Article

Establishing Reference Data for Electromyographic Activity in Gait: Age and Gender Variations

Clinic for Orthopaedics, Heidelberg University Hospital, Schlierbacher Landstr. 200a, 69118 Heidelberg, Germany
*
Author to whom correspondence should be addressed.
Appl. Sci. 2025, 15(7), 3472; https://doi.org/10.3390/app15073472
Submission received: 18 February 2025 / Revised: 18 March 2025 / Accepted: 20 March 2025 / Published: 21 March 2025
(This article belongs to the Special Issue Human Biomechanics and EMG Signal Processing)

Abstract

:
Instrumented gait analysis provides objective data for clinical assessment, with surface electromyography (EMG) serving as a key tool in identifying abnormal muscle activation. However, reliable reference data considering both age and gender remain limited. Age- and gender-related differences in lower-limb EMG during gait in typically developing individuals were examined in this study using statistical parametric mapping (SPM). We also determined the minimum sample size required for robust clinical reference data. Our findings revealed significant differences in muscle activation patterns across age and gender. Children exhibited increased rectus femoris activation in initial swing and greater hamstring activation in the midstance, whereas adults demonstrated greater semimembranosus activity at initial contact, increased soleus activation at push-off, and greater rectus femoris activity in late swing. Gender-based differences included greater tibialis anterior activation in females during the terminal stance and increased vastus lateralis activity during swing, whereas males showed greater vastus lateralis and biceps femoris activation during terminal swing. Additionally, significant age–gender interaction effects were observed in the biceps femoris and semimembranosus, with gender-related differences becoming more pronounced in adulthood. Power analysis indicates that at least 47 participants, with a minimum of 12 per subgroup (male children, female children, male adults, and female adults), are required to detect age–gender interactions reliably. We strongly recommend incorporating both age and gender in clinical norm bands to enhance the accuracy of gait assessments and improve clinical and research comparisons.

1. Introduction

Instrumented gait analysis provides comprehensive data on both normal and pathological gait, offering objective tools that are valuable for clinical assessment. Surface electromyography (EMG), a primary non-invasive technique, records muscle electrical activity during walking and has shown significant benefits for clinical decision making [1,2,3,4]. However, interpreting EMG results requires clinicians to have reliable and valid reference data to accurately identify abnormal activation patterns and guide treatment strategies [5]. In a Delphi survey, experts reached a consensus that a sample size of 20 may be sufficient to establish a clinical norm band [6]. They also recommended that these data should include healthy individuals both below and above 8 years of age, as these age groups likely exhibit different EMG patterns. Schwartz et al. [7] published normative gait and EMG data for 83 children (ages 4–17) across a range of walking speeds. Bovi et al. [8] aimed to expand this research by including adults and exploring various gait analysis protocols. However, their study was limited by a sample size of 40 participants (20 in each age group) and did not specifically examine factors like gender.
Extensive research has established distinct gait characteristics between adult males and females, highlighting significant differences in walking patterns. Females generally display greater cadence, shorter step length, and similar gait speed compared to males [9,10]. Gender-related differences in joint kinematics and kinetics during walking include greater hip flexion and reduced knee extension before initial contact in females. Additionally, females exhibit reduced knee and ankle torque in midstance, increased knee flexion and knee extension torque at terminal stance, as well as an increased knee flexion moment and power during pre-swing [11]. These findings suggest that gender affects motion and joint loading in gait; however, these differences may also vary with age. For example, ankle dorsiflexion duration in initial swing tends to increase more steeply with age in females than in males [12]. As individuals age, gait changes extend further, including longer stance time with slower walking, decreased ankle plantar flexor moment at push-off, and increased peak hip extensor moment during early stance [13,14].
While age- and gender-related changes in gait functions are well-documented, the underlying factors driving these changes remain poorly understood. Some studies suggest that these gender-dependent differences may be partially attributed to variations in muscle recruitment patterns. Di Nardo et al. [15,16] observed greater activation of the tibialis anterior and gastrocnemius lateralis within a single gait stride in adult females, whereas this activation was absent in children aged 6–8. They proposed that this difference may reflect the influence of motor control development with age on EMG patterns. Schmitz et al. [17] specifically examined the effect of age on the activation patterns of lower body muscles during gait and found increased gastrocnemius lateralis activation during the loading response in younger adults, alongside greater activity of the vastus lateralis, soleus, and rectus femoris during the midstance. They attributed these differences to increased ankle joint stiffness and altered stabilizing strategies in older adults. In a comprehensive study, Bailey et al. [12] examined the interactive effects of age and sex on EMG in 93 healthy adults, revealing a correlation between greater rectus femoris activation in males and greater gastrocnemius lateralis activation in females during mid-swing, with both variables showing age-related changes. However, their study was limited to adults (aged >20), excluding children, while other studies have shown that children may exhibit significantly different EMG patterns due to the ongoing development of motor control, particularly in females [15,16]. Therefore, there is a need for further investigation into the effect of age, specifically comparing children and adults, as a factor in studying the influence of gender on neuromuscular control of gait. Additionally, most of the existing literature has focused on specific phases of gait, while methodologies like statistical parametric mapping (SPM, www.spm1d.org, 20 November 2024) [18] allow for analysis across the entire gait cycle, addressing the limitations of previous studies by preventing critical information from being overlooked.
To our knowledge, no study has systematically examined the interaction between age and gender on lower limb muscle activation during gait using a comprehensive EMG dataset that includes children. A secondary aim of our study was to determine the minimum sample size needed in a reference dataset to effectively capture these influences, thereby enhancing the clinical applicability of EMG interpretations.

2. Materials and Methods

2.1. Ethics Statement
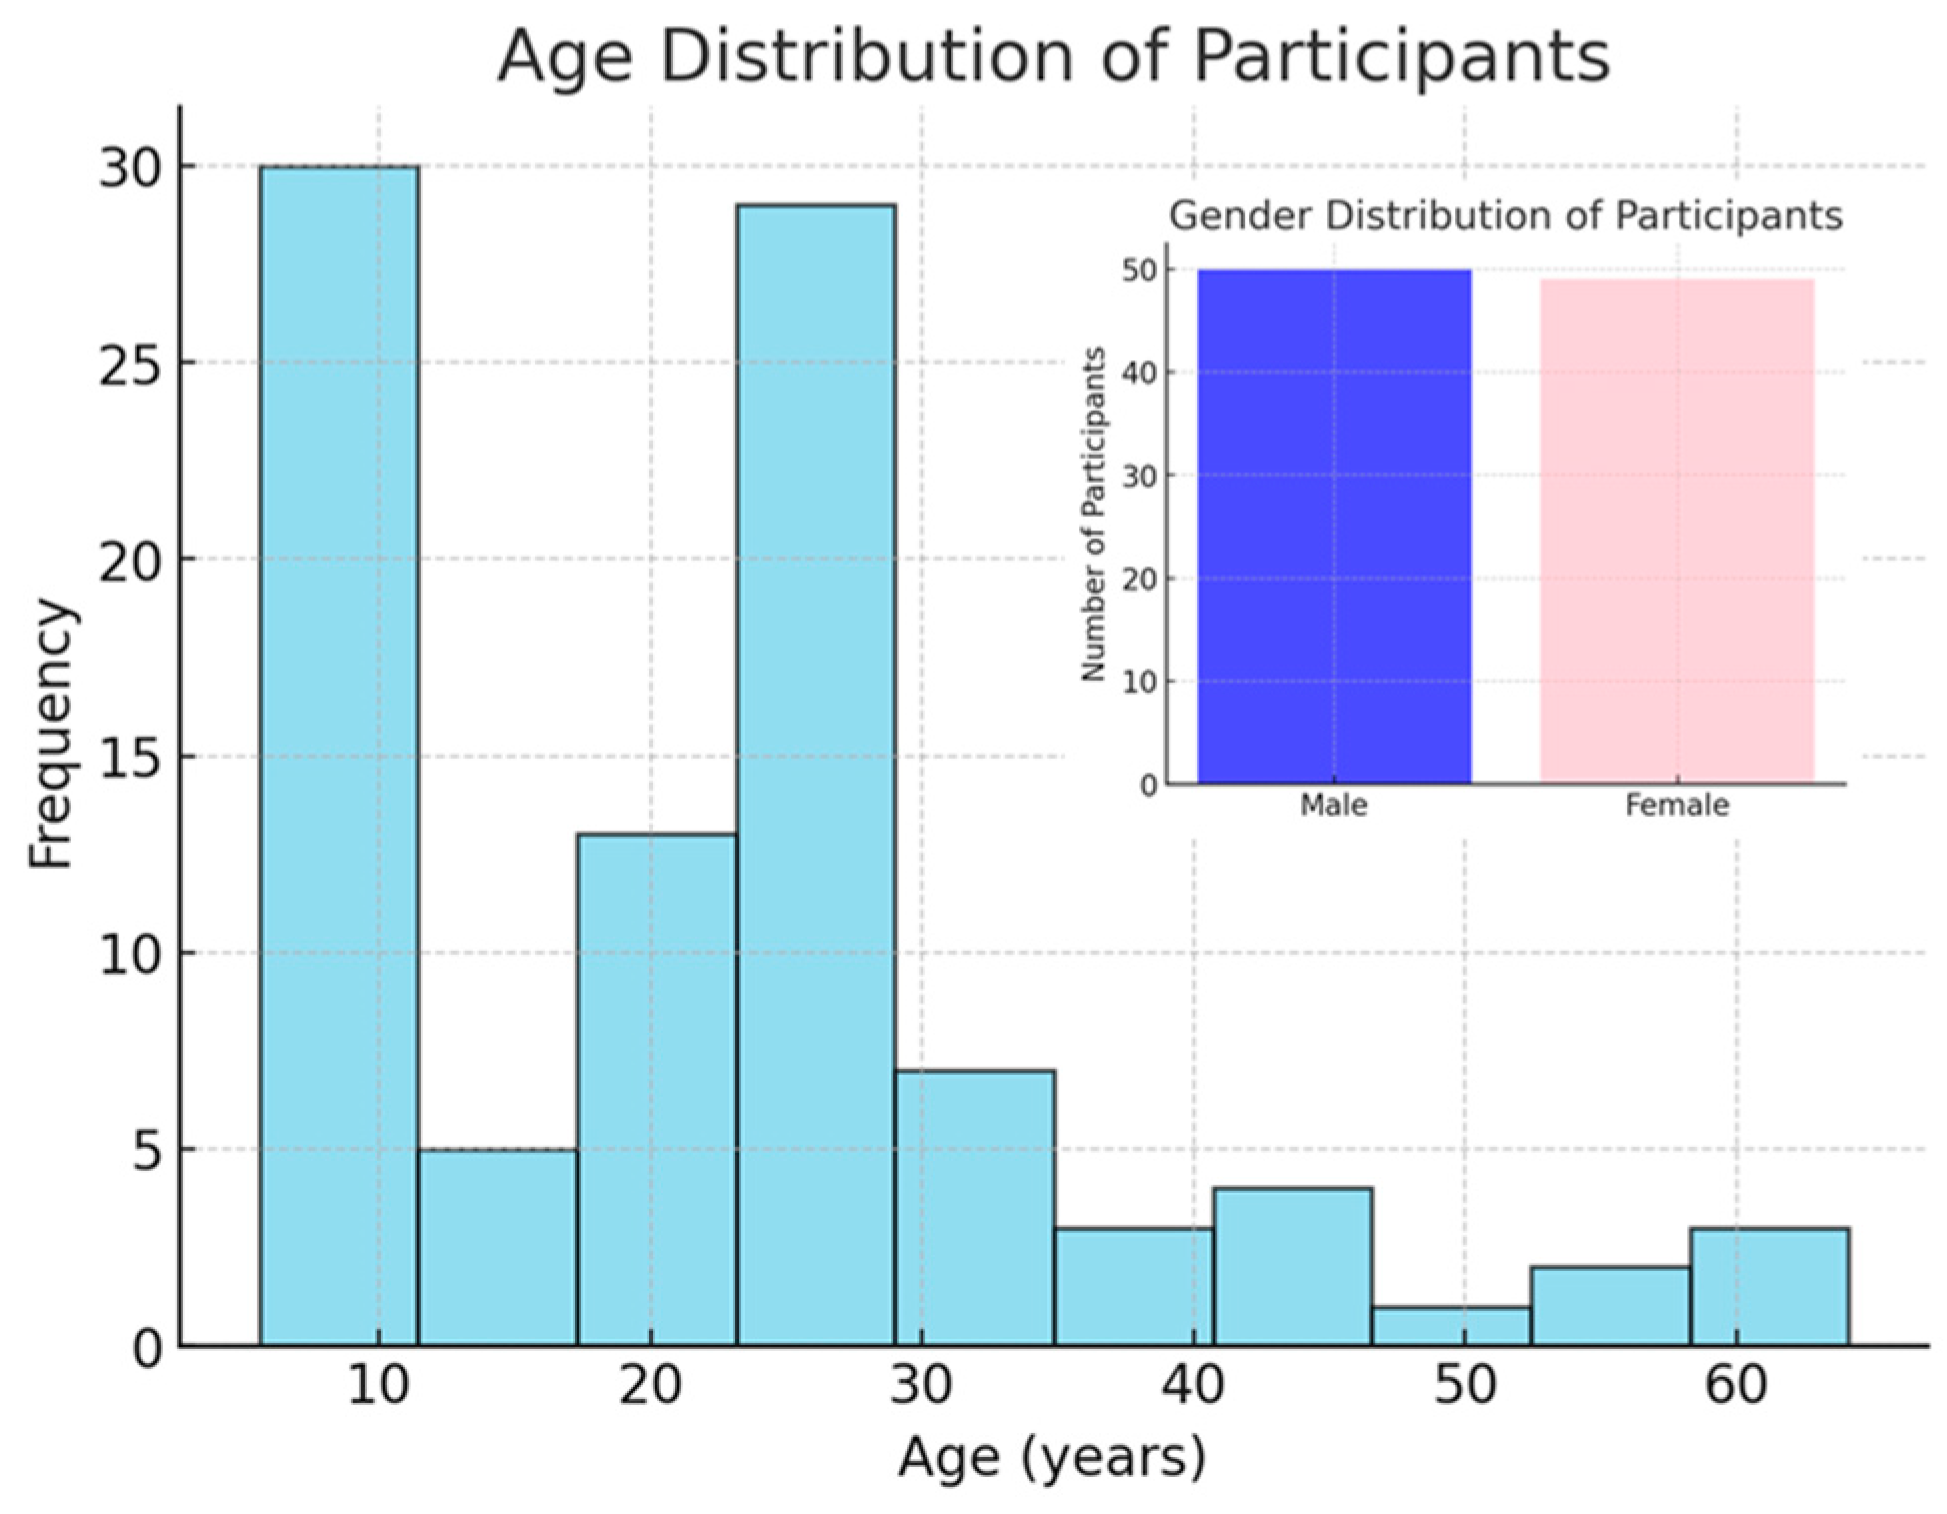
The study was approved by the local Ethical Committee “Medical Faculty, Heidelberg University (no: S-243/2022)”.

2.2. Participants

The data analyzed in this study were part of a larger database established at the local University Clinics between 2000 and 2024, comprising data from more than 350 typically developing (TD) individuals. All healthy participants had no history of motor pathology and were examined by a physiotherapist in our lab to ensure there was no evidence of musculoskeletal or neurological disorders. The primary inclusion criterion for this study was the availability of both EMG and gait data. Specific exclusion criteria included individuals with any prior lower limb injuries, those with current musculoskeletal or neurological conditions, or those unable to complete the gait assessment protocol. Based on these criteria, 108 participants were initially selected and categorized into three age groups: children (aged <13, 35 subjects), juveniles (aged 13–18, 11 participants), and adults (aged >18, 62 subjects). The juvenile group was excluded from further analysis due to its significantly smaller sample size compared to the other groups. As a result, a total of 97 typically developing individuals were included in the study. The demographic details of the participants are provided in Table 1 and Figure 1. Each participant was informed about the study’s purpose and provided written informed consent.

2.3. Instrumentation and Protocol

All the participants walked barefoot at a self-selected speed along a 15 m walkway during data acquisition. Kinematic and kinetic data were recorded using a 12-camera 3D motion analysis system (VICON, Oxford Metrics Limited, Oxford, UK) operating at 120 Hz and three force plates operating at 1080 Hz (Kistler Instruments Co., Winterthur, Switzerland). Skin-mounted markers were placed according to the protocol of Kadaba et al. [19], and the Plug-in-Gait (PiG) model was used for analysis.
EMG data were collected from seven major lower-extremity muscles: the tibialis anterior (TIB), soleus (SOL), gastrocnemius lateralis (GAS), rectus femoris (REF), vastus lateralis (VAS), biceps femoris (BIC), and semimembranosus (SEM) of both legs. Data acquisition was performed using the Myon 320 system (Myon AG, Schwarzenberg, Switzerland). Bipolar surface adhesive electrodes (Blue Sensor, Ambu Inc., Glen Burnie, MD, USA) were placed on the target muscles following SENIAM guidelines [20], with an inter-electrode distance of 2 cm [21]. To amplify the EMG signal, the Biovision EMG apparatus (Biovision Inc., Wehrheim, Germany) was used before 2013/14, and Delsys systems (Delsys Inc., Natick, MA, USA) were used after 2013/14, with a preamplification factor of ×5000. Skin-based EMG signal detection was performed at 1000 Hz. An extensive quality check analysis was conducted to assess potential technological variations between the two systems. No significant differences were observed in the recorded EMG patterns between the systems. Additionally, the same normalization algorithm was applied to the signals from both systems to ensure consistency in data processing.
We extracted gait data from at least seven trials, each including one gait cycle typically around the force plate, where participants exhibited consistent gait patterns, and then calculated average values across all trials for each patient. To ensure the analysis was based on steady-state walking, the initial and final gait cycles of the 15 m walkway were excluded. This approach minimized the influence of acceleration and deceleration phases on the EMG and gait data. The data were collected under the supervision of a professional operator in our lab. The raw EMG data were first assessed by the experienced operator, followed by post-processing. There are several projects and papers involving assessment of EMG data in the Heidelberg motion lab that prove the reliability and robustness of the collected data [1,2,3,4,21,22].

2.4. Signal Processing

Raw EMG signals were processed as follows: band-pass filtering (Butterworth filter, cutoff frequency: 20–350 Hz), rectification, smoothing (Butterworth low-pass filter, cutoff frequency: 9 Hz), amplitude normalization to the mean signal, and time normalization to one gait cycle (101 data points). Since most lab visitors are patients with motor control deficits and anatomical deformities, and no software robustly determines gait events, these events (for patients and healthy individuals) were manually identified under the supervision of experienced operators. A gait cycle was defined as the interval between two consecutive heel strikes of the same foot [23]. The processed data were then averaged across valid strides using MATLAB (2018b, The MathWorks, Inc., Natick, MA, USA) [21]. The peak value of the time series and its occurrence within the gait cycle, along with the mean values over the entire cycle, were calculated. Additionally, these features were analyzed in relation to time by computing them for the full stride, as well as separately for the stance and swing phases [23].
To support the findings from EMG envelopes, additional kinematic, kinetic, and spatiotemporal (ST) parameters, namely cadence, walking speed, stride time, stride length, and foot-off time, were calculated from the gait data to examine differences between age and gender groups. Additionally, the gait data included the peak angles, net joint moments, and powers (normalized to body mass), at the ankle, knee, and hip joints in the sagittal plane (flexion–extension/dorsiflexion–plantarflexion).

2.5. Statistical Analysis
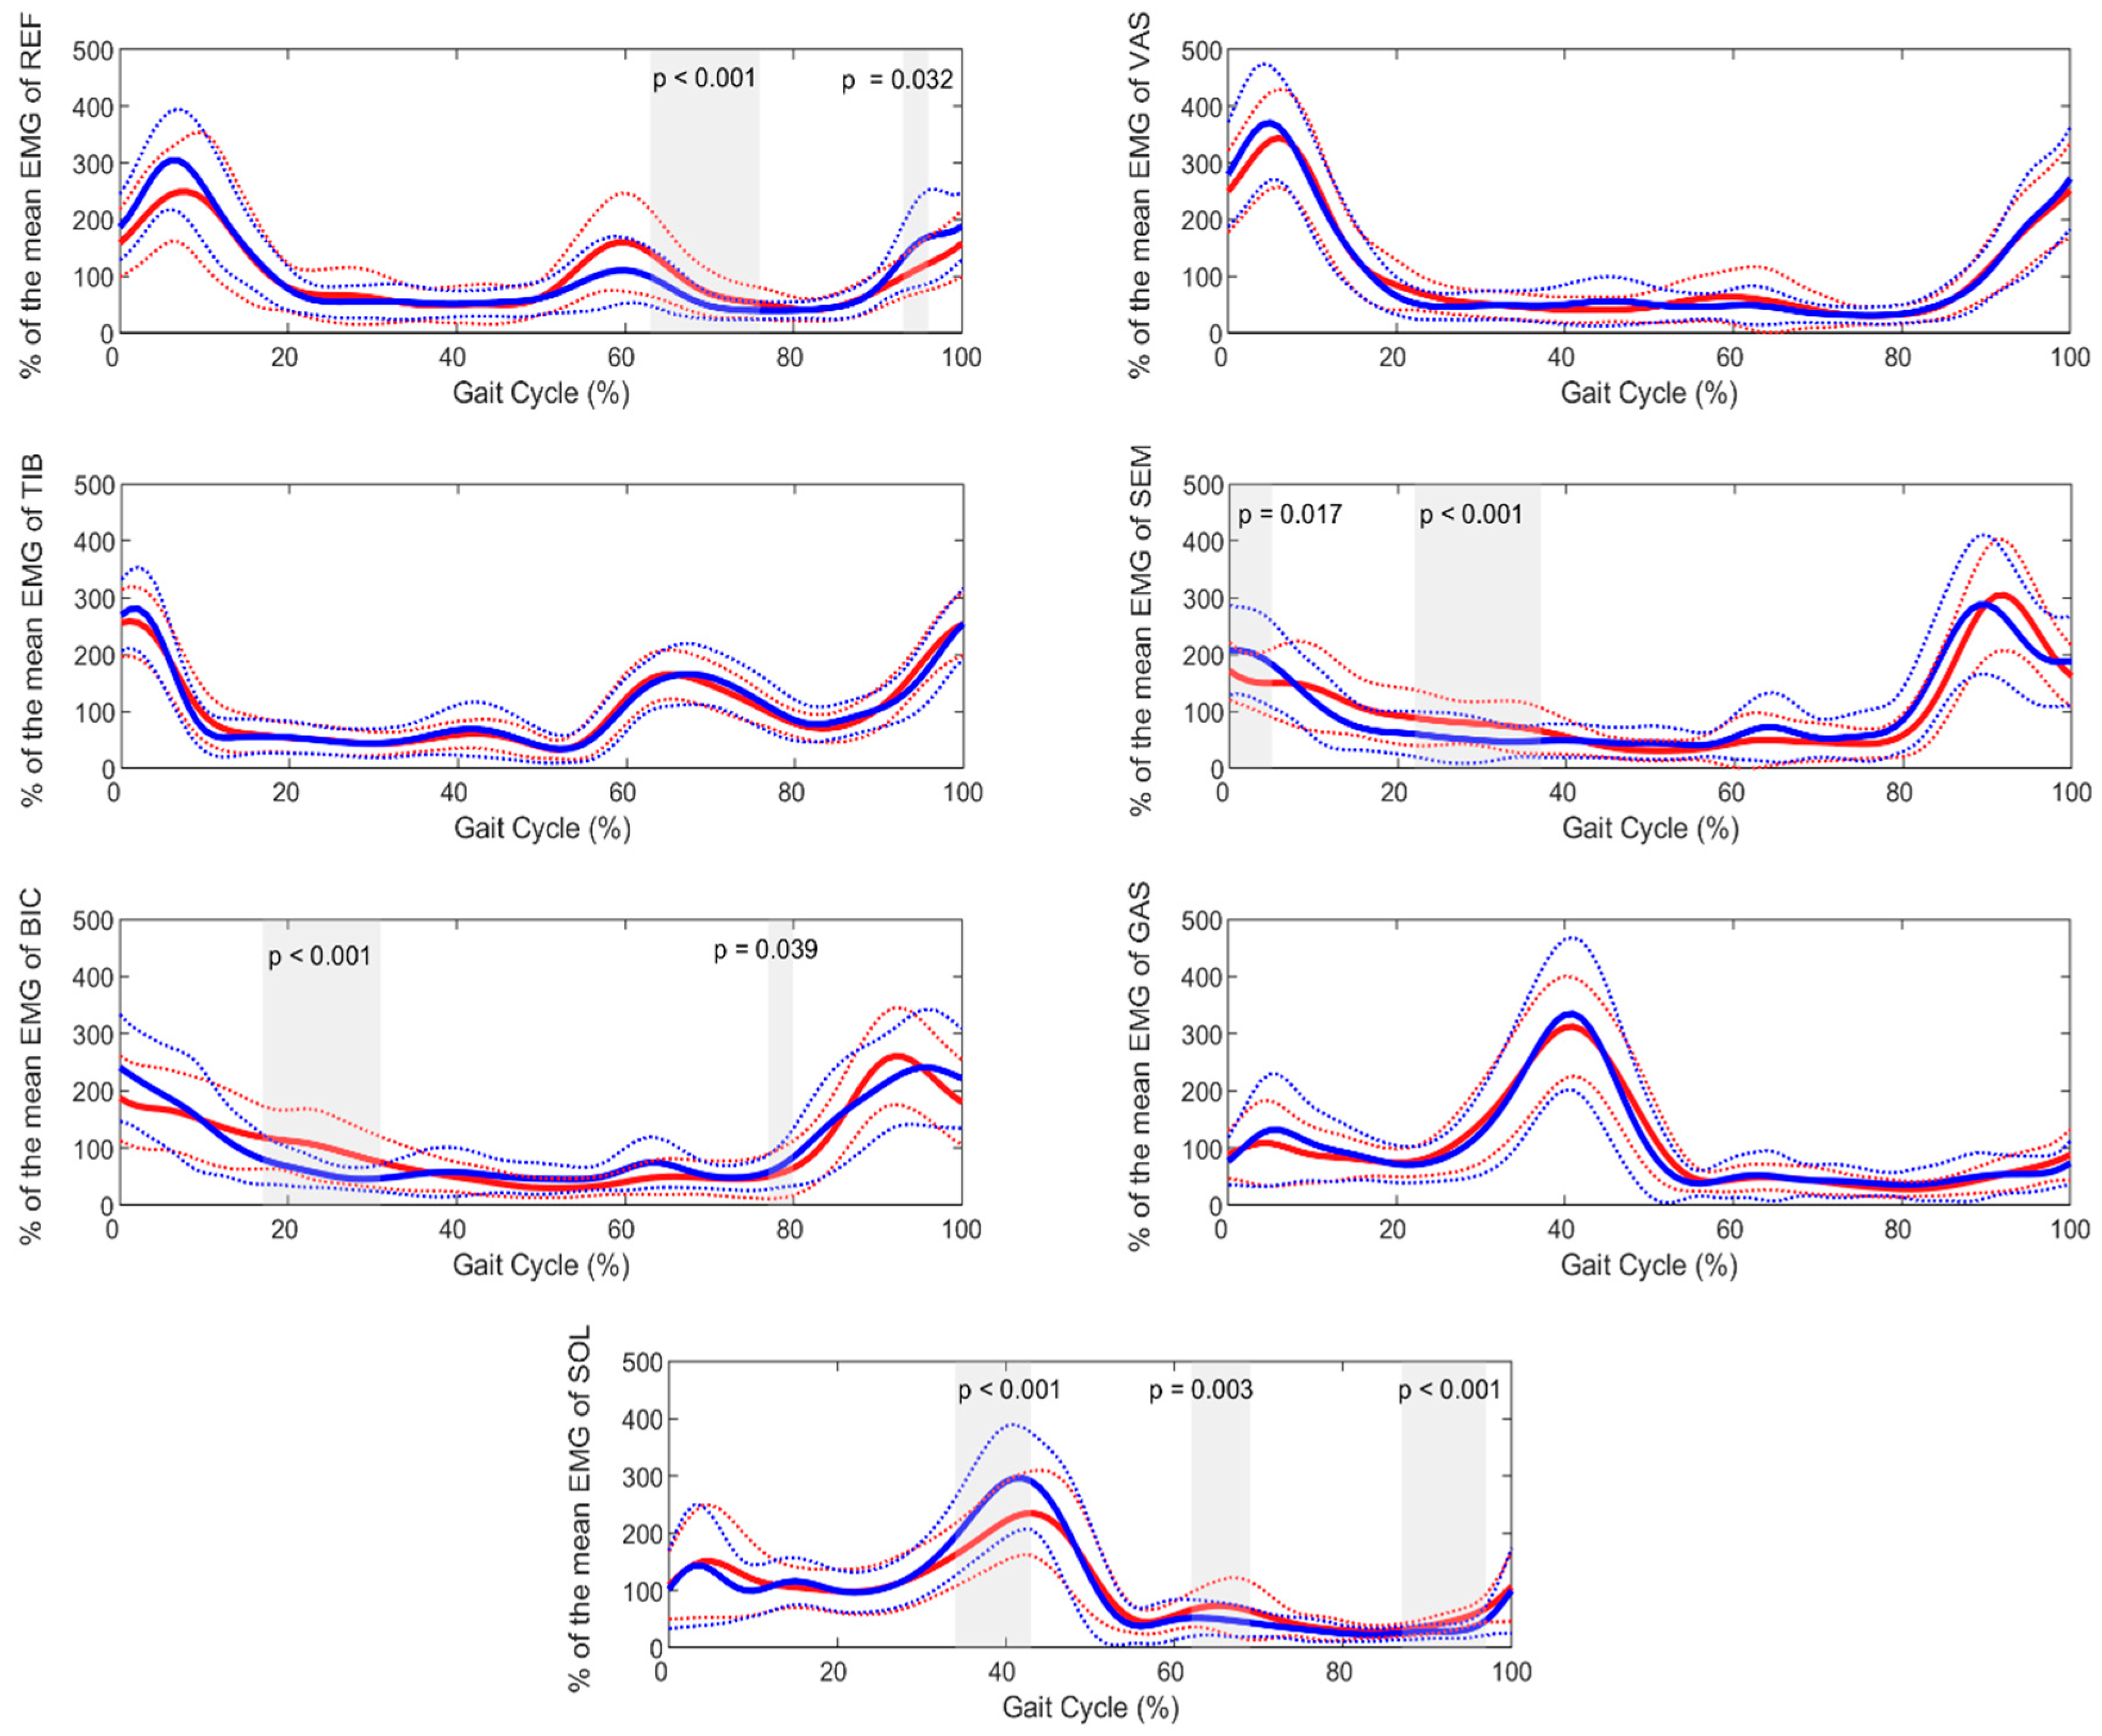
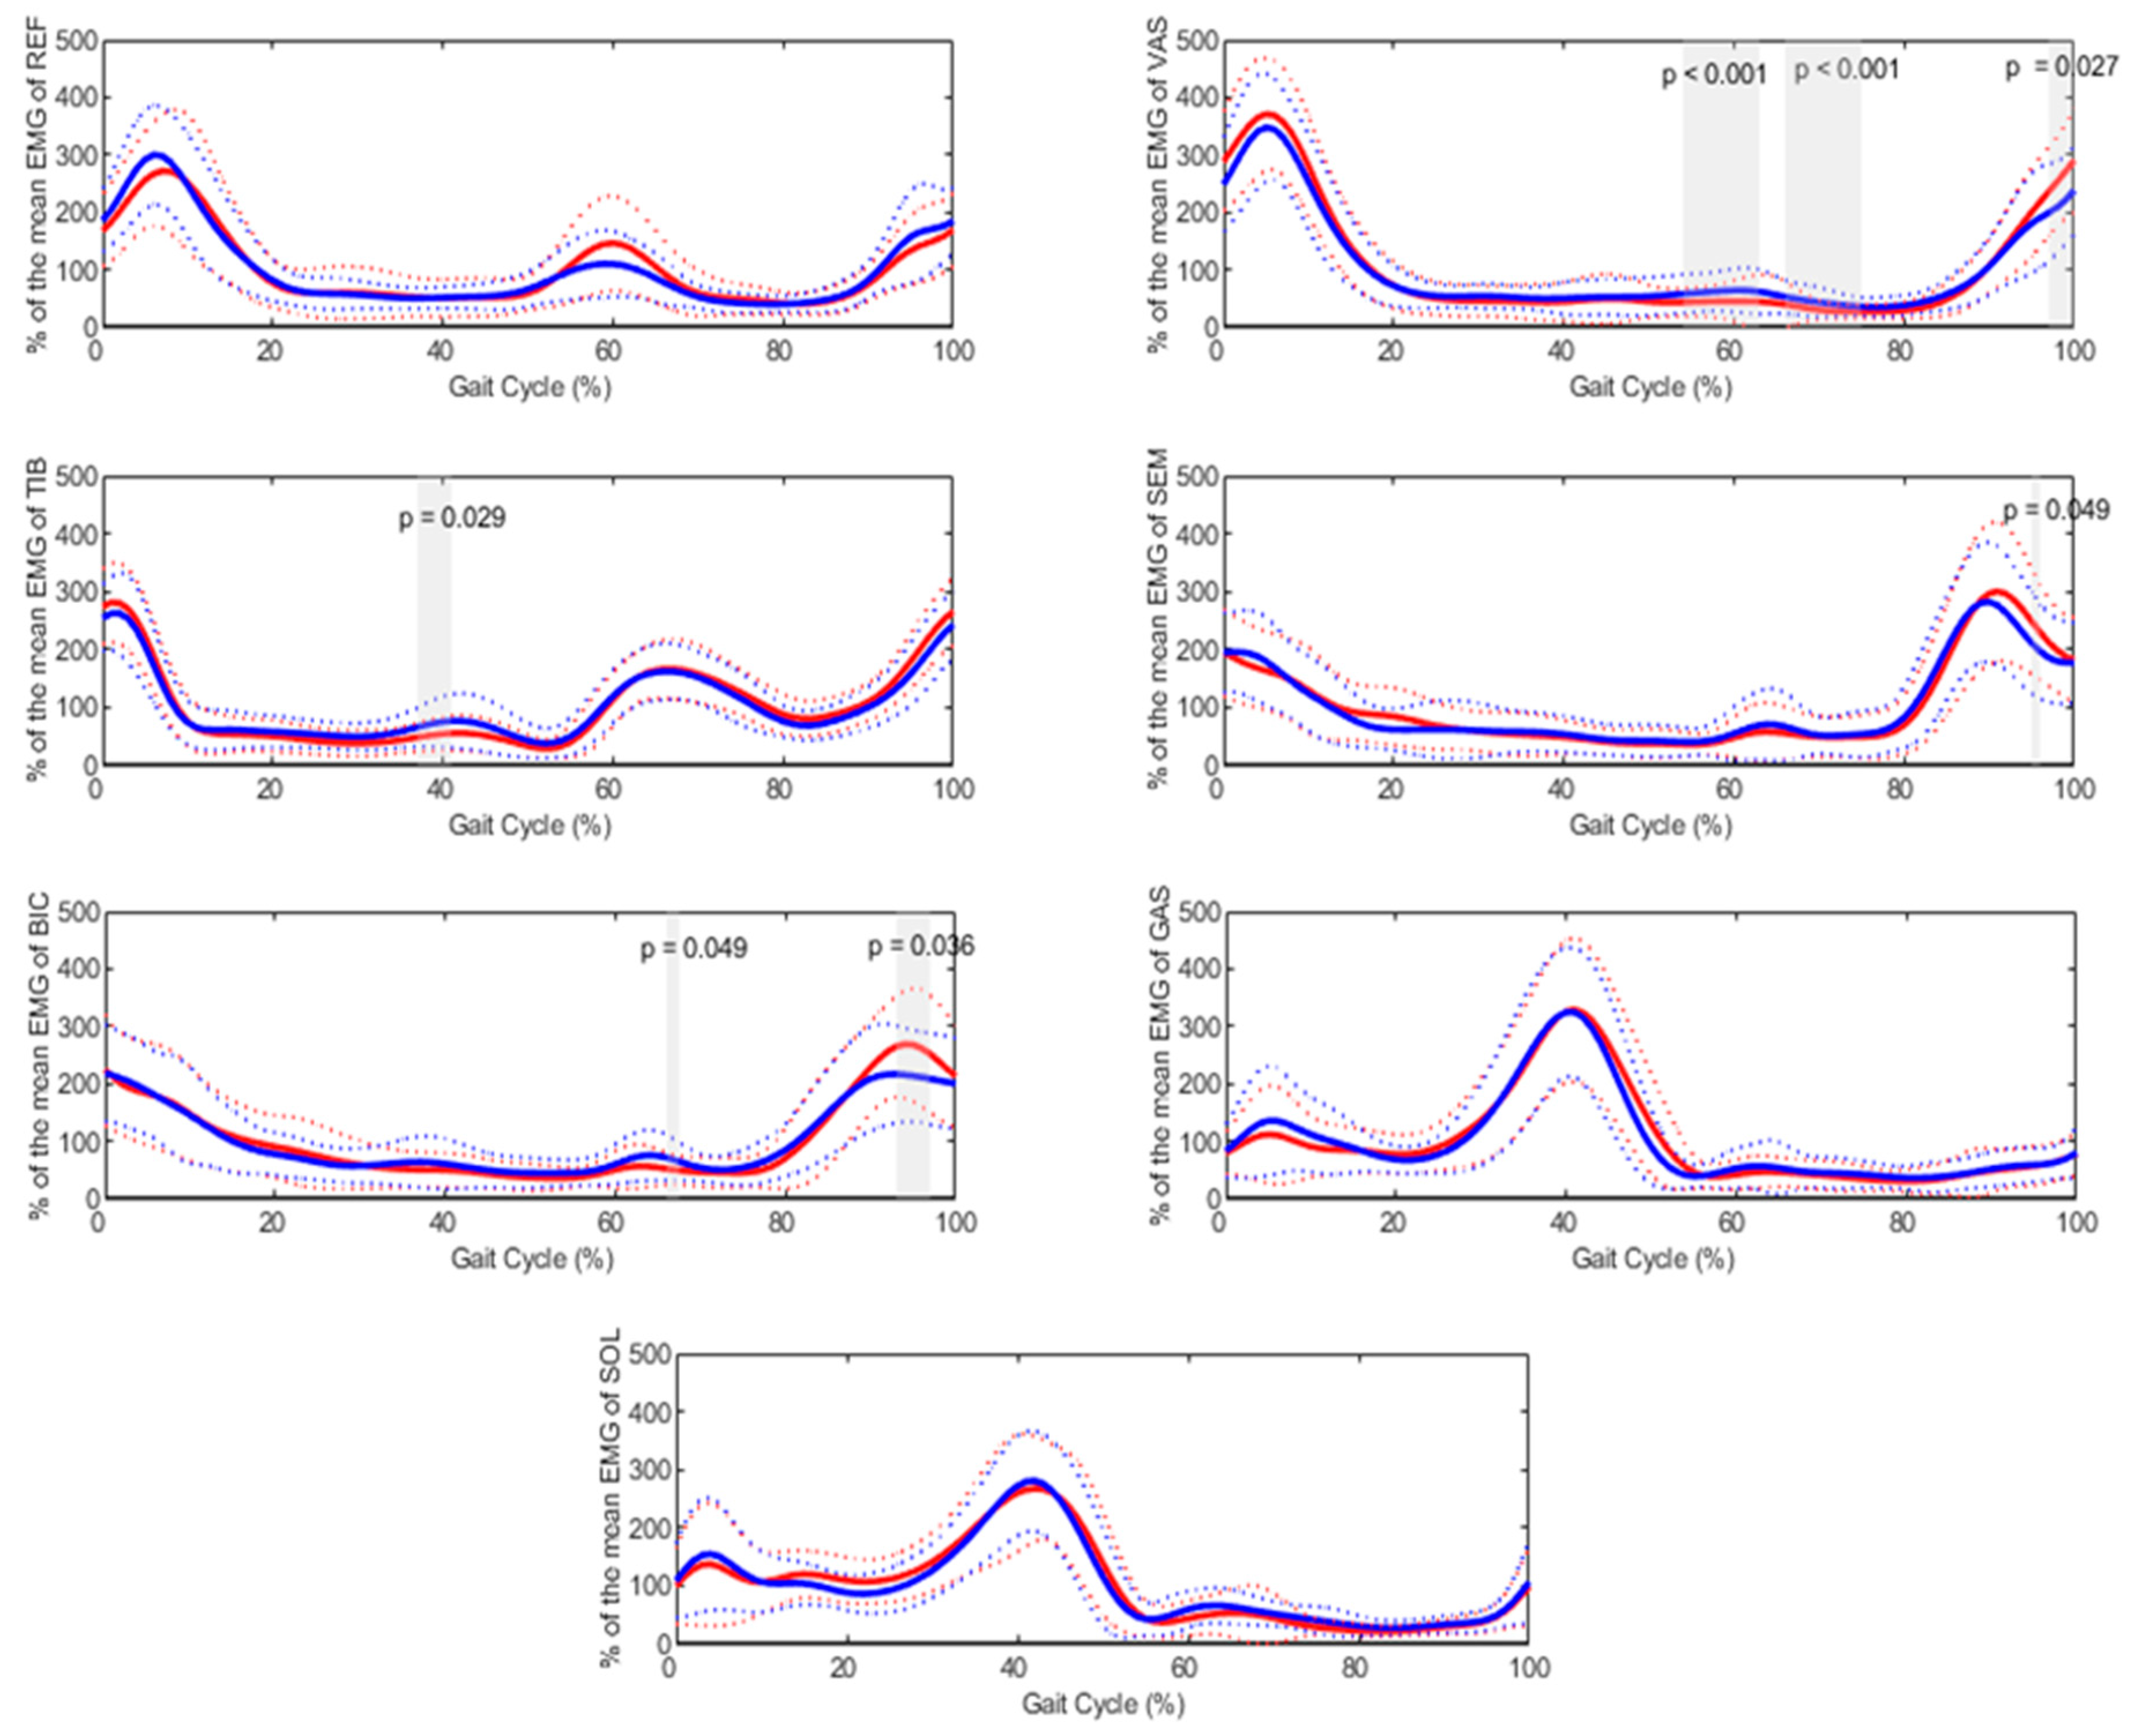
We used the SPM technique (version: M.0.4.10) implemented in MATLAB [18] to compare the EMG envelopes of each muscle across age and gender groups throughout the gait cycle. This method treats the data as continuous time series, maintaining the temporal structure of muscle activation patterns during the entire cycle. SPM(t) evaluates the data at every time point within the gait cycle, detecting significant differences between age groups (children vs. adults) and gender groups (males vs. females). The results (SPM{t}) reveal the specific regions of the gait cycle where statistically significant differences occur, emphasizing phases where age and gender notably influence muscle activation. SPM provides a more detailed and holistic analysis of time-dependent variations in muscle activity by eliminating the need to divide the gait cycle into predefined phases.
Following the SPM analysis for the effects of age and gender, gait and spatiotemporal (ST) parameters were examined using repeated-measures MANOVA, with the significance level set to p = 0.05. The normality of the dataset was checked using the Shapiro–Wilk test. Furthermore, the interaction effect between age and gender on EMG features was also assessed using repeated-measures MANOVA, followed by post hoc analyses with Bonferroni correction, adjusting the significance level to p = 0.0125. In the case of variables showing a significant interaction effect, the effect size (Cohen’s f2) was calculated to quantify the magnitude of the observed differences. Additionally, to determine the minimum sample size required for establishing an EMG reference dataset that accounts for the influence of both age and gender on the patterns, we used G*Power software (version 3.1.9.7; Heinrich-Heine-Universität Düsseldorf, Germany; http://www.gpower.hhu.de, 20 November 2024). The test family was set as F tests, with the statistical test defined as “MANOVA: Special effects and interactions”, an alpha level of 0.0125, and a power of 0.8. The highest calculated effect size was included in the analysis to ensure robust sample size estimation. The number of groups was set to four, since we had two gender groups × two age groups, and the number of predictions was set to three (age, gender, and interaction).

3. Results

No significant differences in height, body mass, or BMI were observed between males and females in the children’s group. However, in the adult group, all parameters demonstrated significant differences (p < 0.001), with males being taller and heavier compared to females.
SPM analysis for the effect of age (Figure 2) indicated that the main differences in EMG activity between children and adults occurred during the midstance phase of the gait cycle for the biceps femoris (17–31% of the gait cycle, p < 0.001; and 77–80% of the gait cycle, p = 0.039). Additionally, significant differences were observed for the semimembranosus during the first 5% of the gait cycle (p = 0.017) and 22–37% of the gait cycle (p < 0.001); for the rectus femoris during 63–76% (p < 0.001) and 93–96% (p = 0.032) of the gait cycle; and for the soleus during 34–43% (p < 0.001), 62–69% (p = 0.003), and 87–94% (p < 0.001) of the gait cycle.
Table 2 presents the mean and standard deviation (SD) of the gait and spatiotemporal characteristics across different age groups. The effect of age on both peak ankle dorsiflexion moment and power was statistically significant (p < 0.001), with greater values observed in adults. A similar effect was found for peak plantarflexion power (p = 0.012) and the knee flexion moment (p = 0.004). However, children exhibited greater hip flexion and cadence during gait, as well as reduced values for the hip extension moment, walking speed, stride time, and stride length.
The gender effect, also analyzed using SPM (Figure 3), revealed that females exhibited greater EMG activation for the biceps femoris during 66–68% of the gait cycle (p = 0.049), while it was greater for males during 93–97% of the gait cycle (p = 0.036). For the semimembranosus, males exhibited increased activation around 95% of the gait cycle (p = 0.049), whereas for the tibialis anterior, females showed significantly greater activation between 37% and 41% of the gait cycle (p = 0.029). The vastus lateralis exhibited the longest durations of significant differences, occurring during 54–63% (p < 0.001), 66–75% (p < 0.001), and 97–100% (p = 0.029) of the gait cycle for females, with more activated EMG. The influence of gender on gait measures was also significant (Table 3), with females showing a greater plantarflexion angle (p = 0.023) and larger dorsiflexion power (p = 0.041) at the ankle compared to males. Additionally, females exhibited an increased peak of hip flexion, greater hip extension power, and an earlier foot-off phase.
Comparison of the age–gender interaction effect on EMG features revealed significant differences in the mean EMG activity of the biceps femoris during both stance (p = 0.002) and swing (p < 0.001), as well as peak activity during swing (p < 0.001). The interaction effect on the semimembranosus during both stance (p = 0.006) and swing (p = 0.006) was also significant. In examining the averages, male children exhibited increased biceps femoris activity during the stance phase compared to female children (90.4 vs. 81.9), while in adults, females demonstrated greater biceps femoris activity than males (88.1 vs. 79.1). A similar pattern was observed for the semimembranosus during the stance phase, with greater activation according to EMG for male children than female children (85.1 vs. 76.2), but in adulthood, activity decreased in males (71.2), while it increased in females (78.6). During the swing phase, the mean and peak EMG activity of the biceps femoris decreased with growth in females, while in males it increased. A similar growth effect was observed for the semimembranosus in both genders.
The effect size was calculated (Table 4) to perform a power analysis on the extracted EMG features that demonstrated a significant interaction effect. The biceps femoris maximum activity during the swing phase showed the largest effect size (f2 = 0.199). With an alpha level of 0.0125, a power level of 0.80, and five response variables, the total sample size required based on the largest effect size was determined to be 47. Therefore, a minimum of 47 participants is necessary to adequately capture age- and gender-related differences in the EMG data of the normative population studied. Ideally, this sample size of 47 should be evenly distributed across the four age–gender groups to ensure a balanced representation of children, adults, males, and females, with approximately 12 participants per group (male children, female children, male adults, and female adults). Our dataset consists of 97 participants, with more than 12 participants in each group, indicating that the sample size is sufficient to reliably detect the interaction effect.

4. Discussion

This study addressed the lack of age- and gender-specific EMG reference data for gait analysis, which are crucial for distinguishing typical from pathological patterns for clinical gait analysis. We aimed to quantify age- and gender-related differences in lower-limb myoelectric activity during walking in typically developing individuals. By applying the SPM approach to EMG envelopes, we were able to capture differences across the entire gait cycle, preserving important information that could be lost through averaging. To further explore these differences, we conducted an analysis of the interaction effect between age and gender, followed by a power analysis to determine the minimum number of subjects required for establishing comprehensive reference data in the clinic.
The observed differences in gait mechanics between children and adults highlight distinct neuromuscular strategies influenced by developmental factors. Children exhibited a greater cadence but slower walking speed, shorter stride time, and shorter stride length, accompanied by larger peak hip flexion and greater activation of the rectus femoris in initial swing and the hamstrings in the midstance. Higher cadence with shorter strides reflects a reliance on more frequent, smaller steps to maintain stability and forward progression, a common characteristic of developing gait patterns [24]. The increased peak hip flexion likely aids in advancing the limb during swing, compensating for the shorter stride length. This is supported by the increased rectus femoris activation in initial swing, which plays a crucial role in lifting and accelerating the limb forward [25]. The greater hamstring activation in the midstance suggests an increased demand for knee stability and control [26]. Given children’s ongoing neuromuscular maturation and developing motor control, the hamstrings may play a compensatory role in stabilizing the knee and modulating joint moments to accommodate their altered gait mechanics.
In contrast, adults exhibited different EMG and gait patterns, characterized by greater activation of the semimembranosus during initial contact, soleus during push-off, and rectus femoris during late swing, along with faster gait, increased knee flexion, hip extension, and ankle dorsi-plantar flexion power. In adults, increased semimembranosus activation at initial contact might be related to a higher knee flexion moment as a result of stabilizing the knee joint, controlling knee extension, and facilitating shock absorption [27]. Furthermore, the greater soleus activation during push-off indicates stronger plantar flexor engagement, which is essential for the efficient forward propulsion and faster gait observed in adults [17]. In children, reduced push-off mechanisms may necessitate compensatory adaptations, such as increased cadence and hip flexion, whereas adults achieve higher walking speeds through more effective force generation at the ankle. Additionally, increased coactivation in children may reflect ongoing maturation of the nervous system, with less refined motor control requiring coactivation of agonist and antagonist muscles for stability. Greater push-off forces in adults can be attributed to more mature neuromuscular control, greater muscle strength, and refined motor strategies [28]. Enhanced rectus femoris activation in late swing further suggests a refined control strategy for decelerating the limb before initial contact, optimizing positioning for the subsequent stance phase. These gait adaptations could reflect the influence of growth on developing motor control, leading to a smoother and more coordinated gait cycle.
Gender-based differences in muscle activation patterns during gait have been well-documented in the literature [16,28,29]. In this study, females exhibited greater EMG activity in the tibialis anterior during the terminal stance and the vastus lateralis during pre- and initial swing, alongside increased hip flexion, hip extension, and ankle dorsiflexion power. These findings align with previous studies, which suggest that females walk with greater hip flexion and reduced knee extension at touchdown compared to males, generating more mechanical power at the hip and ankle during the propulsion phase [10]. Given their shorter height and leg length, females require a more flexed hip and plantarflexed ankle to generate sufficient power and compensate for their smaller physique while maintaining walking speed similar to males. Increased vastus lateralis activity in females, which was also observed in different dynamic tasks like side-step maneuvers and stop jumps [30,31], may reflect the need for greater muscle engagement to sustain gait at the same speed as males, further supported by a higher hip flexion. Additionally, as Di Nardo et al. [16] reported, females tended to exhibit greater co-activation of the ankle muscles, which was also shown in our study by the increased ankle joint power in this group, contributing to improved stride length and cadence despite their smaller size.
Increased activation of the tibialis anterior during the terminal stance likely plays a key role in controlling foot positioning and facilitating ankle dorsiflexion, which is crucial for toe clearance and preparation for the swing phase. Specifically, Chiu and Wang [32] found when analyzing the EMG signals of the biceps femoris, rectus femoris, gastrocnemius, and tibialis anterior that females exhibited significantly higher tibialis anterior activity during walking. This was also observed in our study for the tibialis anterior. In contrast, males exhibited an enhanced activation of the vastus lateralis and biceps femoris during terminal swing, along with a delayed foot-off. Given that males are typically taller and heavier, maintaining stability may require increased joint stiffness [33]. Consequently, the greater co-activation of agonist and antagonist muscles likely contributes to stabilizing the knee and hip, preparing them for initial contact. The delayed foot-off, indicative of a prolonged stance phase, may further reflect the need for enhanced stability during gait.
The significant age–gender interaction effects observed in the biceps femoris and semimembranosus align with previous studies indicating that gender differences in muscle activation patterns become more pronounced with age [14,16]. Di Nardo et al. [16] found that gender-related EMG differences in children appear predominantly during adolescence, with adult-like patterns emerging around the ages of 10–12 years. This aligns with our findings, where significant gender differences in the biceps femoris and semimembranosus were primarily observed in adults. In addition, while male children exhibited greater activity in both muscles during the stance phase, this pattern reversed in adulthood, with females showing increased activity. These changes in muscle activation suggest that gait patterns evolve with age, with sex differences becoming more prominent in adulthood, likely as a result of neuromuscular maturation.
Our findings emphasize the necessity of considering both age and gender when establishing normative gait databases. While the impact of age on gait patterns in clinical settings is well-documented [34,35], our results highlight the equally important role of gender-related differences. Given the influence of sex-related variations in musculoskeletal structure and neuromuscular control, including both male and female participants across different age groups is crucial. According to our findings, we strongly recommend including a minimum of 47 typically developed participants to account for age–gender effects on the norm band, with at least 12 individuals per subgroup (male children, female children, male adults, and female adults). If this is not feasible, providing age or gender separately and interpreting the gait data with greater caution should be considered.
Our investigation into EMG reference data could enhance clinical decision making by providing a benchmark for identifying atypical muscle activation patterns. A better understanding of normative data in clinical settings may also support rehabilitation monitoring by tracking deviations from expected EMG profiles over time. For instance, comparing the gait patterns of patients with cerebral palsy (CP) to reference data from typically developing adults may result in misinterpretations, as some activation patterns in children may reflect developmental differences rather than disorders associated with CP.

5. Limitations and Future Studies

In this study, we focused on the effects of age and gender on EMG patterns, as these were identified as key variables by expert consensus in our previous Delphi survey [6]. While factors such as height, leg length, weight, BMI, and gait speed may also influence EMG data, our primary aim was to establish an initial reference framework based on the most clinically relevant and widely recognized parameters. Furthermore, in many clinical settings, EMG patterns are not routinely adjusted for these factors, nor are they always categorized by age or gender. Thus, our findings provide a practical and meaningful step toward standardizing EMG interpretation in clinical practice. Future studies should expand upon this work by incorporating additional variables to enhance the comprehensiveness of EMG reference data. In addition, the SPM analysis inherently accounts for variability across the gait cycle, incorporating all EMG patterns within confidence intervals.
Future studies could also explore within-subject variability across gait cycles to assess whether individual fluctuations fit within the established reference range. Moreover, EMG signals were normalized in this study using the mean signal, following SENIAM guidelines [20]. This method allows for the general comparison of muscle activation patterns across participants without requiring maximum-effort tasks. While alternative normalization methods, such as maximum isometric voluntary contraction (MVIC) or peak dynamic activation, could provide insights into muscle capacities during specific movements, they were not used in this study. However, it is important to acknowledge that mean signal normalization may be influenced by inter-group differences in baseline muscle activity, particularly when comparing younger and older individuals with different muscle strengths. Future studies may benefit from exploring complementary normalization techniques to enhance the comparability of EMG signals across age groups. Furthermore, this study focused on EMG envelope patterns across the gait cycle rather than raw signal characteristics or muscle activation onset detection. Detailed firing sequences and the influence of factors such as age or gender were not investigated, as they were beyond the scope of the current analysis.
A potential limitation of this study is the exclusion of the adolescent age group due to a small sample size. While this decision ensures statistical robustness in our comparisons, it also creates a gap in understanding the developmental transition between childhood and adulthood. Adolescence is a critical period for neuromuscular development, and individuals within this age range (13–18 years) may exhibit distinct EMG activation patterns. Younger adolescents may demonstrate patterns more similar to children, while older adolescents may align more closely with adults. Future studies including a larger adolescent sample could provide valuable insights into these transitional changes.
Additionally, the influence of gait speed on EMG patterns was not analyzed. Hof et al. [36] demonstrated that average EMG profiles consist of both speed-dependent and speed-independent components, suggesting that normalizing EMG patterns to gait speed could help mitigate confounding effects. In this study, participants walked at their self-selected speed without constraints, as the primary objective was to establish clinical EMG reference data while focusing on age- and gender-related differences. While we did not perform a statistical comparison of gait speed between age groups, we acknowledge that differences in self-selected speed could have influenced EMG patterns. Future studies should consider incorporating statistical adjustments, such as ANCOVA, to better account for the interaction effects of gait speed with age and gender.
Furthermore, the focus of our study was on electromyographic activity in the sagittal plane due to its relevance to gait analysis and the primary motor functions in this plane. While gender differences may exist in other planes, expanding the analysis to the coronal and transverse planes would require additional data and is beyond the scope of this study. However, we acknowledge that deviations in the coronal and transverse planes can have clinical significance, particularly in conditions involving gait asymmetry or neuromuscular disorders. Future studies exploring muscle activation across multiple planes could provide a more comprehensive understanding of these complex gait characteristics. Developing normative EMG data for running at different speeds can also be considered in future work.

Author Contributions

M.D.: writing—original draft, data analysis; F.S.: review and editing, methodology; C.P.: review and editing; S.I.W.: review and editing, conceptualization, methodology, project administration. All authors have read and agreed to the published version of the manuscript.

Funding

This research was funded by the German Research Foundation (DFG) (no: WO 1624/8-1). This funder had no role in study design, data collection and analysis, decision to publish, or preparation of the manuscript.

Institutional Review Board Statement

The study was conducted in accordance with the Declaration of Helsinki, and approved by the Ethics Committee “Medical Faculty, Heidelberg University Hospital” with the serial number S-243/2022 on 11 April 2022.

Informed Consent Statement

The data analyzed in this retrospective study were part of a larger database established at the local University Clinics in the years 2000–2022, after which retrieval was stopped. Only personnel that had regular legal access to the medical records retrieved patient data. They collected data between November and December 2022 and anonymized the data on December 28th of the same year. After this step, individual participants could no longer be identified. The study was approved by the local Ethical Committee (no: S-243/2022), waiving the requirement for informed consent.

Data Availability Statement

The data supporting the conclusions of this article will be made available by the authors upon request.

Conflicts of Interest

The authors declare that the research was conducted in the absence of any commercial or financial relationships that could be construed as potential conflicts of interest.

References

  1. Davoudi, M.; Salami, F.; Reisig, R.; Patikas, D.A.; Beckmann, N.A.; Gather, K.S.; Wolf, S.I. Are Electromyography Data a Fingerprint for Patients with Cerebral Palsy (CP)? Appl. Sci. 2025, 15, 766. [Google Scholar] [CrossRef]
  2. Davoudi, M.; Salami, F.; Reisig, R.; Gather, K.S.; Wolf, S.I. Gluteus medius muscle activation patterns during gait with Cerebral Palsy (CP): A hierarchical clustering analysis. PLoS ONE 2025, 20, e0309582. [Google Scholar]
  3. Davoudi, M.; Salami, F.; Reisig, R.; Patikas, D.A.; Wolf, S.I. Rectus femoris electromyography signal clustering: Data-driven management of crouch gait in patients with cerebral palsy. PLoS ONE 2024, 19, e0298945. [Google Scholar] [CrossRef]
  4. Dreher, T.; Wolf, S.I.; Maier, M.; Hagmann, S.; Vegvari, D.; Gantz, S.; Heitzmann, D.; Wenz, W.; Braatz, F. Long-term results after distal rectus femoris transfer as a part of multilevel surgery for the correction of stiff-knee gait in spastic diplegic cerebral palsy. J. Bone Jt. Surg. 2012, 94, e142. [Google Scholar] [CrossRef]
  5. Agostini, V.; Ghislieri, M.; Rosati, S.; Balestra, G.; Knaflitz, M. Surface electromyography applied to gait analysis: How to improve its impact in clinics? Front. Neurol. 2020, 11, 994. [Google Scholar]
  6. Reisig, R.; Alexander, N.; Armand, S.; Barton, G.J.; Böhm, H.; Boulay, C.; Brunner, R.; Castagna, A.; Davoudi, M.; Desailly, E. Status of surface electromyography assessment as part of clinical gait analysis in the management of patients with cerebral palsy–Outcomes of a Delphi process. Gait Posture 2025, 117, 72–77. [Google Scholar]
  7. Schwartz, M.H.; Rozumalski, A.; Trost, J.P. The effect of walking speed on the gait of typically developing children. J. Biomech. 2008, 41, 1639–1650. [Google Scholar]
  8. Bovi, G.; Rabuffetti, M.; Mazzoleni, P.; Ferrarin, M. A multiple-task gait analysis approach: Kinematic, kinetic and EMG reference data for healthy young and adult subjects. Gait Posture 2011, 33, 6–13. [Google Scholar] [PubMed]
  9. Cho, S.-H.; Park, J.M.; Kwon, O.Y. Gender differences in three dimensional gait analysis data from 98 healthy Korean adults. Clin. Biomech. 2004, 19, 145–152. [Google Scholar]
  10. Kerrigan, D.C.; Todd, M.K.; Croce, U.D. Gender differences in joint biomechanics during walking normative study in young adults. Am. J. Phys. Med. Rehabil. 1998, 77, 2–7. [Google Scholar]
  11. Santuz, A.; Janshen, L.; Brüll, L.; Munoz-Martel, V.; Taborri, J.; Rossi, S.; Arampatzis, A. Sex-specific tuning of modular muscle activation patterns for locomotion in young and older adults. PLoS ONE 2022, 17, e0269417. [Google Scholar]
  12. Bailey, C.A.; Corona, F.; Pilloni, G.; Porta, M.; Fastame, M.C.; Hitchcott, P.K.; Penna, M.P.; Pau, M.; Côté, J.N. Sex-dependent and sex-independent muscle activation patterns in adult gait as a function of age. Exp. Gerontol. 2018, 110, 1–8. [Google Scholar] [PubMed]
  13. Sloot, L.H.; Malheiros, S.; Truijen, S.; Saeys, W.; Mombaur, K.; Hallemans, A.; Van Criekinge, T. Decline in gait propulsion in older adults over age decades. Gait Posture 2021, 90, 475–482. [Google Scholar] [CrossRef] [PubMed]
  14. Kobayashi, Y.; Hobara, H.; Heldoorn, T.A.; Kouchi, M.; Mochimaru, M. Age-independent and age-dependent sex differences in gait pattern determined by principal component analysis. Gait Posture 2016, 46, 11–17. [Google Scholar] [CrossRef]
  15. Di Nardo, F.; Mengarelli, A.; Maranesi, E.; Burattini, L.; Fioretti, S. Gender differences in the myoelectric activity of lower limb muscles in young healthy subjects during walking. Biomed. Signal Process. Control 2015, 19, 14–22. [Google Scholar]
  16. Di Nardo, F.; Laureati, G.; Strazza, A.; Mengarelli, A.; Burattini, L.; Agostini, V.; Nascimbeni, A.; Knaflitz, M.; Fioretti, S. Is child walking conditioned by gender? Surface EMG patterns in female and male children. Gait Posture 2017, 53, 254–259. [Google Scholar]
  17. Schmitz, A.; Silder, A.; Heiderscheit, B.; Mahoney, J.; Thelen, D.G. Differences in lower-extremity muscular activation during walking between healthy older and young adults. J. Electromyogr. Kinesiol. 2009, 19, 1085–1091. [Google Scholar]
  18. Pataky, T.C. Generalized n-dimensional biomechanical field analysis using statistical parametric mapping. J. Biomech. 2010, 43, 1976–1982. [Google Scholar]
  19. Kadaba, M.P.; Ramakrishnan, H.K.; Wootten, M.E. Measurement of lower extremity kinematics during level walking. J. Orthop. Res. 1990, 8, 383–392. [Google Scholar] [CrossRef]
  20. Hermens, H.J.; Freriks, B.; Merletti, R.; Stegeman, D.; Blok, J.; Rau, G.; Disselhorst-Klug, C.; Hägg, G. European recommendations for surface electromyography. Roessingh Res. Dev. 1999, 8, 13–54. [Google Scholar]
  21. Patikas, D.; Wolf, S.I.; Schuster, W.; Armbrust, P.; Dreher, T.; Döderlein, L. Electromyographic patterns in children with cerebral palsy: Do they change after surgery? Gait Posture 2007, 26, 362–371. [Google Scholar] [CrossRef]
  22. Wolf, S.I.; Mikut, R.; Kranzl, A.; Dreher, T. Which functional impairments are the main contributors to pelvic anterior tilt during gait in individuals with cerebral palsy? Gait Posture 2014, 39, 359–364. [Google Scholar] [CrossRef] [PubMed]
  23. Wolf, S.; Loose, T.; Schablowski, M.; Döderlein, L.; Rupp, R.; Gerner, H.J.; Bretthauer, G.; Mikut, R. Automated feature assessment in instrumented gait analysis. Gait Posture 2006, 23, 331–338. [Google Scholar] [CrossRef]
  24. Wu, M.; Liao, L.; Luo, X.; Ye, X.; Yao, Y.; Chen, P.; Shi, L.; Huang, H.; Wu, Y. Analysis and classification of stride patterns associated with children development using gait signal dynamics parameters and ensemble learning algorithms. BioMed Res. Int. 2016, 2016, 9246280. [Google Scholar] [CrossRef] [PubMed]
  25. Nene, A.; Mayagoitia, R.; Veltink, P. Assessment of rectus femoris function during initial swing phase. Gait Posture 1999, 9, 1–9. [Google Scholar] [CrossRef]
  26. Augsburger, S.; White, H.; Iwinski, H. Midstance hamstring length is a better indicator for hamstring lengthening procedures than initial contact length. Gait Posture 2020, 80, 26–30. [Google Scholar] [CrossRef] [PubMed]
  27. Konrath, J.M.; Saxby, D.J.; Killen, B.A.; Pizzolato, C.; Vertullo, C.J.; Barrett, R.S.; Lloyd, D.G. Muscle contributions to medial tibiofemoral compartment contact loading following ACL reconstruction using semitendinosus and gracilis tendon grafts. PLoS ONE 2017, 12, e0176016. [Google Scholar] [CrossRef]
  28. DeMont, R.G.; Lephart, S.M. Effect of sex on preactivation of the gastrocnemius and hamstring muscles. Br. J. Sports Med. 2004, 38, 120–124. [Google Scholar] [CrossRef]
  29. Ko, S.-u.; Tolea, M.I.; Hausdorff, J.M.; Ferrucci, L. Sex-specific differences in gait patterns of healthy older adults: Results from the Baltimore Longitudinal Study of Aging. J. Biomech. 2011, 44, 1974–1979. [Google Scholar] [CrossRef]
  30. Chappell, J.D.; Creighton, R.A.; Giuliani, C.; Yu, B.; Garrett, W.E. Kinematics and electromyography of landing preparation in vertical stop-jump: Risks for noncontact anterior cruciate ligament injury. Am. J. Sports Med. 2007, 35, 235–241. [Google Scholar] [CrossRef]
  31. Sigward, S.M.; Powers, C.M. The influence of gender on knee kinematics, kinetics and muscle activation patterns during side-step cutting. Clin. Biomech. 2006, 21, 41–48. [Google Scholar]
  32. Chiu, M.-C.; Wang, M.-J. The effect of gait speed and gender on perceived exertion, muscle activity, joint motion of lower extremity, ground reaction force and heart rate during normal walking. Gait Posture 2007, 25, 385–392. [Google Scholar] [PubMed]
  33. Cammarata, M.L.; Dhaher, Y.Y. The differential effects of gender, anthropometry, and prior hormonal state on frontal plane knee joint stiffness. Clin. Biomech. 2008, 23, 937–945. [Google Scholar]
  34. Ko, S.-u.; Hausdorff, J.M.; Ferrucci, L. Age-associated differences in the gait pattern changes of older adults during fast-speed and fatigue conditions: Results from the Baltimore longitudinal study of ageing. Age Ageing 2010, 39, 688–694. [Google Scholar]
  35. Kimura, T.; Kobayashi, H.; Nakayama, E.; Hanaoka, M. Effects of aging on gait patterns in the healthy elderly. Anthropol. Sci. 2007, 115, 67–72. [Google Scholar]
  36. Hof, A.L.; Elzinga, H.; Grimmius, W.; Halbertsma, J.P.K. Speed dependence of averaged EMG profiles in walking. Gait Posture 2002, 16, 78–86. [Google Scholar]
Figure 1. Age and gender distribution of participants.
Applsci 15 03472 g001
Figure 2. Average (solid line) and standard deviation (dashed line) of EMG envelopes along with SPM results for two age groups: children (red) and adults (blue). Shaded areas indicate gait cycle periods with statistically significant differences. The p-value was set at 0.05 to determine statistical significance.
Applsci 15 03472 g002
Figure 3. Average (solid line) and standard deviation (dashed line) of EMG envelopes along with SPM results for two gender groups: male (red) and female (blue). Shaded areas indicate gait cycle periods with statistically significant differences.
Applsci 15 03472 g003
Table 1. Demographic characteristics of age and gender groups.
Age GroupGender GroupNo.Age (Years)Age Range (Min–Max)Height (cm)Body Mass (kg) Body   Mass   Index   ( BMI )   ( k g / m 2 )
ChildrenMale219.36 (1.77)5.7–12.7137.76 (11.89)33.02 (88.82)17.04 (2.14)
Female149.28 (2.19)5.6–12.6138.42 (15.16)34.37 (13.78)17.02 (4.06)
AdultsMale2931.42 (10.86)21.2–64.1180.55 (7.16)77.25 (8.71)23.69 (2.33)
Female3328.7 (11.03)18.2–62.6168.84 (11.03)62.88 (7.6)22.04 (2.17)
Table 2. Mean (SD) and statistical results for the effect of age on kinematic, kinetics, and ST parameters.
VariableAge GroupMean (SD)95% Confidence Interval (Lower–Upper Bound)p-Value
Maximum ankle dorsiflexion moment (N.m/kg)Children1.28 (0.17)1.22–1.34<0.001
Adults1.59 (0.17)1.55–1.64
Maximum ankle dorsiflexion power (W/kg)Children3.62 (0.86)3.32–3.91<0.001
Adults4.59 (0.95)4.34–4.83
Maximum ankle plantarflexion power (W/kg)Children0.76 (0.38)0.62–0.890.012
Adults0.95 (0.33)0.86–1.03
Maximum knee flexion moment (N.m/kg)Children0.48 (0.16)0.42–0.540.004
Adults0.6 (0.2)0.55–0.65
Maximum hip flexion (degree)Children36.9 (6.3)34.7–39.10.018
Adults33.9 (5.4)32.5–35.3
Maximum hip extension moment (N.m/kg)Children0.88 (0.22)0.8–0.95<0.001
Adults1.08 (0.27)1.01–1.15
Cadence (strides/min)Children128.1 (10.2)124.6–131.6<0.001
Adults115.2 (8)113.2–117.3
Speed (m/s)Children1.29 (0.15)1.23–1.340.001
Adults1.39 (0.13)1.35–1.42
Stride time (s)Children0.94 (0.07)0.91–0.96<0.001
Adults1.04 (0.07)1.02–1.06
Stride length (m)Children1.21 (0.15)1.16–1.26<0.001
Adults1.45 (0.12)1.42–1.48
Table 3. Mean (SD) and statistical results for the effect of gender on kinematic, kinetics, and spatiotemporal parameters.
VariableGender GroupMean (SD)95% Confidence Interval (Lower–Upper Bound)p Value
Maximum ankle plantarflexion (degree)Males18.4 (5.7)16.8–20.10.023
Females21.5 (7.1)19.4–37.3
Maximum ankle dorsiflexion power (W/kg)Males4.03 (1)3.74–4.320.041
Females4.46 (1)4.1–4.75
Maximum hip flexion (degree)Males33.6 (5.6)31.9–35.20.012
Females36.6 (5.9)34.8–38.3
Maximum hip extension power (W/kg)Males0.97 (0.3)0.88–1.050.042
Females1.1 (0.33)1–1.2
Foot off (% gait cycle)Males61.4 (2.1)60.8–620.024
Females60.5 (1.9)59.9–61
Table 4. Mean (SD) and statistical results for the interaction effect between age and gender groups. BIC: biceps femoris, SEM: semimembranosus. Only variables with a significant interaction effect (p < 0.0125) are presented.
Dependent VariableAge GroupGender GroupMean (SD)95% Confidence Interval (Lower–Upper Bound)p Value for Pairwise Comparisonsp Value for
Interaction Age-Gender
Cohen’s f2
Mean activity of BIC in stanceChildrenMale90.4 (2.7)84.9–95.90.0560.0020.141
Female81.9 (3.3)75.2–88.7
AdultsMale79.1 (2.3)74.3–83.70.006
Female88.1 (2.2)83.7–92.5
Mean activity of BIC in swingChildrenMale116.9 (17.8)108.5–125.30.04<0.0010.177
Female130.9 (14.6)120.6–141.2
AdultsMale136.8 (23)129.6–1440.002
Female121 (18.7)114.2–127.7
Maximum activity of BIC in swingChildrenMale278.5 (61.8)247.5–309.30.151<0.0010.199
Female314.1 (46.5)276.2–351.9
AdultsMale340.6 (85.4)314.3–366.9<0.001
Female268 (71.7)243.3–292.6
Mean activity of SEM in stanceChildrenMale85.1 (2.9)79.2–910.0610.0060.141
Female76.2 (3.6)69–83.4
AdultsMale71.2 (2.5)66.2–76.30.036
Female78.6 (2.3)73.9–83.3
Mean activity of SEM in swingChildrenMale126.1 (4.6)116.9–135.40.0930.0060.151
Female138.6 (5.6)127.3–149.9
AdultsMale148.5 (3.9)140.6–156.40.018
Female135.4 (3.7)128.1–142.8
Disclaimer/Publisher’s Note: The statements, opinions and data contained in all publications are solely those of the individual author(s) and contributor(s) and not of MDPI and/or the editor(s). MDPI and/or the editor(s) disclaim responsibility for any injury to people or property resulting from any ideas, methods, instructions or products referred to in the content.

