1. Introduction
Osteoporosis is defined as a systemic skeletal disorder in which a combination of low bone mass and microarchitectural deterioration cause an increased risk of bone fragility [
1,
2]. The consequence is that osteoporosis represents a major risk factor for fragility fractures (FFs) and imposes a significant burden on society and healthcare systems. Typical sites of FFs are the dorsal and lumbar vertebrae, femoral neck, proximal humerus, and distal radius: experiencing a fragility fracture is a strong predictor of an increased risk for future fractures. For instance, women with existing vertebral fractures are five times more likely to sustain another vertebral fracture and twice as likely to experience a hip fracture [
3]. Early detection of osteoporosis and the initiation of suitable treatment can contribute to FF risk reductions [
4].
In clinical practice, instrumental diagnosis of osteoporosis relies on the assessment of bone mineral density (BMD) at the lumbar spine and hip using dual-energy X-ray absorptiometry (DXA) [
5].
BMD primarily reflects bone quantity and is closely related to bone strength; however, many individuals experiencing FFs (or with prevalent FFs) may exhibit normal BMD values. This controversial aspect can be attributed to the impact of skeletal factors that influence skeletal strength other than BMD, including bone geometry, microarchitecture, and remodeling. These skeletal features are considered to be related to “bone quality”, and account for about 30% of bone strength [
6].
DXA is a two-dimensional imaging technique influenced by bone size, which cannot differentiate between cortical and trabecular bone or evaluate bone microarchitecture [
7]. To address these limitations, the Trabecular Bone Score (TBS) was developed in 2010. This DXA-based software analyzes lumbar spine images to indirectly assess trabecular microarchitecture through image textural analysis: higher TBS values indicate a normal microarchitecture, while lower values reflect a degraded microarchitecture and increased risk of fracture [
8,
9].
Quantitative computed tomography (QCT) is a CT-based cross-sectional technique, which provides three-dimensional volumetric BMD (vBMD) values of mg hydroxyapatite/cm
3 from the lumbar spine and femur [
10]. The main advantage over DXA is the ability to analyze trabecular and cortical bone separately, providing vBMD measurements of the trabecular part only, avoiding artifacts typically found at the spine on DXA (e.g., due to degenerative disease) [
11]. Moreover, QCT is also less affected by surrounding tissues compared to DXA [
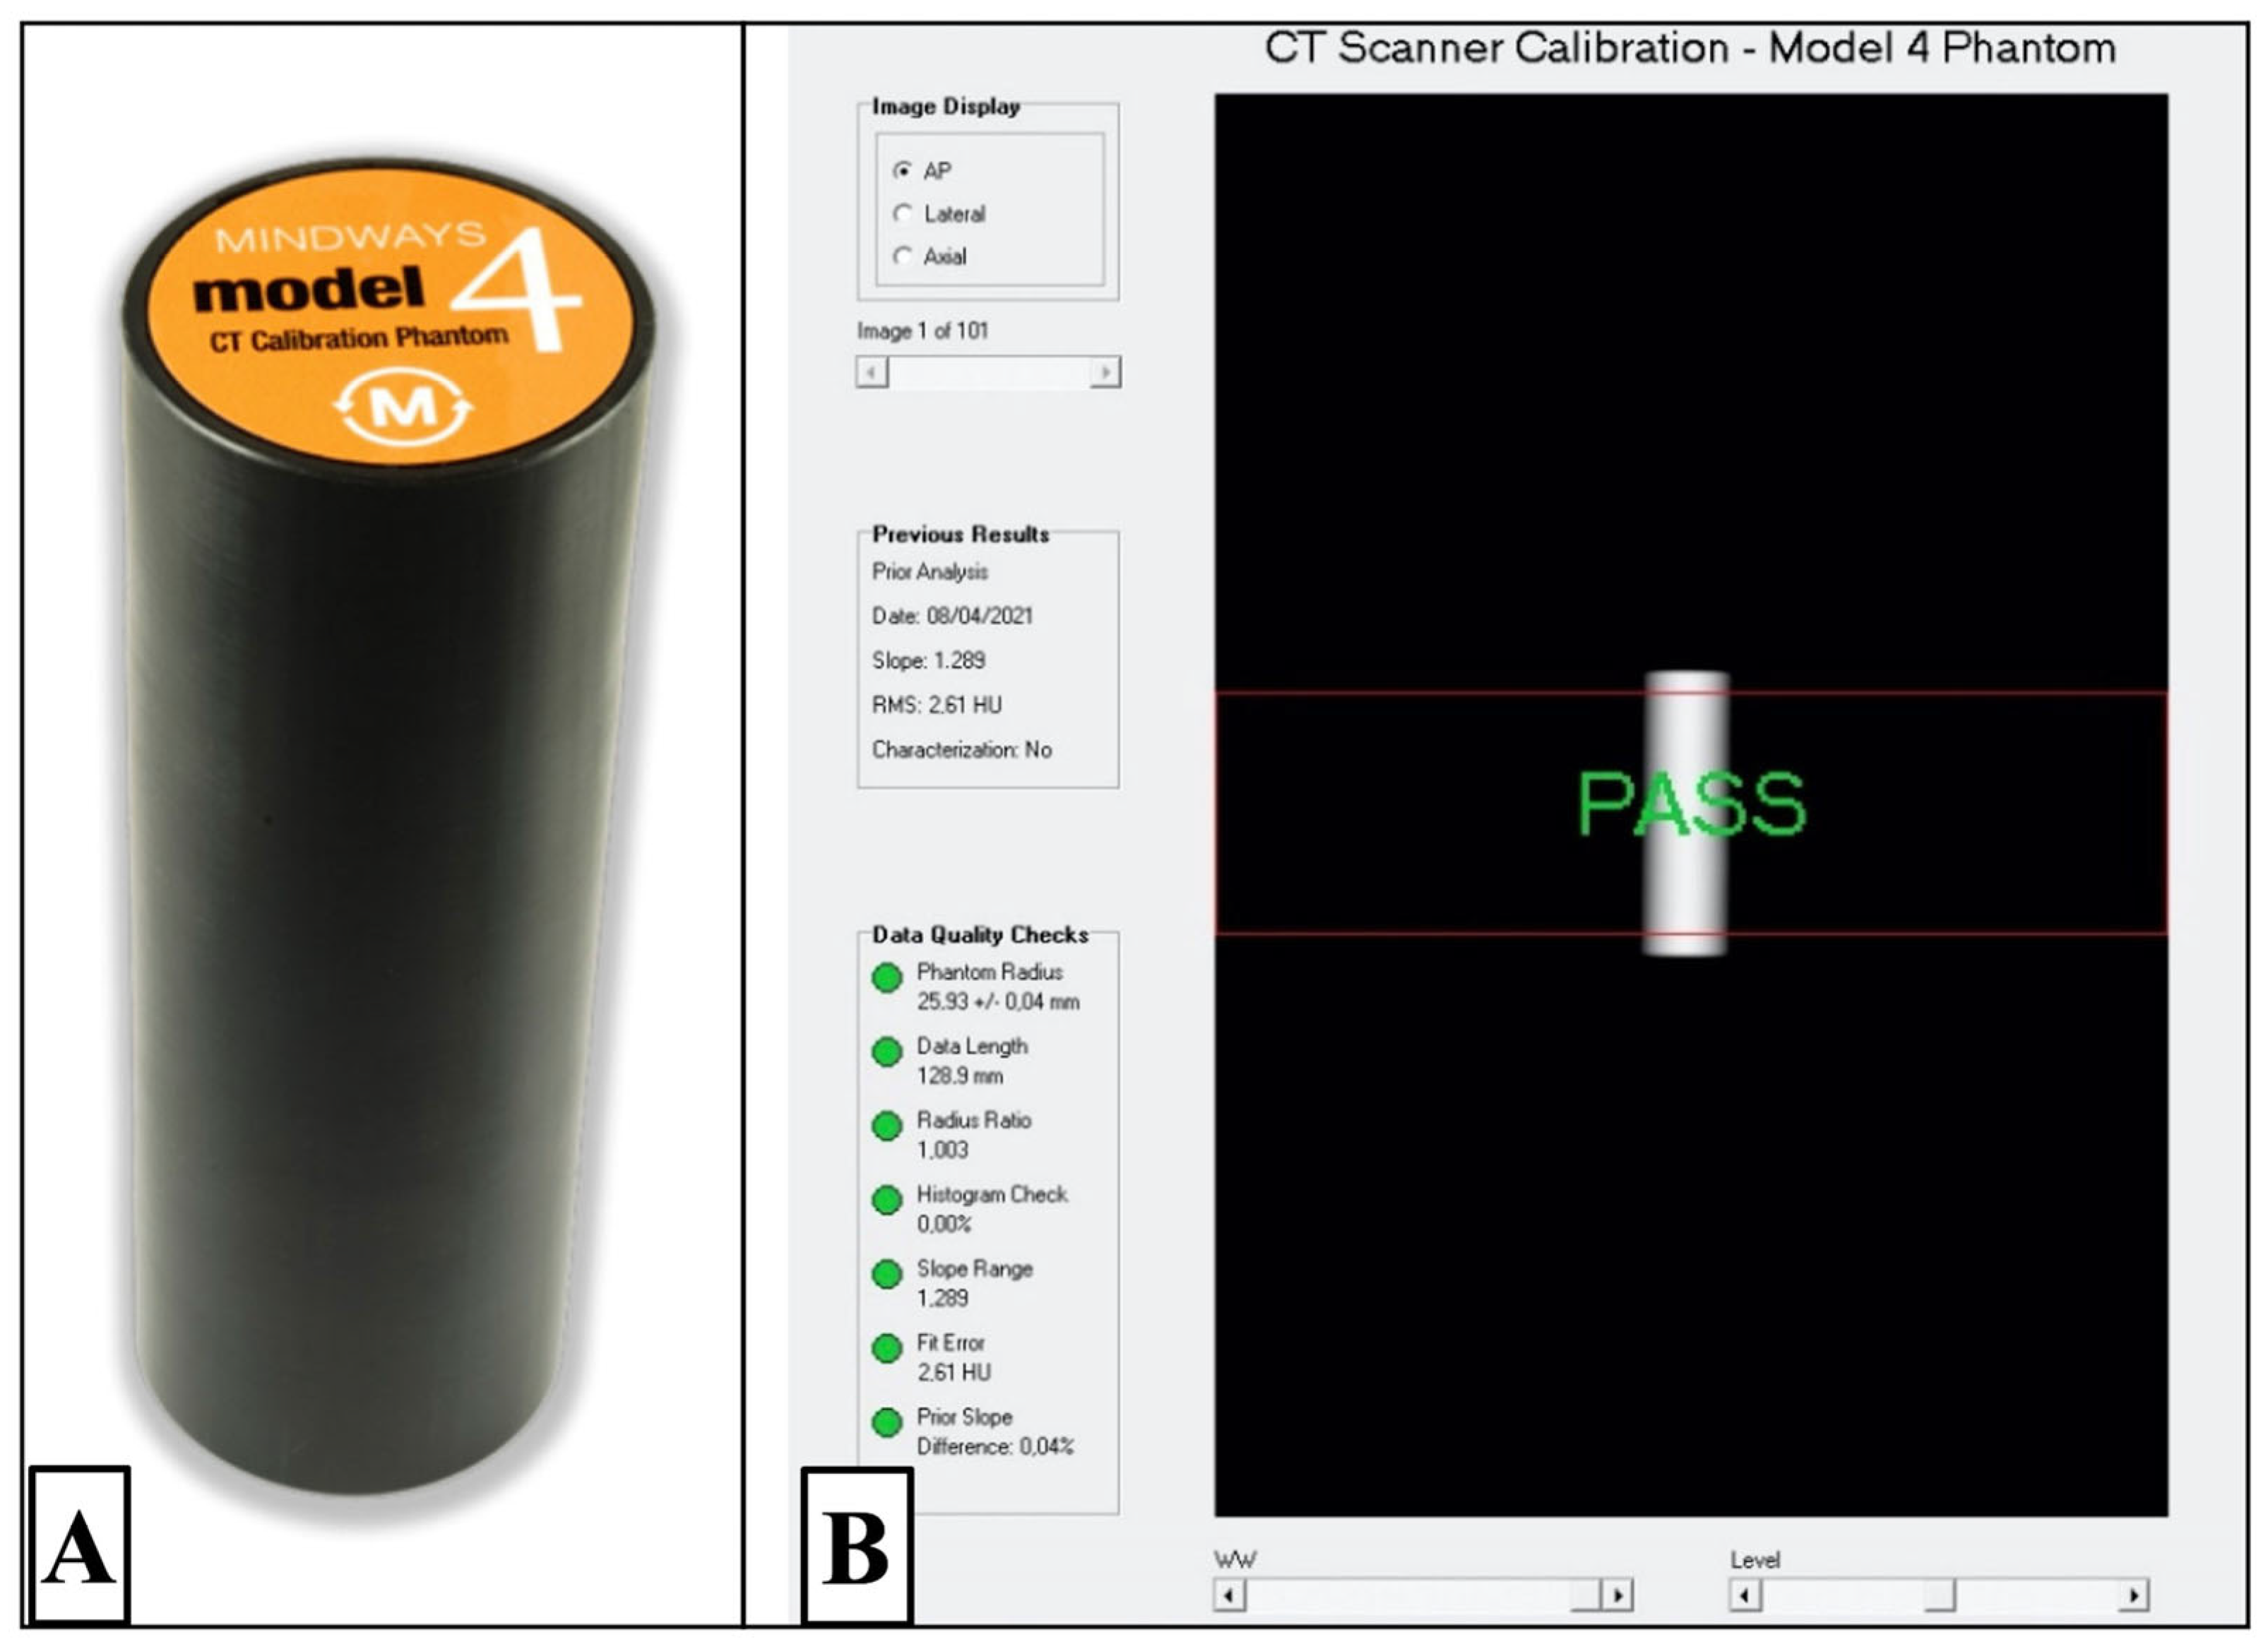
12]. A CT scanner calibration, with external phantoms, is necessary to obtain vBMD values from CT images, which typically provides Hounsfield Unit (HU) values. These phantoms are composed of a set of known density values of hydroxyapatite samples. The calibration can be performed synchronously or asynchronously. In the case of synchronous calibration, the phantom is placed within the CT table during the patient scan, while for asynchronous calibration, the phantom is scanned periodically in the absence of the patient [
11,
13]. Therefore, asynchronous calibration allows vBMD values to be obtained from routine CT examinations performed for other clinical reasons, setting the stage for an opportunistic osteoporosis screening.
Despite DXA representing the reference for measuring BMD, a discrepancy is reported between areal BMD from DXA and volumetric BMD from QCT [
14]. The common explanation is that DXA is influenced by vertebral degenerative changes or aortic calcifications, while QCT can exclusively evaluate the trabecular region of the vertebral body [
14]. In this study, we aimed to compare QCT to DXA including not only BMD but also the TBS, which is generally reported to be less affected by degenerative changes [
15]. Therefore, we compared the diagnostic accuracy of these parameters in discriminating between individuals with and without fragility fractures.
2. Materials and Methods
2.1. Study Population
This retrospective study was performed at the IRCCS Istituto Ortopedico Galeazzi in Milan, Italy. Local ethics committee approval was obtained (RETRORAD, approved by the Ethical Committee of San Raffaele Hospital), and patient authorization was obtained for the publication of anonymized data.
Patients who underwent both a lumbar spine DXA and a chest/abdominal CT between January 2015 and July 2022 were evaluated. Inclusion criteria were as follows: (i) maximum time interval of six months between the two examinations; (ii) non-contrast CT scan, which included at least the first four lumbar vertebrae, to obtain valid QCT values; (iii) CT scan performed with the patient positioned supine with arms raised up in order to avoid artifacts related to arms that may interfere with QCT measurements; (iv) age ≥ 18 years to ensure a study population consisting of skeletally mature individuals; and (v) adequate image quality for both DXA and CT, to ensure accurate assessment of bone density and morphology.
Exclusion criteria were (i) history of lumbar spine surgery, as metallic implants alter BMD measurements; (ii) technical issues affecting image quality, including motion artifacts, excessive noise, or inadequate CT acquisition parameters (QCT software version 5.1 only accepts a specific field of view and tube voltage); and (iii) history or presence of oncologic diseases with spinal involvement. Of note, the presence of osteometabolic or systemic diseases was not considered an exclusion criterion. Such conditions do not introduce a systematic discrepancy between the two imaging modalities and therefore did not affect the study’s primary objective. Furthermore, patients with non-aggressive bone alterations (such as vertebral compression fractures or hemangiomas) were included whenever alternative vertebrae could be analyzed or partial measurements could be reliably obtained.
The final cohort consisted of 105 participants, 87 (82.9%) females and 18 (17.1%) males, with a mean age of 69 years (SD: 11; range 40–86). More in detail, for the female participants, the mean age was 68.5 years (SD: 11; range 42–86), while male participants had a mean age of 70 years (SD, range 40–82.5).
2.2. Fragility Fracture Evaluation
The presence of fragility fractures was retrospectively assessed on the reformatted sagittal CT scan, and on any diagnostic imaging performed in our institution by the subject, before the CT. For this purpose, we used a Picture Archiving and Communication System (PACS) to review the imaging studies. Major fractures were considered those that occurred at hip, vertebrae, distal wrist, and proximal humerus.
2.3. CT Examinations
CT scans were performed with the patient supine on a 64-slice scanner (Somatom Emotion, Siemens Medical Solutions, Erlangen, Germany). Scans were carried out in a head-first orientation, without gantry tilt. CT parameters were as follows: tube voltage range: 120 to 140 kV; tube current: 220 to 260 mA; collimation = 64 × 0.6 mm; and rotation time = 0.5 s, with a pitch of 0.6. Image reconstruction was performed with the use of a standard algorithm for soft tissue, with a slice thickness of 3 mm (1 mm intervals).
2.4. QCT Asynchronous Calibration
‘‘Asynchronous’’ calibration relies on the fact that a scan of the QCT phantom is performed (without scanning the patient) using the quality assurance (QA) tool provided by the manufacturer. This calibration is necessary to transform the Hounsfield Unit (HU) from CT into g/cm
3 for BMD-QCT. All QA studies were performed on the Mindways QA phantom with the use of the same technical parameters that were in use for routine CT examination (e.g., same field of view, same tube voltage range, etc.). This step is a pre-requisite to conduct the retrospective analysis of all the scans that were previously acquired on our CT that we use in our study [
11]. The specific tool called “QA analysis” in the Mindways platform (Mindways Software Inc., version 5.1, Austin, TX, USA) was used to match CT HU from images to the appropriate reference QA/calibration results (
Figure 1).
2.5. QCT-Based BMD Measurements
Once the examinations were retrieved on the QCT software, an experienced operator (more than ten years in osteoporosis imaging) performed the exams using the dedicated Mindways software (QCT PRO version 6.1). The evaluation can be conducted on up to three lumbar vertebrae, ranging from L1 to L4. The software automatically identifies the vertebral region and place the regions of interest (ROIs) on the axial lumbar CT, but these ROIs can always be corrected by the operator, whenever necessary.
The values of vBMD (mg/cm
3) obtained through QCT were expressed as equivalent calibrated densities of aqueous potassium phosphate. For QCT, lumbar spine T-scores were calculated using the manufacturer’s CTXA reference database; these values are not equivalent to DXA T-scores and cannot be used for the World Health Organization diagnosis of osteoporosis. Therefore, the American College of Radiology defines trabecular spine BMD categories as follows: values above 120 mg/cm
3 are considered normal, values between 80 and 120 mg/cm
3 indicate osteopenia, and values below 80 mg/cm
3 are classified as osteoporosis [
16].
2.6. DXA-Based BMD Measurements
DXA exams were performed using a Hologic QDR-Discovery W densitometer (Hologic Inc., Bedford, MA, USA) by a radiographer with more than 5 years in DXA scanning. BMD values were obtained after the end of the analysis, which was performed according to the manufacturer’s instruction. All TBS values were automatically obtained after the DXA analysis by a report generated from the same area of analysis of lumbar spine BMD, using the TBS iNsight
® software (version 2.1; Medimaps, Merignac, France). T-score values were used for BMD value diagnosis in accordance with the WHO criteria [
17]. TBS values greater than 1.310 indicate a normal microarchitecture with minimal degradation, values between 1.230 and 1.310 suggest a partially degraded microarchitecture, and values below 1.230 reflect a significantly degraded microarchitecture, which is associated with a higher risk of fractures. These thresholds provide complementary information to bone mineral density (BMD) measurements from DXA.
2.7. Statistical Analysis
The Shapiro–Wilk test was used to assess the normality of data; the mean, along with the standard deviation (SD), was calculated for both BMD and TBS values. The correlation between QCT and DXA data was estimated using a linear regression analysis by calculating the Pearson’s correlation coefficient (r). To further evaluate the agreement between QCT and DXA (BMD), as well as between QCT and TBS, we performed a Bland–Altman analysis. For each comparison, we calculated the mean difference (bias) and 95% limits of agreement (mean difference ± 1.96 standard deviations). We also calculated the mean absolute difference (MAD) to quantify the average discrepancy, independent of the sign. A Bland–Altman analysis was also performed to assess the agreement between DXA aBMD and DXA TBS.
The ability of QCT-derived vBMD and DXA-based parameters (aBMD and TBS) to differentiate patients with and without a history of fragility fractures was evaluated using the area under the curve (AUC) of the Receiver Operating Characteristic (ROC). The sensitivity of aBMD, TBS, and vBMD by QCT in identifying fragility fractures was also calculated.
Statistical analysis was performed using SPSS v24 (SPSS Inc., Chicago, IL, USA). A
p-value < 0.05 was considered statistically significant [
18].
3. Results
A total of 194 participants were identified, and after applying inclusion and exclusion criteria, 89 (45.8%) participants were excluded due to the following reasons: previous spinal surgery (n = 49, 55%), the absence of a non-contrast scan (n = 15, 16.9%), and technical limitations (n = 25, 28.1%).
A summary of patients’ characteristics and bone status is reported in
Table 1. The mean value of participants’ body mass index (BMI) was 26.6 (SD: 5; range 18.6–46.4). Overall, 49/105 participants (46.6%) had a positive history for at least one major fragility fracture.
The mean T-score obtained by QCT was −3.4 ± 1.2, with a final diagnosis of osteoporosis in 59/105 (56.2%), osteopenia in 36/105 (34.3%), and normal status in 10/105 (9.5%).
On the other hand, the mean T-score obtained by DXA was −1.3 ± 1.6, with a final diagnosis of osteoporosis in 25/105 (23.8%), osteopenia in 35/105 (33.3%), and normal status in 45/105 (42.9%).
The direct comparison in terms of final diagnosis between DXA and QCT showed that in 42/105 (40%) cases, DXA and QCT provided the same final diagnosis (DXA-QCT matching), while in 63/105 (60%) the final diagnosis was different (DXA-QCT mismatching).
A more detailed analysis of mismatching cases showed that DXA underestimated the disease in 58/63 cases (92.2%), while QCT underestimated the disease in only 5/63 (7.8%) cases, as listed in
Table 2.
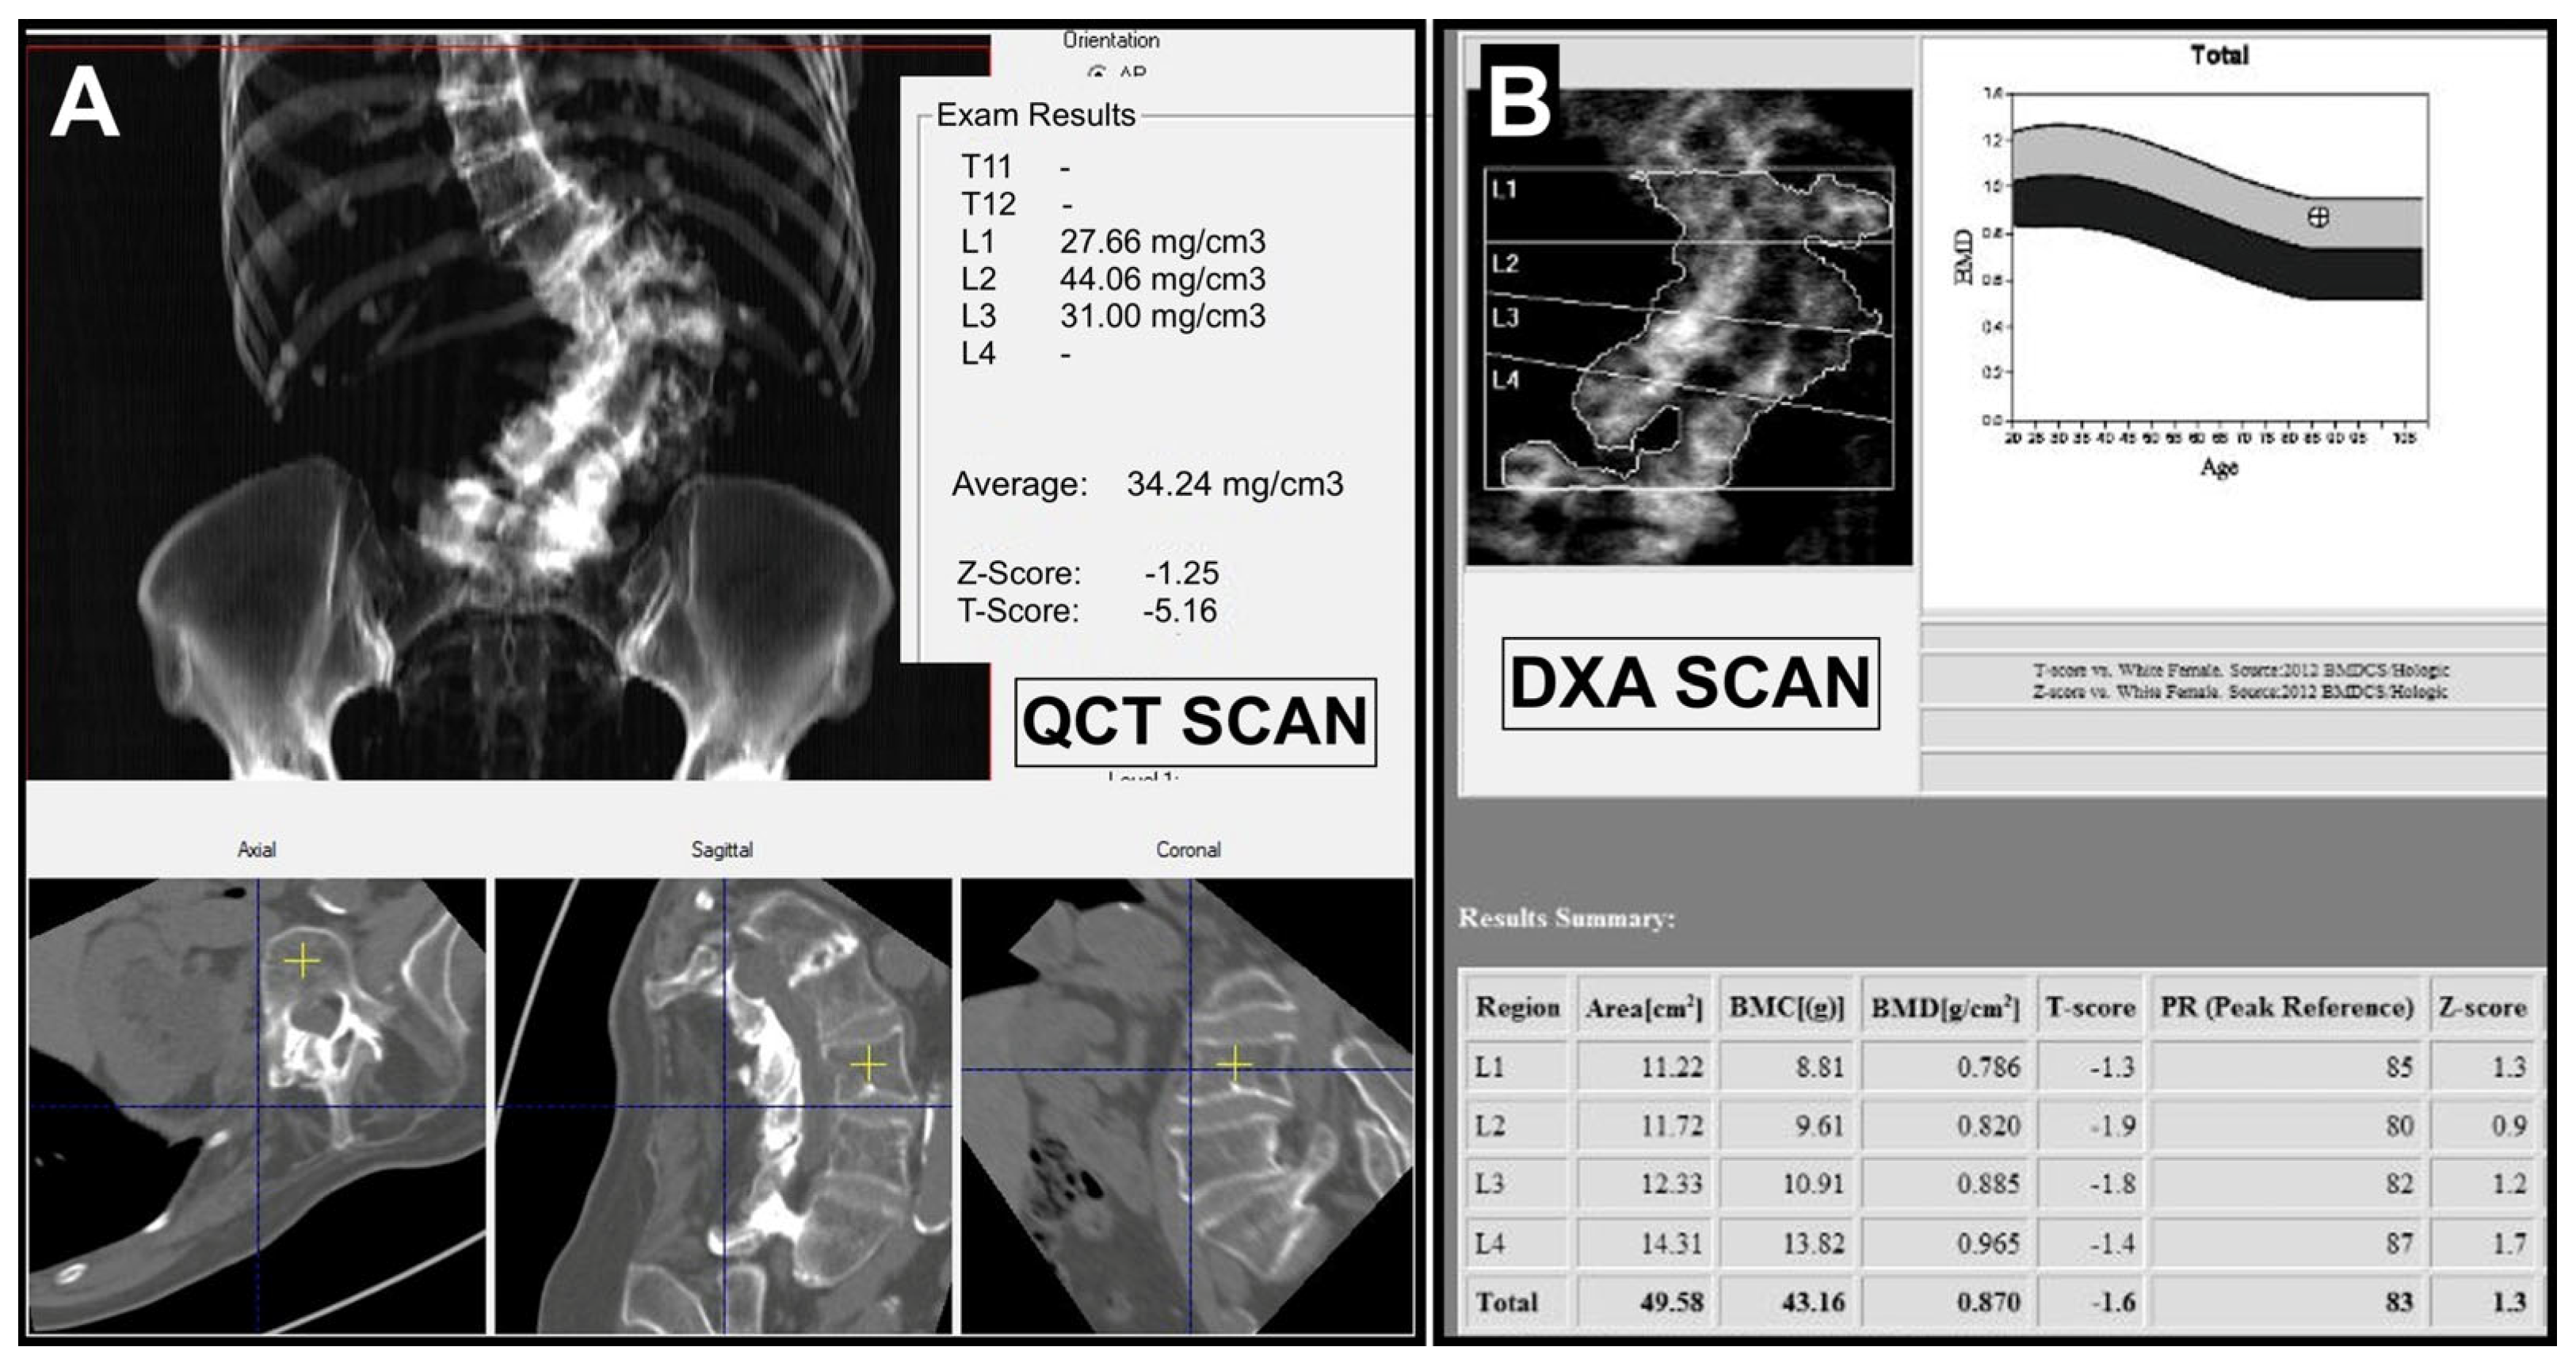
The analysis of single cases in which QCT underestimated the disease demonstrated mean vBMD values very close to diagnostic thresholds, with little difference between the QCT-derived T-score values and the DXA T-score. On the contrary, in 49/58 (84%) of cases of underestimation by DXA, the radiologist stated the presence of degenerative changes in the lumbar spine, resulting in a fictitious increase in aBMD. An example of a mismatching case caused by spondylarthrosis is shown in
Figure 2.
Regarding TBS, 35/105 patients (33.3%) presented normal TBS values (>1.310) corresponding to a normal indirect bone microarchitecture, 32/105 participants (30.5%) presented TBS values between 1.230 and 1.310 (partially degraded microarchitecture), and 38/105 participants (36.2%) presented a degraded indirect microarchitecture (TBS < 1.230).
The correlation between DXA-derived aBMD and QCT-derived vBMD was moderate (r = 0.446), as well as between TBS and vBMD (r = 0.524), while a good correlation was found between aBMD and TBS (r = 0.621). All correlations were statistically significant (p < 0.005).
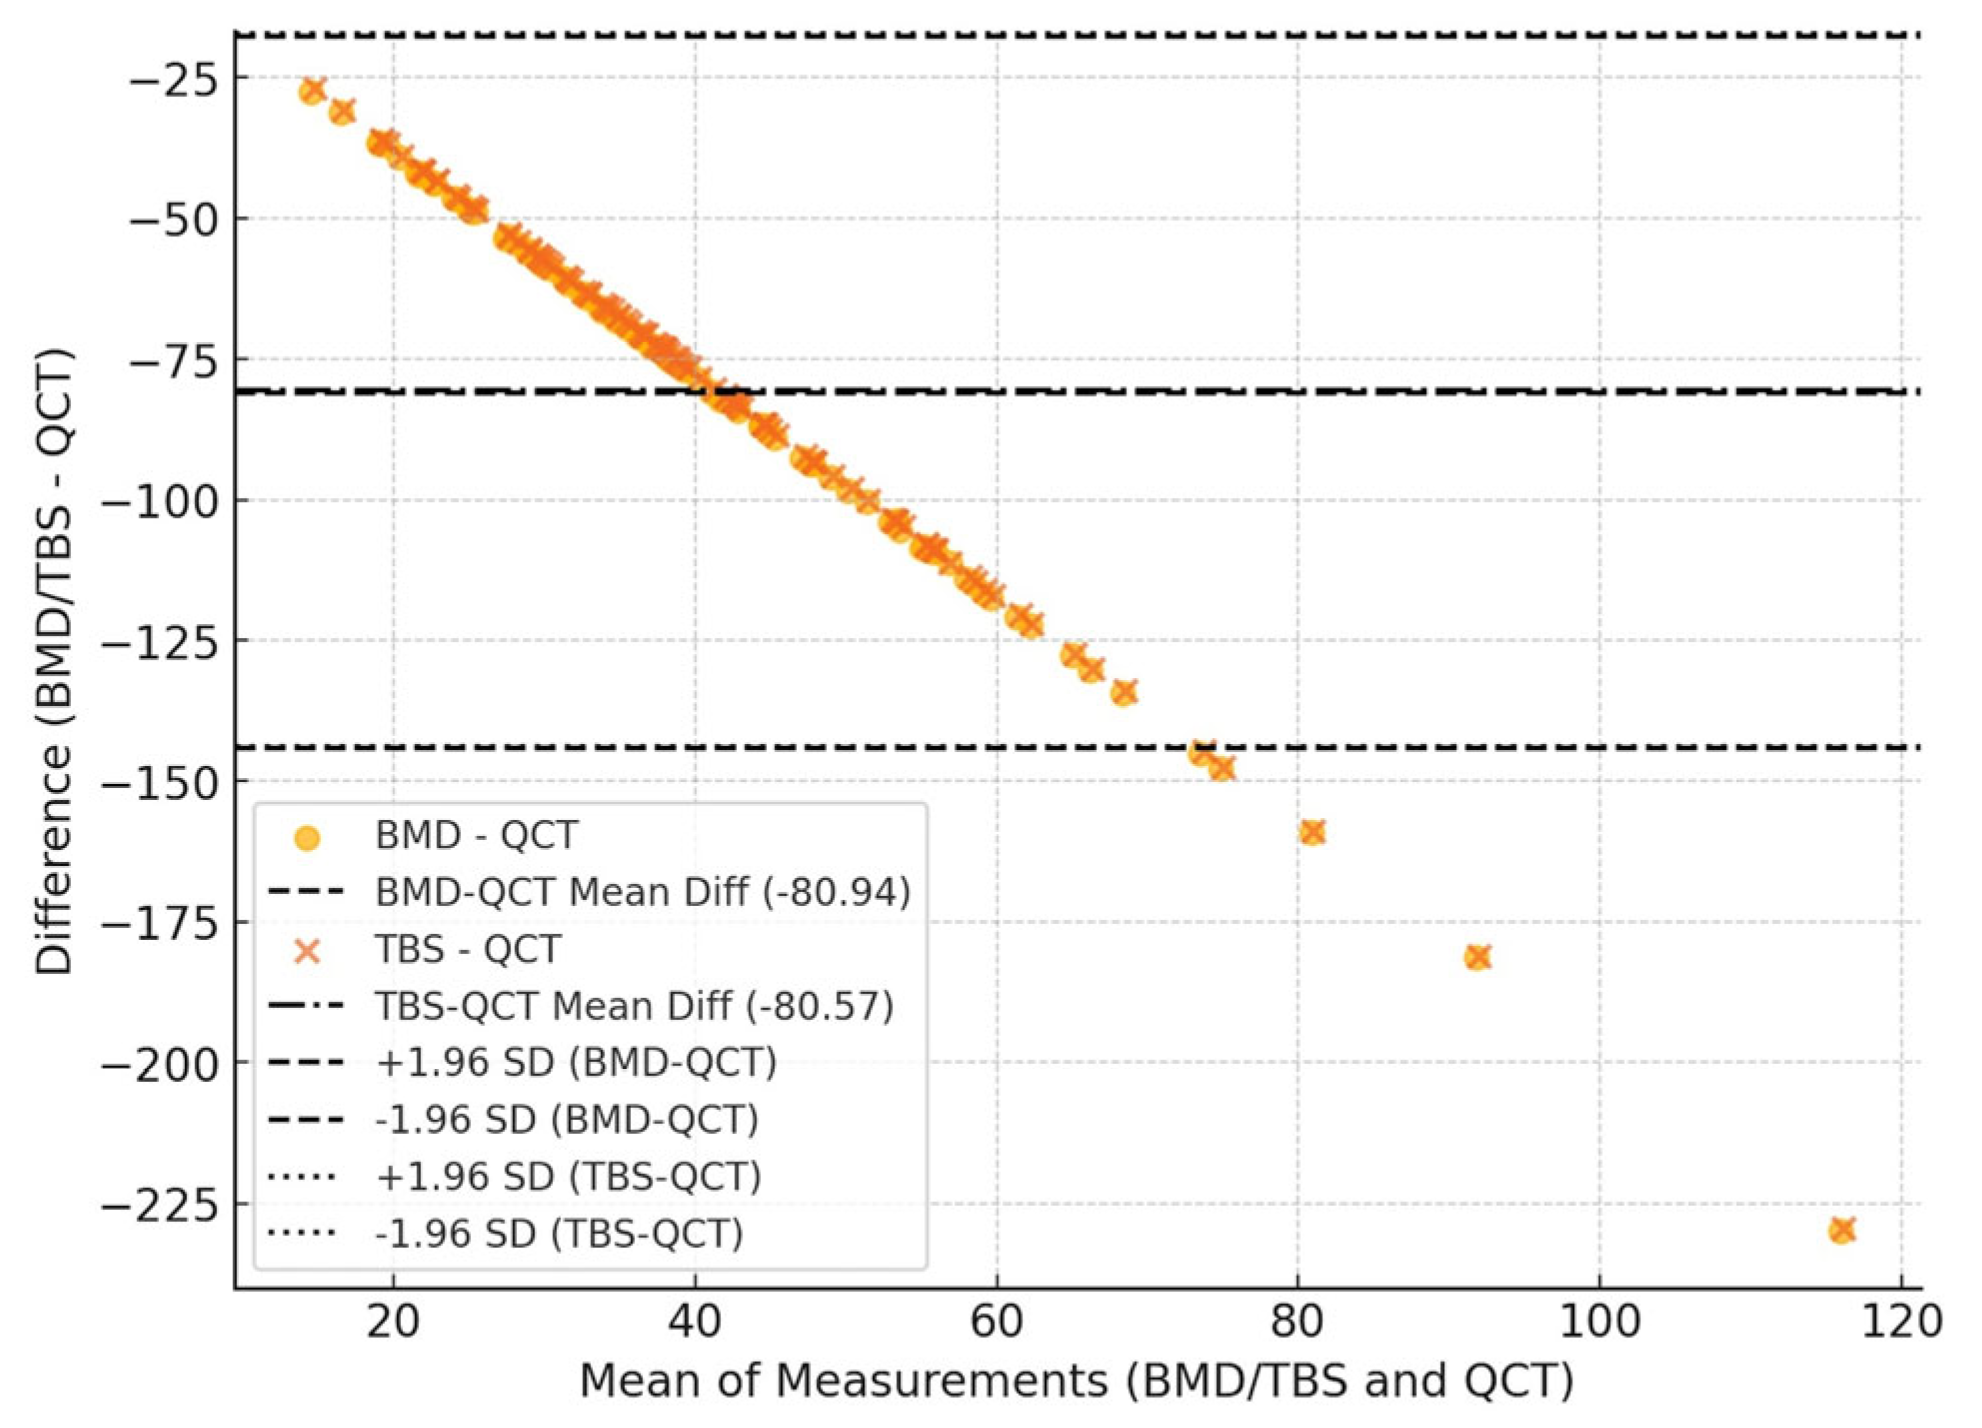
The Bland–Altman analysis (
Figure 3) showed a systematic bias between the methods. The mean difference was −80.94 for BMD-QCT and −80.57 for TBS-QCT, indicating that QCT systematically overestimates values compared to DXA and TBS. This is shown in
Figure 3. The limits of agreement demonstrated an increasing dispersion at higher values, suggesting a proportional bias. This means that the discrepancy between QCT and DXA/TBS is not constant but tends to increase as BMD/TBS values rise. Additionally, the mean absolute difference (MAD) was 80.94 for BMD-QCT and 80.57 for TBS-QCT, confirming a consistent discrepancy between the methods, regardless of the direction of the difference.
The Bland–Altman plot (
Figure 4) for DXA aBMD vs. DXA TBS shows a mean difference (bias) of −0.367, with limits of agreement (LoA, ±1.96 SD) of [−0.654, −0.079]. The mean difference (bias) is negative, indicating that aBMD values by DXA are consistently higher than TBS values. The limits of agreement are relatively wide, suggesting considerable variability between these two parameters.
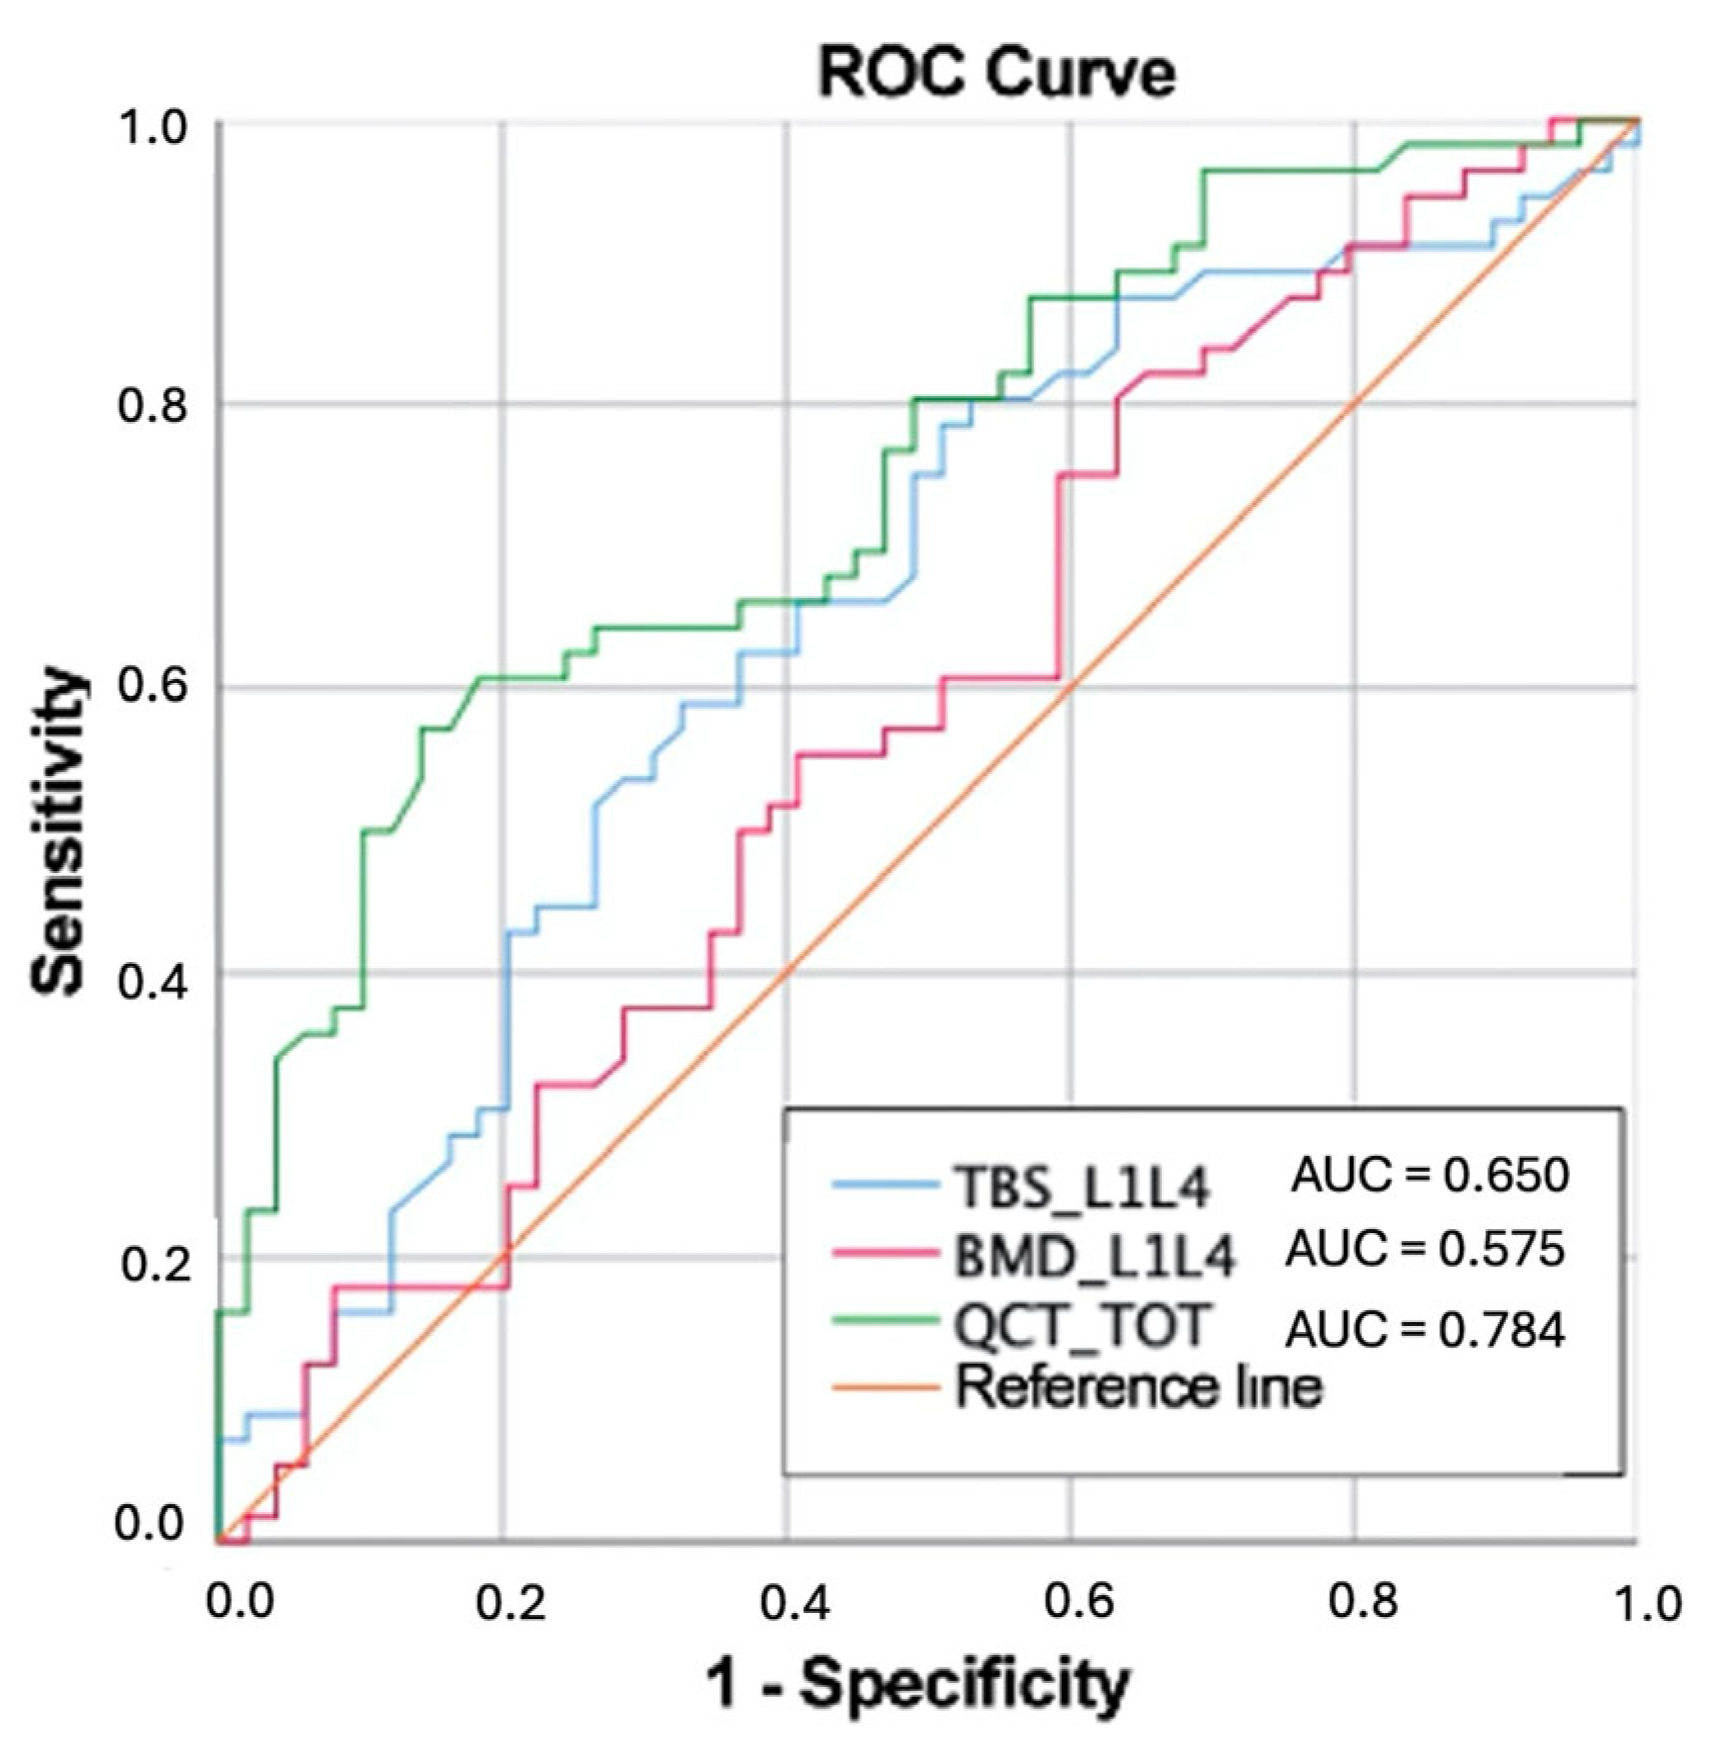
ROC curves were calculated to assess the capability to discriminate between participants with and without fragility fractures. The best performing parameter was the QCT-derived vBMD, with an area under the curve (AUC) of 0.748. In contrast, the diagnostic performance of DXA-based parameters was slightly worse, namely with an AUC of 0. 575 for aBMD and 0.650 for TBS.
Figure 5 illustrates the comparison between the ROC curves for the three parameters. Volumetric BMD by QCT demonstrated the highest sensitivity (65.3%) in identifying fragility fractures, followed closely by TBS (63.3%), while aBMD by DXA showed the lowest sensitivity (55.1%).
4. Discussion
This study compared lumbar (L1–L4) BMD measurements by DXA, including TBS, with volumetric BMD values obtained via QCT. On one hand, we found that QCT with asynchronous calibration was able to provide vBMD values that most of the time were comparable with those of DXA-aBMD in diagnosing patients with osteoporosis. In fact, all patients classified with osteoporosis by DXA were similarly classified by QCT, except for four participants classified as osteoporotic by DXA and osteopenic by QCT. One possible explanation is that the ACR thresholds for QCT are linear and do not represent a standard deviation, as seen with the T-score. In all these cases, the values were very close to a change in the diagnosis (from osteopenia to osteoporosis). On the other hand, our results showed that QCT can offer a more accurate diagnosis of osteopenia/osteoporosis in patients where DXA-aBMD values were altered and overestimated due to artifacts caused by vertebral degenerative changes. In fact, we must consider that DXA-based parameters (aBMD and TBS) acquired during posteroanterior DXA at the lumbar spine, are influenced by the vertebral posterior elements [
19]. Previous studies showed that the posterior elements accounted for about half of the bone mineral content in the DXA lumbar spine scan region [
20]. On the contrary, when analyzing QCT images, an elliptical ROI is placed within the axial vertebral plane in the trabecular region of each vertebral body, to exclude any cortical and sub-cortical bone: this allows QCT to provide a direct measure of the trabecular vBMD of the vertebral body only [
21]. This can explain why in most of mismatching cases of our study where DXA-aBMD underestimated the disease, patients showed signs of advanced spondylarthrosis or degenerative scoliosis at the lumbar spine, which generated a fictitious increase in aBMD values. In general, this is also confirmed by the results from the Bland–Altman analysis, which highlight the systematic overestimation by QCT, reinforcing the need for caution when comparing bone density measurements obtained with different imaging modalities. The presence of a proportional bias suggests that the discrepancy between methods increases at higher bone density values, which may have implications for clinical decision-making and fracture risk assessment.
Similar results were already reported by a 2019 study from Paggiosi et al., where the authors found significant differences in lumbar spine measurement variables between fractured and non-fractured groups. In particular, QCT-derived vBMD values were significantly lower in all groups compared to DXA-aBMD. It was also shown that vBMD was the only parameter that could discriminate between postmenopausal women with low aBMD values associated with fragility fractures from those with isolated low aBMD values [
21].
More recently, a study by Lin et al. showed that the diagnostic discordance of DXA and QCT was 34.5%, which is lower compared to our findings (60% of DXA-QCT mismatching) [
14]. This may be attributed to the slightly younger age of their patients compared to ours, resulting in a lower impact of degenerative changes that can overestimate BMD. Similarly to our study, one strength is that both are focused on a direct comparison of level-specific BMD measurements in patients who underwent both DXA and QCT. Still, no information about TBS is provided by Lin et colleagues.
To understand why vBMD from QCT demonstrates a better ability to discriminate participants with vertebral fractures compared to other variables (aBMD and TBS), it is essential to examine both the underlying fracture mechanisms but also the distinct imaging techniques used to study the lumbar spine. Studies have shown that adult lumbar vertebrae are primarily composed of trabecular bone [
22], and vertebral fractures are a consequence of a poor trabecular microarchitecture due to progressive loss of trabecular bone caused by the thinning or disruption of some bony trabeculae [
23]. Different imaging techniques may catch different aspects of bone properties when they are also performed at the same skeletal site. For example, DXA of the lumbar spine provides only 2D quantitative measurements of bone, without offering any qualitative 3D information about trabecular bone structure [
21]. At the same time, TBS from lumbar spine DXA is able to provide only an “indirect” measurement of bone trabecular microstructure [
9]. Lumbar QCT, on the contrary, provides specific 3D data of lumbar vertebrae, allowing a direct assessment of trabecular bone. This could partly explain why this parameter is able to better distinguish between women who have vertebral fractures and those who do not [
12,
13].
Evaluation of diagnostic performance in the prediction of fragility fractures showed that the AUC values of aBMD were not only lower than vBMD, but also than TBS. This may be partly attributable to the fact it has been reported that TBS values are less affected by spondylarthrosis compared to aBMD [
15]. In fact, a study by Kolta et al. conducted on 1254 postmenopausal women showed that lumbar osteoarthritis led to an increase in lumbar spine BMD, while TBS was not affected by lumbar osteoarthritis, with no significant difference in TBS values between patients with and without lumbar osteoarthritis [
15,
24]. The systematic bias resulting from the Bland–Altman analysis between DXA aBMD and DXA TBS is in line with this, confirming that BMD values consistently higher than TBS may be attributable to osteoarthritis. The relatively wide limits of agreement between aBMD and TBS suggest that while these two indices are related, the considerable variability between these two parameters confirms the evidence that TBS provides complementary information to BMD, particularly in assessing bone quality beyond density alone [
9,
25,
26].
Our study has some limitations, the main being the retrospective design and the small number of participants. Another limitation is the absence of an ad hoc analysis of subgroups of patients according to age, gender, and vertebral fractures, as well as between patients with and without spondylarthrosis, which could provide more granular insights into the variability of the measurements. Future studies with larger sample sizes should explore these stratifications to better understand their potential impact on the observed findings.
5. Conclusions
In conclusion, our findings demonstrate that QCT with asynchronous calibration can provide vBMD values comparable to those obtained through DXA in osteoporotic patients, thereby enabling opportunistic screening for osteoporosis. Furthermore, QCT demonstrated the ability to diagnose osteoporosis even in individuals with severe vertebral degenerative changes, where DXA performance is limited by such artifacts. We also demonstrated that vBMD effectively distinguishes between individuals with and without fragility fractures by providing a 3D measurement that excludes the posterior vertebral elements and accounts for bone size. TBS performed better than aBMD but did not reach the diagnostic accuracy of vBMD.
The findings of this study confirm the potential advantages of QCT over DXA in assessing bone mineral density with greater accuracy. However, its translation into routine clinical practice may not be easy. While vBMD from QCT may offer a more precise volumetric measurement, its widespread implementation remains limited by factors such as accessibility, cost, and radiation exposure [
12]. The use of QCT should be oriented to specific clinical scenarios where QCT could provide the greatest benefit, such as in patients with obesity, degenerative changes, or discordant DXA results, to refine its role in clinical guidelines and decision-making processes. The incorporation of TBS values may partially compensate for the limitations of DXA aBMD, particularly in subjects with degenerative changes, to refine osteoporosis risk stratification without the need for additional imaging modalities like QCT.


 ,
, 

