1. Introduction
In recent years, virtual reality (VR) technologies have emerged as relevant tools for perceptual-motor training in sports [
1,
2,
3,
4]. Indeed, the use of virtual environments (VEs) allows for complete control over the training condition, which is not possible in the real-world environment (RWE). In addition, VEs offer the possibility of implementing training principles that are relevant for learning but rather hard to apply on the field [
5]. These principles include, for example, manipulating task constraints [
6], providing task-relevant feedback [
7], and shaping individualized adaptive training programs [
8].
Recently, a 4 × 100 m athletics relay simulator including VE technologies was created with a view to the 2024 Olympic Games, specifically to train athletes’ anticipation skills, i.e., the ability of athletes to initiate their runs at the right time to minimize speed loss during baton transmission [
9]. In relays, the first runner carries a relay baton that has to be passed to the next athlete in a 30 m passing zone. The goal of the receiving runner is to optimize their start in order to catch the baton at maximum speed in the passing zone. To achieve this, the receiving athlete has a simple task, which is to initiate their run when the incoming partner passes over a reference go-mark on the ground. This transmission phase can be difficult to train on the track for several reasons. First, the repetition of the task for receiver athletes is necessarily associated with the sprints of other athletes, and repetitions of many runs at maximum speed is physiologically impossible for them to carry out and could lead to injuries. Secondly, there is no integrated measurement system on the field that allows athletes to precisely measure their performance and/or product behavior. And finally, training on a track does not allow for precise control over training conditions. The simulator was therefore created in collaboration with the French Athletics Federation in order to overcome these limitations and be able to implement the learning principles identified previously [
5]. It was specially designed with the two main objectives of realistically recreating the informational context of the task while allowing the athlete to behave as if they were on the track. From our point of view, the preservation of functional relationships between perception and action is fundamental in order to optimize the anticipation capacities of high-level athletes [
10,
11,
12]. This simulator has already been used as a tool to characterize the anticipation skills of athletes of the French national team [
13], and high acceptance scores were recorded before and after using the simulator [
14]. However, although this simulator is both well accepted and offers the possibility of characterizing the behavior of athletes, it is necessary to assess its efficacy as a training tool before incorporating it into athletes’ training routines as part of the next Olympiad.
In VR training, the first criterion of efficacy concerns the transfer of improvements acquired through the VE into the real world [
15]. According to the review by Michalski et al. [
3], despite the growing number of sports training simulators which integrate VR technologies, only four of them have demonstrated a real-world transfer—in darts [
16], table tennis [
17], juggling [
6], and baseball batting [
8]. However, many others have already used VE in sports training without any assurance as to their efficacy, thereby running the risk of wasting valuable training time and, in the worst-case scenario, even reducing the athlete’s performance. The lack of transferable training protocols in VE is probably linked to the absence of precautions taken in most studies to ensure the validity and fidelity of simulators before using them to train athletes, which represent the secondary criterion for VE evaluation and is a good predictor of transferability [
15]. Although the long-term goal underlying relay simulator development is to demonstrate the transferability of virtual training, it seems necessary to first measure the simulator’s validity and fidelity. This is precisely the objective pursued in this study.
Harris et al. proposed a complete framework to assess the validity and fidelity of training VEs [
18]. These principles are subdivided into subtypes that are defined and discussed according to their importance for the transfer of training. According to this framework, the assessment of the validity and fidelity of a VE must be task-specific and exhaustive, considering various aspects of the behavior. Applying this to our simulator means answering the following two questions: does the relay simulator enable athletes to maintain their perceptual-motor behavior in comparison with a real relay initiation (physical fidelity, biomechanical fidelity, and psychological fidelity)? And can the relay simulator precisely track the virtual performance with consistency with the real-life performance or, in other words, are the performance measurements obtained in VR reliable and comparable to those made in reality (construct validity)? Consequently, we aimed to assess the validity of the simulator with several complementary variables. Each of them was chosen in light of Harris et al.’s framework recommendations [
18] and the results of Chomienne et al. relating to the characterization of perceptual-motor behavior produced by athletes in the relay task [
13].
The relay initiation task is an overall movement that can be broken down into three key events that occur in a specific order [
13]. First, as the partner approaches, the athlete begins their motor routine by lowering their center of mass in a back-and-forth movement. This first event, called the wave, is followed by gaze release, i.e., the moment when the athlete stops taking visual information from their partner’s approach and turns their head in the direction of the run. Finally, gaze release is immediately followed by the rear foot lift, which is considered by the coach to be the initiation of the run. By extension, the anticipation performance corresponds to the difference in time between the passage of the approaching athlete over the mark (more precisely, the passage of the pelvis vertically above the mark) and the foot lift action performed by the receiving athlete. These key events are specific markers of the motor behavior during a relay initiation and are inherent to each individual. They constitute a perceptual-motor signature of the behavior performed and are totally linked from the very beginning of the movement to the foot lift action. In addition, the relative timing of the occurrence of each event is also an indicator of the underlying control process. It has been shown that high-level relay athletes are able to adjust the timing of the occurrence of these three events in order to initiate their run at the right time. Over trials, for a specific athlete, the wave initiation is very variable over time, while the foot lift action is relatively stable and more precise. From a behavioral perspective, this variability reduction reflects athletes’ ability to use the information related to the temporal proximity of the partner in order to adapt their movement online to optimize the final result. This control process has already been described in relay [
13] and in other sports [
19,
20].
Assuming that these specificities are representative of relay initiation, the assessment of validity and fidelity is mainly based on a comparison of athletes’ behaviors at the group and athlete levels in two conditions: VE and RWE (construct validity). From a biomechanical point of view, we compared the timing of occurrence for each key event between VE and RWE conditions (biomechanical fidelity). This measure also enables us to assess whether the variability pattern is maintained in the VE, i.e., whether the control process involved is similar (psychological fidelity). The timing error produced was also compared in the two conditions (i.e., VE and RWE). These task-specific measures were supplemented by two complementary questionnaires as in Harris et al.’s method [
21]. Participants reported their feeling of presence to ensure that the VE was sufficiently immersive (physical fidelity) [
22] and the perceptual-cognitive demands of the VE were measured and compared with the RWE though a self-report measure of task load called the Simulation Task Load Index (SIM-TLX; psychological fidelity) [
23].
To summarize, the aim of this study was to assess the validity and fidelity of a relay simulator in the most exhaustive way. From a validity perspective, it was hypothesized that the simulator would be an accurate measurement tool of athletes’ behavior, making it possible to reflect real-life performance consistently, i.e., a simulator that is able to reliably differentiate different levels of expertise. From a fidelity perspective, it was expected that perceptual-motor behavior in the VE would be similar to that in the RWE, i.e., that the VE is sufficiently realistic to allow the user to behave as in the RWE.
2. Materials and Methods
This section outlines the methodology employed in this study. First, the participant recruitment process is detailed, with the inclusion criteria and selection procedures specified. Then, the materials and experimental environments are described, providing an overview of the equipment used. The measures and data processing methods are then introduced, explaining the variables recorded and their treatment. The experimental procedure is subsequently presented, detailing the sequence of events during the study. Finally, the statistical analyses applied to the collected data are described.
2.1. Participants
Twelve athletes (mean age = 21.17 ± 4.04 years; eight males and four females), practicing relay at the national level, participated in the experiment. This sample size is supported by an a posteriori power analysis that predicts, for an effect size (f = 0.3), a type I error (α = 0.5) and a power of 1–β = 0.7, a sample of n = 12 participants. All were recruited from the athletics club of Société Culturelle Omnisport (SCO) of Marseille and every participant competed at least once in a 4 × 100 m relay meeting at the national level. None of them had previous experience with the VE. They all had normal or corrected-to-normal vision and reported no injuries. All participants gave written informed consent. The study was conducted in line with the ethical guidelines of the national ethics committee (CERSTAPS no. IRB00012476-2024-23-04-311) as well as in compliance with the Declaration of Helsinki for human research and the international principles governing research on humans.
2.2. Material
The VE was a reproduction of the athletics track of the Stade de France (
Figure 1A). It was developed using the gaming engine Unity (version: 3.2.0) and projected via a wireless HMD device (model: HTC Vive Focus 3; field of view: 120°; resolution: 2448 × 2448 pixels per eye; refresh rate: 90 Hz; HTC Inc., Taoyuan City, Taiwan) and a laptop with a 2.2 GHz Intel Core i9 processor and NVIDIA RTX A4500 graphics card. HTC Vive trackers (<1 mm spatial resolution, 90 Hz temporal resolution) were placed on the feet and on the head to record their position and analyze participants’ motor behavior. Trackers placed on the feet also enabled virtual feet to be generated in the environment. Three lighthouse lasers were used to detect the position and orientation of the HMD and of the trackers. This virtual environment was developed for use in training by the French relay team. It is not intended for personal use.
During the experiment, the virtual task was performed in a closed room with enough space for the participants to run 15 m. When immersed in the VE, participants were standing in the starting position on the fourth lane of the virtual track, as the third runner of the team. They were waiting for the approach of their virtual partner positioned behind them, as the second runner of the team. Realistic avatars were created via motion captures collected on male and female U20 athletes of the French national team using a marker-less system (Xsens MVN; Xsens Technologies B.V., Enschede, NL, The Netherlands). These avatars were fully customizable in terms of starting distance and approach speed from trial to trial. The distance between the go-mark and the participant can also be parametrized. At the onset of each trial, the avatar started running at a constant speed, and participants were instructed to initiate their run when the avatar passed over the go-mark placed in the running lane. After the first two strides of their run, participants had to decelerate and stop and could then return to their starting line to wait for a new trial. At the end of each trial, feedback depicting the timing error in milliseconds (ms) could be delivered in the VE (time between the avatar’s passage over the mark and the running initiation of the participant objectified by the lift of the rear foot).
The real-world environment (RWE) was the athletics track at the Pierre Delort stadium (Marseille). In this condition, the virtual avatar and go-mark were replaced by real ones. During the tests in the RWE, the athletes were equipped in the same way as during the tests in the VE. HTC Vive trackers were placed on the feet and head, and three lighthouse lasers detected their positions. However, the HMD was placed on the floor next to the participant instead of on their heads. At the start of each RWE trial, a VE trial was run simultaneously to ensure data recording. A photocell integrated into the data acquisition system was placed at the go-mark level and used as a reference for calculating the timing error. The virtual condition and real condition setups functioned simultaneously in order to carry out acquisitions simultaneously in both conditions.
2.3. Measures and Data Processing
This section presents the various measurements employed in the study. The first two subsections introduce the Presence Questionnaire and the Simulation Task Load Index (SIM-TLX), both completed by participants to assess their subjective experience. The final subsection focuses on the identification of key behavioral events during running initiation, which are representative of task performance. The relevance and specific use of these events in the analysis are also detailed.
2.3.1. Presence Questionnaire
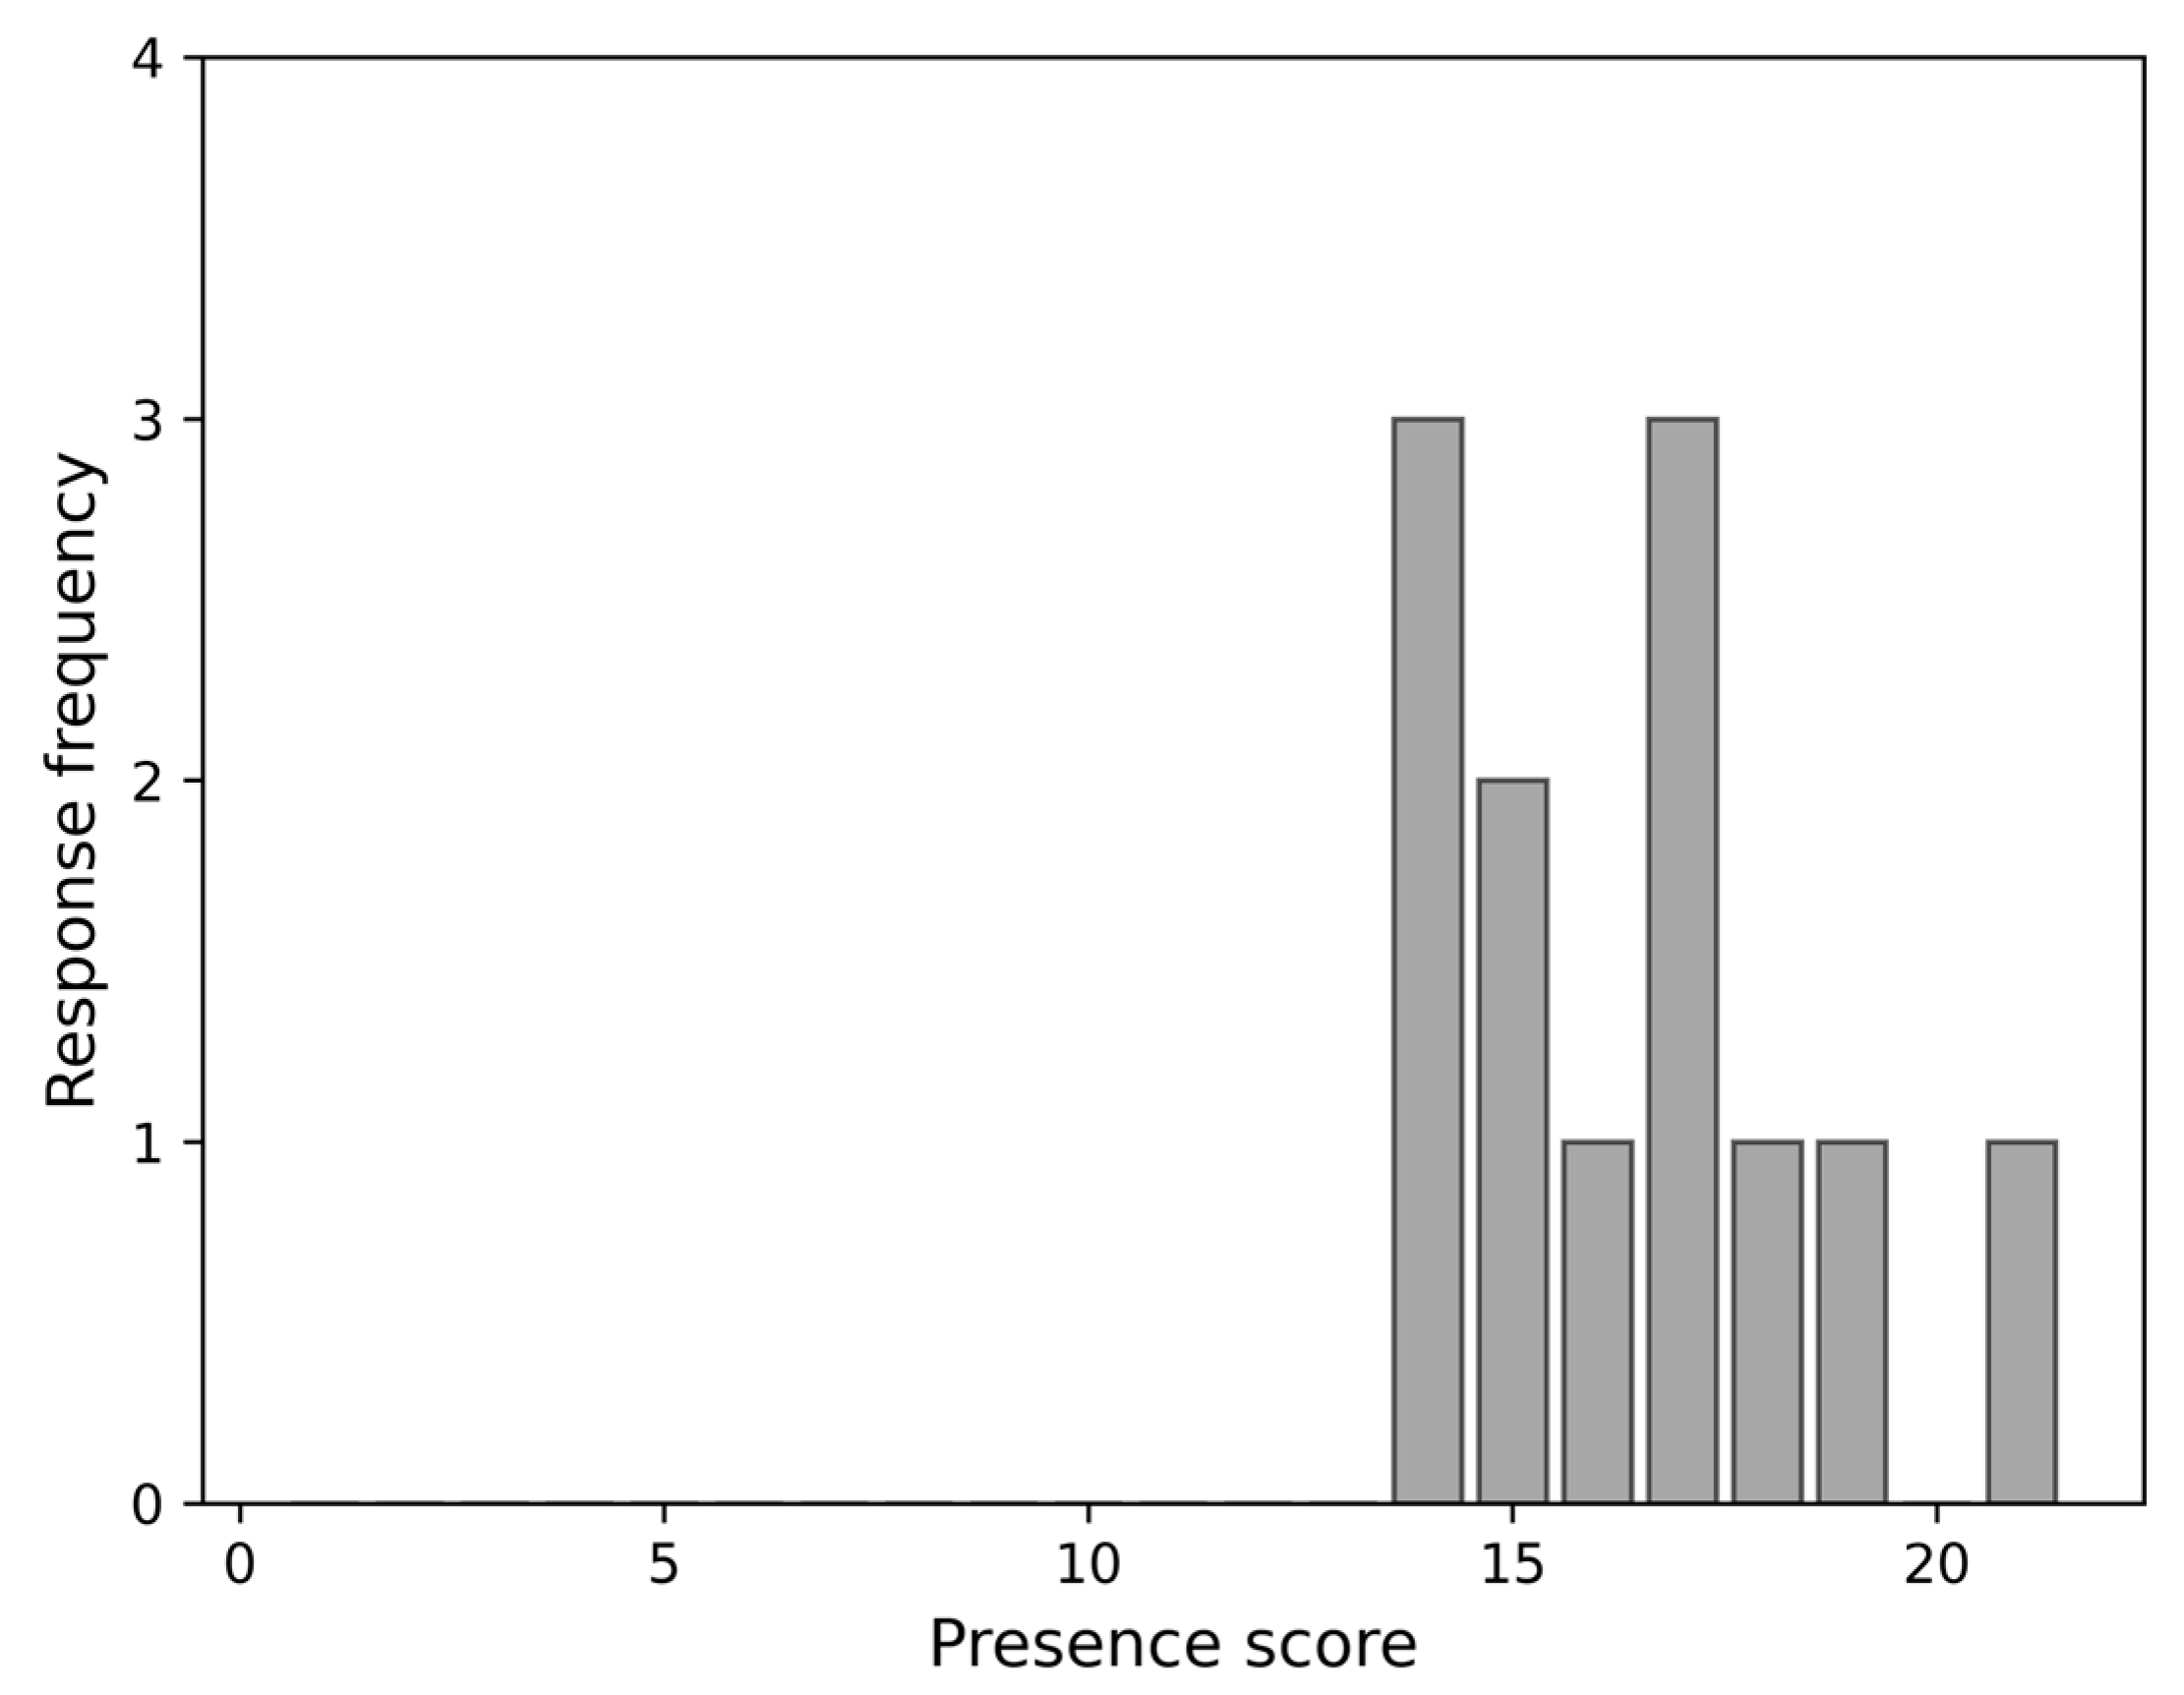
After executing all trials in the VE condition, participants were asked to rate their sense of presence by answering three questions from the Presence Questionnaire [
22]. These questions relate, respectively, to the sense of “being there” in the VE, the extent to which the virtual world seemed more like the presenting reality than the real world, and the sense of visiting somewhere rather than seeing images of something. Responses were given on seven-point Likert scales, and results of the three questions were summed to obtain a final presence score by participant.
2.3.2. Simulation Task Load Index (SIM-TLX)
The SIM-TLX [
23] is a questionnaire inspired by the NASA-TLX [
24], assessing the workload during tasks executed in VEs. After completing all trials in one of the two conditions (VE or RWE), participants were asked to rate the level of demand they had experienced on nine subscales, reflecting, respectively, different workload dimensions: mental demands; physical demands; temporal demands; frustration; task complexity; situational stress; distractions; perceptual strain; and task control. Responses were given on a twenty-one-point Likert scale anchored between “very low” and “very high”. The workload score was then averaged between participants for each dimension and then compared between the two conditions.
2.3.3. Running Initiation Key Events of Interest/Initiation Timing Error
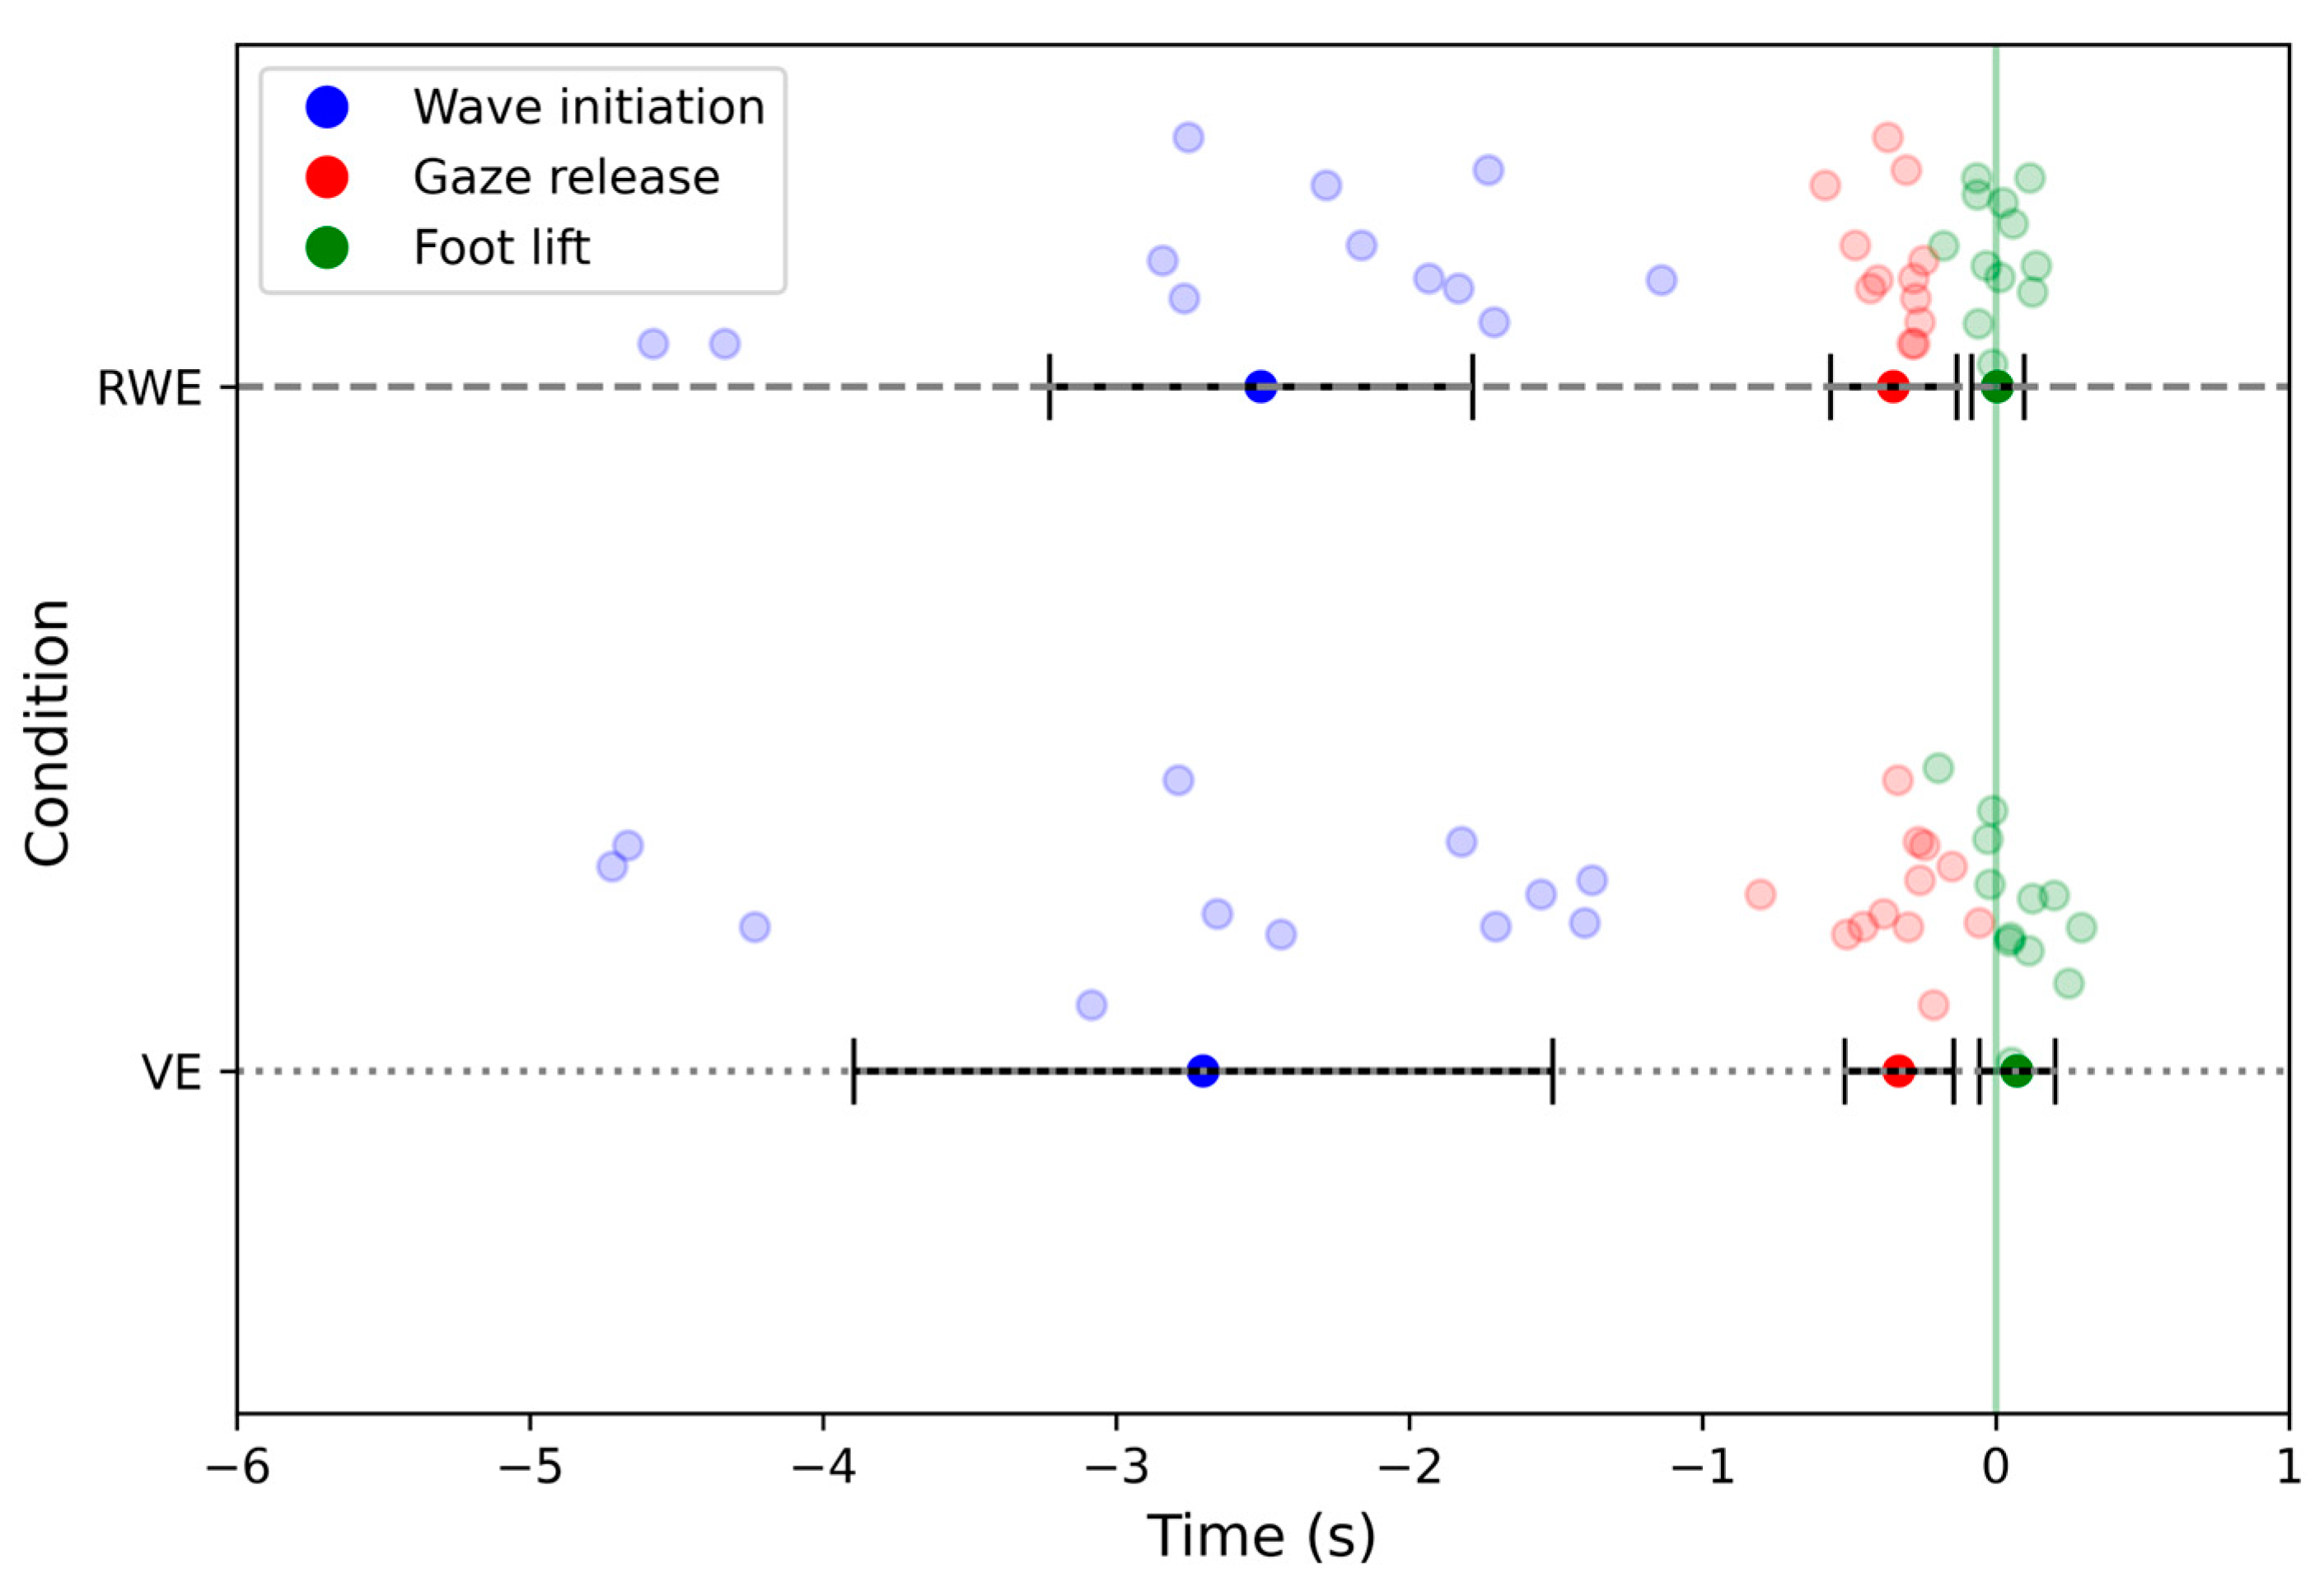
In both VE and RWE conditions, and following Chomienne et al.’s method [
13], three key events were identified and measured regarding the running initiation task: wave initiation, gaze release, and foot lift (
Figure 1B). Wave initiation corresponds to the moment when the participant begins to lower their head as their partner approaches. It corresponds to the beginning of the preparatory movement that precedes the initiation of the run. Gaze release is much closer to the race initiation and corresponds to the moment when the athlete’s head turns away to face the athletics track. Gaze release is also associated with the last moment athletes can receive visual information about their partner. Finally, the foot lift action is the main marker of performance. It corresponds to the moment when the participant lifts their rear foot (right foot during the experiment). This event is considered as the initiation of the run. The timing of each event was computed for each participant as the difference in milliseconds between the time of occurrence of each event in reference to the time of the partner’s passage on the mark. The passage of the partner corresponds to the value of 0. Events preceding the partner’s passage have a negative sign, and those following it have a positive sign.
Detections of the three events were then expressed in ms relative to the avatar’s passage over the mark. The detection method is detailed in Chomienne et al.’s article [
13]. The 8 trials were averaged per participant for each event and for each condition. Between-participant and within-participant variability were also measured. Between-participant variability corresponds to the standard deviation between the means of each participant for each event. Within-participant variability corresponds to the mean of intra-participant standard deviations for each event and participant. The data analysis was first carried out at the group scale (paired comparison of the 12 participants) in order to identify the general behavioral tendency. Secondly, the data analysis was performed at the participant scale (paired comparison for each participant) to precisely assess the impact of the VE on the behavior of each athlete.
2.4. Procedure
The participants were required to attend the stadium in groups of four for a single event, which lasted approximately 2 h. All participants warmed up for 20 min under the guidance of their coach. Athletes were then divided into two pairs: the experimental pair and the partner pair. Each member of the experimental pair was then randomly assigned to one of the two conditions. While the first participant underwent the VE condition, the second underwent the RWE condition. In the VE condition, participants were initially asked to perform 10 familiarization trials without feedback in order to become familiarized with the VE. This familiarization period was followed by an acquisition block of 8 trials. In both familiarization and acquisition block, the partner’s avatar and the go-mark were, respectively, 38 m and 8 m behind the participant. The partner’s speeds varied randomly between 9 and 11 m/s between trials. This range was calculated using the respective speeds of each athlete of the cohort measured a priori by their coach. The speed randomization did not vary between participants. In the RWE condition, participants performed 8 trials without familiarization. As in the VE condition, the partner was 38 m behind the participant, and the go-mark was 8 m behind. Sprints in the RWE condition were performed by the partner pair. The partner athletes performed the sprints alternately, with 3 min of recovery time between 2 consecutive sprints. When participants of the experimental pair had completed all their trials, they switched their conditions (i.e., the participant who was tested in the VE condition moved to the RWE condition, and vice versa). Athletes of the partner pair continued to sprint for the second participant. Once the two participants of the experimental pair had completed both conditions, they became the partner pair, and vice versa. In total, each participant completed 26 trials (10 familiarization, 2 × 8 acquisition) and 8 sprints. After completing the VE trials, participants had to complete presence and SIM-TLX questionnaires. They also had to complete the SIM-TLX after completing the RWE trials.
2.5. Statistical Analysis
Statistical analysis was performed using JASP (Version 0.18.3) and R (Version 4.4.1). Presence questionnaire scores were compared with the mid-way point of the scale using a one sample t-test. SIM-TLX scores of each dimension were compared via a paired t-test between conditions. Questionnaire scores were initially checked for normality.
Two ANOVAs were performed on key event data. The first one was a 2 (conditions: VE and RWE) × 3 (events: wave initiation, gaze release, and foot lift) repeated measures ANOVA at the group scale to compare the participants’ behavior averaged over the 12 participants. The second one was a 2 (conditions: VE and RWE) × 3 (events: wave initiation, gaze release, and foot lift) × 12 (participant) mixed ANOVA at the participant scale, with condition and event as repeated measures and participant as a fixed factor. This test enabled us to compare the behavior of participants depending on the conditions while considering inter-individual differences. It also made it possible to evaluate the behavioral similarity between VE and RWE at the participant level. Homogeneity of variance and sphericity were checked, and Grennhouse–Geissner sphericity correction was applied when necessary. Follow-up t-tests with Bonferroni correction were used for intra-participant post hoc analyses in order to determine for which participants behavioral differences were significant. Effect sizes were calculated for every test using Cohen’s d and partial eta squared.
4. Discussion
Given the current growth of interest in the use of VR technologies for perceptual-motor training in sport, there is an urge to take a number of methodological precautions with regard to their effectiveness before using them to characterize and/or optimize the underlying (perceptual-motor) processes. In this regard, the notions of validity and fidelity are emerging in the literature as relevant predictive criteria. Consequently, the aim of this study was to assess the validity and fidelity of a relay simulator in the most exhaustive way.
The overall results suggest that the simulator is, on the one hand, an accurate tool for the measurement of athletes’ behavior (validity) and, on the other hand, allows athletes to behave in the virtual task as if they were on the real track (fidelity). This assertion is based on several complementary measures carried out in this study and discussed below. First, the results concerning the sense of presence and the comparison of workload are discussed. The results concerning the perceptual-motor behavior of the athletes at different scales are then analyzed.
Every participant reported a high level of presence in the environment. In comparison with previous uses of this scale in the literature, these results suggest that the virtual task is immersive and that the physical fidelity is sufficient (16.4 ± 2.1 in this study; 12.7 ± 4.5 in Harris’s study [
21]). A high level of presence could lead to user engagement, which is a benefit to training efficacy. However, while a high sense of presence is desirable for the take-up of the technology, it is not necessarily a good predictor of training efficacy. High physical fidelity is often associated with high graphical realism, which is not necessarily linked to the key perceptual features of the task [
25]. This emphasizes the need to conduct an exhaustive fidelity assessment with complementary measures. Next, the perceptual-cognitive demands of the VE were compared with those of the RWE using self-report scales of task load in each condition. Among the nine workload dimensions measured using the SIM-TLX, only the “mental demands” differed significantly between conditions: the measures of mental demands were significantly higher in the VE. This result is consistent with those obtained by Lackey et al. [
26], which show that good immersion in a VR task was positively correlated with additional mental demands. Another possibility concerning this result could be related to environmental conditions during VE trials: the VE running initiations were conducted in a closed room, and participants could potentially experience higher mental demands when running toward a wall. This result can also be discussed in the context of the Cognitive Load Theory. Studies in the literature on Cognitive Load Theory consider three different types of load [
27,
28]: the intrinsic load of the learner, which is inherent in the complexity of the task; the extraneous load, which is linked to the way the task is presented; and the germane load, which is directly associated with the learning process. The absolute cognitive load is considered as the sum of the three types of load. So, if this theory is applied to this study, the difference in mental demand between the two conditions could be explained by a difference in one of the three load types. However, the context of the task differs greatly between the two conditions. In the RWE, the athletes are on their usual training track, whereas in the VE, they are immersed in the Stade de France on the Olympic Games track. This difference can typically induce an additional extraneous load that influences the global cognitive load score. It would be interesting to assess in future studies whether this cognitive load increase affects performance using the dual-task paradigm. However, since eight of the nine dimensions do not differ significantly, the global SIM-TLX assessment mostly supports the idea that the workload of the virtual task does not differ significantly from the real one, which supports the psychological fidelity of the simulator.
Athletes’ perceptual-motor behavior has also been compared between the VE and RWE conditions by measuring the timing of the three key events for each trial (wave initiation, gaze release, and foot lift). The aim of this comparison was to determine whether the simulator is an accurate tool for measuring athletes’ perceptual-motor behavior (construct validity) and whether it allows participants to behave in a similar way in the virtual task as they would on the field (biomechanical fidelity and psychological fidelity). The group-scale comparison between virtual and real behaviors revealed no significant differences between the time of occurrence of the three events, supporting the idea that the chronology of events is comparable in the two conditions. In accordance with the results of Chomienne et al. [
13], the wave initiation occurs first, followed, respectively, by gaze release and foot lift. The wave initiation timing differs significantly from the other events independently of the condition. Gaze release and foot lift timings do not differ significantly and are very close to each other, but still the specific order described above is maintained. Another interesting result concerns the between-participant variability of each event. The timing of wave initiation varied widely between athletes, reflecting the diversity of strategies employed. This between-participant variability decreases over time in both conditions to reach its minima at the foot lift moment, which is the event associated with anticipation performance. This variability pattern is also consistent with Chomienne et al.’s [
13] findings and shows that although different strategies are employed, they all have a common goal of initiating the run at the optimum moment. The present study also reports that the VR device used appears to preserve these different strategies. The overall group-scale analysis shows that the athletes behave similarly in both conditions (VE and RWE). The timing of the key events does not differ, so it can be assumed that the virtual task does not constrain the movement and allows for consistent perceptual-motor behavior. These interpretations are supported by the same decrease over time of inter-participant variability in the two conditions, showing that different perceptual-motor strategies were employed by the athletes. Those strategies were efficient in the two conditions. With regard to assessing the fidelity of the simulator, these results largely support psychological and biomechanical fidelity.
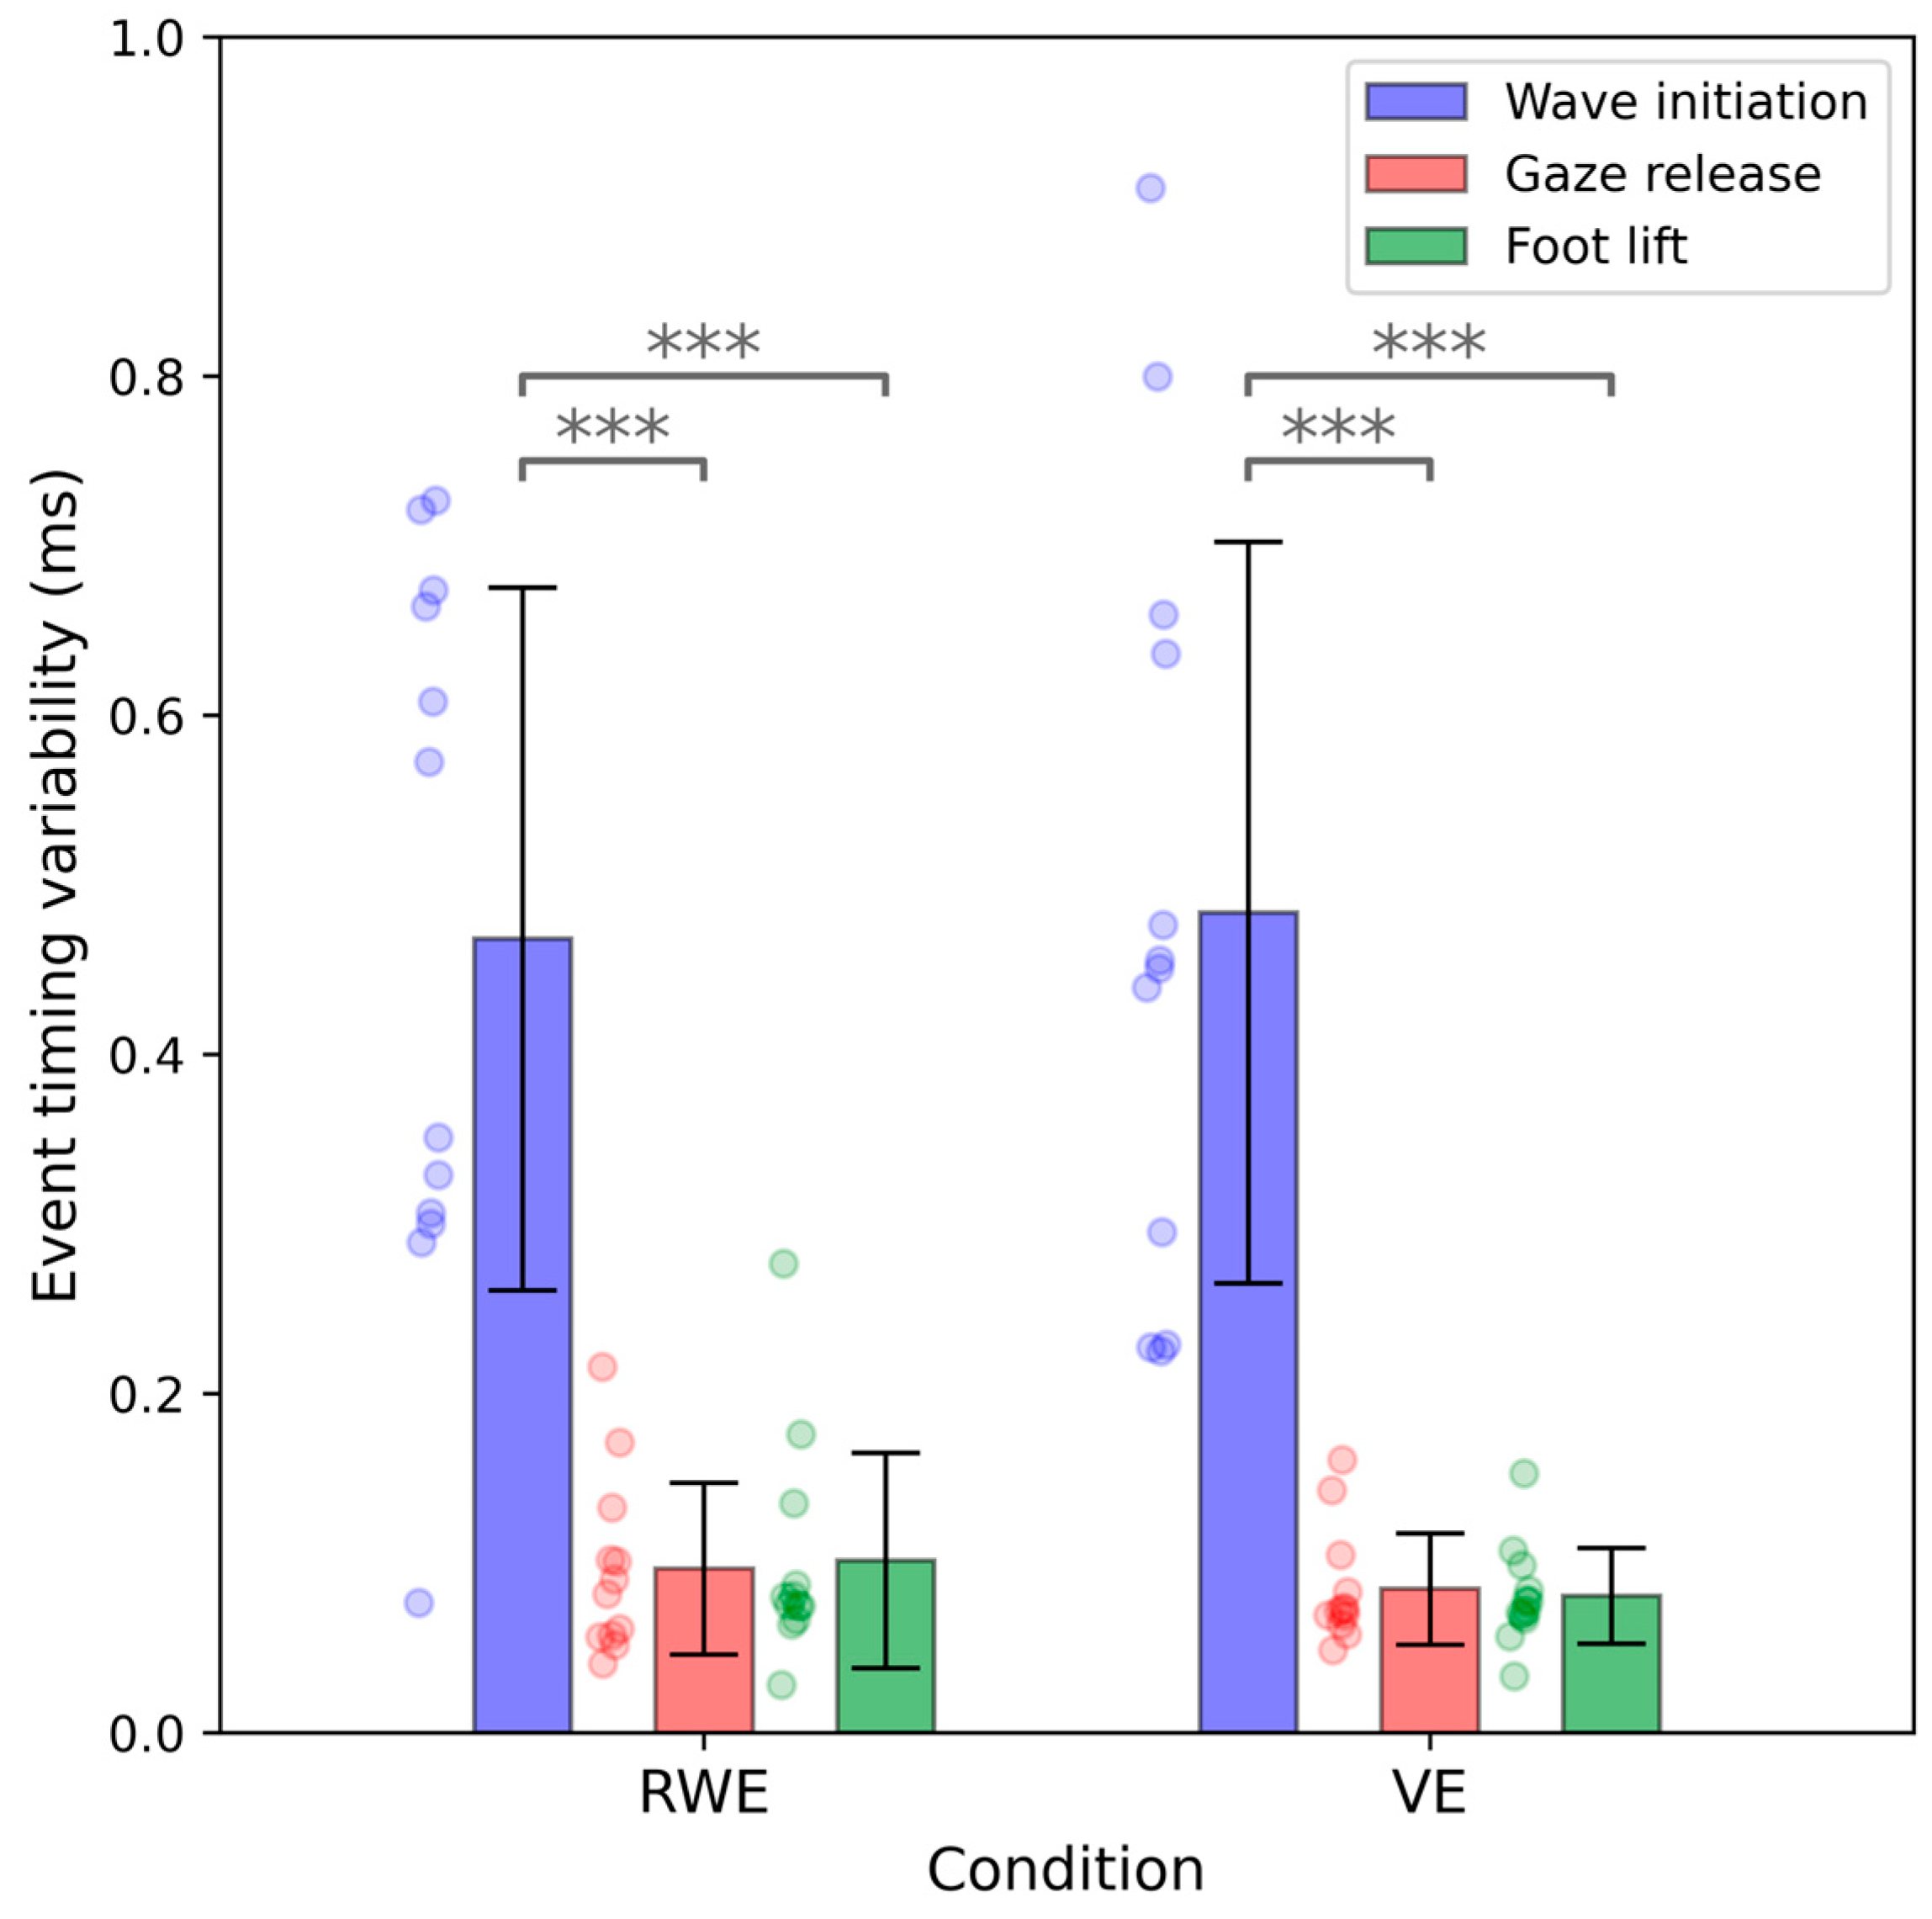
When looking at within-athlete variability (i.e., variability from trial to trial for a given athlete and a given event), the results revealed that, in the same way as the between-athlete variability, no significant difference was found between the two conditions, and event variability decreases over time. For both the VE and RWE conditions, the wave is significantly more variable than gaze release and foot lift. This means that participants initiate their waves at different moments over trials and adjust wave kinematics to reduce the variability of the last event (i.e., foot lift) to maximize performance. In both virtual and real tasks, athletes adjust their preparatory movements using the perceptual information of the approaching partner. Similar control strategies have already been described in other sports [
19,
20] and in relays [
13]. The fact that this control strategy is maintained during the virtual task reinforces the idea that the simulator consistently reproduces the perceptual-motor dialog of the real task, which largely supports the psychological fidelity of the simulator. Among the participants, only P1 seems to use another perceptual-motor control strategy without any reduction in variability over time. The variability of P1’s triggering is stable over time for all key events. This means that, in contrast to the other participants, the motor sequence is performed according to an open-loop control mode, i.e., without adjustment during motor execution. In this strategy, the final performance is conditioned by the initiation of the motor sequence, i.e., by the initiation of the wave. Although P1’s strategy is different from the others, it is the same in both the VE and RWE conditions, thus confirming the psychological validity of the simulator.
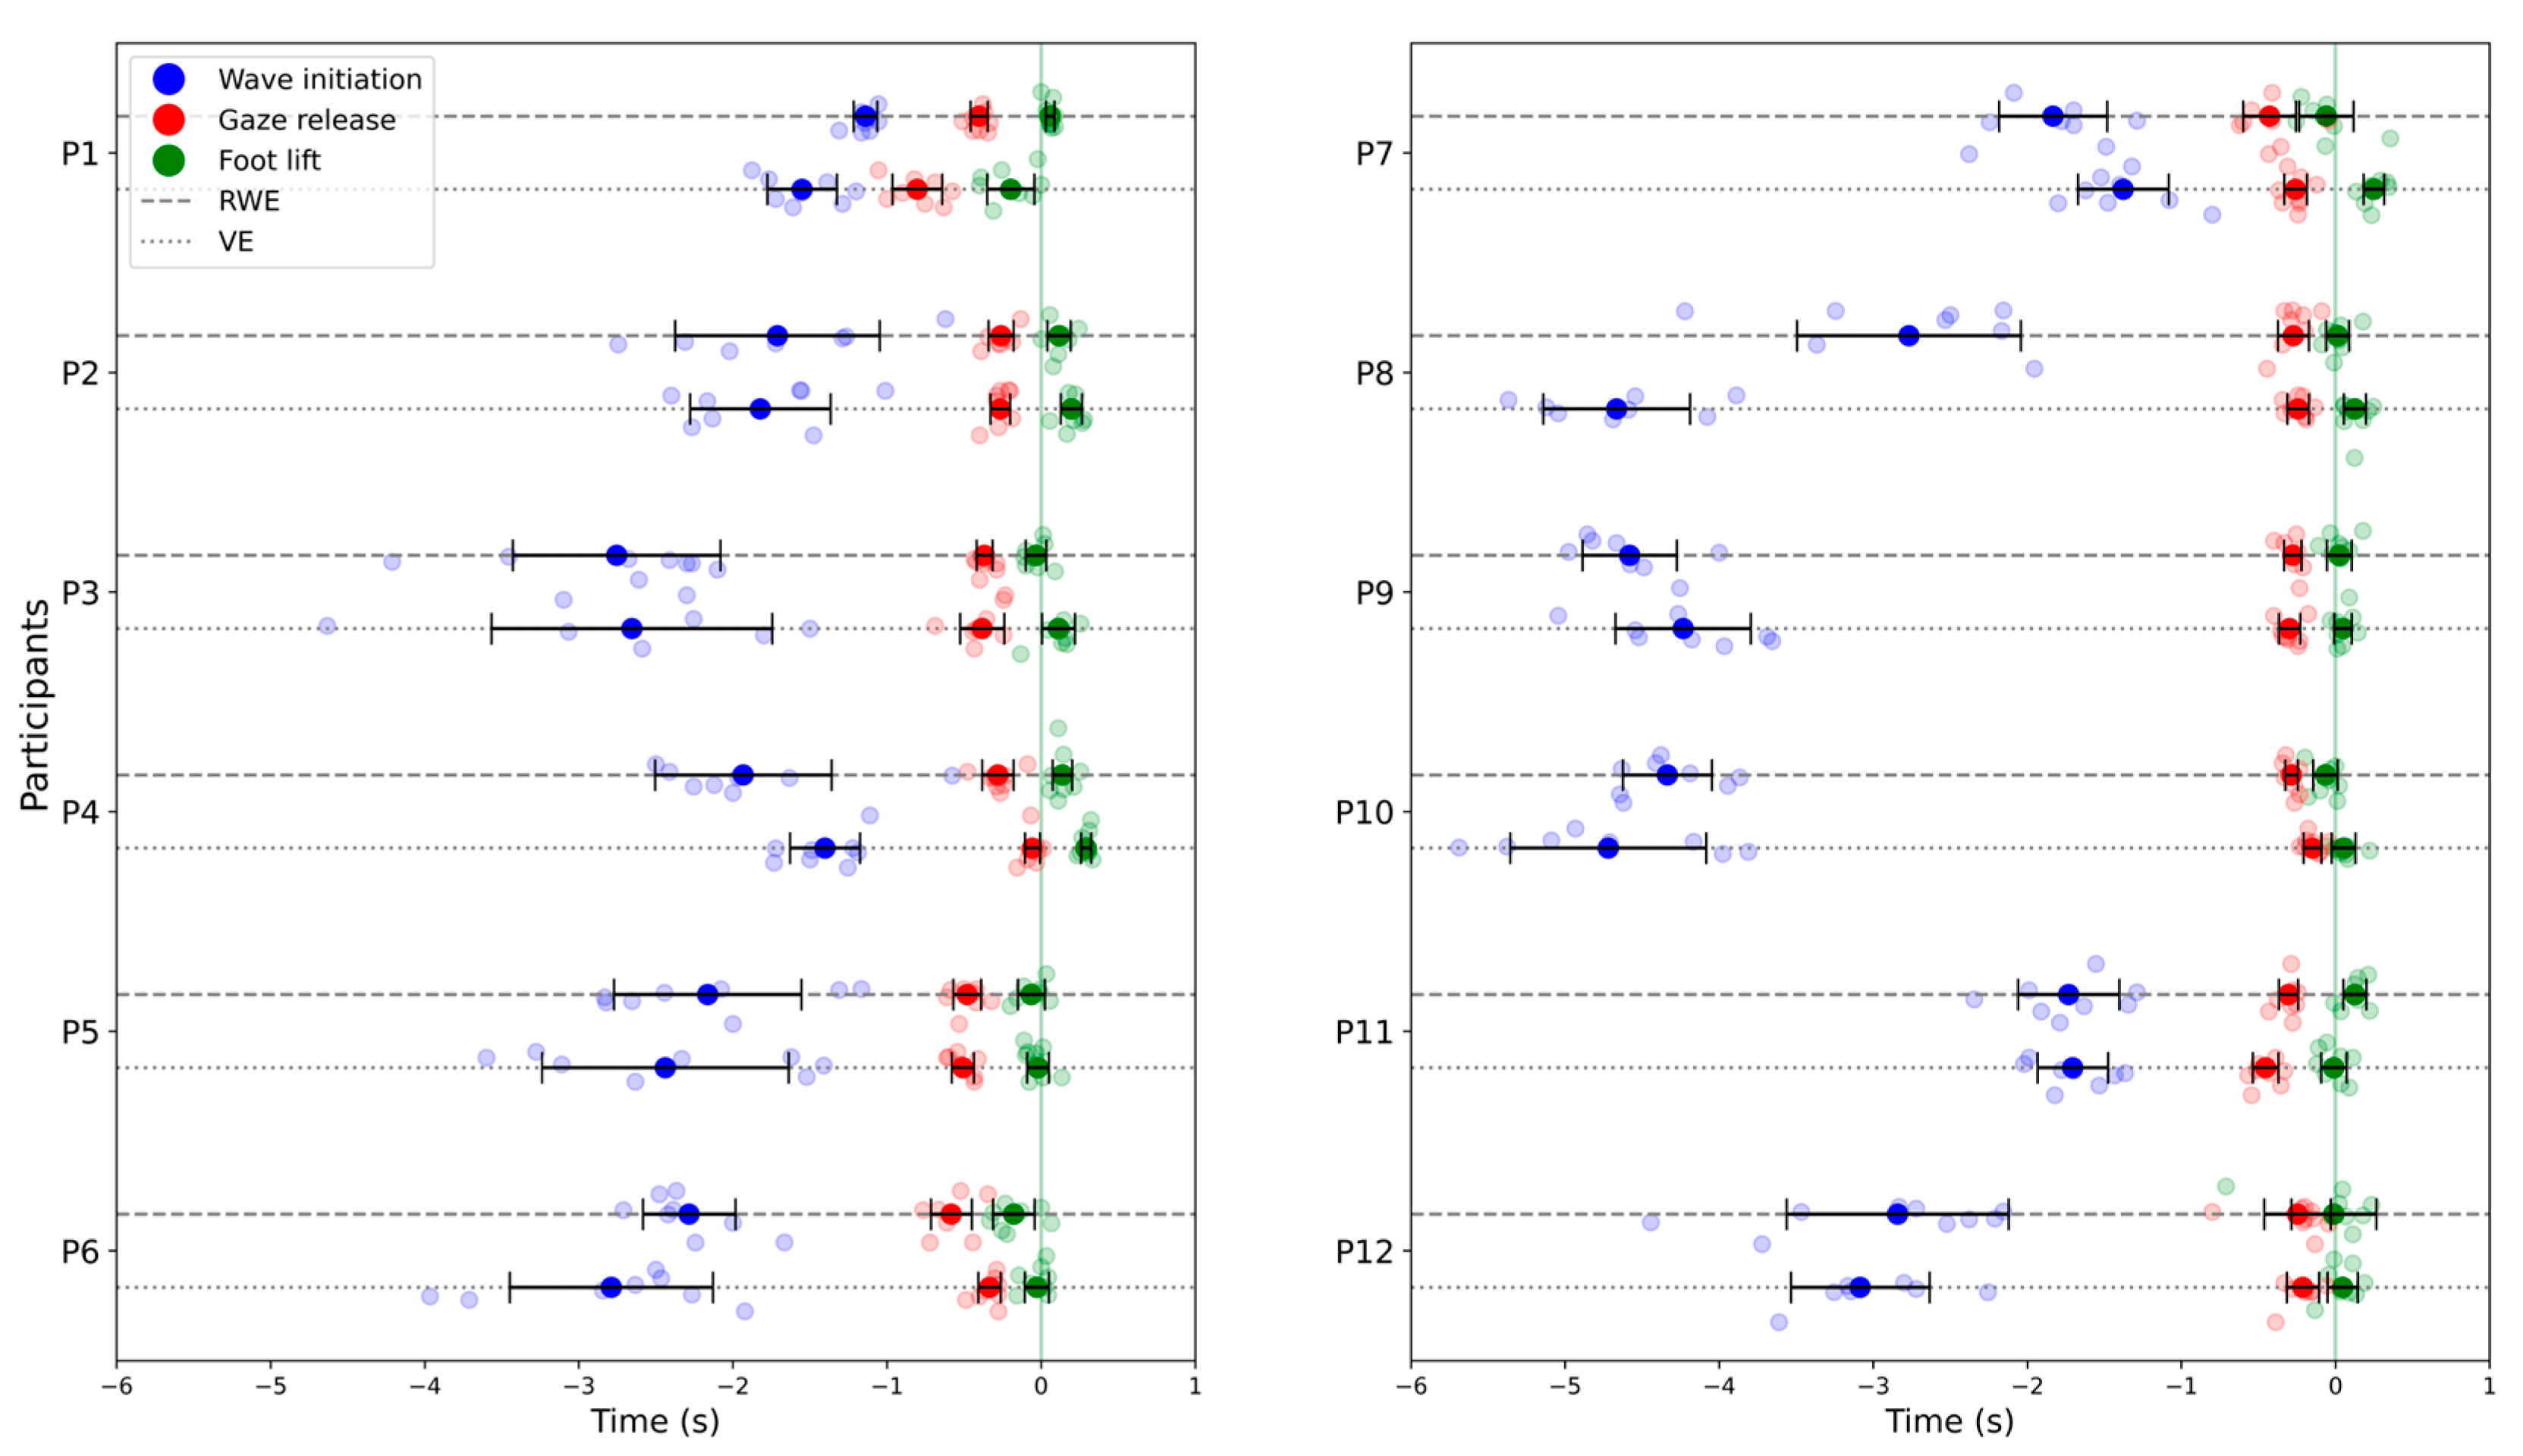
However, while a group-scale analysis provides an overview of the participants’ behavior, it is not sufficient to determine what is happening at the level of each athlete. A participant-scale analysis showed no significant differences in the chronology of key events between the two conditions (VE and RWE): the initiation of the wave occurs first, followed by gaze release and foot lift. Now, the precise chronology of the three events differed significantly between the participants, confirming the use of specific strategies. Zooming in on each athlete, the results reveal that the initiation behavior was strictly similar between conditions for 8 of 12 participants (no significant difference was found in the intra-participant post hoc comparisons for any of the key events). For three of the four remaining participants, only one of the three key events differed significantly (gaze release for P1 and P10 and wave initiation for P8). Two key events differed for P4 (gaze release and foot lift). The wave initiation difference in P8 is explained by a methodological limit. During acquisition in the RWE condition, P8 initiated their wave as soon as the sprinting partner began to move, i.e., before the experimenter started to collect data. Therefore, it is reasonable to assume that without this experimental problem, P8 could have completely maintained their behavior between the two conditions. This means that for all participants, behavior remains partly similar between the two conditions. The behavioral differences in the four participants could be explained by the short duration of the familiarization phase proposed in our experiment. In fact, the participants only had 10 trials to become familiarized with the simulator, and yet most of them maintained their behavior. It is reasonable to assume that by extending the familiarization period where necessary, all behaviors in both conditions would be comparable. These results are crucial with regard to assessing the ability of the simulator to precisely measure athletes’ behavior. Indeed, not only is the simulator able to measure that a user behaves identically, but it also differentiates between individuals by capturing their own initiation strategies. This strongly supports the construct validity while confirming the biomechanical and psychological fidelity of the simulator. Usually, a construct validity assessment of simulators is performed by comparing the behavior and performance of a novice vs. an expert on the simulator and measuring whether the performance difference obtained is consistent with reality [
18,
21,
29,
30,
31]. The relay initiation skill is a quite specific anticipation task, and “relay expertise” does not necessary reflect anticipation performance. A good relay athlete is generally a fast runner. The notion of anticipatory performance is secondary and is not considered in the assessment of expertise. Taking this fact into account, an alternative way to assess construct validity is to verify whether individual behavioral strategies and performance are maintained in the VE. That is what was carried out in this study. Maintaining performance revealed that the simulator enables the athlete to behave in a natural and spontaneous way (biomechanical fidelity), that the athlete uses the same perceptual information to control their movement (psychological fidelity), and, above all, proves that the simulator is able to correctly measure user behavior (construct validity).
In this study, the validity and fidelity of a VR relay simulator were tested in the most exhaustive way through numerous complementary measures. The evaluation showed that the simulator accurately reproduced the task constraints, allowing the athletes to behave as if they were on the track, while providing a reliable tool for measuring performance. Although the results largely support the validity and fidelity of the simulator, the sample size of this study remains rather small, and it will be interesting to compare the behaviors of a larger number of athletes. A larger-scale comparison could provide more confident results in terms of behavior preservation in the virtual task and also give the possibility of clustering individual athletes’ strategies. It would also be interesting to carry out a more in-depth comparison of motor behavior using other analyses such as Spatial Parametric Mapping (SPM) or using another kinematic measurement system independent of the simulator. Once this work has been completed, it will be necessary to continue the work initiated by Chomienne et al. by using the simulator as a tool for characterizing athletes’ performance [
13]. Furthermore, it is essential to point out that the validity and fidelity of the simulator are not sufficient to guarantee a potential transfer of learning to reality but are part of the methodological precautions that maximize the chances of obtaining it [
15]. This type of study aims to prove that VR is a suitable tool for perceptual-motor training, provided that the validity and fidelity criteria are met. Their measurements should therefore be an integral part of the design process for future simulators. It should be noted that the 4 × 100 m relay is a simple sporting discipline to replicate virtually, compared with others such as team sports. The absence of haptic feedback is a huge limit for most virtual environments. However, the relay initiation task does not require any haptic feedback. The decision-making process is based on visual information about the incoming partner, and that is why this motor task is compatible with a virtual environment. On the other hand, depth perception is indeed a potential limit of the simulator, and it would be relevant to test whether distance perception is biased in virtual reality. But according to Gray [
15], good psychological fidelity can be absolute or relative. Absolute psychological fidelity means that every variable of the environment is identical to reality. Relative psychological fidelity means that although some variables differ, like distance perception, they vary proportionally. Absolute psychological fidelity is optimal for the transfer of training, but relative fidelity is also functional. Moreover, depth perception bias can be overcome by immersing free-moving athletes in rich and structured virtual environments, providing them with a large amount of motion parallax and other sources of information, which is well documented to greatly attenuate virtual misperception [
32]. The challenge for the years to come will be to create valid and faithful simulators for more complex sports. Assuming that the results of this study are encouraging, the next step will be to assess whether training athletes’ anticipation skills using the simulator is a method transferable to the field. With these methodological precautions having now been taken, it is time to start using the simulator as a training tool to measure performance improvements in the real world. As mentioned above, it would also be a matter of completing the work on characterizing the different types of anticipation behavior. All of these studies focus on a single final objective: creating a virtual training protocol for the anticipation skills of the French team’s relay experts.

 ,
, 