Abstract
This study analyzed the use of cork-derived biochar, obtained through pyrolysis, as a more sustainable additive than traditional carbon materials. In addition, the present study explored its application in a polymer matrix through additive manufacturing via stereolithography. To the best of our knowledge, this approach has not been reported in scientific literature. The cork biochar retained the morphology of the original cork and integrated well into the photocurable polymer, as demonstrated by scanning electron microscopy. This integration can contribute to the formation of internal networks within the material, potentially modifying some of its properties. At specific low percentages, cork biochar enhanced both the electrical conductivity and mechanical properties of photocurable polymers. Notably, the required biochar concentrations were minimal, facilitating its incorporation into the photopolymer matrix. Additionally, the thermal stability of the material slightly improved at certain percentages but remained comparable to that of the original polymer in all cases. These findings highlight the potential of cork biochar as a sustainable additive for advanced polymer composites.
1. Introduction
Additive manufacturing, commonly known as 3D printing, is an advanced technology that enables the fabrication of 3D objects by layering materials in a controlled manner [1]. The emergence of 3D-printed polymer materials has significantly transformed the manufacturing industry [2], enabling creating complex and customized designs [3]. This innovation has found applications across multiple sectors, including aerospace [4,5], healthcare [6], and consumer goods. In aerospace, 3D printing is used to produce lightweight and intricate components [7], whereas in healthcare, 3D printing enables the development of custom implants and prosthetics [8,9]. The ability to rapidly prototype and manufacture customized parts makes additive manufacturing an essential tool for modern production processes.
Recent advancements in 3D printing have focused on enhancing the properties of polymer materials [3], leading to the development of stronger, more flexible, and more heat-resistant materials. These improvements have expanded the range of applications and have enabled the production of high-performance components across various industries. One critical aspect of these advances is the integration of composite materials, particularly fiber-reinforced polymers, which offer superior mechanical properties. However, these materials present challenges in terms of recyclability and end-of-life management [10]. The difficulty associated with recycling conventional fiber-reinforced composites has prompted research into more sustainable alternatives.
The growing emphasis on environmental sustainability has driven efforts to develop biobased and biodegradable polymer composites. The transition to eco-friendly materials is aligned with global sustainability trends and corporate social responsibility initiatives [11]. One promising approach involves incorporating biomass waste into polymer composites via 3D printing techniques [12,13,14,15,16]. By using agricultural biomass waste as an additive, it is possible to create sustainable materials with improved mechanical properties while reducing reliance on non-renewable resources [17]. This strategy also supports circular economy principles by repurposing waste materials into valuable industrial products [18,19].
Biochar, a carbon-rich material obtained by the pyrolysis of biomass waste, has gained increasing attention as a sustainable reinforcement for composite materials [20]. Because of its high surface area, porosity, and stability, biochar enhances the mechanical and thermal performance of polymer composites [21,22,23,24,25]. These improvements include increased tensile strength, elastic modulus, and resistance to thermal degradation. Additionally, biochar-based composites offer environmental benefits and can serve as effective adsorbents for wastewater treatment [26,27,28] and catalysts for clean energy applications [29,30]. The biodegradability of biochar depends on the polymer matrix, making it a viable option when combined with biodegradable resins [31].
Cork waste, a byproduct of cork production, represents a renewable and abundant source of biochar. Using cork-derived biochar as a reinforcement material in polymer composites can reduce the environmental impact of cork waste while introducing new opportunities for resource conservation [32,33,34]. The integration of cork biochar into polymer matrices enhances the mechanical properties and promotes material fabrication sustainability. Despite its potential, research on the use of cork biochar in 3D-printed photopolymers remains limited. This study aimed to bridge this gap by investigating the feasibility of incorporating cork biochar into photopolymers via vat photopolymerization.
To the best of our knowledge, this is the first study to successfully integrate cork biochar into a photopolymer using vat photopolymerization techniques, such as stereolithography (SLA) and digital light processing (DLP). These methods use photopolymer resins, but they differ in how the resin is cured [35]. SLA uses a UV laser to solidify liquid photopolymer resin layer by layer, achieving high precision and smooth surface finishes. This makes SLA ideal for applications requiring intricate geometries, such as dental and jewelry manufacturing. In contrast, DLP projects light through an array of micromirrors, curing entire layers simultaneously, leading to faster print speeds [36].
This work focuses on DLP-based fabrication due to its higher speed and cost compared to SLA. DLP enables high-throughput production, making it suitable for large-scale manufacturing of biochar-reinforced polymer composites. However, SLA was also used in this study to compare the results and validate the feasibility of using cork biochar in photopolymer matrices. By systematically analyzing the mechanical and thermal properties of cork biochar-based polymer composites (CBPCs), this research establishes a foundation for the application of cork biochar in additive manufacturing.
Comprehensive mechanical testing, including Young’s modulus, tensile strength, and elongation at break, was conducted to evaluate the effects of cork biochar on polymer composites. Furthermore, microscopic characterization techniques such as scanning electron microscopy (SEM) were used to analyze the dispersion and adhesion of biochar within the polymer matrix. The thermal properties of the samples were assessed using differential scanning calorimetry (DSC) and thermogravimetric analysis (TGA) to determine their thermal stability and degradation behavior. This study contributes to the advancement of sustainable materials, paving the way for innovative applications in various industrial sectors.
2. Materials and Methods
2.1. Materials
Cork waste was provided by Corchos del Estrecho S.L. (Alcalá de los Gazules, Cádiz, Spain). The waste was sieved to particle sizes in the range of 63–125 µm. The cork powder was derived from the waste generated from producing cork stoppers; that is, raw cork was subjected to boiling in water and drying, which are characteristic treatments for cork preparation for industrial processing. The photocurable resin used was a 3D-printed UV-sensitive Plant Biobased Resin from Anycubic (Anycubic, Shenzhen, China). The resin contained 45% epoxidized soybean oil, making it a more ecologically friendly substance than conventional 3D printing resins. Isopropyl alcohol was purchased from Scharlab (Barcelona, Spain).
2.2. Cork Pyrolysis to Obtain Biochar
The furnace used was an L 3/11/B180 furnace (Nabertherm GmbH (Bremen, Germany). The cork was placed in a melting pot, introduced into the furnace, and calcined at 300 °C in air for 20 min. At the end of calcination, biochar from the cork waste was obtained.
2.3. Sample Preparation of Cork Biochar Photopolymer Composites
The biochar powder was blended with the photocurable resin at different %w/w ratios. In a beaker stirred, cork biochar was first added, followed by resin, according to the formulations listed in Table 1. After stirring for 10 min at room temperature (25 °C), the beaker containing the mixture was placed in an ultrasonic bath to remove air bubbles formed during mixing. The duration in the ultrasonic bath varied, but it continued until the air bubbles were visually no longer present in the mixture. The mixture was deposited in the tank of a 3D printer (a Creality LD 006 using 405 nm light), used for the additive manufacturing of dogbone specimens according to ASTM D638 [37] (type 1BA) for tensile testing, flat discs of 2 mm of height and 50 mm diameter for thermal characterization according to ASTM E1350 [38], and flat discs of 2 mm of height and diameter of 65 mm according to ASTM D257 [39] for electrical resistivity testing. During the printing process, the temperature in the laboratory was set to 25 °C, and the humidity was 56%. The layer height of the specimens was 0.05 mm, with 40 layers per specimen. The printing direction was perpendicular to the plane of platform printing at the selected maximum printing speed. The specimens were then cleaned with isopropyl alcohol to remove any remaining composite residue. The obtained CBPC formulations are listed in Table 1.

Table 1.
Photocurable polymer composites with cork biochar. Resin = photocurable clean resin; CBPC-X = photocurable resin–biochar composite, where X indicates the %w/w of cork biochar present in the prepared sample.
To achieve the desired mechanical performance, the specimens were subjected to UV curing in a UV chamber (Anycubic Wash & Cure Machine, Anycubic, Shenzhen, China) for 10 min on each side of the specimen with a light source of 405 nm and power of 25 W. The design of the printing specimens was created using computer-aided design (CAD) software (Ultimaker Cura V.3.1.1), uploading the design to the DLP printer.
2.4. Material Characterization
2.4.1. Characterization by Scanning Electron Microscopy
The biochar used as an additive and the manufactured composites were characterized by SEM. The microscope used to obtain high-resolution SEM images was a Nova NanoSEM 450 (FEI Company, Hillsboro, OR, USA), located at the Central Research and Technology Services of the University of Cadiz (Spain).
2.4.2. Tensile Testing
For the tensile test, a set of samples of the biochar composite material was produced using the DLP 3D printing in accordance with the ASTM D638 standard [37]. The samples correspond to model 1BA of the standard and have total length, thickness, and width of 75, 2, and 5 mm, respectively. Tensile testing was conducted using a Shimadzu universal testing machine at a speed of 1 mm/min to obtain the tensile–deformation curve. Subsequently, Young’s modulus (E), tensile strength (σr), and elongation at break (εr %) were determined. Five specimens for each composition were tested for measurements to calculate average values along with standard deviations and associated errors.
2.4.3. Thermal Characterization
The thermal stability of the developed CBPCs was analyzed by TGA and DSC. The TGA examination was conducted using a TGA Q50 instrument (TA Instruments). The specimens were initially stabilized at 30 °C for 5 min and then heated to 600 °C at a rate of 10 °C/min under an inert nitrogen (N2) atmosphere with a flow rate of 60 mL/min. Prior to analysis, the composite samples were stored in a desiccant environment. The composites had an approximate mass of 10 mg. Thermogravimetric analysis was performed using the TA Universal Analysis 2000 software (V. 4.5A). DSC analysis was performed using a Q20 (TA Instruments, New Castle, DE, USA). The samples were initially stabilized at 40 °C for 5 min and then heated to 550 °C at a rate of 10 °C/min in an inert nitrogen (N2) atmosphere with a flow rate of 50 mL/min. Both instruments are housed in the Faculty of Science at the University of Cádiz (Spain).
For the thermal analysis of the samples, the thermal conductivities of various composite formulations were determined under UV irradiation. The measurements were conducted using the TA Instrument model DTC-25 conductivity meter following the ASTM E1530 standard [40] (located at the Central Research and Technology Services of the University of Cadiz (Spain)). This method provides standardized thermal conductivity values for cylindrical specimens corresponding to each composition under study.
2.4.4. Electrical Conductivity Testing
To determine the electrical conductivity of the CBPC formulations, the electrical resistivity was measured using a Keithley 6517B electrometer (Keithley, Cleveland, OH, USA) with a voltage of 500 V at the Central Research and Technology Services of the University of Cadiz (Spain).
3. Results and Discussion
3.1. Morphological Structure Analysis of Cork Biochar and Cork Biochar Polymer Composites
SEM analysis was conducted on the CBPCs to examine the microstructure of the cork biochar and the dispersion of the cork biochar materials within the polymer composite matrix. Figure 1 shows SEM images of the cork at different magnifications after the pyrolysis process and the cork biochar obtained after the same process. As shown in the images of Figure 1, the cork biochar obtained after pyrolysis of the cork biomass preserved the complete three-dimensional alveolar structure of the original cork. The effects of the pyrolysis process on biomass were previously reported [32,41].
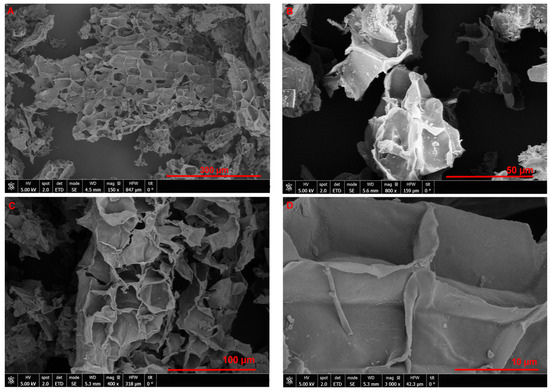
Figure 1.
Cork biomass waste (A,B) and biochar from cork biomass waste after pyrolysis (C,D).
The SEM analysis in Figure 2 (in which pristine resin without cork biochar (A) was compared with the rest of CBPCs) shows strong interfacial bonding and good compatibility between the polymer matrix and cork biochar. The cited figure shows that throughout the photopolymerization process of the printed components. The three-dimensional structure of the cork biochar (B) remained intact without any distortion in the printed parts. SEM analysis indicated that the original alveolar structure was maintained in all the formulations processed by VAT photopolymerization (Table 1), including (C), (D), (E), (F), (G), and (H). The preservation of the original alveolar structure is crucial for maintaining the unique properties and functionality of biochar in printed parts. These results are promising in terms of the overall structural integrity and performance of the 3D-printed polymer composites. Overall, the SEM analysis confirmed the successful fabrication of polymer composites using the VAT photopolymerization technique with a good distribution of cork biochar and the photopolymer matrix.
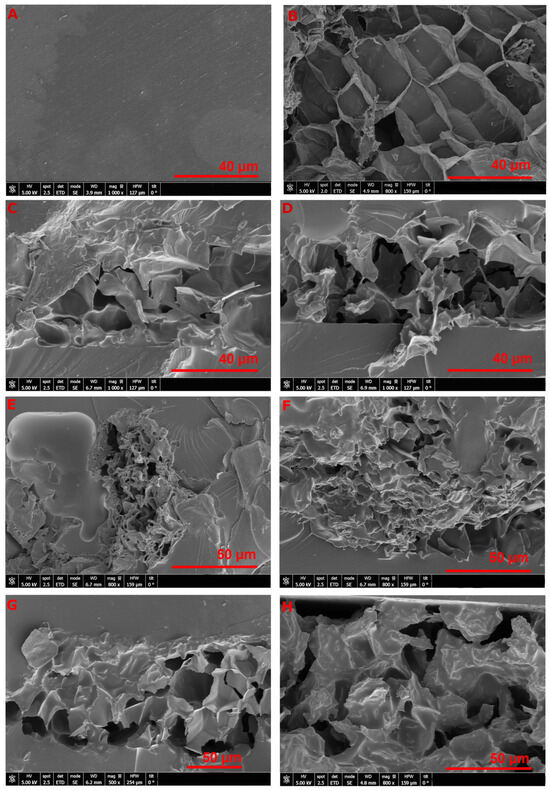
Figure 2.
SEM images of pristine resin without cork biochar (A), cork biochar (B), CBPC 0.15%w/w (C), CBPC 0.25%w/w (D), CBPC 0.35%w/w (E), CBPC 0.5%w/w (F), CBPC 1%w/w (G), and CBPC 1.5%w/w (H).
3.2. Thermal Analysis of Cork Biochar-Based Composites
3.2.1. Thermogravimetric Analysis
Thermal analysis can provide valuable information about the composition, stability, and thermal properties of manufactured CBPCs. Applying TGA to biochar-based composites, the thermal stability and decomposition behavior of the composites were analyzed. In Figure 3, the TGA results of the CBPCs are shown.
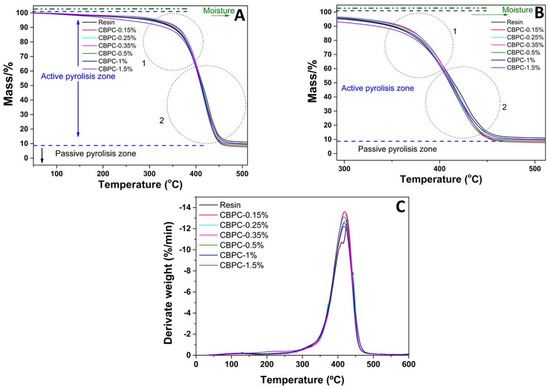
Figure 3.
TGA (A), TGA interest area zoom (B), and derivative thermogravimetry (DTG) curves of the printed CBPCs (C).
Three areas can be differentiated in the TGA curves: the first, marked in green, corresponds to the loss of moisture naturally present in the samples. The temperature range of this first zone goes up to 150 °C. This area is very common in the TGA analyses of biomass composites, as can be found in the literature [41,42]. The second area, marked by blue arrows, extends from 150 °C to 450 °C. The active pyrolysis zone is where the major percentage of mass is liberated. The circles 1 and 2 in the TGA curves of Figure 3A indicate the interest zone inside the active pyrolysis area, and an enlarged image of this area is shown Figure 3B. In the area marked as circle 1, it was noted that CBPCs containing up to 0.35%w/w of cork biochar exhibited slightly smaller stability compared to those containing a higher cork biochar concentration in the polymer matrix. This difference between the samples was smaller than 3%, which could also be explained by the precision of the measurements. Advancing into the active pyrolysis zone (circle 2, Figure 3), a slight difference in mass loss was observed between the composites and the neat resin, but as in the previous discussion, it was not quite significant. These results indicate that the inclusion of cork biochar, which acts as a thermally stable network within the polymer matrix, could increase thermal resistance and prevent degradation at high temperatures in the composite matrix, enhancing its heat resistance and improving its ability to retain its shape at elevated temperatures. Other research has produced comparable findings on biochar composites [43].
Continuing with the TGA curve analysis, the DTG curves are shown in Figure 3C. In the DTG graph, the two peaks correspond to the two main areas of the TGA curves. The first region is located at approximately 100 °C, which corresponds to the moisture loss observed in the TGA curves, and the second region agrees with the active pyrolysis area observed in the TGA graphs.
At the beginning of the pyrolysis process, the temperature at which the weight-loss rate occurs is slightly less pronounced in CBPCs than in neat resin. The inflection point occurred around 350 °C, in which the weight loss was slightly higher for CBPCs than for the neat resin. However, as it was discussed in the TGA analysis, these differences are not significant because they did not exceed 3% of the difference in the samples.
3.2.2. Differential Scanning Calorimetry Analysis
As is well known, DSC is a powerful technique for analyzing the thermal properties of materials. It measures the difference in heat flow between a sample and a reference material as a function of temperature. DSC analysis offers a comprehensive understanding of CBPCs, allowing for informed decisions regarding the selection of materials and the processing parameters for 3D printing. The photocurable resin is a type of photopolymer that can be used in comparison with heat-resistant polymers. While the idea of glass transition also relates to thermosetting materials; in this case, the alterations in the properties during the glass transition are not significant. However, DSC analysis can still provide valuable information about the transition temperatures and thermal behaviors of photocurable CBPCs.
Regarding the DSC of this work, Figure 4 shows the DSC curves for the neat resin and CBPCs printed. The DSC curves show four differentiated points, as shown in Figure 4A. For better clarity in visualizing these temperature ranges, Figure 4B–D display these ranges separately.
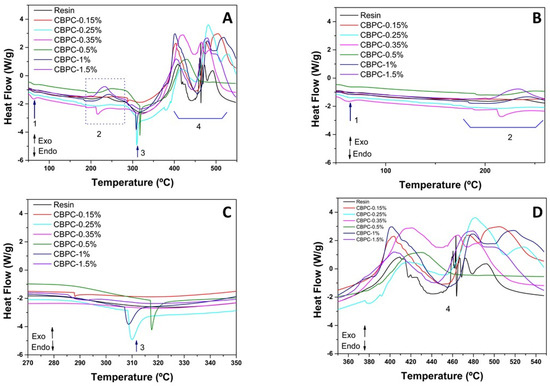
Figure 4.
DSC of cork biochar photopolymer composites and neat photocurable resin. Overview of (A) stages 1 and 2 (B), stage 3 (C), and stage 4 (D).
The first one (No. 1 Figure 4B), located at the beginning of the DSC analysis, around ~40 °C, can be attributed to the heat deflection temperature (HDT) of the photocurable resin. This endothermic peak was observed in all CBPCs because the resin matrix was the same. The second highlighted area (No. 2 Figure 4B) in the DSC graph, which occurs in the temperature range of 80–260 °C. In this range, a glass transition (Tg) characteristic of the amorphous region of the polymer occurs. The DSC graph shows that this amorphous region is more pronounced for samples with a higher biochar content, indicating greater heterogeneity of the material, which will unequivocally affect both the thermal and mechanical properties. The endothermic peak around 310 °C, (No. 3 Figure 4C), which is present in all CBPCs and in the pristine resin, is attributed to the fusion temperature (Tm). The presence of this peak confirms the existence of a crystalline phase in the composites. The next area of interest (No. 4 Figure 4D) occurs at a high temperature, around ~450 °C. This peak is directly linked to the decomposition of the photopolymer resin, which acts as a matrix in the developed CBPCs. This high-temperature endothermic phenomenon occurs due to the extensive cross-linking present in photopolymer resin, which results in highly interconnected structures that require high decomposition energy.
It should also be noted that no secondary polymerization reactions of the monomers of the photocurable resin were observed, as has been reported on other occasions for this type of composite [44,45,46]. Thus, subsequent curing with a UV chamber was effective for completely curing the photocurable resin. The exothermic peaks around ~500 °C is attributed to the final mass loss due to total photocurable resin bond rupture.
3.2.3. Thermal Conductivity (TC)
TCs are essential in polymer composites for heat dissipation applications. This depends on factors such as filler type, concentration, polymer matrix, composite morphology, and processing techniques. High-TC fillers such as carbon nanotubes, graphene, and boron nitride improve thermal performance. Proper dispersion and interaction between the fillers and polymer matrix are key to optimizing TC [47,48]. As discussed in Section 3.1, the cork biochar retains its three-dimensional honeycomb-like structure after the pyrolytic process and integrates into the photocuring resin during printing. The cork biochar forms a network structure inside the polymeric resin. These network structures enable thermal energy transfer with minimal phonon scattering [49].
The conductivities of the CBPCs and the photocurable resin were then measured. The graph is shown in Figure 5.
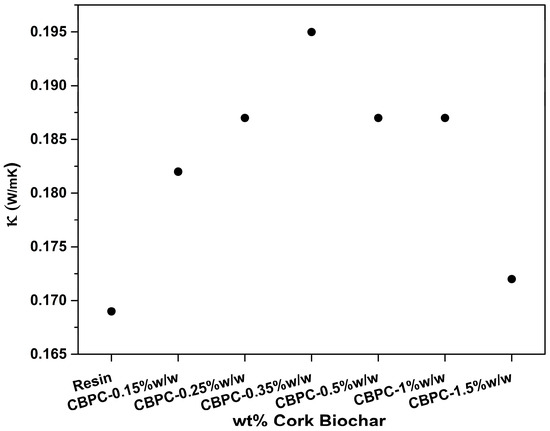
Figure 5.
Thermal conductivities of cork biochar photopolymer composites and neat photocurable resin.
As can be observed in Figure 5, the addition of cork biochar resulted in an increase in thermal conductivity for all CBPCs, compared with resin alone, even with a small amount of cork biochar, with CBPC 0.35%w/w showing the highest increase. The graph shows that as the %w/w of cork biochar increased, the conductivity value increased until reaching a maximum at CBPC 0.35%w/w. At this point, no increase in thermal conductivity was achieved by boosting the biochar content. As concluded in the previous Section 3.2.2 of the DSC analysis, CPBCs with higher biochar contents exhibited higher heterogeneity, which caused phonons to scatter through the amorphous regions and possible crystalline regions created by the biochar, thereby reducing the thermal conduction efficiency.
Considering the above, proper dispersion and strong filler-matrix interaction of cork biochar can lead to improved heat transfer within the composite.
3.3. Electrical Conductivity of Cork Biochar Polymer Composites (CBPCs)
Polymer composites with various carbonaceous additives, such as carbon nanotubes (CNTs) and graphene, generally exhibit increased electrical conductivity, which has been widely documented in the scientific literature [50,51]. The dispersion of these fillers plays a crucial role in determining the overall electrical properties of the composite material [52]. In this regard, the electrical conductivities of the CBPCs were measured, and the results are shown in Figure 6.
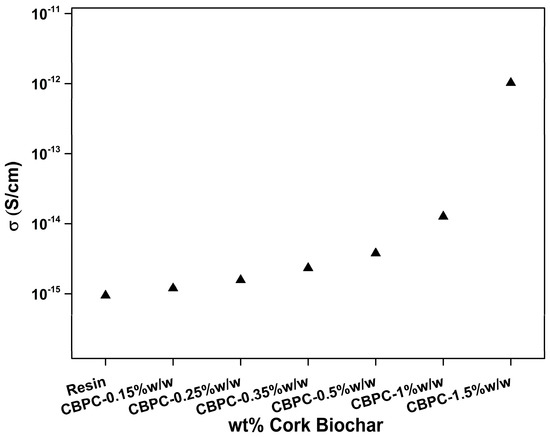
Figure 6.
Electrical conductivities of cork biochar photopolymer composites and neat photocurable resin.
The graph illustrates the relationship between conductivity and cork biochar weight percentage, demonstrating a progressive increase in conductivity with increasing cork biochar content. At the maximum cork biochar content, the conductivity was three-fold higher than that of the polymeric resin. In addition to dispersion, the aspect ratio and surface area of the carbonaceous fillers significantly influenced the electrical properties of the composite material [53]. The high aspect ratio of cork biochar promotes efficient electron transport within CBPCs, leading to enhanced conductivity.
Based on the electrical and thermal conductivity results, no correlation was observed as expected. Research has suggested that particle clustering can cause the scattering of heat carrier phonons, leading to reduced thermal conductivity in a specific direction [49]. High thermal conductivity within these clusters may also introduce non-uniformity in heat flow and affect the overall thermal conductivity. The agglomeration of cork biochar was the sharpest in printed samples with higher %w/w cork biochar content. This explains why sample CBPC-0.35%w/w had higher thermal conductivity (topmost value) than CBPC-1.5%w/w (smaller value) and, on the contrary, CBPC-1.5%w/w had higher electrical conductivity (topmost value) than CBPC-0.35%w/w (one of the smaller values) [54].
3.4. Mechanical Properties of Cork Biochar Polymer Composites (CBPCs)
To complete the material characterization, mechanical testing was conducted to evaluate the Young’s modulus (E), tensile strength (σr), and elongation at break (Ɛr %) of the printed CBPC parts. These tests provide valuable insights into the structural performance and suitability of 3D-printed CBPCs for specific applications. In simple terms, Young’s modulus reflects the stiffness of a material under stress. A high Young’s modulus indicates greater stiffness and reduced deformation under load, whereas a low Young ’s modulus indicates greater flexibility and easier deformation. In general, the tensile strength of polymer composites reflects their ability to withstand the forces applied without breaking or undergoing permanent. Fracture elongation indicates the extent to which a material can be stretched before experiencing tensile failure. This is a crucial measure of the ductility or plastic deformation of CBCPs. Materials with greater elongation at break can stretch further before breaking, indicating increased energy absorption capacity and enhanced resistance to tensile fractures.
The overall mechanical properties of CBPCs with different cork biochar loading levels are presented in Table 2, with the standard deviation (SD). The mechanical properties of the photocurable resin, which acts as the polymer matrix of the composites, were markedly modified by the addition of cork biochar to form CBPCs. Young’s modulus, tensile strength, and elongation at break were significantly different between the pristine matrix and the biochar, highlighting the effect of biochar within the polymeric matrix.
Table 2.
Mechanical property values of CBPCs.
Using the statistical methods of analysis of variance (ANOVA) and multiple comparisons, the influence of different percentages of cork biochar on the mechanical properties of CBPCs was analyzed.
To further investigate these differences, post hoc comparisons such as Tukey’s HSD test were conducted to determine which specific pairs of reinforcement materials exhibited significant differences in mechanical properties. The ANOVA revealed significant differences in the mechanical properties of CBPCs based on the percentage of cork biochar used. Specifically, Young’s modulus, tensile strength, and percentage elongation at break showed statistically significant variations (p < 0.05) among the composite formulations.
Young’s modulus values differ significantly among various CBPCs with different percentages of cork biochar. There was a significant difference in modulus between neat resin and CBPCs with cork biochar at percentages ranging from 0.5% to 1.5%w/w. Lower percentages do not yield such significance, indicating that Young’s modulus is not significantly affected by levels below 0.5%w/w in cork biochar. The CBPCs 0.15%w/w, CBPCs 0.25%w/w, and CBPCs 0.35%w/w did not display notable differences compared with each other.
In the ANOVA analysis for tensile strength, there was a significant difference when comparing the resin with the entire range of CBPC series, indicating a significant modification of the tensile strength by the cork biochar at any percentage level of the cork biochar. In contrast with the findings for Young’s modulus, the comparisons between CBPCs-0.35%w/w, CBPCs-0.5%w/w, CBPCs-1%w/w and CBPCs-1.5%w/w did not reveal significant differences, possibly due to close values and comparable dispersion achieved in this range within the polymer matrix. Finally, it was noted that CBPCs-0.15%w/w, CBPCs-0.25%w/w, and CBPCs-0.35%w/w series show no significant differences when compared to each other, like Young’s modulus observations.
The ANOVA indicates a significant difference in the percentage elongation at break between the resin and the full range of CBPCs, which is similar to the results observed for the tensile strength. Additionally, there are no significant differences among CBPCs-0.15%w/w, CBPCs-0.25%w/w, CBPCs-0.35%w/w, and CBPCs-0.5%w/w when compared to each other. However, for CBPCS-1.5%w/w and CBPCs with lower percentages of biochar, significant differences exist. Above 0.5%w/w, there are none. This suggests that once a specific percentage is attained, the modification of the percentage elongation at break is consistent across all cases.
3.4.1. Young’s Modulus of CBPCs
In view of the Young’s modulus results (Figure 7), it is possible to affirm that a higher cork biochar content increases flexibility. The lowest values for E correspond to CBPCs with high cork biochar content. The addition of porous or hollow fillers, such as biochar, into the polymeric matrix significantly affects the Young’s modulus of the composite material; this influence varies depending on various factors [22,25,43,55]. As the cork biochar content increased, the Young’s modulus gradually decreased. The presence of these fillers tended to reduce the overall stiffness of polymer composites. This reduction in stiffness can be attributed to the presence of voids or gaps within the material, which act as stress concentration points and lead to easier deformation under load. The incorporation of cork biochar, which has an alveolar three-dimensional structure, increased the flexibility of the composite material.
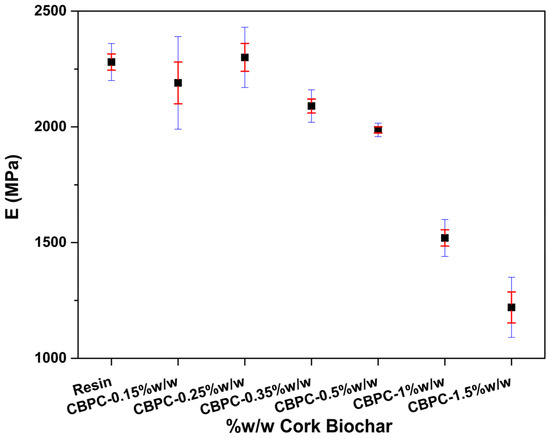
Figure 7.
Young’s modulus of photocurable resin and CBPCs. The blue and red bars correspond to the standard deviations and the standard error of the mean, respectively [22,25,43,55].
3.4.2. Tensile Strength of CBPCs
In addition to affecting Young’s modulus, the incorporation of cork biochar into a photocurable resin also has a notable impact on the tensile strength of the material, shown in Figure 8. The presence of porous or hollow fillers can influence the ability of a composite to withstand pulling forces without fracturing or permanent deformation. The effect of a porous filler on the tensile strength is multifaceted [22,25,43,55]. In this case, the alveolar morphology of cork biochar had a different effect on the tensile strength of CBPCs, depending on the %w/w. It was observed that for CBPCs ranging from 0.15% to 0.5%w/w, the tensile strength was slightly higher than that of the neat photocurable resin. Along with the CBPCs, the tensile strength tended to decrease with the increasing of cork biochar %w/w. In general, a decrease in the tensile strength indicates poor interfacial adhesion between the materials [56]. The results indicate that for %w/w values greater than 0.5, the tensile strength decreases drastically compared with that of neat photocurable resin.
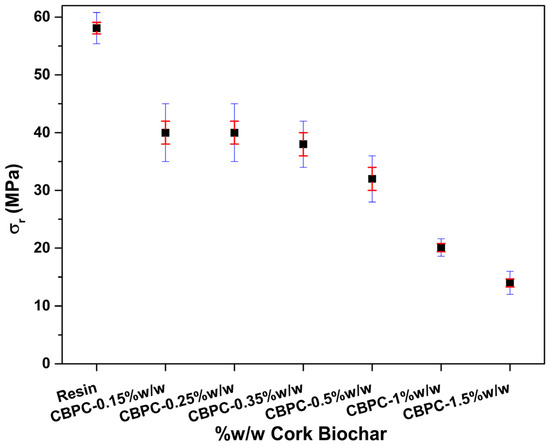
Figure 8.
Tensile strength of the photocurable resin and CBPCs. The blue and red bars correspond to the standard deviations and the standard error of the mean, respectively.
3.4.3. Percentage Elongation at Break of CBPCs
Regarding the elongation at break of the studied CBPCs (Figure 9), the incorporation of cork biochar into the neat photocurable resin drastically decreased the ductility of all the printed CBPCs, and it can be concluded that the CBPCs were more rigid than the neat photocurable resin. The reduction in % elongation at break is primarily attributed to the incorporation of cork biochar into the matrix, which restricted the mobility and relaxation of photopolymer chains under tension, leading to lower ductility in the sample. This behavior has been previously reported for composites with carbon-based fillers [57,58].
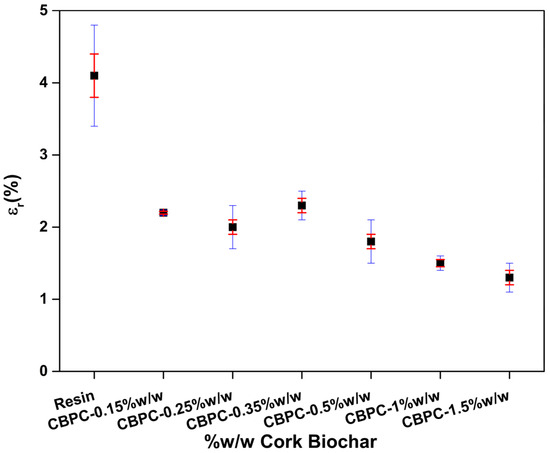
Figure 9.
Percentage elongation at break of the photocurable resin and CBPCs. The blue and red bars correspond to the standard deviations and the standard error of the mean, respectively.
3.4.4. Discussion of the Mechanical Properties of the Cork Biochar-Integrated Materials and Interpretation of the Results
The data in Table 2 reveal that the mechanical performance significantly declined with increasing biochar content. The elongation at break decreased progressively, indicating reduced material ductility. The tensile strength also decreased considerably from 58 MPa (pure resin) to 14 MPa at 1.5%w/w biochar, demonstrating a substantial weakening of the material. Additionally, Young’s modulus declined as the biochar content increased, suggesting reduced stiffness.
A typical trend in material mechanics is that a decrease in Young’s modulus often corresponds to an increase in elongation at break as the material becomes more flexible. However, in this case, the opposite trend was observed: both Young’s modulus and elongation at break decreased simultaneously. This suggests that the addition of biochar particles introduces stress concentrators or defects within the matrix, leading to premature failure rather than increased flexibility.
Despite the reduction in mechanical properties, biochar incorporation may offer other functional benefits that justify its use in specific applications. For example, regarding sustainability and environmental impact, biochar is derived from biomass, making it a sustainable additive that may contribute to eco-friendly material formulations. Another advantage of using cork biochar in some polymer composites is that biochar can enhance thermal stability and barrier properties against moisture or gases, potentially benefiting applications in packaging or insulation. Furthermore, as a bio-based filler, biochar may reduce material costs while providing acceptable performance for non-load-bearing applications.
If mechanical performance is a primary concern, the observed reductions in strength, elongation, and stiffness may limit the applicability of biochar-based composites in structural or high-performance mechanical applications. Future research should explore strategies to mitigate these drawbacks, such as surface modification of biochar, optimization of filler dispersion, and hybrid reinforcement approaches.
Overall, although biochar affects the mechanical properties of the resin matrix, its potential benefits in terms of sustainability and functional improvements may justify its use in targeted applications. Further studies are needed to balance mechanical performance with the advantages that biochar offers.
4. Conclusions
A novel composite material was developed by combining photocurable resin and biochar from cork waste. This new composite, which is a novel approach not previously reported, can be processed by additive manufacturing via vat polymerization, a well-established technique. With higher cork biochar contents, the electrical conductivity of the composite material increased significantly by three orders of magnitude, whereas lower cork biochar contents led to increased thermal conductivity. Cork biochar directly influences the mechanical properties of photocurable composite materials; these properties can be adjusted by varying the cork biochar content. This suggests that cork biochar could be a sustainable filler alternative to other carbonaceous materials. Ongoing research aims to further improve the electrical, thermal, and mechanical properties of future composites using cork biochar as an additive.
Author Contributions
I.R.-O.: Conceptualization, Methodology, Investigation, Data curation, Writing–original draft, Writing–review and editing, Visualization. N.F.-D.: Investigation, Data curation, and writing—review and editing. J.B.: Investigation, Data curation, Writing–review and editing S.I.M.: Resources: Writing–review and editing, Supervision, Project administration, Funding acquisition. All authors have read and agreed to the published version of the manuscript.
Funding
This research was funded by Consejería de Agricultura, Ganadería, Pesca y Desarrollo Sostenible from Junta de Andalucía, through ADICORK project (ref OT2020/146) Group TEP-946 INNANOMAT, UE-ITI funding) in the first stage, and later by the FUTURECORK (ref. BF022) project, which is supported by the Biodiversity Foundation of the Ministerio para la Transición Ecológica y el Reto Demográfico (MITECO) within the framework of the Recovery, Transformation and Resilience Plan (PRTR), funded by the European Union—NextGenerationEU.
Institutional Review Board Statement
Not applicable.
Informed Consent Statement
Not applicable.
Data Availability Statement
The raw data supporting the conclusions of this article will be made available by the authors on request.
Acknowledgments
I.R.-O. acknowledges funding from access to the Spanish System of Science, Technology and Innovation linked to Andalusian Innovation Strategy and technological Innovation Initiatives ITI. Additive manufacturing and characterization measurements were performed at SC-ICyT-UCA (DFA and DME-ELECMI). We thank Miriam Herrera Collado for her help in discussing the results and improving the manuscript.
Conflicts of Interest
The authors declare no conflict of interest.
References
- Kanishka, K.; Acherjee, B. Revolutionizing manufacturing: A comprehensive overview of additive manufacturing processes, materials, developments, and challenges. J. Manuf. Process. 2023, 107, 574–619. [Google Scholar] [CrossRef]
- Mitchell, A.; Lafont, U.; Hołyńska, M.; Semprimoschnig, C. Additive manufacturing—A review of 4D printing and future applications. Addit. Manuf. 2018, 24, 606–626. [Google Scholar] [CrossRef]
- Islam, M.A.; Mobarak, M.H.; Rimon, M.I.H.; Al Mahmud, M.Z.; Ghosh, J.; Ahmed, M.M.S.; Hossain, N. Additive manufacturing in polymer research: Advances, synthesis, and applications. Polym. Test. 2024, 132, 108364. [Google Scholar] [CrossRef]
- Alami, A.H.; Ghani Olabi, A.; Alashkar, A.; Alasad, S.; Aljaghoub, H.; Rezk, H.; Abdelkareem, M.A. Additive manufacturing in the aerospace and automotive industries: Recent trends and role in achieving sustainable development goals. Ain Shams Eng. J. 2023, 14, 102516. [Google Scholar] [CrossRef]
- Altıparmak, S.C.; Xiao, B. A market assessment of additive manufacturing potential for the aerospace industry. J. Manuf. Process. 2021, 68, 728–738. [Google Scholar] [CrossRef]
- Culmone, C.; Smit, G.; Breedveld, P. Additive manufacturing of medical instruments: A state-of-the-art review. Addit. Manuf. 2019, 27, 461–473. [Google Scholar] [CrossRef]
- Blakey-Milner, B.; Gradl, P.; Snedden, G.; Brooks, M.; Pitot, J.; Lopez, E.; Leary, M.; Berto, F.; Du Plessis, A. Metal additive manufacturing in aerospace: A review. Mater. Des. 2021, 209, 110008. [Google Scholar] [CrossRef]
- Mobarak, M.H.; Islam, M.d.A.; Hossain, N.; Al Mahmud, M.Z.; Rayhan, M.T.; Nishi, N.J.; Chowdhury, M.A. Recent advances of additive manufacturing in implant fabrication—A review. Appl. Surf. Sci. Adv. 2023, 18, 100462. [Google Scholar] [CrossRef]
- Kumar, R.; Kumar, M.; Chohan, J.S. The role of additive manufacturing for biomedical applications: A critical review. J. Manuf. Process. 2021, 64, 828–850. [Google Scholar] [CrossRef]
- Al Rashid, A.; Khan, S.A.; Koç, M. Life cycle assessment on fabrication and characterization techniques for additively manufactured polymers and polymer composites. Clean. Environ. Syst. 2024, 12, 100159. [Google Scholar] [CrossRef]
- Abad-Segura, E.; Cortés-García, F.J.; Belmonte-Ureña, L.J. The Sustainable Approach to Corporate Social Responsibility: A Global Analysis and Future Trends. Sustainability 2019, 11, 5382. [Google Scholar] [CrossRef]
- Hassan, M.; Mohanty, A.K.; Misra, M. 3D printing in upcycling plastic and biomass waste to sustainable polymer blends and composites: A review. Mater. Des. 2024, 237, 112558. [Google Scholar] [CrossRef]
- Ganguly, A.; Shankar, S.; Das, A.; Shukla, M.; Swaroop, C.; Bhardwaj, T. Natural fibre reinforced composites: A review based on additive manufacturing routes and biodegradability perspective. Mater. Today Proc. 2022, 62, 131–135. [Google Scholar] [CrossRef]
- Rigotti, D.; Pegoretti, A. 23—Additive manufacturing with biodegradable polymers. In Biodegradable Polymers, Blends and Composites; Mavinkere Rangappa, S., Parameswaranpillai, J., Siengchin, S., Ramesh, M., Eds.; Woodhead Publishing Series in Composites Science and Engineering; Woodhead Publishing: Cambridge, UK, 2022; pp. 611–679. [Google Scholar] [CrossRef]
- Mukherjee, C.; Varghese, D.; Krishna, J.S.; Boominathan, T.; Rakeshkumar, R.; Dineshkumar, S.; Rao, C.B.; Sivaramakrishna, A. Recent advances in biodegradable polymers—Properties, applications and future prospects. Eur. Polym. J. 2023, 192, 112068. [Google Scholar] [CrossRef]
- Kumar, R.; Sadeghi, K.; Jang, J.; Seo, J. Mechanical, chemical, and bio-recycling of biodegradable plastics: A review. Sci. Total Environ. 2023, 882, 163446. [Google Scholar] [CrossRef] [PubMed]
- Ji, A.; Zhang, S.; Bhagia, S.; Yoo, C.G.; Ragauskas, A.J. 3D printing of biomass-derived composites: Application and characterization approaches. RSC Adv. 2020, 10, 21698–21723. [Google Scholar] [CrossRef]
- Romani, A.; Suriano, R.; Levi, M. Biomass waste materials through extrusion-based additive manufacturing: A systematic literature review. J. Clean. Prod. 2023, 386, 135779. [Google Scholar] [CrossRef]
- Rahman, A.M.; Rahman, T.T.; Pei, Z.; Ufodike, C.O.; Lee, J.; Elwany, A. Additive Manufacturing Using Agriculturally Derived Biowastes: A Systematic Literature Review. Bioengineering 2023, 10, 845. [Google Scholar] [CrossRef]
- Chang, B.P.; Rodriguez-Uribe, A.; Mohanty, A.K.; Misra, M. A comprehensive review of renewable and sustainable biosourced carbon through pyrolysis in biocomposites uses: Current development and future opportunity. Renew. Sustain. Energy Rev. 2021, 152, 111666. [Google Scholar] [CrossRef]
- Giorcelli, M.; Khan, A.; Pugno, N.M.; Rosso, C.; Tagliaferro, A. Biochar as a cheap and environmental friendly filler able to improve polymer mechanical properties. Biomass Bioenergy 2019, 120, 219–223. [Google Scholar] [CrossRef]
- Pudełko, A.; Postawa, P.; Stachowiak, T.; Malińska, K.; Dróżdż, D. Waste derived biochar as an alternative filler in biocomposites—Mechanical, thermal and morphological properties of biochar added biocomposites. J. Clean. Prod. 2021, 278, 123850. [Google Scholar] [CrossRef]
- Das, C.; Tamrakar, S.; Kiziltas, A.; Xie, X. Incorporation of Biochar to Improve Mechanical, Thermal and Electrical Properties of Polymer Composites. Polymers 2021, 13, 2663. [Google Scholar] [CrossRef] [PubMed]
- Minugu, O.P.; Gujjala, R.; Shakuntala, O.; Manoj, P.; Chowdary, M.S. Effect of biomass derived biochar materials on mechanical properties of biochar epoxy composites. Proc. Inst. Mech. Eng. Part C-J. Mech. Eng. Sci. 2021, 235, 5626–5638. [Google Scholar] [CrossRef]
- Hernandez-Charpak, Y.D.; Trabold, T.A.; Lewis, C.L.; Diaz, C.A. Biochar-filled plastics: Effect of feedstock on thermal and mechanical properties. Biomass Convers. Biorefinery 2022, 12, 4349–4360. [Google Scholar] [CrossRef]
- Lehmann, J.; Cowie, A.; Masiello, C.A.; Kammann, C.; Woolf, D.; Amonette, J.E.; Cayuela, M.L.; Camps-Arbestain, M.; Whitman, T. Biochar in climate change mitigation. Nat. Geosci. 2021, 14, 883–892. [Google Scholar] [CrossRef]
- Bhatia, S.K.; Gurav, R.; Choi, T.R.; Kim, H.J.; Yang, S.Y.; Song, H.S.; Park, J.Y.; Park, Y.L.; Han, Y.H.; Choi, Y.K.; et al. Conversion of waste cooking oil into biodiesel using heterogenous catalyst derived from cork biochar. Bioresour. Technol. 2020, 302, 122872. [Google Scholar] [CrossRef]
- Quarta, A.; Novais, R.M.; Bettini, S.; Iafisco, M.; Pullar, R.C.; Piccirillo, C. A sustainable multi-function biomorphic material for pollution remediation or UV absorption: Aerosol assisted preparation of highly porous ZnO-based materials from cork templates. J. Environ. Chem. Eng. 2019, 7, 102936. [Google Scholar] [CrossRef]
- Stephanie, H.; Mlsna, T.E.; Wipf, D.O. Functionalized biochar electrodes for asymmetrical capacitive deionization. Desalination 2021, 516, 115240. [Google Scholar] [CrossRef]
- Pullar, R.C.; Gil, L.; Oliveira, F.A.C. Biomimetic cork-based CeO2 ecoceramics for hydrogen generation using concentrated solar energy. Cienc. Tecnol. Dos Mater. 2016, 28, 23–28. [Google Scholar] [CrossRef]
- Idrees, M.; Jeelani, S.; Rangari, V. Three-Dimensional-Printed Sustainable Biochar-Recycled PET Composites. ACS Sustain. Chem. Eng. 2018, 6, 13940–13948. [Google Scholar] [CrossRef]
- Wang, Q.; Chu, D.; Luo, C.; Lai, Z.; Shang, S.; Rahimi, S.; Mu, J. Transformation mechanism from cork into honeycomb–like biochar with rich hierarchical pore structure during slow pyrolysis. Ind. Crops. Prod. 2022, 181, 114827. [Google Scholar] [CrossRef]
- Zhai, W.; Zhong, Y.; Xu, M.; Wei, X.; Cai, L.; Xia, C. Transforming wastes into functional materials: Natural cork-based physical structural components and polymers. Green Chem. 2024, 26, 8615–8641. [Google Scholar] [CrossRef]
- Wang, Q.H.; Lai, Z.Y.; Mu, J.; Chu, D.M.; Zang, X.R. Converting industrial waste cork to biochar as Cu (II) adsorbent via slow pyrolysis. Waste Manag. 2020, 105, 102–109. [Google Scholar] [CrossRef]
- Zhang, F.; Zhu, L.; Li, Z.; Wang, S.; Shi, J.; Tang, W.; Li, N.; Yang, J. The recent development of vat photopolymerization: A review. Addit. Manuf. 2021, 48, 102423. [Google Scholar] [CrossRef]
- Mendes-Felipe, C.; Oliveira, J.; Etxebarria, I.; Luis Vilas-Vilela, J.; Lanceros-Mendez, S. State-of-the-Art and Future Challenges of UV Curable Polymer-Based Smart Materials for Printing Technologies. Adv. Mater. Technol. 2019, 4, 1800618. [Google Scholar] [CrossRef]
- D638-22; Standard Test Method for Tensile Properties of Plastics. ASTM International: West Conshohocken, PA, USA, 2022.
- E1350-23; Standard Guide for Testing Sheathed Thermocouples, Thermocouple Assemblies, and Connecting Wires Prior to, and After Installation or Service. ASTM International: West Conshohocken, PA, USA, 2023.
- D257-21; Standard Test Methods for DC Resistance or Conductance of Insulating Materials. ASTM International: West Conshohocken, PA, USA, 2021.
- E1530-25; Standard Test Method for Evaluating the Resistance to Thermal Transmission by the Guarded Heat Flow Meter Technique. ASTM International: West Conshohocken, PA, USA, 2025.
- Jankovic, B.; Manic, N.; Stojiljkovic, D. The gaseous products characterization of the pyrolysis process of various agricultural residues using TGA-DSC-MS techniques. J. Therm. Anal. Calorim. 2020, 139, 3091–3106. [Google Scholar] [CrossRef]
- Zhao, S.H.; Luo, Y.H.; Zhang, Y.L.; Long, Y.F. Experimental Investigation of Rice Straw and Model Compound Oxidative Pyrolysis by in Situ Diffuse Reflectance Infrared Fourier Transform and Coupled Thermogravimetry-Differential Scanning Calorimetry/Mass Spectrometry Method. Energy Fuels 2015, 29, 4361–4372. [Google Scholar] [CrossRef]
- Nan, N.; DeVallance, D.B.; Xie, X.; Wang, J. The effect of bio-carbon addition on the electrical, mechanical, and thermal properties of polyvinyl alcohol/biochar composites. J. Compos. Mater. 2016, 50, 1161–1168. [Google Scholar] [CrossRef]
- Jiang, F.; Drummer, D. Curing Kinetic Analysis of Acrylate Photopolymer for Additive Manufacturing by Photo-DSC. Polymers 2020, 12, 1080. [Google Scholar] [CrossRef]
- De Leon, A.S.; Molina, I.S. Influence of the Degree of Cure in the Bulk Properties of Graphite Nanoplatelets Nanocomposites Printed via Stereolithography. Polymers 2020, 12, 1103. [Google Scholar] [CrossRef]
- Sekmen, K.; Rehbein, T.; Johlitz, M.; Lion, A.; Constantinescu, A. Thermal analysis and shrinkage characterization of the photopolymers for DLP additive manufacturing processes. Contin. Mech. Thermodyn. 2024, 36, 351–368. [Google Scholar] [CrossRef]
- Guo, Y.; Ruan, K.; Shi, X.; Yang, X.; Gu, J. Factors affecting thermal conductivities of the polymers and polymer composites: A review. Compos. Sci. Technol. 2020, 193, 108134. [Google Scholar] [CrossRef]
- Mousavi, S.R.; Estaji, S.; Kiaei, H.; Mansourian-Tabaei, M.; Nouranian, S.; Jafari, S.H.; Ruckdäschel, H.; Arjmand, M.; Khonakdar, H.A. A review of electrical and thermal conductivities of epoxy resin systems reinforced with carbon nanotubes and graphene-based nanoparticles. Polym. Test. 2022, 112, 107645. [Google Scholar] [CrossRef]
- Mingo, N.; Esfarjani, K.; Broido, D.; Stewart, D. Cluster scattering effects on phonon conduction in graphene. Phys. Rev. B 2010, 81, 045408. [Google Scholar] [CrossRef]
- Chen, Q.; Yang, K.; Feng, Y.; Liang, L.; Chi, M.; Zhang, Z.; Chen, X. Recent advances in thermal-conductive insulating polymer composites with various fillers. Compos. Part A Appl. Sci. Manuf. 2024, 178, 107998. [Google Scholar] [CrossRef]
- Ali, Z.; Yaqoob, S.; Yu, J.; D’Amore, A. Critical review on the characterization, preparation, and enhanced mechanical, thermal, and electrical properties of carbon nanotubes and their hybrid filler polymer composites for various applications. Compos. Part C Open Access 2024, 13, 100434. [Google Scholar] [CrossRef]
- Zhang, Q.; Wang, J.; Zhang, B.Y.; Guo, B.H.; Yu, J.; Guo, Z.X. Improved electrical conductivity of polymer/carbon black composites by simultaneous dispersion and interaction-induced network assembly. Compos. Sci. Technol. 2019, 179, 106–114. [Google Scholar] [CrossRef]
- Chen, J.; Gao, X.; Song, W. Effect of various carbon nanofillers and different filler aspect ratios on the thermal conductivity of epoxy matrix nanocomposites. Results Phys. 2019, 15, 102771. [Google Scholar] [CrossRef]
- Tessema, A.; Zhao, D.; Moll, J.; Xu, S.; Yang, R.; Li, C.; Kumar, S.K.; Kidane, A. Effect of filler loading, geometry, dispersion and temperature on thermal conductivity of polymer nanocomposites. Polym. Test. 2017, 57, 101–106. [Google Scholar] [CrossRef]
- Das, O.; Sarmah, A.K.; Bhattacharyya, D. Biocomposites from waste derived biochars: Mechanical, thermal, chemical, and morphological properties. Waste Manag. 2016, 49, 560–570. [Google Scholar] [CrossRef]
- Mozrall, A.M.; Hernandez-Charpak, Y.D.; Trabold, T.A.; Diaz, C.A. Effect of biochar content and particle size on mechanical properties of biochar-bioplastic composites. Sustain. Chem. Pharm. 2023, 35, 101223. [Google Scholar] [CrossRef]
- Girdthep, S.; Komrapit, N.; Molloy, R.; Lumyong, S.; Punyodom, W.; Worajittiphon, P. Effect of plate-like particles on properties of poly(lactic acid)/poly(butylene adipate-co-terephthalate) blend: A comparative study between modified montmorillonite and graphene nanoplatelets. Compos. Sci. Technol. 2015, 119, 115–123. [Google Scholar] [CrossRef]
- Tavares, L.; Sousa, L.R.; da Silva, S.M.; Lima, P.S.; Oliveira, J.M. Effect of Incorporation of Graphene Nanoplatelets on Physicochemical, Thermal, Rheological, and Mechanical Properties of Biobased and Biodegradable Blends. Polymers 2023, 15, 3622. [Google Scholar] [CrossRef] [PubMed]
Disclaimer/Publisher’s Note: The statements, opinions and data contained in all publications are solely those of the individual author(s) and contributor(s) and not of MDPI and/or the editor(s). MDPI and/or the editor(s) disclaim responsibility for any injury to people or property resulting from any ideas, methods, instructions or products referred to in the content. |
© 2025 by the authors. Licensee MDPI, Basel, Switzerland. This article is an open access article distributed under the terms and conditions of the Creative Commons Attribution (CC BY) license (https://creativecommons.org/licenses/by/4.0/).