1. Introduction
With the increasing development in coal mining to deep rock masses, the strong dynamic impact disasters of surrounding rock caused by deep mining are increasingly serious. Coal burst is a dynamic phenomenon that occurs when the elastic strain energy within coal mass is suddenly released due to the combined influence of static and dynamic stresses. The phenomenon is a significant challenge in underground mine engineering worldwide [
1,
2,
3]. By February 2023, 150 underground coal mines distributed in 15 provinces and autonomous regions have suffered severe coal bursts in China [
4]. Several severe coal bursts were caused by hard roof. The hard roof can facilitate the likelihood of rock burst from the dynamic and static loads [
5,
6,
7]. The problem of rock burst along the gob-side roadway is particularly prominent under hard roof conditions. As a result, it is essential to conduct thorough research into the mechanisms and prevention measures for this problem.
In recent years, many theoretical and numerical simulation studies have been conducted on the mechanism of mine pressure occurrence and pressure relief along the gob-side roadway. Zhai et al. [
8] conducted a study on the problem of large deformation along the gob-side entry during working face extraction, and the application of carbon dioxide phase-change fracturing (L-CO2) in the roof cutting was put forward. To address the issue of rock burst in deep multi-pillar gob-side roadways, Pan et al. [
9] developed a stress source structure model with “F-shaped” and “L-shaped” structures and explained the mechanisms behind rock burst occurrences. Mu et al. [
10] developed a stress model for the quantitative calculation of stress and deformation along the gob-side entry under an overburdened coal pillar and verified its accuracy. Xie et al. [
11] investigated the influence of coal–rock parameters on the integrity of the surrounding rock and proposed a scheme to maintain the stability of the coal pillar through asymmetric support structure. Zhang et al. [
12] systematically investigated the mining pressure characteristics above the gob-side entry during the first mining and secondary mining period. Shi et al. [
13] combined physical model tests and numerical simulation to investigate the crack propagation mechanisms of the gob-side roadway under different states, and obtained the movement laws, failure mechanisms and crack evolution laws of the roof above the gob-side roadway in a thick coal seam. Wu et al. [
14,
15] examined the stress characteristics of the gob-side entry under different pressure relief layout conditions, and proposed an optimal layout plan for prefabricated cutting lines. In addition, an optimized supporting structure scheme was proposed through similar simulation tests and FLAC3D numerical simulation analysis. Wang et al. [
16] developed dynamic pressure along the gob-side roadway overburden structure model and investigated the relationships between the immediate roof parameters and the integrity of the gob-side roadway. Chang et al. [
17] analyzed the characteristics of lateral abutment pressure and propagation of plastic zone in goaf and identified the deformation patterns of the gob-side roadway in the process of excavation. Yang et al. [
18] conducted an irregular “umbrella-shaped” coal pillar, simulated the stress and displacement along the gob-side roadway during the extraction of coal pillar by utilizing FLAC3D and revealed the stress distribution law under the “umbrella-shaped” coal pillar. Zhang et al. [
19] carried out the mechanical structure model of surrounding rock theoretically and studied the changing characteristics of the stress of roof and surrounding rock under the influence of the periodic movement of overlying rock and mining disturbance. They obtained the mechanism of pressure relief under roof cutting and the spatio-temporal development law of stress of surrounding rock along the gob-side roadway. Considering the current situation of serious asymmetric deformation and failure of the gob-side roadway under fully mechanized coal mining, Xu et al. [
20] revealed the failure mode through FLAC3D and field tests.
The key to prevent roadways from rock burst is to weaken its roof structure. Currently, the most commonly employed techniques are deep-hole blasting and hydraulic fracturing [
21,
22]. Both techniques can create a so called weakening zone over the roadway. This zone, depending on the damage intensity, attenuates an elastic wave propagation which reduces a dynamic load, possible roadway contour displacements and finally—any damage, especially if caused by strong mining tremors [
23]. Among the aforementioned methods, deep-hole blasting (DHB) of the hard roof is typically selected as a necessary pressure reduction measure for explosive rock coal mines due to its cost-effectiveness and suitability for complex downhole conditions [
24].
Recently, the utilization of DHB technology in engineering projects has prompted scholars at home and abroad to undertake fruitful research. Banadaki et al. [
25] investigated the crack expansion pattern of rocks under the induced effect of blast stress waves by laboratory scale single hole blasting experiments. Wang et al. [
26] studied the fracture range affected by high-energy blasting stress waves by finite element software LS-DYNA, which revealed that the mechanism of roof blasting can control the roof collapse. Konicek et al. [
27] implemented the deep-hole roof pre-cracking blasting for the No. 504 coal seam at Lazy coal mine, and put forward the corresponding evaluation indexes of the effect of unloading blasting as well as grading standards. Wu et al. [
28] revealed the movement behavior of the overburden and the mechanism of de-stressing of working faced by DHB. Wojtecki et al. [
29] applied the seismic effects method to assess the effectiveness of long-hole de-stressing blasting in underground hard coal mines. Li et al. [
30] studied the formation of the crushed zone and the progression of cracks under the combined static and dynamic pressure generated by DHB. Kan et al. [
31] examined the factors influencing the peak particle velocity (PPV) resulting from roof pre-splitting blasting and developed a predictive algorithmic model to enhance the accuracy of forecasting PPV induced by blasting.
It can be seen that many researchers have made significant contributions to the mechanism of pressure relief along the gob-side roadway by blasting. However, the transformation of the overburden on the gob-side roadway before and after blasting, the decompression mechanism and effect of blasting remain insufficiently studied. This paper presents a theoretical analysis and subsequent verification through physical experiments, numerical simulation and field practice to assess the effectiveness of the modified pressure relief achieved by blasting in hard roof. The findings of this study could offer both theoretical insights and practical guidance for preventing rock burst in similar geological settings.
2. Geological Overview
The Shilawusu coal mine, located in Ordos, China, is divided into three mining areas: 221, 222 and 223. The coal seams are 2-2 seams, which are mined via strip arrangement in the main roadway, descending mining, backward mining, integrated mining and the fully caving coal mining method to manage the roof. The eastern side of the 22108 workface is the designed 22110 workface (not mined), the southern side of the western side is solid coal, and the northern side of the western side is the 22106A workface mining area. The southern side is situated 353 m from the coal pillar protection of the PG-17, DPS-72 and D12-1 oil and gas wells, while the northern side is 300 m from the coal pillar protection along the roadway. The advancing length of the face is 289 m in length, with a total advance of 3243.7 m, including the 3233.7 m auxiliary transportation roadway. The length of the face is 289 m, the advancing length is 3243.7 m and the auxiliary transportation length is 3233.7 m, resulting in an average length of 3238.7 m. The surface area of the working face is 935,984.3 m2, with elevations ranging from 685.4 to 697.8 m, averaging 691.6 m. The elevation of the ground above the face ranges from 1337.9 to 1355.9 m, averaging 1346.9 m. During the mining period, a series of micro-seismic events occurred within the goaf. Additionally, notable deformations were detected in the coal pillars along the gob-side roadway, significantly affecting production safety. Therefore, it is crucial to examine the decompression mechanism to ensure operational safety.
The layout of the 21108 working face and lithology information is shown in
Figure 1 and
Table 1.
3. Mechanism of Pressure Relief Caused by Roof Cutting
Based on the key stratum principle, the excavation of adjacent long-wall panels induces characteristic “O-X” fracturing patterns, as depicted in
Figure 2a. At the end of the long-wall face, an “arc-shaped triangular block” is generated referred to as the key block (Block B in
Figure 2b). As the coal seam is mined, the immediate roof experiences irregular breakage and sagging, separating from the main roof above. Once the overburden strata stabilize, the main roof assumes a hinged structure composed of blocks A, B and C.
The coal pillar is located beneath the cantilever beam. The long, thick cantilever typically results in deformation of the roadway. Therefore, block B is very important for the stability of the roadway structure, which can be defined as including three basic dimensions: the lateral rift size (
D), the periodic weighting length (
L) and thickness of the block B (
h), with their interrelationship quantitatively described by the following empirical formulation [
32].
The force of block B is calculated and the structural diagram is depicted in
Figure 3, presuming that the uniform roof load is
q1, the distributed coal load is
σy and the supporting resistance
P2 acts at
x0 (where
s <
x0 <
s +
a).
The stress equilibrium zone for the coal rib (
s) and
σy can be defined as [
33]
where
P0 is the support strength [Pa] of the coal pillar;
φ0 is the internal friction angle;
A1 is lateral pressure coefficient;
γ is the average unit weight of overlying layers [N/m
3];
k is the stress concentration factor;
H is the mining depth [m];
m is the mining height [m];
c0 is the cohesion [Pa].
The moment balance is applied at point A
Thus, can be obtained
among them
and
For rectangular roof cross-section elements per unit width (
b = 1 m), assuming cantilever tension there are:
where
Rt is the tensile strength (Pa).
The ultimate bending moment of the main roof lateral suspension cantilever is
Mmax, From
M1 ≤
Mmax, we can obtain
The lateral cantilever beam length (l) of the roof exhibits a positive correlation with the released coal pillar pressure during roof failure. Strategic control of roof fracture dimensions through precision blasting techniques enables significant pressure mitigation in the coal pillar.
After deep-hole blasting in block B, the blast-induced fracturing creates a crushed zone surrounding boreholes, facilitating stress migration towards deeper strata and consequently, reducing effective stress concentrations. At the same time, detonation waves propagate through the medium, generating systematic crack networks that enable the hard roof to break along the cutting roof line in time reducing the range of suspended roof l. To sum up, the blasting could effectively promote pressure relief.
4. Numerical Simulation Analysis on Roof Blasting Pressure Relief
4.1. Modelling
The UDEC software UDEC 7.0 software was employed to construct a two-dimensional model for analyzing roof structural behavior and dynamic stress redistribution mechanisms within roadway during pre- and post-blasting phases. The simulation framework was geometrically calibrated based on the actual geological configuration of the Shilawusu 21108 working face with dimensional parameters of 250 m (X-axis) × 132 m (Z-axis), as illustrated in
Figure 4.
The simulation protocol was sequentially executed through four operational phases mirroring actual mining sequences: (1) geostress equilibration phase, (2) progressive excavation, (3) goaf formation and (4) controlled roof fracturing via blasting. The process of simulating the roof cutting by blasting based on the following steps involved determining the location, dip angle, thickness, length and other parameters of the structural plane, setting up the structural plane and meshing the model in advance and assigning relatively low joint parameters to make it prone to sliding or cracking under the influence of stresses.
4.2. Boundary Conditions
The model’s left and right boundaries were constrained for displacement in the X-direction; the bottom boundary was fixed for vertical displacement in the Z-direction and the upper boundary was free with a 12.5 MPa vertical stress. The model was divided by triangular elements with 0.75 m sides and 0.3 m in the area of interest. The remainder of the model domain was discretized into the progressively larger rectangular block.
The Mohr–Coulomb model was applied to all lithology, while the Coulomb sliding model was used to represent the constitutive behavior of the joints. The stratification and mechanical parameters were finally determined with reference to the comprehensive geological column map of the mine and the geological drilling data. The physical and mechanical properties of each lithology used in the numerical simulation are presented in
Table 2.
4.3. Results and Analysis
The values of stress and displacement were obtained by monitoring measurement points set up around the roadway. The vertical stress and displacement cloud maps calculation to equilibrium before and after blasting was applied is illustrated in
Figure 5.
From
Figure 5a, the main roof’s overhang remained relatively intact prior to the roof cutting, and there was a stress concentration area above the coal pillar diagonally.
The vertical displacement deformation of the 21108 gob-side roadway after excavation and calculation to equilibrium is shown in
Figure 5b. It illustrates that the displacement of the roof was larger above the coal pillar; the displacement of the main roof above the solid coal area was basically 0. The large deformation was produced on the coal pillar and irregular deformation was produced along the gob-side roadway, and furthermore, the displacement of the side of the coal pillar was obviously larger than the deformation of the solid coal side.
Figure 5c shows delineated equilibrated vertical stress distribution post-blasting. It demonstrates that a stress concentration area was observed above the coal pillar, but was still less than the stress prior to blasting. Compared with
Figure 5b, it is evident that the stress in the range of the main roof breakage blasting was reduced due to blasting, resulting in a reduction in the stress in the solid coal area. The coal pillar exhibited negligible stress redistribution due to persistent structural coupling between the fragmented roof margin and the pillar geometry.
The vertical displacement increment following blasting is illustrated in
Figure 5d. Comparing the vertical stress cloud map prior to roof cutting, the main roof of the broken blasting range due to parameter weakening and deformation increased, the coal pillar produced large deformation. Irregular deformation was observed along the gob-side roadway, with the coal pillar side experiencing noticeably greater deformation than the solid coal side.
Figure 5 demonstrates that the blast-induced fracture zone laterally exceeded the coal pillar’s dimensions. The pillar deformation was diminished and stress transfer mechanisms to adjacent coal seams were attenuated, thereby achieving a substantial mitigation of peak stress concentrations within the solid coal side.
Figure 6 illustrates the vertical stress value at varying distances along the gob-side roadway both before and after blasting. It is evident that the peak stress in the coal seam decreased by 3.54 MPa, from 24.23 to 20.69 MPa, respectively, with the peak stress situation occurring at a depth of 9 m and 15 m, respectively, so the place where a peak stress occurs was transfered deeper into the rock body by 6 m. Hence, it can be seen that blasting can mitigate the likelihood of a rock burst by moving a stress concentration from the vicinity of a gob side roadway deep to the solid side of intact coal. Furthermore, a reduction of 3.54 MPa in stress significant under real mining conditions significantly lowers the peak static load stress in the coal body of an adjacent goaf roadway and enhances the surrounding rock stress environment, thereby decreasing the likelihood of a rock burst. The recorded displacement data and trends are displayed in
Figure 7. When blasting was not carried out, the cantilever rock block exerted a loading effect on the solid coal in the gob-side roadway. The roof, coal pillar and solid coal all have formed large deformation, and the maximum displacement was 9.5, 10.8 and 4 cm, respectively. After roof pre-splitting blasting, the structural continuity between the lower cantilevered rock mass and the gob-side roadway roof was disrupted, the cantilever length of the key layer in the middle and high level was shortened and the monitoring data after blasting exhibited respective reductions of 6.5 cm, 2 cm and 3 cm in maximum displacement values for the roof, coal pillar and solid coal side, respectively.
5. Physical Model Experiment on Roof Blasting Pressure Relief
5.1. Experiment Steps
To investigate the mechanism and effect of blasting pressure relief, the 22108 working face was selected as a prototype, and the geological section per unit length along the strike direction was chosen for modelling. The stratified structure of the model was formed through the utilization of fine river sand as the aggregate material, with gypsum and calcium carbonate being adopted as binding components, while mica particles were strategically incorporated to replicate bedding planes. In selecting the parameters of the model, the uniaxial compressive strength was identified as the primary analogous physical quantity, with the similarity of other physical quantities also being a requisite. In accordance with the analogous proportion of the model coal–rock layer, the entire layer was constructed. Following the consolidation of the simulated rock layer, a period of 7–10 days was allowed for drying. Subsequently, the coal–rock layer was subjected to the application of boundary stress, while observation lines and points were established concurrently.
This experimental study was implemented on a planar testing device (2500 mm length × 160 mm width × 1900 mm height) at China University of Mining and Technology, utilizing a plane strain simulation configuration. Boundary constraints were imposed on the lateral and basal surfaces of the physical model, while the upper interface was maintained in an unconstrained state throughout the testing process. In accordance with the three theorems of similarity, the four principles that underpin the physical similarity simulation test have been established. They were the geometric similarity principle, the physical similarity principle, the stress similarity principle and the time similarity principle. The scaling ratio critically influenced the experimental results by affecting the model’s ability to replicate the prototype’s complex structures and stress distribution. A smaller scaling ratio (e.g., 1:200) may fail to accurately reflect intricate details like fractures or bedding planes, leading to discrepancies in roof failure mechanisms and stress patterns. Additionally, the scaling ratio impacts the model’s layer thickness design, where excessively thin or thick layers can alter material density and deformation behavior. Moreover, the scaling ratio affects the strength and deformation properties of similar materials, and improper selection may cause significant deviations in the stress–strain relationship, undermining the model’s ability to accurately simulate real-world mining conditions. Based on this, the geometric similarity ratio, density similarity ratio and strength similarity ratio of the physical model were set to 100, 1.5 and 150, respectively. The dimensions of the model were calculated, and the material quantities in each stratum were determined. The proportions of materials used for model building are presented in
Table 3. The layout of the physical model and the location of stress monitoring are illustrated in
Figure 8.
During the construction of the model, the floor was simplified. The height of the model was 1 m. The overburden rock layer was simulated with a height of 100 m, and the remaining overburden rock was created by uniformly applying stress. The model was constructed with a 10 cm × 10 cm grid format comprising 14 rows and 24 columns of displacement measurement points, with a total coal seam thickness of 6.5 cm. A 40 cm protective coal pillar was designed at the left end of the model, and the model was excavated initially to a depth of 5 cm to serve as the roadway on the 22108 working face. In accordance with construction parameters of roof cutting in the engineering field, a roof cutting surface with an inclination angle of 80° and a length of 8 cm was pre-set at the boundary of the return roadway. The model was then excavated in a single step.
Pressure capsules were set to carry out real-time observation of the vertical stresses in the floor of a coal seam in front of the workings, the floor of the mining area and the side of a coal pillar along the gob-side roadway when mining. In the floor layer 10 mm below the coal seam, a total of 10 pressure capsules numbered 1# to 10# with a spacing of 25 cm were laid in sequence, as illustrated in
Figure 8. The capsules positioned on the coal seam floor near the roadway were labeled 1# to 2#; the capsules from 3# to 9# were located in the floor of the goaf, while 10# sensor was positioned on the coal seam floor after mining ceased. Stress monitoring readings were taken directly from the instrument.
5.2. Experiment Results and Analysis
During the mining process, the collapse of the immediate roof occurred 110 cm from the initial working face. In addition, as the advancing distance increased, the breaking movement of the immediate roof gradually extended to the upper position, as shown in
Figure 9.
The lower immediate roof collapsed in a mess on the floor, as illustrated in
Figure 9a. Following the breakage of the upper portions of hard roof 1, as the working face continued to advance, the micro fissures developed on the immediate roof and its overlying rock stratum. The development of micro-fractures after the effect of mining influence was coherent, and the internal structure was more fragmented. The main roof began to move periodically with the height of the overburden rock fractured zone increasing upward as the mining continued. At 130 cm, the separation fracture developed to hard roof 2. The barrier of hard roof 2 temporarily inhibited the vertical development of the fracture. Subsequently, following the fracturing of the rock layers below hard roof 2, a fracture line, with a certain angle exhibiting a bias towards the mining zone, was formed. The overburden strata formed a stable “ladder” type structure, as illustrated in
Figure 9b.
When excavating to 150 cm, the hanging roof area of hard roof 2 reached the limit collapse distance, the cantilever beam structure was unstable and collapsed. With the advancement of mining, the height of collapse rose, and the rotary space of hard roof 2 increased. As demonstrated in
Figure 9c, the rotary space expanded as excavation progressed, causing the voussoir beam structure to destabilize.
Figure 9d illustrates that as mining continued, the collapsed rock formed an effective filling support in the goaf, which mitigated the impact power and energy of the collapse. Furthermore, the articulation of overburden strata reduced stress concentration between the roof and its overlying rock layer on the unbroken side.
Figure 10 delineates the distribution of overburden strata fissures following the excavation. It is evident that the fissures exhibited a discernible spatial distribution pattern within the goaf. The separation area and compacted area are affected by coal pillar abutment pressure. The height of the caving zone at the broken side was 100 cm, and the height of the fractured zone was 130 cm; the fissures between hard roof 1 and hard roof 2 were essentially undeveloped, with only a few minor fissures presented above hard roof 2. The caving zone at the unbroken side measured 30 cm in height, while the width of the fractured zone was continuously expanding with the excavation process, reaching a maximum width of 200 cm. The caving zone elevation on the broken side was 3.3 times that observed on the unbroken side, while the elevation of the fractured zone was 0.52 times. It meant that the implement of blasting technology can diminish the stress concentration around the roadway by increasing the height of the collapse zone.
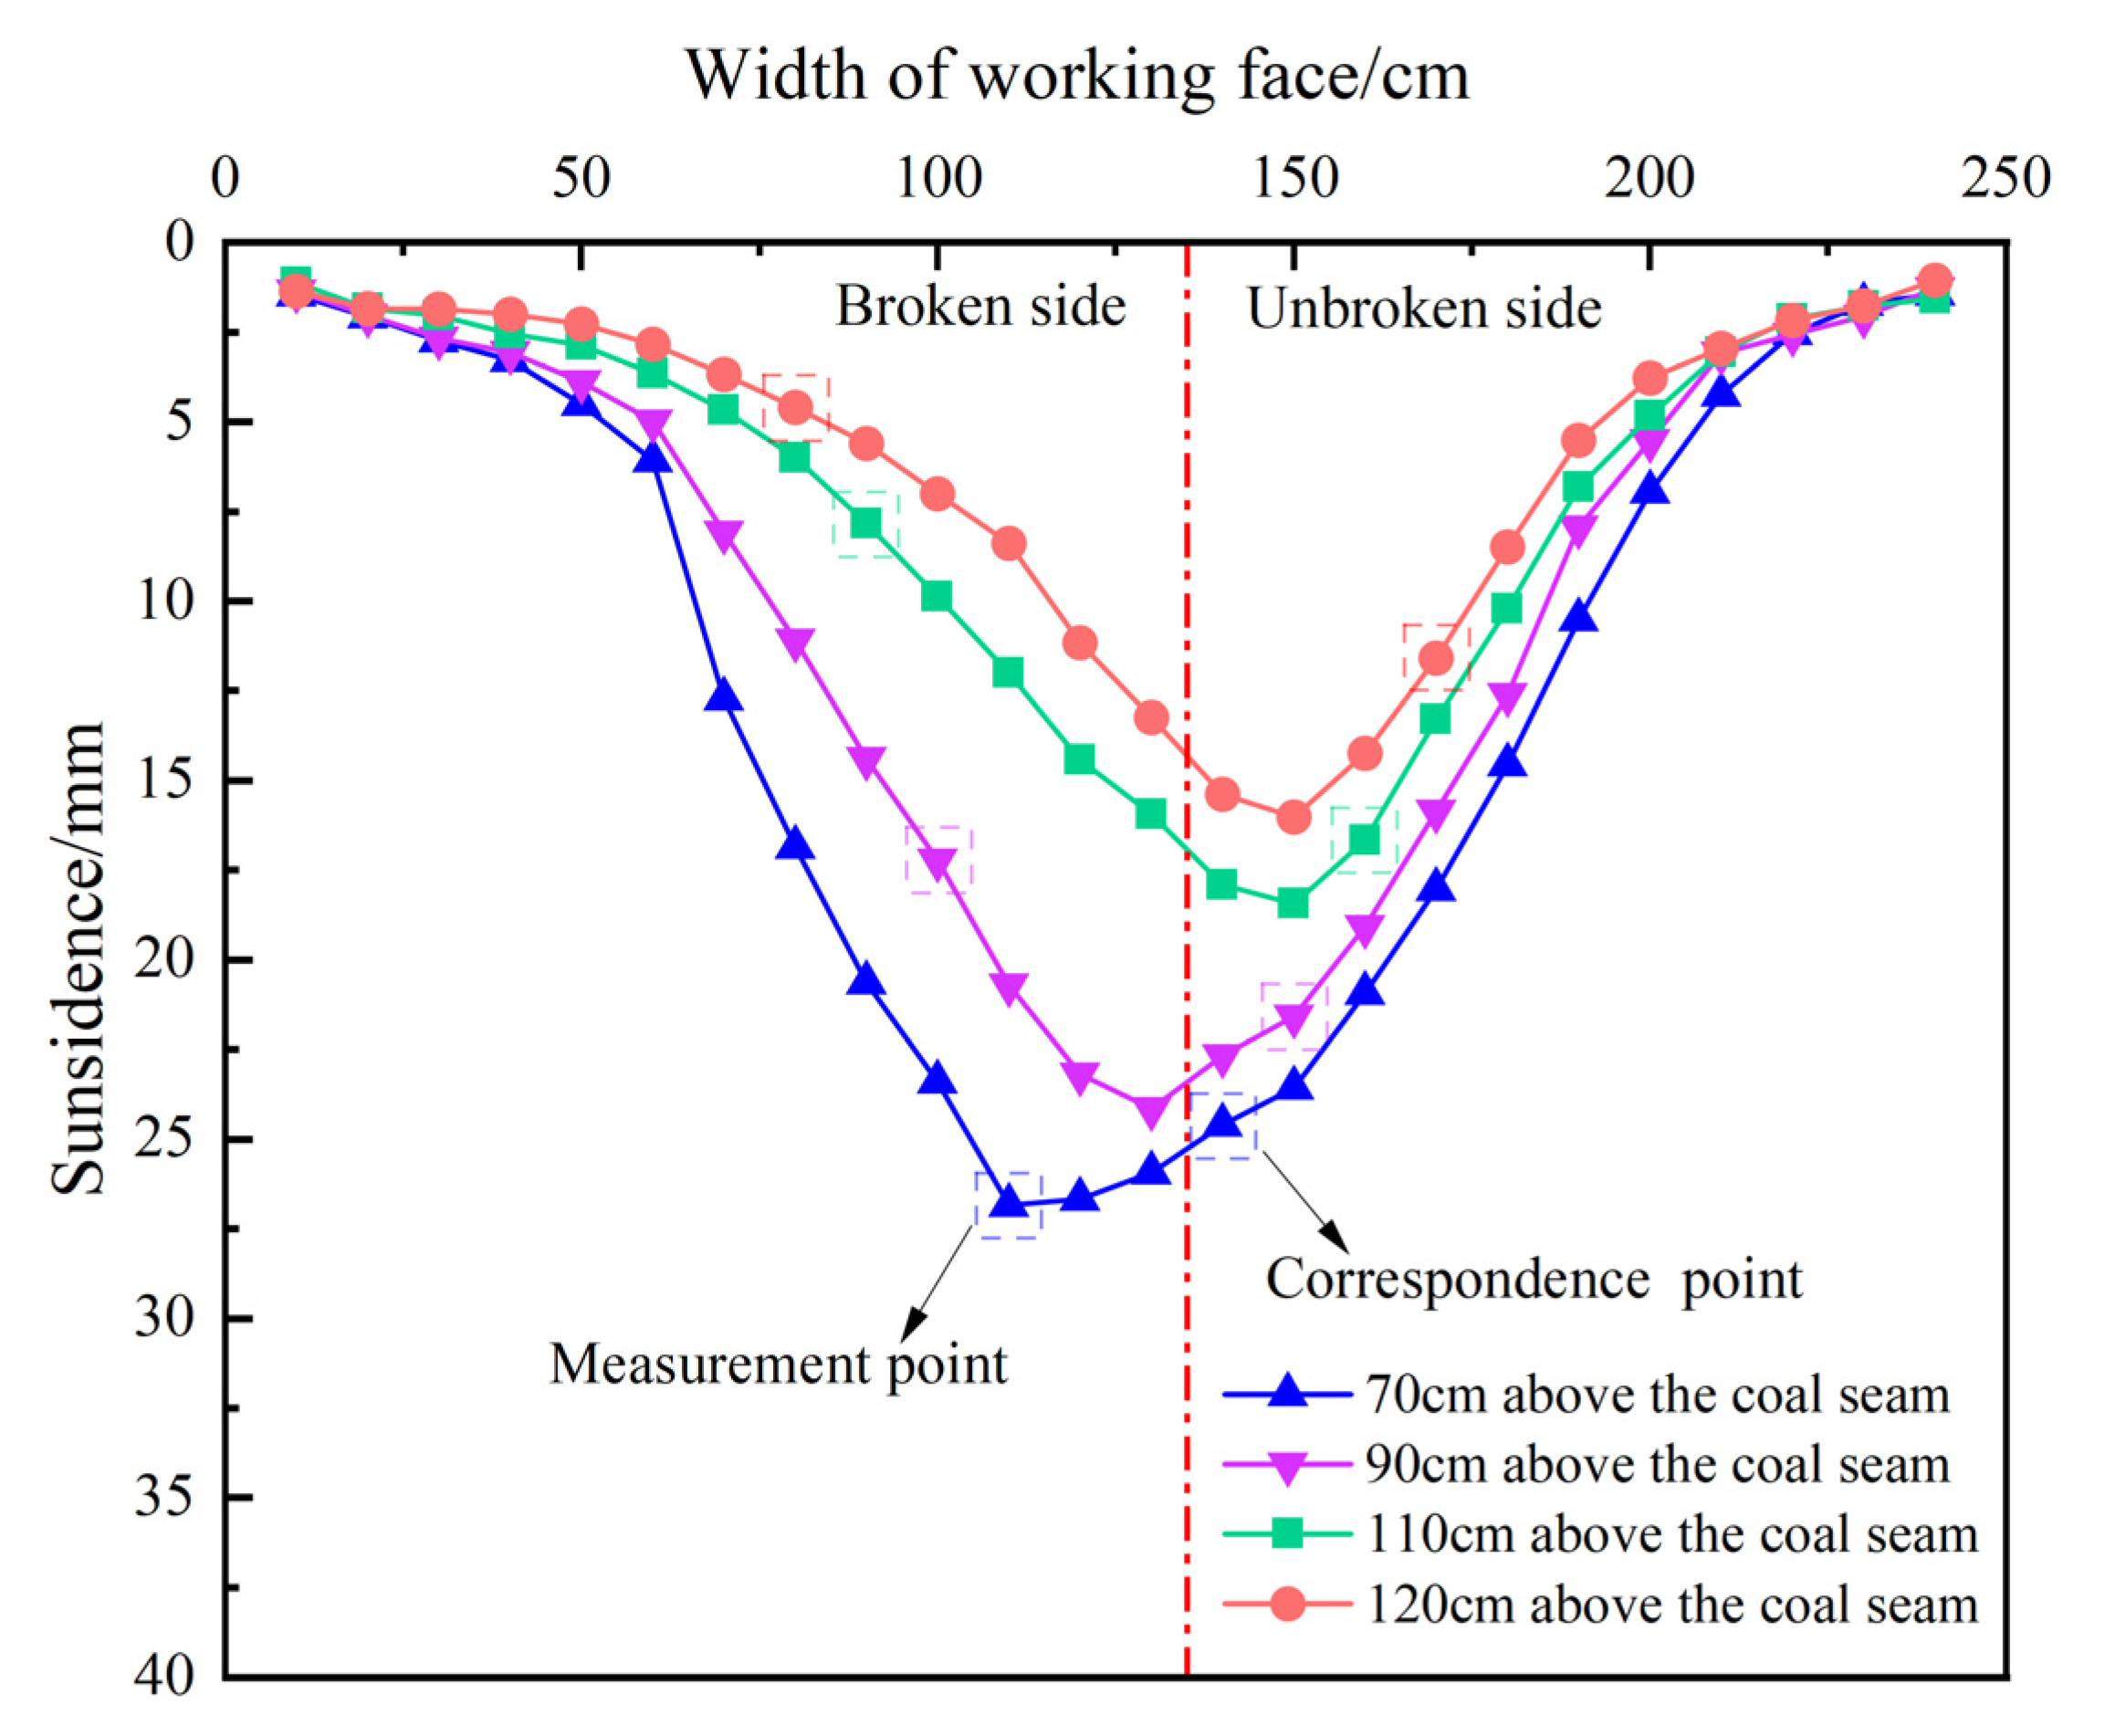
To compare the roof displacement on the side of the cut roof and the uncut roof, survey lines were arranged every 10 cm at close distance and every 20 cm at long distance above the coal seam of the physical model. There were 14 survey lines in total. Measuring points were arranged every 10 cm on the survey line. The high-resolution SLR camera (Canon EOS70D, Tokyo, Japan) equipped in the three-dimensional static deformation measurement system was used to record the experimental model from multiple angles. After the recording was completed, the pictures were imported into the computer for processing. Due to the movement of the overlying strata, the subsidence of each measuring point was discontinuous. The data of 4 measuring lines arranged at 70 m, 90 cm, 110 cm and 120 cm away from the coal seam were selected to draw the final subsidence curve in
Figure 11 and
Figure 12.
It is evident that the subsidence curve of the overburden strata was asymmetrical, and the rock layer within 90 cm above the simulated coal seam (the layer above hard roof 2) was used as the dividing line. The movement of the overburden strata showed obvious regional characteristics. Among them, within 90 cm above the simulated coal seam, the overburden strata subsidence was obvious due to the influence of mining (as shown by the survey lines at 70 cm and 90 cm in the figure); while the subsidence of the strata above hard roof 2 was relatively small, and when it reached 120 cm above the coal seam, it was mainly slightly separated with unobvious subsidence.
As mining continued, the subsidence of the upper measuring points gradually decreased. The 70 cm and 90 cm survey subsidence lines of the measuring points on the side of the cut roof was greater than that on the side of the uncut roof, while the 110 cm and 120 cm survey subsidence of the measuring points on the side of the cut roof was smaller than the other side. The fissures amount developed on the cutting roof side was larger than that on the uncut roof side in the range of 0–90 cm from the roof, while the uncut roof side was larger in the range of more than 110 cm.
The mining of coal can cause advanced abutment pressure in the working face, leading to displacement of the roadway and change in the mine pressure borne by the coal. To compare the changes in abutment pressure in coal on the side of the cut roof and the uncut roof, the abutment pressure distribution curve was obtained from pressure capsules (1#~10#) at the seam floor position. It is shown in
Figure 13.
As displayed in
Figure 13, the abutment pressure distribution curve exhibited a “single-peak” shape. The abutment pressure increased monotonically with the excavation length. Once the peak value was reached, the abutment pressure decreased steadily, gradually returning to the in situ stress state, while the vertical stress remained relatively constant. The stress increased significantly when blasting was applied to the cut roof. After stabilization, it became evident that the stress on the broken side was lower than on the unbroken side. The roof cutting surface disrupted the rock mechanical system structure between the roof and the working face, leading to the stress not being directly redirected to the coal seam.
6. Field Application
The drilling method was employed to show the difference in rock stress before and after blasting works. To assess blasting effectiveness on the gob-side roadway, two test areas were designed during mining. The tests in area 1 was carried out before blasting, and in area 2, after blasting. The vertical height of the blasting was set at 30 m, with an angle of 80°. The layout of blasting and tested areas is illustrated in
Figure 14.
6.1. Drilling Method
The drilling test was carried out in 16 monitoring holes at two distances to the stopping line before and after blasting: 20–57.5 m and 70–107.5 m.
Figure 15 and
Figure 16 show the change in drilling powder weight with a drilling depth. As shown in the figures, the total drilling powder weight after blasting compared to before blasting decreased by about 1.45–31.8%, depending on the distance to the rib. The average amount of drilling powder decreased by about 1.30–22.7%. It can be observed that following the implementation of blasting, the total and average drilling powder weight from the 22108 working face along the gob-side roadway exhibited a notable decline. It can be noticed that the highest difference is at the depth of 16 m where the coal is intact and solid and the stress higher. This indicated that the utilization of blasting techniques can effectively mitigate the stress concentration and the potential risk of a rock burst.
6.2. Micro-Seismic Monitoring
The mining period before cutting roof was from 26 September 2023 to 17 October 2023, with a cumulative total of 22 days of mining. The mining time after cutting roof was from 18 October 2023 to 8 November 2023, with a cumulative total of 22 days of mining. Two areas (I and II) in a rock mass were selected for seismic monitoring to control the effect of different blasting solutions by micro-seismic analysis. A comparison comprised the total daily energy, maximum daily energy and total daily number of seismic events. In light of these findings, an in-depth examination was conducted to elucidate the distribution pattern of micro-seismic frequency before and after roof cutting. This entailed the calculation of the percentage of micro-seismic events occurring at different energy levels. The results are presented in
Figure 17 and
Table 4.
Figure 17a,b illustrates that the total energy after cutting roof went through three half-cycles, with a maximum daily total energy of 60,309 J. In contrast, the daily total energy before cutting roof experienced two cycles, with a maximum daily total energy of 57,400 J. Consequently, the change in the daily total energy indirectly reflected a reduction in the step of the periodic pressure after cutting roof, which was conducive to the prevention and control of rock burst. The overall change in the daily maximum energy after cutting roof was stable, with a maximum value of 1.07 × 10
4 J on the seventh day of the mining period. In contrast, the overall change in the daily maximum energy in the experimental area I was more fluctuating, with a maximum value of 1.81 × 10
4 J on the tenth day of mining, representing a 69.2% increase. This suggested that after cutting roof, the fissure of hard roof developed, and there was no longer an overhanging roof, thus significantly reducing the risk of rock burst.
As illustrated in
Figure 17c,d, the total daily frequency after cutting roof was markedly elevated in comparison to the period before cutting roof. The maximum total daily seismic event number after blasting was 114, representing a 35.6% increase relative to the value of 84 before blasting. The cumulative number of micro-seismic events before cutting roof was 887, comprising 685 events of energies 10
2 J, 201 events of energies 10
3 J and 1 event of energy 10
4 J, with a total energy of 693,955 J and an average energy of 782 J. The cumulative number of micro-seismic events after cutting roof was 1182, of which the numbers of seismic events of energies 10
2 J, 10
3 J and 10
4 J were 998, 183 and 1, respectively. The total emitted energy was 707,412 J, with an average energy of 598 J. The total energy released during the mining period increase by 33.3%, but the energy of a single event decreased by 23.5%. This suggested that micro-seismic progresses towards a trend of “high-frequency and low-energy” after the implementation of blasting, thereby reducing the risk of rock burst.
6.3. Stress Distribution
As illustrated in
Figure 18, the S133 and S135 measurement points in area I and the S137 and S139 measurement points in area II were selected for comprehensive comparison; the total stress tendency in area I was more elevated than in area II. The maximum stress value in area I at measuring point S133 was 7.54 MPa, averaging 6.08 MPa. The maximum stress value at measuring point S135 was 6.04 MPa, averaging 5.54 MPa. The maximum value of the stress at measuring point S137 in area II was 5.93 MPa, with an average value of 5.23 MPa. The maximum value of the stress at measuring point S139 was 5.88 MPa, with an average value of 4.93 MPa. Following the implementation of blasting along the gob-side roadway, the corresponding area exhibited a reduction in stress levels.
Figure 19 illustrates the mean stress distribution in areas I and II. The results demonstrated that the overall mining stress in area I was slightly higher than the average stress observed in area II. The highest average stress value was 6.34 MPa in area I and 6.06 MPa in area II. This evidence also corroborated the conclusion that the application of blasting technology could mitigate stress concentration in the coal, thereby substantiating the efficacy of the blasting process.
7. Discussion
7.1. Extended Applications of the Results
(1) Open-off cut inclined roof-breaking blasting: the roof-breaking blasting process could be applied in the open-off cut under the condition of a hard roof. Initially, the goaf roof was supported on two solid coal sides. As mining progressed, the hard roof was resistant to collapse under the ultimate stress. As the suspended roof area expanded, it might have experienced a sudden collapse. To mitigate this risk, roof-breaking blasting was conducted in the open-off cut, causing the roof to collapse early in short-distance mining. This process effectively transformed the roof from a two-side support system to a one-side support system, thereby reducing both the static dynamic load resulting from the initial collapse.
(2) Advanced pre-splitting: after the first caving event in the working face, the goaf roof entered the periodic caving stage. The support for the goaf rock shifted from two sides to one side, causing stress concentration and energy accumulation in the coal seam due to the compression and bending of the overhanging roof. When the stress exceeded the strength limit of solid coal, it fractured and released large energy. The resulting vibrations caused the overhanging roof to oscillate, leading to roof failure and triggering a rock burst. Once the roof’s strength limit was reached, the hard roof fractured and collapsed. The vibration from the collapsing roof generated a dynamic load, impacting the coal body at a high rate, causing rapid fracturing and lateral expansion. To mitigate the impact risk, pre-splitting blasting can be applied to the roof strata before mining.
7.2. The Limitations of the Simulation Results
(1) The UDEC numerical model assumed uniform geological conditions, which may not fully reflect the variability encountered in real-world mining operations. Differences in rock properties, such as strength, fracturing and bedding, can influence the results, and the accuracy of the simulations might vary when applied to different geological environments.
(2) In our study, we used specific parameters tailored to the gob-side roadway conditions. However, these parameters may need adjustments when considering different coal seam types, seam depths or other variations in geological conditions. To further validate the simulation results, it would be essential to compare them with additional field data across diverse mining sites to assess how well the model performs under different geological settings.
7.3. The Analysis Cost-Effectiveness and Feasibility
(1) Cost-effectiveness: the initial investment in blasting equipment and the required safety measures must be balanced against the long-term benefits of improved roadway stability and reduced rock burst risk. While the cost of drilling and blasting operations may vary depending on the roadway size and the coal seam depth, the reduction in roadway deformation and the prevention of rock bursts can result in significant cost savings. These savings can stem from reduced maintenance costs, fewer mine closures due to instability and the prevention of costly damage caused by rock bursts. Additionally, improved worker safety can reduce the financial burden associated with accidents and downtime.
(2) Feasibility: the proposed blasting technique can be implemented in various mining conditions, but its practicality will depend on specific site conditions, such as rock mechanics, coal seam depth and the availability of skilled personnel. In regions with challenging geological conditions, the technique may require additional investments in training, equipment and monitoring to ensure proper execution and safety. Additionally, the blasting parameters would need to be optimized for different mining environments, taking into account the local geology, rock type and seam characteristics to ensure both effectiveness and safety.
8. Conclusions
(1) The roof breaking on the side of the gob-side roadway was analyzed and the mechanism of pressure relief by deep-hole blasting was shown. The analysis proved that after blasting, the layer around a blasting hole is greatly dislocated, the stress balance of the initial state of the roof is destroyed and the stress zone concentration is redirected deep to a rock mass, away from the fractured rock mass. Meantime, the roof along the gob-side roadway can collapse along the cutting roof line what reduces the range of the hanging roof, reduces the additional load and displacement of the roadway.
(2) The UDEC results demonstrated that after blasting, the peak stress in the coal seam decreased by 3.54 MPa, dropping from 39.23 to 35 MPa and a peak stress is transferred 6 m to the depth of a coal body. At the same time, the deformation of the roadway along the gob-side roadway after blasting is reduced, which aids in preserving the stability of roadway.
(3) The experiment results illustrate that the height of the final caving zone on the side of the cut roof was 3.3 times that observed on the side of the uncut roof, while the height of the fractured zone was 0.65 times higher. The movement of the overburden strata showed obvious regional characteristics.
(4) By severing the rock connection between the roof and the working face, the stress from the overburden rock layers in the goaf is unable to be directly transmitted to the coal seam. As a result, the pressure on the side where the roof was cut is lower compared to the side where the roof remains intact.
(5) The results of a field test show that after the implementation of blasting along the gob-side roadway, the amount of drilling powder weight, micro-seismic events number and daily energy are decreasing, reducing the potential of a rock burst. Furthermore, the monitoring results from coal stress and mine pressure also illustrate that the blasting can reduce the pressure of the overburden strata and the generation of cracks within the coal seam, achieving a better effect on pressure relief.
Author Contributions
Conceptualization, X.Z. and Z.M.; methodology, X.Z.; software, C.J. and J.Z.; validation, C.J., J.Z. and J.C.; formal analysis, H.W.; investigation, Y.C.; resources, C.M.; data curation, J.C.; writing—original draft preparation, C.J.; writing—review and editing, X.Z.; visualization, Z.M.; supervision, X.Z.; project administration, X.Z.; funding acquisition, X.Z. All authors have read and agreed to the published version of the manuscript.
Funding
The authors would like to express their sincere gratitude to the National Natural Science Foundation of China (Grant Nos. 52274147, 52227901 and 52474270) for their financial support of this research. We also extend our thanks to the Shandong Energy Group (No. SNKJ2022BJ01-R27) for their valuable contributions. Additionally, we appreciate the support from the Taishan Industrial Experts Program (No. tscx202408130).
Institutional Review Board Statement
Not applicable.
Informed Consent Statement
Not applicable.
Data Availability Statement
The data used to support the findings of this study are available from the corresponding author upon request.
Acknowledgments
The authors are grateful to Shilawusu Coal Mine for providing field testing. We would also particularly like to acknowledge Piotr Małkowski for his wonderful collaboration and patient support. Additionally, the authors would also like to thank the peer reviewers and editors for their valuable comments and suggestions, which have greatly improved this manuscript presentation.
Conflicts of Interest
The authors declare that they have no known competing financial interests or personal relation-ships that could have appeared to influence the work reported in this paper. Authors Xiufeng Zhang, Hao Wang, Yang Chen and Cao Man are employees of the company Shandong Energy Group Co., Ltd. The authors declare that this study received funding from Shandong Energy Group. The funder had no role in the design of the study; in the collection, analysis, or interpretation of data, in the writing of the manuscript, or in the decision to publish the results.
References
- Cai, W.; Dou, L.; Si, G.; Hu, Y. Fault-induced coal burst mechanism under mining-induced static and dynamic stresses. Engineering 2021, 7, 687–700. [Google Scholar] [CrossRef]
- He, M.; Wang, Q. Rock dynamics in deep mining. Int. J. Min. Sci. Technol. 2023, 33, 1065–1082. [Google Scholar] [CrossRef]
- Ren, F.; Zhu, C.; He, M.; Shang, J.; Feng, G.; Bai, J. Characteristics and precursor of static and dynamic triggered rockburst: Insight from multifractal. Rock Mech. Rock Eng. 2023, 56, 1945–1967. [Google Scholar] [CrossRef]
- Pan, Y.S.; Song, Y.M.; Liu, J. Pattern, change and new situation of coal mine rockburst prevention and control in China. Chin. J. Rock Mech. Eng. 2023, 42, 2081–2095. [Google Scholar]
- He, J.; Dou, L.; Cao, A.; Gong, S.-Y.; Lü, J.-W. Rock burst induced by roof breakage and its prevention. J. Cent. South Univ. 2012, 19, 1086–1091. [Google Scholar] [CrossRef]
- Cai, W.; Bai, X.; Si, G.; Cao, W.Z.; Gong, S.Y.; Dou, L.M. A monitoring investigation into rock burst mechanism based on the coupled theory of static and dynamic stresses. Rock Mech. Rock Eng. 2020, 53, 5451–5471. [Google Scholar] [CrossRef]
- Li, Z.; Dou, L.; Wang, G.; Cai, W.; He, J.; Ding, Y.-L. Risk evaluation of rock burst through theory of static and dynamic stresses superposition. J. Cent. South Univ. 2015, 22, 676–683. [Google Scholar] [CrossRef]
- Zhai, W.; He, F.; Song, J.; Wu, Y.; Xu, X.; Wang, D.; Zhang, J.; Li, L. Strong strata behavior mechanism and roof cutting control of small pillar gob-side roadway in extra-thick coal seam. Bull. Eng. Geol. Environ. 2024, 83, 77. [Google Scholar] [CrossRef]
- Pan, J.; Du, T.; Gao, J.; Xie, F.; Liu, H.; Wu, Y.; Jia, P.; Xiong, H.; Rao, X. Mechanism and prevention of rockburst in deep multipillar gob-side entry. Lithosphere 2021, 2021, 1509697. [Google Scholar] [CrossRef]
- Mu, H.; Wang, A.; Song, D.; Su, D.; Li, D. Failure mechanism of gob-side roadway under overlying coal pillar multiseam mining. Shock Vib. 2021, 2021, 4403456. [Google Scholar] [CrossRef]
- Xie, F. Control of gob-side roadway with large mining height in inclined thick coal seam: A case study. Shock Vib. 2021, 2021, 6687244. [Google Scholar]
- Zhang, M.; He, H.; Zhang, Y.; Jin, X.; Zhang, Y.; Guo, H. Research on the deformation and control technology of surrounding rock in entry retaining along the gob side. Adv. Civ. Eng. 2020, 2020, 8885439. [Google Scholar] [CrossRef]
- Shi, X.; Jing, H.; Zhao, Z.; Gao, Y.; Zhang, Y.; Bu, R. Physical experiment and numerical modeling on the failure mechanism of gob-side entry driven in thick coal seam. Energies 2020, 13, 5425. [Google Scholar] [CrossRef]
- Wu, H.; Zhu, C.; Li, Q. Study on surrounding rock stability mechanism of gob-side entry retaining with prefabricated fracture. Adv. Civ. Eng. 2021, 2021, 5819672. [Google Scholar] [CrossRef]
- Wu, H.; Li, Q.; Zhu, C.; He, L. Study on the failure law of surrounding rock in inclined coal seam with gob side entry. Sci. Rep. 2023, 13, 973. [Google Scholar] [CrossRef]
- Wang, M.; Xu, Y.; Xu, Q.; Shan, C.; Li, Z.; Nan, H.; Li, Y.; Liu, H.; Chu, T. Stability control of overburden and coal pillars in the gob-side entry under dynamic pressure. Int. J. Rock Mech. Min. Sci. 2023, 170, 105490. [Google Scholar] [CrossRef]
- Chang, Q.; Ge, S.; Shi, X.; Sun, Y.; Wang, H.; Li, M.; Wang, Y.; Wu, F. Determination of narrow coal pillar width and roadway surrounding rock support technology in gob driving roadway. Sustainability 2022, 14, 4848. [Google Scholar] [CrossRef]
- Yang, Y.; Zhang, Y.; Huang, G. Research on stress distribution regularity and support optimization of an “umbrella” coal pillar in a gob-side roadway based on irregular gob. Energies 2022, 15, 3932. [Google Scholar] [CrossRef]
- Zhang, Y.; Xu, H.; Song, P.; Sun, X.; He, M.; Guo, Z. Stress evolution law of surrounding rock with gob-side entry retaining by roof cutting and pressure release in composite roof. Adv. Mater. Sci. Eng. 2020, 2020, 1961680. [Google Scholar] [CrossRef]
- Xu, X.; He, F.; Li, X.; He, W. Research on mechanism and control of asymmetric deformation of gob side coal roadway with fully mechanized caving mining. Eng. Fail. Anal. 2021, 120, 105097. [Google Scholar] [CrossRef]
- Liu, C.; Yang, J.; Yu, B. Rock-breaking mechanism and experimental analysis of confined blasting of borehole surrounding rock. Int. J. Min. Sci. Technol. 2017, 27, 795–801. [Google Scholar]
- Ye, Q.; Jia, Z.Z.; Zheng, C. Study on hydraulic-controlled blasting technology for pressure relief and permeability improvement in a deep hole. J. Pet. Sci. Eng. 2017, 159, 433–442. [Google Scholar] [CrossRef]
- Zhuang, J.; Mu, Z.; Zhang, X.; Cai, W.; Cao, A.; Jiang, C.; Małkowski, P. Seismic mitigation effect of overlying weakening strata in underground coal mines. Energies 2023, 16, 5958. [Google Scholar] [CrossRef]
- Zou, J.; Wu, K.; Zhang, X.; Zhu, J.; Zhou, Z.; Zheng, F.; Xie, H.; Jiao, Y.-Y. Effective evaluation of deep-hole blasting for controlling strong tremors induced by deep coal mining—A case study. Int. J. Rock Mech. Min. Sci. 2022, 159, 105211. [Google Scholar] [CrossRef]
- Banadaki, M.M.D.; Mohanty, B. Numerical simulation of stress wave induced fractures in rock. Int. J. Impact Eng. 2012, 40, 16–25. [Google Scholar] [CrossRef]
- Wang, F.; Tu, S.; Yuan, Y.; Feng, Y.; Chen, F.; Tu, H. Deep-hole pre-split blasting mechanism and its application for controlled roof caving in shallow depth seams. Int. J. Rock Mech. Min. Sci. 2013, 64, 112–121. [Google Scholar] [CrossRef]
- Konicek, P.; Soucek, K.; Stas, L.; Singh, R. Long-hole destress blasting for rockburst control during deep underground coal mining. Int. J. Rock Mech. Min. Sci. 2013, 61, 141–153. [Google Scholar] [CrossRef]
- Wu, K.; Zou, J.; Jiao, Y.Y.; He, S.; Wang, G. Insight and effectiveness of working-face deep-hole blasting for prevention of strong seismicity induced by deep coal mining. Rock Mech. Rock Eng. 2023, 56, 8693–8709. [Google Scholar] [CrossRef]
- Wojtecki, Ł.; Konicek, P.; Mendecki, M.J.; Zuberek, W.M. Evaluation of destress blasting effectiveness using the seismic moment tensor inversion and seismic effect methods. Int. J. Geomech. 2022, 22, 04022010. [Google Scholar] [CrossRef]
- Li, X.; Zhu, Z.; Wang, M.; Wan, D.; Zhou, L.; Liu, R. Numerical study on the behavior of blasting in deep rock masses. Tunn. Undergr. Space Technol. 2021, 113, 103968. [Google Scholar] [CrossRef]
- Kan, J.; Dou, L.; Li, X.; Cao, J.; Bai, J.; Chai, Y. Study on influencing factors and prediction of peak particle velocity induced by roof pre-split blasting in underground. Undergr. Space 2022, 7, 1068–1085. [Google Scholar] [CrossRef]
- Zhang, K.; Liu, C.; Zhang, H.; Yue, X.; Liu, H. Research on roof cutting pressure relief of the gob-side entry retaining with roadside backfilling. Front. Earth Sci. 2022, 10, 835497. [Google Scholar] [CrossRef]
- Lin, J.; Guo, K.; Sun, Z.; Wang, T. Study on fracturing timing of hydraulic fracturing top-cutting and pressure relief in roadway with strong dynamic pressure. J. China Coal Soc. 2021, 46, 140–148. [Google Scholar]
Figure 1.
Configuration of the 21108 working face and deformation phenomenon.
Figure 1.
Configuration of the 21108 working face and deformation phenomenon.
Figure 2.
Roof breaking law along the gob-side roadway. (a) “O-X” fracture; (b) Mechanical model.
Figure 2.
Roof breaking law along the gob-side roadway. (a) “O-X” fracture; (b) Mechanical model.
Figure 3.
Simplified physical model of a lateral cantilever beam.
Figure 3.
Simplified physical model of a lateral cantilever beam.
Figure 4.
Schematic diagram of the model and boundary conditions.
Figure 4.
Schematic diagram of the model and boundary conditions.
Figure 5.
Stress and displacement maps next to the 21108 gob-side roadway. (a) Vertical stress before blasting; (b) Vertical displacement before blasting; (c) Vertical stress after blasting; (d) Vertical displacement after blasting.
Figure 5.
Stress and displacement maps next to the 21108 gob-side roadway. (a) Vertical stress before blasting; (b) Vertical displacement before blasting; (c) Vertical stress after blasting; (d) Vertical displacement after blasting.
Figure 6.
The vertical stress value at varying distances along the gob-side roadway before and after blasting.
Figure 6.
The vertical stress value at varying distances along the gob-side roadway before and after blasting.
Figure 7.
Displacement characteristics of the gob-side entry: (a) roof; (b) floor; (c) coal pillar side; (d) solid coal side.
Figure 7.
Displacement characteristics of the gob-side entry: (a) roof; (b) floor; (c) coal pillar side; (d) solid coal side.
Figure 8.
Layout of the model and the location of stress monitoring capsules.
Figure 8.
Layout of the model and the location of stress monitoring capsules.
Figure 9.
Schematic diagram of the change in the state of motion of the roof as the excavation advances. (a) Immediate roof instability and collapse; (b) Collapse of the overlying strata; (c) Destabilized of the voussoir beam structure; (d) Filling of collapsed rock and articulation of the overlying rock.
Figure 10.
Fracture distribution of inclined overburden strata after mining.
Figure 10.
Fracture distribution of inclined overburden strata after mining.
Figure 11.
Subsidence of overburden after 120 cm of excavation.
Figure 11.
Subsidence of overburden after 120 cm of excavation.
Figure 12.
Subsidence of overburden after 170 cm of excavation.
Figure 12.
Subsidence of overburden after 170 cm of excavation.
Figure 13.
Variation in stress with coal seam excavation.
Figure 13.
Variation in stress with coal seam excavation.
Figure 14.
Schematic layout of blasting and measurement. (a) Profile diagram with blasting towards the side of the goaf; (b) Layout of measuring points.
Figure 14.
Schematic layout of blasting and measurement. (a) Profile diagram with blasting towards the side of the goaf; (b) Layout of measuring points.
Figure 15.
Total drilling powder weight from the section of 20–57.5 m to the stopping line before and after blasting (a) 20 m; (b) 37.5 m; (c) 45 m; (d) 57.5 m.
Figure 15.
Total drilling powder weight from the section of 20–57.5 m to the stopping line before and after blasting (a) 20 m; (b) 37.5 m; (c) 45 m; (d) 57.5 m.
Figure 16.
Total drilling powder weight from the section of 20–57.5 m to the stopping line before and after blasting (a) 70 m; (b) 82.5 m; (c) 95 m; (d) 107.5 m.
Figure 16.
Total drilling powder weight from the section of 20–57.5 m to the stopping line before and after blasting (a) 70 m; (b) 82.5 m; (c) 95 m; (d) 107.5 m.
Figure 17.
Distribution of micro-seismic events in area I and area II. (a) Total daily energy (b) Maximum daily energy (c) Total daily frequency (d) Energy level distribution.
Figure 17.
Distribution of micro-seismic events in area I and area II. (a) Total daily energy (b) Maximum daily energy (c) Total daily frequency (d) Energy level distribution.
Figure 18.
Stress distribution in area I and area II.
Figure 18.
Stress distribution in area I and area II.
Figure 19.
Mean stress laws in area I and area II.
Figure 19.
Mean stress laws in area I and area II.
Table 1.
Lithology column of the strata.
Table 1.
Lithology column of the strata.
| Lithological Column | No. | Lithology | Thickness/m | Depth/m | Key Layer |
|---|
![Applsci 15 03168 i001]() | 7 | Medium
sandstone | 26.12 | 579.34 | No |
| 6 | Siltstone | 12.85 | 605.46 | No |
| 5 | Sandy
mudstone | 12.77 | 618.31 | No |
| 4 | Fine sandstone | 31.05 | 631.08 | Yes |
| 3 | 2-2 coal | 9.5 | 662.13 | No |
| 2 | Sandy
mudstone | 6.5 | 671.63 | No |
| 1 | Siltstone | 9.05 | 680.68 | No |
Table 2.
Physical and mechanical properties of coal and rock mass.
Table 2.
Physical and mechanical properties of coal and rock mass.
| Lithology | Density (kg/m3) | Tensile Strength (MPa) | Shear Modules (GPa) | Bulk Modules (GPa) | Cohesion
(MPa) | Friction
Angle (°) | Poisson
Ratio |
|---|
Medium
sandstone | 2.5 × 10³ | 2.55 | 4.34 | 7.21 | 1.45 | 30 | 0.28 |
| Siltstone | 2.61 × 10³ | 2.48 | 5.91 | 9.79 | 1.5 | 32 | 0.25 |
Sandy
mudstone | 2.5 × 10³ | 2.71 | 4.27 | 7.86 | 1.4 | 28 | 0.27 |
| Fine sandstone | 2.5 × 10³ | 2.42 | 4.98 | 8.12 | 1.48 | 31 | 0.25 |
| Coal seam | 1.4 × 10³ | 2.02 | 3.21 | 6.31 | 1.4 | 28 | 0.25 |
Sandy
mudstone | 2.5 × 10³ | 2.71 | 4.27 | 7.86 | 1.4 | 28 | 0.27 |
| Siltstone | 2.61 × 10³ | 2.48 | 5.91 | 9.79 | 1.5 | 32 | 0.25 |
Table 3.
Ratio table of lithology.
Table 3.
Ratio table of lithology.
| No. | Lithology | Thickness
(mm) | Sand
(kg) | Calcium
Carbonate (kg) | Gypsum
(kg) | Water
(kg) |
|---|
| 1 | Sandy
mudstone | 96.87 | 62.27 | 5.19 | 5.19 | 10.38 |
| 2 | Fine sandstone | 34.60 | 20.76 | 3.63 | 1.56 | 2.88 |
| 3 | Sandy
mudstone | 274.93 | 176.74 | 14.73 | 14.73 | 29.46 |
| 4 | Fine sandstone | 21.33 | 12.80 | 2.24 | 0.96 | 1.78 |
| 5 | Sandy
mudstone | 76.80 | 49.37 | 4.11 | 4.11 | 8.23 |
| 6 | Fine sandstone | 125.93 | 75.56 | 13.22 | 5.67 | 10.49 |
| 7 | Siltstone | 68.93 | 38.78 | 9.05 | 3.88 | 5.74 |
| 8 | Sandy
mudstone | 102.47 | 65.87 | 5.49 | 5.49 | 10.98 |
| 9 | Siltstone | 67.73 | 38.10 | 8.89 | 3.81 | 5.64 |
| 10 | Sandy
mudstone | 175.87 | 113.06 | 9.42 | 9.42 | 18.84 |
| 11 | Medium
sandstone | 174.13 | 97.95 | 9.80 | 22.86 | 18.66 |
| 12 | Siltstone | 85.73 | 48.23 | 4.82 | 11.25 | 7.14 |
| 13 | Sandy
mudstone | 85.13 | 54.73 | 4.56 | 4.56 | 9.12 |
| 14 | Fine sandstone | 207.00 | 124.20 | 21.74 | 9.32 | 17.25 |
| 15 | 2-2 coal | 65.33 | 43.05 | 4.34 | 1.86 | 5.47 |
| 16 | Sandy
mudstone | 43.33 | 27.86 | 2.32 | 2.32 | 4.64 |
| 17 | Siltstone | 60.33 | 33.94 | 7.92 | 3.39 | 5.023 |
Table 4.
Statistics on the energy level distribution in area I and area II.
Table 4.
Statistics on the energy level distribution in area I and area II.
| Energy Level [J] | Number of Seismic Events |
|---|
| Area I | Area II |
|---|
| 10–102 | 685 | 998 |
| 102–103 | 201 | 183 |
| 103–104 | 1 | 1 |
| Disclaimer/Publisher’s Note: The statements, opinions and data contained in all publications are solely those of the individual author(s) and contributor(s) and not of MDPI and/or the editor(s). MDPI and/or the editor(s) disclaim responsibility for any injury to people or property resulting from any ideas, methods, instructions or products referred to in the content. |
© 2025 by the authors. Licensee MDPI, Basel, Switzerland. This article is an open access article distributed under the terms and conditions of the Creative Commons Attribution (CC BY) license (https://creativecommons.org/licenses/by/4.0/).


