Article

Comparative Performance of YOLOv8, YOLOv9, YOLOv10, and YOLOv11 for Layout Analysis of Historical Documents Images

by
Eder Silva dos Santos Júnior
*,
Thuanne Paixão
and
Ana Beatriz Alvarez
PAVIC Laboratory, University of Acre (UFAC), Rio Branco 69915-900, Brazil
*
Author to whom correspondence should be addressed.
Appl. Sci. 2025, 15(6), 3164; https://doi.org/10.3390/app15063164
Submission received: 15 February 2025 / Revised: 7 March 2025 / Accepted: 7 March 2025 / Published: 14 March 2025

Abstract

:
The digitalization of historical documents is of interest for many reasons, including historical preservation, accessibility, and searchability. One of the main challenges with the digitization of old newspapers involves complex layout analysis, where the content types of the document must be determined. In this context, this paper presents an evaluation of the most recent YOLO methods for the analysis of historical document layouts. Initially, a new dataset called BHN was created and made available, standing out as the first dataset of historical Brazilian newspapers for layout detection. The experiments were held using the YOLOv8, YOLOv9, YOLOv10, and YOLOv11 architectures. For training, validation, and testing of the models, the following historical newspaper datasets were combined: BHN, GBN, and Printed BlaLet GT. Recall, precision, and mean average precision (mAP) were used to evaluate the performance of the models. The results indicate that the best performer was YOLOv8, with a Recall test of 81 % and an mAP test of 89 % . This paper provides insights on the advantages of these models in historical document layout detection and also promotes improvement of document image conversion into editable and accessible formats.

1. Introduction

Many mass digitization projects have gained prominence in different parts of the world [1]. These initiatives allow materials of great historical, cultural and literary importance to be converted into a digital format; otherwise, these materials would normally only be found in museums [2,3]. However, conducting research on digital images is a difficult task; consequently, the material available for study has not been completely explored. This problem started to be addressed in the early 1990s, when algorithms for analyzing document images began to develop with the aim of extracting information from document images in a human-like way [4].
A widely used approach for extracting text from images is Optical Character Recognition (OCR), a technique capable of converting digital documents into machine-readable ones [5]. One of the stages of OCR is layout analysis, which consists of locating the layout regions present in the document images and is of fundamental importance for a good OCR result [6]. Although the OCR has performed well on modern documents, its performance is significantly reduced when it comes to historical documents [5,7].
In the case of historical newspapers, the challenges in the layout analysis process are obvious, due to characteristics such as different font sizes and styles, number of columns, column widths, presence of column dividers, etc. [8]. According to [9], most of the algorithms described in the literature were developed to recognize contemporary documents, such as magazines and books, with more regular layouts and fonts. For this reason, existing open-source OCR systems, such as Tesseract and EasyOCR, are unable to correctly identify the text regions of historical newspapers, thus jeopardizing the final OCR result [6].
Related studies show that in recent years, deep learning-based methods have become the most popular among researchers for document layout analysis [10]. The use of advanced architectures such as YOLO models, for example, in object detection tasks offers a powerful combination of precision and speed [11,12,13], crucial for layout analysis.
The following studies are worth highlighting: ref. [14] used the approach of Faster R-CNN and Mask R-CNN as a unified framework graphical object detection for the analysis of graphics layout; ref. [15] used Siamese networks that consist of two identical convolutional neural networks to detect Arabic manuscripts; ref. [16] proposed LayoutLM, an algorithm capable of jointly modeling interactions between text and layout information across scanned document images; ref. [17] proposed DocFormer, a multi-modal transformer-based architecture for the task of Visual Document Understanding; ref. [18] proposed LayoutLMv3, the first multimodal model that does not rely on a pre-trained CNN or Faster R-CNN to extract visual features; [19] presented DiffusionDet, a new framework that formulates object detection as a denoising diffusion process from noisy boxes to object boxes; ref. [20] proposed the Real-Time Detection Transformer (RT-DETR), a transformer-based object detector for real-time that avoids the use of NMS; ref. [21] introduced DocLayout-YOLO, a novel approach that enhances accuracy while maintaining speed advantages through document-specific optimizations in both pre-training and model design; ref. [22] proposed DocFusion, a lightweight generative model for document parsing tasks; ref. [23] performed a comparative analysis between the YOLOv5s and YOLOv5m architectures applied to a custom dataset containing mainly images from books in English and Arabic; ref. [24] applied a high-accuracy YOLOv8 model to three document image datasets: ICDAR-POD, PubLayNet, and IIIT-AR-13K; ref. [25] proposed a single-stage DLA model multi-scale cross fusion former called YOLOLayout; ref. [26] trained and evaluated a model for layout detection and OCR of historical documents from the 19th century, and the proposed method was compared with the standard Tesseract OCR engine; ref. [27] proposed EDocNet, a lightweight convolutional neural network composed of multiple depth separable layers to analyze electronic device documents.
More recently, transformer-based architectures, such as DocFormer and LayoutLM, have also emerged as a promising alternative [10]. However, YOLO-based models offer significant benefits, such as real-time inference and lower computational complexity, making them more suitable for applications where speed is of the essence. In addition, the need for large volumes of labeled data to train transformers can be a barrier for historical documents, where the amount of data available is reduced. While transformers require large volumes of annotated data for satisfactory performance, YOLO is more robust for smaller sets. Additionally, models such as LayoutLM are more geared towards tasks involving semantic interpretation and text extraction while YOLO specializes in the efficient detection of objects within images.
In this context, a limited number of related studies on layout analysis in German–Brazilian historical documents using deep learning techniques is observed. When considering the datasets of historical newspapers with Gothic typography, such as the German–Brazilian Newspaper (GBN) Dataset created in the study of [6] with annotations for layout analysis and OCR and the Printed BlaLet GT dataset [28], no references were found investigating layout analysis. Thus, there is a gap in the literature to be filled when it comes to the use of deep learning techniques in German–Brazilian historical newspapers.
This work proposes a new annotated dataset for layout analysis of historical Brazilian newspapers and also makes a comparative analysis between the performances of the YOLOv8 to YOLOv11 architectures on a combined dataset to investigate which is the best for the OCR task. Thus, this study provides an original dataset to enrich the area of layout analysis of historical documents, which has a scarcity of available data—especially those with annotations—for layout detection studies. In addition, the results achieved reveal the performance of current YOLO models on a dataset compiled for this application, showing the potential of the models for further research and development of more robust OCR technologies for recognizing historical documents.
In summary, the main contributions of this study are:
  • Creation and availability of a dataset of historical Brazilian newspapers for layout analysis, named “Brazilian Historical Newspaper” (BHN). As one of the main contributions of this paper, the first dataset of historical Brazilian newspapers with annotations for layout detection was created.
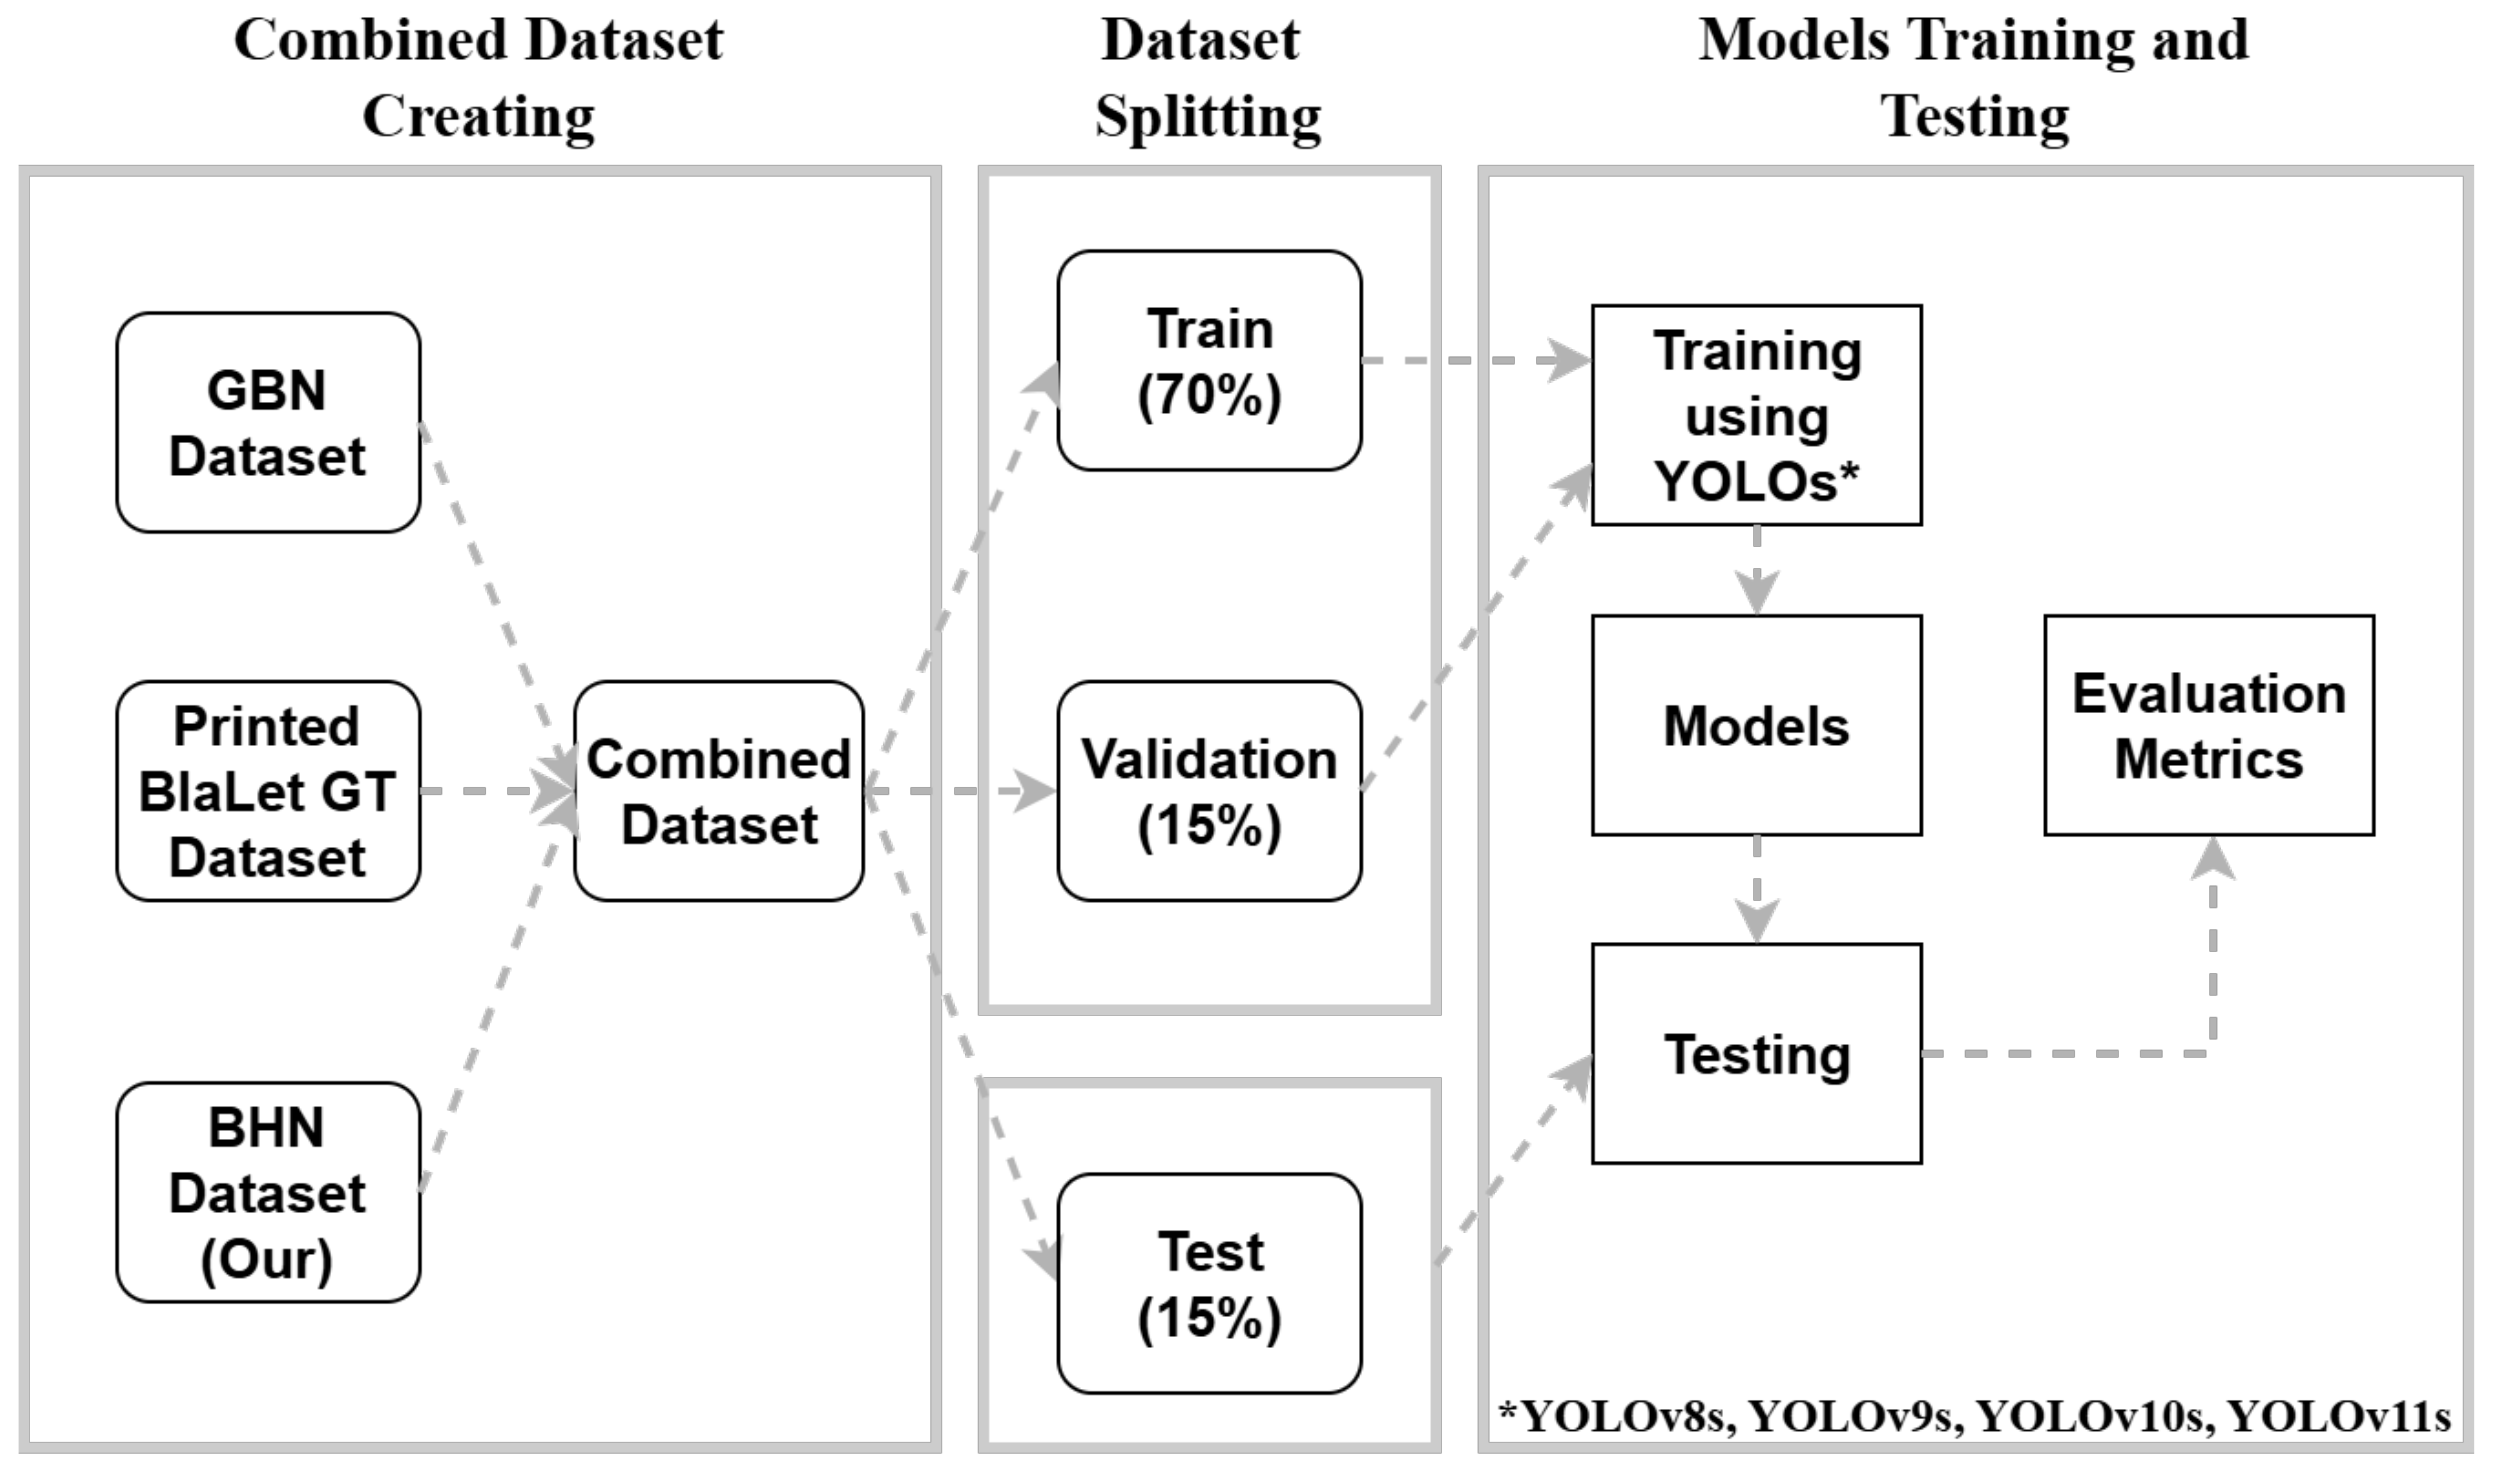
  • Development of a combined dataset, combining the BHN, GBN, and Printed BlaLet GT datasets, consisting of 459 images of historical documents annotated for layout analysis. After organizing the data and reviewing the annotations, the dataset was made publicly available on the Roboflow (www.roboflow.com, accessed on 25 September 2024) website.
  • Comparative analysis of the performance of the YOLOv8, YOLOv9, YOLOv10 and YOLOv11 architectures in the layout analysis task, trained on the combined dataset. As Section 2.3 explains, these architectures were selected because of their speed, ease of implementation, and suitability for the task of layout analysis. This paper highlights the potential of these architectures in layout analysis, where significant results were obtained that not only demonstrate the effectiveness of the architectures, but also motivate new scientific research in the area.
This paper is organized as follows: Section 2 addresses the general methodology used in the research; Section 3 presents the results and discussions; and finally, Section 4 contains the conclusions about the research and suggestions for future studies.

2. Materials and Methods

The general methodology followed in this research is illustrated in Figure 1, which shows the process from merging the data set to evaluating the deep learning algorithms.
For the experiments, three datasets were selected with annotations for layout analysis that best met the requirements of the study, which were the BHN dataset (our dataset), GBN dataset, and the Printed Black Letter GT (BlaLet GT) dataset, later combined into a single dataset. This process is described in more detail in Section 2.1 and Section 2.2. After organizing the data and reviewing the markings using the roboflow tool, the dataset was separated into training, validation, and test sets, and the annotations were exported in the appropriate format for the architectures.
Next, the four selected architectures (YOLOv8, YOLOv9, YOLOv10, and YOLOv11), which are explained in Section 2.3, were trained using the training and validation data. The training algorithms were run with the hyperparameters presented in Section 2.4, and the customized weights for each architecture were generated. These models were then applied to the test set to obtain the evaluation metrics, which provide the performance of the models. The main object detection metrics described in Section 2.5 were selected to compare the architectures.
The experiments were implemented in VS Code software, an Integrated Development Environment (IDE) where the code was compiled and the algorithms could be trained and evaluated. The IDE used the Python programming language, chosen because it is widely used in the field of deep learning [29].

2.1. Proposed Dataset: Brazilian Historical Newspaper (BHN)

The dataset was developed using images of pages from historic Brazilian newspapers. These images were free acquired from the website of the Brazilian National Digital Library (BND) (https://bndigital.bn.gov.br/, accessed on 6 September 2024). In view of the focus on historical documents, two newspapers were selected from the “19th century periodicals” category, which are the “Compilador Mineiro” and the “Recopilador Sergipano”.
Next, all the images available on the BND for these two newspapers were downloaded in .png format. This resulted in a total of 140 images of Brazilian newspapers for the construction of the proposed dataset. The tool roboflow was used to annotate this data, a website where it is possible to create datasets, pre-process, divide the data into training, validation, and testing, and other uses [30]. It was possible to load the images and mark the annotations, also called Ground Truth (GT) of the dataset.
In object detection, the GT consist of bounding boxes indicating the location of the object, which need to be present in the dataset to train the algorithm, using this information as a reference to validate the learning. Besides learning to locate the regions of the document layout, the algorithm must learn to specify the category of the region. In the dataset images, the presence of the following categories was observed: text, image, graphic, table, and separator.
Figure 2a shows one of the examples from the dataset and Figure 2b the corresponding GT, carried out manually using roboflow. In this case, the purple bounding box indicates that the region corresponds to the text class, while the green color refers to the graphic class and the red color to the separator class.
The BHN is the first dataset of historical Brazilian newspapers marked for layout detection and is available for download via the following link: https://app.roboflow.com/myworkspace-wzeqx/brazilian_historical_newspaper/4 (accessed on 6 September 2024). In this version, the dataset, with a total of 140 images, is divided into 80% for training (112 images) and 20% for validation (28 images). It is worth noting that the separator class was discarded from the dataset as it does not represent content that is as important for layout analysis as text regions, for example, which are essential for the OCR task.
For the experiments with the object detectors, the BHN dataset was merged with two other historical newspaper datasets, as described in Section 2.2. This resulted in a unified dataset with a larger number of images, allowing the models to be trained with more data and generalize better.

2.2. Combined Dataset and Pre-Processing

In this study, it was decided to combine the proposed dataset (BHN) with other datasets of historical newspapers in the literature in order to execute the experiments with a more robust dataset. We searched the literature for datasets of historical German–Brazilian newspapers or other similar newspapers.
In [31], a list of such datasets was built meeting the following requirements: 1. they must be open for academic research purposes; 2. they must be easy to access and download; 3. they must be composed, at least in part, of images from historical German-language newspapers; and 4. they must contain layout annotations (i.e., the GT).
Then, a total of three datasets of historical newspapers were used, including the BHN, with markings suitable for the task of detecting layout in historical documents. Table 1 presents a description of the datasets, containing information on the quality of the images, dots per inch (DPIs), format, and number of pages in the datasets.
The first dataset selected was the GBN Dataset (https://web.inf.ufpr.br/vri/databases/gbn/, accessed on 24 August 2023), which consists of 152 color page images from eight different newspapers belong to the dbp digital project from the Dokumente.br initiative, which has the goal to digitally reconstruct the complete collection of these newspapers [6]. The second dataset chosen, called BlaLet GT Dataset (https://github.com/impresso/NZZ-black-letter-ground-truth, accessed on 26 October 2023), has 167 images of pages from the Swiss newspaper Neue Zürcher Zeitung [28]. Finally, the third dataset used is the BHN, proposed in this paper and already explained in Section 2.1.
The selected datasets feature images with a similar layout style, consisting of scanned pages from newspapers which were printed between the 18th and 20th centuries. In addition to the images, the datasets have the GT, which consists of annotations of the coordinates of each piece of content on the pages.
Once these datasets had been selected and organized, the three sets were merged to form a single dataset with 459 images of historical newspapers, 321 of which were for training (70%), 69 for validation (15%) and 69 for testing (15%). The procedure of combining the datasets and separating them into training, validation and test data was also done using roboflow. The Figure 3 shows some examples of images from the final dataset.
The original datasets comprised the classes Text, Image, Graphic, Table, and Separator. In the experiments, we disregarded the separator category in the final dataset, as it does not hold significant information for understanding the document. The Table 2 shows the classes evaluated and the number of instances of each class. It can be seen that the distribution of classes is unbalanced, where the majority classes are Text and Graphic, with a greater number of instances, and the minority classes are Table and Image.
The markings were revised to correct incorrect bounding boxes at the end of the process. The final version of the dataset, called merged_historical_newspaper Dataset (https://app.roboflow.com/myworkspace-wzeqx/merged_historical_newspaper/1, accessed on 25 September 2024) is available digitally for download. It is worth noting that the images had different resolutions but were resized in this version to a standard size of 640 × 640 pixels, as a pre-processing step in the implementation of the experiments.

2.3. Used Architectures

The YOLOv8, YOLOv9, YOLOv10, and YOLOv11 architectures were selected for use due to their proven performance capabilities in object detection and versatility in different scenarios. YOLO models are known for their speed in detecting objects compared to other detection methods, such as transformers, which generally require more computing power and inference time. This is essential for large-scale digitization scenarios.
For real-time tasks or those involving large volumes of historical documents, the efficiency of YOLO can be a significant advantage. Furthermore, in the case of historical documents, where data are scarce and noisy, the use of YOLO allows for a simpler and more efficient pipeline for training and inference. Thus, YOLO models were chosen for their speed, simplicity and suitability for the task of layout detection.
Some of the characteristics of each architecture are described below:
  • YOLOv8: This state-of-the-art algorithm can be used for object detection, image classification, and instance segmentation tasks [32]. YOLOv8 was developed by Ultralytics, which included several changes to the architecture and developer experience, as well as improvements over YOLOv5. YOLOv8 uses an anchor-free model with a decoupled head to independently process the objectivity, classification and regression tasks. This design allows each branch to concentrate on its task and improves the overall accuracy of the model. In the output layer of YOLOv8, the authors used the sigmoid function as the activation function for the objectivity score, representing the probability that the bounding box contains an object.
  • YOLOv9: YOLOv9 was launched in February 2024 [33] as an update to previous versions. YOLOv9 boasts two key innovations: the Programmable Gradient Information (PGI) framework and the Generalized Efficient Layer Aggregation Network (GELAN). The PGI framework aims to address the issue of information bottlenecks, inherent in deep neural networks in addition to enabling deep supervision mechanisms to be compatible with lightweight architectures. By implementing PGI, both lightweight and deep architectures can leverage substantial improvements in accuracy, as PGI mandates reliable gradient information during training, thus enhancing the architecture’s capacity to learn and make accurate predictions.
  • YOLOv10: YOLOv10 [34] sets a new standard in real-time object detection by addressing the shortcomings of previous YOLO versions and incorporating innovative design strategies. Its ability to deliver high accuracy with low computational cost makes it an ideal choice for a wide range of real-world applications. To address the Non-Maximum Suppression (NMS) dependency and architectural inefficiencies of past YOLO versions, YOLOv10 introduces consistent dual assignments for training without NMS and a holistic model design strategy aimed at efficiency and accuracy. Thus, its main features are NMS-free training, holistic model design, and enhanced model features.
  • YOLOv11: According to [35], YOLOv11 represents the latest advancement in the YOLO family, building on the strengths of its predecessors while introducing innovative features and optimizations aimed at enhancing performance across various computer vision tasks. The YOLOv11 architecture has optimized feature extraction capabilities, making it possible to capture intricate details in images [36]. This model supports a range of applications, including real-time object detection, instance segmentation, and pose estimation, which allows it to accurately identify objects regardless of their orientation, scale, or size, making it versatile for industries like agriculture and surveillance. The YOLOv11 model utilizes enhanced training techniques that have led to improved results on benchmark datasets. YOLOv11 is optimized for real-time applications, ensuring fast processing even in demanding environments.

2.4. Training Hyperparameters

We adopted the training hyperparameters shown in Table 3. Each model was trained for 100 epochs, with a batch size of 16, images size equal to 640 × 640, a learning rate of 0.01 , and a momentum set to 0.937 , with all other settings kept as default. The choice of these hyperparameters was based on related works on detection using YOLO models, such as [37,38,39,40,41].
It is important to emphasize that in the experiments with the YOLO architectures, fine-tuning was carried out using the YOLOv8s, YOLOv9s, YOLOv10s, and YOLOv11s pretrained models. Where “s” indicates the small version, to ensure a balance between speed and precision. It should also be noted that, in all experiments, the weights of the best models were saved for the test stage.

2.5. Evaluation Metrics

In the different annotated data sets used by object detection challenges and the scientific community, the metric most commonly used to measure the accuracy of detections is the mean average precision ( m A P ) [42]. To understand m A P , you need to bear in mind the concepts of true positive, false positive, and false negative, which are defined as follows:
  • True Positive (TP): Correct detection of a true bounding box;
  • False Positive (FP): An incorrect detection of a nonexistent object or a misplaced detection of an existing object;
  • False Negative (FN): An undetected ground-truth bounding box;
The previous definitions also require establishment of what are correct and incorrect detections. A common method for this is the use of the intersection over union (IoU). According to [43] the I o U is a measure based on Jaccard’s index which measures the area of overlap between the predicted bounding box B p and the true bounding box B g t divided by the area of union between them, as described mathematically in Equation (1) and illustrated in Figure 4.
I o U = a r e a ( B p B g t ) a r e a ( B p B g t )
The value of I o U is then compared with a defined threshold t in order to establish when a detection is correct or incorrect. If I o U t , then the detection is considered correct. If I o U < t , the detection is considered incorrect.
In addition to m A P , other evaluation metrics frequently used in detection problems are precision and recall [42], which are also adopted in the evaluation process. Each of these detection metrics will be explained below.
  • Precision: It measures the quality of the model through its ability to find true positives among all positive predictions [42]. Mathematically, accuracy is given by Equation (2), where T P is the number of true positives and F P is the number of false positives.
    P r e c i s i o n = T P T P + F P = T P a l l d e t e c t i o n s
  • Recall: It is related to quantity and measures the model’s ability to find true positives in relation to the total number of positives [42]. Mathematically, sensitivity is given by Equation (3), where T P is the number of true positives and F N is the number of false negatives.
    R e c a l l = T P T P + F N = T P a l l g r o u n d t r u t h s
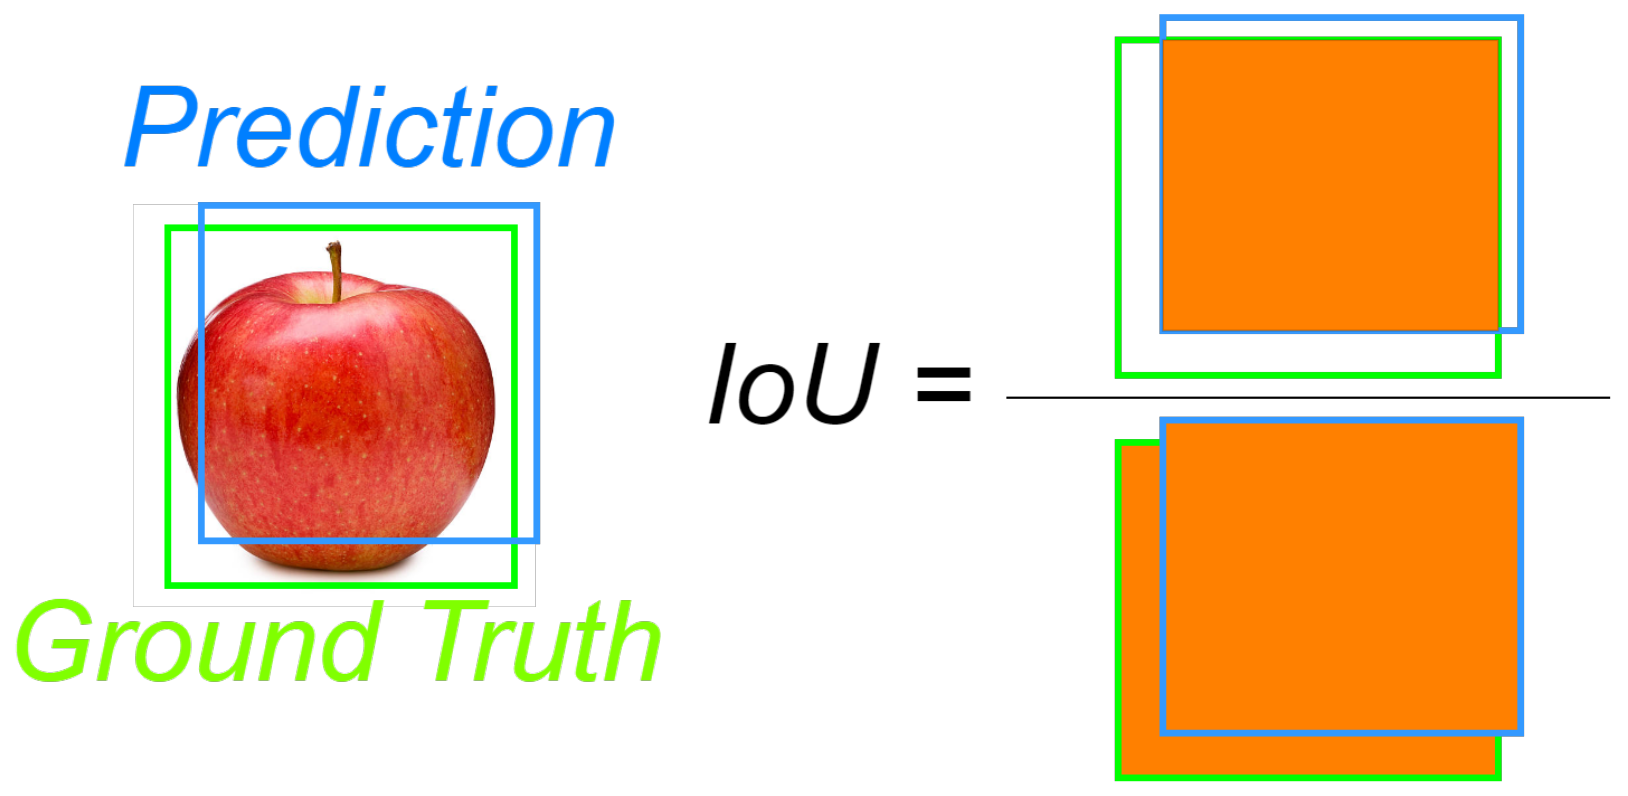
  • mAP: It is an evaluation metric that has been widely used for evaluating the quality of object detectors [44]. This metric is the most popular among benchmark challenges, such as the COCO and ImageNET challenges. The m A P measure, used in multiclass problems, is defined from the Average Precision ( A P ) of each class.
    The A P is calculated by Equation (4) and is defined as the area under the precision (P) × recall (R) curve, where M is the number of interpolated points.
    A P = m = 1 M ( R m R m 1 ) · P ( R m )
    Therefore, the m A P metric calculates the A P of each category separately and then averages these APs across all categories. This approach ensures that the model’s performance is assessed for each category individually, providing a more comprehensive assessment of the model’s overall performance [43]. The m A P is expressed mathematically by Equation (5), where N is the number of classes in the problem.
    m A P = 1 N · i = 1 N A P i
    It is important to note that for this work, a threshold of 50 % was selected when evaluating the architectures. In this case, the notation m A P 50 is used to indicate the threshold.

3. Results and Discussion

This section discusses the results as follows: Section 3.1 the evaluation metrics obtained for each model; in Section 3.2, some qualitative results are analyzed, visualizing the predictions of the models; and Section 3.3 presents more details about the best-performing model.

3.1. Models Performance

The Table 4 shows the results in terms of the evaluation metrics that were achieved for each of the architectures on the test set. In the following paragraphs, a comparison of the performance of the architectures will be discussed.
It is easy to see that YOLOv8 obtained the best performance among the architectures evaluated, achieving an mAP of 89.10%. This model also had the highest recall (80.9%), indicating its superior ability to detect a large proportion of the objects present, as well as good o verall performance in correctly detecting layout regions. Its optimized structure combines computational efficiency with good generalization power, which may explain its superior performance.
Although it has lower recall (0.712) and precision (0.754) values than YOLOv8, YOLOv9 achieves an mAP50 of 0.757, which can still be considered acceptable in certain applications. However, its relatively lower performance suggests that it is less effective at correctly detecting document layout elements than YOLOv8. The model introduced refinements in the anchoring strategy and improvements in feature extraction, but it may not be as optimized for the dataset used.
The YOLOv10 architecture, although it has the lowest recall (0.495) and the worst mAP50 (0.692), it has the highest precision (0.949), outperforming the other architectures in this metric. This suggests that YOLOv10 is highly selective, resulting in high accuracy at the expense of low sensitivity. This configuration may be unsuitable for detection tasks where it is necessary to identify all relevant objects, since a large number of them are ignored. Structurally, YOLOv10 has been modified to reduce computational costs and improve energy efficiency, which may have had an impact on its detection capacity.
Finally, YOLOv11 had the second best mAP50 (0.871), almost matching the overall performance of YOLOv8. In addition, this architecture achieved balanced recall (0.801) and precision (0.854) values. This architecture could be a good alternative for applications that require a balance between recall and precision, despite not achieving an mAP50 as high as the YOLOv8. The structural changes in version 11 focused on integrating attention mechanisms and optimizing parameters, which may explain the improvement in Precision over YOLOv8.
In view of the above, YOLOv8 and YOLOv11 are the most balanced models and are preferable for layout analysis. YOLOv10, despite its high precision, has low recovery capacity, which could be a problem for complete detection. YOLOv9 underperformed, suggesting that its structural modifications may not be ideal for this specific task.

3.2. Some Visual Results

For a qualitative view of the results, the Figure 5 shows the predictions of each trained YOLO model for four selected images from the test set. Analyzing the predictions, the following observations made:
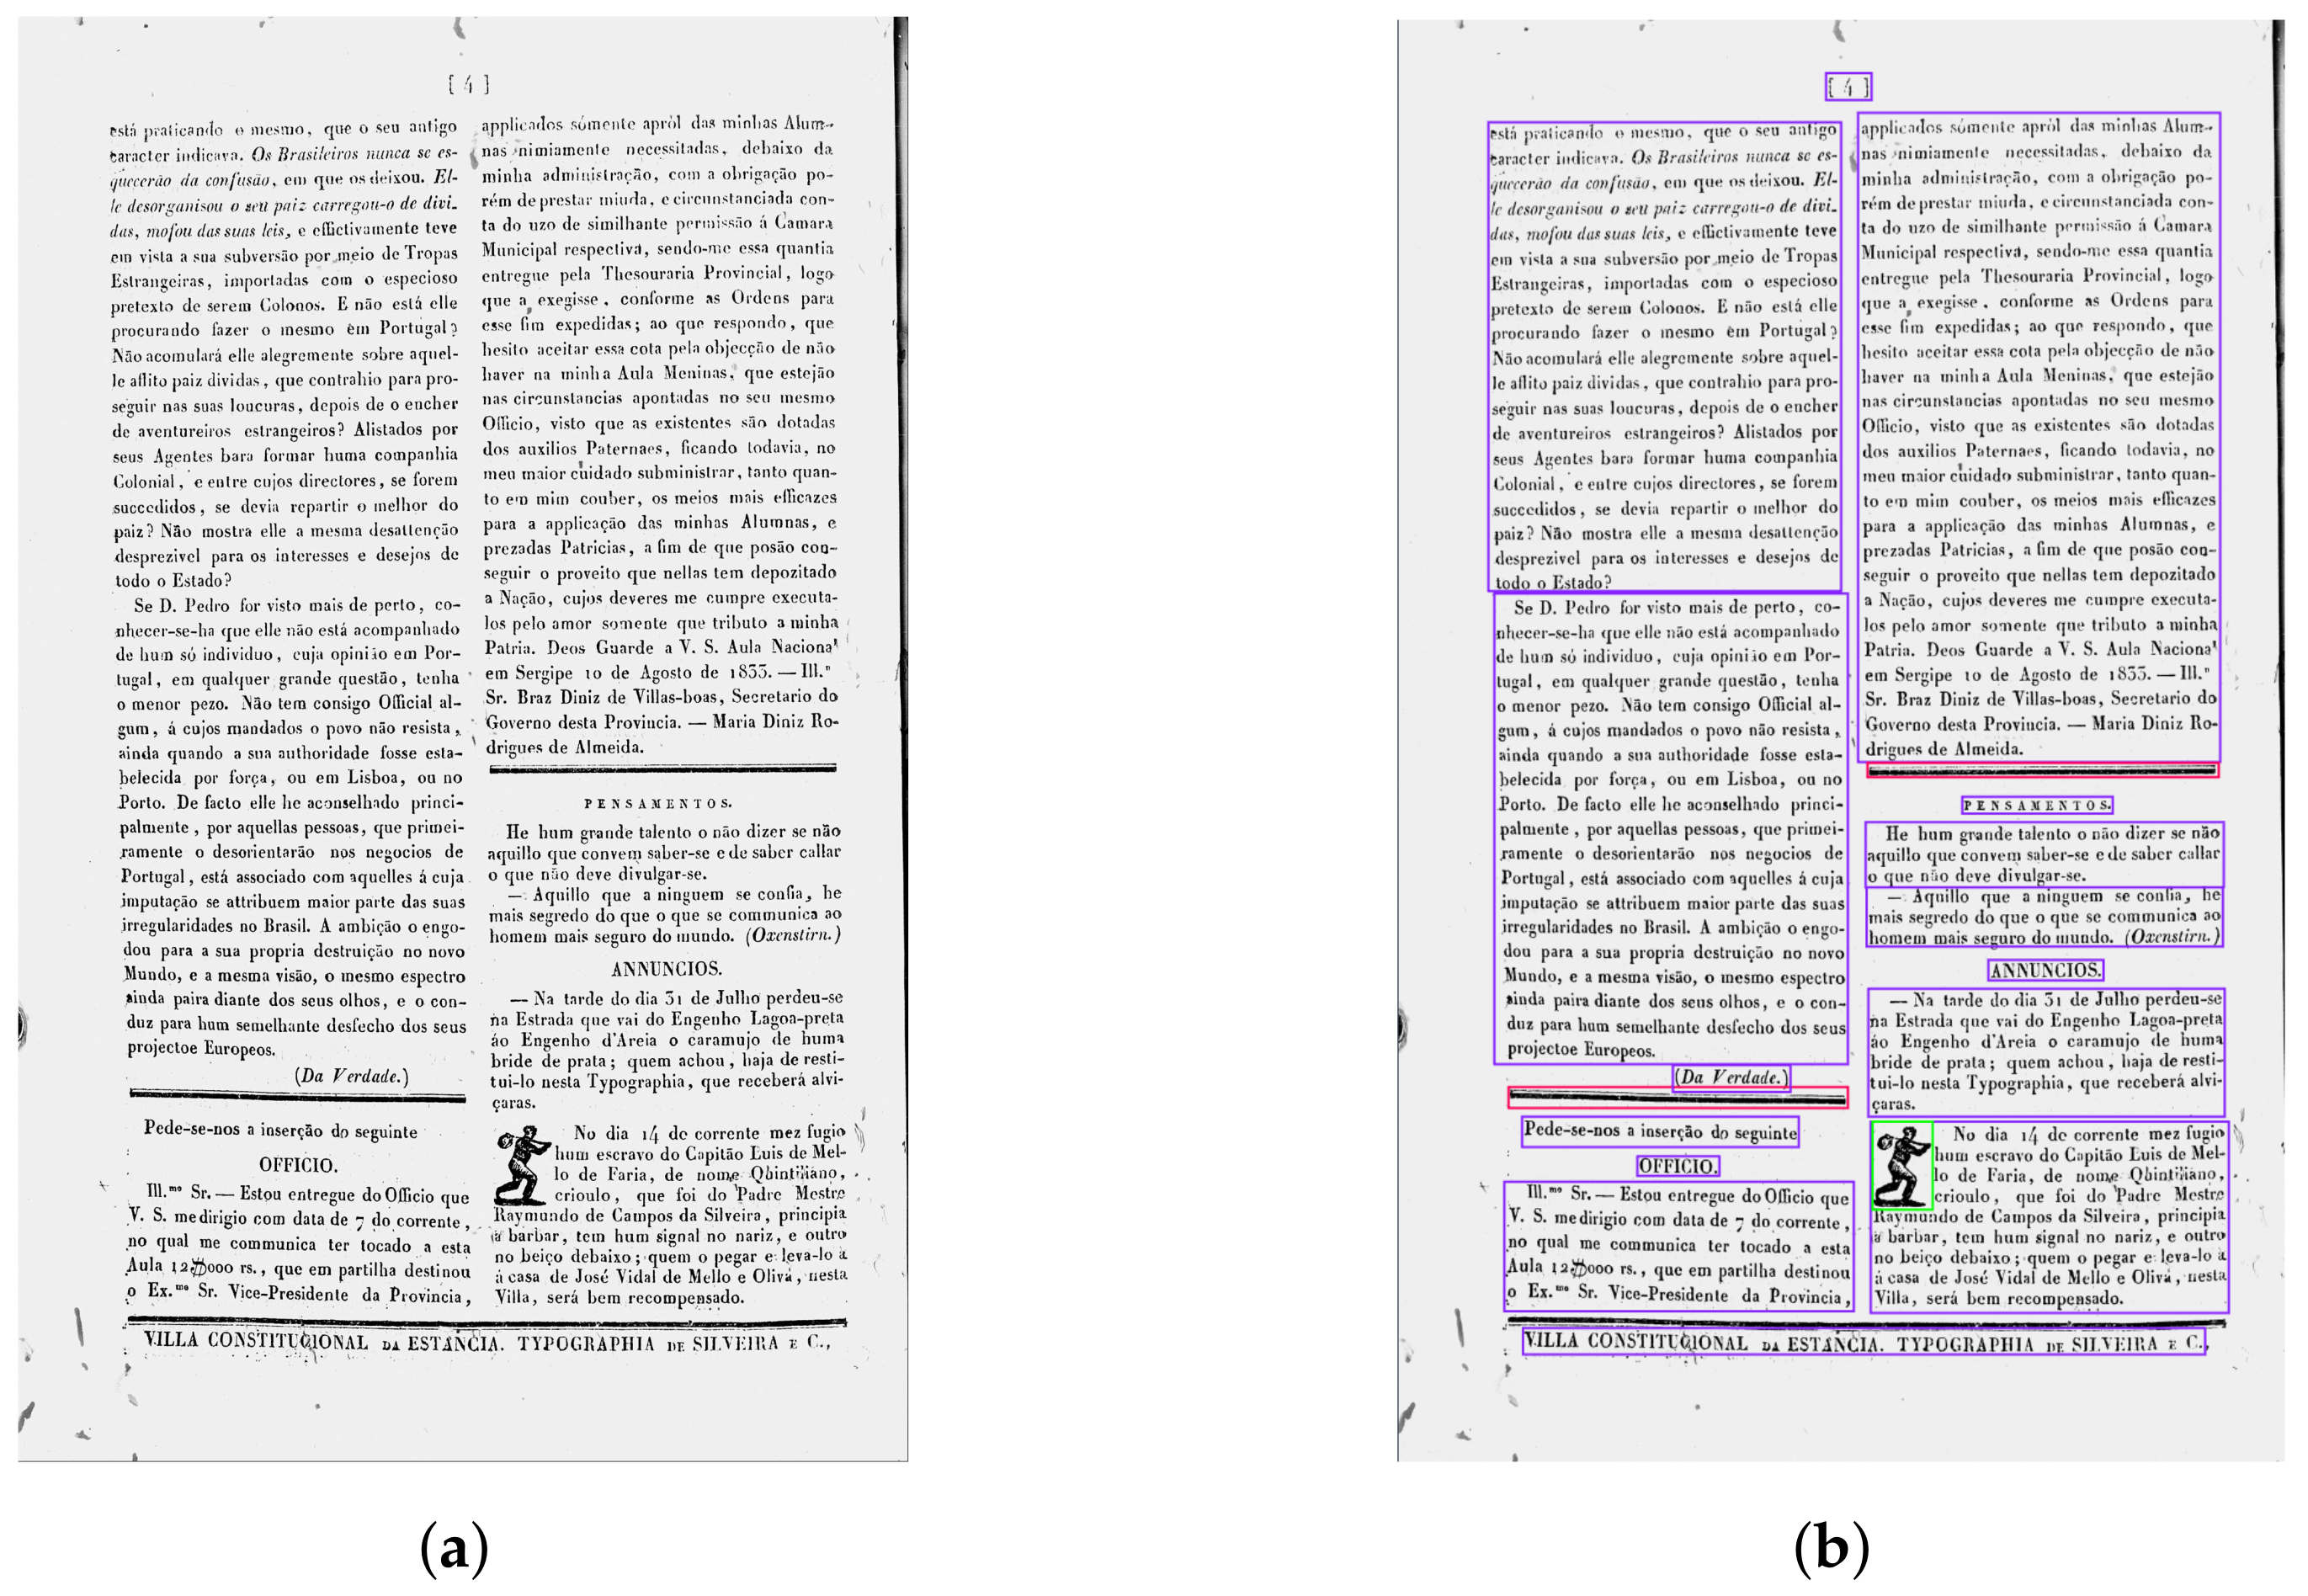
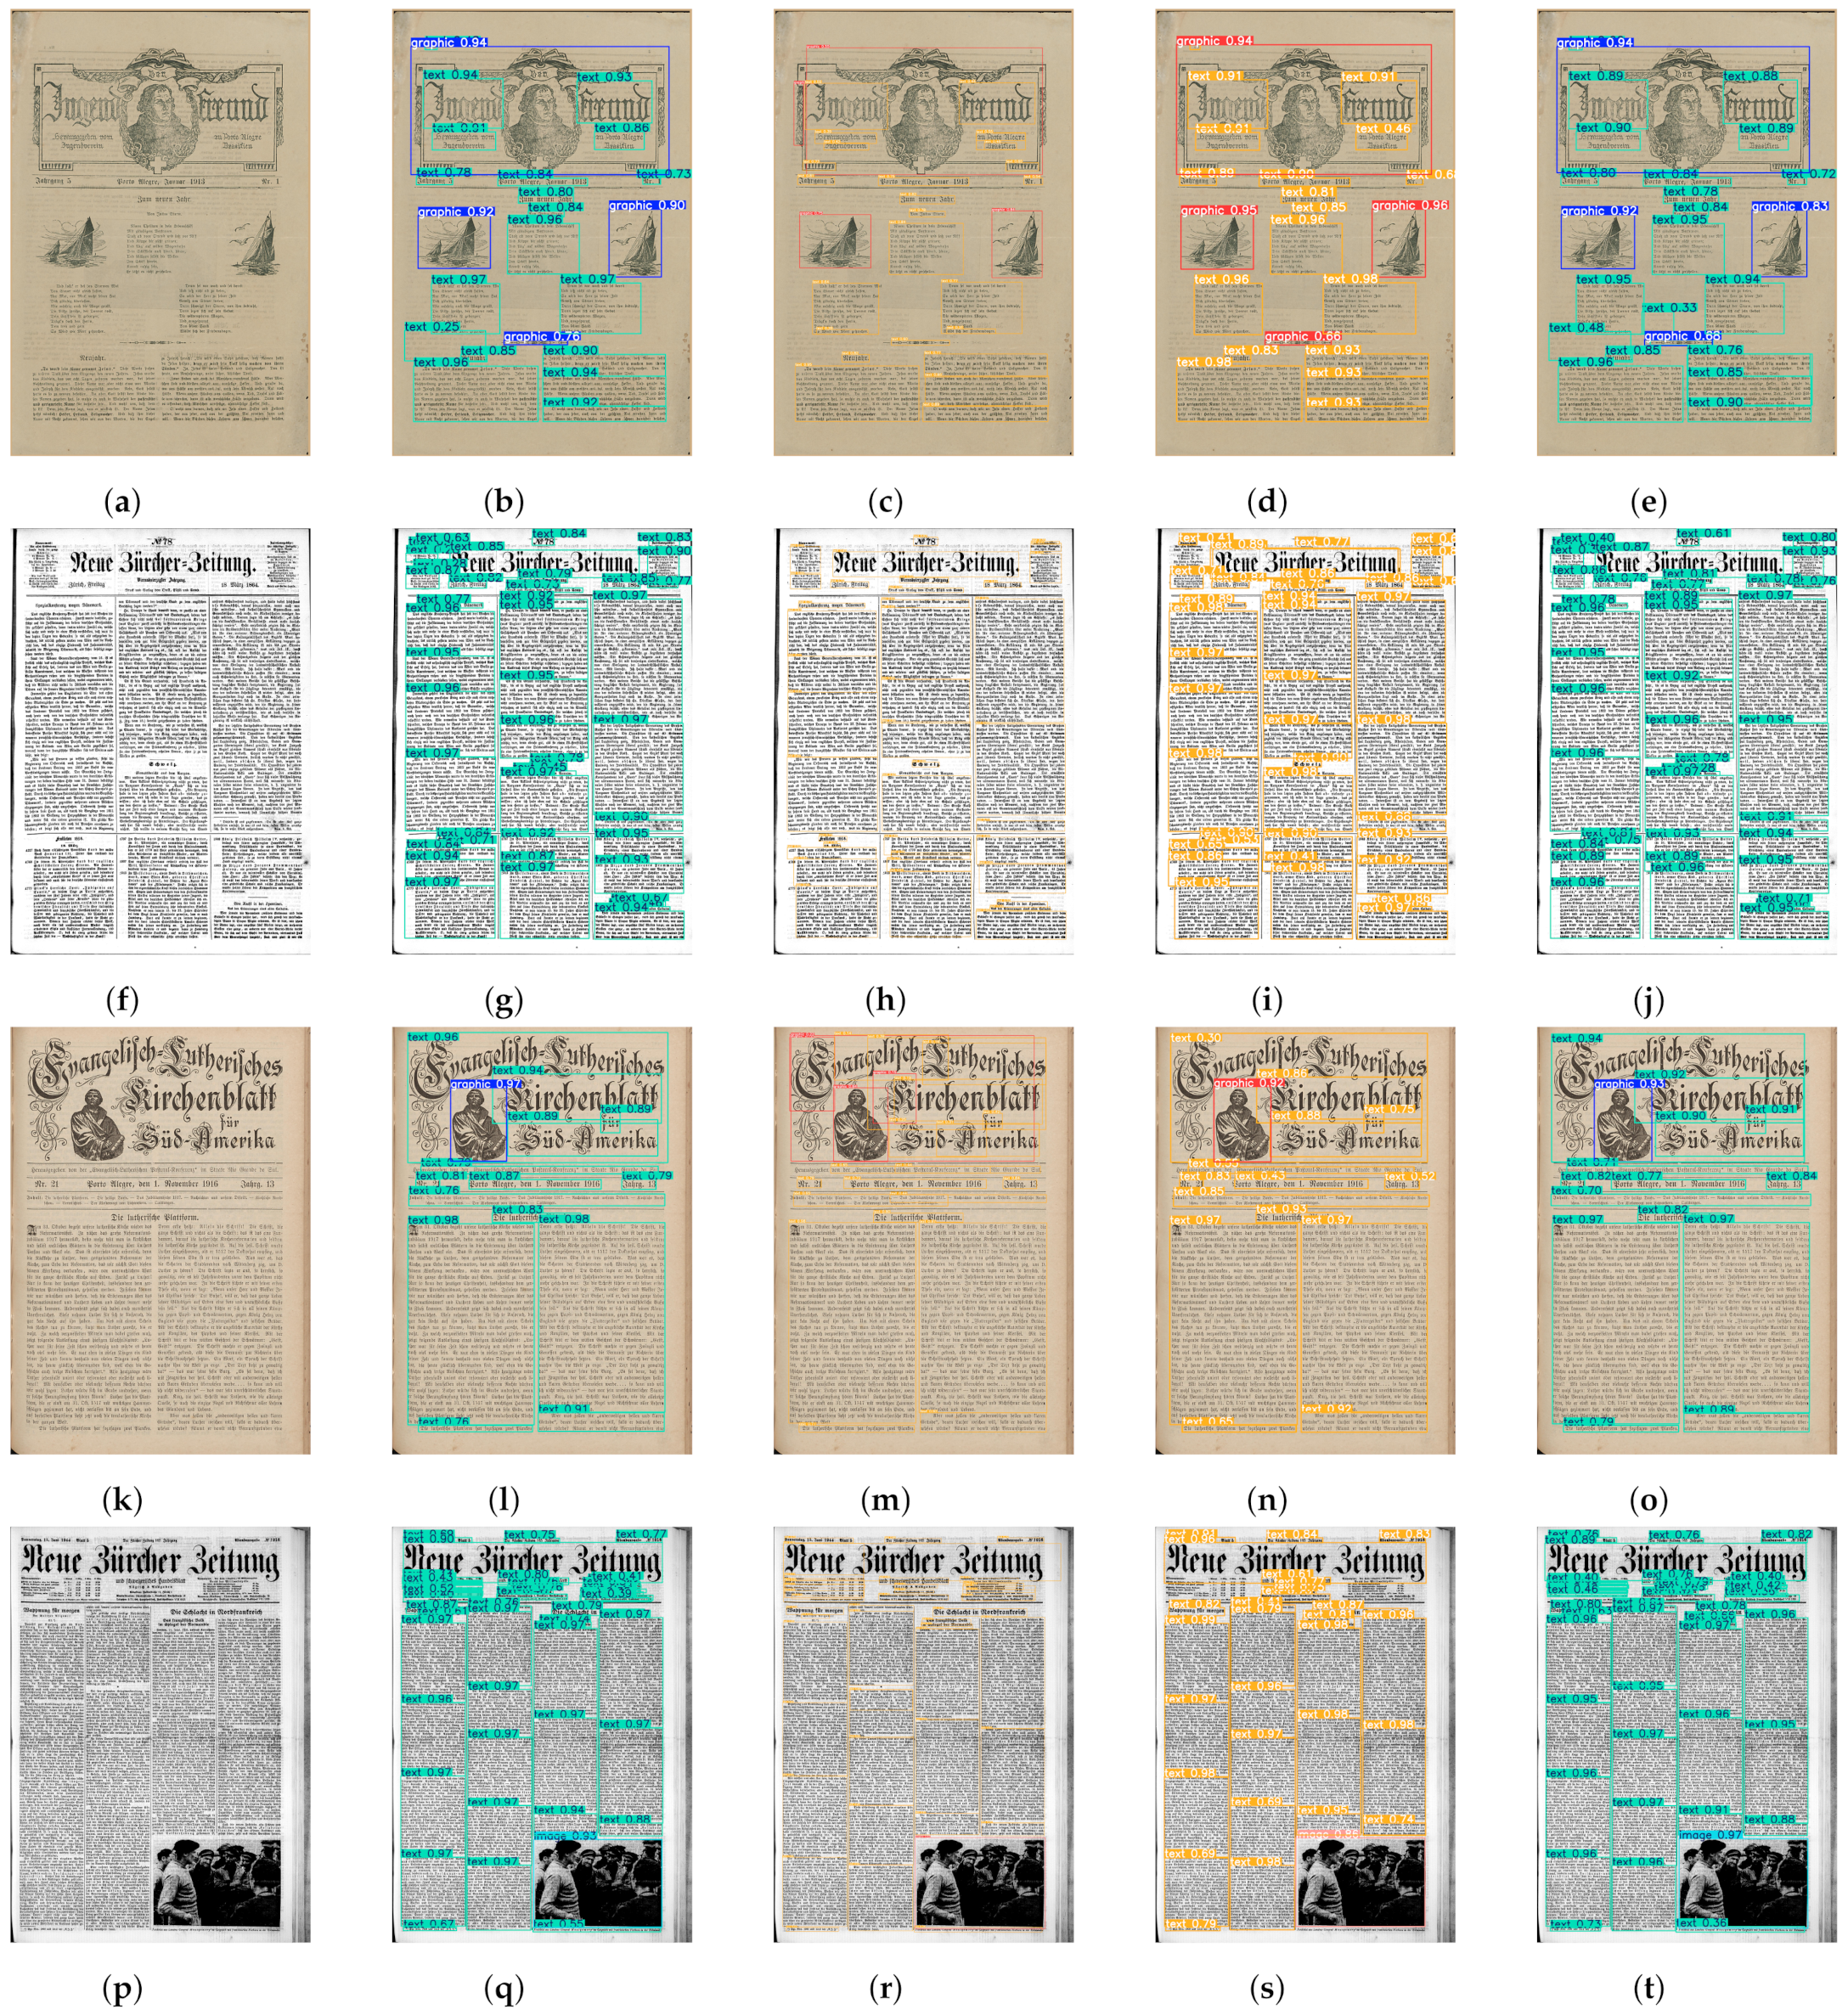
  • In test image 1 (Figure 5a), it can be seen that YOLOv8 (Figure 5b) detects all the desired regions correctly, despite producing two false positives for the Text class: one at the bottom of the document, with 0.25 confidence, and another at the top left. YOLOv9 (Figure 5c), even though many regions on the page are well detected, it has limitations related to the fragmentation of text blocks, low confidence scores in specific areas and confusion between nearby classes. YOLOv10 (Figure 5d) was able to detect all regions, generating only one false positive, which proves its high precision, shown in Table 4. YOLOv11 (Figure 5e) shows a similar result to YOLOv8, but with three false positives from the Text class;
  • In test image 2 (Figure 5f), which has a high number of instances, all of which are of the Text class, the YOLOv8 (Figure 5g) and YOLOv11 (Figure 5j) architectures performed better in the layout analysis task. However, it can be seen that YOLOv9 (Figure 5h) and YOLOv10 (Figure 5i) did not locate all the text regions, which is in line with the lower recall of these architectures.
  • In test image 3 (Figure 5k), it can be seen that YOLOv8 (Figure 5l) correctly identified all text regions, whether in the form of a paragraph, title or subtitle, as well as detecting the graphic element present on the page. Only a section of the subtitle was not detected by YOLOv8 and was left out of the bounding box that was generated for that text. YOLOv9 (Figure 5m) detected fewer layout elements, missing some parts of the text by producing inaccurate bounding boxes and giving rise to false positives for the graphic and text class. YOLOv10 (Figure 5n) and YOLOv11 (Figure 5o), in turn, achieved a similar performance to YOLOv8, with YOLOv11’s result showing bounding boxes better adjusted to the text blocks;
  • In test image 4 (Figure 5p), YOLOv8 (Figure 5q) detected the blocks of text and the image on the newspaper page more accurately and consistently, with the bounding boxes delimiting the text columns well. YOLOv9 (Figure 5r) correctly recognized the image on the page, but did not detect all the text regions, once again underperforming YOLOv8. YOLOv10 (Figure 5s) had the worst result for test image 4 among the architectures, failing to detect several text regions just below the title. Once again, YOLOv11 (Figure 5t) performed closely to YOLOv8, capturing the text regions and the image on the page well.
With regard to failure cases, it can be seen that the YOLO models analyzed reveal distinct patterns of error in the detection of layout elements in historical newspapers. YOLOv8, despite having the best overall performance, showed difficulty in correctly separating very close blocks of text, grouping distinct columns into a single region, which may be related to its sensitivity to textual density. YOLOv9 performed solidly but failed to detect graphics and images in some cases, ignoring these elements or identifying them incompletely, possibly due to its lower ability to capture non-textual visual patterns. YOLOv10 showed a greater tendency towards false positives in empty areas, erroneously detecting non-existent elements, which can be attributed to its sensitivity to noise or variations in the page background; in addition, some images were detected in a fragmented way, suggesting difficulties in generalizing to illustrations of different formats. YOLOv11, on the other hand, had the highest rate of omission of graphics and images, possibly because it prioritizes textual patterns over more varied visual elements, although it was more conservative in detecting text, avoiding undue groupings, but resulting in some under-detections.
These shortcomings highlight common challenges in detecting the layout of historical documents, especially in separating dense text, accurately identifying images and graphics, and minimizing false positives in empty areas. It is believed that improvements can be achieved through pre-processing techniques such as contrast enhancement and noise removal.

3.3. Best Model (YOLOv8) Details

In summary, the YOLOv8 architecture proved to be the most suitable for the task of document layout analysis due to its balanced performance in all criteria, especially in recall and mAP50, which suggests its greater robustness for this application.
To obtain a more detailed view of YOLOv8 performance, Table 5 shows the metrics obtained by class, which had its test set randomly generated without the Table class. In this case, a mAP of 0.995 was obtained for the Image class, 0.911 for the Text class and 0.768 for the Graphic class, ordered from the highest result to the lowest. Most of the instances are from the Text class, which makes it easier to learn this class. The regions of the Image class, although not as numerous, could be recognized by the model. Unlike the Graphic class, which has more complex patterns and one of the fewest instances.
Thus, from an individual point of view, the highest accuracies were obtained for the Text and Image classes, with values above 90 % . The algorithm was particularly excellent at detecting regions in the Image class, with an mAP of almost 100 % . Finally, YOLOv8 achieved a global mAP of 0.891 .
Figure 6 shows the confusion matrix obtained by YOLOv8 on the test set, where the rows indicate the class that was predicted and the columns indicate the true class corresponding to the object detected by the model.
For the Graphic class, 26 true positives, 13 false positives, and 7 false negatives were obtained. For the Image class, the two existing instances were correctly identified. For the Table class, there are no instances in the test set. For the Text class, 2294 true positives, 252 false positives, and 615 false negatives were found. Note the presence of 611 false negatives from the Text class that were detected as background, as well as 252 background regions that were incorrectly classified as text. This error may have been caused by noise in the document or scanning artifacts. However, the confusion matrix reinforces YOLOv8s ability to detect text, as it had a high number of true positives for this class.

4. Conclusions and Future Works

This paper proposes a dataset and presents experiments aimed at analyzing the layout of historical documents using deep learning techniques, more specifically, object detection algorithms. Using the roboflow, a dataset of Brazilian newspapers called BHN was developed, containing 140 images of document pages and ground truth for layout detection. Next, three historical newspaper datasets were combined, including the BHN, and a combined dataset was built, with a larger number of images. This resulted in a dataset with 459 images, which were separated into 321 training samples, 69 validation samples and 69 test samples.
Four state-of-the-art object detection architectures were selected for this study. The algorithms were trained on the combined dataset and then evaluated on the test subset, where YOLOv8 was found to have the best performance. A significant mAP of 89% was obtained for YOLOv8. This model was able to correctly extract a large amount of information present in the documents, mainly texts and images, which were the two most detected classes.
The introduction of the BHN dataset and the combination with other historical datasets allowed for a more robust analysis of the capabilities of these architectures. The BHN stands out as the first dataset aimed at detecting layout in Brazilian historical newspapers, filling a gap in the literature and offering an unprecedented resource for the scientific community. In addition to contributing to research in computer vision and machine learning, the BHN has direct applications in the preservation and digitization of the Brazilian historical press. Its use can facilitate the automatic indexing of digitized newspapers, improve OCR systems and enable more efficient searches in historical collections, benefiting researchers and institutions dedicated to document preservation.
Therefore, in addition to its academic impact, the results of this work have direct implications for real-world applications. The accurate detection of historical newspaper layouts is a fundamental step towards the automated conversion of these documents into searchable and accessible formats. In large-scale projects, such as digital repositories and national libraries, the adoption of robust detection models can significantly speed up the digitization and indexing processes. In addition, integrating these models with OCR systems can improve automatic text extraction, reducing errors associated with inaccurate detections and contributing to better information retrieval.
It is also worth noting that the proposed methodology can also be applied to other datasets, even contemporary documents, and would be useful for solving various problems in public and private institutions, in the sense of automating information recognition tasks in digital or digitized documents. A platform for transcribing the text from the image of the document could also be implemented to facilitate research into historical documents by scholars in the fields of history and archaeology, for example.
For future studies, there is interest in the idea of carrying out a new experiment with transformer-based detection architectures. It would also be interesting to investigate the use of data augmentation techniques to increase the number of images in the dataset and possibly improve performance even further. Another promising idea for scientific advancement in the area is investigation of the impact of the layout analysis step on the final performance of engines OCR open source (such as Tesseract and OCROpy).

Author Contributions

Conceptualization, E.S.d.S.J. and A.B.A.; methodology, E.S.d.S.J.; software, E.S.d.S.J.; validation, E.S.d.S.J., T.P. and A.B.A.; formal analysis, E.S.d.S.J.; investigation, E.S.d.S.J., T.P. and A.B.A.; resources, A.B.A.; data curation, E.S.d.S.J.; writing—original draft preparation, E.S.d.S.J. and T.P.; writing—review and editing, E.S.d.S.J., T.P. and A.B.A.; visualization, E.S.d.S.J.; supervision, A.B.A.; project administration, T.P. and A.B.A.; funding acquisition, A.B.A. All authors have read and agreed to the published version of the manuscript.

Funding

This work was supported by the PAVIC Laboratory, University of Acre, Brazil, benefited from SUFRAMA fiscal incentives under Brazilian Law No. 8387/1991.

Institutional Review Board Statement

Not applicable.

Informed Consent Statement

Not applicable.

Data Availability Statement

Data are contained within the article.

Acknowledgments

The authors gratefully acknowledge support from the PAVIC Laboratory.

Conflicts of Interest

The authors declare no conflicts of interest.

References

  1. Nguyen, T.T.; Le, H.; Nguyen, T.; Vo, N.D.; Nguyen, K. A brief review of state-of-the-art object detectors on benchmark document images datasets. Int. J. Doc. Anal. Recognit. IJDAR 2023, 26, 433–451. [Google Scholar] [CrossRef]
  2. Lopatin, L. Library digitization projects, issues and guidelines: A survey of the literature. Libr. Hi Tech 2006, 24, 273–289. [Google Scholar] [CrossRef]
  3. Barlindhaug, G. Artificial Intelligence and the Preservation of Historic Documents; University of Akron Press: Akron, OH, USA, 2022. [Google Scholar]
  4. Biffi, S. Document Layout Analysis: Segmentation and Classification with Computer Vision and Deep Learning Techniques. Master’s Thesis, ING-Scuola di Ingegneria Industriale e dell’Informazione, Milan, Italy, 2016. [Google Scholar]
  5. Chandra, S.; Sisodia, S.; Gupta, P. Optical character recognition-A review. Int. Res. J. Eng. Technol. (IRJET) 2020, 7, 3037–3041. [Google Scholar]
  6. Araújo, A.B. Análise de layout de página em jornais históricos germano-brasileiros. Master’s Thesis, UFPR-Federal University of Paraná, Curitiba, Brazil, 2019. [Google Scholar]
  7. Jannidis, F.; Kohle, H.; Rehbein, M. Digital Humanities; Springer: Berlin/Heidelberg, Germany, 2017. [Google Scholar]
  8. Zhu, W.; Sokhandan, N.; Yang, G.; Martin, S.; Sathyanarayana, S. DocBed: A multi-stage OCR solution for documents with complex layouts. In Proceedings of the AAAI Conference on Artificial Intelligence, Online, 22 February–1 March 2022; Volume 36, pp. 12643–12649. [Google Scholar] [CrossRef]
  9. Dai-Ton, H.; Duc-Dung, N.; Duc-Hieu, L. An adaptive over-split and merge algorithm for page segmentation. Pattern Recognit. Lett. 2016, 80, 137–143. [Google Scholar] [CrossRef]
  10. Shehzadi, T.; Stricker, D.; Afzal, M.Z. A hybrid approach for document layout analysis in document images. In Proceedings of the International Conference on Document Analysis and Recognition, Athens, Greece, 30 August–4 September 2024; Springer: Berlin/Heidelberg, Germany, 2024; pp. 21–39. [Google Scholar] [CrossRef]
  11. Cong, X.; Li, S.; Chen, F.; Liu, C.; Meng, Y. A review of YOLO object detection algorithms based on deep learning. Front. Comput. Intell. Syst. 2023, 4, 17–20. [Google Scholar] [CrossRef]
  12. Lavanya, G.; Pande, S.D. Enhancing Real-time Object Detection with YOLO Algorithm. EAI Endorsed Trans. Internet Things 2024, 10, 12. [Google Scholar] [CrossRef]
  13. Wang, C.Y.; Liao, H.Y.M. YOLOv1 to YOLOv10: The fastest and most accurate real-time object detection systems. APSIPA Trans. Signal Inf. Process. 2024, 13, e29. [Google Scholar] [CrossRef]
  14. Saha, R.; Mondal, A.; Jawahar, C. Graphical object detection in document images. In Proceedings of the 2019 International Conference on Document Analysis and Recognition (ICDAR), Sydney, Australia, 20–25 September 2019; IEEE: Piscataway, NJ, USA, 2019; pp. 51–58. [Google Scholar] [CrossRef]
  15. Alaasam, R.; Kurar, B.; El-Sana, J. Layout analysis on challenging historical arabic manuscripts using siamese network. In Proceedings of the 2019 International Conference on Document Analysis and Recognition (ICDAR), Sydney, Australia, 20–25 September 2019; IEEE: Piscataway, NJ, USA, 2019; pp. 738–742. [Google Scholar] [CrossRef]
  16. Xu, Y.; Li, M.; Cui, L.; Huang, S.; Wei, F.; Zhou, M. Layoutlm: Pre-training of text and layout for document image understanding. In Proceedings of the 26th ACM SIGKDD International Conference on Knowledge Discovery & Data Mining, Virtual, 6–10 July 2020; pp. 1192–1200. [Google Scholar]
  17. Appalaraju, S.; Jasani, B.; Kota, B.U.; Xie, Y.; Manmatha, R. Docformer: End-to-end transformer for document understanding. In Proceedings of the IEEE/CVF International Conference on Computer Vision, Montreal, QC, Canada, 10–17 October 2021; pp. 993–1003. [Google Scholar]
  18. Huang, Y.; Lv, T.; Cui, L.; Lu, Y.; Wei, F. Layoutlmv3: Pre-training for document ai with unified text and image masking. In Proceedings of the 30th ACM International Conference on Multimedia, Lisbon, Portugal, 10–14 October 2022; pp. 4083–4091. [Google Scholar] [CrossRef]
  19. Chen, S.; Sun, P.; Song, Y.; Luo, P. Diffusiondet: Diffusion model for object detection. In Proceedings of the IEEE/CVF International Conference on Computer Vision, Paris, France, 2–3 October 2023; pp. 19830–19843. [Google Scholar]
  20. Zhao, Y.; Lv, W.; Xu, S.; Wei, J.; Wang, G.; Dang, Q.; Liu, Y.; Chen, J. Detrs beat yolos on real-time object detection. In Proceedings of the IEEE/CVF Conference on Computer Vision and Pattern Recognition, Seattle, WA, USA, 17–18 June 2024; pp. 16965–16974. [Google Scholar]
  21. Zhao, Z.; Kang, H.; Wang, B.; He, C. Doclayout-yolo: Enhancing document layout analysis through diverse synthetic data and global-to-local adaptive perception. arXiv 2024, arXiv:2410.12628. [Google Scholar]
  22. Chai, M.; Shen, Z.; Zhang, C.; Zhang, Y.; Wang, X.; Dou, S.; Kang, J.; Zhang, J.; Zhang, Q. DocFusion: A Unified Framework for Document Parsing Tasks. arXiv 2024, arXiv:2412.12505. [Google Scholar]
  23. Salim, H.; Mustafa, F.S. A COMPREHENSIVE EVALUATION OF YOLOv5s AND YOLOv5m FOR DOCUMENT LAYOUT ANALYSIS. Eur. J. Interdiscip. Res. Dev. 2024, 23, 21–33. [Google Scholar]
  24. Deng, Q.; Ibrayim, M.; Hamdulla, A.; Zhang, C. The YOLO model that still excels in document layout analysis. Signal Image Video Process. 2024, 18, 1539–1548. [Google Scholar] [CrossRef]
  25. Gao, Z.; Li, S. YOLOLayout: Multi-Scale Cross Fusion Former for Document Layout Analysis. Int. J. Emerg. Technol. Adv. Appl. (IJETAA) 2024, 1, 8–15. [Google Scholar] [CrossRef]
  26. Fleischhacker, D.; Goederle, W.; Kern, R. Improving OCR Quality in 19th Century Historical Documents Using a Combined Machine Learning Based Approach. arXiv 2024, arXiv:2401.07787. [Google Scholar]
  27. Chen, H.C.; Wu, L.; Zhang, Y. EDocNet: Efficient Datasheet Layout Analysis Based on Focus and Global Knowledge Distillation. arXiv 2025, arXiv:2502.16541. [Google Scholar]
  28. Ströbel, P.; Clematide, S. Improving OCR of Black Letter in Historical Newspapers: The Unreasonable Effectiveness of HTR Models on Low-Resolution Images. In Proceedings of the Digital Humanities 2019 (DH2019), Utrecht, The Netherlands, 9–12 July 2019. [Google Scholar]
  29. Chollet, F. Deep Learning with Python; Simon and Schuster: New York, NY, USA, 2021. [Google Scholar]
  30. Kim, J.H.; Oh, W.J.; Lee, C.M.; Kim, D.H. Achieving optimal process design for minimizing porosity in additive manufacturing of Inconel 718 using a deep learning-based pore detection approach. Int. J. Adv. Manuf. Technol. 2022, 121, 2115–2134. [Google Scholar] [CrossRef]
  31. Sulzbach, L. Building a Dataset of Late Modern German-Brazilian Newspaper Advertisement Pages for Layout and Font Recognition. Bachelor’s Thesis, UFPR-Federal University of Paraná, Curitiba, Brazil, 2022. [Google Scholar]
  32. Terven, J.; Córdova-Esparza, D.M.; Romero-González, J.A. A comprehensive review of yolo architectures in computer vision: From yolov1 to yolov8 and yolo-nas. Mach. Learn. Knowl. Extr. 2023, 5, 1680–1716. [Google Scholar] [CrossRef]
  33. Wang, C.Y.; Yeh, I.H.; Mark Liao, H.Y. Yolov9: Learning what you want to learn using programmable gradient information. In Proceedings of the European Conference on Computer Vision, Milan, Italy, 29 September–4 October 2024; Springer: Berlin/Heidelberg, Germany, 2024; pp. 1–21. [Google Scholar] [CrossRef]
  34. Wang, A.; Chen, H.; Liu, L.; Chen, K.; Lin, Z.; Han, J.; Ding, G. Yolov10: Real-time end-to-end object detection. arXiv 2024, arXiv:2405.14458. [Google Scholar]
  35. Sapkota, R.; Meng, Z.; Churuvija, M.; Du, X.; Ma, Z.; Karkee, M. Comprehensive performance evaluation of yolo11, yolov10, yolov9 and yolov8 on detecting and counting fruitlet in complex orchard environments. arXiv 2024, arXiv:2407.12040. [Google Scholar]
  36. Khanam, R.; Hussain, M. YOLOv11: An Overview of the Key Architectural Enhancements. arXiv 2024, arXiv:2410.17725. [Google Scholar]
  37. Ramos, L.; Casas, E.; Bendek, E.; Romero, C.; Rivas-Echeverría, F. Hyperparameter optimization of YOLOv8 for smoke and wildfire detection: Implications for agricultural and environmental safety. Artif. Intell. Agric. 2024, 12, 109–126. [Google Scholar] [CrossRef]
  38. Ji, X.; Wan, J.; Zhang, Y.; Yang, T.; Yang, Q.; Liao, J. Hydrospot-Yolo: Real-Time Water Hyacinth Detection in Complex Water Environments; Elsevier: Amsterdam, The Netherlands, 2024. [Google Scholar]
  39. Neupane, C.; Walsh, K.B.; Goulart, R.; Koirala, A. Developing Machine Vision in Tree-Fruit Applications—Fruit Count, Fruit Size and Branch Avoidance in Automated Harvesting. Sensors 2024, 24, 5593. [Google Scholar] [CrossRef] [PubMed]
  40. Liu, X.; Wang, Y.; Yu, D.; Yuan, Z. YOLOv8-FDD: A real-time vehicle detection method based on improved YOLOv8. IEEE Access 2024, 12, 136280–136296. [Google Scholar] [CrossRef]
  41. Lee, Y.S.; Prakash Patil, M.; Kim, J.G.; Seo, Y.B.; Ahn, D.H.; Kim, G.D. Hyperparameter Optimization for Tomato Leaf Disease Recognition Based on YOLOv11m. Plants 2025, 14, 653. [Google Scholar] [CrossRef]
  42. Padilla, R.; Netto, S.L.; Da Silva, E.A. A survey on performance metrics for object-detection algorithms. In Proceedings of the 2020 international conference on systems, signals and image processing (IWSSIP), Niterói, Brazil, 1–3 July 2020; IEEE: Piscataway, NJ, USA, 2020; pp. 237–242. [Google Scholar] [CrossRef]
  43. Terven, J.; Cordova-Esparza, D.M.; Ramirez-Pedraza, A.; Chavez-Urbiola, E.A. Loss functions and metrics in deep learning. A review. arXiv 2023, arXiv:2307.02694. [Google Scholar]
  44. Wang, B. A parallel implementation of computing mean average precision. arXiv 2022, arXiv:2206.09504. [Google Scholar]
Figure 1. Flowchart of the experiment put into practice.
Applsci 15 03164 g001
Figure 2. BHN dataset image markings, showing: (a) Source image; (b) Ground truth, where the purple bounding box indicates the text class, the green color indicates the graphic class and the red color indicates the separator class.
Applsci 15 03164 g002
Figure 3. Sample images from the dataset.
Applsci 15 03164 g003
Figure 4. Illustration describing the calculation of the I o U .
Applsci 15 03164 g004
Figure 5. Predictions made by the architectures on four test images, (a) Test image 1, (b) YOLOv8, (c) YOLOv9, (d) YOLOv10, (e) YOLOv11, (f) Test image 2, (g) YOLOv8, (h) YOLOv9, (i) YOLOv10, (j) YOLOv11, (k) Test image 3, (l) YOLOv8, (m) YOLOv9, (n) YOLOv10, (o) YOLOv11, (p) Test image 4, (q) YOLOv8, (r) YOLOv9, (s) YOLOv10, (t) YOLOv11.
Applsci 15 03164 g005
Figure 6. YOLOv8 confusion matrix.
Applsci 15 03164 g006
Table 1. Characteristics of the datasets selected.
DatasetImagesPages
QualityDPIFormat
BlaLet GTGray224–521TIFF167
GBNBitonal300PNG152
RGB600
BHN (Our)RGB96PNG140
Table 2. Classes evaluated in the experiments.
DescriptionCount
Text14.333
Image23
Graphic462
Table42
Table 3. Hyperparameters of the experiment.
HyperparameterValue
Epochs100
Batch Size16
Image Size640 × 640
Learning Rate0.01
Momentum0.937
Table 4. Comparison of the architectures’ performances.
ArchitectureRecallPrecisionmAP50
YOLOv80.8090.8450.891
YOLOv90.7120.7540.757
YOLOv100.4950.9490.692
YOLOv110.8010.8540.871
Table 5. YOLOv8 performance by class.
ClassesRecallPrecisionmAP50
Text0.8250.8880.911
Image1.0000.7590.995
Graphic0.6020.8870.768
all0.8090.8450.891
Disclaimer/Publisher’s Note: The statements, opinions and data contained in all publications are solely those of the individual author(s) and contributor(s) and not of MDPI and/or the editor(s). MDPI and/or the editor(s) disclaim responsibility for any injury to people or property resulting from any ideas, methods, instructions or products referred to in the content.

