Article

Study on the Design and Construction Methods of Auxiliary Workings for the Deepening of Shaft II in the Borynia Mine

1
KOMAG Institute of Mining Technology, 37 Pszczyńska, 44-101 Gliwice, Poland
2
Przedsiębiorstwo Budowy Szybów SA, 5-9 Hutnicza, 42-600 Tarnowskie Góry, Poland
3
Mineral and Energy Economy Research Institute, Polish Academy of Sciences, 7A Wybickiego, 31-261 Cracow, Poland
*
Author to whom correspondence should be addressed.
Appl. Sci. 2025, 15(6), 3131; https://doi.org/10.3390/app15063131
Submission received: 15 February 2025 / Revised: 3 March 2025 / Accepted: 12 March 2025 / Published: 13 March 2025
(This article belongs to the Special Issue Advances in Tunnel and Underground Construction)

Abstract

:
This study explores the design and construction methods for auxiliary workings for the deepening of Shaft II at the Borynia Mine. The shaft, an essential intake structure for personnel and material transport, is being extended from 980 m to 1150 m to provide access to a new mining level at 1120 m. Given the challenging geological and operational conditions, a top-to-bottom deepening method was adopted, with excavation from a sub-level accessed via an auxiliary incline. The study details the planning and implementation of key auxiliary workings, including hoisting machine chamber and technological shaft inset. A comprehensive geotechnical analysis was conducted to assess rock mass properties, classify geological formations, and estimate mechanical parameters affecting excavation stability. The support system design was carried out using both analytical and numerical methods, ensuring safe and efficient construction. The applied primary and secondary support structures have successfully maintained excavation stability. The findings demonstrate the reliability of the adopted engineering solutions and their applicability in deep mining environments.

1. Introduction

1.1. Overview of Shaft Deepening Methods

The deepening of existing shafts in active mines is typically carried out in conjunction with the development of a new mining level, a scenario commonly encountered in underground coal mines. The technical and operational conditions associated with shaft deepening are generally more challenging than those faced during the sinking of a new shaft from the ground surface. This complexity arises from the necessity of performing construction works related to shaft deepening simultaneously with the ongoing operation of hoisting vessels within the existing section of the shaft [1].
Shaft deepening can be performed using two primary approaches: top-to-bottom or bottom-to-top, also known as the reverse sinking method [1]. Bottom-to-top shaft deepening can be performed using three distinct methods [2]:
  • The conventional drill-and-blast method, used in the past for reverse shaft sinking in high quality rock masses without significant waterlogging.
  • The deep-hole blasting method, developed to address safety and work efficiency challenges associated with the conventional drill-and-blast method.
  • The raise-boring method, which involves excavating the shaft by back-reaming a pilot hole using drill rigs.
The application of the bottom-to-top deepening method requires the prior development of a new mining level through another shaft or incline. Moreover, this method can only be used in compact rocks of high or medium strength, without joints or significant waterlogging. Consequently, the reverse shaft sinking has not found widespread application in the Polish mining industry. Instead, top-to-bottom deepening methods have been widely employed, as follows:
  • The method of direct shaft sinking from the existing mining level, which involves leaving a protective rock shelf or constructing the so-called artificial bottom [3,4] below the existing section of the shaft.
  • The method of shaft sinking from a sub-level accessed via an auxiliary incline or a sub-shaft constructed from an existing mining level. The depth of the sub-level must be selected in such a way that it enables the creation of a protective rock shelf or the construction of the so-called artificial bottom below the existing section of the shaft.
The method of direct shaft sinking from the existing level may be used only if a separate deepening compartment can be established within the shaft cross-section and the shaft workings at the existing mining level can be adapted for activities related to shaft deepening [1]. On the other hand, the use of the sub-level deepening method allows for the uninterrupted operation of the existing mining level throughout the shaft deepening period. Therefore, despite higher capital expenditures, this method is currently used almost exclusively in Polish coal mining practices. In the last two decades, this method has been used for the deepening of shafts such as Leon IV [5], Janina VI [6], Jankowice VIII, Zofiówka IIz, and Pniówek III.

1.2. Deepening of Shaft II in the Borynia Mine

Shaft II of the Borynia Mine is an intake shaft equipped with two hoists used for the transportation of personnel and materials. The shaft is currently connected to mining levels at depths of 713 m, 838 m, and 950 m. Its diameter is 7.2 m along its entire length. The shaft was designed to be deepened from a depth of 980 m to approximately 1150 m, thereby providing access to a new mining level at a depth of 1120 m.
In the conceptual design developed in 2018, it was assumed that the shaft deepening would be carried out using the top-to-bottom method from a sublevel accessed via an auxiliary incline. The decision to select the top-to-bottom deepening method for Shaft II was primarily influenced by two critical factors. First, the contractor’s limited experience with alternative deepening techniques, particularly the bottom-to-top approach, posed significant risks in terms of efficiency and safety. Second, the relatively low strength of the rock mass and the considerable excavation depth necessitated a deepening method that would ensure shaft stability and operational safety. At the conceptual design stage, two possible approaches to the top-to-bottom shaft sinking were considered, as follows:
  • Sinking with a large-diameter borehole used for the gravitational transport of mined rock to the mining level at a depth of 1120 m.
  • Conventional sinking without a large-diameter borehole, whereby mined rock is transported to the sub-level (using a shaft hoist) and then to the existing mining level at a depth of 950 m (using conveyor belts).
Since the new mining level at a depth of 1120 m could not be accessed before the commencement of shaft deepening, the sinking method without a large-diameter borehole was ultimately chosen (excluding only the short section of the shaft located between the hoisting machine chamber and the technological shaft inset). Therefore, the following auxiliary workings had to be excavated before the commencement of shaft sinking:
  • Connecting drift I, the technological incline, and the technological drift were used as access routes to Shaft II, as well as transport routes for materials and mined rock from excavated shaft.
  • Technological shaft inset was used as a loading point for materials, a discharge point for mined rock from the excavated shaft, and a location for the concrete mixing plant.
  • Hoisting machine chamber with the shaft inset was used as a location for hoisting machines and mining reels.
  • Connecting drift II was used as an access route to the hoisting machine chamber.
Arrangement of auxiliary workings for the deepening of Shaft II is illustrated in Figure 1.

2. Rock Mass Characteristics

2.1. Geological Conditions in the Area of Shaft II

The geological data used in this study were obtained from several sources. The G.281(05) borehole, drilled from a mining level at 950 m depth, provided core samples over a length of approximately 308 m. These samples were collected at regular intervals to determine lithology and coal seam thickness. Additional data were obtained from the geological profile of Shaft II and the mine plan of the 950 m level, which included geological information from previous excavation works. Field observations from the on-site inspection also played a crucial role in confirming the lithology and structural features encountered during excavation. The reliability of the data were ensured through cross-validation between these sources. Discrepancies were addressed by correlating borehole data with field observations and the geological profile, improving the accuracy of the interpretation.
The rock mass in the vicinity of Shaft II, within a depth range of 950–1150 m, consists of Carboniferous formations represented by the Lower Ruda (coal seams 417/1–418/1-2) and Saddle (coal seams 502/1–503-1) beds. These formations are composed of alternating layers of sandstones and claystones, with occasional interlayers of coal seams and mudstones. In the geological shaft profile, sandstones (63%) predominate over claystones (25%). The thickness of the coal seams varies from 0.80 m to 5.40 m.
Groundwater conditions were not identified as a major concern in the area of Shaft II due to the relatively low permeability of the host rock and stable hydrogeological conditions. Field observations confirmed the absence of significant groundwater ingress or pressure buildup, which justified the decision to exclude groundwater as a design parameter in further analyses.

2.2. Intact Rock Parameters

The planned auxiliary workings, located within a depth range of 957.00–1012.20 m, were predominantly excavated in compact rocks with uniaxial compressive strength (σc) ranging from 35.6 to 73.9 MPa, tensile strength (σt) varying from 3.8 to 8.9 MPa, and Rock Quality Designation (RQD) values ranging from 60% to 100%.
Due to the lack of laboratory tests for deformation modulus (Ei) for the considered rock formations, the values of deformation modulus for intact rock were estimated using the modulus ratio (MR) using the following equation:
E i = M R · σ c , i .
The modulus ratio values used in this study were based on laboratory tests conducted by Małkowski et al. [7], who investigated the relationship between Young’s modulus and uniaxial compressive strength for Carboniferous sedimentary rocks, including sandstones, mudstones, and claystones.
The basic mechanical parameters of intact rock, along with RQD values for different lithological units in the area of Shaft II within a depth range of 957.00–1012.20 m, are summarized in Table 1.
Possible geological uncertainties, such as spatial variability of rock mass properties and the potential presence of fault zones, were addressed by adopting conservative lower-bound values for geotechnical parameters derived from laboratory tests on intact rock samples. Additionally, safety factors in accordance with relevant regulations were applied in the later design stages to ensure the stability and reliability of the excavation and support systems under diverse geological conditions.

2.3. Rock Mass Classifiaction

Due to the large scale and discontinuous nature of in situ rock masses, which is incomparable to conventional engineering materials such as steel or concrete, the estimation of rock mass parameters has traditionally been based on empirical classification systems, such as the Rock Mass Rating (RMR) [8], the Geological Strength Index (GSI) [9,10,11], or the Q-system [12]. These classification systems take into account factors such as the spacing, condition, and orientation of discontinuities, as well as intact rock strength and groundwater conditions, providing a useful tool for the initial assessment of rock mass quality and potential support solutions.
In the present study, the RMR system was adopted for the initial assessment of rock mass quality, while the GSI system was used to obtain the mechanical parameters of the rock mass. The GSI values for different lithological units were calculated using previously estimated RMR index values, based on the equation proposed by Hoek and Brown [13]:
G S I = R M R 5 .
The estimation of GSI based on the RMR index is a widely adopted approach in numerous studies on the stability of tunnels and mine workings [14,15,16,17,18,19]. In other cases, GSI was determined through visual observations of the rock mass appearance and the use of GSI charts for jointed rock masses [20,21,22].
The GSI value calculated using Equation (2) was employed to estimate the peak rock mass properties. On the other hand, the Residual Geological Strength Index (GSIr) was applied to determine the residual (post-peak) rock mass properties. Cai et al. proposed a method for estimating the GSIr value based on in situ block shear test data and the back-analysis of rock slopes [23]. According to Cai et al., the GSIr value can be calculated using the following equation:
G S I r = G S I · e 0.0134 · G S I .
A different approach was proposed by Dressel and Diederichs, who analyzed a combined database comprising Cai et al.’s field data and Walton et al.’s laboratory data [24]. They introduced an empirical relationship to calculate the GSIr value based on the peak GSI and the Hoek–Brown material constant for intact rock, mi [25]:
G S I r G S I = 1 + m i 33 1.5 · G S I m i 100 .
The method proposed by Cai et al. most likely represents a lower bound for residual rock mass strength [26]. Therefore, it was ultimately adopted for further analysis, providing an additional safety factor for the designed support structures.
The estimated RMR values, along with the peak and post-peak GSI values for different lithological units in the area of Shaft II within a depth range of 957.00–1012.20 m, are summarized in Table 2.

2.4. Estimation of Rock Mass Strenght Properties

Even the most sophisticated failure criteria, laboratory tests of intact rock, and rock mass classification systems have little practical value unless they can be used to estimate the representative mechanical properties of jointed rock masses [27]. Therefore, in the present study, the following strength degradation relations for undisturbed rock mass, proposed by Hoek et al. [28] and reiterated by Hoek and Brown [29], were employed to determine the Hoek–Brown material constants m, s, and a:
m m i = exp G S I 100 28 ,
s = exp G S I 100 9 ,
a = 1 2 + 1 6 · exp G S I 15 exp 20 3 .
The recommended method for determining the Hoek–Brown material constant mi is the triaxial compressive test of intact rock samples [30]. However, due to the lack of relevant data, a different approach had to be employed in the present study, based on the research conducted by Arshadnejad [31], who provided the following relationship between the material constant mi and intact strength parameters for sedimentary rocks:
m i = exp 1.3 · σ c , i 2.5 · σ t , i σ t , i 0.26 .
Equivalent Mohr–Coulomb strength parameters, found by fitting linear Coulomb failure envelope to the parabolic Hoek–Brown failure envelope, were calculated with use of the solution provided by Hoek et al. [28]:
c e q = σ c , i · 1 + 2 · a · s + 1 a · m · σ 3 n · s + m · σ 3 n a 1 1 + a · 2 + a · 1 + 6 · a · m · s   +   m · σ 3 n a 1 1   +   a · 2   +   a ,
φ e q = sin 1 6 · a · m · s + m · σ 3 n a 1 2 · 1 + a · 2 + a + 6 · a · m · s + m · σ 3 n a 1 ,
where ceq is the equivalent cohesion, φeq is the equivalent internal friction angle, m, s, and a are Hoek–Brown material constants for jointed rock mass and σ3max is the upper limit of the confining stress.
In the present study, the peak strength properties of the jointed rock mass were calculated based on the Geological Strength Index (Table 3), while the post-peak properties were estimated using the Residual Geological Strength Index (Table 4).

2.5. Estimation of Rock Mass Deformation Modulus

The mechanical analysis of underground excavations requires knowledge of the rock mass deformation modulus (Em), which plays a crucial role in assessing excavation stability and estimating support loads. In the present study, the following relationship proposed by Hoek and Diederichs [32] was applied to determine the deformation moduli of rock masses in the vicinity of Shaft II:
E m = E i · 0.02 + 1 1 + exp 60 G S I 11 .
The calculated values of rock mass deformation modulus, along with the deformation modulus of intact rock for different lithological units in the area of Shaft II within a depth range of 957.00–1012.20 m, are summarized in Table 5.

2.6. In Situ Stress

The pre-mining state of stress is one of the most important factors in the design and construction of underground excavations. Results from in situ stress measurements indicate that the ratio of horizontal to vertical stress (k) is highly dependent on depth. At shallow depths, k values are often greater than unity, while at greater depths, the upper bound of the k ratio approaches unity [33].
Therefore, for the purposes of the present study, a hydrostatic state of stress was assumed, meaning that horizontal and vertical stresses are equal (k ratio equals 1). Consequently, values of the in situ stresses were determined based on the following relation:
p z = p x = γ o · H ,
where pz and px represent the vertical and horizontal in situ stress, respectively, γo denotes the average bulk weight of the overburden rock, and H is the overburden thickness. Assuming an average bulk weight of the overburden rock of 0.024 MN/m3, estimated values of the horizontal and vertical stress at a depth range of 957.00–1012.20 m vary between 22.97 and 24.29 MPa.

3. Analytical Method of Support Design

3.1. Calculation of the Support Pressure

The post-mining state of stress resulting from an underground excavation can be calculated using analytical, elastic [34] or elasto-plastic [35,36,37], closed-form solutions. Analytical closed-form solutions are typically limited to simple geometries and material models; therefore, they should always be applied with appropriate caution. Nevertheless, an analytical approach to stress state calculation can serve as a valuable tool for a “sanity check” of the results obtained from more advanced numerical analyses.
In this study, a closed-form solution based on an elasto-plastic strain-softening rock mass model was employed in accordance with the guidelines outlined in the Polish National Standards PN-G-05020 [38] and PN-G-05600 [39], as well as the additional recommendations provided by Chudek et al. [40,41].
For excavation shapes other than circular, an equivalent excavation radius was calculated using the following equation:
r e q = A π ,
where A represents the excavation cross-sectional area.
Peak and post-peak compressive strength of the rock mass were determined by the following relationships:
R c g = 2 · c · c o s φ 1 s i n φ ,
where Rcg and Rcg′ represent the peak and post-peak compressive strength of the rock mass, respectively, c and c′ denote the peak and post-peak cohesive strength of the rock mass, while φ and φ′ are the peak and post-peak internal friction angles.
To simplify further calculation, a factor β, defined by Equation (8) was introduced as follows:
β = 2 · s i n φ 1 s i n φ .
The radial stress at the boundary between the elastic and plastic zones (synonymous with the critical support pressure required to prevent rock mass failure), pg was calculated as follows:
p g = 2 · p z R c g 2 + β ,
where pz represents the far-field (in situ) stress.
The radius of the plastic zone is a function of an active support pressure. For a support system consisting of yielding steel sets equipped with sliding joints, the active support pressure can be estimated using the following equation:
p a = N j r e q · e ,
where Nj is the yielding force of the sliding joints, and e denotes the spacing between steel sets.
The radius of the plastic zone, rl, was determined based on the estimated value of the active support pressure using the following equation:
r l = r e q · p g · β + R c g p a · β + R c g 1 β .
The development of the plastic zone around the underground excavation corresponds to the occurrence of static rock mass pressure, which results from the gravitational load of the plasticized and fractured roof rocks [42]. The characteristic value of the static support pressure of the plasticized rock mass, qzN, was calculated using the following equation:
q z N = γ r · r l r z ,
where γr is the bulk weight of the roof rocks.
The design value of the static support pressure of the plasticized rock mass, qzo, was calculated as follows:
q z o = n · k s · q z N ,
where n is the partial load factor according to Table 1 in the Polish National Standard PN-G-05600 [39], and ks is the impact factor of the adjacent excavation, calculated using the following formula proposed by Rułka et al. [43]:
k s = 1 + 1 1 + x s w a 2 ,
where xs is the distance between neighboring excavations, and wa is the width of the adjacent excavation.
Calculation results of the static support pressure for two different auxiliary workings in the area of Shaft II: the hoisting machine chamber (excavation A) and the technological shaft inset (excavation B), are summarized in Table 6.

3.2. Determination of Support Parameters

Given the significant rock mass deformation anticipated based on the results of the initial analysis, yielding steel arches equipped with sliding joints were employed as the primary support for both the hoisting machine chamber and the technological shaft inset. The maximum spacing of the steel sets was determined using the relationship proposed by Chudek et al. for steel sets constructed from V-profiles [40,41,44]:
e m a x = m i n f y d · ( m + n 1 ) M m a x W x + N c o r ϕ · A · m 1 , N j N
where Mmax is the maximum value of the bending moment, Ncor is the corresponding value of the axial force, N is the value of the axial force in the sliding joint, Wx is the elastic section modulus of the V-profile, A is the cross-sectional area of the V-profile, fyd is the design yield strength of the steel, ϕ is the buckling factor according to the Polish National Standard PN-B-03200 [45], while m, n1, and m1 are the shape factor, material plasticity coefficient, and support working condition factor, respectively.
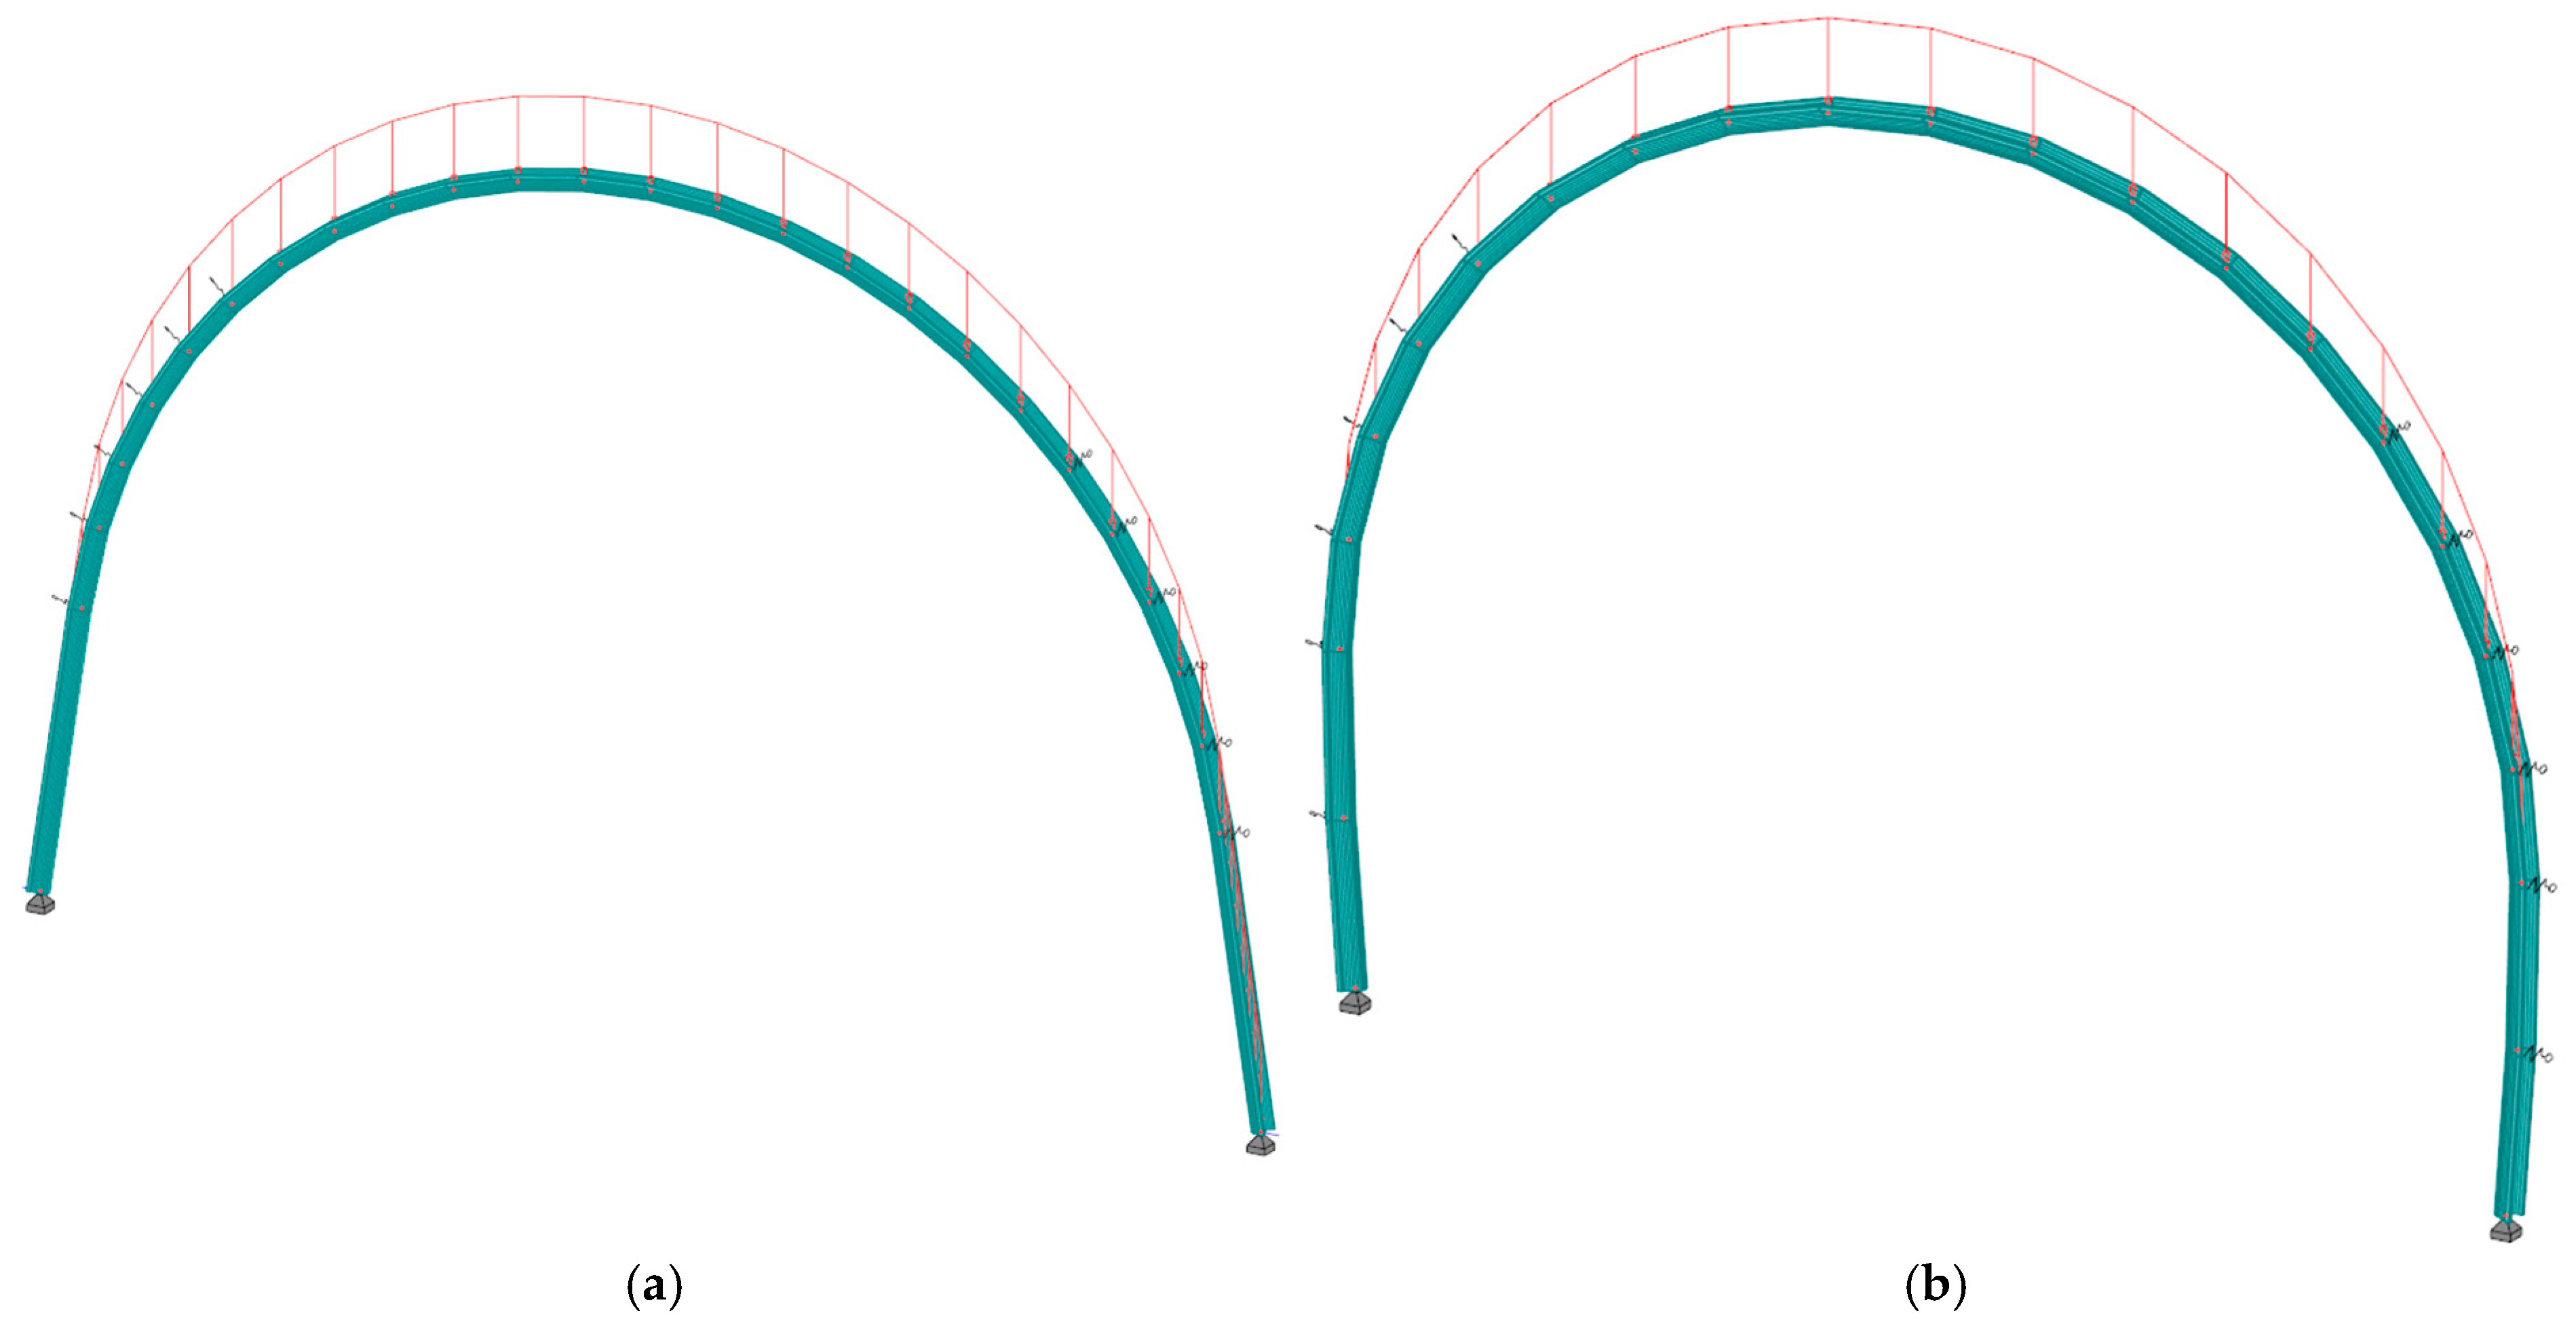
To determine the internal forces in the steel arches subjected to the static support pressure, Autodesk Robot Structural Analysis software, based on the finite element method, was used. The steel arches were modeled as a 2D frame composed of bar elements. Additionally, to account for the ground–structure interaction between the rock mass and the steel sets, spring supports characterized by a stiffness coefficient k were introduced in the model. For the primary support design, a characteristic value of the static support pressure was considered in the frame models.
The static schemes of the frame models for the hoisting machine chamber and the technological shaft inset are illustrated in Figure 2.
The calculation results for the maximum steel set spacing in the hoisting machine chamber (excavation A) and the technological shaft inset (excavation B), based on Equation (23) and the internal force values in the steel arches obtained from the frame models, are summarized in Table 7.
The composite support system, consisting of steel sets embedded in fiber-reinforced shotcrete, was employed as a secondary support for both the hoisting machine chamber and the technological shaft inset. The installation of secondary support in both excavations should only take place after all deformations of the excavation opening have ceased. Therefore, the determination of secondary support properties was carried out based solely on the value of the static support pressure. The following relationships, based on the guidelines provided Polish National Standard PN-G-05600:1998 [39] and Chudek et al. [40,41], were used to calculate the theoretical value of composite support capacity due to compression and shear failure, respectively:
p s u p 1 = g · f c d · e + A · f d r w · e ,
p s u p 2 = 4 · g · f c t d · e + 0.6 · A · f d r w · e ,
where psup1 and psup2 denote the composite support capacity due to compression and shear failure, respectively, fcd and fctd are the design compressive and tensile strengths of fiber-reinforced shotcrete, g is the shotcrete thickness, A is the cross-sectional area of the steel set profile, fd is the design value of the ultimate strength of steel, e is the steel set spacing, and rw is the contour radius of the excavation opening (outer radius of the shotcrete layer).
The calculation results of the composite support capacity for the hoisting machine chamber (excavation A) and the technological shaft inset (excavation B), based on Equations (24) and (25), are summarized in Table 8.
As indicated in Table 8, the values of support capacity, psup1 and psup2, for both the hoisting machine chamber and the technological shaft inset exceed the values of static support pressure presented in Table 6. Therefore, based on the analytical calculation method, it can be concluded that the secondary support systems should ensure long-term excavation stability, while maintaining the required safety factors.

4. Numerical Method of Support Design

4.1. Basic Assumptions and Methodology for Numerical Modeling

Numerical modeling is a widely adopted design tool in rock engineering, enabling precise calculations of stress and displacement states around underground or surface excavations. This methodology is particularly useful in evaluating the stability of rock masses under complex conditions, such as those encountered in advanced tunneling and mining operations. In such cases, traditional empirical methods or analytical closed-form solutions often fall short due to the intricate nature of geological formations and loading conditions. By integrating numerical models, engineers gain a deeper understanding of the behavior of rock masses, allowing for more reliable predictions and informed decision-making in design and construction.
In the present study, a continuum analysis method based on the finite element method (FEM) was implemented to model the behavior of the rock mass. Continuum analysis assumes the domain to be a homogeneous and isotropic medium, thereby neglecting the explicit representation of individual discontinuities. This simplification enables the efficient simulation of large-scale problems but requires appropriate adjustments to account for the inherent heterogeneity and discontinuities present in natural rock masses. To address this limitation, the mechanical properties of the rock mass were adjusted from laboratory-derived properties obtained from intact rock samples, as described in Section 2.3 and Section 2.4.
While discontinuum methods, such as the Distinct Element Method (DEM), can provide a more detailed representation of the rock mass’s behavior, capturing the effects of rock mass anisotropy, they are often less practical in scenarios where input data are scarce or difficult to obtain. This limitation, combined with the increased computational complexity, often makes such methods less suitable for large-scale simulations typically required in coal mining projects. In contrast, continuum methods, although less detailed in their representation of fractures and joints, offer a more feasible solution in cases where data availability and computational resources are limited.
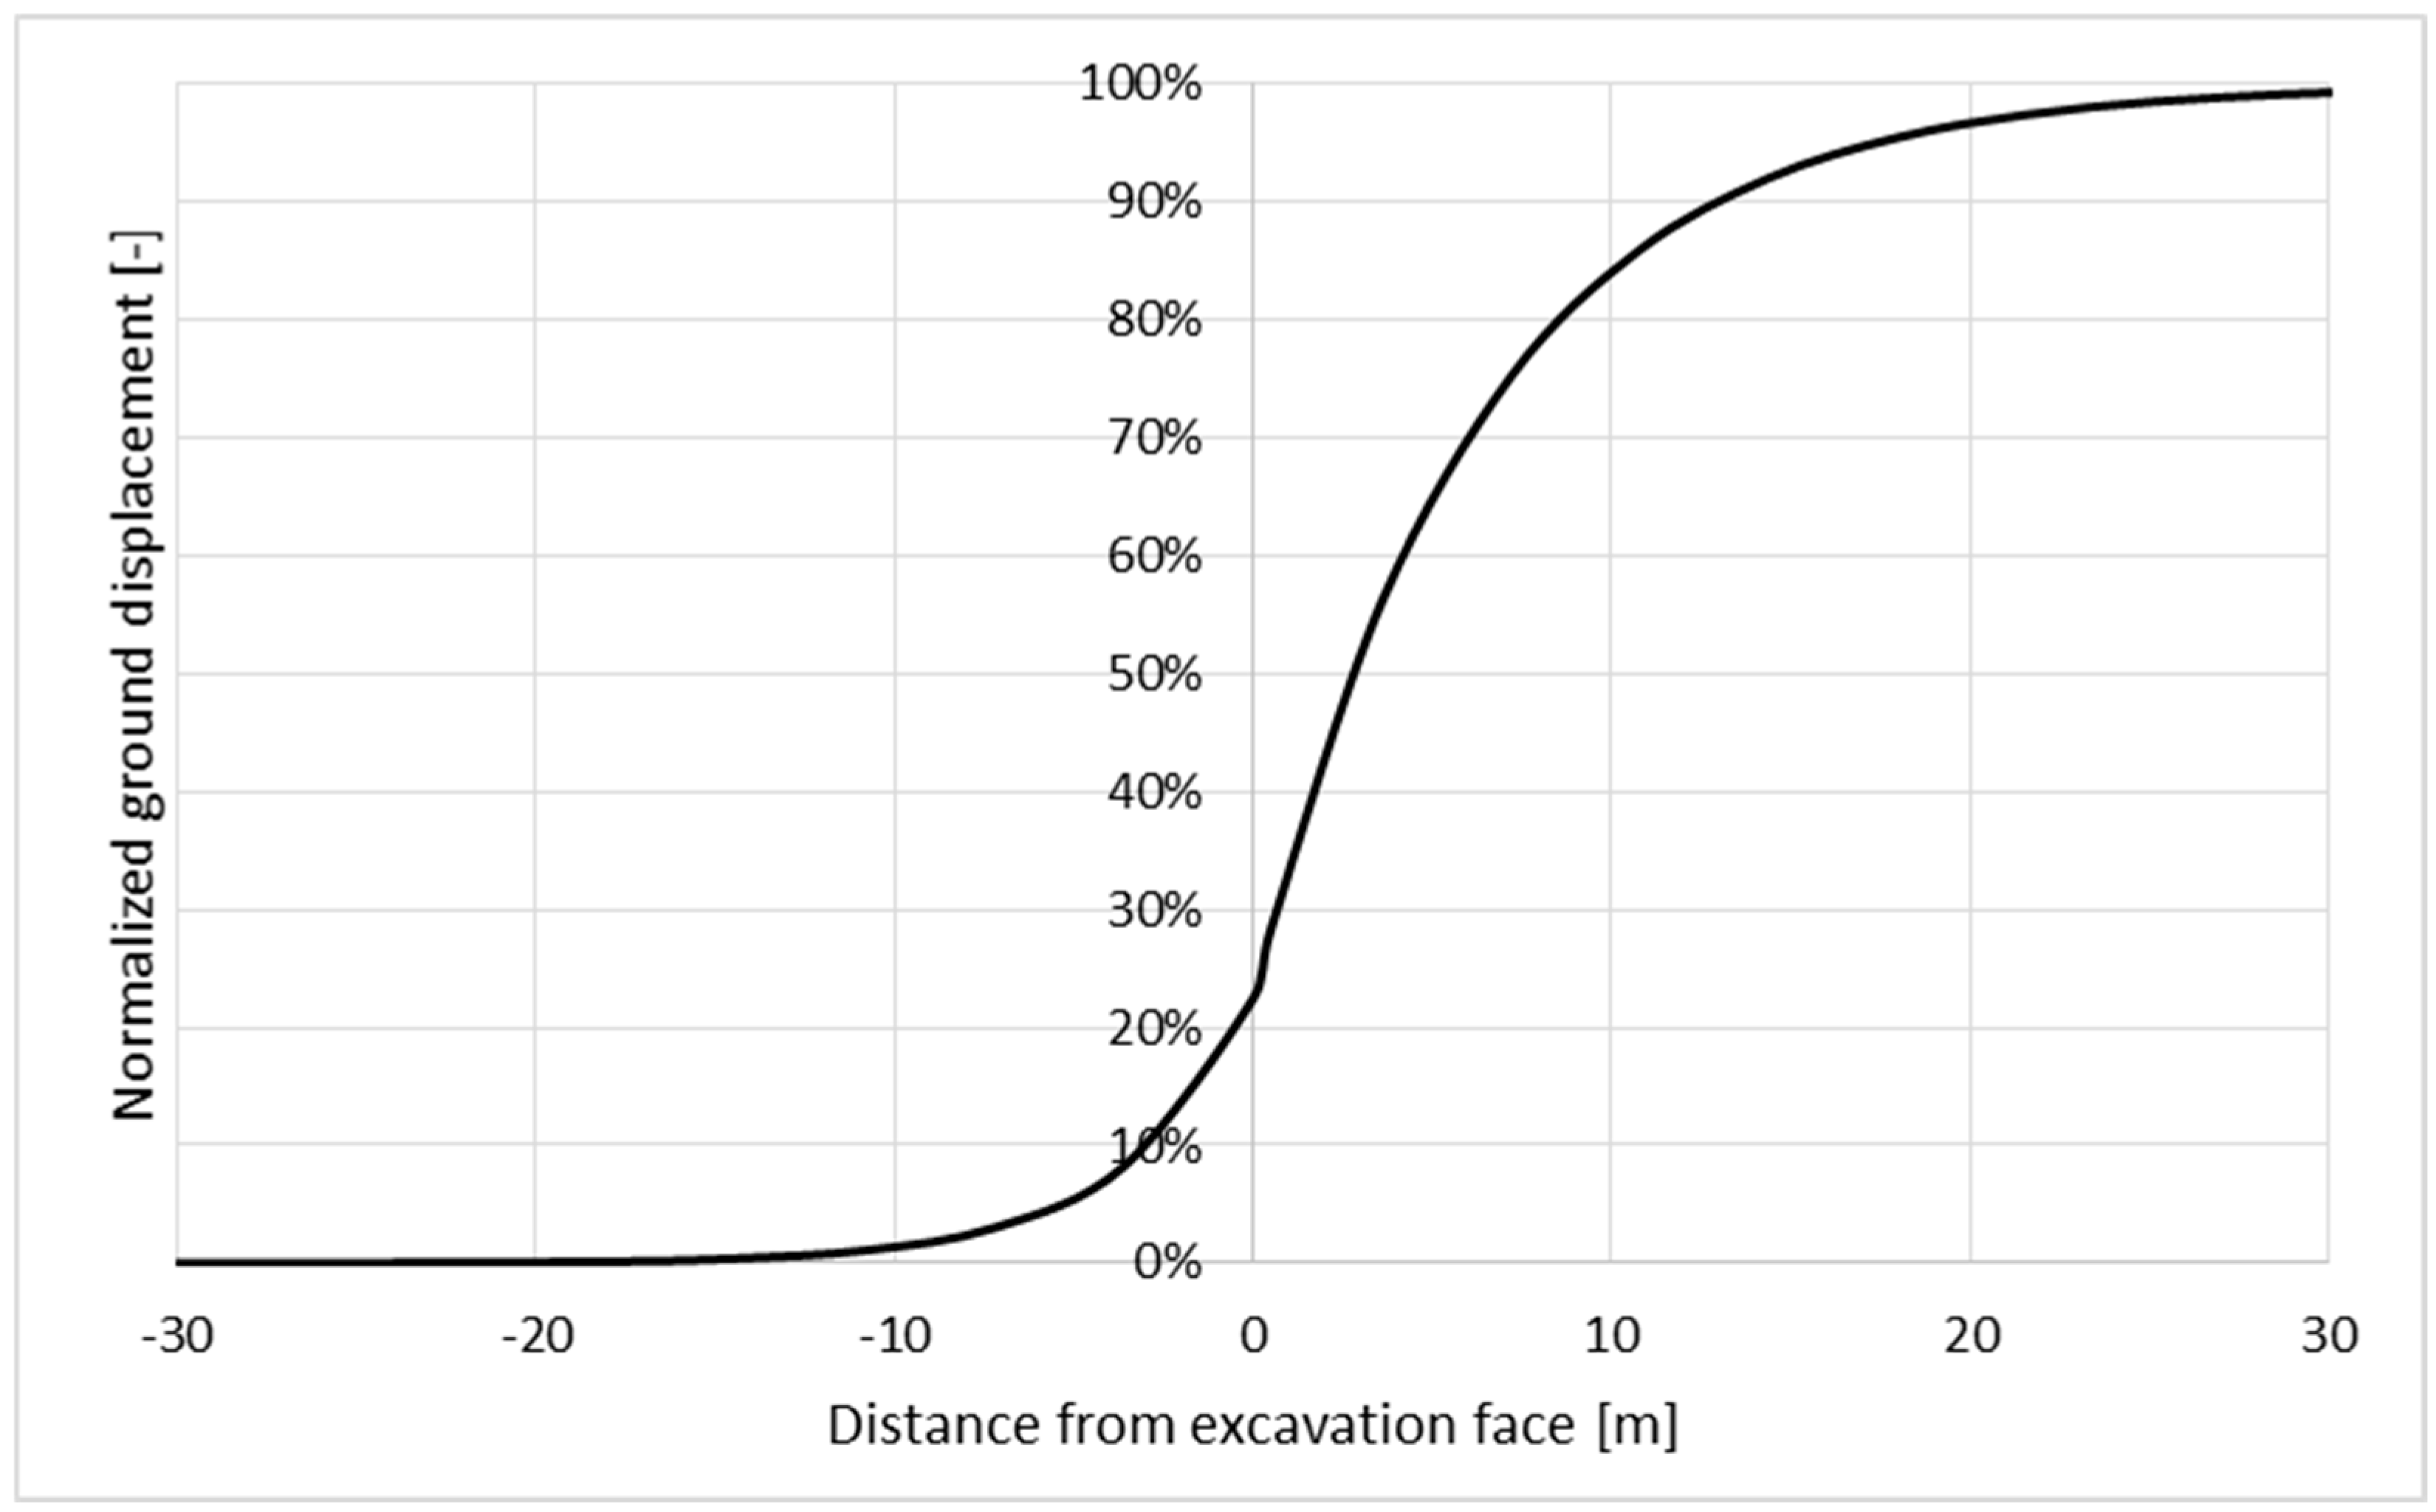
Although the stress and displacement state in the vicinity of an excavated tunnel, roadway, or chamber is inherently a three-dimensional problem, a 2D plain-strain analysis can, under certain conditions, be effectively applied for the practical assessment of excavation stability and support behavior [46]. To accurately represent the true three-dimensional behavior of the rock mass, the 2D model must incorporate pre-face conditions, the state of displacement at the excavation face, and the progressive development of deformation and the plastic zone behind the face [47]. To address these challenges, a longitudinal displacement profile (LDP) can be employed to establish a quantitative relationship between the wall displacement perpendicular to the tunnel axis and the distance from the excavation face. In the present study, given the use of yielding support systems, an unsupported version of LDP based on the following relationships proposed by Vlachopoulos and Diederichs [48], was applied, as follows:
u 0 * = u ( x ) u m a x = 1 3 · e 0.15   ·   r l r e q ,
u * = u ( x ) u m a x = u 0 · e x r e q ,
u + * = u ( x ) u m a x = 1 1 u 0 · e 3   ·   x 2   ·   r l ,
where x denotes the distance from the tunnel face, u 0 * , u * and u 0 * represent the normalized radial wall displacements at the excavation face (x = 0), ahead of the face (x < 0), and behind the face (x > 0), umax is the maximum predicted radial wall displacement, while u(x) describes the radial wall displacement as function of the distance from the excavation face.
The LDP curve, calculated using Equations (26) and (27), was incorporated into the numerical models by applying the average pressure reduction technique, following the guidelines provided by Vlachopoulos and Diederichs [47]. An exemplary LDP curve, obtained for the hoisting machine chamber, is depicted in Figure 3.
The numerical calculations in the present study were conducted using a graded mesh with three-noded triangular elements, ensuring an optimal balance between computational efficiency and accuracy. While the element size varied across the model, a higher mesh density was applied in the vicinity of the excavations to improve result precision. This was achieved by locally refining the mesh using an automatic density adjustment function, which reduces element size in areas of interest while maintaining larger elements in less critical regions. As a result, the element size near the excavations was approximately 0.2 m, allowing for a more accurate representation of stress distribution and deformation.
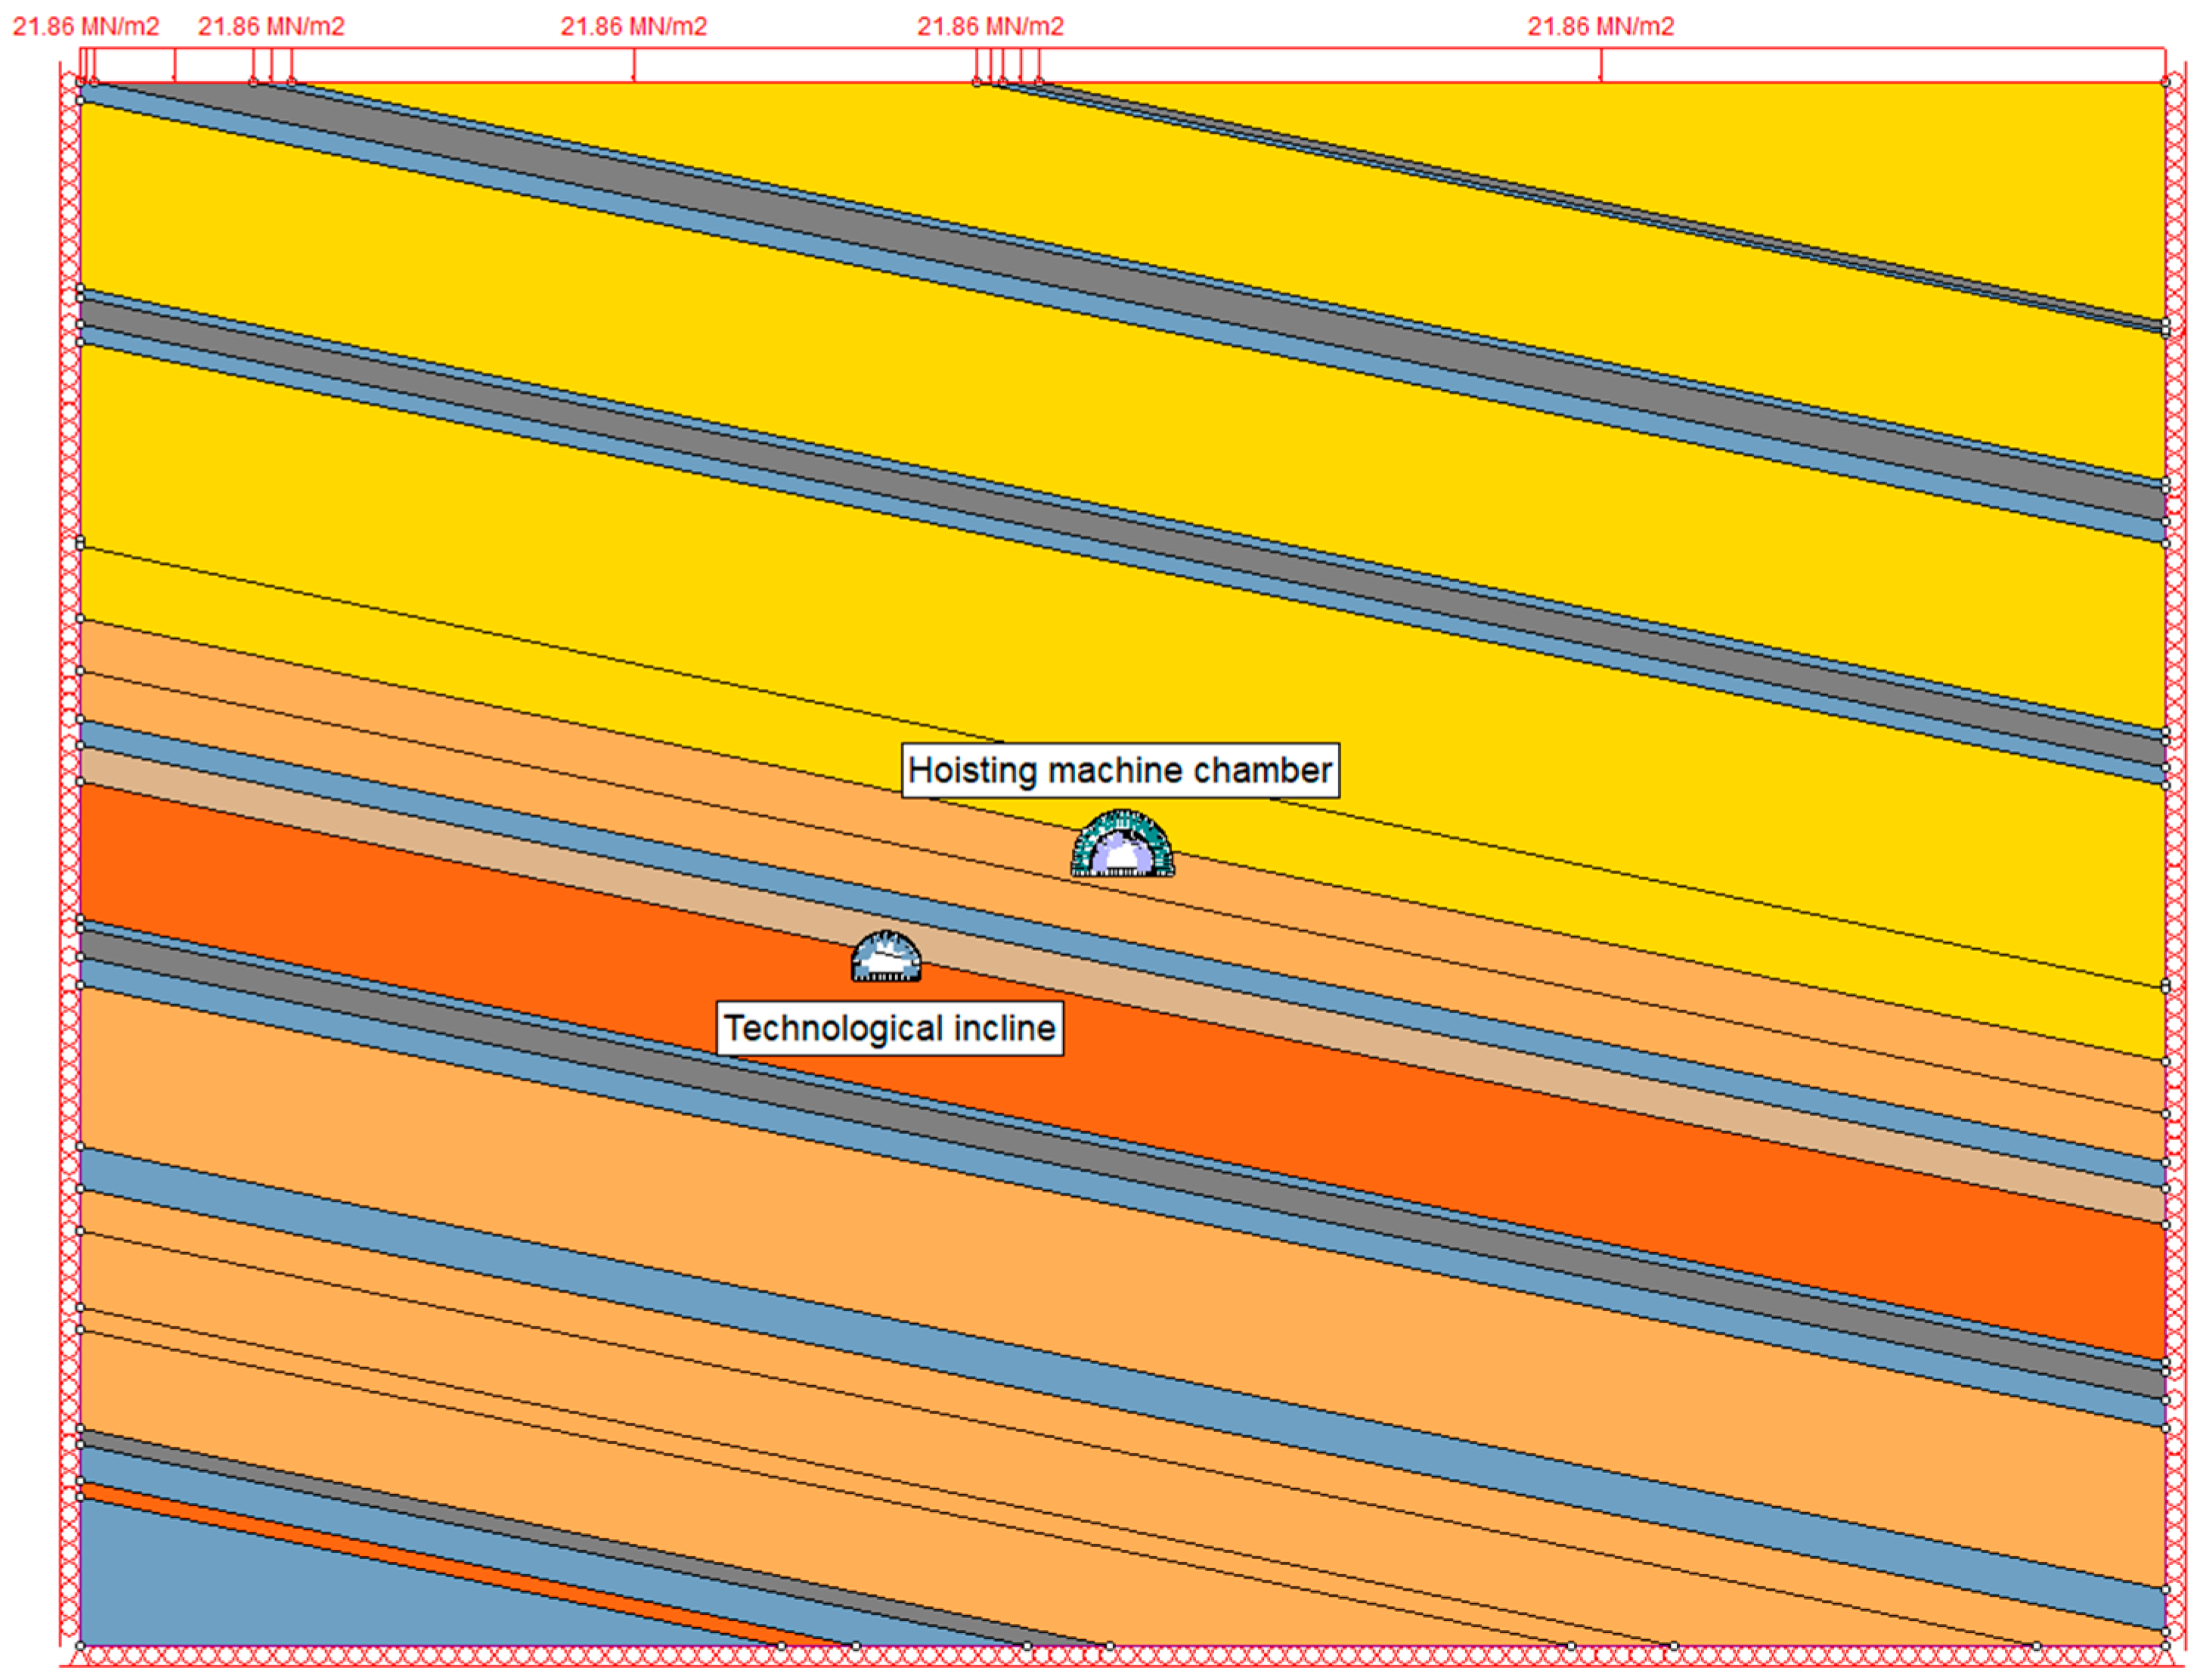
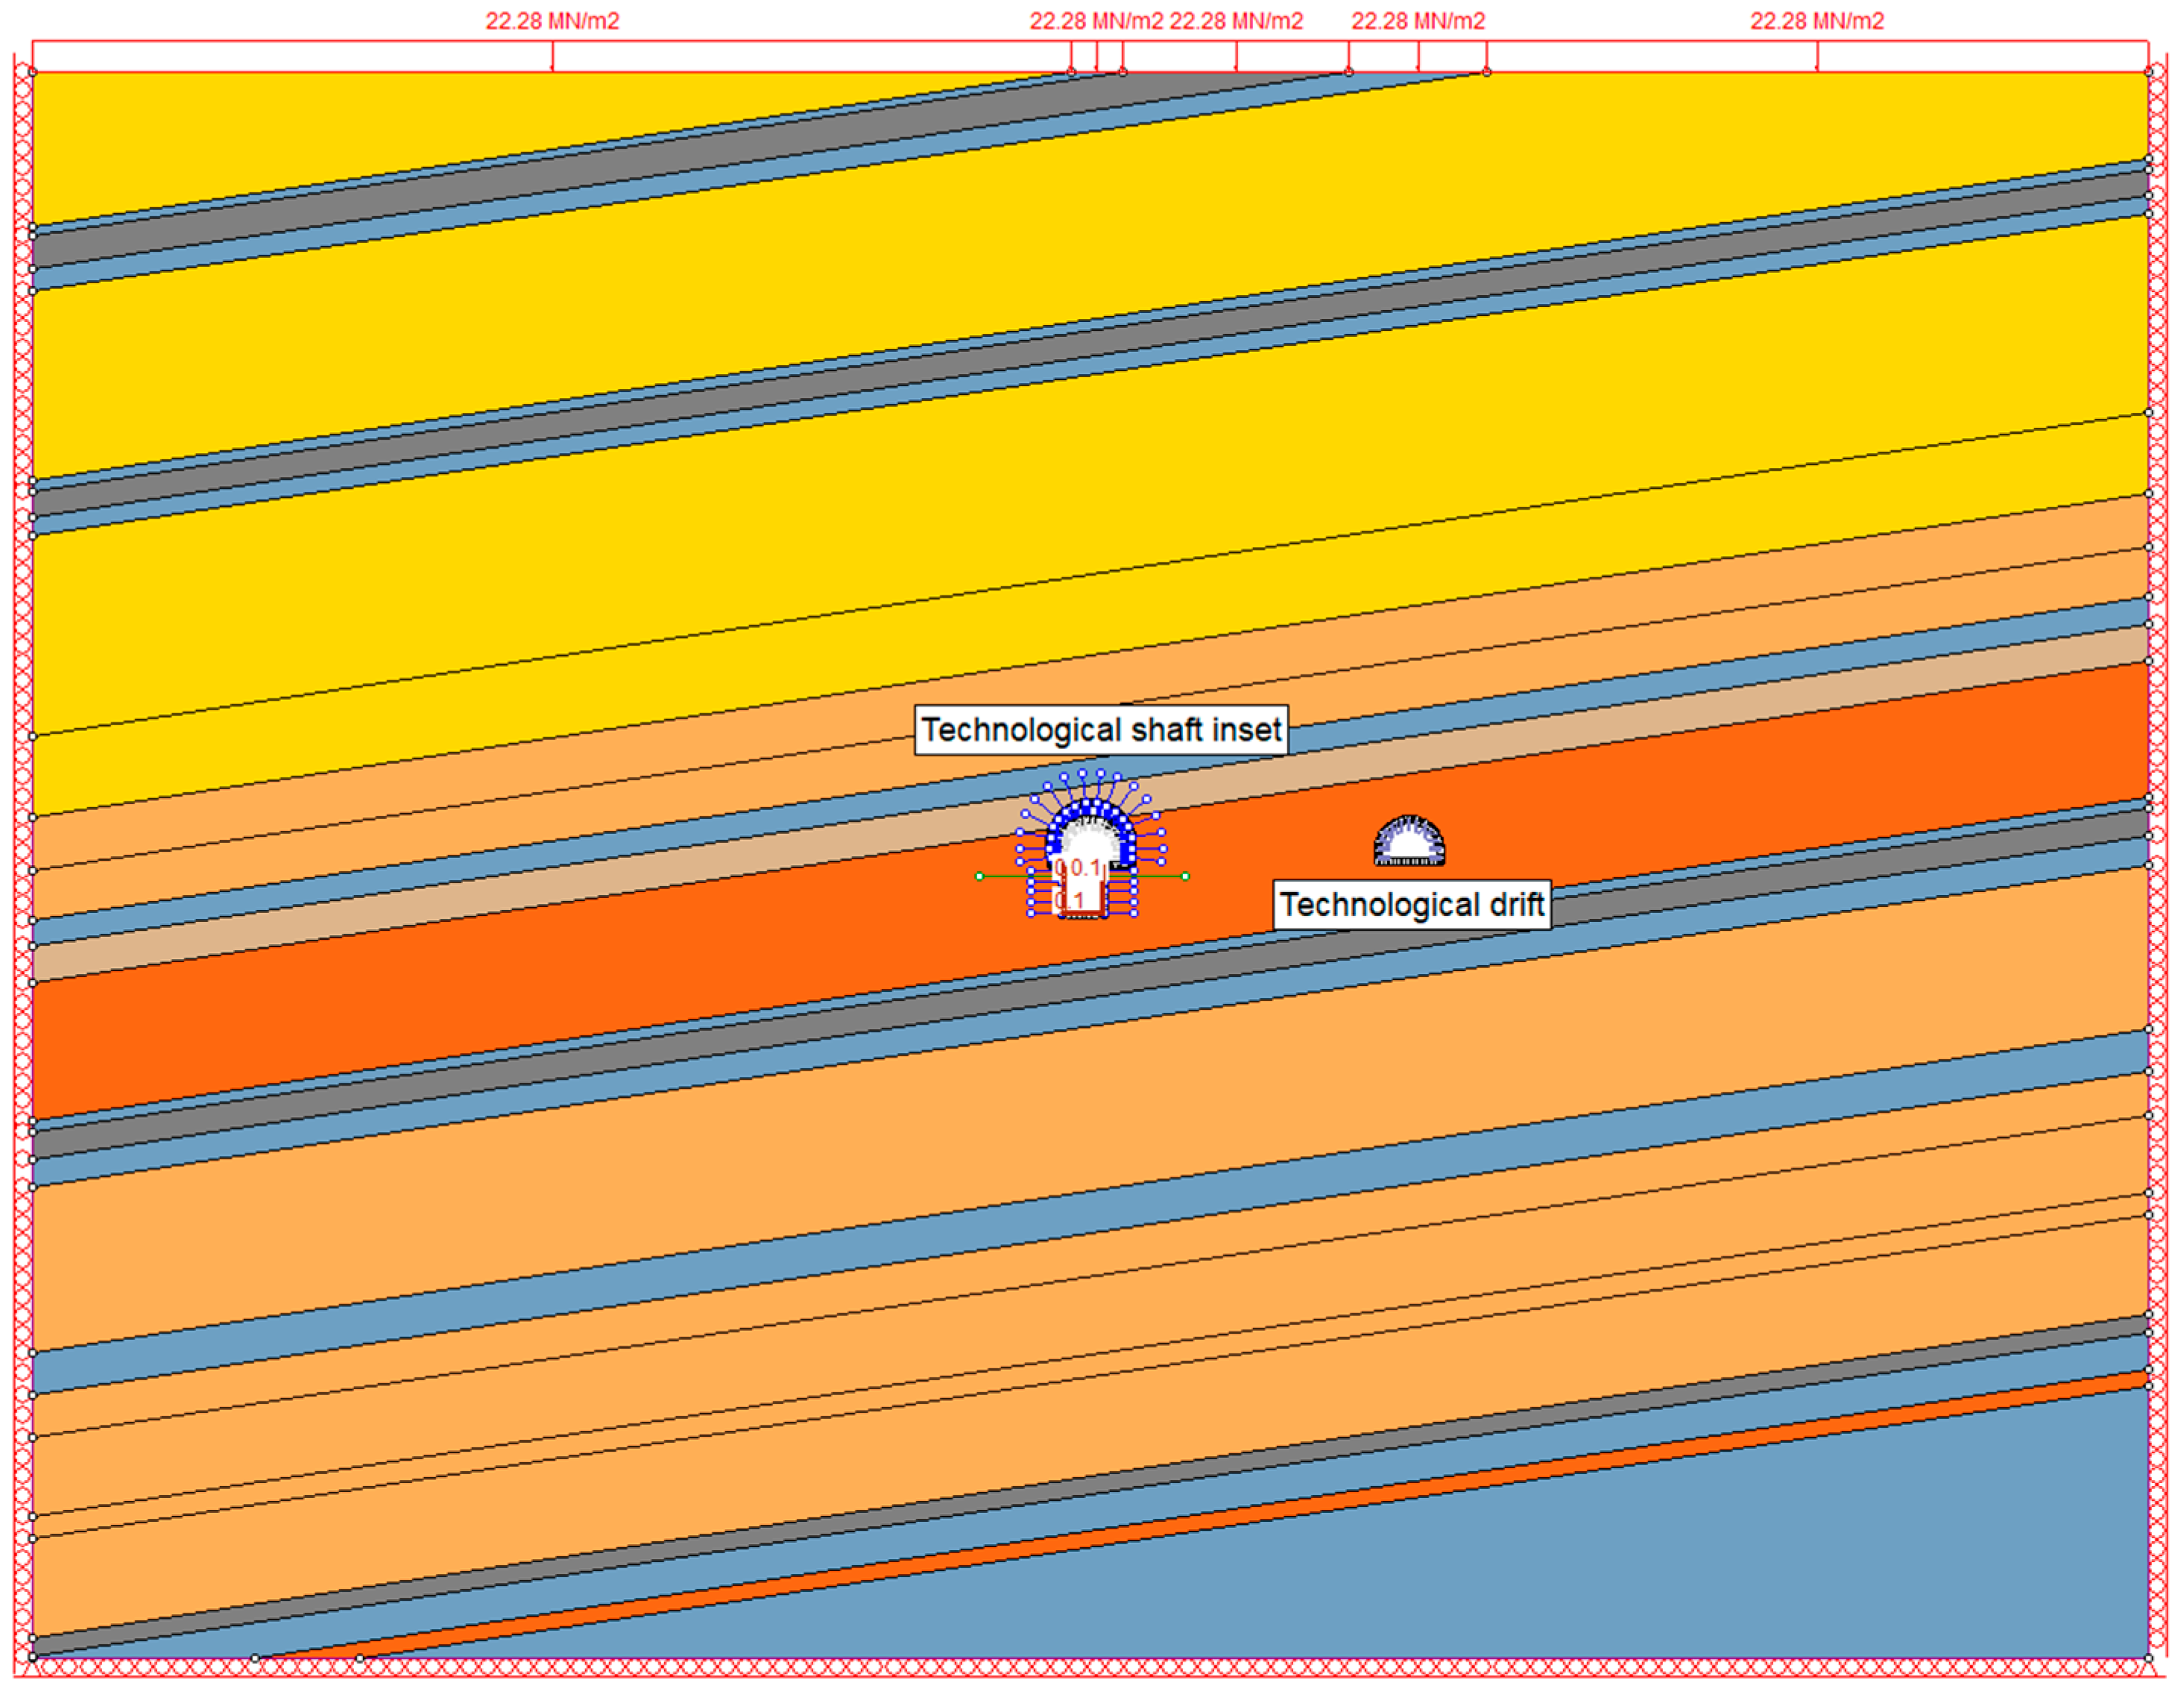
Based on the assumptions presented above, as well as the interpreted geological profile and the planned excavation sequence, two numerical models were developed for the hoisting machine chamber and the technological shaft inset (Figure 4 and Figure 5).

4.2. Evaluation of the Primary Support Performance

Yielding steel arches, used as the primary support for the hoisting machine chamber and the technological shaft inset, were modeled as an arrangement of elastic beam elements with geometric parameters corresponding to the dimensions of the V29 and V36 profiles. To accurately represent the behavior of sliding joints, which enable the yielding steel arches to close in the circumferential direction, the axial stiffness of the beam elements was reduced to zero using the “sliding gap” option provided by the software manufacturer.
It is important to note that the flexural behavior of the beam elements is not directly affected by the “sliding gap” option. The liners incorporated into the numerical models provide resistance to bending moments regardless of the status of the sliding gap [49]. Therefore, the assessment of the performance of yielding steel arches was carried out based on the bending moment diagrams obtained from numerical calculations, as well as the value of the strain ratio k, calculated using the following equation:
k = M m a x · m 1 · e f y d · ( m + n 1 ) · W x .
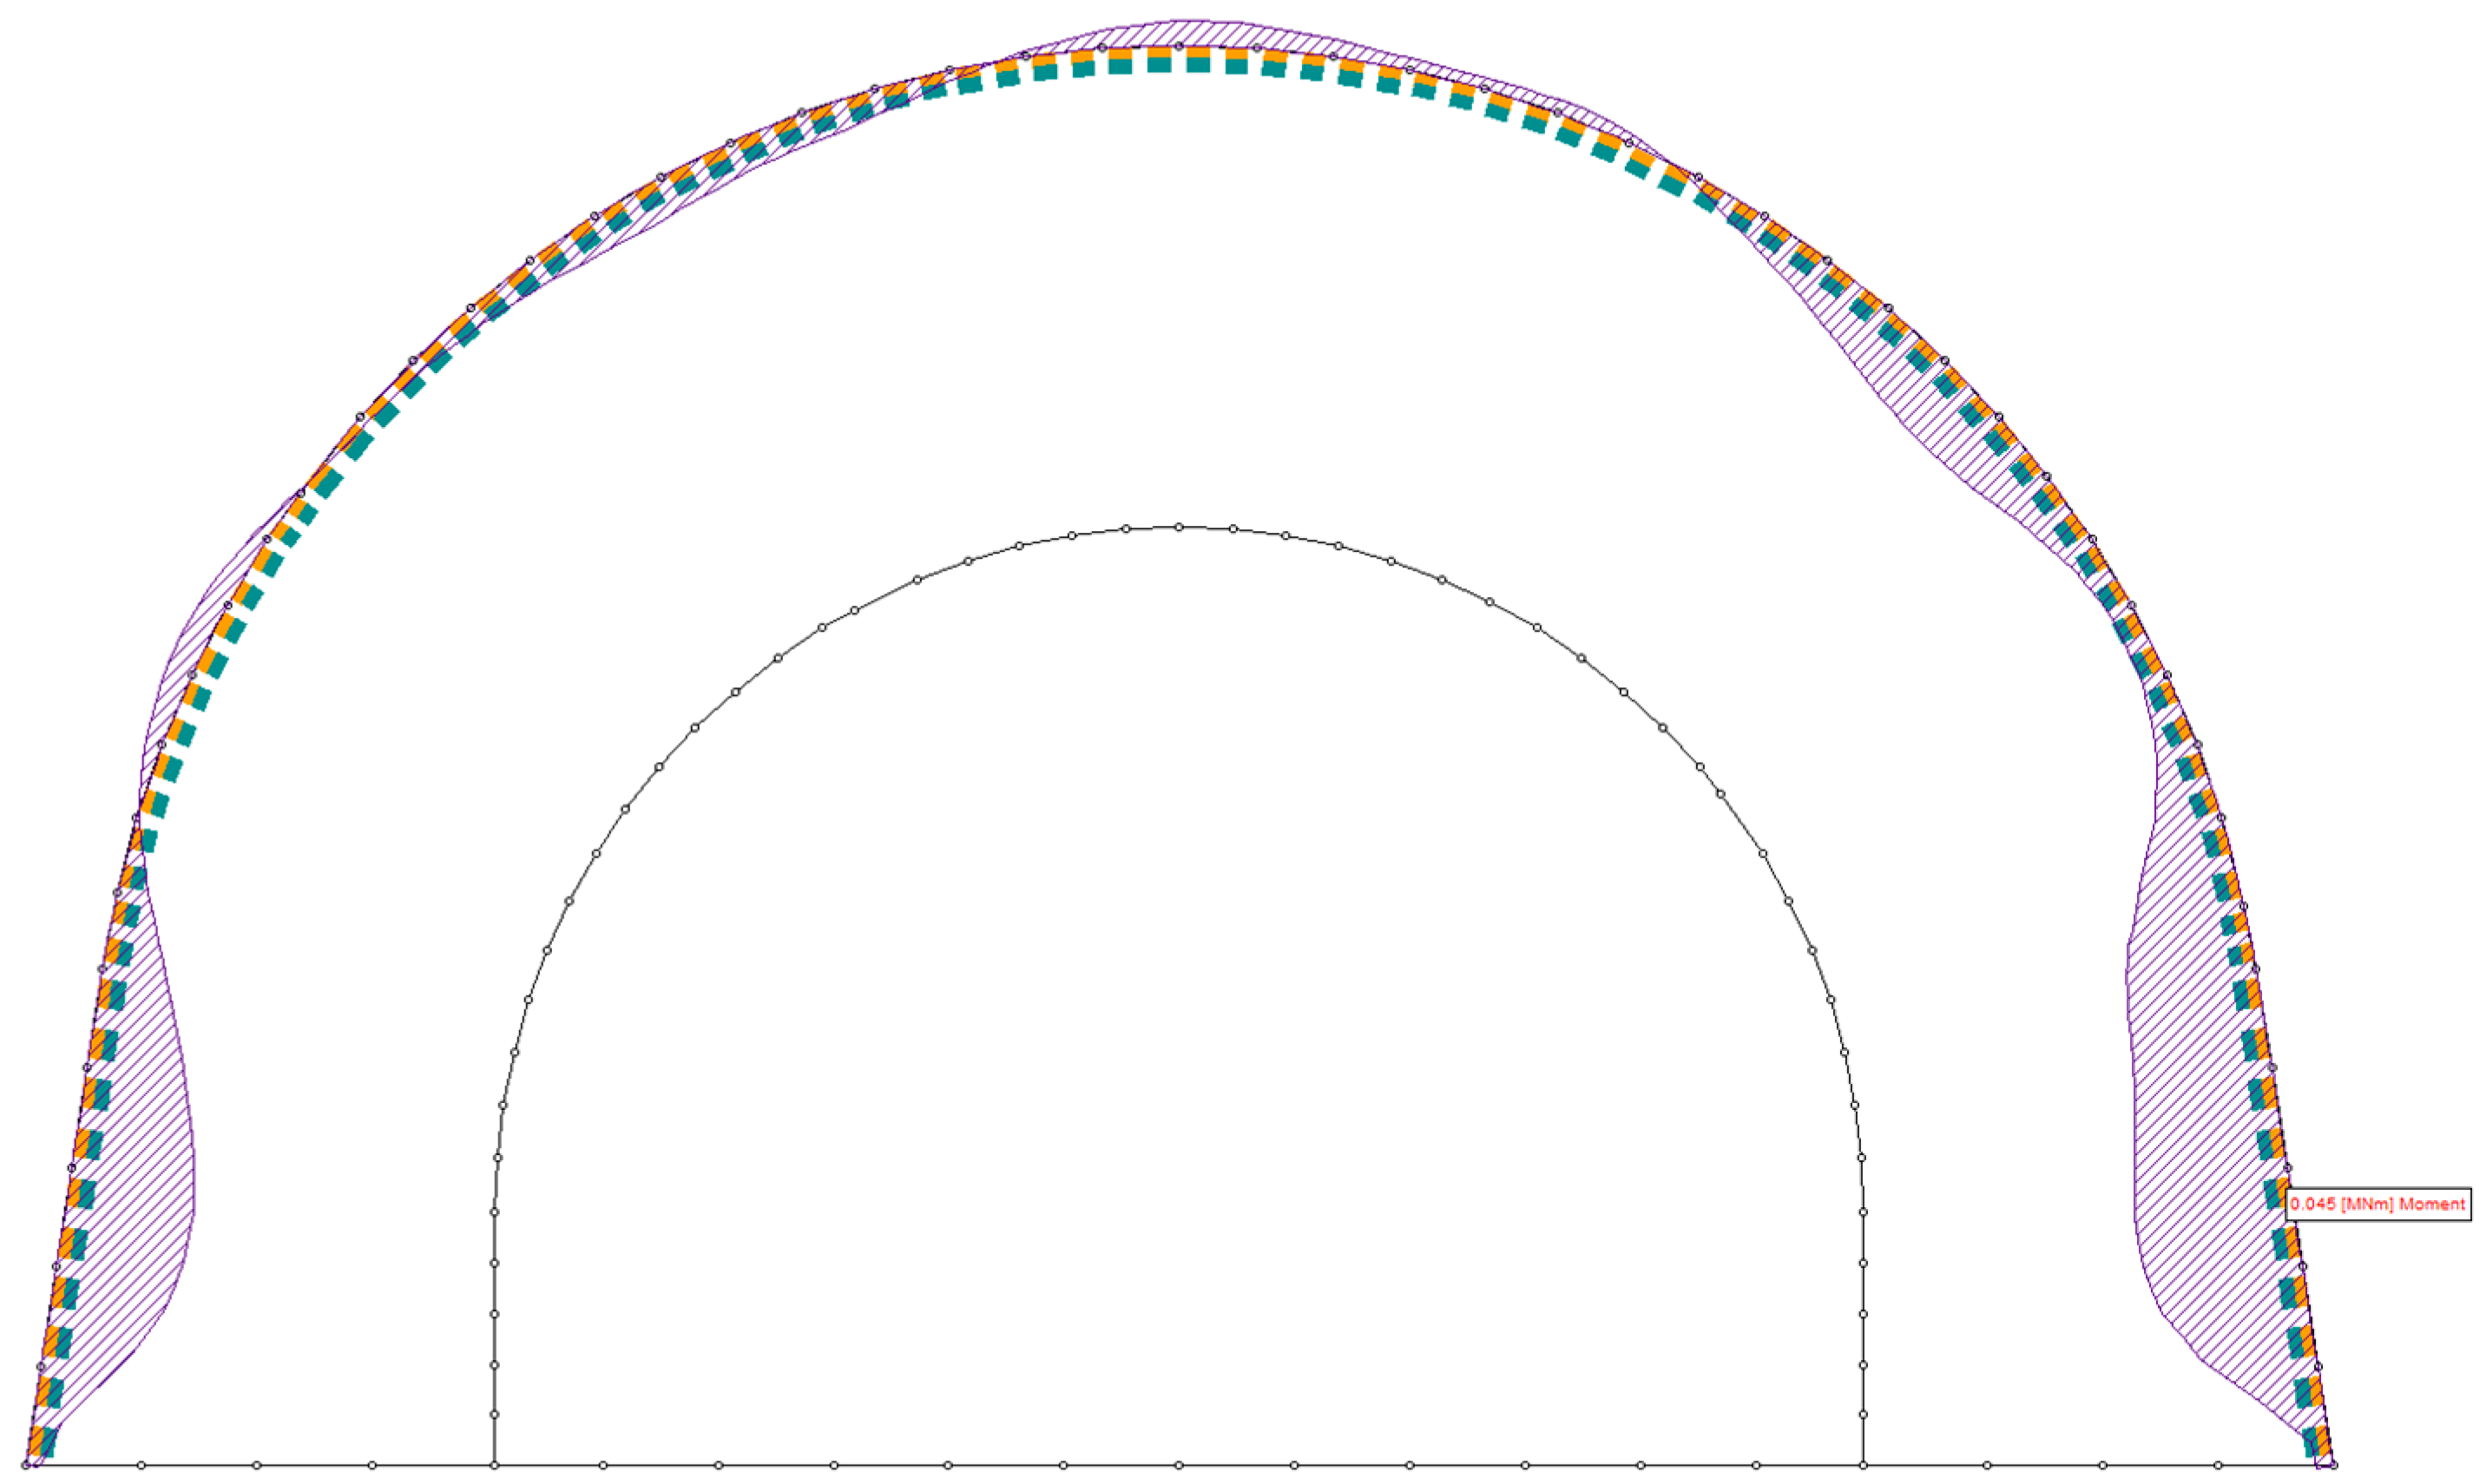
An exemplary bending moment diagram, obtained for the hoisting machine chamber, is depicted in Figure 6.
The calculation results of the strain ratio of the yielding steel sets used as a primary support of the hoisting machine chamber (excavation A) and the technological shaft inset (excavation B), based on Equation (29), are summarized in Table 9.
As indicated in Table 9, the values of the steel sets strain ratio k for both the hoisting machine chamber and the technological shaft inset are less than unity. Therefore, based on the numerical calculation results, it can be concluded that the primary support system, consisting of steel sets spaced at 0.6 and 0.5 m intervals—initially determined using the analytical design method (presented in Section 3 of this article)—should ensure initial excavation stability while maintaining the required safety factors.

4.3. Evaluation of the Secondary Support Performance

The installation of secondary support for both the hoisting machine chamber and the technological shaft inset should be carried out only after the deformations of the excavation opening have fully stabilized. In numerical models, the secondary support is initially introduced in a stress-free state to reflect this condition. The secondary support is typically subjected to long-term loading due to factors such as the progressive degradation of the primary support, weakening of the surrounding rock mass, rheological effects, and potential groundwater interactions. Since no significant groundwater-related risks were identified in the area of Shaft II, and the adjacent sandstone formation does not exhibit notable rheological behavior, it has been assumed that the secondary lining becomes loaded predominantly as a result of the gradual deterioration of the surrounding rock. This study assumes that the long-term loading of the secondary support results from a decrease in rock mass cohesion, while the internal friction angle remains unchanged [50]. Therefore, in the final phase of the numerical simulations, the post-peak rock mass cohesion was reduced by 10%.
The secondary support system, consisting of steel arches embedded in fiber-reinforced shotcrete, was modeled using the equivalent section approach proposed by Carranza-Torres and Diederichs [51]. This method, widely recognized in both academic research and engineering practice, is extensively used by researchers and designers to evaluate the performance of support structures in tunnels and underground mine workings [19,20,22,52,53]. The equivalent section approach involves representing the composite support system—comprising steel sets and shotcrete lining—as an “equivalent” rectangular section with a width b, thickness teq, and modulus of elasticity Eeq. First, the mechanical properties of this equivalent section are determined. Next, the load-bearing capacity of the steel sets and shotcrete lining are assessed separately. A numerical model of the tunnel is then developed, where beam elements representing the equivalent section are applied along the tunnel perimeter. Finally, bending moments and axial thrusts computed in the numerical model are redistributed back onto the individual components—steel sets and shotcrete lining—allowing for a more precise evaluation of their structural response under different loading conditions.
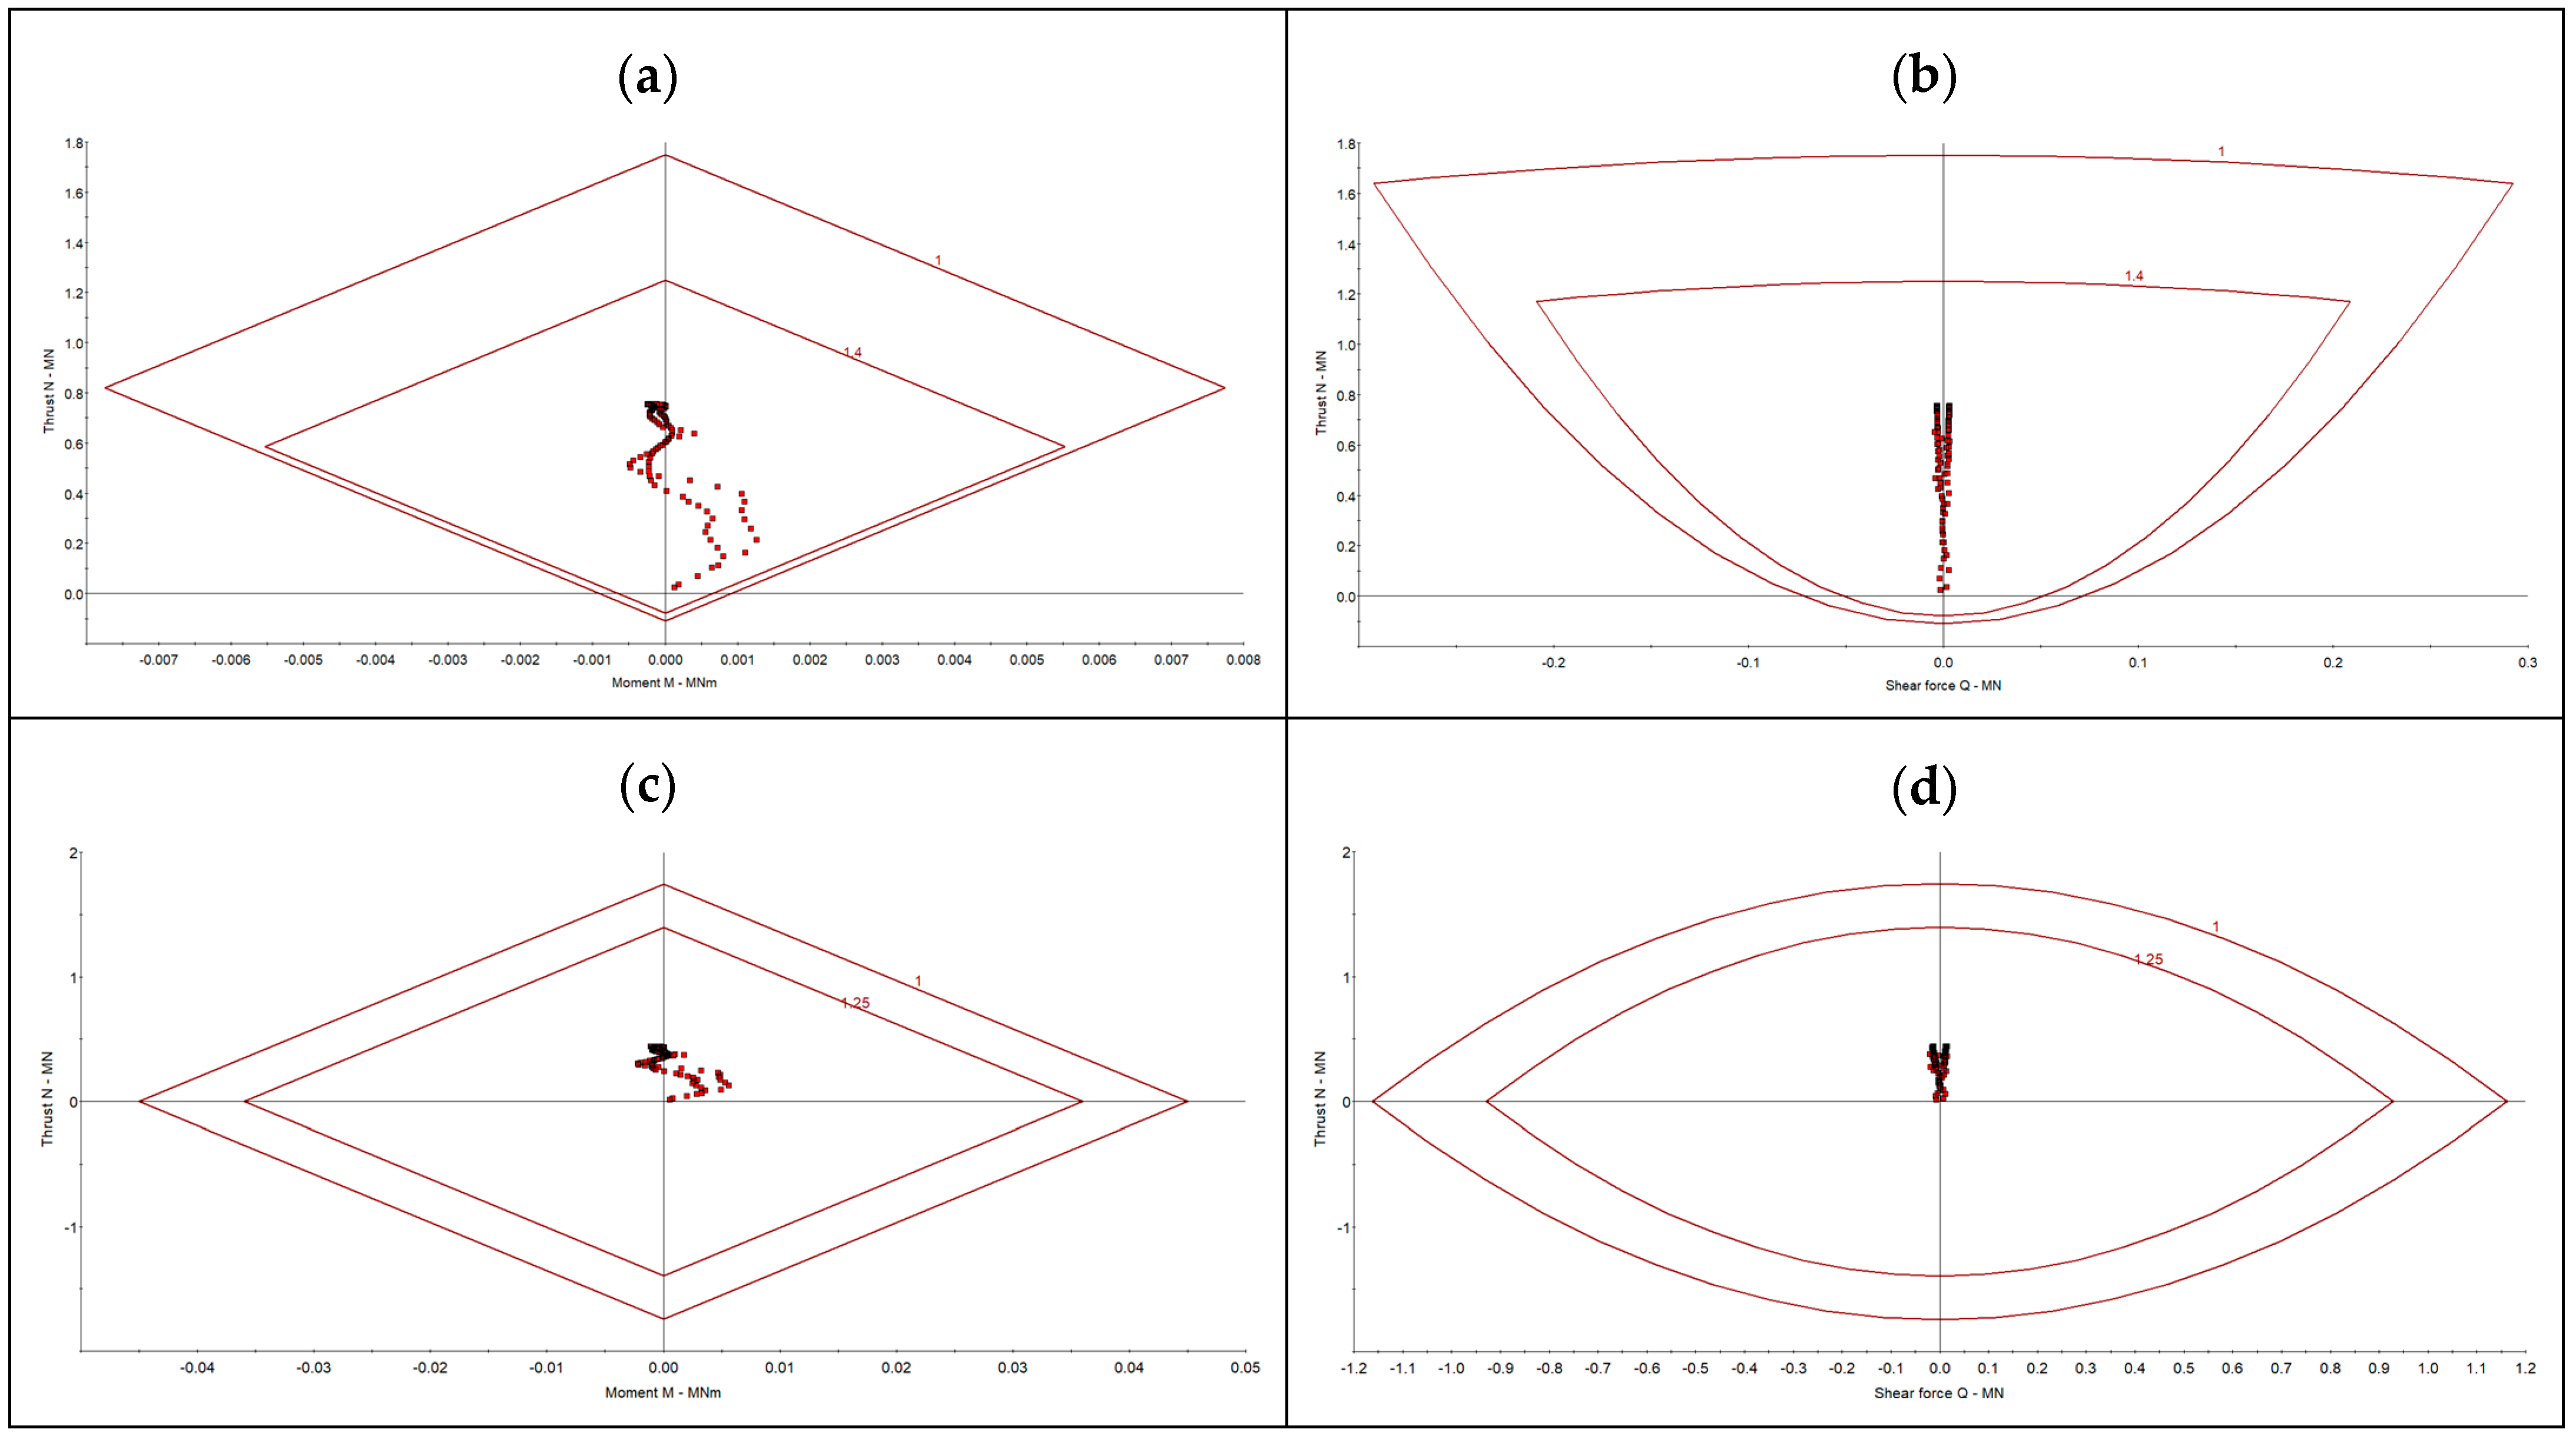
In the present study, support capacity plots were used to evaluate the performance of secondary support systems for the hoisting machine chamber and the technological shaft inset. Plots for moment-thrust capacity (M-N plot) and shear force-thrust capacity (Q-N plot) were generated using the “reinforced concrete” tool provided by the software manufacturer, based on the relationships proposed by Carranza-Torres and Diederichs [51]. The support capacity plots for the hoisting machine chamber and the technological shaft inset are presented in Figure 7 and Figure 8, respectively.
The support capacity plots presented in Figure 7 and Figure 8 indicate that both the shotcrete and steel components of the composite support maintain the required safety factors (1.40 for shotcrete and 1.25 for steel). Therefore, based on the numerical calculation results, the design of the secondary support system can be considered structurally adequate and compliant with safety requirements.

5. Engineering Application

Auxiliary workings for the deepening of Shaft II, including the hoisting machine chamber and the technological shaft inset, were excavated between 2023 and 2024. Both the hoisting machine chamber and the technological shaft inset were excavated using the pilot drift expansion method, as depicted in numerical models.
The overall construction sequence of the pilot drift expansion method is as follows: First, a small pilot drift is excavated and temporarily supported. In the next phase, the main excavation is expanded to its final dimensions (in Polish coal mining a drill and blast method is typically used) and supported with primary support. Finally, after reaching an equilibrium state between the primary support and an adjacent rock mass, secondary support is installed to ensure the long-term stability of the structure.
This method is particularly advantageous in weak or medium-quality rock masses, as it allows for controlled excavation while minimizing the risk of instability. By first creating a smaller pilot tunnel, stress redistribution within the rock mass is facilitated, reducing excessive deformations and ensuring safer working conditions. The pilot drift expansion method is widely used in underground mining and civil engineering projects, especially for large-section chambers and tunnels requiring careful ground control [41,54]. This approach enhances excavation safety and stability, making it a preferred technique in challenging geological conditions.
Geotechnical monitoring of the considered excavations was carried out through visual inspections, which included regular observations of the primary and secondary support, sliding in the yielding joints, as well as the state of the excavation face and adjacent rock mass, particularly block formation and joint propagation. Throughout the entire excavation period up to the present date, no critical conditions that could lead to ground failure or potential excavation collapse have been observed. Overall, the primary and secondary support systems, validated using analytical and numerical design methods, have proven effective in maintaining excavation stability. The results confirm the reliability of the adopted design methodology and highlight the effectiveness of the applied support solutions under the given geological conditions.
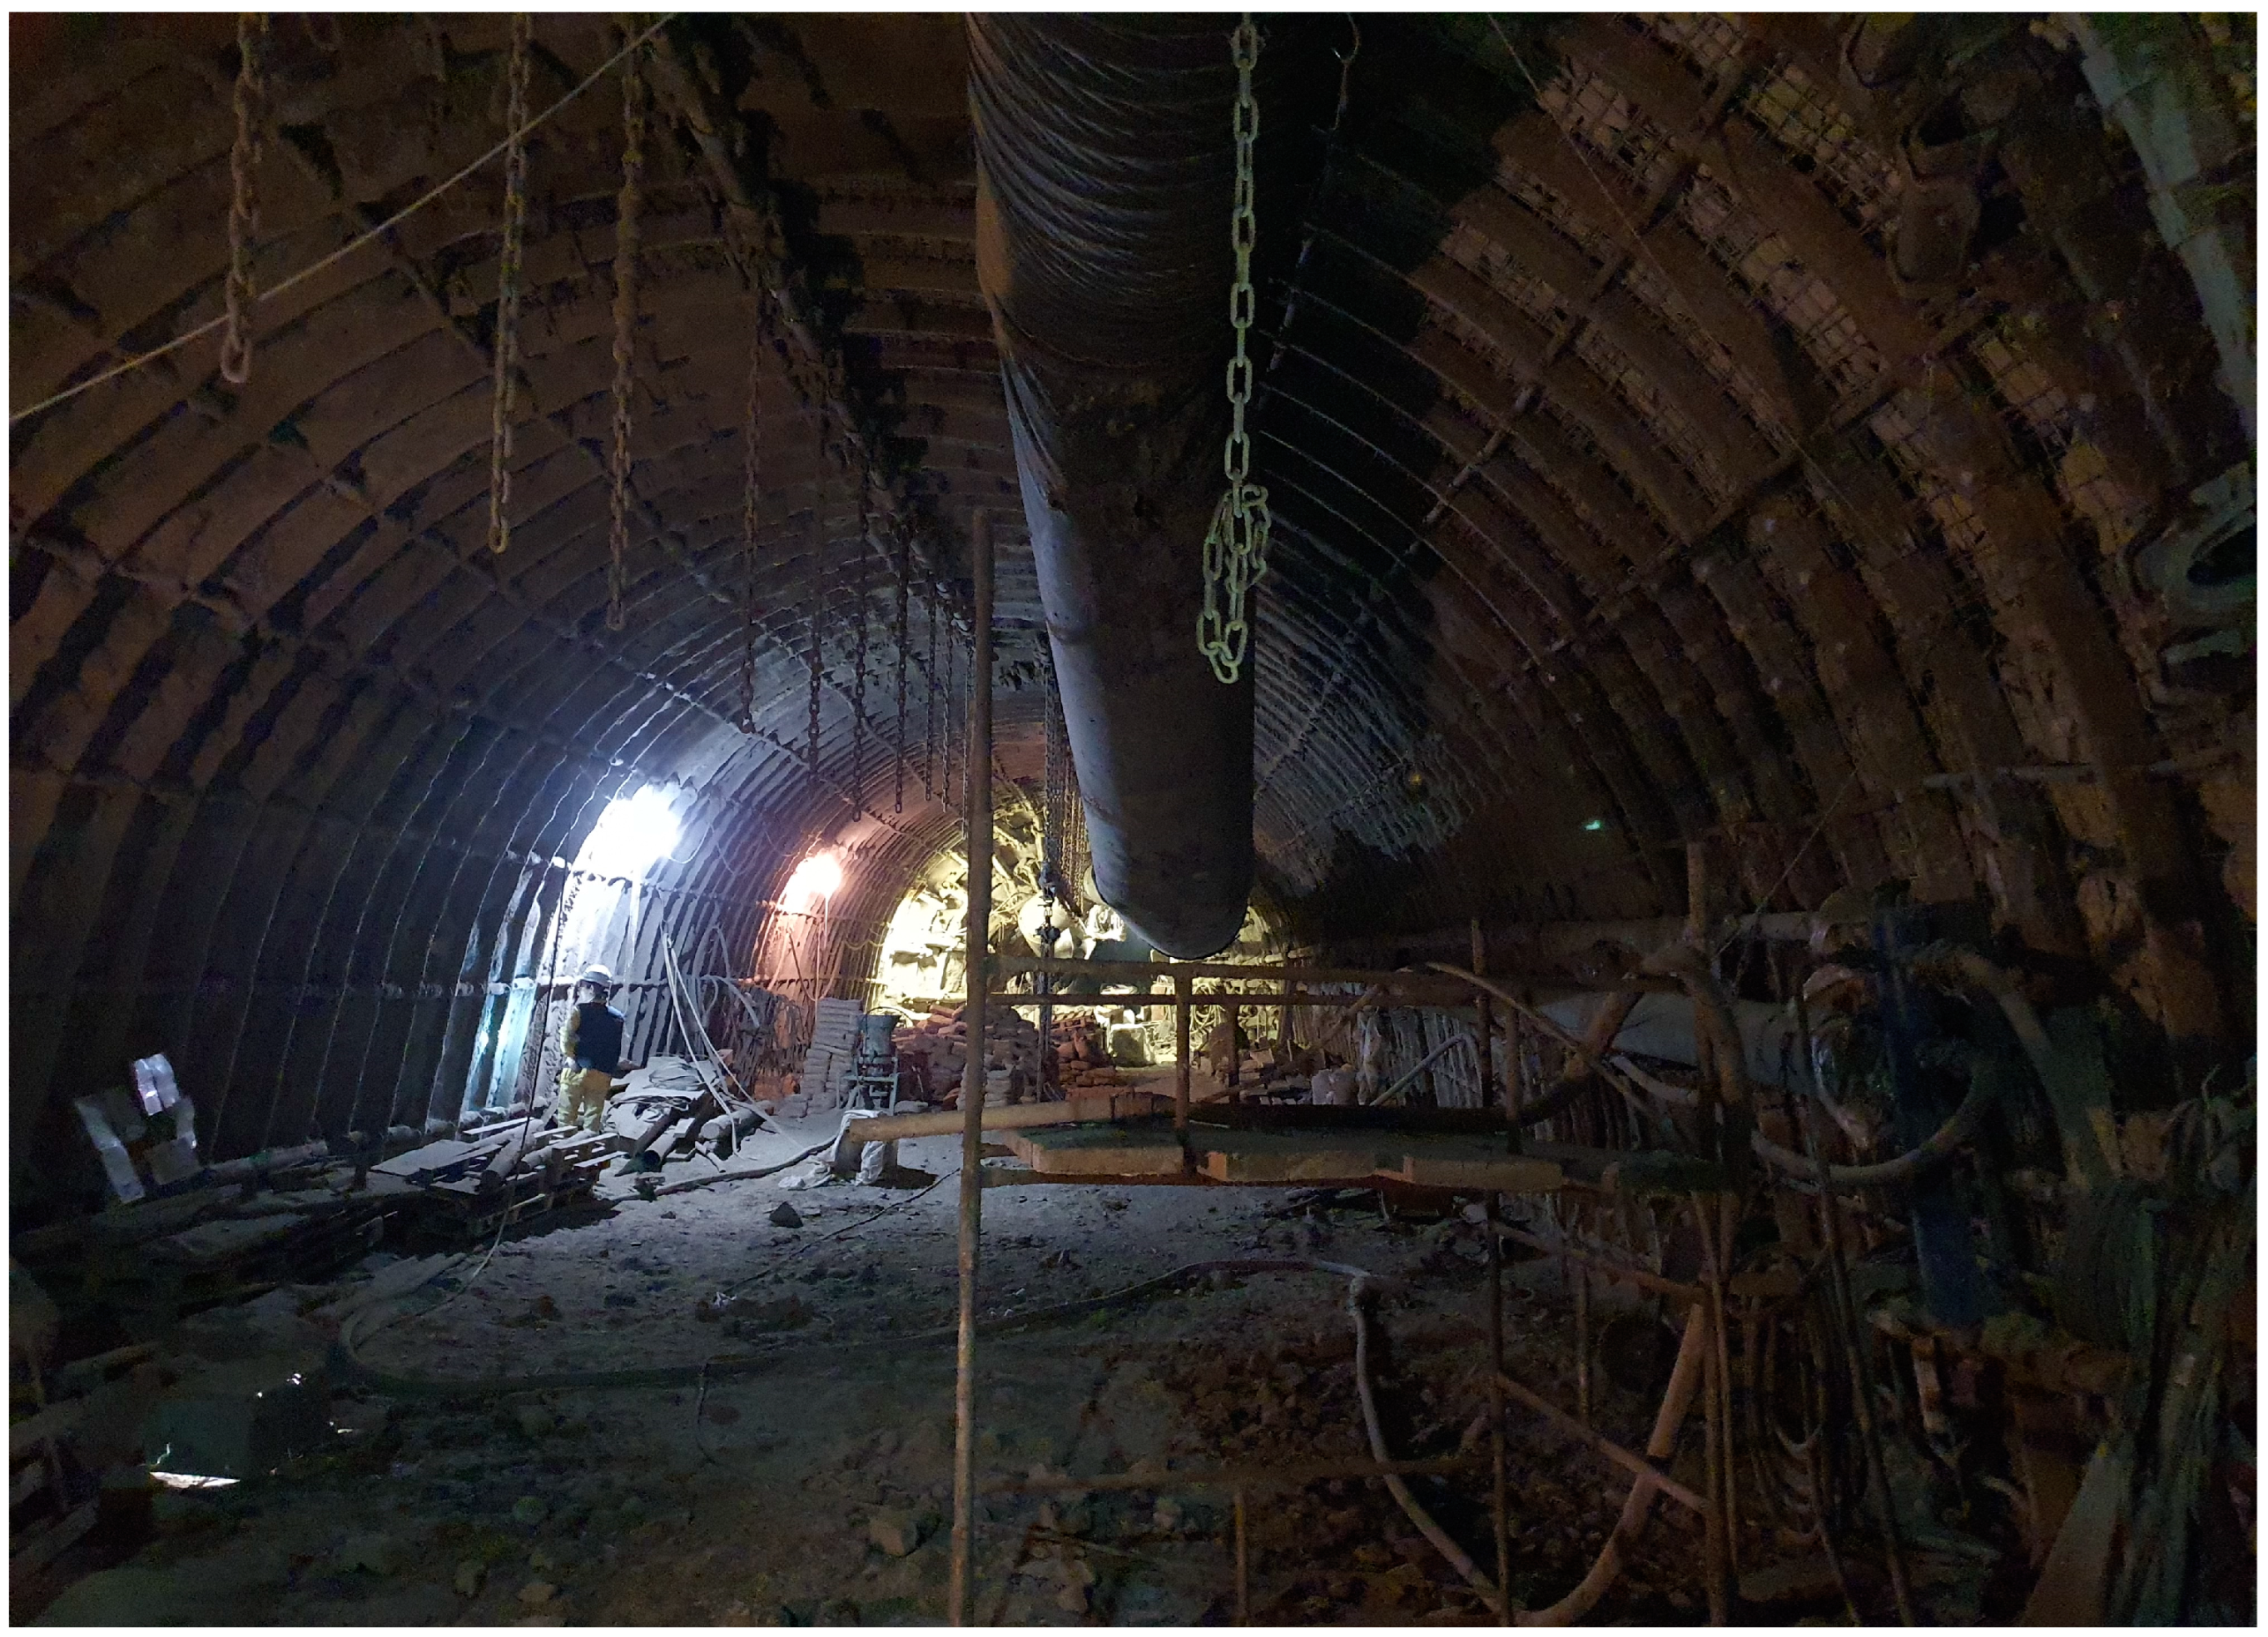
The actual view of the hoisting machine chamber, supported with primary and secondary support, is shown in Figure 9.
Direct validation of the finite element model using in situ monitoring data (e.g., convergence measurements) was not feasible due to practical constraints. Both numerical models discussed in this study were developed in accordance with established engineering practices and calibrated against the analytical solutions presented in Section 4, which indirectly supports their predictive capability. However, the model’s assumption of isotropic and homogeneous material behavior may not fully capture local geological variations or anisotropic effects. In the absence of direct field measurements, certain aspects of stress distribution and rock mass displacement remain unverified. Future studies should incorporate detailed monitoring data to enhance the validation and refinement of numerical predictions.

6. Conclusions

Based on the conducted study, the conclusions can be inferred as follows:
  • The top-to-bottom deepening method was chosen for Shaft II at the Borynia Mine due to its advantages in maintaining operational continuity and excavation stability. This approach allowed for controlled shaft sinking from a sub-level, ensuring safe working conditions despite the challenging geological environment. The method was selected based on past experiences in Polish mining, where bottom-to-top techniques have seen limited application due to unfavorable rock mass conditions and logistical constraints.
  • The mechanical properties of the rock mass were determined using borehole data, geological profiles, and in situ observations. The classification of surrounding formations was carried out using the Rock Mass Rating (RMR) and Geological Strength Index (GSI), providing estimates for key parameters such as rock mass cohesion, internal friction angle, and deformation modulus. These values formed the basis for subsequent analytical and numerical analyses.
  • The support pressure was initially estimated using a closed-form method, based on elasto-plastic strain-softening model. The Mohr–Coulomb failure criterion was applied to estimate the transition between elastic and plastic zones, allowing for an assessment of rock mass response to excavation. The analytical approach provided a first estimate of the expected load on the support system, used subsequently in further calculations.
  • The primary support system, consisting of yielding steel arches equipped with sliding joints, was designed based on numerical calculations of bending moments and axial forces in frame models. The optimal steel set spacing was determined to ensure required load-bearing capacity while maintaining cost-effectiveness. Additionally, the secondary support system, comprising aforementioned steel sets embedded in fiber-reinforced shotcrete, was designed based on its compressive and shear strength, ensuring long-term excavation stability.
  • Two-dimensional finite element models (FEM) were developed to analyze stress distribution and state of deformation around analyzed excavations. The model incorporated pre-mining stress conditions, excavation sequence effects, and rock mass properties derived from empirical classification systems. To simulate the gradual formation of the plastic zone, a longitudinal displacement profile (LDP) was applied, allowing for a more realistic assessment of ground-support interaction.
  • The primary and secondary support systems were evaluated through numerical simulations. The analysis confirmed that the selected steel arches with sliding joints maintained stability under expected loads, while the composite support system of shotcrete and steel reinforcements provided long-term structural integrity. The numerical results validated the analytical calculations, ensuring that the adopted design met safety requirements.
  • The proposed excavation and support designs were successfully implemented during the excavation of auxiliary workings for the deepening of Shaft II. The pilot drift expansion method was applied to ensure controlled stress redistribution and maximize operational safety. In situ observations confirmed that the implemented support system performed as expected, preventing excessive deformation or rock mass failure. The results demonstrate the effectiveness of the combined analytical and numerical design approach for the design of deep mining excavations.

Author Contributions

Conceptualization, A.D. and D.P., methodology, A.O. and P.D., formal analysis, A.D., project administration, P.K., supervision, P.K. and D.P., validation, P.K. and D.P., writing—original draft, A.O. and P.D., writing—review and editing, P.K. and A.O. All authors have read and agreed to the published version of the manuscript.

Funding

This research received no external funding.

Institutional Review Board Statement

Not applicable.

Informed Consent Statement

Not applicable.

Data Availability Statement

The data presented in this study are available on request from the corresponding author. The data are not publicly available due to privacy policy.

Conflicts of Interest

Authors Paweł Kamiński, Aleksandra Otto and Piotr Dawidziuk are employed by the company Przedsiębiorstwo Budowy Szybów S.A. The remaining authors declare that the research was conducted in the absence of any commercial or financial relationships that could be construed as a potential conflict of interest.

References

  1. Walewski, J. Zasady Projektowania Kopalń. Część V. Projektowanie Szybów i Szybików; Publishing House Śląsk: Katowice, Poland, 1965; pp. 660–724. [Google Scholar]
  2. Liu, Z.; Meng, Y. Key technologies of drilling process with raise boring method. J. Rock Mech. Geotech. Eng. 2015, 7, 385–394. [Google Scholar] [CrossRef]
  3. Kamiński, P.; Dyczko, A.; Prostański, D. Virtual Simulations of a New Construction of the Artificial Shaft Bottom (Shaft Safety Platform) for Use in Mine Shafts. Energies 2021, 14, 2110. [Google Scholar] [CrossRef]
  4. Gospodarczyk, P. Computer Simulation Usage for Verification of Deepened Shaft Artificial Bottom Construction. Arch. Min. Sci. 2015, 60, 1029–1039. [Google Scholar] [CrossRef]
  5. Kamiński, P. Polish Experience in Shaft Deepening and Mining Shaft Hoist Elongation. In Mining Techniques—Past, Present and Future; Soni, A., Ed.; IntechOpen: London, UK, 2021; pp. 79–96. ISBN 978-1-83962-368-4. [Google Scholar]
  6. Łapuszek, B.; Szyndler, J.; Kamiński, P. Wykonanie wlotu podszybia szybu ”Janina VI” na poziomie 800. Wiadomości Górnicze 2017, 68, 173–183. [Google Scholar]
  7. Małkowski, P.; Ostrowski, P.; Brodny, J. Analysis of Young’s modulus for Carboniferous sedimentary rocks and its relationship with uniaxial compressive strength using different methods of modulus determination. J. Sustain. Min. 2018, 17, 145–157. [Google Scholar] [CrossRef]
  8. Bieniawski, Z.T. Engineering Rock Mass Classifications: A Complete Manual for Engineers and Geologists in Mining, Civil, and Petroleum Engineering; Wiley: New York, NY, USA, 1989; pp. 51–72. ISBN 978-0471601722. [Google Scholar]
  9. Hoek, E. Strength of Rock and Rock Masses. ISRM News J. 1994, 2, 4–16. [Google Scholar]
  10. Hoek, E.; Kaiser, P.K.; Bawden, W.F. Support of Underground Excavations in Hard Rock; A.A. Balkema Publishers: Rotterdam, The Netherlands, 1995; pp. 27–50. ISBN 978-9054101871. [Google Scholar]
  11. Hoek, E.; Marinos, P. Predicting tunnel squeezing problems in weak heterogeneous rock masses. Tunn. Tunn. Int. 2000, 132, 45–51. [Google Scholar]
  12. Barton, N.; Lien, R.; Lunde, J. Engineering classification of rock masses for the design of tunnel support. Rock Mech. 1974, 6, 189–236. [Google Scholar] [CrossRef]
  13. Hoek, E.; Brown, E.T. Practical estimates of rock mass strength. Int. J. Rock Mech. Min. Sci. 1997, 34, 1165–1196. [Google Scholar] [CrossRef]
  14. Li, G.C.; Sun, Y.T.; Zhang, J.F.; Zhang, Q.J.; Sun, C.L.; Zhang, S.H.; Bi, R.Y. Experiment and application of coalcrete on roadway stability: A comparative analysis. Adv. Mater. Sci. Eng. 2020, 2020, 1–14. [Google Scholar] [CrossRef]
  15. Małkowski, P.; Ostrowski, Ł.; Bachanek, P. Modelling the Small Throw Fault Effect on the Stability of a Mining Roadway and Its Verification by In Situ Investigation. Energies 2017, 10, 2082. [Google Scholar] [CrossRef]
  16. Małkowski, P.; Ostrowski, Ł. Convergence monitoring as a basis for numerical analysis of changes of rock-mass quality and Hoek-Brown failure criterion parameters due to longwall excavation. Arch. Min. Sci. 2019, 64, 94–118. [Google Scholar] [CrossRef]
  17. Marini, D.; Zurlo, R.; Rivoltini, M.; Pizzarotti, E.M. Brenner Base Tunnel, Italian Side: Mining methods stretches—Design procedures. In Tunnels and Underground Cities. Engineering and Innovation Meet Archaeology, Architecture and Art. Volume 7: Long And Deep Tunnels; Peila, D., Viggiani, G., Celestino, T., Eds.; CRC Press: London, UK, 2020; ISBN 9780429424441. [Google Scholar] [CrossRef]
  18. Sebbeh-Newton, S.; Abdulazeez Shehu, S.; Ayawah, P.; Kaba, A.A.; Zabidi, H. Analytical and numerical assessment of a preliminary support design—A case study. Cogent Eng. 2021, 8, 1869367. [Google Scholar] [CrossRef]
  19. Azad, M.A.; Singh, S.K.; Alok, A.; Meenakshi; Shekhar, S.; Kumar, P. Geotechnical and geological studies of Adit-6 of the railway tunnel between Rishikesh and Karnprayag in India focusing on the excavation methods and design of support analysis: A case study. Arab. J. Geosci. 2022, 15, 129. [Google Scholar] [CrossRef]
  20. Zeqiri, K.; Ibishi, G.; Shabani, M.; Kortnik, J.; Bilir, M.E.; Geniş, M.; Yavuz, M.; Hetemi, M.; Bacak, G. Preliminary support design for underground mine adit, Artana mine, Kosovo. Min. Sci. 2021, 28, 141–159. [Google Scholar]
  21. Salehi, B. Cavern Design Philosophy under High Stress Rock Condition a Case Study in Sri Lanka. Am. J. Appl. Sci. 2017, 14, 406–416. [Google Scholar] [CrossRef]
  22. Azad, M.A.; Naithani, A.K.; Shekhar, S.; Ahmad, S.; Singh, S.K. Tunnel Support Validation Using Numerical Modelling: A Case Study from NW, Himalaya, India. Geotech. Geol. Eng. 2023, 41, 4335–4349. [Google Scholar] [CrossRef]
  23. Cai, M.; Kaiser, P.K.; Tasaka, Y.; Minami, M. Determination of residual strength parameters of jointed rock masses using the GSI system. Int. J. Rock Mech. Min. Sci. 2007, 44, 247–265. [Google Scholar] [CrossRef]
  24. Walton, G.; Larie, D.; Alejano, L.R. On the residual strength of rocks and rockmasses. Rock Mech. Rock Eng. 2019, 52, 4821–4833. [Google Scholar] [CrossRef]
  25. Dressel, E.J.; Diederichs, M.S. Guidelines for estimating residual GSI and the effects of Hoek-Brown dilation on continuum 3D pillar behaviour. In Proceedings of the GeoNiagara 2021 Conference, Niagara Falls, ON, Canada, 26–29 September 2021; p. 8. [Google Scholar]
  26. Fischer, C.P.; Diederichs, M.S. Explicit numerical models for the prediction of plastic and weakening rockmass behaviour around a circular tunnel in isotropic and anisotropic stress conditions. IOP Conf. Ser. Earth Environ. Sci. 2023, 1124, 012061. [Google Scholar] [CrossRef]
  27. Rafiei Renani, H.; Cai, M. Forty-Year Review of the Hoek–Brown Failure Criterion for Jointed Rock Masses. Rock Mech. Rock Eng. 2022, 55, 439–461. [Google Scholar] [CrossRef]
  28. Hoek, E.; Carranza-Torres, C.; Corkum, B. Hoek-Brown failure criterion and GSI—2002 edition. In Proceedings of the 5th North American Rock Mechanics Symposium, Toronto, ON, Canada, 7–10 July 2002; pp. 267–273. [Google Scholar]
  29. Hoek, E.; Brown, E.T. The Hoek-Brown failure criterion and GSI—2018 edition. J. Rock Mech. Geotech. Eng. 2019, 11, 445–463. [Google Scholar] [CrossRef]
  30. Małkowski, P.; Niedbalski, Z. The Meaning of Average Compressive and Tensile Strength for Hoek-Brown mi Constant Determination. Arch. Min. Sci. 2024, 69, 485–508. [Google Scholar] [CrossRef]
  31. Arshadnejad, S. Determination of “mi” in the Hoek-Brown failure criterion of rock. Min. Sci. 2018, 25, 111–127. [Google Scholar] [CrossRef]
  32. Hoek, E.; Diederichs, M.S. Empirical estimation of rock mass modulus. Int. J. Rock Mech. Min. Sci. 2006, 43, 203–215. [Google Scholar] [CrossRef]
  33. Brady, B.H.G.; Brown, E.T. Rock Mechanics for Underground Mining, 3rd ed.; Springer Dordrecht: Dordrecht, The Netherlands, 2006; pp. 142–164. ISBN 978-1-4020-2064-3. [Google Scholar]
  34. Kirsch, G. Die Theorie der Elastizität und die Bedürfnisse der Festigkeitslehre. Zantralblatt Verlin Dtsch. Ingenieure 1898, 42, 797–807. [Google Scholar]
  35. Brown, E.T.; Bray, J.; Ladanyi, B.; Hoek, E. Ground response curves for rock tunnels. J. Geotech. Eng. 1983, 109, 15–39. [Google Scholar] [CrossRef]
  36. Duncan Fama, M.E. Numerical modelling of yield zones in weak rock. In Comprehensive Rock Engineering: Principles, Practice and Projects. Analysis and Design Methods; Fairhurst, C., Ed.; Pergamon Press: Oxford, UK, 1995; pp. 49–75. ISBN 978-0-08-040615-2. [Google Scholar]
  37. Carranza-Torres, C.; Fairhurst, C. Application of the Convergence-Confinement Method of Tunnel Design to Rock Masses that Satisfy The Hoek-Brown Failure Criterion. Tunn. Undergr. Space Technol. 2000, 15, 187–213. [Google Scholar] [CrossRef]
  38. PN-G-05020:1997; Podziemne Wyrobiska Korytarzowe i Komorowe. Obudowa Sklepiona. Zasady Projektowania i Obliczeń Statycznych. Polski Komitet Normalizacyjny: Warsaw, Poland, 1997.
  39. PN-G-05600:1998; Podziemne Wyrobiska Korytarzowe i Komorowe. Obudowa Powłokowa. Zasady Projektowania i Obliczeń Statycznych. Polski Komitet Normalizacyjny: Warsaw, Poland, 1998.
  40. Chudek, M.; Mateja, J.; Rułka, K. Podstawy Teoretyczne Oraz Nowe Zasady Doboru, Ustalenia Obciążeń i Wymiarowania Obudów Długotrwałych Wyrobisk Korytarzowych i Komorowych; Publishing House of Silesian University of Technology: Gliwice, Poland, 1985. [Google Scholar]
  41. Chudek, M.; Głuch, P.; Szczepaniak, Z. Projektowanie i Wykonywanie Wyrobisk Komorowych, 2nd ed.; Publishing House of Silesian University of Technology: Gliwice, Poland, 1991. [Google Scholar]
  42. Kamiński, P.; Otto, A.; Dawidziuk, P.; Malinowski, L.; Stecuła, K.; Dyczko, A. Determination of the Ground Reaction Curve for an Elasto-Plasto-Fractured Rock Mass. Appl. Sci. 2024, 14, 5409. [Google Scholar] [CrossRef]
  43. Rułka, K.; Mateja, J.; Kowalski, E.; Skrzyński, K.; Stałęga, S.; Wojtusiak, A.; Schinohl, J. Uproszczone Zasady Doboru Obudowy Odrzwiowej Wyrobisk Korytarzowych w Zakładach Wydobywających Węgiel Kamienny; Publishing House of Central Mining Institute: Katowice, Poland, 2001; p. 23. [Google Scholar]
  44. Chudek, M.; Duży, S.; Kleta, H.; Kłeczek, Z.; Stoiński, K.; Zorychta, A. Zasady Doboru i Projektowania Obudowy Wyrobisk Korytarzowych i ich Połączeń w Zakładach Górniczych Wydobywających Węgiel Kamienny; Departament of Geomechanics, Underground Construction and Surface Protection, Faculty of Mining and Geology of Silesian University of Technology: Gliwice, Poland, 2000; pp. 42–52. [Google Scholar]
  45. PN-B-03200:1990; Konstrukcje Stalowe. Obliczenia Statyczne i Projektowanie. Polski Komitet Normalizacyjny: Warsaw, Poland, 1990.
  46. Karakus, M. Appraising the methods accounting for 3D tunnelling effects in 2D plane strain FE analysis. Tunn. Undergr. Space Technol. 2007, 22, 47–56. [Google Scholar] [CrossRef]
  47. Vlachopoulos, N.; Diederichs, M.S. Appropriate Uses and Practical Limitations of 2D Numerical Analysis of Tunnels and Tunnel Support Response. Geotech. Geol. Eng. 2014, 32, 469–488. [Google Scholar] [CrossRef]
  48. Vlachopoulos, N.; Diederichs, M.S. Improved longitudinal displacement profiles for convergence confinement analysis of deep tunnels. Rock Mech. Rock Eng. 2009, 42, 131–146. [Google Scholar] [CrossRef]
  49. RS2 User Guide. Available online: https://www.rocscience.com/help/rs2/documentation/ (accessed on 23 January 2025).
  50. Tajduś, A.; Cała, M.; Tajduś, K. Geomechanika w Budownictwie Podziemnym i Tunelowaniu; Publishing House of AGH University of Science and Technology: Cracow, Poland, 2012; pp. 185–191. ISBN 978-83-7464-511-9. [Google Scholar]
  51. Carranza-Torres, C.; Diederichs, M.S. Mechanical analysis of a circular liner with particular reference to composite supports. For example, liners consisting of shotcrete and steel sets. Tunn. Undergr. Space Technol. 2009, 24, 506–532. [Google Scholar] [CrossRef]
  52. Ahmad, E. Design Considerations for Single Twin-Track Railway NATM Tunnel over Mountainous Terrain in Kenny Hill Formation. In Proceedings of the Southeast Asian Conference and Exhibition in Tunneling and Underground Space 2017, Subang Jaya, Malaysia, 18–19 April 2017. [Google Scholar]
  53. Terron-Almenara, J.; Skretting, E.; Holter, K.G. Design of Rock Support in Low Overburden and Hard Rock Conditions with the use of Rock Mass Classification Systems and Numerical Analyses: A Study Based on the Construction of the Hestnes Railway Tunnel, Norway. Rock. Mech. Rock. Eng. 2024, 57, 1–26. [Google Scholar] [CrossRef]
  54. Cui, G.; Chen, Q. Research on large deformation control technology of highly weathered carbonaceous slate tunnel. Appl. Rheol. 2023, 33, 47–53. [Google Scholar] [CrossRef]
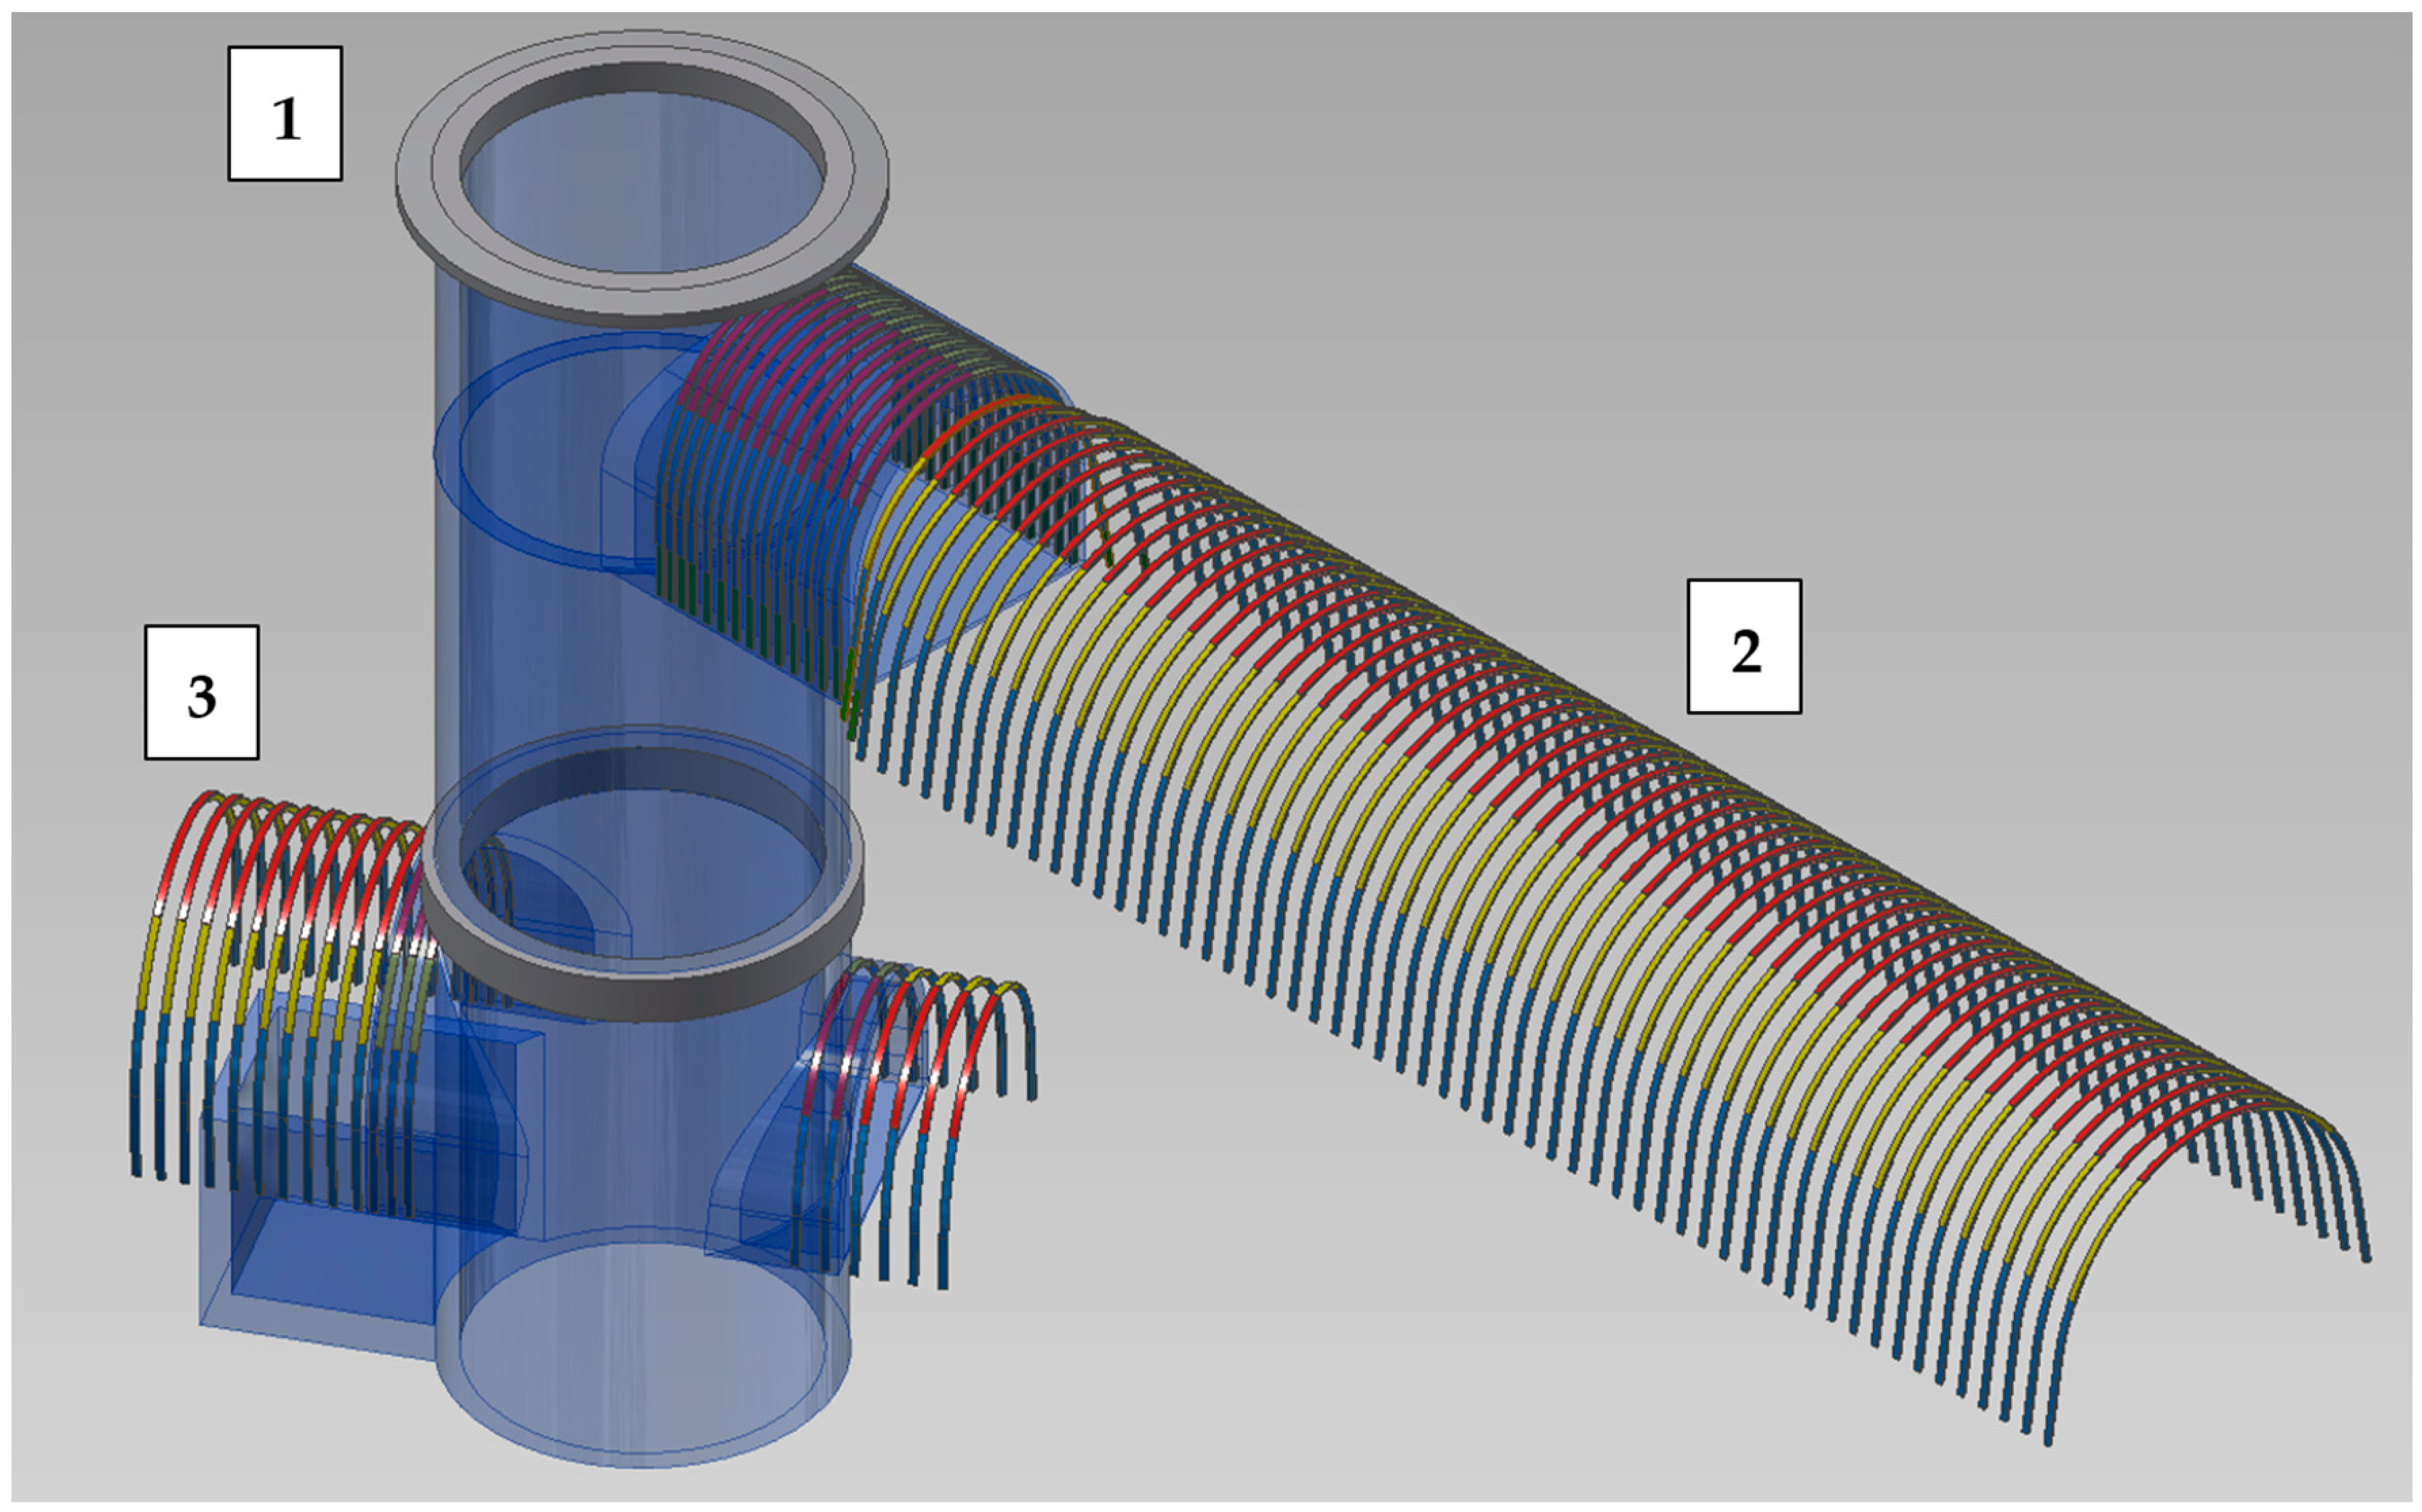
Figure 1. Arrangement of auxiliary working for the deepening of Shaft II (1—shaft bottom at depth of 980 m, 2—hoisting machine chamber, 3—technological shaft inset).
Applsci 15 03131 g001
Figure 2. Static schemes of the frame models ((a)—hoisting machine chamber; (b)—technological shaft inset).
Applsci 15 03131 g002
Figure 3. LDP curve for the hoisting machine chamber.
Applsci 15 03131 g003
Figure 4. Numerical model for the hoisting machine chamber.
Applsci 15 03131 g004
Figure 5. Numerical model for the technological shaft inset.
Applsci 15 03131 g005
Figure 6. Bending moment diagram for the yielding steel set used as a primary support of the hoisting machine chamber.
Applsci 15 03131 g006
Figure 7. Support capacity plots of the secondary support of the hoisting machine chamber ((a)—M-N plot for shotcrete; (b)—Q-N plot for shotcrete; (c)—M-N plot for steel sets; (d)—Q-N plot for steel sets).
Applsci 15 03131 g007
Figure 8. Support capacity plots of the secondary support of the technological shaft inset ((a)—M-N plot for shotcrete; (b)—Q-N plot for shotcrete; (c)—M-N plot for steel sets; (d)—Q-N plot for steel sets).
Applsci 15 03131 g008aApplsci 15 03131 g008b
Figure 9. Actual view of the hoisting machine chamber supported with primary support (in the foreground) and secondary support (in the background).
Applsci 15 03131 g009
Table 1. Basic mechanical parameters of intact rock, along with RQD values for different lithological units in the area of Shaft II.
LithologyDepth
(m)
σc,i
(MPa)
σt,i
(MPa)
Ei
(MPa)
RQD
(%)
Medium-grained sandstone957.00–983.5035.63.87903100
Mixed-grained sandstone983.50–988.5055.25.812,25480
Mixed-grained sandstone988.50–993.2064.96.814,40880
Claystone993.20–995.7032.64.0893265
Mudstone995.70–999.2073.98.917,14570
Fine-grained sandstone999.20–1012.2067.36.914,94160
Table 2. Classification of the rock masses in the area of Shaft II.
LithologyDepth
(m)
Rock Mass Classification
RMRGSIGSIr
Medium-grained sandstone957.00–983.5072.467.427.3
Mixed-grained sandstone983.50–988.5068.363.327.1
Mixed-grained sandstone988.50–993.2069.064.027.1
Claystone993.20–995.7058.654.626.1
Mudstone995.70–999.2065.160.126.9
Fine-grained sandstone999.20–1012.2064.259.226.8
Table 3. Peak strength properties of the rock masses in the area of Shaft II.
LithologyDepth
(m)
Hoek–BrownCoulomb–Mohr
msac (MPa)φ
(°)
Medium-grained sandstone957.00–983.502.6680.0270.5022.6032.56
Mixed-grained sandstone983.50–988.502.3320.0170.5022.9434.89
Mixed-grained sandstone988.50–993.202.3960.0180.5023.2336.31
Claystone993.20–995.701.0250.0020.5041.5824.52
Mudstone995.70–999.201.4340.0050.5032.6433.20
Fine-grained sandstone999.20–1012.201.5700.0050.5032.5933.17
Table 4. Post-peak strength properties of the rock masses in the area of Shaft II.
LithologyDepth
(m)
Hoek–BrownCoulomb–Mohr
msac (MPa)φ
(°)
Medium-grained sandstone957.00–983.500.6370.0000.5271.2721.19
Mixed-grained sandstone983.50–988.500.6400.0000.5271.5024.09
Mixed-grained sandstone988.50–993.200.6430.0000.5271.6125.18
Claystone993.20–995.700.5500.0000.5291.1419.62
Mudstone995.70–999.200.5760.0000.5281.6125.13
Fine-grained sandstone999.20–1012.200.6500.0000.5281.6425.36
Table 5. Overview of deformation moduli of intact rock and jointed rock mass for different lithological units in the area of Shaft II.
LithologyDepth
(m)
Ei
(MPa)
Em
(MPa)
Medium-grained sandstone957.00–983.5079035391
Mixed-grained sandstone983.50–988.5012,2547285
Mixed-grained sandstone988.50–993.2014,4088788
Claystone993.20–995.7089321820
Mudstone995.70–999.2017,1456136
Fine-grained sandstone999.20–1012.2014,9415077
Table 6. Input data and calculation results of the static support pressure for the hoisting machine chamber (excavation A) and the technological shaft inset (excavation B).
ParameterSymbolUnitAB
1. Input parameters
Peak cohesive strength of the rock masscMPa2.762.87
Post-peak cohesive strength of the rock masscMPa1.381.54
Peak internal friction angle of the rock massφ°33.6434.07
Post-peak internal friction angle of the rock massφ°22.4924.26
Rock mass deformation modulusEMPa62867261
Rock mass Poisson’s ratioν-0.180.19
Average bulk weight of the overburden rockγoMN/m30.0240.024
Overburden thicknessHm986.51003.4
Excavation cross-sectional areaAm239.5357.69
Yielding force of the sliding jointNjMN0.290.35
Steel set spacingem0.600.50
Average bulk weight of the roof rocksγrMN/m30.0240.024
Partial load factor according to PN-G-05600n-1.201.20
Distance between neighboring excavationsxsm15.1523.00
Width of the adjacent excavationwam5.905.90
2. Calculation results
Far field (in situ) stresspzMPa23.6824.08
Equivalent excavation radiusreqm3.554.29
Peak compressive strength of the rock massRcMPa10.3010.81
Post-peak compressive strength of the rock massRcMPa4.114.77
Computational factorϐ-2.482.55
Radial stress at the boundary between plastic and elastic zonepgMPa8.268.21
Active support pressurepaMPa0.140.16
Radius of the plastic zonerlm7.068.03
Impact factor of the adjacent exavationksm1.081.04
Charasteristic value of the static support pressure qzNMPa0.0850.090
Design value of the static support pressureqzoMPa0.1090.113
Table 7. Input data and calculation results of maximum steel set spacing for the hoisting machine chamber (excavation A) and the technological shaft inset (excavation B).
ParameterSymbolUnitAB
1. Input parameters
Section type--V29V36
Steel grade--S480WS480W
Maximum value of the bending momentMmaxMNm0.01680.0147
Corresponding value of the axial forceNcorMN0.29620.2851
Value of the axial force in the sliding jointNMN0.47800.5147
Cross-sectional area of the V-profileAm20.003630.00452
Elastic section modulus of the V-profileWxm30.00008750.0001276
Yielding force of the sliding jointNjMN0.290.35
Radius of gyration of the V-profileixm0.04000.0452
Characteristic yield strength of steelfykMPa480480
Design yield strength of steelfydMPa384384
Characteristic ultimate tensile strength of steelftMPa650650
Unsupported length of the steel setlm6.726.60
Shape factorm-1.401.40
Support working condition factorm1-1.501.50
Material plasticity coefficientn1-0.350.35
2. Calculation results
Slenderness ratio according to PN-B-03200λ-84.074.4
Reference slenderness ratio according to PN-B-03200λp-48.348.3
Reduction factor according to PN-B-03200ϕ-0.270.33
Max. steel set spacing due to profile strengthe1m0.9131.117
Max. steel set spacing due to sliding joint capacitye2m0.6070.680
Maximum steel set spacingemaxm0.6070.680
Steel set spacing adopted for further calculationsem0.6000.500
Table 8. Input data and calculation results of the composite support capacity for the hoisting machine chamber (excavation A) and the technological shaft inset (excavation B).
ParameterSymbolUnitAB
1. Input parameters
Contour radius of the excavation openingrwm4.583.87
Characteristic compressive strength of shotcretefckMPa35.0040.00
Characteristic tensile strength of shotcretefctdMPa2.202.50
Partial safety factor for fiber-reinforced shotcreteγc-1.401.40
Design compressive strength of shotcretefcdMPa25.0028.57
Desing tensile strength of shotcretefctdMPa1.571.79
Shotcrete thicknessgm0.050.05
Characteristic value of the ultimate strength of steelfykMPa650650
Partial safety factor for steelγs-1.251.25
Design value of the ultimate strength of steelfdMPa520520
Cross-sectional area of the steel set profileAm20.003630.00452
Steel set spacingem0.6000.500
2. Calculation results
Support capacity due to compression failurepsup1MPa0.9601.584
Support capacity due to shear failurepsup2MPa0.4810.821
Table 9. Input data and calculation results of the strain ratio of the steel sets used as a primary support of the hoisting machine chamber (excavation A) and the technological shaft inset (excavation B).
ParameterSymbolUnitAB
1. Input parameters
Section type--V29V36
Steel grade--S480WS480W
Maximum value of the bending momentMmaxMNm0.00450.0119
Steel set spacingem0.6000.500
Cross-sectional area of the V-profileAm20.0003630.00452
Elastic section modulus of the V-profileWxm30.00008750.0001276
Radius of gyration of the V-profileixm0.04000.0452
Characteristic yield strength of steelfykMPa480480
Design yield strength of steelfydMPa384384
Characteristic ultimate tensile strength of steelftMPa650650
Shape factorm-1.401.40
Support working condition factorm1-1.501.30
Material plasticity coefficientn1-0.350.35
2. Calculation results
Strain ratio of the steel setk-0.6870.900
Disclaimer/Publisher’s Note: The statements, opinions and data contained in all publications are solely those of the individual author(s) and contributor(s) and not of MDPI and/or the editor(s). MDPI and/or the editor(s) disclaim responsibility for any injury to people or property resulting from any ideas, methods, instructions or products referred to in the content.