Article

Experimental Study on the Effect of Rubber Particle Size on the Frost Resistance Characteristics of Concrete

1
Anhui Province Key Laboratory of Green Building and Assembly Construction, Anhui Institute of Building Research & Design, Heifei 230031, China
2
School of Civil Engineering and Architecture, Anhui University of Science and Technology, Huainan 232001, China
3
National Key Laboratory of Fine Coal Exploration and Intelligent Development, China University of Mining and Technology, Xuzhou 221116, China
*
Authors to whom correspondence should be addressed.
Appl. Sci. 2025, 15(6), 3060; https://doi.org/10.3390/app15063060
Submission received: 6 November 2024 / Revised: 16 December 2024 / Accepted: 23 December 2024 / Published: 12 March 2025
(This article belongs to the Special Issue Emerging Trends in Rock Mechanics and Rock Engineering)

Abstract

:

Featured Application

The study of the law of influence of rubber particle size on concrete antifreeze characteristics can lead to effectively grasping the characteristics of rubber concrete in cold zones. Meanwhile, in some practical projects (cold zone rock projects), it can be used to better play with the antifreeze role of rubber concrete, protect the safety of the project, and provide theoretical references for actual projects.

Abstract

In order to study the law of influence of rubber particle size on concrete frost resistance characteristics, this paper systematically evaluates the freeze–thaw characteristics of rubber concrete containing different particle sizes. Rubber concrete containing different particle sizes is subjected to 25, 50, 75, 100, and 125 freeze–thaw cycles. After the freeze–thaw cycles, the specimens are observed or measured for appearance, mass change rate, relative dynamic elastic modulus, internal damage degree, compressive strength, and tensile strength. The results show that the frost resistance of concrete mixed with rubber of different particle sizes is more excellent, and the surface of concrete specimens after different numbers of freezing and thawing cycles shows different degrees of spalling. Meanwhile, due to the presence of rubber, the compressive and tensile strengths of rubberized concrete are significantly inferior. Finally, the microscopic scanning results reveal the mechanism of rubber’s incorporation into concrete. The incorporation of rubber effectively reduces its internal pore development. To summarize, it can be seen that rubber incorporated into concrete is a worthwhile method to consider for frost resistance of engineering materials.

1. Introduction

From the establishment of environmental protection as a basic national policy to the implementation of the sustainable development strategy and the construction of a resource-saving and environmentally friendly society, the strategic position of ecological environmental protection has been continuously upgraded. However, with China’s economic and social development, solid waste is increasing, which has become a challenge for sustainable development [1]. According to relevant statistics, the rate of recycling waste rubber in China is less than 50% [2]. Although part of the rubber is recycled, most of the waste rubber is buried or incinerated, which causes fire hazards and public health and safety and environmental problems [3,4,5,6]. For the disposal of waste rubber, experts and scholars at home and abroad have put forward a series of recommendations [7,8,9], in which rubber is used as an aggregate to replace original concrete aggregate, which can effectively solve the problem of rubber recycling and pollution and at the same time achieve waste recycling. In addition, relevant studies have shown that rubber incorporation can have a positive effect on the antifreeze, impermeability, and deformation capacity, and the chloride ion penetration, of concrete [10,11,12,13], which shows that rubber particles incorporated into concrete can effectively improve the relevant characteristics of concrete and at the same time achieve the effect of recycling resources.
When rubber particles replace the aggregate and are incorporated into concrete, they can effectively meet the needs of concrete and protect sand and gravel resources. Rubber added to concrete can effectively improve its anti-cracking properties. According to the analysis of three-point test results, rubber can effectively absorb part of the energy to improve the toughness of concrete [14,15]. Further, adding rubber to concrete can make the slump of concrete smaller, resulting in poor working performance [16]. In order to solve this problem, 1~3 mm, 3~6 mm, and 60-mesh rubber were mixed into concrete. It was found that for the particle size of 1~3 mm and 60-mesh rubber, at a 15% admixture, the slump first increased and then decreased. The particle size of 1~3 mm rubber admixture reached the maximum slump at 10~15%, and the 60-mesh rubber admixture reached the maximum slump at 5~10%. The rubber particle size and the admixture had different effects on the slump [17]. Also, for concrete mixed with coarse and fine rubber, its related work performance was also quite different. Relative to the mixing of fine rubber, the work performance of coarse rubber concrete was better. For an equal volume replacement of fine aggregate with rubber mixed into concrete, its work performance increased with the increase in coarse rubber mixing, while for fine rubber, it was the opposite. For rubber directly mixed into concrete outside, whether it was coarse rubber or fine rubber, its work performance showed the same effect on the slump with the increase in the amount of rubber mixed in [18], and the slump showed a pattern of increasing and then decreasing [19].
The work performance of rubber admixture undergoes a series of changes and also has a series of effects on its static mechanical properties. Percentages of 15%, 30%, and 45% of rubber were added to concrete with an equal volume replacement of coarse aggregate. It was found that with the increase in the amount of mixing, the compressive strength decreased more obviously. The mixing particle size also had an effect on the strength, but it was not the case that the larger the particle size, the more the strength decreased [20]. When rubber powder and rubber blocks were added to concrete in different contents, it was found that the rubber powder had less of an effect on the compressive, flexural, and splitting strength of concrete with the same content [20,21]. After carrying out tests on concrete with different rubber contents, it was found that the compressive strength decreased with the increase in admixture. When the rubber content was 10%, the change in flexural strength was insignificant, the decrease in bending and tensile modulus was more pronounced, and the seepage resistance improved to float less. When the rubber content was more than 10%, the decrease in flexural strength was greater, and the seepage resistance had a tendency to decrease. Through the Fuller formula to derive the probability of occurrence of each aggregate on any section, the calculation results simulated the aggregate distribution state of each cross-section. Through finite element analysis and comparison with the actual test results, it was found that the specimen damage was due to the pressurization process. The rubber was under less stress, while the concrete around it was under large stress, making the stress distribution uneven and resulting in a concentration of stress, leading to the specimen’s destruction [22]. Yuan Qun et al. [23] found that regarding the effect of the two factors of mixing and particle size on the various basic mechanical properties of concrete, the particle size factor played a dominant role. The axial compressive stress–strain curve of rubberized concrete with different dosages and particle sizes was studied, and it was found that there was a certain correlation between the stress, strain, and Poisson’s ratio of rubberized concrete and rubber dosage and particle size as a whole, but the law was not obvious. In addition, the effects of dosage and particle size on its performance were random, and the law was difficult to determine [24]. The pre-treatment of rubber and then mixing it into the concrete was researched, and it was found that it could reduce the water absorption of concrete and enhance the compressive strength and flexural strength. If the water–cement ratio was higher, the improved performance was better [25]. Rubber of different particle sizes with different substitution amounts were incorporated into concrete, and it was found that the addition of rubber reduced the concrete strength, and the concrete density and modulus of elasticity also decreased with the increase in rubber admixture [26,27].
Many scholars have conducted a series of studies on static mechanical properties. In engineering, rubberized concrete is commonly used in practical projects [28,29,30,31,32,33]. However, with the development of cold regions, related engineering freeze–thaw cycles frequently occur. As well as under the conditions of global climate change, more and more frequent cold wave low temperatures exacerbate the freeze–thaw cycle effect, and the related effect exacerbates the damage to concrete. Rubber blended into concrete can effectively change this situation [1,34]. Analyzing the gap in physical and mechanical properties between NC and RRC after freeze–thaw cycles in a chloride salt environment, it was found that the RRC mechanical and freeze–thaw properties were optimal when the rubber admixture was 10% [35]. Different rubber powders were added to the concrete, and the concrete had better frost resistance when the rubber powder was 2.5%, and the freeze–thaw damage constitutive model of rubberized concrete was established [36]. Rubber in concrete can play the role of an air-entraining agent, increasing the air content of concrete, and the more rubber mixing, the faster its strength increases on the third and seventh days [37]. A fast-freezing test on rubberized concrete resulted in lighter mass and less density, which resulted in lower compressive strength [38]. For frost resistance of rubber concrete containing different dosages and particle sizes, it was found that as the rubber particle size decreases, the rate of mass loss of concrete decreases, and the higher the modulus of elasticity, the better the frost resistance. As the dosage increases, the rate of mass loss decreases and then increases, and the modulus of elasticity increases and then decreases, and when the rubber dosage is less than 100 L/m3, the frost resistance is better [39]. It was shown that the best freezing performance of concrete was achieved with a rubber dosage of 30% for 20 purposes, and the relationship between the amount of freezing and thawing loss and the number of freezing and thawing times of rubberized concrete could be best modeled by a quadratic equation [40].
Although it has been confirmed in some studies that the use of rubberized concrete enhances concrete-related properties to a certain extent, the research on the frost resistance of concrete with different rubber particle sizes under freeze–thaw environment needs to be further improved. Therefore, this paper evaluates the frost resistance of concrete containing different rubber particle sizes. Different rubber concrete specimens are taken according to the rubber particle size, and different numbers of freeze–thaw cycles are carried out on the specimens. The appearance change, mass loss, relative dynamic elastic modulus, compressive strength, and tensile strength of rubber concrete with different particle sizes are observed as an evaluation of different rubber concrete freezing resistance indexes. Finally, the deterioration basis of freeze–thaw damage is analyzed in depth by electron microscope. The research in this paper will provide experimental and theoretical references for the application of rubber to concrete for frost resistance, and at the same time, the research will provide a friendly disposal method for the utilization of rubber concrete, while achieving resource recycling to a certain extent.

2. Materials and Methods
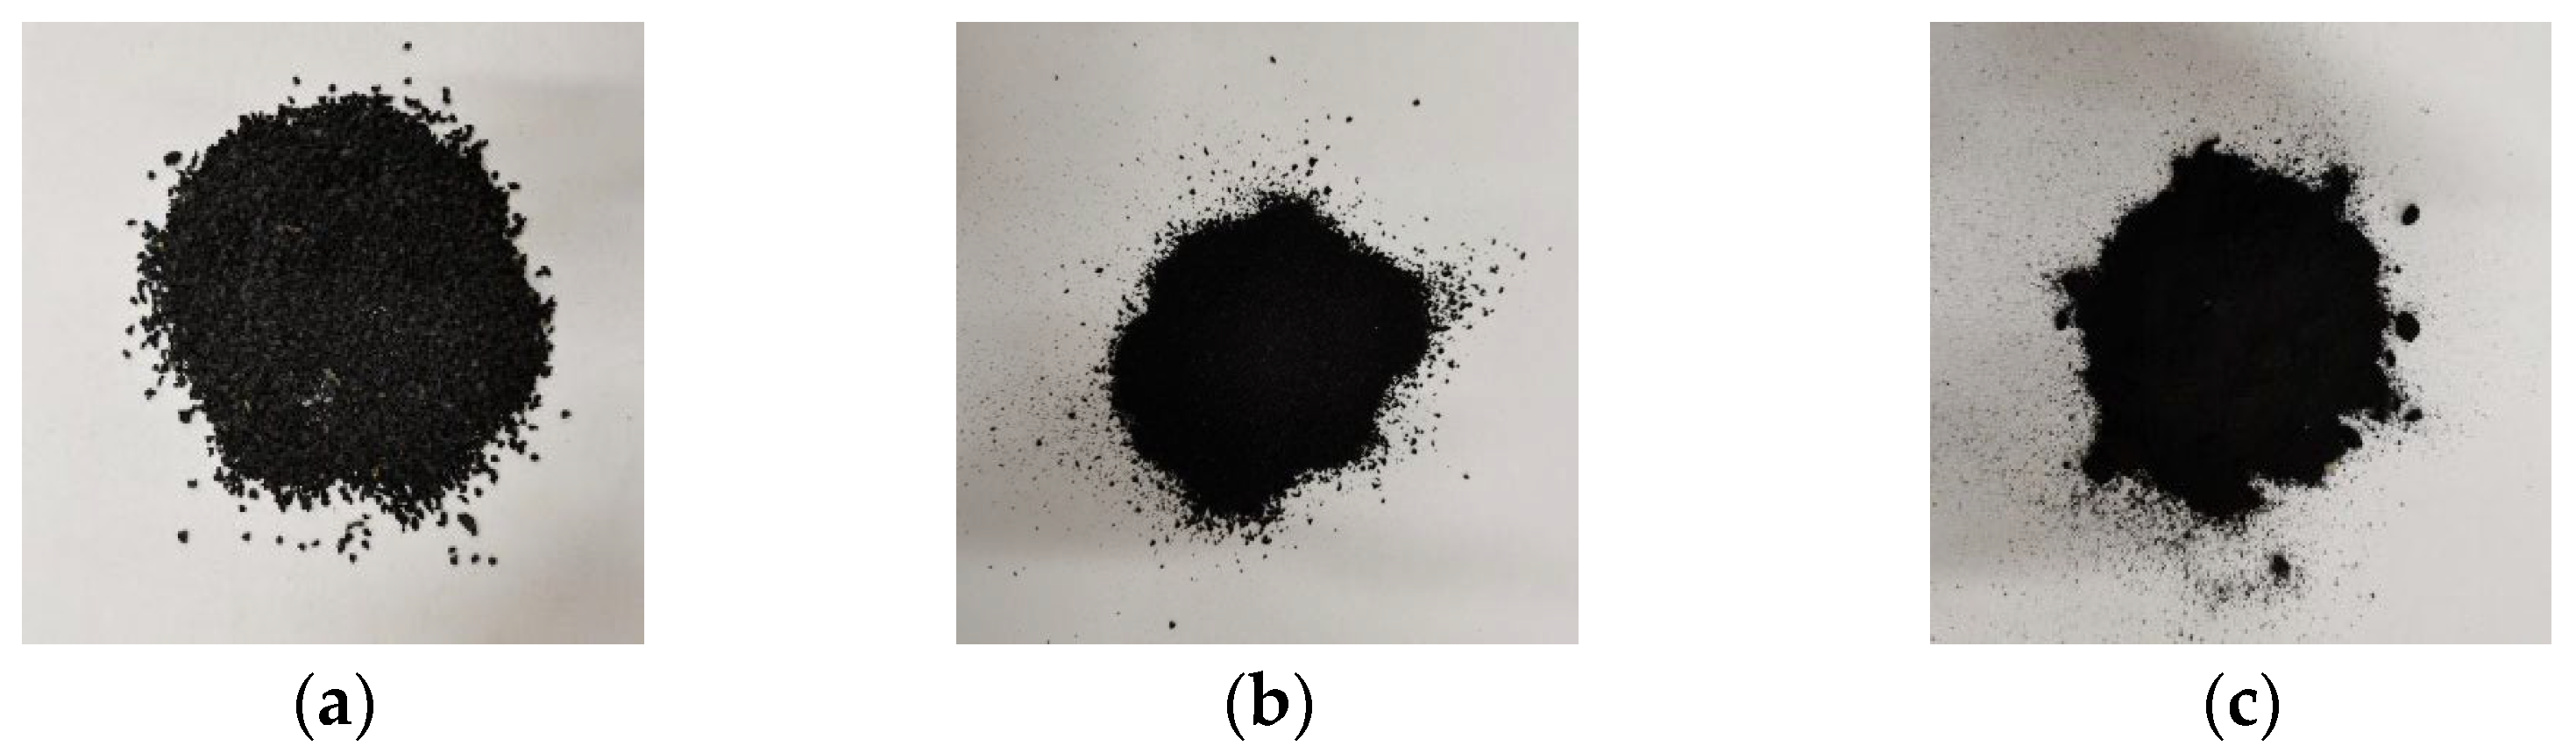
2.1. Raw Materials

The cement used in the test was produced by Bagongshan Cement Factory of Huainan City, China, which was P-O 42.5-grade ordinary silicate cement. The sand used in the test was natural river sand with a fineness modulus of 2.80, apparent density of 2520 kg/m3, and bulk density of 1640 kg/m3. The gravel was natural crushed stone with a particle set of 5–16 mm, apparent density of 2625 kg/m3, and bulk density of 1665 kg/m3. The water was ordinary tap water, and the water-reducing agent was HPWR-type high-performance water-reducing agent with a density of 1.1 g/cm3 and a water-reducing rate of 37%. The rubber was 10-mesh, 20-mesh, 30-mesh rubber produced by Dujiangyan Huayi Rubber Co., Ltd. (Dujiangyan, China), with an apparent density of 750 kg/m3. Pictures of the rubber used are shown in Figure 1.

2.2. Mixing Ratio Design

This test is mainly based on the concrete design regulations for the proportion design, using a C40 concrete proportion. After calculating the dosages of coarse aggregate, fine aggregate, cement, water, etc., 20% of the fine aggregate with an equal mass to the C40 concrete was mixed with 10-mesh, 20-mesh, 30-mesh rubber with different particle sizes. The group without mixed rubber was marked as A, the group with 20% of 10-mesh rubber was marked as B, the group with 20% of 20-mesh rubber was marked as C, and the group with 20% of 30-mesh rubber was marked as D. Because rubber is a hydrophobic material, in principle, there is no need to change the amount of water and water reducer. The detailed ratio is shown in Table 1.

2.3. Specimen Preparation and Test Equipment

In accordance with GB/T 50080-2016 “Standard Test Methods for Properties of Ordinary Concrete Mixes” [41] and GB/T 50081-2019 “Standard Test Methods for Physical and Mechanical Properties of Concrete” [42] specifications, specimens were made into a 100 mm × 100 mm × 100 mm standard cube. A layer of cling film was smeared on the top for treatment, and after 24 h of demolding and marking the specimen, it was placed in the saturated Ca(OH)2 solution curing pool for maintenance. The process is shown in Figure 2.
The freeze–thaw cycle used the method of fast freezing. The method is as follows: The concrete specimens were produced and put in the saturated Ca(OH)2 solution curing pool for curing for 24 d, then immersed in (20 ± 2) °C water for 4 d. The water needs to be diffused over the top of the specimen. After the specimen was cured for 24 d in the saturated Ca(OH)2 solution and then for 4 d in the water, that is, when the specimen was cured for up to 28 d, the freezing and thawing cycle test could begin to be carried out. Each freeze–thaw cycle time was 4 h, with rapid freezing for 2.5 h and then removal for rapid melting for 1.5 h. The temperature of the cryogenic freezing equipment (Changchun, China) was set to −20 °C. The specimen containing saturated water in the cryogenic freezing equipment was taken for freezing, and thawing was performed in the water. A constant temperature heating rod was added to the water to accelerate the specimen’s thawing speed. Every 25 freeze–thaw cycles were considered a round. In each cycle, 3 compressive specimens and 3 anti-splitting specimens were taken from each group (as Table 2). After each cycle of freezing and thawing, the surface of the specimen was washed with water to remove the flotsam and for 5 freeze–thaw cycle specimens, the surface of the water was dried to measure the mass and the modulus of elasticity of its dynamic.
All specimens could be dried naturally in the laboratory at the end of freeze–thaw cycle to carry out the next physical test and static mechanical test. The static loading mode was displacement loading, the compressive loading rate was 3 mm/min, and the tensile loading rate was 1 mm/min. The number of specimens after the freeze–thaw cycles is shown in Table 2.

3. Test Results and Analysis

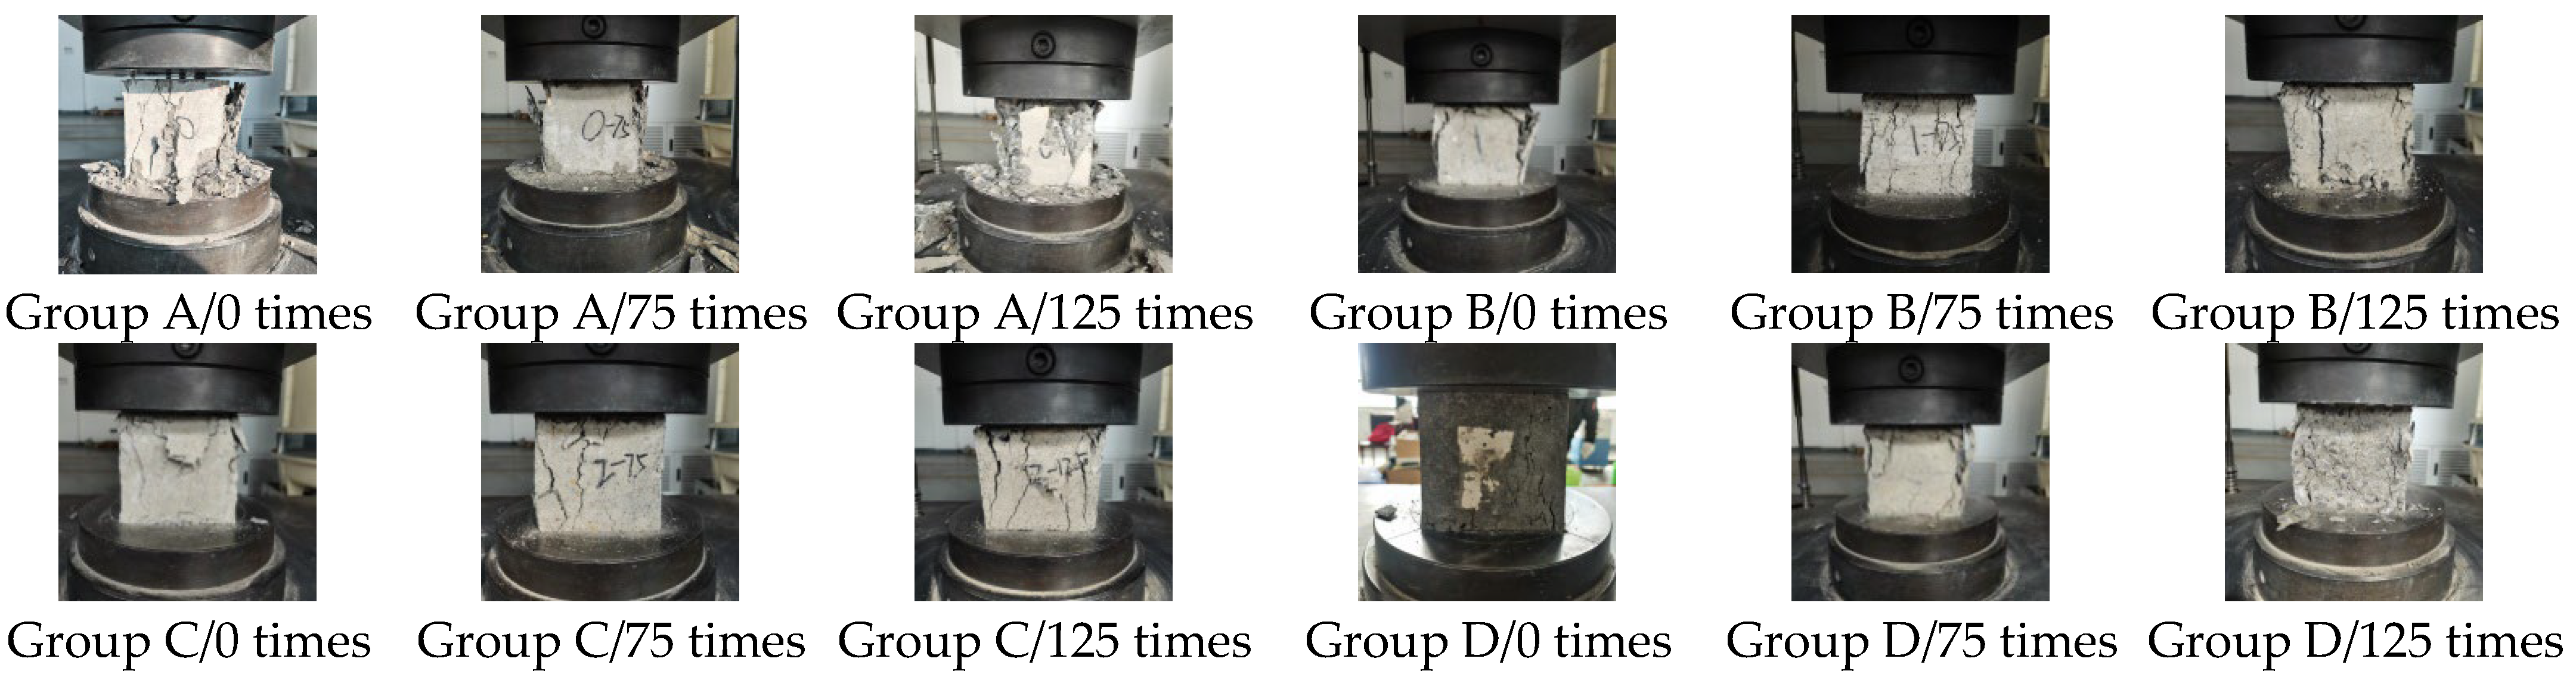
3.1. Apparent Changes in Specimens After Freeze–Thaw Cycles

With the increase in the number of freeze–thaw cycles, the specimen surface becomes rough. There is fine sand, rubber, and cement paste coming off the surface, and the specimen surface appears to have more small holes. As the fine sand and cement paste come off the surface, more rubber is exposed. The overall volume does not have a large change, and the surface damage phenomenon of the specimen is not obvious. The morphology diagram is shown in Figure 3.

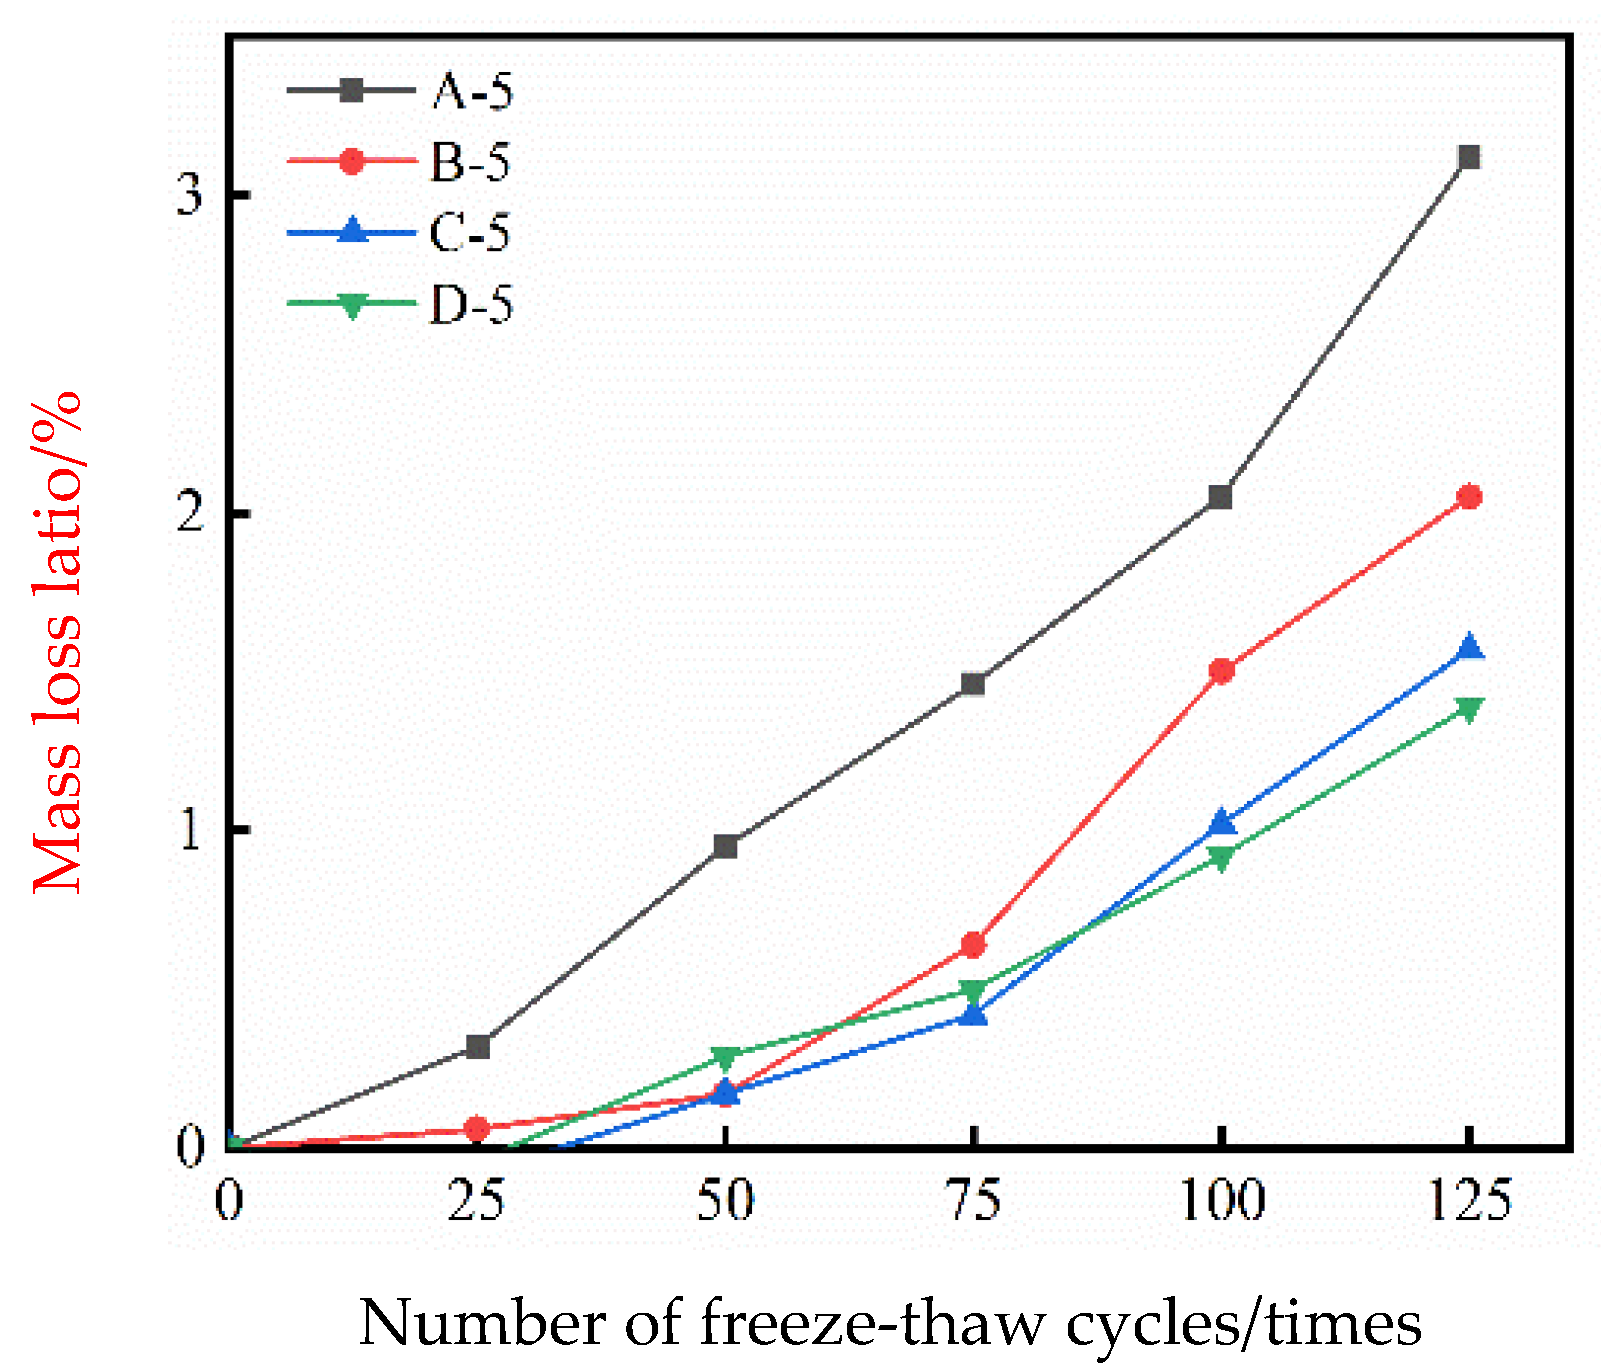
3.2. Rate of Mass Loss After Freeze–Thaw Cycles

The mass loss rate was calculated for specimens with different numbers of freeze-thaw cycles. The formula for the mass loss rate is as follows:
η = m 0 m 1 m 0 × 100 %
where η is the mass loss rate after the freeze–thaw cycle, %; m0 is the specimen mass before the freeze–thaw cycle, g; and m1 is the specimen mass after the freeze–thaw cycle, g.
The mass loss rate of specimens under different times of freeze–thaw cycles is shown in Figure 4. It increases with the increase in the number of freeze–thaw cycles. However, the mass loss rate of groups C-5 and D-5 is negative after 25 freeze–thaw cycles. This is because after 25 freeze–thaw cycles, both the surface and the interior of the specimen produce small cracks, which allows more water to enter the specimen. When the amount of water entering the specimen is greater than the amount of sand and cement paste shed on the surface of the specimen at the initial stage, the overall mass of the specimen increases, and the mass loss rate shows a negative value. The mass loss rate of group A-5 is significantly higher than that of the other three groups at all times, indicating that adding rubber to concrete effectively enhances the frost resistance of concrete. Comparing groups B-5, C-5, and D-5, it can be seen that the D-5 group has the best freezing resistance, followed by the C-5 group, and the B-5 group has the worst freezing resistance. Therefore, when the rubber mixing amount is the same, the smaller the rubber particle size, the more obvious the improvement in the freezing resistance of concrete. Also, the mass loss rate of all four groups after 125 freeze–thaw cycles is less than 5%. Thus, from the freeze–thaw cycle test phenomenon and the mass loss rate, it can be seen that the freeze–thaw cycle has a small impact on the surface damage of the specimen and mainly causes internal damage to the concrete.

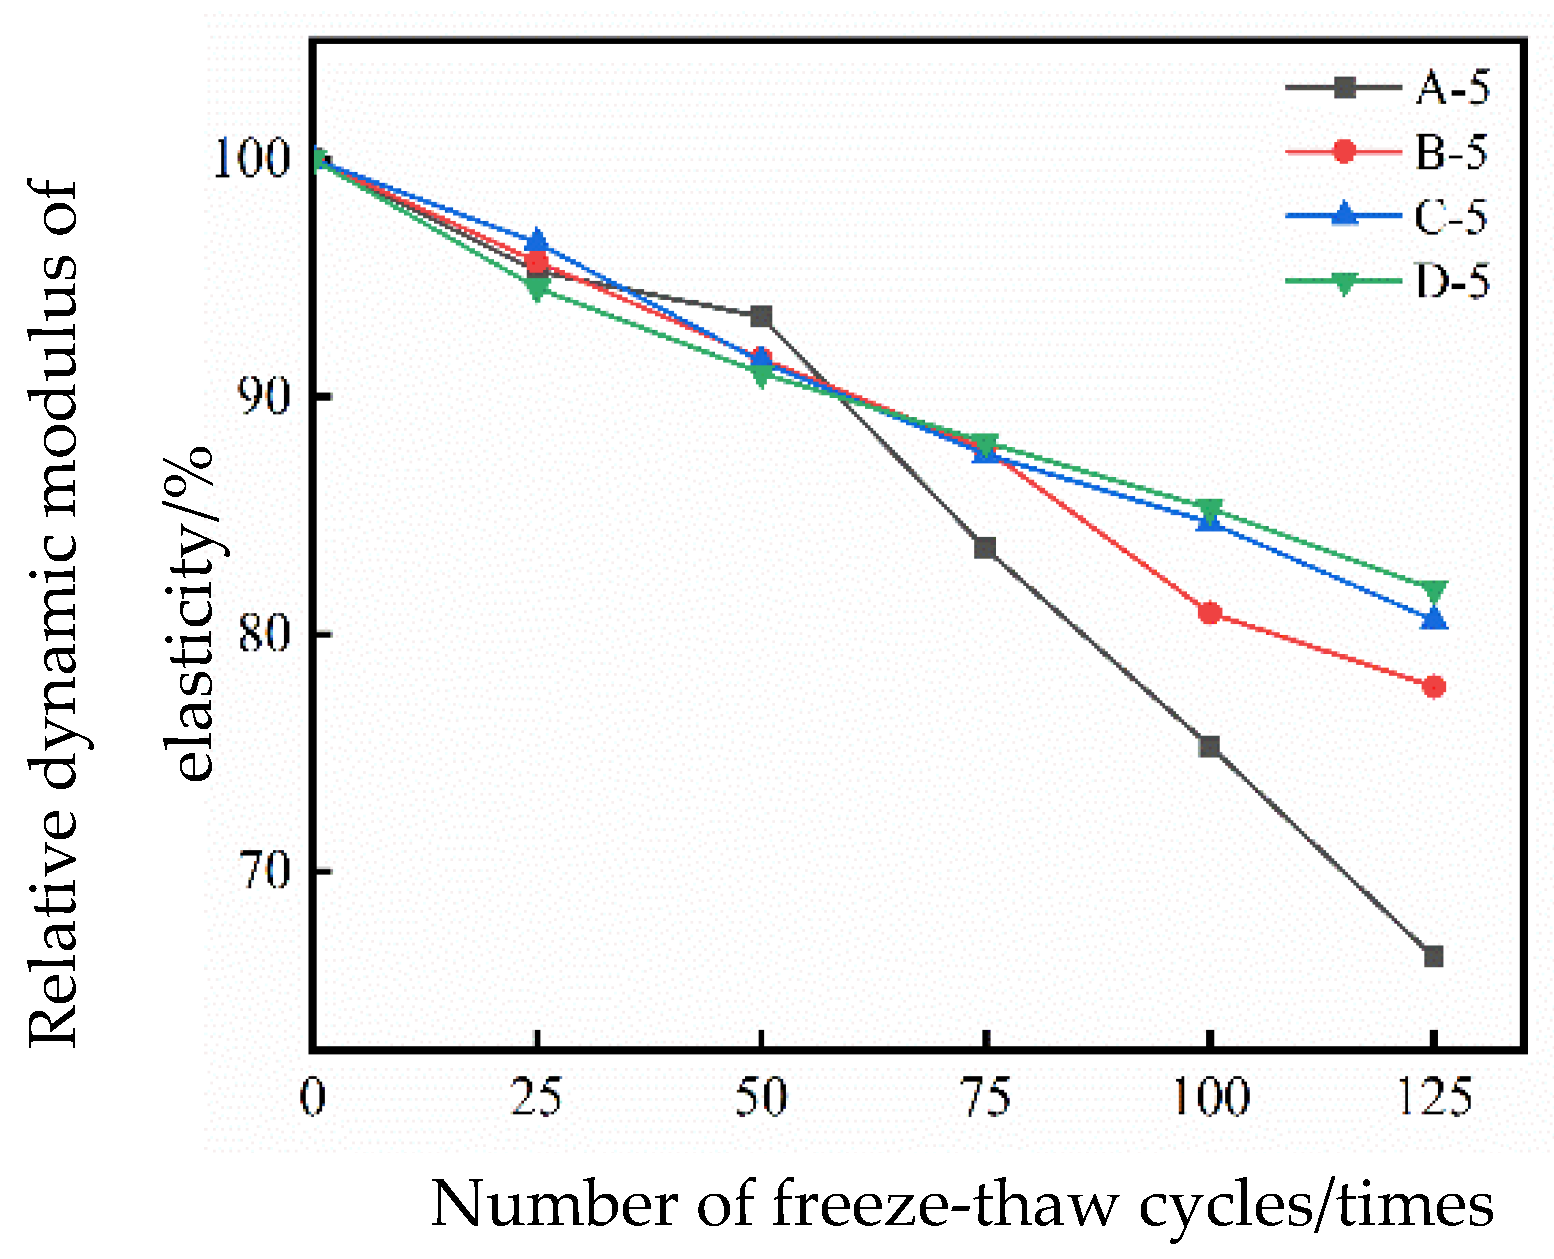
3.3. Relative Dynamic Modulus of Elasticity After Freeze–Thaw Cycles

The relative dynamic elastic modulus of the specimens was calculated by carrying out acoustic tests using a wave velocity meter to determine the relative dynamic elastic modulus of the specimens after different freezing and thawing cycles. The formula is as follows:
p i = f i 2 f 0 2 × 100 %
where Pi is the relative dynamic elastic modulus of the specimen after n freeze–thaw cycles, %; f1 is the transverse fundamental frequency of the specimen after n freeze–thaw cycles, Hz; and f0 is the transverse fundamental frequency of the specimen before the freeze–thaw cycles, Hz.
The relative dynamic elastic modulus of the specimen under different freeze–thaw cycles is shown in Figure 5. With the increase in the number of freeze–thaw cycles, the relative dynamic elastic modulus of the specimen decreases. This is because the small cracks in the specimen’s interior and surface continue to increase and connect throughout the process of the freezing and thawing cycles. The small cracks become larger, the specimen’s interior and surface show a brittle phenomenon, and the specimen breaks, causing the relative dynamic elastic modulus of the specimen to continuously decrease. It can be clearly seen from the figure that the relative dynamic elastic modulus of groups B-5, C-5, and D-5 is significantly smaller than that of group A-5, which proves that the addition of rubber can significantly improve the frost resistance of concrete. The relative dynamic modulus of elasticity of groups C-5 and D-5 is not much different but is slightly better than that of the B-5 group. Therefore, the frost resistance of concrete can be better improved when the rubber particles are smaller.

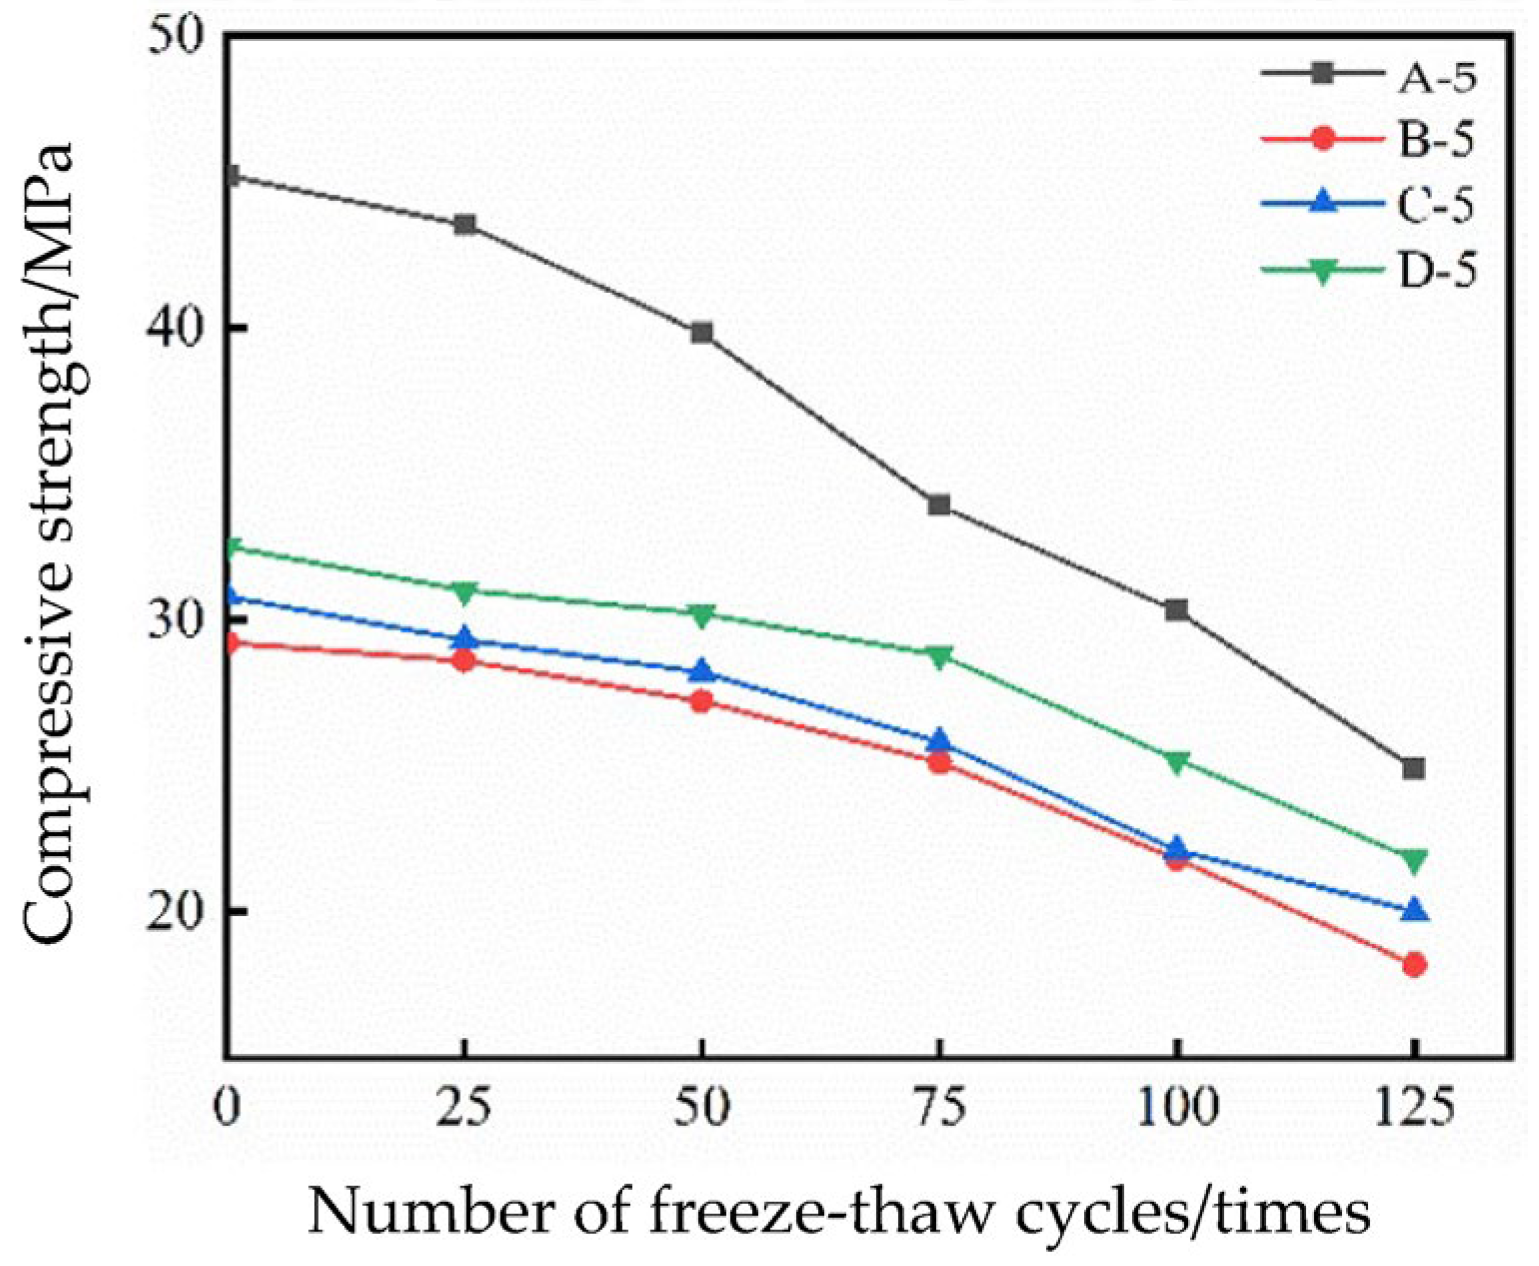
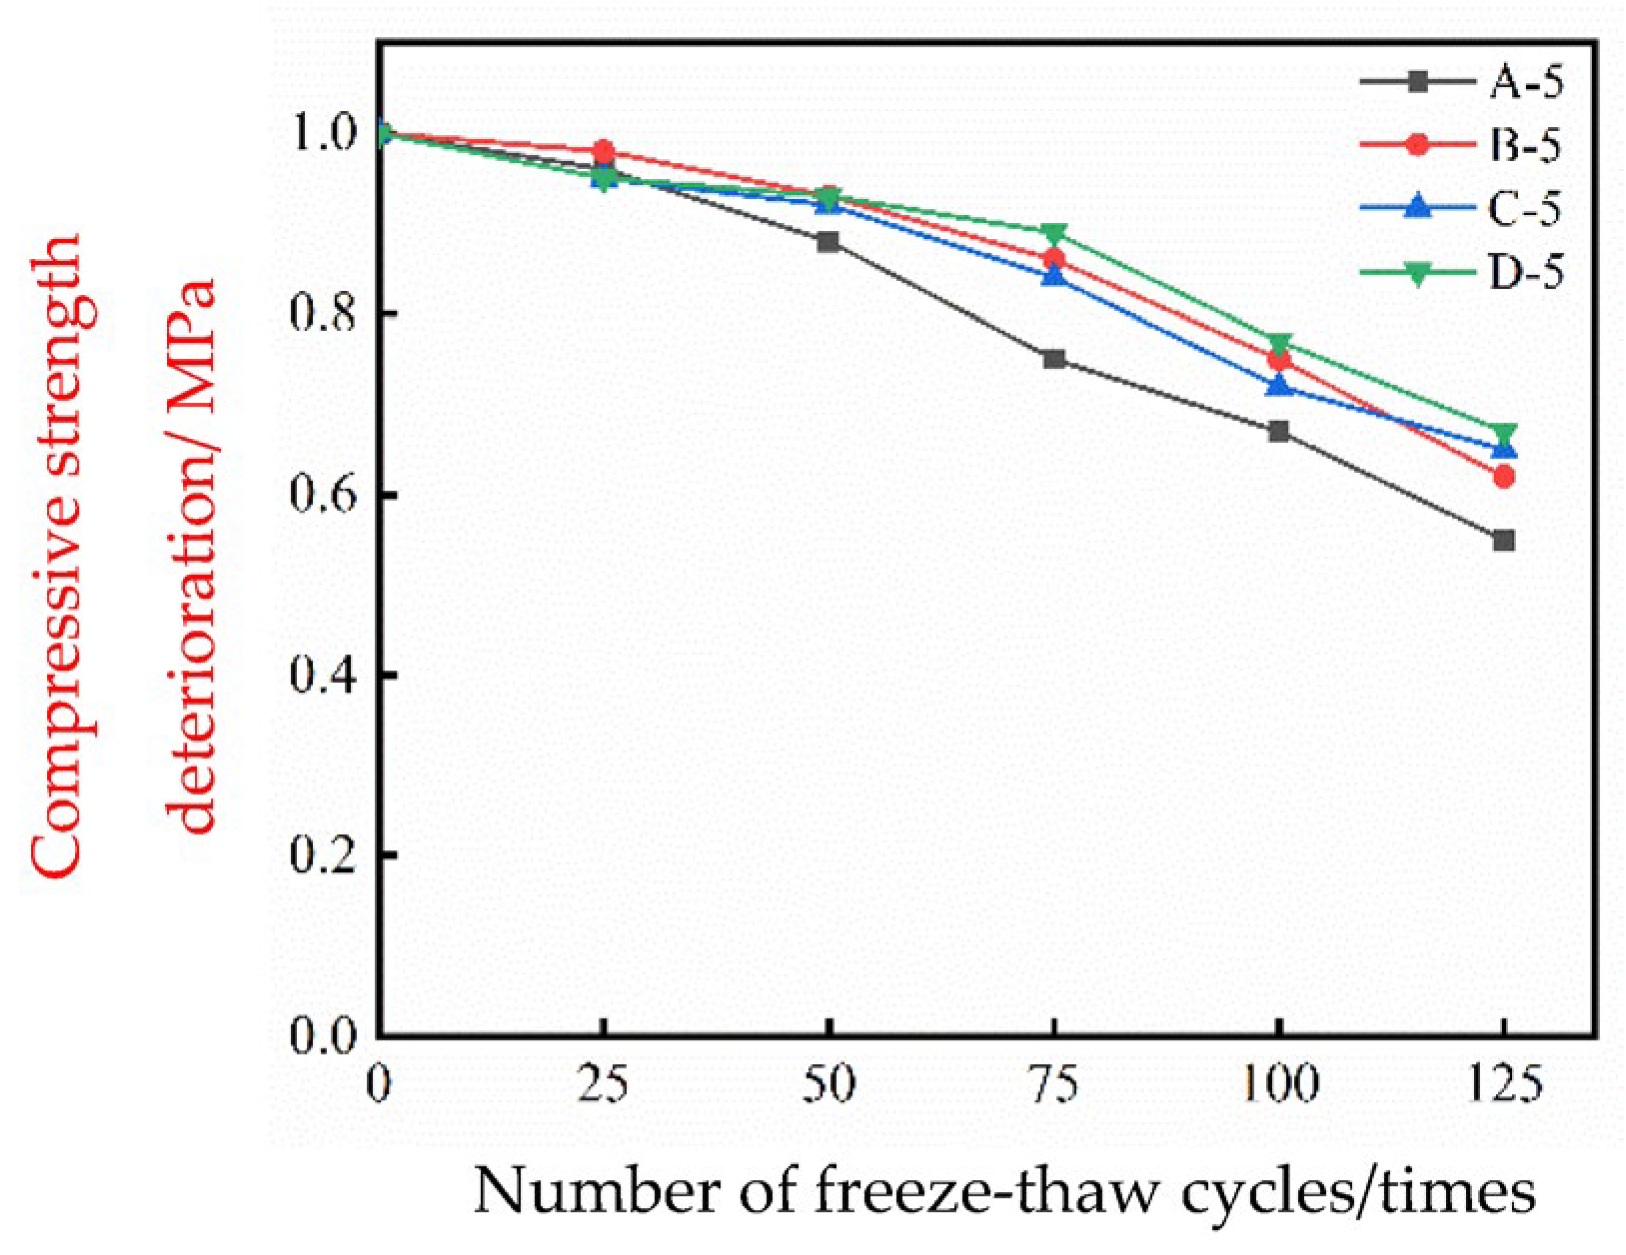
3.4. Changes in Compressive Strength After Freeze–Thaw Cycles

The change in compressive strength of the specimen after different numbers of freeze–thaw cycles is shown in Figure 6. With the increase in the number of freeze–thaw cycles, the uniaxial compressive strength of the specimen gradually decreases. This is mainly due to the following reasons. On the one hand, the hardness of rubber is significantly smaller than that of concrete material. The addition of rubber replaces part of the concrete material, reducing the strength of the concrete. As an elastic material, rubber has a small support force, which affects the compressive strength of the concrete. On the other hand, as an organic material, the bond between rubber and concrete is poor, and the addition of rubber introduces more pores. All these reasons cause an increase in the internal voids of the concrete. When loading, it is more likely to occur in the gap, reducing the strength of the concrete. At the same time, the density of rubber is relatively small, and it is easy for it to float in the concrete specimen, resulting in an uneven distribution in the concrete specimen [43]. When a large amount of rubber is distributed in a certain place, stress concentration occurs, making the concrete structure unstable and more likely to be damaged. At the same time, as seen in the figure, among the three rubber particle sizes, 30-mesh rubber has the smallest impact on the reduction in concrete strength. After different numbers of freezing and thawing cycles, the trend of declining strength of the concrete group with rubber added is significantly smaller than that of ordinary concrete.
In order to better obtain the change trend of specimen strength with the increase in freeze–thaw cycles, the strength deterioration value is introduced, and the strength deterioration value is calculated as shown below:
k = F F 0 × 100 %
where k is the enhanced deterioration value; F is the strength value of the specimen after a certain number of freeze–thaw cycles, MPa; and F0 is the strength value of the specimen after a certain number of freeze–thaw cycles, MPa.
The compressive strength deterioration value curve is shown in Figure 7. In the first 50 freeze–thaw cycles, the compressive strength decline is relatively gentle. After 50 freeze–thaw cycles, the decline in compressive strength begins to become obvious. Compared with ordinary concrete, rubber concrete shows less decline in strength. After 100 freeze–thaw cycles, the relative value of ordinary concrete compressive strength is lower than 70%. After 125 freeze–thaw cycles, the relative value of rubber concrete compressive strength is lower than 70%, while the relative value of ordinary concrete compressive strength is 0.55. This indicates that the addition of rubber makes the compressive strength degradation value of concrete in the process of freezing and thawing cycles decrease.
In order to better understand the influence of different rubber particle sizes on concrete specimens, research was carried out on specimens after uniaxial compressive damage after different freeze–thaw cycles.
Figure 8 shows the damage diagram of the specimens after different numbers of freeze–thaw cycles. With the increase in the number of freeze–thaw cycles, the damage phenomenon of the specimen is more intense, the cracks and the degree of specimen crushing become more obvious, and the amount of specimen surface concrete spalling increases. When comparing the different groups during the test, it was found that ordinary concrete is more intact after crushing compared with rubberized concrete, and the sound of shattering is relatively quieter during specimen destruction, but more cracks are produced during compression.

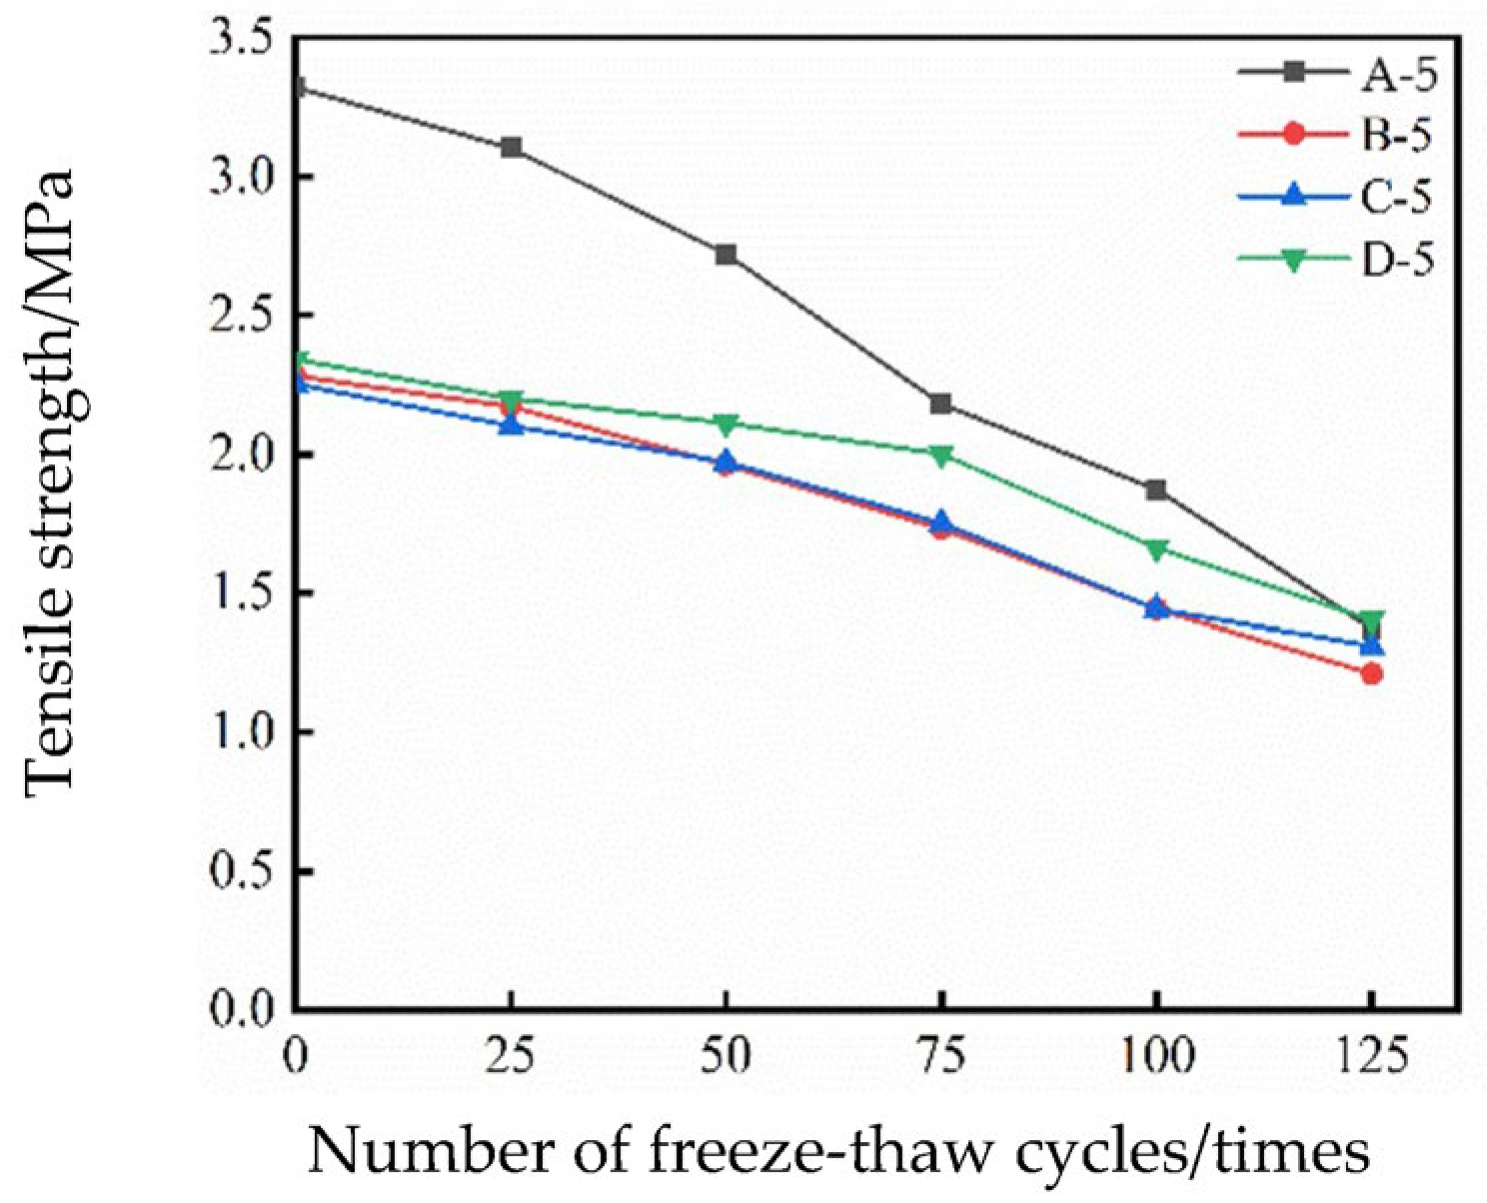
3.5. Changes in Tensile Strength After Freeze–Thaw Cycles

The tensile strength of specimens after different numbers of freeze–thaw cycles is shown in Figure 9. Within the first 75 freeze–thaw cycles, the splitting tensile strength of ordinary concrete decreases significantly faster than that of rubber concrete, and the decrease of rubber concrete is relatively slow. After 75 freeze–thaw cycles, the splitting tensile strength of ordinary concrete continues to decrease, and the rate of decrease in rubberized concrete is accelerated compared with that during the first 75 freeze–thaw cycles. Overall, it seems that the addition of rubber substantially reduces the splitting tensile strength of concrete. However, during the freeze–thaw cycle, the addition of rubber slows down the reduction in splitting tensile strength and improves the frost resistance of concrete. The reason why the addition of rubber can reduce the rate of decrease in the split tensile strength of concrete after freezing and thawing is that, on the one hand, as an elastic material, when the concrete specimen is subjected to force, rubber can slow down the degree of force of the concrete. On the other hand, the addition of rubber can introduce more bubbles into the concrete, increasing the antifreeze property of the concrete and reducing the internal damage of the concrete after freezing and thawing, thus slowing down the decrease in split tensile strength.
The curve of the tensile strength deterioration value is shown in Figure 10. With the increasing number of freeze–thaw cycles, the splitting tensile strength of ordinary concrete decreases by the largest proportion. After 50 freeze–thaw cycles, the splitting tensile strength of ordinary concrete in group A drops to 82%, while that of the concrete with rubber is above 85%, and the splitting tensile strength of group B with 10-mesh rubber decreases by the least, by 10%. After 75 freeze–thaw cycles, the splitting tensile strength of group A of ordinary concrete decreases to 66%, while that of the concrete with rubber is above 75%, and the splitting tensile strength of group B with 10-mesh rubber decreases by the least, by 15%. After 100 freeze–thaw cycles, the splitting tensile strength of group A of ordinary concrete drops to 53%, while that of the concrete with rubber is above 63%, and the splitting tensile strength of group D with 30-mesh rubber decreases by the least, by 29%. After 125 freeze–thaw cycles, the splitting tensile strength of group A of ordinary concrete is less than half of the initial value, while that of the rubberized concrete is above 53%, and the splitting tensile strength of group D with 30-mesh rubber decreases by the least, by 40%. Overall, the splitting tensile strength of ordinary concrete in group A is rapidly reduced. For the rubber added to groups B, C, and D, the decline rate in the first period is smooth, and the decline rate in the later period is accelerated compared with that in the first period, among which group D has the slowest decline. This shows that the addition of rubber can slow down the reduction in the splitting tensile strength of concrete, and the best performance of the experimental group in the test group is that of the 30-mesh rubber group.
Figure 11 shows the damage diagram of tensile specimens after different numbers of freeze–thaw cycles. With the increasing number of freeze–thaw cycles, the loading time of specimens before damage gradually becomes shorter, but the change in specimen damage morphology is not obvious. Compared with ordinary concrete, the cracks after damage to rubber-mixed concrete are more complete and clear.

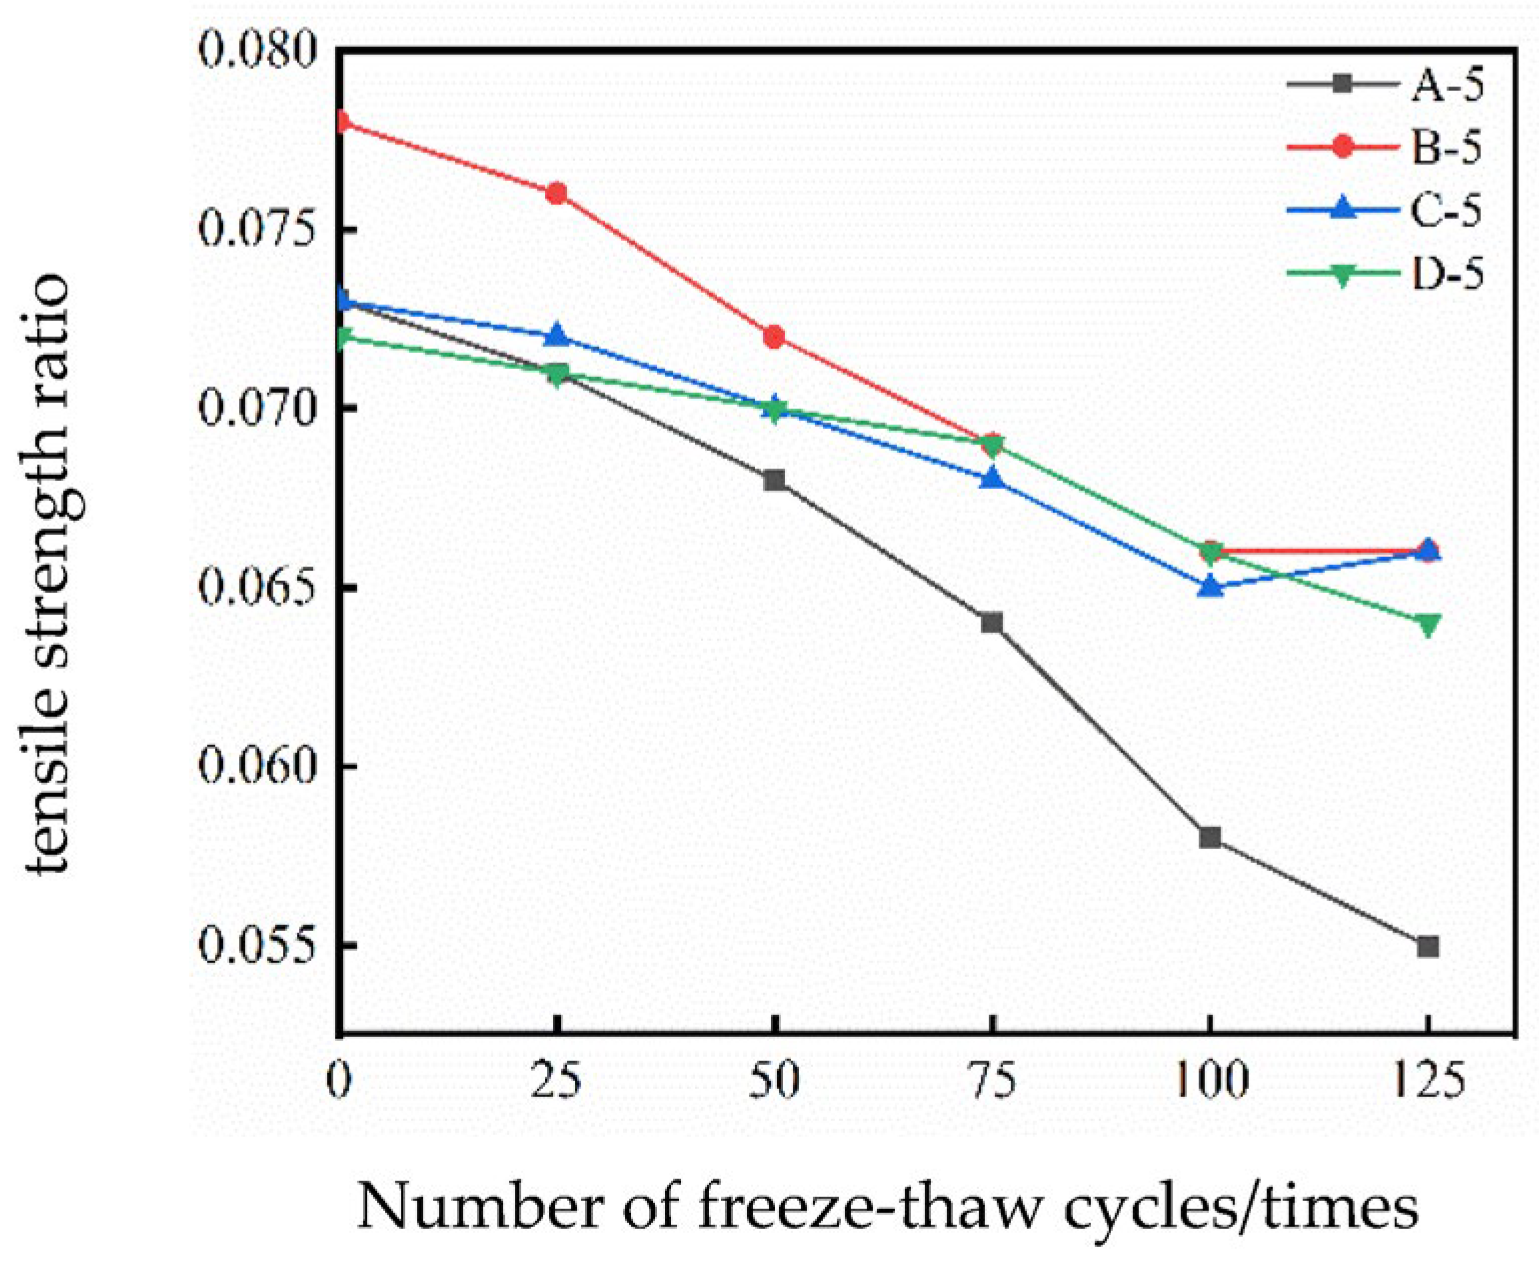
3.6. Tensile Compression Ratio of Rubberized Concrete After Freeze–Thaw Cycles

The tensile compression ratio of concrete is the ratio of splitting tensile strength to compressive strength of concrete, which is an important index to measure the brittleness of concrete. When the tensile compression ratio is larger, the brittleness of concrete specimens is smaller and the toughness is higher. The tensile and compressive ratios of four groups of concrete specimens after different numbers of freeze–thaw cycles are shown in Figure 12.
Before the freeze–thaw cycle, Group B has the largest tensile ratio, of 0.078, and the concrete with 10-mesh rubber added has the smallest brittleness and the highest toughness. With the freezing and thawing cycle, the tensile ratio of ordinary concrete in group A decreases the fastest and the brittleness of the specimen increases, while the three groups of B, C, and D with rubber added have a slower decrease in tensile ratio and less brittleness of the specimen. The performance of group B is better than that of groups C and D. The addition of 10-mesh rubber reduces the initial brittleness of the concrete, and with the increase in the number of freezing and thawing cycles, the decrease in the tensile ratio decreases and the increase in brittleness slows down. However, in general, the initial tensile compression ratio of the rubber-mixed B, C, and D groups is between 0.072 and 0.078, and the tensile compression ratio decreases to about 0.065 after 125 freezing and thawing cycles. It can be seen that the change in rubber particle size in concrete does not have a great effect on the brittleness and toughness of concrete, but rubber mixing can significantly improve the degree of reduction in concrete tensile ratio after freeze–thaw cycles, which improves the working performance of concrete.

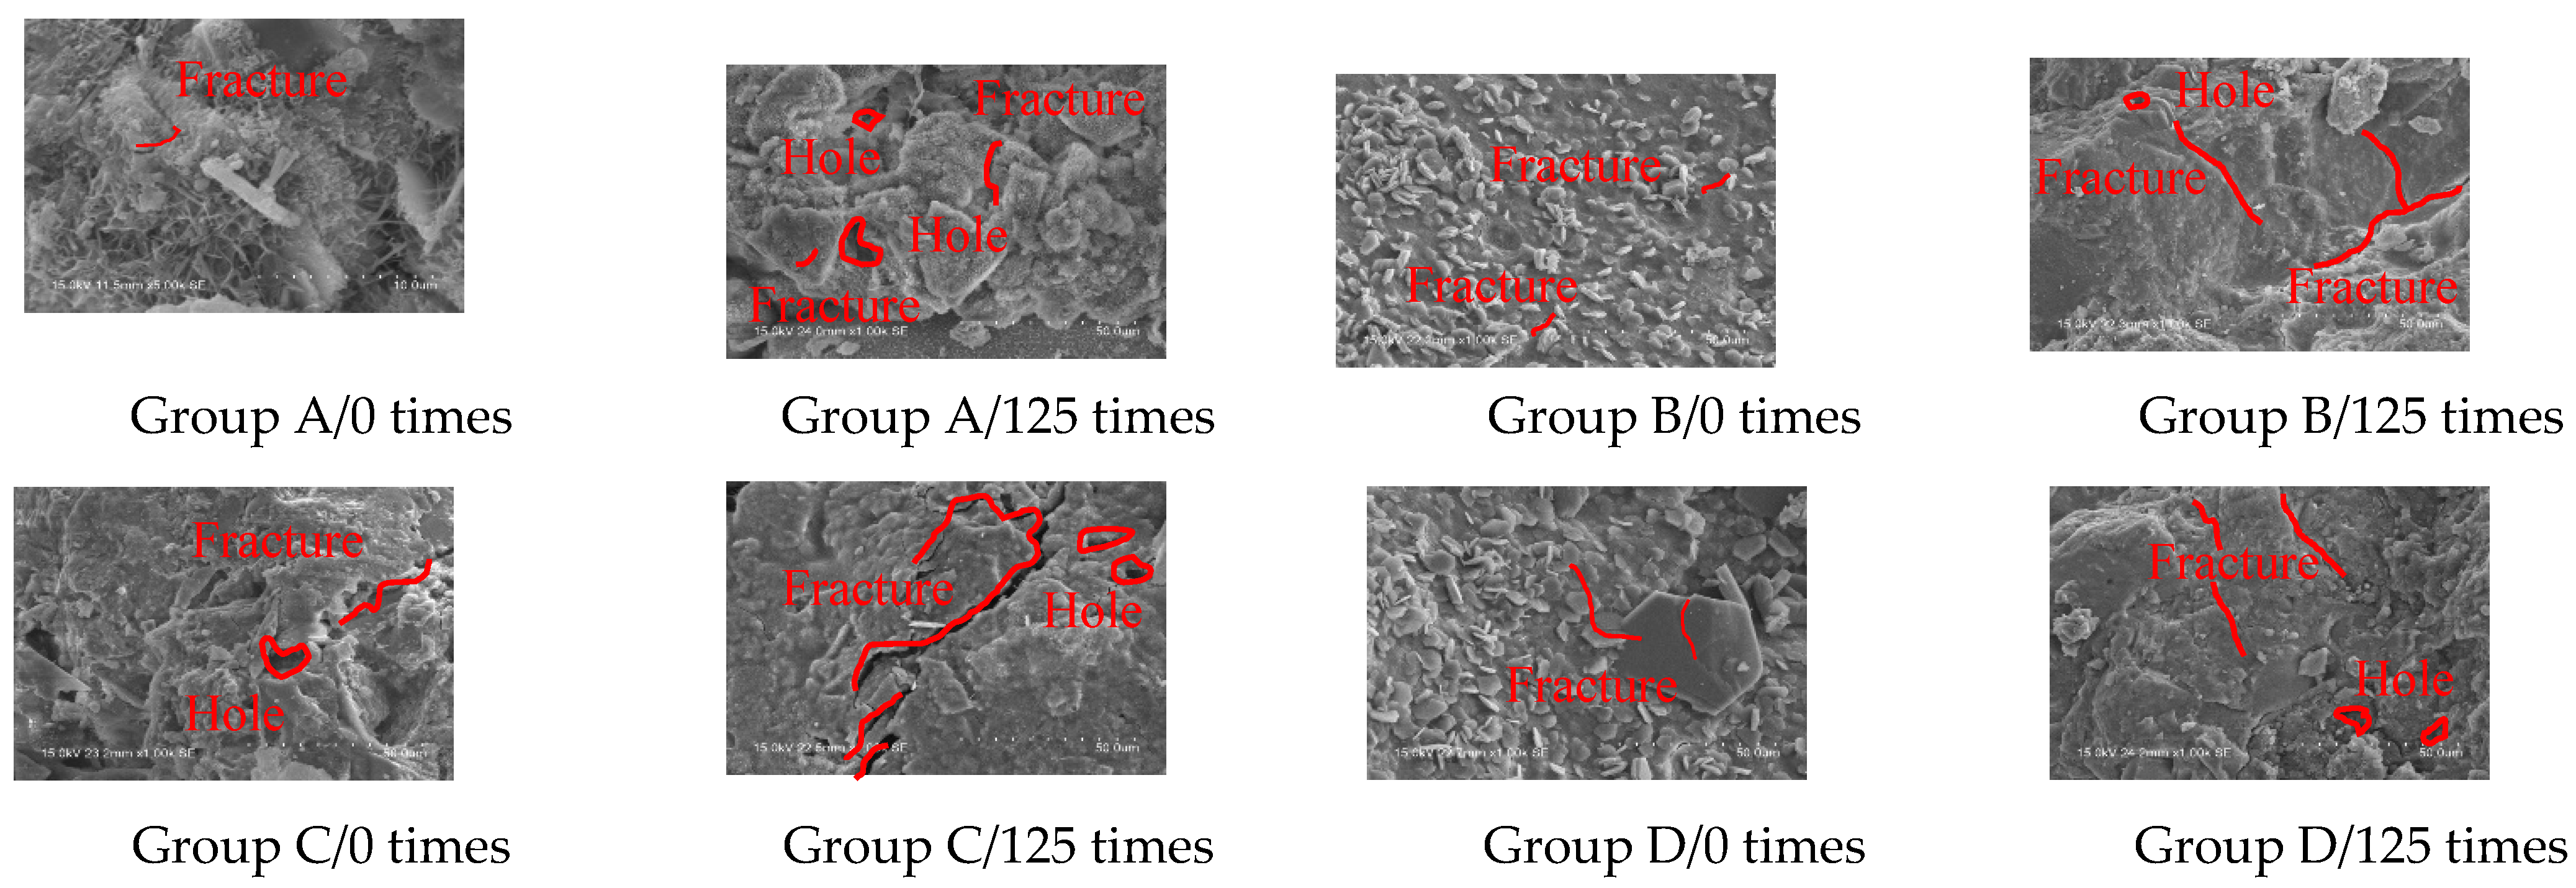
3.7. Microstructural Characteristics of Rubberized Concrete After Freeze–Thaw Cycles

Figure 13 shows the microstructure after different numbers of freezing and thawing cycles. From the figure, it can be seen that the internal structure of ordinary concrete (group A) is relatively simple. There are tiny cracks before the freezing and thawing cycles, but the overall densification is better. After 125 freezing and thawing cycles, the specimen has more internal cracks and more holes, and densification deteriorates. This shows that the concrete is damaged internally after freeze–thaw cycles, the number of cracks and holes increases, and the concrete becomes loose. This is due to the damage caused by the expansion of internal water icing after the specimen is frozen, and the continuous freeze–thaw cycle intensifies the internal damage, resulting in more and larger cracks and a looser texture.
Figure 13 also shows the microanalysis diagrams of rubber concrete with a 20% admixture of 10 mesh (group B), 20 mesh (group C) and 30 mesh (group D) before freeze–thaw and after 125 freeze–thaw cycles, respectively. It can be seen from the micrographs that the rubber is mainly in the form of flaky and irregular distribution, and it does not participate in the hydration reaction in the concrete without the generation of new substances. Before freeze–thaw cycles, there are more cracks and holes inside the specimen. This is due, on the one hand, to there being less formation of C-S-H gel hydration product between rubber and cement, resulting in weak joints and easy to produce pores, and on the other hand, to the rubber mixing introducing more gas and playing the role of air-entraining agent [44,45]. After 125 freezing and thawing cycles, the internal cracks of the specimen increase significantly, but the increase in internal pores relative to ordinary concrete is less, and the change in compactness is relatively small, which indicates that the addition of rubber can improve the frost resistance performance of concrete to a certain extent, thus reducing the damage caused by the expansion of the internal water icing of the specimen.
The specimens were damaged to different degrees after freezing and thawing, and the higher the number of freezing and thawing cycles, the more internally damaged the specimens were. Compared with ordinary concrete, rubber concrete after the same number of freezing and thawing cycles has less internal damage, indicating that the mixing of rubber can improve the frost resistance of concrete.

4. Discussion and Conclusions

In this paper, the law of influence of rubber particles on the freezing characteristics of concrete is systematically investigated, and based on the test results, the following conclusions can be drawn:
  • Ordinary concrete and rubber concrete specimens after being subjected to different freeze–thaw cycles demonstrate different degrees of spalling. From the rate of mass loss and the relative dynamic elastic modulus of two aspects of the phenomena and the results of the concrete specimens after freeze–thaw cycle analysis, it is concluded that the mixing of 10-mesh, 20-mesh, 30-mesh rubber, and 30 mesh rubber has the most obvious improvement on the concrete frost resistance.
  • Based on the compressive test and split tensile test results of the ordinary concrete and rubber concrete (mixed with 20% 10-mesh, 20-mesh, and 30-mesh rubber) after 0, 25, 50, 75, 100, and 125 ties freeze-thaw cycles, the rubber admixture leads to a reduction in concrete strength, and the smaller the rubber particle size, the smaller the impact on the concrete strength. The rubber admixture improves the frost resistance of concrete. With an increase in the number of freeze–thaw cycles, the strength reduction rate of the rubber admixture of concrete is smaller. Taken together, this indicates that 30-mesh rubber has better frost resistance and has the least effect on concrete strength.
  • Through the tensile ratio, it can be seen that in the process of freezing and thawing cycles, the increase in the rubber concrete tensile ratio decreases to a smaller extent, indicating that rubber mixing makes the concrete show better toughness and have better working performance, but a change in the particle size of the rubber does not have an obvious effect on the concrete toughness.
  • The SEM microanalysis shows that the rubber admixture reduces the development of internal pores during freezing–thawing of concrete, and at the same time acts as an air-entraining agent, which improves the frost resistance of concrete.
  • The test proved that rubber mixed into concrete has certain advantages in frost resistance, and at the same time solved the problem of secondary utilization of rubber to a certain extent.

Author Contributions

X.-W.H. wrote the manuscript and edited the manuscript; J.-S.Z. designed the research methods; Y.-S.B. edited and revised the manuscript. All authors have read and agreed to the published version of the manuscript.

Funding

Supported by the Open Research Fund of Anhui Province Key Laboratory of Green Building and Assembly Construction, Anhui Institute of Building Research & Design, Grant No. 2022-JKYL-007; funded by the Natural Science Research Project of Higher Education Institutions in Anhui Province (2023AH051219); funded by the Open Research Fund of the State Key Laboratory for Fine Exploration and Intelligent Development of Coal Resources, CUMT, (SKLCRSM23KF007); supported by the Key Laboratory of Mine Construction Engineering in Anhui Province, project number: GXZDSYS2022102; and supported by the Anhui University of Science and Technology Young Teachers Scientific Research Fund Project, project number: QNYB2021-08.

Data Availability Statement

The original contributions presented in this study are included in the article. Further inquiries can be directed to the corresponding authors.

Acknowledgments

The authors would like to thank the editor-in-chief, editor, and anonymous reviewers for their valuable reviews.

Conflicts of Interest

The authors declare no conflict of interest.

References

  1. He, Y.; Zhang, J.; Jiang, Z.; Zhou, B.; Zheng, Z.; Wang, Y.; Lu, Q.; Huang, W. Evaluation of the freeze-thaw resistance of concrete incorporating waste rubber and waste glass. Compos. Commun. 2024, 50, 102020. [Google Scholar] [CrossRef]
  2. China Scrap Rubber Recycling Industry Market Development Monitoring and Investment Strategy Consulting Report [2024–2030 M]; Huajing Industry Research Institute: Xuchang, China, 2024.
  3. Zhao, S.; Liu, M.; Meng, X.; Liu, A.; Duo, L. Waste rubber–Black pollution reframed as a global issue: Ecological challenges and sustainability initiatives. Environ. Pollut. 2024, 356, 124291. [Google Scholar] [CrossRef]
  4. Rhodes, E.P.; Ren, Z.; Mays, D.C. Zinc Leaching from Tire Crumb Rubber. Environ. Sci. Technol. 2012, 46, 12856–12863. [Google Scholar] [CrossRef]
  5. Gomes, F.O.; Rocha, M.R.; Alves, A.; Ratola, N. A Review of Potentially Harmful Chemicals in Crumb Rubber Used in Synthetic Football Pitches. J. Hazard. Mater. 2020, 409, 124998. [Google Scholar] [CrossRef] [PubMed]
  6. Basik, A.A.; Sanglier, J.J.; Yeo, C.T.; Sudesh, K. Microbial Degradation of Rubber: Actinobacteria. Polymers 2021, 13, 1989. [Google Scholar] [CrossRef]
  7. Chittella, H.; Yoon, L.W.; Ramarad, S.; Lai, Z.-W. Rubber waste management: A review on methods, mechanism, and prospects. Polym. Degrad. Stab. 2021, 194, 109761. [Google Scholar] [CrossRef]
  8. Bolding, B.; Bonar, S.; Divens, M. Use of Artificial Structure to Enhance Angler Benefits in Lakes, Ponds, and Reservoirs: A Literature Review. Rev. Fish. Sci. 2004, 12, 75–96. [Google Scholar] [CrossRef]
  9. Adesina, A.; Das, S. Performance of engineered cementitious composites incorporating crumb rubber as aggregate. Constr. Build. Mater. 2021, 274, 122033. [Google Scholar] [CrossRef]
  10. Chen, B.; Zhang, Y.M.; Chen, S.X.; Zhang, C.H. Preliminary study on the properties of rubberized concrete. Concrete 2004, 12, 37–39. [Google Scholar]
  11. Zhang, Y.M.; Chen, S.X.; Gao, Y.Y. Properties of rubber cement concrete under dip-bake cycle. J. Build. Mater. 2005, 6, 665–671. [Google Scholar]
  12. Hu, P.; Zhu, H.; Wang, M. Study on the permeability of rubberized aggregate concrete. J. Tianjin Polytech. Univ. 2006, 4, 8–12. [Google Scholar]
  13. Farhad, A.; Maryam, K. Properties of High-Performance Self-Compacting Rubberized Concrete Exposed to High Temperatures. J. Mater. Civ. Eng. 2019, 31, 04019040. [Google Scholar]
  14. Zhao, W.; Hang, H.; Lman, H.; Maurizio, G.; Kypros, P. Tensile stress-strain characteristics of rubberised concrete from flexural tests. Constr. Build. Mater. 2020, 236, 117591. [Google Scholar]
  15. Abrasion, R.; Flexural, T. Impact Resistance of Rubberized Concrete. Int. J. Eng. Adv. Technol. 2020, 9, 1032–1038. [Google Scholar]
  16. Li, H.Y. Research on the Properties of Rubber-Modified Cementitious Materials. Master’s Thesis, Southeast University, Nanjing, China, 2004. [Google Scholar]
  17. Xu, H.Y.; Hu, F.Q.; Qin, S.B.; Yuan, Q.; Feng, L.Y. Influence law of rubber particles on the working performance of concrete. J. Water Resour. Constr. Eng. 2016, 14, 67–85. [Google Scholar]
  18. Wang, X.C.; Yang, C.F.; Yang, M. Experimental study on the working performance of waste rubber concrete. Concrete 2013, 275, 2051–2054. [Google Scholar]
  19. Xiong, J.; Zheng, L.; Yuan, Y. Experimental study on compressive strength of waste rubber concrete. Concrete 2004, 12, 40–42. [Google Scholar]
  20. Zhang, H.; Zhang, X.L.; Le, J.Z. Experimental study on the performance of waste tire rubber modified concrete materials. J. Zhejiang Water Conserv. Hydropower Coll. 2008, 1, 39–41. [Google Scholar]
  21. Fan, L.L. Research on the Road Performance of Cement Concrete with Rubber Particles from Waste Tires. Master’s Thesis, Harbin Institute of Technology, Harbin, China, 2008. [Google Scholar]
  22. Liu, F.; Pan, D.P.; Li, L.J.; Chen, Y.Q. Fine-scale numerical analysis of stress and strength of rubberized concrete. J. Build. Mater. 2008, 2, 144–151. [Google Scholar]
  23. Yuan, Q.; Feng, L.Y.; Yuan, B.; Cao, H.L.; Shi, C.C.; Zhang, G.Z. Effects of rubber particle size and dosage on concrete properties. People’s Yellow River 2013, 35, 111–113. [Google Scholar]
  24. Yuan, Q.; Feng, L.Y.; Cao, H.L.; Shi, C.C.; Zhang, G.C. Stress-strain curve test of rubberized concrete. J. Build. Sci. Eng. 2013, 30, 96–100. [Google Scholar]
  25. Yang, C.H.; Tian, Y.; Wang, L.; Chang, S.W.; Yang, T. Effect of NaOH pretreatment on the properties of rubberized concrete. Civ. Constr. Environ. Eng. 2016, 38, 44–50. [Google Scholar]
  26. Nakhao, A.B.; Alhumoud, J.M. Properties of Concrete Containing Scrap (Recycled) Tire-Rubber. J. Eng. Appl. Sci. 2019, 15, 653–658. [Google Scholar]
  27. Murugan, R.B.; Sai, E.R.; Natarajan, C.; Chen, S.E. Flexural fatigue performance and mechanical properties of rubberized concrete. Građevinar 2017, 69, 983–990. [Google Scholar]
  28. Wang, B.M.; Liu, W. Research progress of cement concrete with waste rubber particles in foreign countries. Concrete 2010, 103, 54–56. [Google Scholar]
  29. Deng, Z.C.; Liu, X.C. Research status analysis and prospect of rubberized concrete for road use. Natl. Def. Transp. Eng. Technol. 2010, 8, 1–5. [Google Scholar]
  30. Batayneh, M.K.; Marie, I.; Asi, I. Promoting the use of crumb rubber concrete in developing countries. Waste Manag. 2007, 28, 2171–2176. [Google Scholar] [CrossRef]
  31. Paine, K.A. Research on new applications for granulated rubber in concrete. Proc. Inst. Civ. Eng. Constr. Mater. 2010, 163, 7–17. [Google Scholar] [CrossRef]
  32. Xu, Y.W. Research status and development prospect of rubberized concrete for road use. Chem. Manag. 2019, 32, 104–105. [Google Scholar]
  33. Youssf, O.; Mills, J.E.; Ellis, M.; Benn, T.; Zhuge, Y.; Ma, X.; Gravina, R.J. Practical Application of Crumb Rubber Concrete in Residential Slabs. Structures 2022, 36, 837–853. [Google Scholar] [CrossRef]
  34. Cheng, C.; Wang, X.; Wang, X. Salt-freeze resistance and life prediction of geopolymer recycled concrete mixed with rice husk ash and modified rubber particles. Constr. Build. Mater. 2024, 449, 138433. [Google Scholar] [CrossRef]
  35. Wang, H.; Xu, Y.H.; Yao, W.J. Freeze-thaw resistance and microstructure of rice husk ash rubberized concrete. J. Compos. Mater. 2023, 40, 2951–2959. [Google Scholar]
  36. Zhao, L.-N. Experimental Research on Mechanics and Frost Resistance of Rubber Recycled Concrete. Master’s Thesis, North China University of Water Resources and Hydropower, Zhengzhou, China, 2023. [Google Scholar]
  37. Wang, T.; Hong, J.X.; Mu, C.-W.; Liu, J.P. Experimental study on rubberized concrete. Concrete 2009, 1, 67–69. [Google Scholar]
  38. Xu, J.H.; Feng, X.T.; Chen, S.L. Influence of rubberized aggregates on the frost resistance of concrete. J. Northeast. Univ. 2012, 33, 895–898. [Google Scholar]
  39. Xu, J.Y.; Li, Z.Z.; Luo, X. Comparative study on frost resistance of rubberized concrete. Silic. Bull. 2014, 33, 800–805. [Google Scholar]
  40. Guo, Q.; Cui, S.C.; Bei, H. Freeze-thaw damage analysis of rubberized concrete. J. Chongqing Jiaotong Univ. 2018, 37, 40–45. [Google Scholar]
  41. GB/T 50080-2016; Standard Test Methods for Properties of Ordinary Concrete Mixes. The People’s Republic of China Standard: Beijing, China, 2016.
  42. GB/T50081-2019; Standard Test Methods for Physical and Mechanical Properties of Concrete. The People’s Republic of China Standard: Beijing, China, 2019.
  43. Liu, Y.S. Research on Mechanical Properties and Application of Rubberized Shotcrete for Roadway Under Complex Environment. Ph.D. Thesis, Anhui University of Science and Technology, Huainan, China, 2022. [Google Scholar]
  44. Gu, X.J.; Han, W.J.; Tian, X.J. Improvement of mechanical properties and condensation mechanism of calcium hydroxide on slag alkali-activated materials. J. Jiangsu Vocat. Tech. Coll. Archit. 2024, 24, 31–38. [Google Scholar]
  45. Zhang, M.; Dou, Z.; Wang, Z.P. Basic mechanical properties and microscopic properties of alkali-activated slag/fly ash desert sand concrete. Mater. Rep. 2024, 1–26. [Google Scholar]
Figure 1. Rubber particles. (a) 10 mesh (average particle size 2 mm). (b) 20 mesh (average particle size 0.85 mm). (c) 30 mesh (average particle size 0.6 mm).
Applsci 15 03060 g001
Figure 2. Flowchart of the test.
Applsci 15 03060 g002
Figure 3. Changes in specimens before and after freezing and thawing.
Applsci 15 03060 g003
Figure 4. Variation in mass loss rate with the freeze–thaw cycle.
Applsci 15 03060 g004
Figure 5. Variation in relative dynamic elastic modulus with the number of freeze–thaw cycles.
Applsci 15 03060 g005
Figure 6. Compressive strength of specimens after different numbers of freeze–thaw cycles.
Applsci 15 03060 g006
Figure 7. Deterioration value of compressive strength of specimens after different numbers of freeze–thaw cycles.
Applsci 15 03060 g007
Figure 8. Damage diagram of the compressive specimen after different number of freeze–thaw cycles.
Applsci 15 03060 g008
Figure 9. Tensile strength of specimens after different numbers of freeze–thaw cycles.
Applsci 15 03060 g009
Figure 10. Deterioration in tensile strength of specimens after different numbers of freeze–thaw cycles.
Applsci 15 03060 g010
Figure 11. Damage diagram of the tensile specimen after different numbers of freeze–thaw cycles.
Applsci 15 03060 g011
Figure 12. Tensile compression ratio of specimens after different numbers of freeze–thaw cycles.
Applsci 15 03060 g012
Figure 13. Microstructure of the specimen after different numbers of freeze–thaw cycles.
Applsci 15 03060 g013
Table 1. Test mix ratios.
NumberFine Aggregate
kg/m3
Coarse Aggregate
kg/m3
Clinker
kg/m3
RubberWater
kg/m3
Water Reducer
kg/m3
MeshDopant
kg/m³
A581.431356.67329.60 0132.303.30
B581.431356.67329.601058.14132.303.30
C581.431356.67329.602058.14132.303.30
D581.431356.67329.603058.14132.303.30
Table 2. Specimen labeling.
Number of Cycles0255075100125
AA-0A-1A-2A-3A-4A-5
BB-0B-1B-2B-3B-4B-5
CC-0C-1C-2C-3C-4C-5
DD-0D-1D-2D-3D-4D-5
Disclaimer/Publisher’s Note: The statements, opinions and data contained in all publications are solely those of the individual author(s) and contributor(s) and not of MDPI and/or the editor(s). MDPI and/or the editor(s) disclaim responsibility for any injury to people or property resulting from any ideas, methods, instructions or products referred to in the content.

