Article

The Influence of Mineral Matter on X-Ray Photoelectron Spectroscopy Characterization of Surface Oxides on Carbon

1
Istituto di Scienze e Tecnologie per l’Energia e la Mobilità Sostenibili, C.N.R., P. le Tecchio 80, 80125 Napoli, Italy
2
Dipartimento di Ingegneria, Università degli Studi del Sannio, Piazza Roma 21, 82100 Benevento, Italy
3
Elettra-Sincrotrone Trieste S.C.p.A., AREA Science Park, 34149 Trieste, Italy
4
Ingegneria Chimica, dei Materiali e della Produzione Industriale, Università degli Studi di Napoli Federico II, P. le Tecchio 80, 80125 Napoli, Italy
*
Author to whom correspondence should be addressed.
Appl. Sci. 2025, 15(6), 2993; https://doi.org/10.3390/app15062993
Submission received: 30 January 2025 / Revised: 4 March 2025 / Accepted: 7 March 2025 / Published: 10 March 2025
(This article belongs to the Special Issue Advances and Challenges in Carbon Capture, Utilisation and Storage)

Abstract

:
The chemical structure of coal is very composite, consisting of a heterogeneous carbonaceous matrix with variable degrees of “turbostratic” order and the inclusion and/or exclusion of mineral matter (ash). The formation of surface oxides on carbon has long been recognized as a key to understanding many chemical and physical properties of carbon materials relevant to their consolidated or emerging applications. The extent and nature of surface oxides can effectively be assessed by high-resolution X-ray photoelectron spectroscopy (XPS), which provides excellent insight into the functional nature of C-O moieties. However, the XPS analysis of ash-bearing carbons may be biased by the interfering effects of inorganics with the most relevant spectral ranges, namely the core levels O1s and C1s. The effect of ash components on the spectroscopic characterization of carbon is scrutinized here with reference to a sub-bituminous coal characterized by a fairly large ash content. The coal is subjected to different treatments, including devolatilization, milling, and oxidation. A synthetic carbon (Carboxen) is used as a reference sample for the correct assignment of the carbon–oxygen functionalities in the core-level XPS spectra (C1s and O1s) in the absence of mineral matter. On the opposite side, fly ash from an industrial coal boiler is analyzed to investigate the effects of mineral matter. It is shown that the establishment of non-uniform charging of the sample induced by ash provides a key to the interpretation of the XPS spectra of ash-bearing carbon samples. The positive charge on the surface, referred to as the charging effect, brings about a shift of the core-level binding energies towards higher values. Grinding of the samples or partial combustion emphasizes the charging effect. XPS analysis of the fly ash, where carbon is largely consumed and dispersed in the inorganic matter, confirms that charging arises from non-conductive aluminosilicates. These effects may induce remarkable changes in carbon and oxygen peak shapes and need to be accounted for to obtain correct interpretations of the XPS spectra of ash-rich carbonaceous fuels.

1. Introduction

The surface and microstructural properties of carbons are very relevant to their use in consolidated and emerging applications as fuels, adsorbents/catalysts for chemical and environmental applications, or electrodes/supercapacitors for energy storage [1,2,3,4,5,6]. The characterization of the surface chemistry of carbons is of primary importance for the proper design and tailoring of smart carbon materials. Among the most widely used and effective surface characterization methods are X-ray photoelectron spectroscopy (XPS) [7,8,9,10,11,12,13,14,15,16,17,18], Fourier-transformed infrared spectroscopy (FTIR) [19,20,21], temperature-programmed desorption (TPD) [7,22,23,24,25,26,27,28,29,30], and attenuated total reflectance (ATR) [31,32]. Due to its sensitivity to the chemical composition and environment of atomic species, XPS has been extensively utilized to determine the carbon structure features on the surface of graphite and graphene oxides, providing valuable insights into the mechanical and electronic properties of these materials [9,12,13,14]. Senneca et al. [7,15] used XPS to scrutinize the nature of carbon–oxygen functionalities as intermediates in the heterogeneous oxidation of different types of coals and synthetic carbons. Surface chemistry has been correlated with the exothermicity or endothermicity of reactions occurring during oxidation and desorption investigated by thermoanalytical methods (DTG, DSC, TPD). Studies on heterogeneous carbon–oxygen chemistry are relevant to the combustion and gasification of carbon from either fossil or biogenic renewable sources to improve efficiency and reduce CO2 emissions to the atmosphere [33]. The nature of carbon–oxygen complexes and the mechanisms underlying the desorption of CO and CO2 under steady and dynamic conditions have been further investigated in [34,35]. Results from oxidation/desorption experiments are fully consistent with the characterization of the nature and extent of surface oxides formed on the carbon substrate, assessed via XPS spectral intensities. In particular, the CO/CO2 ratio in the off gas turns out to be a meaningful fingerprint of the relative abundance of “edge” oxides (ether, carbonyl, lactone) versus epoxy moieties assessed via XPS.
However, the XPS data interpretation of heterogeneous samples, characterized by non-uniform electrical conductivity, may not be straightforward. It is widely recognized that the positive charge generated on the sample surface during the photoemission process is neutralized by an electric current to the grounded sample when the sample’s conductivity is prominent, as well as by metals and semiconductors. In contrast, for insulating materials, neutralization is only partial, leading to the accumulation of a significant net positive charge on the surface [36,37,38,39]. As a result, the sample surface develops a positive potential, typically ranging from a few volts to several tens of volts, which results in a lower measured kinetic energy of the photoelectrons and, as a consequence, a higher apparent binding energy. If the charging is very strong, the shift in binding energy may be large to the point of hiding the photoelectron peak in the secondary electron tail. In intermediate cases, the BE shifts lead to difficulties in interpreting the chemical states of the elements or even in the identification of the observed chemical species.
The situation is further complicated for composite samples, in which case effects like differential charging [40], where regions with different conductivities are present, can entail different retarding potentials and lead to peak broadening and even distortions [41]. The differential charging effect depends on many factors, such as the size and specific resistivity of the sample, the lateral and vertical inhomogeneity of the structure, the chemical constitution of the surface phases within the sample, the total photoionization cross-section of the materials being analyzed, and the features of the incoming X-ray beam (size, shape, intensity, homogeneity, etc.) [42,43,44]. For such inhomogeneous samples, the use of a low-energy electron flood gun to compensate for the positive charge on the sample surface [42,43,44,45]—a common procedure with fully insulating samples—may not be resolute.
The interpretation of carbon XPS analysis has been debated in the literature [46,47]. The XPS analysis of the core-level spectra of carbon materials has been discussed in [46], underlining the ill-informed approach to analyzing the spectroscopic data. Indeed, the carbon species and banding energies for several carbon materials (graphite, carbon black, graphene, carbon nanotubes, carbides, and polymers) are summarized in [46], underlining that carbon materials with different preparation and analytical methods or storage time differ in carbon species and banding energies. The effect on the surface properties of carbon samples exposed to solar radiation was also investigated in [47].
Surface charging during XPS analysis has been accurately scrutinized in recent literature [48,49,50,51,52]. Baer et al. [48] summarize methods to control surface charging during the XPS analysis of insulating samples and different possible approaches for extracting useful information on binding energy. Because of the variety of approaches followed to extract binding energies for insulating materials, each with its own limitations, it is critical for researchers to identify the best procedure.
Gorham et al. [49] presented a method which employs XPS imaging to chemically detect spatially segregated multiwalled carbon nanotubes (MWCNT)-rich regions on an composite surface by exploiting differential charging methods. The results demonstrated that the XPS imaging of differentially charging MWCNT composite samples was an effective means for assessing dispersion quality.
Greczynski and Hultman [50,51,52] revised essential concepts and key experiments related to BE referencing. They discussed appropriate energy reference levels for conducting and insulating samples with and without electrical contact with the spectrometer, and defined criteria for the ultimate charge-reference method, based on adventitious carbon (AdC), which turned out to be the least reliable. They suggested easy-to-perform control experiments that refute the notion that the C1s peak has a constant BE.
In this study, we investigate non-homogeneous carbons in which a conductive matrix (near-graphitic carbonaceous domains) coexists with dispersed dielectric domains (the mineral fraction of the coal, mainly aluminosilicates). The spectral features from the dielectric areas are expected to show significant shifts towards higher binding energy because of the net positive charge, whereas the spectral features of the conducting domains are expected to show no (or limited) binding energy shift by means of XPS.
The bias deriving from the influence of ash material is assessed by a comparative analysis of spectroscopy data obtained with different samples:
  • Carboxen has been selected as an essentially ash-free reference carbon. It is an ideal model carbon to ensure the reliable peak assignment of XPS carbon–oxygen functionalities, ruling out interference due to the presence of inorganics.
  • Char from a sub-bituminous coal, characterized by a large content of both inertinite and vitrinite macerals, has been investigated as a sample of an ash-bearing carbon.
  • Fly ash from entrained flow combustion of the same sub-bituminous coal has been selected as an ideal sample of ash-enriched carbon. The sample contains 68.0% carbon and 15.7% ash. The latter is predominantly constituted by an amorphous alumina silica glass phase (62.1%) and by two crystalline phases, mullite (31.8%) and quartz (6.1%).
  • Milled char samples have been investigated within the scope of elucidating how the exposure of metal oxides from the bulk to the surface of carbon, which is indeed enhanced by grinding, affects the characterization of the sample surfaces by XPS.

2. Materials and Methods

Experiments were carried out on (a) a synthetic carbon (commercial name Carboxen), (b) char from a bituminous coal from South Africa, and (c) fly ash from suspension firing of the same coal.
The synthetic carbon was supplied by Sigma–Aldrich, under the commercial brand of Carboxen 1000. This is a spherically shaped 180–250 μm carbon molecular sieve. It is synthesized by the pyrolysis of an organic polymeric precursor. The properties of Carboxen are reported in Table 1.
The South African coal is a medium-rank bituminous coal with a high content of inertinite macerals. Chars were produced in a lab-scale fluidized bed reactor (ID = 10 cm) at 1123 K under a nitrogen flow. The proximate and ultimate analysis results are provided in Table 2. The microstructure of South African char has been investigated by a combination of techniques, including porosimetric analysis, XRD, Raman, and EPR, reported in [53]. This sample can be considered a “turbostratic” carbon, with a structural order intermediate between that of amorphous carbon and crystalline graphite.
The South African char was ground by means of a laboratory-scale planetary centrifugal ball mill (RETSCH PM 100). The milling balls and drum lining were composed of agate. Approximately 60 g of char samples was loaded into the drum before each milling session; the milling duration ranged from 5 to 30 min, with a rotational speed of 500 rpm. Additional details on the milling process can be found in [54].
Fly ash samples came from a 240 MWe front-fired PC boiler with low-NOx burners burning pulverized South African coal. The ash samples were collected from the hoppers below the first and second rows of electrostatic precipitators and then mechanically sieved using mesh sizes of 75 and 150 μm. The results of the ash analysis are presented in Table 2. Additional details regarding their features can be found in an earlier study [30].
Oxidation treatments were carried out by heating the samples in an electric oven with an airflow. The specific time and temperature conditions for the oxidation treatment of each sample are provided in Table 3.
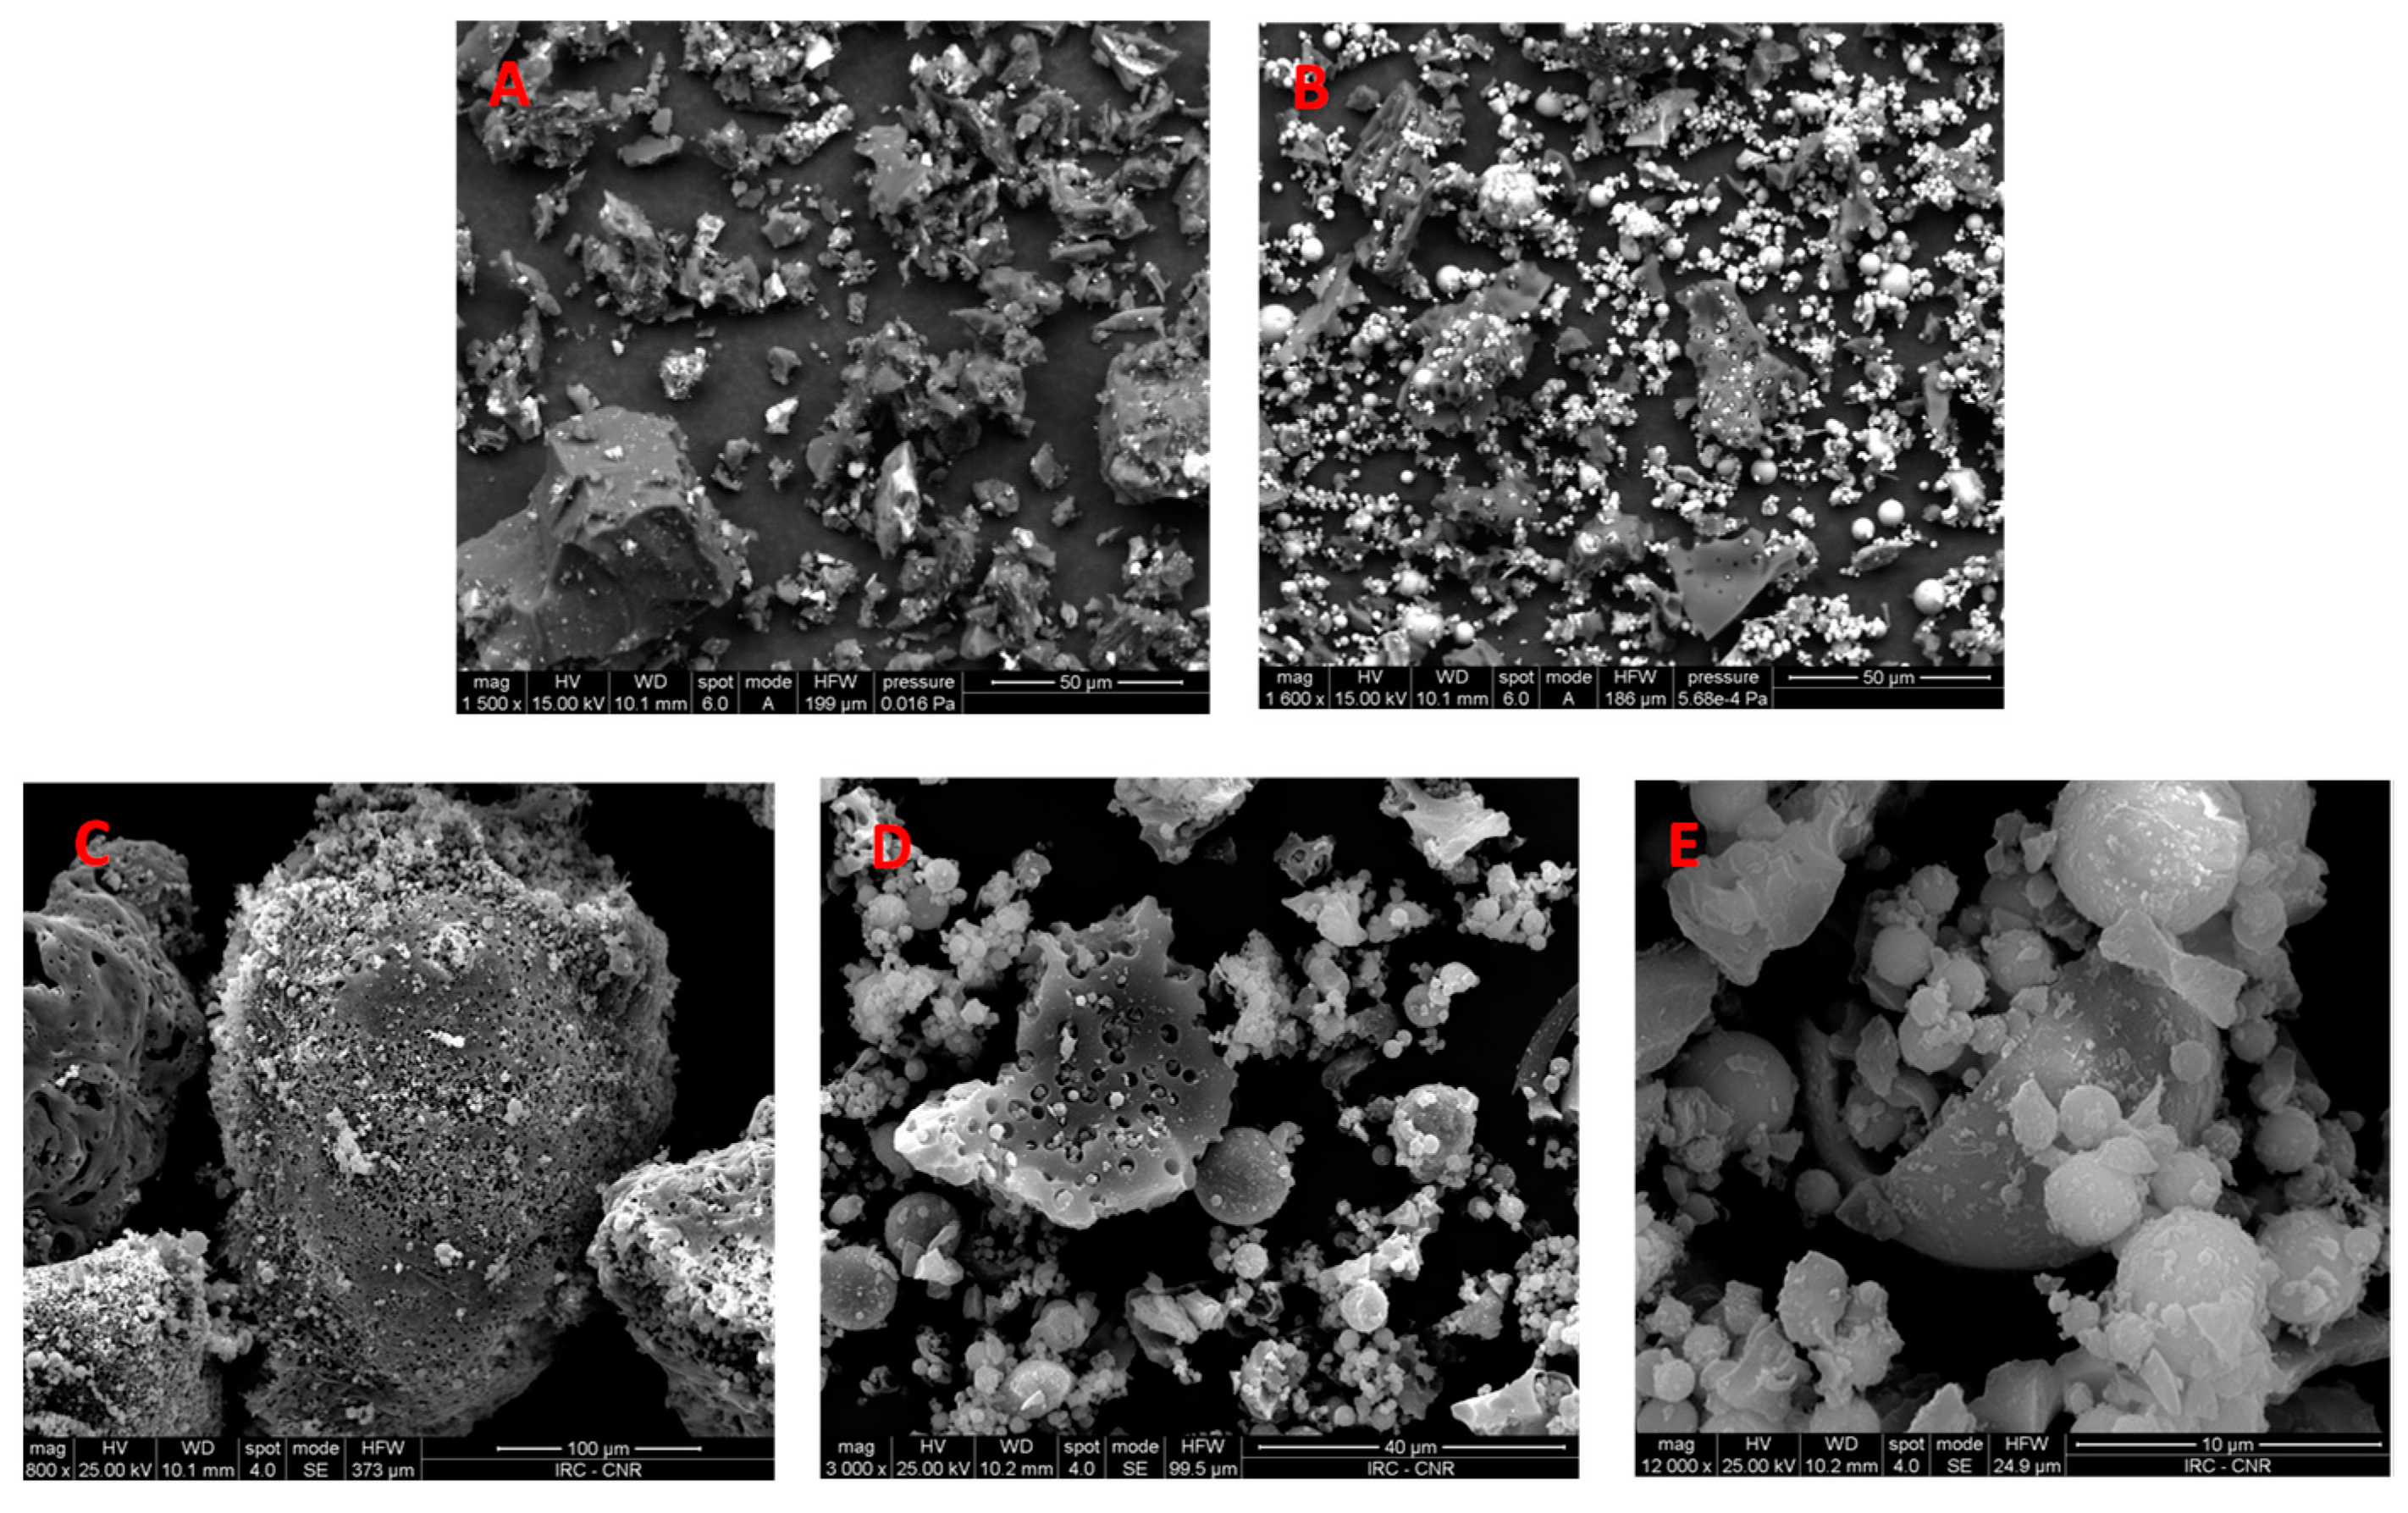
SEM/EDX results on char particles and raw and milled fly ash are reported in Appendix A.
The XPS experiments were performed in the ultra-high vacuum chamber (UHV) of the SuperESCA beamline at the Elettra synchrotron radiation facility (Trieste, Italy).
A thin layer of powdered sample was deposited on circular adhesive foils (6 mm in diameter). A Au foil (3 mm × 6 mm) was located in good electrical contact with the sample, and it was used as a reference to calibrate the binding energy position.
Electrons were detected at a 20° angle relative to the surface normal using a Phoibos electron energy analyzer (SPECS GmbH, Berlin, Germany), equipped with a custom delay-line detector. The measurements were taken with the X-ray beam impinging at a 50° angle relative to the normal of the sample surface. The size of the X-ray beam on the sample was approximately 100 μm × 10 μm.
Survey spectra were acquired at photon energies of 650 eV to confirm alignment and examine potential interference from inorganic substances and contaminants. The selected photon energy allowed for the inclusion of both O1s and C1s peaks in the survey spectrum.
Core-level spectra for C1s and O1s were measured at photon energies of 400 eV and 650 eV, respectively, with overall energy resolutions of 80 meV and 150 meV.
After the removal of a Shirley background [8], C1s and O1s spectra were fitted with Doniach–Sunjic functions convoluted with Gaussians [16]. The XPS curve fitting was performed in agreement with the procedure developed by Levi et al. [7,15] and compared with the results of [9,13]. The following Table 4 reports the binding energies used by Levi et al. [15].
Microstructural investigations of raw materials were carried out by means of X-ray powder diffraction (XRD) analysis in the 2Θ range of 3–90° using a Rigaku Miniflex 600 automated diffractometer (Rigaku, Tokyo, Japan) equipped with a CuKα radiation source. Phases were identified by using the PDF-5 + 2024 database (ICDD—International Centre for Diffraction Data®, Newtown Square, PA, USA) and the Rigaku Smart Lab II software v4.5.162.0. The determination of Reference Intensity Ratios (RIRs) was performed without considering the amorphous phase. The mass fraction of each crystalline phase can be determined using the ratio of diffraction peak intensities between crystalline phases, allowing quantitative analysis. The equation of the RIR method is shown as follows:
w i = I i m a x R i
where wi is the mass fraction of an analytical phase i, I i m a x is the highest peak intensity, and Ri is the RIR value [55].
Microstructural investigation of raw samples, SA milled, fly ash, and Carboxen, have been performed by XRD and the results are reported in Figure 1.
The XRD pattern of fly ash shows diffraction peaks (labelled as 1) corresponding to crystalline phases of Al2(Al2.Si)O10, with an RIR of 82.2 wt%, and a minor diffraction peak attributable to αSiO2 (labelled as 2), with an RIR of 17.8 wt% Figure 1a. Conversely, the XRD pattern of SA milled shows the presence of an amorphous phase and the coexistence of two different phases of silicon dioxide, which were αSiO2, with an RIR of 90 wt%, and SiO2, with an RIR of 10 wt%, (labelled as 3). Instead, the XRD pattern of Carboxen (Figure 1b) shows the presence of a single amorphous phase.

3. Results

3.1. Characterization of Carboxen

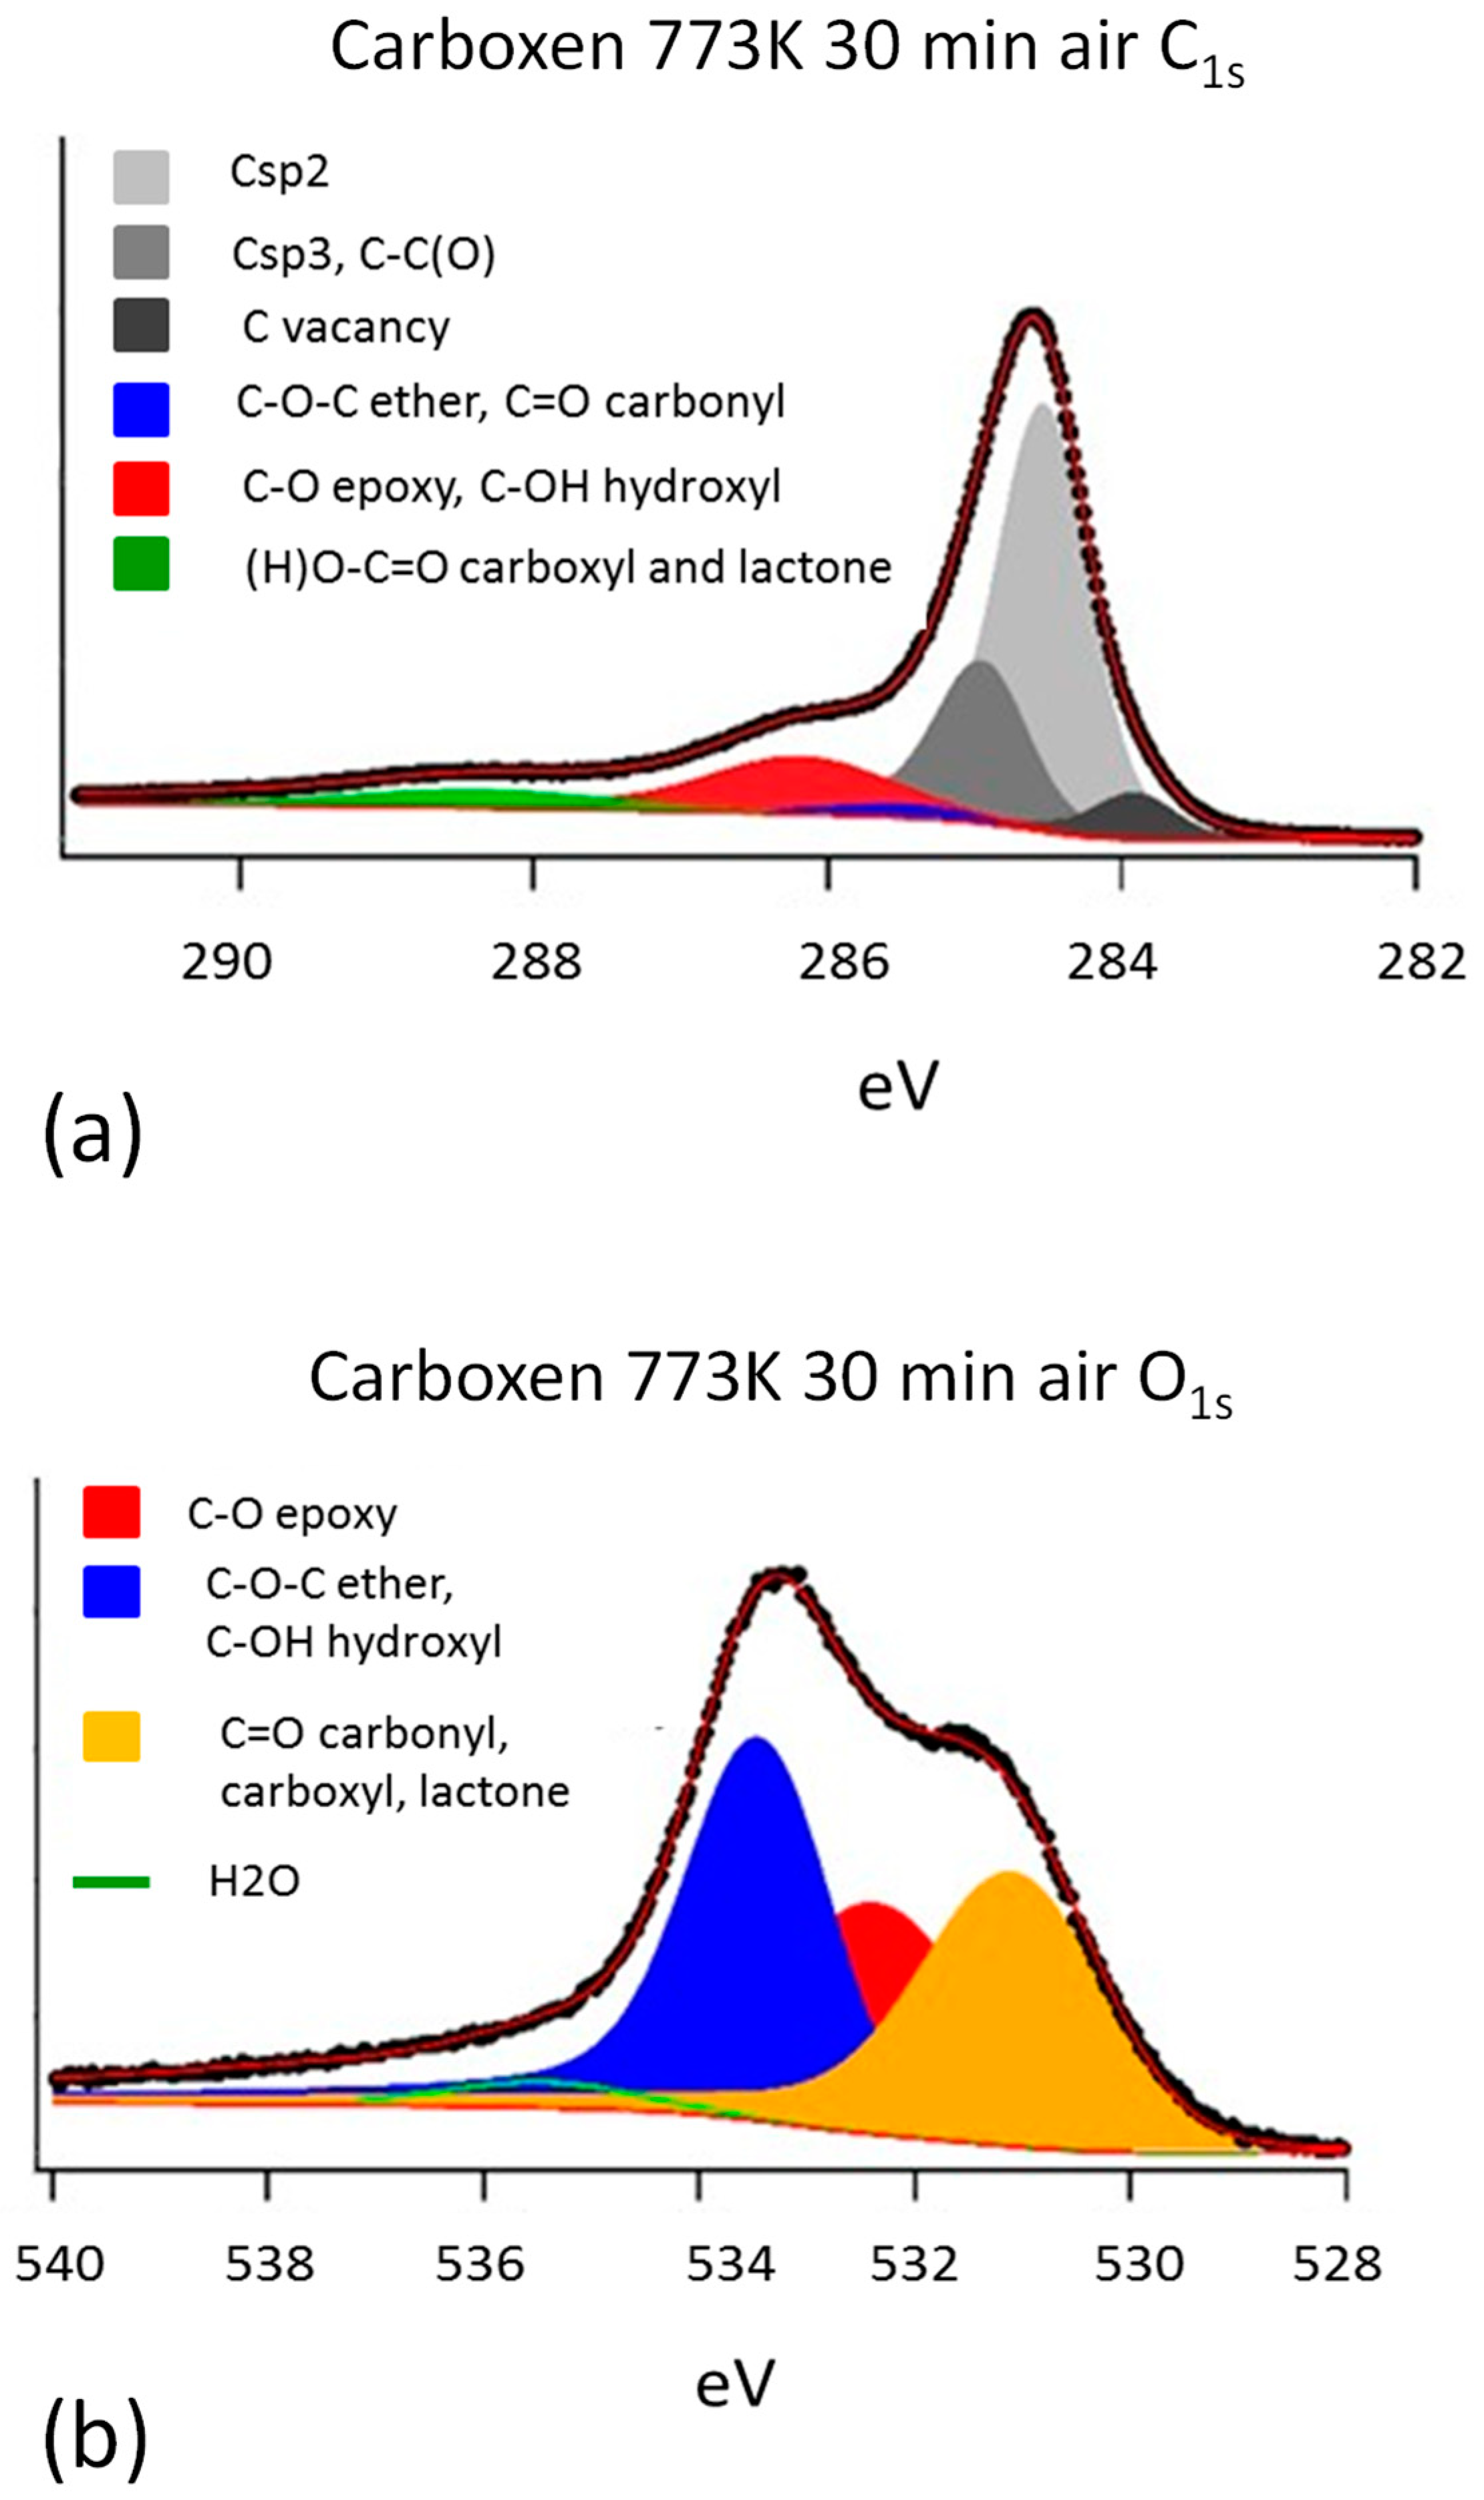
The details of the spectral components obtained by deconvolution of C1s and O1s spectra are shown in Figure 2. The peak assignments are reported in the figure legend, in which black dots and red lines represent the experimental data and the best-fit curves, respectively.
The C1s spectrum exhibits a prominent peak around 284.51 eV, which corresponds to sp2 carbons in C=C bonds within aromatic regions of unoxidized carbon rings and in aliphatic chains [7,9,15]. Additional components associated with sp3 and oxidized carbons appear on the higher-binding-energy side: the feature at 288.29 eV is attributed to HO-C=O [7,9,13,15], the peak at 286.12 eV is linked to epoxides and C-OH groups [7,9,13,15], and the peak at 284.93 eV corresponds to C sp3 and C-C(O) [7,13,15]. On the lower-binding-energy side, a component at 283.89 eV is associated with carbon vacancies [7,9,15].
The O1s spectrum shows three prominent peaks: The main peak at 532.28 eV is related to photoemitted electrons from epoxy oxygen [7,9,15]. A peak at 533.39 eV on the higher-binding-energy side is attributed to ether and hydroxyl groups [7,9,15], while the component at 531.02 eV on the lower-binding-energy side is ascribed to carbonyl, carboxyl, and lactone groups [7,9,15]. Finally, a very weak component at higher binding energy is assigned to H2O, likely resulting from the adsorption of hydroxyl groups in the pore structure [25].

3.2. Characterization of Milled and Unmilled Oxidized Coal Char Samples

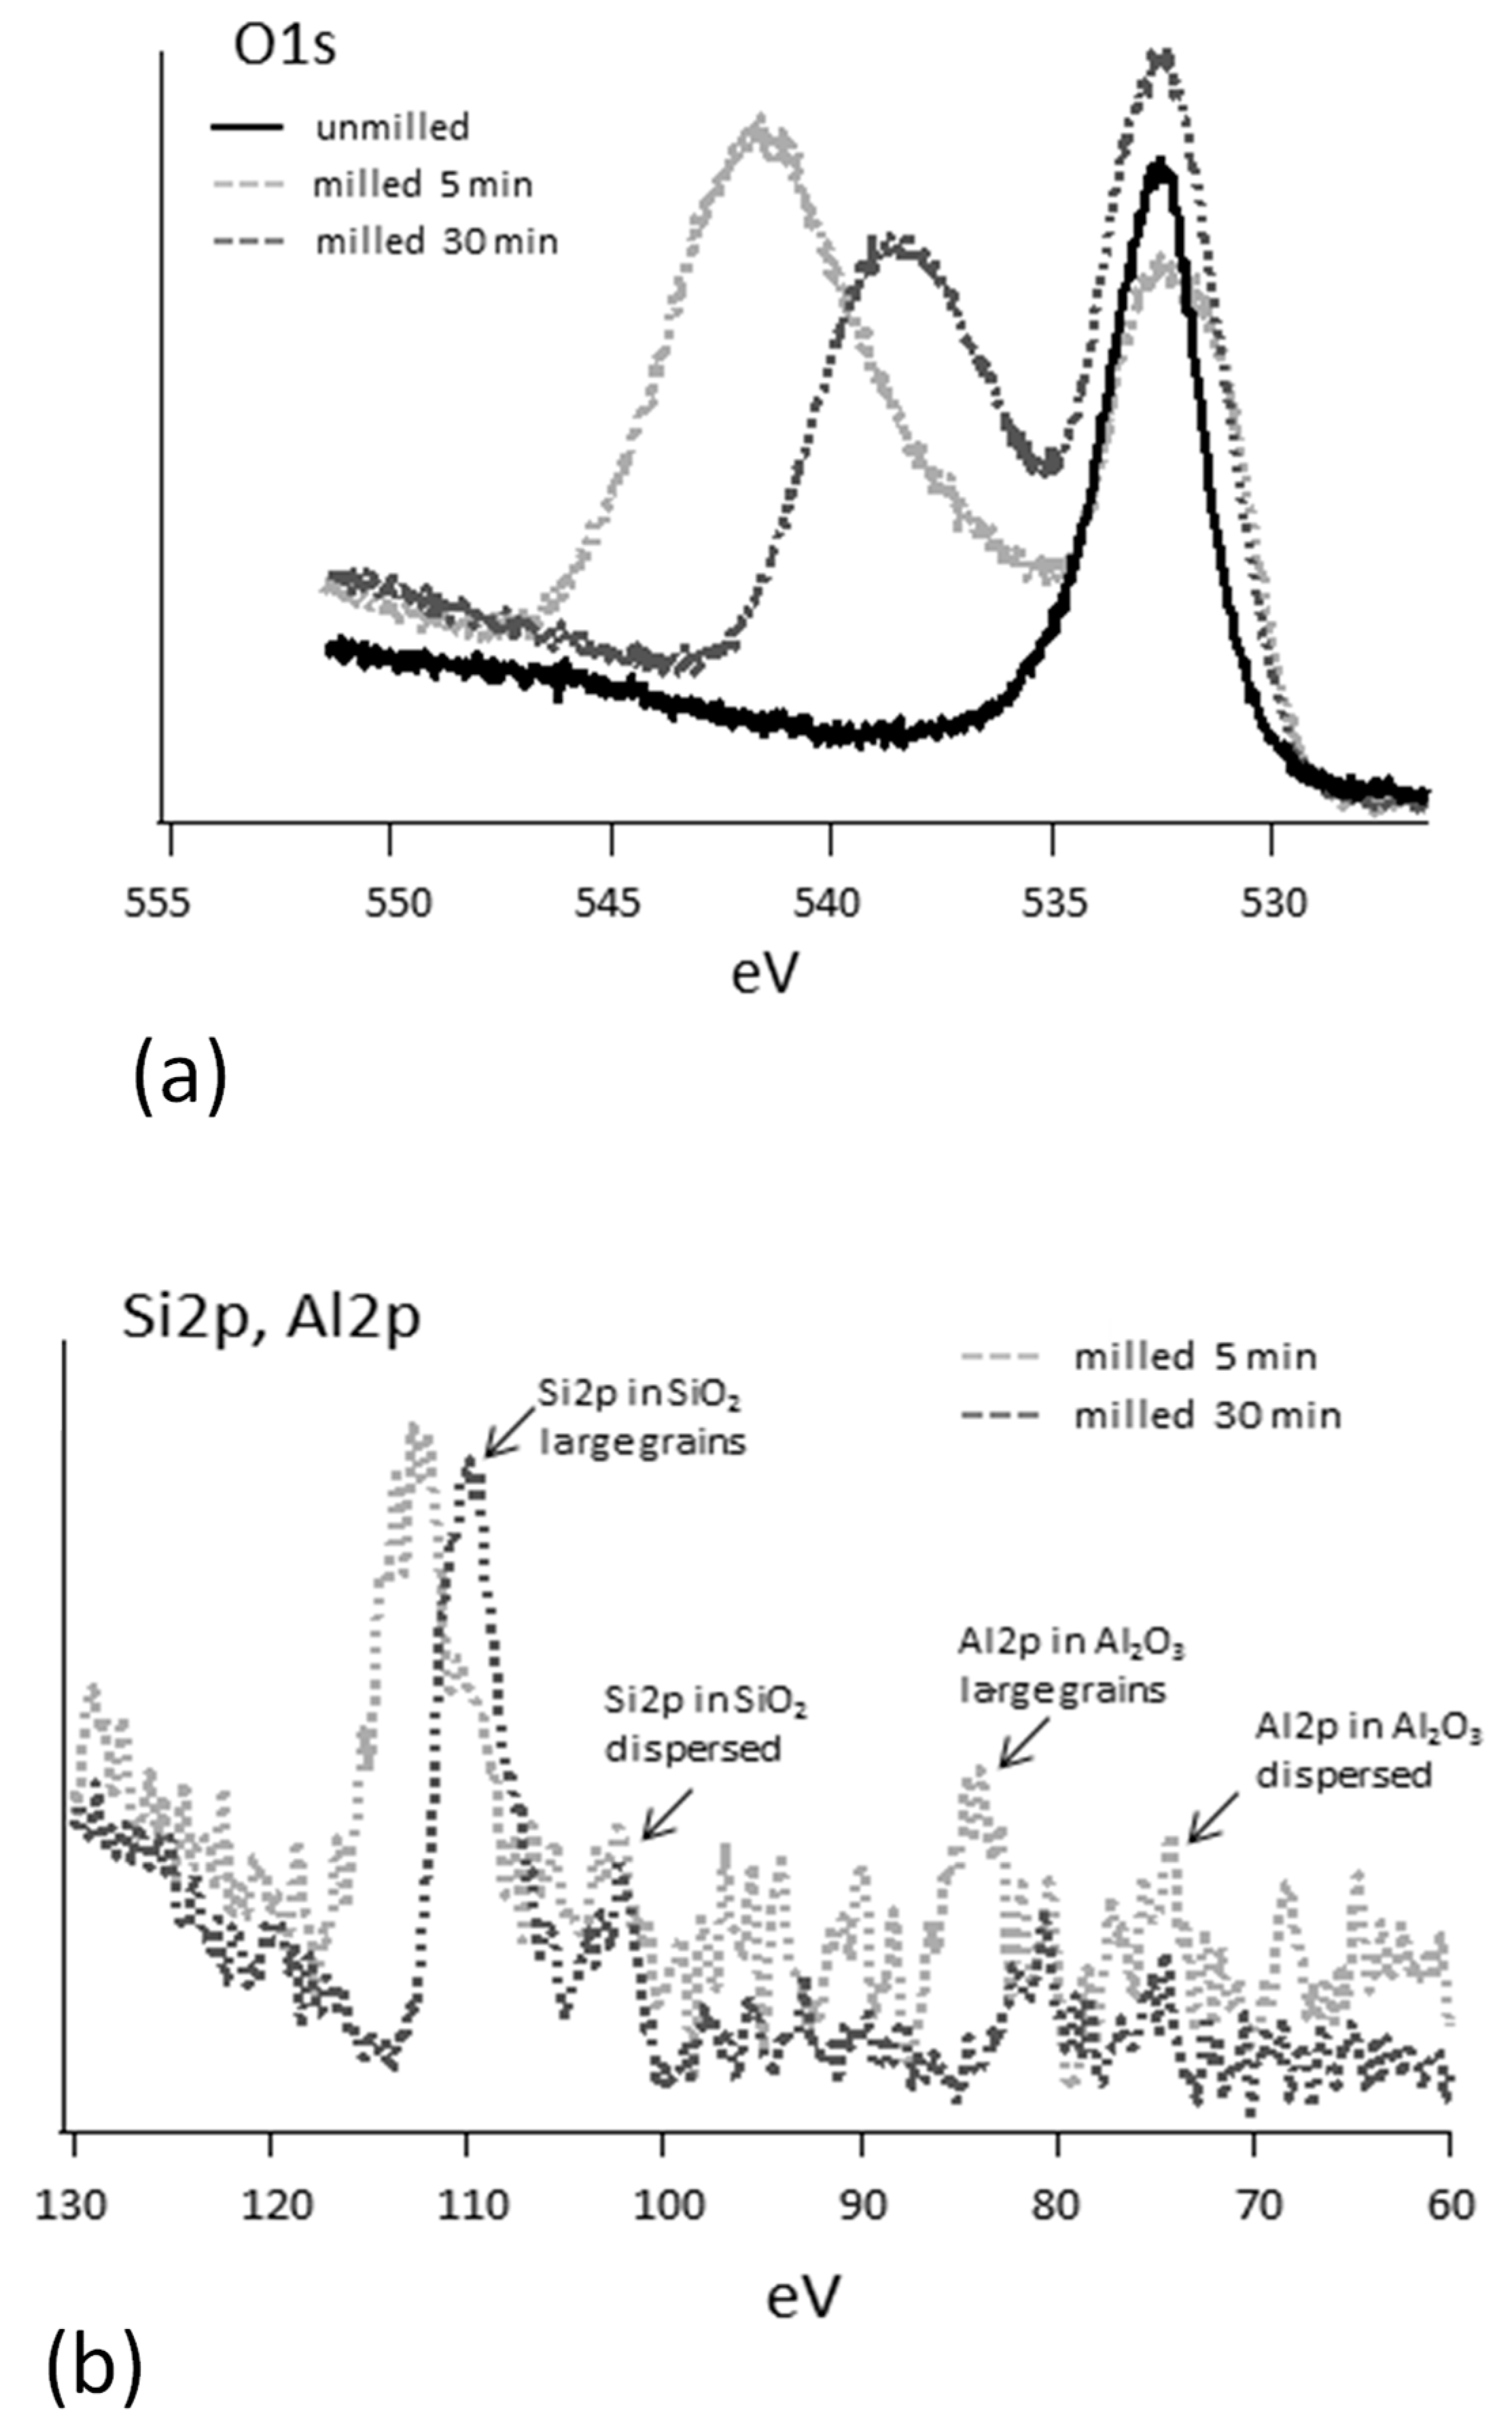
In this section, the results obtained from milled (5 and 30 min) and unmilled coal char samples oxidized at 573 K for 2 h are reported. From the O1s high-resolution XPS spectra shown in Figure 3a, it is clear that, while the O1s core level is broadly comparable with the one detected for Carboxen for the unmilled char (even if the detailed features and contribution of spectral components are locally different), the O1s spectra of the milled chars show very intense extra features shifted at ~538 eV for the 30 min milled sample, and at ~542 eV for the 5 min milled sample.
A similar, although less pronounced, result is found when C1s spectra are analyzed. It is remarkable that even though all the three samples studied in this section underwent the same oxidative treatment, only the C1s spectra of the two milled samples exhibit higher-binding-energy carbon components. In particular, for the 5 min milled sample, a clearly distinguishable peak emerges at around 288.31 eV, while for the 30 min milled sample, two distinguishable peaks emerge at around 288.19 eV and 289.39 eV. The identification of this last component is indeed rather controversial in the literature:
  • Some authors reported that higher-binding-energy carbon components should reflect more oxidized forms of surface carbon [44,56];
  • According to other authors, higher-binding-energy peaks might originate from the inhomogeneous charging artefacts that occur in dielectric compounds [41,45,50].
We believe that such large shifts and associated energy differences cannot be explained on the basis of the changing nature of surface oxides of carbon, as binding energy chemical shifts related to organic oxygen moieties lie mostly in the 527–538 eV range [57]. Instead, we interpret these strong shifts as the perturbation of O1s electrons photoemitted by oxides due to differential charging effects induced by the dielectric nature of mineral components of the char. Char milling causes fragmentation and an increase in the surface area, and favours the emergence of ash inclusions on the surface (see Appendix A) where they are exposed to and detected by XPS. Within this picture, the peak centred at around 532 eV is due to the oxygen signal from the conductive carbonaceous matrix of the char, which is not affected (or only moderately affected) by the charging of the neighbouring mineral particles.
A confirmation of our interpretation comes from the analysis of the survey spectra, acquired at the same photon energy of 650 eV. As shown in Figure 3b, photoemission intensities related to the Si2p and Al2p core levels are detected, in agreement with the expectations as the inorganic fraction of the coal char is mainly composed of silica and alumina (see Table 2). Although the XPS signal is fairly low and noisy and the disorder of the system under investigation prevents thorough resolution of the spin–orbit splitting, for both core levels, we can recognize two features:
  • A weaker intensity at the binding energy at which the signals from silica and alumina are expected (about 103–104 eV for Si2p and about 74–75 eV for Al2p [57]) that can be assigned to small mineral particles dispersed within the organic carbonaceous matrix that experiences weak or no charging effects.
  • A more intense signal shifted by 6–10 eV towards higher binding energy that can be due to larger inorganic grains where photo-induced charging effects are stronger.
It is worth noting the correspondence among the charging-induced shifts in the photoemission spectra of the same sample measured at the same photon energy (650 eV): all three core levels under consideration (O1s, Si2p, and Al2p) show a shift of about 9.5 eV for the 5 min milled sample and a shift of about 6.5 eV for the 30 min milled sample. This observation is consistent with the common origin of the spectral shifts, namely differential charging.
Relating spectroscopic features to the milling time is not straightforward. The emergence of a pronounced peak shifted by about 9 eV toward higher energies is observed after 5 min of milling. Further milling for 30 min is associated with the appearance of a peak of comparable intensity but with a smaller shift, nearly 6 eV, in the resulting spectrum. It may be speculated that early milling discloses ash inclusions of fairly coarse sizes, whereas prolonged milling reduces the size of disclosed mineral inclusions so that the related shift is attenuated.
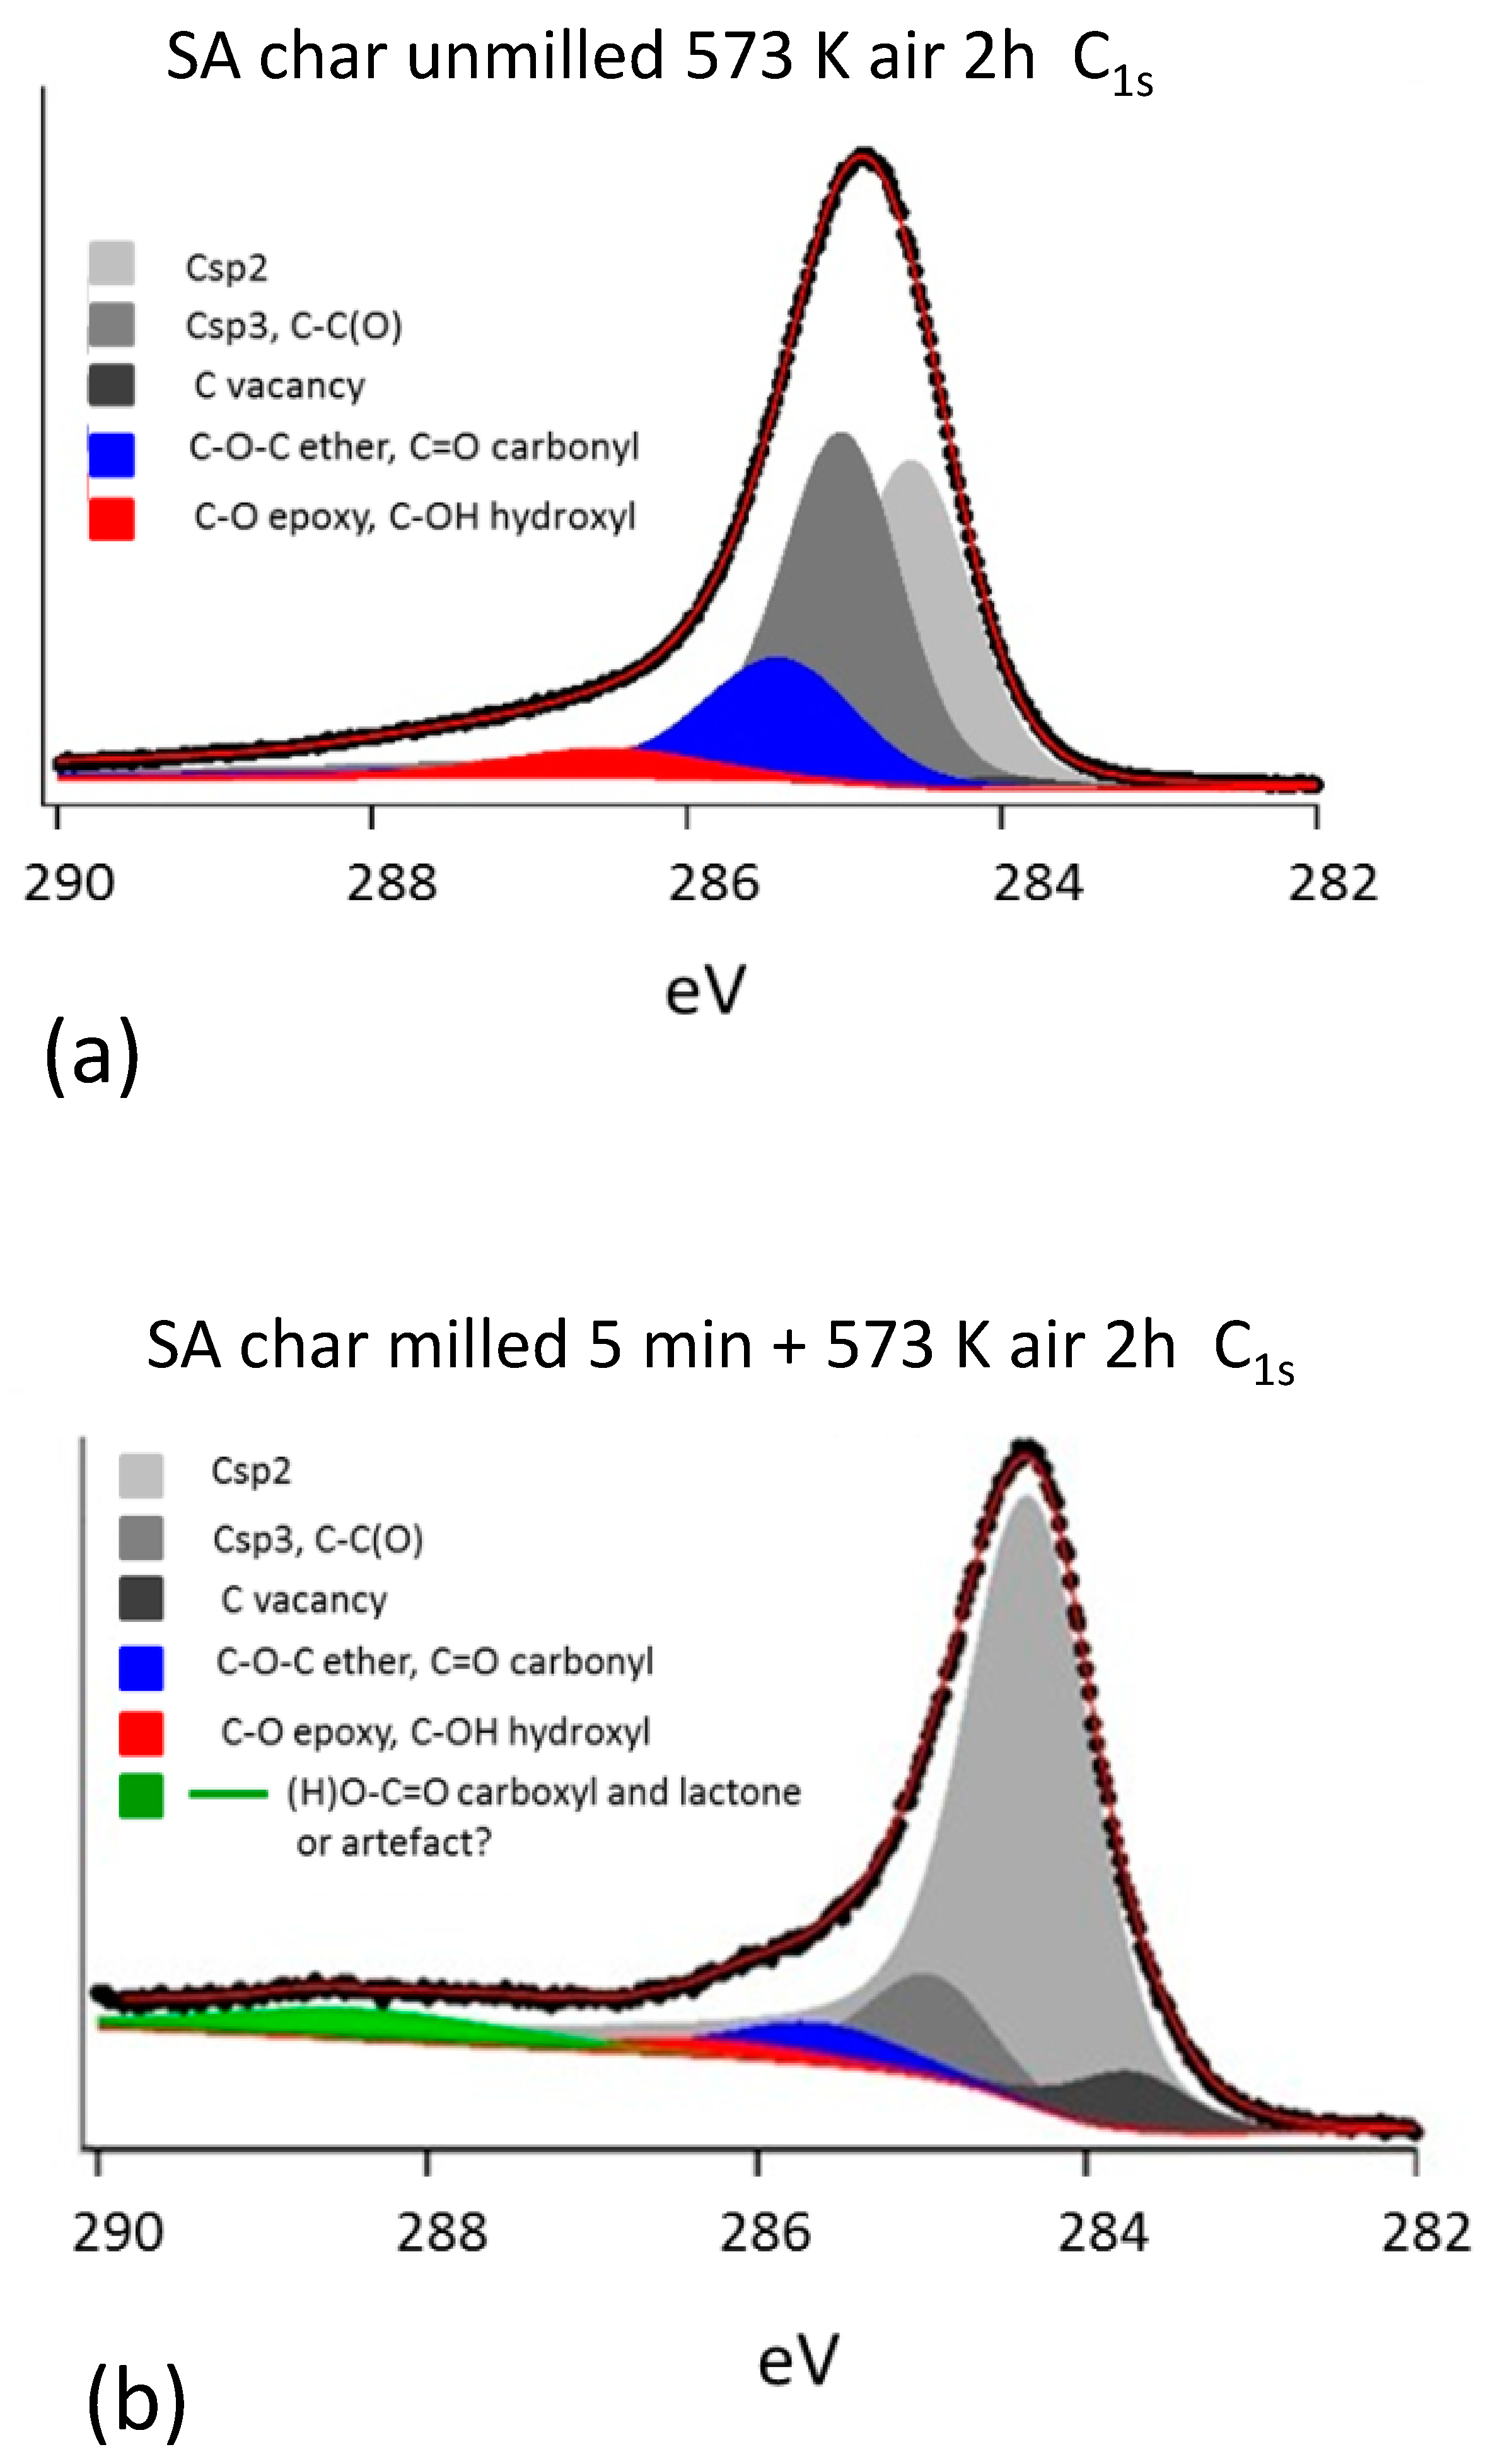
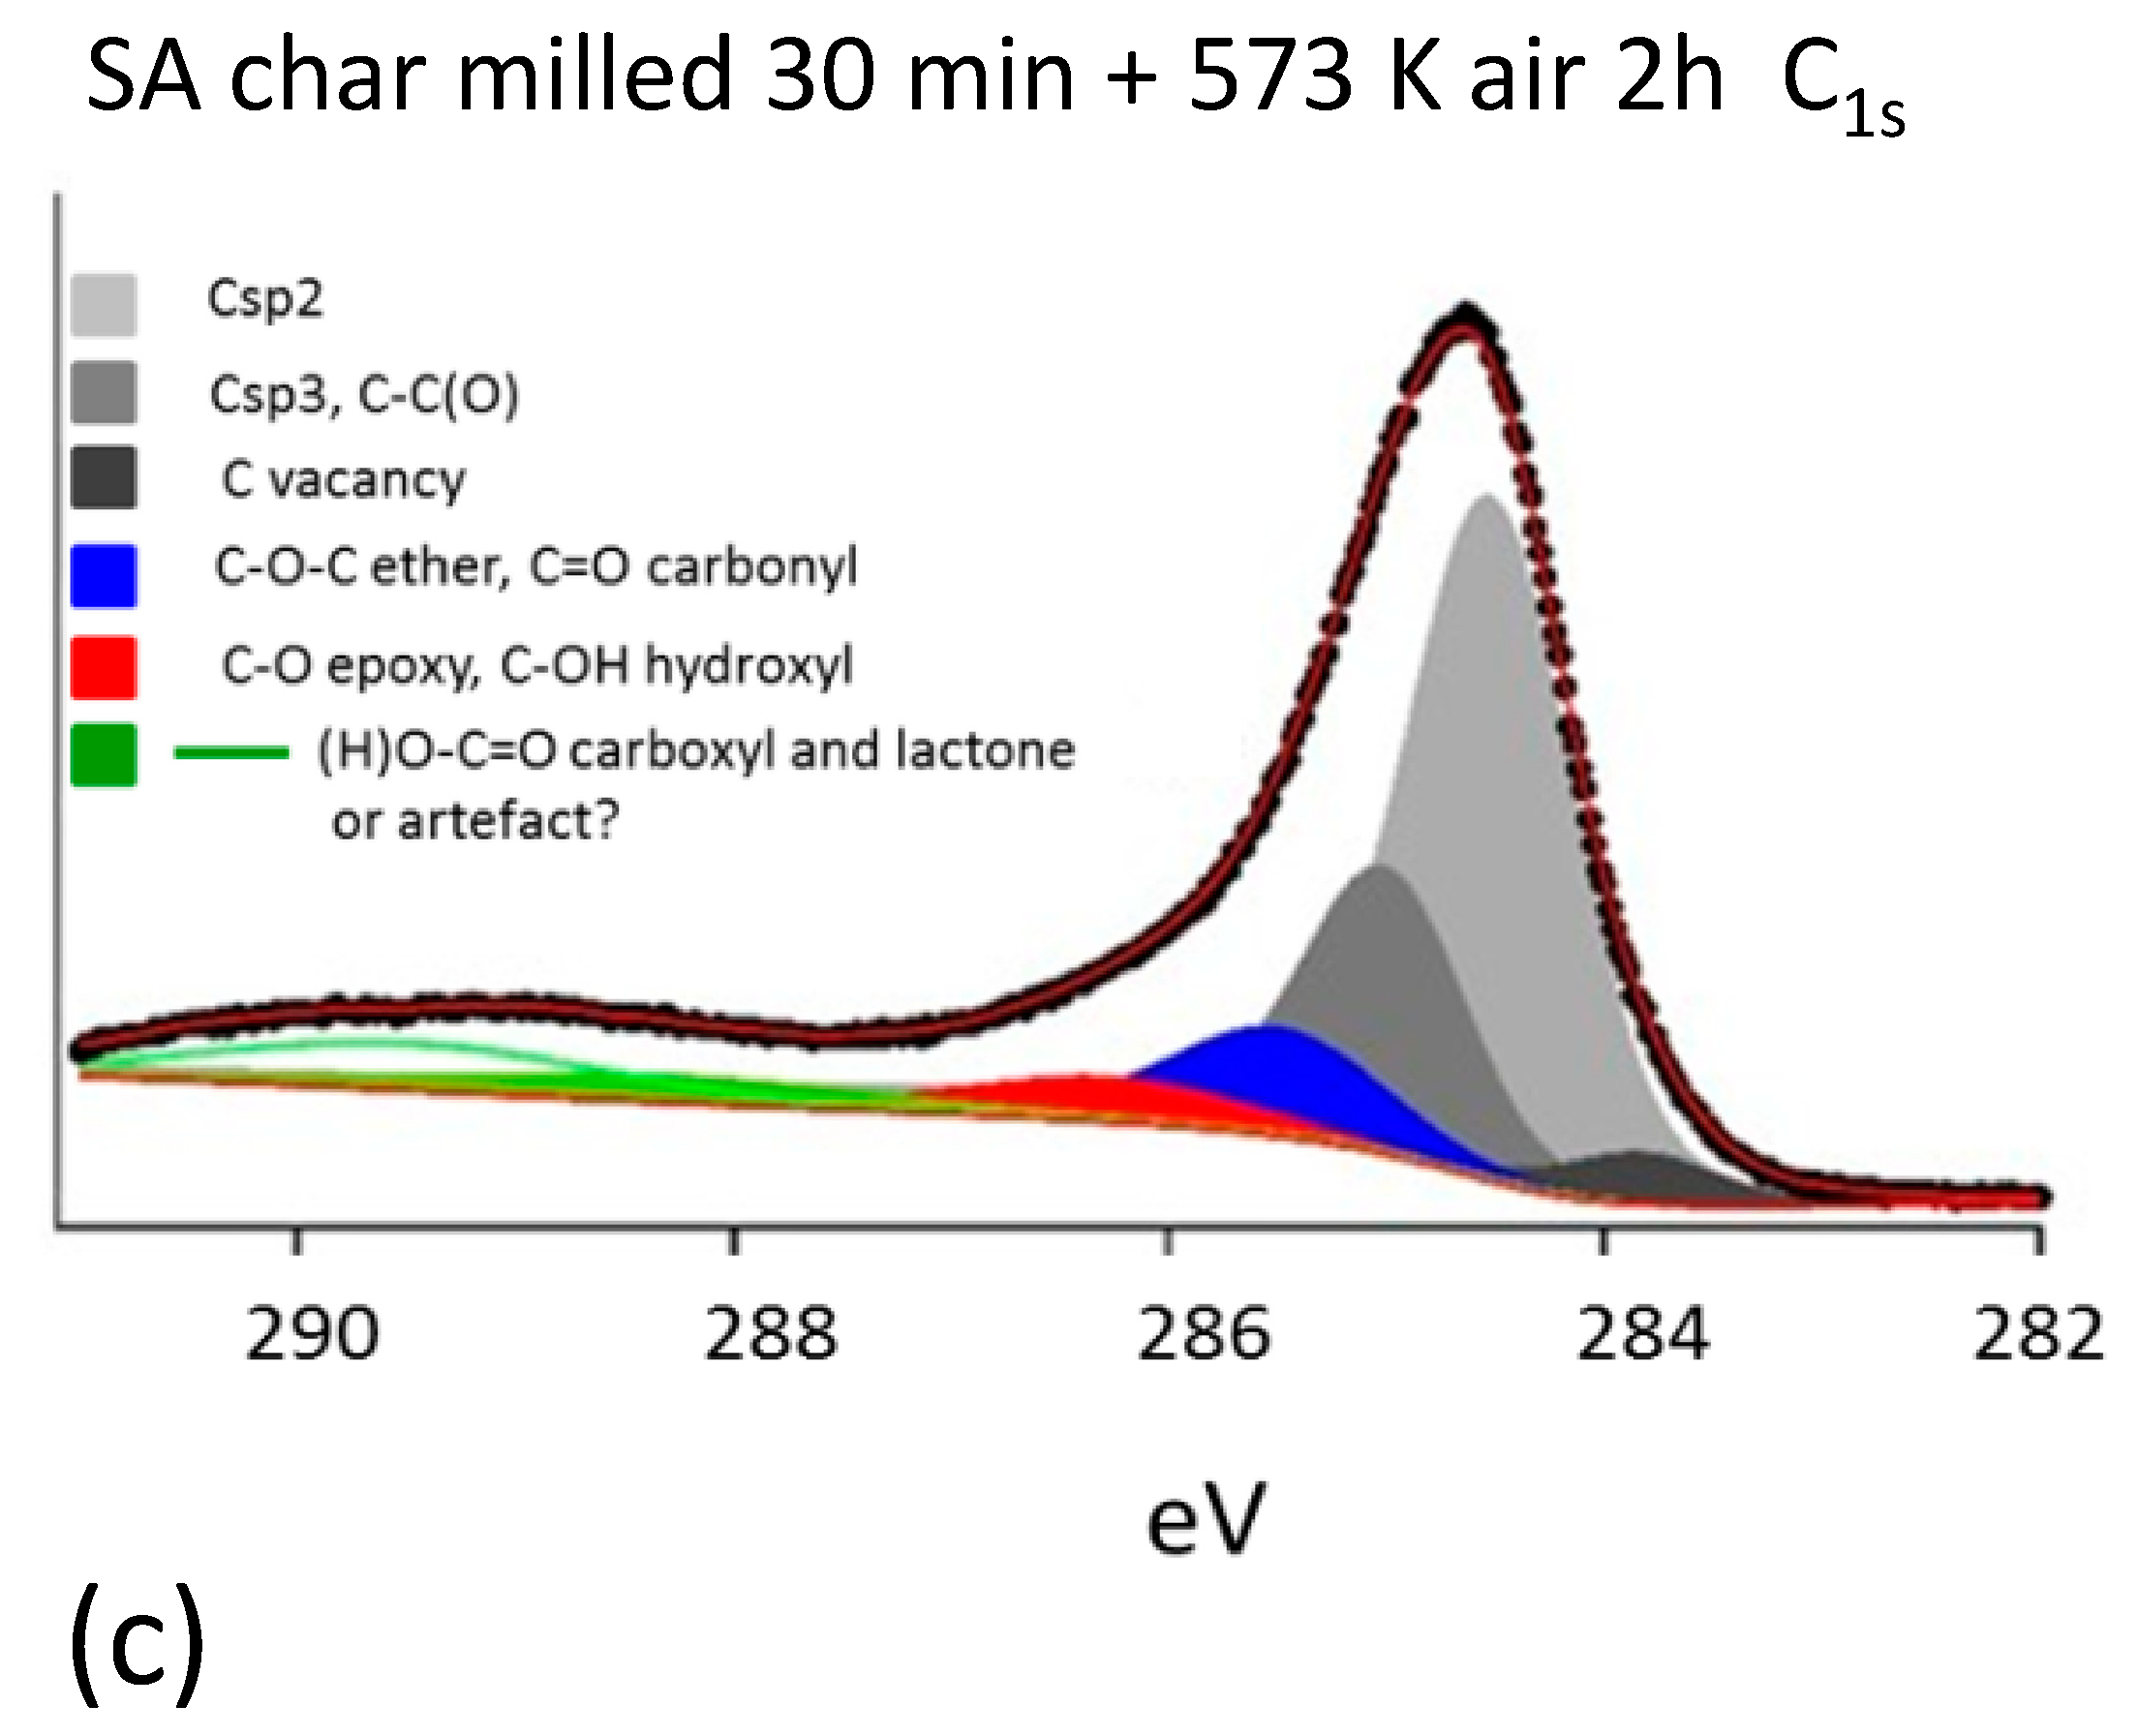
Figure 4a–c report the C1s spectra of the three coal char samples acquired at 400 eV photon energy. The spectral patterns associated with differential charging are still detected, but they are less pronounced than in spectral analysis performed at a 650 eV photon energy. This finding may be attributed to the larger kinetic energy for the C1s photoelectrons (about 370 eV kinetic energy at 650 eV vs. 120 eV kinetic energy for 400 eV photons) that allows us to probe a deeper fraction of the insulating particles, thereby increasing the amount of signal shifted to higher binding energy. On the other hand, the largest part of the C1s signal is still due to the conductive carbonaceous matrix of the char and does not experience charging-related shifts: only a small fraction of carbon is localized in ash and gives rise to the structure at high binding energy, which is much smaller compared to what is observed in the O1s spectra.
Deconvolution of the C1s spectra measured at 400 eV is also reported in Figure 4a–c.
The unmilled sample shows a main component peak at about 284.54 eV. This main component represents sp2 carbons in C=C bonds in aromatic domains of unoxidized carbon rings and in aliphatic chains [7,9,15]. Other components are identified at other binding energy values: 284.98 eV related to C sp3 [7,13,15], 283.94 related to carbon vacancies [7,9,15], 285.46 eV related to ether [7,9,13,15], and 286.26 eV related to epoxides [7,9,13,15]. The C1s signal of milled samples shows a main peak ascribed to sp2 carbons (284.31 eV), a much smaller contribution of the sp3 component (284.92 eV), and an even smaller contribution peak at 283.69 eV related to carbon vacancies [7,9,15]. Oxidized carbons are identified on the high-binding-energy side: at 285.61 eV related to the ether component [7,9,13,15], and at 286.19 eV related to the epoxy–hydroxyl component [7,9,13,15].
The effect of milling on spectral patterns is remarkable, with a pronounced reduction in the sp3 component and an increase in the vacancy component as compared with the sp2 component (see also Appendix B). This finding may be interpreted in light of the mechanochemical effects documented in previous work [54], where a remarkable increase in the intrinsic combustion reactivity of residual carbon in fly ash was observed upon milling. The mechanochemical effect in [54] was assessed by non-isothermal thermogravimetric analysis and temperature programmed desorption [54], even though it was observed that milling did not induce relevant changes in the porosity of the samples, nor in the ash content and composition. It was in fact postulated that mechanochemical activation was due to the increase in strong electron-acceptor sites that could be identified with carbon atoms with unsaturated bonds located at the edges of carbon anisotropic layered structures.
While we can be confident about the interpretation of the spectral components reported above, the situation is less clear for the smaller features at high binding energies, where disentangling structures due to different carbon species from the effects of differential charging appears to be a hard task.

3.3. Characterization of Residual Carbon in Fly Ash

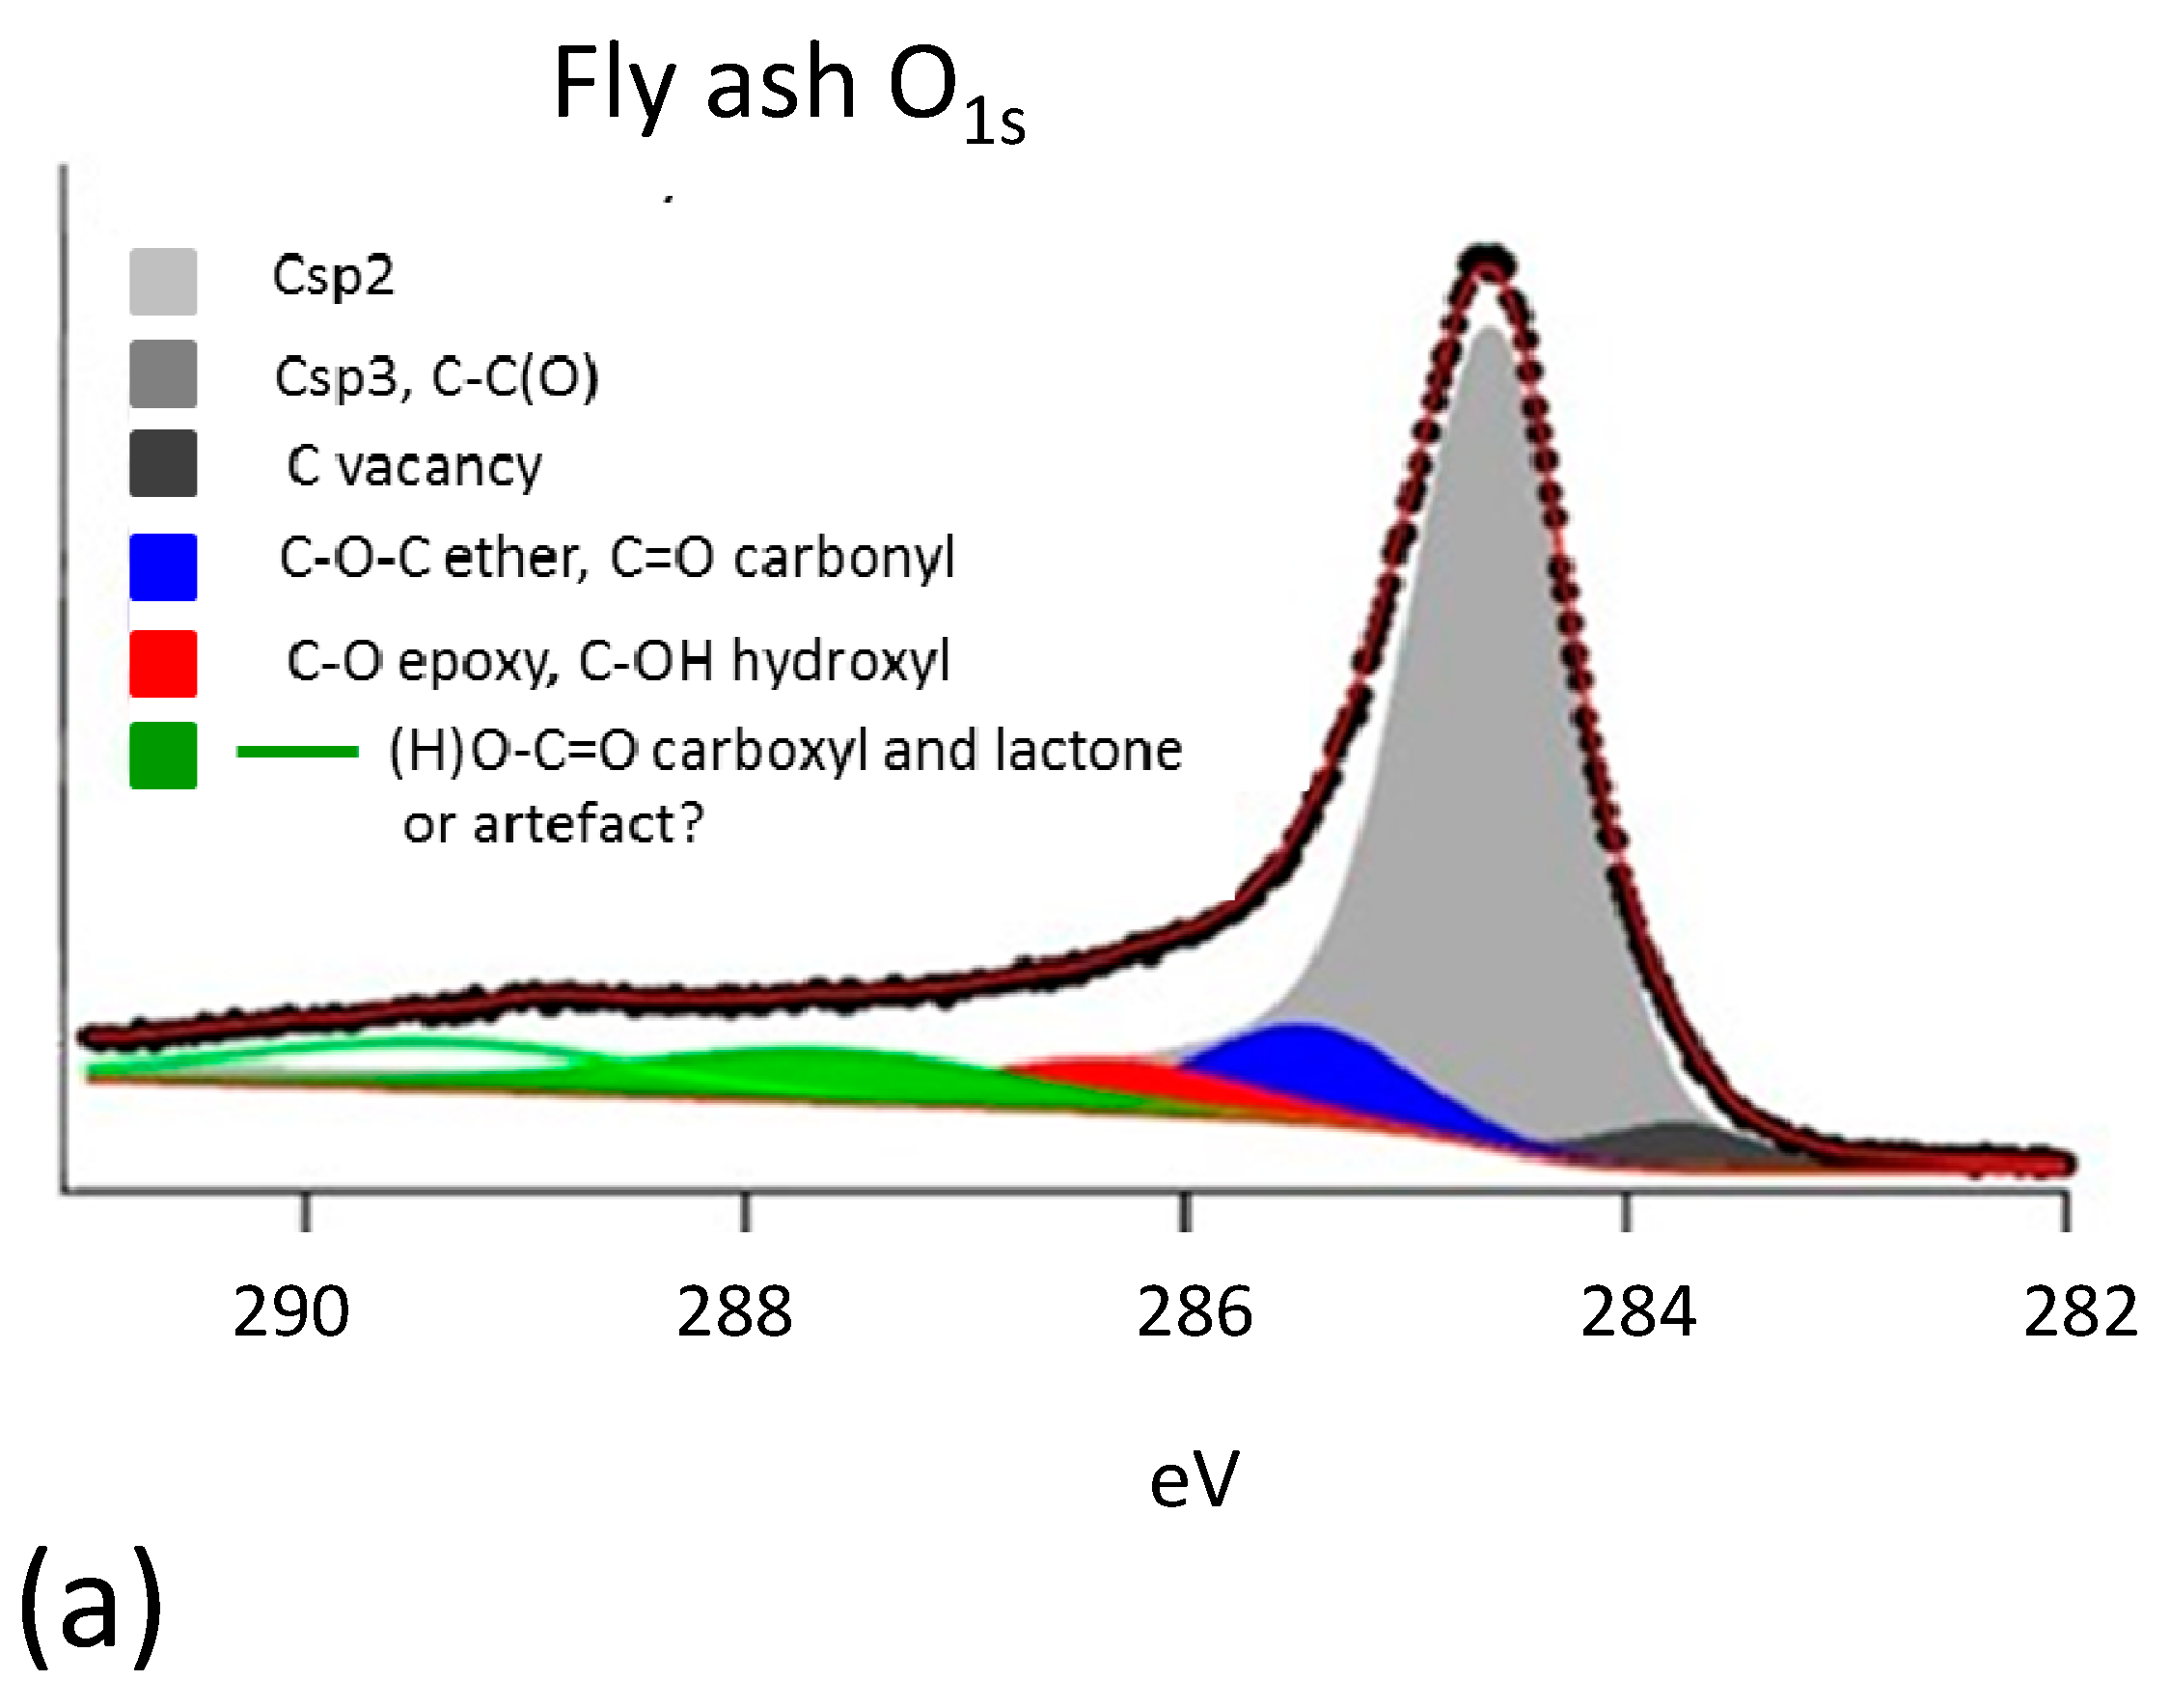
The C1s and O1s high-resolution XPS spectra measured on coal fly ash samples are reported in Figure 5. As it is possible to notice from the O1s signal, the high content of ash, in particular non-conductive aluminosilicates, generates more intense and more shifted features in the O1s spectrum compared to what was observed for the previous set of oxidized char.
The sample shows a very intense C sp2 component at 284.57 eV [7,9,15], because of the thermal annealing [54]. Two components at 285.41 and 286.28 eV were also identified. They could be assigned to ether [7,9,13,15] and epoxy–hydroxyl components, respectively, [7,9,13,15] while the component at 288.14 could be, in principle, assigned to the carboxyl and lactone group [7,9,13,15]. The most remarkable feature of this sample is the presence of a large amount of non-conducting metal oxide particles that cause a positive charge on the surface, shifting the core-level binding energies towards higher values. As for the spectra reported in Figure 4, the identification of the component at 289.27 eV is uncertain, since it can be attributed either to oxidized carbon forms or to differential charging effects.

4. Conclusions

The present study confirms that the spectroscopic characterization of surface oxides on carbon by high-resolution XPS analysis of ash-bearing carbons may be biased by interfering effects of inorganics with the most relevant spectral ranges, namely the core levels O1s and C1s. The comparison of the XPS spectra of unmilled and milled oxidized coal char samples with those of a synthetic ash-free sample (Carboxen) and of fly ash from suspension firing of the same coal sheds light on the effect of mineral matter on photoelectron spectral patterns. The O1s and, to a lesser extent, the C1s high-resolution XPS spectra of milled and oxidized coal char samples display high-energy spectral components that cannot simply be related to modifications of carbon–oxygen moieties. Similar shifts are observed when the Si2p and Al2p core levels are scrutinized. The similarity of spectral shifts observed with all the core levels is interpreted in light of a common mechanism, that is, differential positive charging of dielectric regions of the composite sample surface, most likely aluminosilicate grains, reflected by the emergence of high-binding-energy spectral components. Consistent with this framework, the O1s and C1s spectra of coal fly ash show qualitatively similar, but even more pronounced, spectroscopic patterns. It is remarkable that unmilled coal char samples do not display the same high-binding-energy spectral components observed in milled char and fly ash samples. It may be speculated that the milling of “as-prepared” and oxidized coal char emphasizes the effect of mineral matter by disclosing ash inclusions, whose crystalline core is eventually exposed to photoemission phenomena, from the carbon matrix. The C1s spectra at the lower photon energy of 400 eV is less affected by the “differential charging effects”. Deconvolution of these spectra has been accomplished with some success and suggests a pronounced change in the carbon sp2 vs. sp3 and vacancy components upon milling that may reflect the mechanochemical activation of carbon. The purpose of the present investigation is not to solve the charging effect issue but to provide evidence for it in the case of ash-rich carbonaceous fuels. Future efforts will be required by the scientific community to establish a quantitative relationship model between mineral components (such as the SiO2/Al2O3 ratio) and charge effect intensity so as to provide a basis for XPS data correction.

Author Contributions

Conceptualization, F.C., P.S. and O.S.; methodology, F.C., A.F. (Annunziata Forgione), P.L., A.F. (Antonio Fabozzi) and O.S.; validation, P.L. and S.L.; formal analysis, F.C., A.F. (Annunziata Forgione), P.L. and A.F. (Antonio Fabozzi); resources, P.L. and S.L.; data curation F.C., A.F. (Annunziata Forgione), P.L., S.L. and A.F. (Antonio Fabozzi); writing—original draft preparation, F.C., A.F. (Annunziata Forgione), P.L., S.L., A.F. (Antonio Fabozzi), P.S. and O.S.; writing—review and editing, F.C., A.F. (Annunziata Forgione), P.L., S.L., A.F. (Antonio Fabozzi), P.S. and O.S.; supervision, S.L., P.S. and O.S. All authors have read and agreed to the published version of the manuscript.

Funding

The authors acknowledge CERIC for funding the experimental campaign at ELETTRA (proposal number 20152058 CERIC). Antonio Fabozzi acknowledges funding from the European Union—NextGenerationEU under the National Recovery and Resilience Plan (PNRR), Mission 04 Component 2 Investment 3.1, Project “ECCSELLENT—Development of ECCSEL-R.I. ItaLian facilities: usEr access, services and loNg-Term sustainability” Code: IR0000020-CUP F53C22000560006. iENTRANCE@ENL—Infrastructure for ENergy TRAnsition aNd Circular Economy @ EuroNanoLab”—Code IR0000027-CUP B33C22000710006—European Union—NextGenerationEU under the National Recovery and Resilience Plan (NRRP), Mission 04, Component 2, Investment 3.1.

Institutional Review Board Statement

Not applicable.

Informed Consent Statement

Not applicable.

Data Availability Statement

The original contributions presented in the study are included in the article, further inquiries can be directed to the corresponding author.

Acknowledgments

The authors acknowledge Luciano Cortese for assistance in sample preparation and Luigi Stanzione and Andrea Capuozzo for XRD analysis.

Conflicts of Interest

The authors declare no conflicts of interest.

Appendix A

Figure A1. SEM images of (A) char sample; (B) char sample oxidized and milled; (C) unmilled ash; (D,E) milled ash.
Applsci 15 02993 g0a1
Table A1. EDX analysis results of char sample, char sample oxidized and milled, unmilled ash, and milled ash.
EDX AnalysisChar SampleChar Oxidized and MilledAshAsh Milled (Char Particles) Ash Milled, Ash Particles
wt%
C91.17461.6091.3417.38
O7.820.721.095.6342.41
Nan.d.0.30.540.321.92
Al0.31.34.410.9013.19
Si0.32.15.120.8217.45
Kn.d.0.20.930.172.04
Ca0.10.21.420.150.71
Fen.d.0.64.50.594.3

Appendix B

Table A2. Intensity and banding energy of C sp2, C sp3/C-C(O), C vacancy peaks of fly ash, Carboxen, unmilled SA char, and milled SA char samples obtained from C1s core-level XPS curve-fitting results.
SampleHeat
Treatment
Air
C sp2C sp3,
C-C(O)
C Vacancy
Intensity
(a.u.)
BE
(eV)
Intensity
(a.u.)
BE
(eV)
Intensity
(a.u.)
BE
(eV)
Fly ash 2554.42284.57152.62284.99130.76283.72
Carboxen773 K 30 min3191.41284.511221.02284.93317.31283.89
SA unmilled573 K 2 h2267.22284.542508.19284.9852.87283.94
SA milled 5 min573 K 2 h1884.81284.31305.76284.92166.67283.69
SA milled 30 min573 K 2 h2114.01284.49867.34284.98147.69283.8
Table A3. Intensity and banding energy of ether/carbonyl, epoxy/hydroxyl, carboxyl/lacton, and artefact peaks of fly ash, Carboxen, unmilled SA char, and milled SA char samples obtained from C1s core-level XPS curve-fitting results.
SampleHeat
Treatment
Air
Ether,
Carbonyl
Epoxy,
Hydroxyl
Carboxyl,
Lacton
Artefact
Intensity
(a.u.)
BE
(eV)
Intensity
(a.u.)
Intensity
(a.u.)
Intensity
(a.u.)
BE
(eV)
Intensity
(a.u.)
BE
(eV)
Carboxen 129.94285.44778.71286.12305.86288.29
Fly ash773 K 30 min362.05285.41250.86286.28338.49288.14316.32289.27
SA unmilled573 K 2 h452.16285.46319.06286.26
SA milled 5 min573 K 2 h160.21285.6172.199286.19184.97288.31
SA milled 30 min573 K 2 h414.18285.46211.44286.21153.32288.19317.58289.39
Table A4. Intensity and banding energy of epoxy, ether/hydroxyl, carbonyl/carboxyl/lacton, and water peaks of Carboxen sample obtained from O1s core-level XPS curve-fitting results.
SampleHeat
Treatment Air
EpoxyEther,
Hydroxyl
Carbonyl,
Carboxyl, Lacton
Water Adsorb
Intensity
(a.u.)
BE
(eV)
Intensity
(a.u.)
BE
(eV)
Intensity
(a.u.)
BE
(eV)
Intensity
(a.u.)
BE
(eV)
Carboxen773 K 30 min1137.61532.281435.52533.391256.81531.02129.98535.37

References

  1. Danish, M.; Ahmad, T. A review on utilization of wood biomass as a sustainable precursor for activated carbon production and application. Renew. Sustain. Energy Rev. 2018, 87, 1–21. [Google Scholar] [CrossRef]
  2. González-García, P. Activated carbon from lignocellulosics precursors: A review of the synthesis methods, characterization techniques and applications. Renew. Sustain. Energ. Rev. 2018, 82, 1394–1414. [Google Scholar] [CrossRef]
  3. Faraji, S.; Nasir Ani, F. The development supercapacitor from activated carbon by electroless plating—A review. Renew. Sustain. Energ. Rev. 2015, 42, 823–834. [Google Scholar] [CrossRef]
  4. Najafabadi, A.T. Emerging applications of graphene and its derivatives in carbon capture and conversion: Current status and future prospects. Renew. Sustain. Energ. Rev. 2015, 41, 1515–1545. [Google Scholar] [CrossRef]
  5. Farooqui, U.R.; Ahmad, A.L.; Hamid, N.A.A. Graphene oxide: A promising membrane material for fuel cells. Renew. Sustain. Energ. Rev. 2018, 82, 713–733. [Google Scholar] [CrossRef]
  6. Tsang, C.H.A.; Huang, H.; Xuan, J.; Wang, H.; Leung, D.Y.C. Graphene materials in green energy applications: Recent development and future perspective. Renew. Sustain. Energ. Rev. 2020, 120, 109656. [Google Scholar] [CrossRef]
  7. Levi, G.; Causà, M.; Lacovig, P.; Salatino, P.; Senneca, O. Mechanism and thermochemistry of coal char oxidation and desorption of surface oxides. Energy Fuels 2017, 31, 2308–2316. [Google Scholar] [CrossRef]
  8. Shirley, D.A. High-Resolution X-Ray Photoemission Spectrum of the Valence Bands of Gold. Phys. Rev. 1972, 5, 4709. [Google Scholar] [CrossRef]
  9. Barinov, A.; Malcioglu, O.B.; Fabris, S.; Sun, T.; Gregoratti, L.; Dalmiglio, M.; Kiskinova, M. Initial Stages of Oxidation on Graphitic Surfaces: Photoemission Study and Density Functional Theory Calculations. J. Phys. Chem. 2009, 113, 9009–9013. [Google Scholar] [CrossRef]
  10. Xia, W.; Yang, J.; Liang, C. Investigation of changes in surface properties of bituminous coal during natural weathering processes by XPS and SEM. Appl. Surf. Sci. 2014, 293, 293–298. [Google Scholar] [CrossRef]
  11. Gonga, B.; Pigramb, P.J.; Lamba, R.N. Surface studies of low-temperature oxidation of bituminous coal vitrain bands using XPS and SIMS. Fuel 1998, 77, 1081–1087. [Google Scholar] [CrossRef]
  12. Yamada, Y.; Yasuda, H.; Murota, K.; Nakamura, M.; Sodesawa, T.; Sato, S. Analysis of heat-treated graphite oxide by X-ray photoelectron spectroscopy. J. Mater. Sci. 2013, 48, 8171–8198. [Google Scholar] [CrossRef]
  13. Zhang, W.; Carravetta, V.; Li, Z.; Luo, Y.; Yang, J. Oxidation States of Graphene: Insights from Computational Spectroscopy. J. Chem. Phys. 2009, 131, 244505. [Google Scholar] [CrossRef]
  14. Kim, S.; Zhou, S.; Hu, Y.; Acik, M.; Chabal, Y.J.; Berger, C.; de Heer, W.; Bongiorno, A.; Riedo, E. Room-temperature metastability of multilayer graphene oxide films. Nat. Mater. 2012, 11, 544. [Google Scholar] [CrossRef]
  15. Levi, G.; Senneca, O.; Causà, M.; Salatino, P.; Lacovig, P.; Lizzit, S. Probing the chemical nature of surface oxides during coal char oxidation by high-resolution XPS. Carbon 2015, 90, 181–196. [Google Scholar] [CrossRef]
  16. Doniach, S.; Šunjić, M. Many-electron singularity in X-ray photoemission and X-ray line spectra from metals. J. Phys. C Solid State Phys. 1970, 3, 285–291. [Google Scholar] [CrossRef]
  17. Cheung, T.T.P. X-ray photoemission of carbon: Lineshape analysis and application to studies of coals. J. Appl. Phys. 1982, 53, 6857–6862. [Google Scholar] [CrossRef]
  18. Haerle, R.; Riedo, E.; Pasquarello, A.; Baldereschi, A. Sp2/Sp3 hybridization ratio in amorphous carbon from C 1s core-level shifts: X-ray photoelectron spectroscopy and first-principles calculation. Phys. Rev. 2001, 65, 045101. [Google Scholar] [CrossRef]
  19. Cloke, M.; Gilfillan, A.; Lester, E.H. The characterization of coals and density separated coal fractions using FTIR and manual and automated petrographic analysis. Fuel 1997, 76, 1289–1296. [Google Scholar] [CrossRef]
  20. Gilfillan, A.; Lester, E.H.; Cloke, M.; Snape, C.E. The structure and reactivity of density separated coal fractions. Fuel 1999, 78, 1639–1644. [Google Scholar] [CrossRef]
  21. Manoj, B.; Narayanan, P. Study of Changes to the Organic Functional Groups of a High Volatile Bituminous Coal during Organic Acid Treatment Process by FTIR Spectroscopy. J. Min. Mater. Charact. Eng. 2013, 1, 39–43. [Google Scholar] [CrossRef]
  22. Christoph Schneider, C.; Sonia Rincón Prat, S.; Thomas Kolb, T. Determination of active sites during gasification of biomass char with CO2 using temperature-programmed desorption. Part 1: Methodology & desorption spectra. Fuel 2020, 267, 116726. [Google Scholar]
  23. Radovic, L.R. Active Sites in Graphene and the Mechanism of CO2 Formation in Carbon Oxidation. J. Am. Chem. Soc. 2009, 131, 17166–17175. [Google Scholar] [CrossRef] [PubMed]
  24. Rincón Prat, S.; Schneider, C.; Kolb, T. Determination of active sites during gasification of biomass char with CO2 using temperature-programmed desorption. Part 2: Influence of ash components. Fuel 2020, 267, 117179. [Google Scholar] [CrossRef]
  25. Bagri, A.; Mattevi, C.; Acik, M.; Chabal, Y.J.; Chhowalla, M.; Shenoy, V.B. Structural evolution during the reduction of chemically derived graphene oxide. Nat. Chem. 2010, 2, 581–587. [Google Scholar] [CrossRef] [PubMed]
  26. Sanchez, A.; Mondragon, F. Role of the Epoxy Group in the Heterogeneous CO2 Evolution in Carbon Oxidation Reactions. J. Phys. Chem. C 2007, 111, 612–617. [Google Scholar] [CrossRef]
  27. Hall, P.J.; Calo, J.M. Secondary interactions upon thermal desorption of surface oxides from coal chars. Energy Fuels 1989, 3, 370–376. [Google Scholar] [CrossRef]
  28. Zhuang, Q.; Kyotani, T.; Tomita, A. Dynamics of Surface Oxygen Complexes during Carbon Gasification with Oxygen. Energy Fuels 1995, 9, 630–634. [Google Scholar] [CrossRef]
  29. Montoya, A.; Truong, T.T.T.; Mondragon, F.; Truong, T.N. CO Desorption from Oxygen Species on Carbonaceous Surface: 1. Effects of the Local Structure of the Active Site and the Surface Coverage. J. Phys. Chem. A 2001, 105, 6757–6764. [Google Scholar] [CrossRef]
  30. Senneca, O.; Salatino, P.; Sorrenti, R. Beneficiation of coal fly ash by oxygen chemisorption. Exp. Therm. Fluid Sci. 2012, 43, 76–81. [Google Scholar] [CrossRef]
  31. Orrego-Ruiz, J.A.; Hernandez, R.C.; Mejia-Ospino, E. Structural Study of Colombian Coal by Fourier Transform Infrared Spectroscopy Coupled to Attenuated Total Reflectance (FTIR-ATR). Rev. Mex. Física 2010, 56, 251–254. [Google Scholar]
  32. Mielczarski, J.A.; Deńca, A.; Strojek, J.W. Application of Attenuated Total Reflection Infrared Spectroscopy to the Characterization of Coal. Appl. Spectrosc. 1986, 40, 998–1004. [Google Scholar] [CrossRef]
  33. Danlami Musa, D.; Zhonghua, T.; Ibrahim, A.O.; Habib, M. China’s energy status: A critical look at fossils and renewable options. Renew. Sustain. Energ. Rev. 2018, 81, 2281–2290. [Google Scholar] [CrossRef]
  34. Cerciello, F.; Senneca, O.; Coppola, A.; Lacovig, P.; Forgione, A.; Salatino, P. The influence of temperature on the nature and stability of surface-oxides formed by oxidation of char. Renew. Sustain. Energ. Rev. 2021, 137, 110595. [Google Scholar] [CrossRef]
  35. Cerciello, F.; Coppola, A.; Lacovig, P.; Senneca, O.; Salatino, P. Characterization of surface-oxides on char under periodically changing oxidation/desorption conditions. Renew. Sustain. Energy Rev. 2021, 137, 110453. [Google Scholar] [CrossRef]
  36. Cros, A. Charging effects in X-ray photoelectron spectroscopy. J. Electron Spectros. Relat. Phenom. 1992, 59, 1–14. [Google Scholar] [CrossRef]
  37. Vereecke, G.; Paul, G.R. Surface Charging of Insulating Samples in X-ray Photoelectron Spectroscopy. Surf. Interface Anal. 1998, 26, 490–497. [Google Scholar] [CrossRef]
  38. Cabaniss, G.E.; Linton, R.W. Characterization of Surface Species on Coal Combustion Particles by X-ray Photoelectron Spectroscopy in Concert with Ion Sputtering and Thermal Desorption. Environ. Sci. Technol. 1984, 18, 271–275. [Google Scholar] [CrossRef]
  39. Sezen, H.; Suzer, S. XPS for chemical- and charge-sensitive analyses. Thin Solid Film. 2013, 534, 1–11. [Google Scholar] [CrossRef]
  40. Metson, J.B. Charge compensation and binding energy referencing in XPS analysis. Surf. Interface Anal. 1999, 27, 1069–1072. [Google Scholar] [CrossRef]
  41. Baer, D.R.; Engelhard, M.H.; Gaspar, D.J.; Lea, S.; Windisch, C.F. Use and limitations of electron flood gun control of surface potential during XPS: Two non-homogeneous sample types. Surf. Interface Anal. 2002, 33, 781–790. [Google Scholar] [CrossRef]
  42. Wagner, C.D. Studies of the charging of insulators in ESCA. J. Electron Spectros. Relat. Phenom. 1980, 18, 345–349. [Google Scholar] [CrossRef]
  43. Cazaux, J. About the charge compensation of insulating samples in XPS. J. Electron Spectros. Relat. Phenom. 2000, 113, 15–33. [Google Scholar] [CrossRef]
  44. Greczynski, G.; Lars Hultman, L. X-ray photoelectron spectroscopy: Towards reliable binding energy referencing. Prog. Mater. Sci. 2020, 107, 100591. [Google Scholar] [CrossRef]
  45. Kelly, M.A. Analysing Insulators with XPS and AES. In Surface Analysis by Auger and X-Ray Photoelectron Spectroscopy; Briggs, D., Grant, J.T., Eds.; IM Publications: Chichester, UK; SurfaceSpectra: Manchester, UK, 2003; pp. 191–210. [Google Scholar]
  46. Chen, X.; Wang, X.; Fang, D. A review on C1s XPS-spectra for some kinds of carbon materials. Fuller. Nanotub. Carbon Nanostruct. 2020, 28, 1048–1058. [Google Scholar] [CrossRef]
  47. Li, N.; Rao, F.; He, L.; Yang, S.; Bao, Y.; Huang, C.; Bao, M.; Chen, Y. Evaluation of biochar properties exposing to solar radiation: A promotion on surface activities. Chem. Eng. J. 2020, 384, 123353. [Google Scholar] [CrossRef]
  48. Baer, D.R.; Artyushkova, K.; Cohen, H.; Easton, C.D.; Engelhard, M.; Gengenbach, T.R.; Greczynski, G.; Mack, P.; Morgan, D.J.; Roberts, A. XPS guide: Charge neutralization and binding energy referencing for insulating samples. J. Vac. Sci. Technol. A 2020, 38, 031204. [Google Scholar] [CrossRef]
  49. Gorham, J.M.; Osborn, W.A.; Woodcock, J.W.; Scott, K.C.K.; Heddleston, J.M.; Walker, A.R.; Gilman, J.W. Detecting Carbon in Carbon: Exploiting Differential Charging to Obtain Information on the Chemical Identity and Spatial Location of Carbon Nanotube Aggregates in Composites by Imaging X-ray Photoelectron Spectroscopy. Carbon 2016, 96, 1208–1216. [Google Scholar] [CrossRef]
  50. Greczynski, G.; Hultman, L. Binding energy referencing in X-ray photoelectron spectroscopy. Nat. Rev. Mater. 2025, 10, 62–78. [Google Scholar] [CrossRef]
  51. Greczynski, G.; Hultman, L. Referencing to adventitious carbon in X-ray photoelectron spectroscopy: Can differential charging explain C 1s peak shifts? Appl. Surf. Sci. 2022, 606, 154855. [Google Scholar] [CrossRef]
  52. Greczynski, G.; Hultman, L. The same chemical state of carbon gives rise to two peaks in X ray photoelectron spectroscopy. Sci. Rep. 2021, 11, 11195. [Google Scholar] [CrossRef] [PubMed]
  53. Levi, G.; Causà, M.; Cortese, L.; Salatino, P.; Senneca, O. On how mild oxidation affects the structure of carbons: Comparative analysis by different techniques. Appl. Energy Combust. Sci. 2020, 1, 100006. [Google Scholar] [CrossRef]
  54. Senneca, O.; Salatino, P.; Chirone, R.; Cortese, L.; Solimene, R. Mechanochemical activation of high-carbon fly ash for enhanced carbon reburning. Proc. Comb. Inst. 2011, 33, 2743–2753. [Google Scholar] [CrossRef]
  55. Fabozzi, A.; Cerciello, F.; Senneca, O. Direct reduction of iron ore using biomass biochar: Reduction rate, microstructural and morphological analysis. Fuel 2025, 383, 133976. [Google Scholar] [CrossRef]
  56. Jitianu, A.; Cacciaguerra, T.; Benoit, R.; Delpeux, S.; Beguin, F.; Bonnamy, S. Synthesis and characterization of carbon nanotubes–TiO2 nanocomposites. Carbon 2004, 42, 1147–1151. [Google Scholar] [CrossRef]
  57. Available online: https://srdata.nist.gov/xps/ (accessed on 12 March 2023).
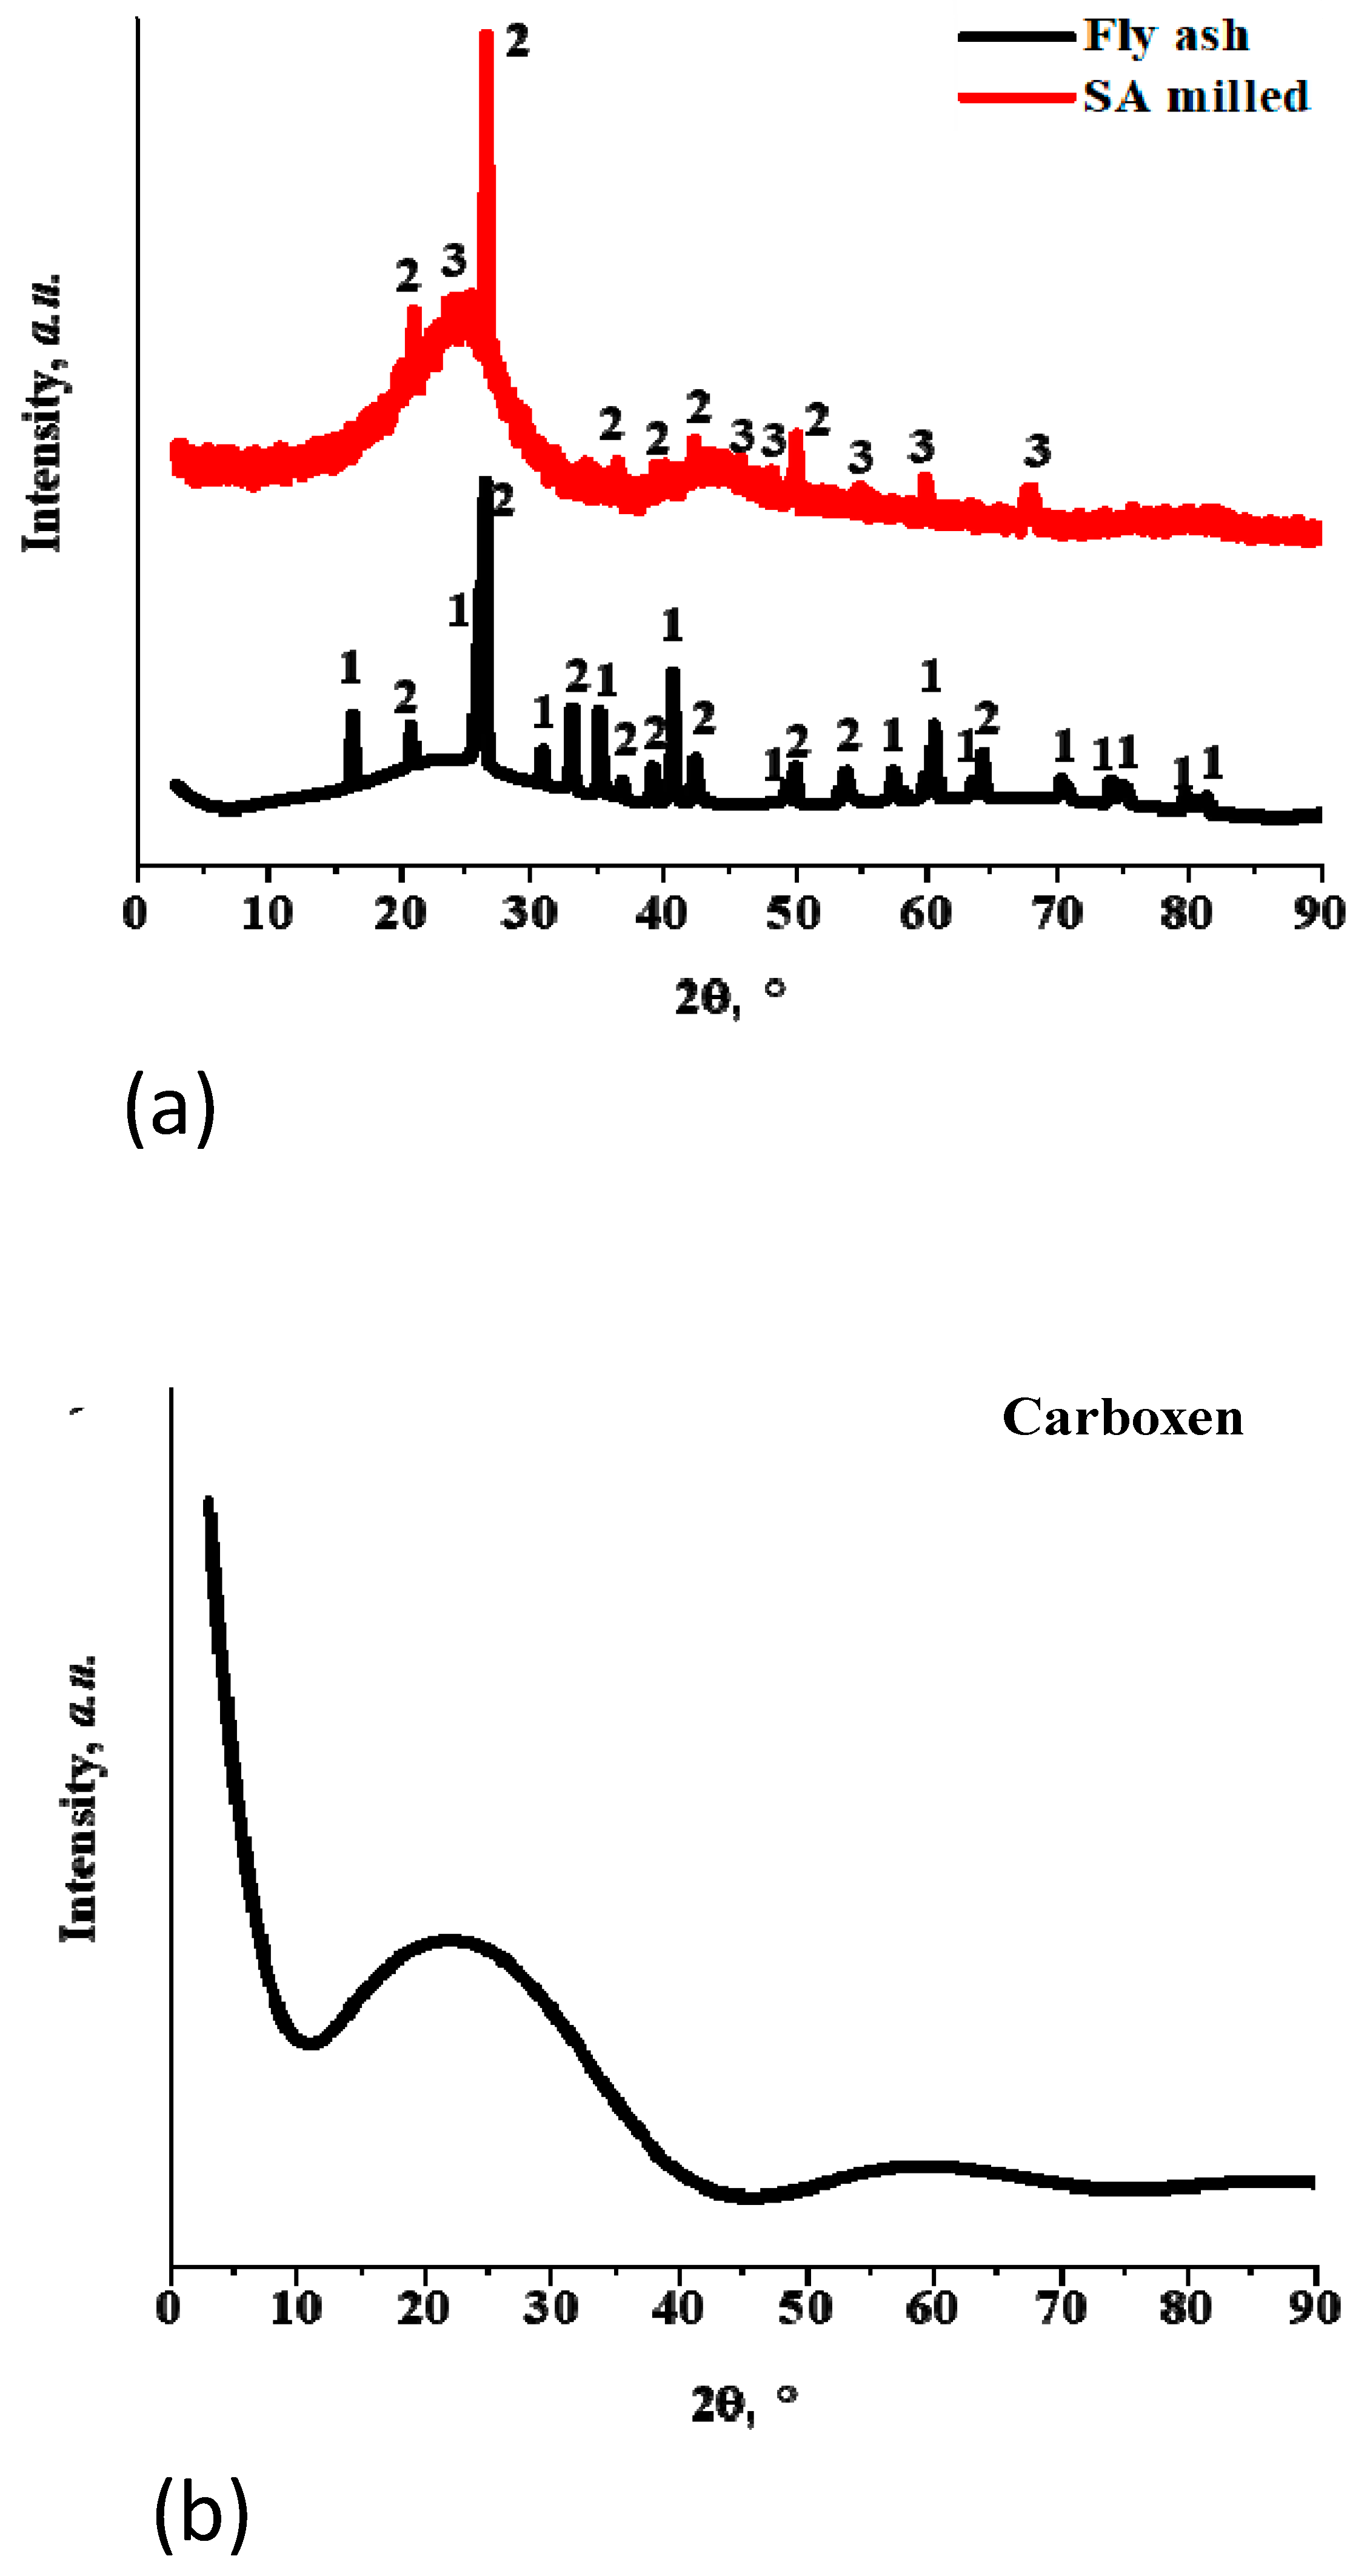
Figure 1. XRD patterns of (a) Fly ash and SA milled samples; (b) Carboxen. The crystalline phases, with ICDD codes, are indicated as follows: 1 = Al2(Al2.Si) O10, 01-074-8553; 2 = αSiO2, 01-077-1060; 3 = SiO2, 00-033-1161.
Applsci 15 02993 g001
Figure 2. (a) C1s and (b) O1s high-resolution XPS spectra obtained from the surface of oxidized Carboxen. The C1s and O1s core-level spectra were recorded at photon energies of 400 eV and 650 eV, respectively.
Applsci 15 02993 g002
Figure 3. Photoemission spectra acquired at 650 eV photon energy for the South African char oxidized at 573 K in air. (a) High-resolution spectrum of the O1s core level of milled and unmilled samples. (b) Si2p and Al2p core levels of the milled samples. (c) C1s core levels of the milled samples.
Applsci 15 02993 g003aApplsci 15 02993 g003b
Figure 4. C1s XPS spectra of (a) oxidized unmilled sample; (b) oxidized sample milled for 5 min; (c) oxidized sample milled for 30 min. C1s core-level spectra were measured at a photon energy of 400 eV.
Applsci 15 02993 g004aApplsci 15 02993 g004b
Figure 5. (a) C1s and (b) O1s XPS high-resolution XPS spectra measured on the surface of unburned SA samples. C1s and O1s core-level spectra were measured at photon energies of 400 and 650 eV, respectively.
Applsci 15 02993 g005aApplsci 15 02993 g005b
Table 1. Proximate and ultimate analysis of the Carboxen samples [15].
Ash aVolatiles aC aH aN a
(wt%)(wt%)(wt%)(wt%)(wt%)
3.05.092.00.70.1
a dry basis.
Table 2. Properties of South African coal, char, and ash.
Ash aVolatiles aCfix aC aH aN aS aVitrinite Rr
(wt%)(wt%)(wt%)(wt%)(wt%)(wt%)(wt%)(%)
Coal15.723.161.268.03.81.20.60.72
Char20.44.675.075.41.21.8n.d.n.d.
AshSiO244.1Al2O234.0CaO8.1MgO2.2
K2O0.62Na2O0.15FeO1.53MnO0.01
TiO21.41P2O52.35SO32.08Others3.45
a dry basis.
Table 3. Carbon samples and their respective thermal treatments.
SampleHeat Treatment Air
Fly ashNone
Carboxen773 K 30 min
SA unmilled573 K 2 h
SA milled 5 min573 K 2 h
SA milled 30 min573 K 2 h
Table 4. C1s and O1s binding energies (BEs) of various carbon–oxygen groups in electron volts (eV) [15].
C1sC Sp2C Sp3
C-C(O) a
C Vacancy bEther,
Carbonyl
Epoxy,
Hydroxyl
Carboxyl,
Lacton
284.3–284.5284.9–285.0283.8–284.7285.7–285.6286.3–286.0287.7–288.2
O1sepoxyether, hydroxylcarbonyl, carboxyl, lacton
532.6–532.0533.5–533.2531.1–530.7
a nearest and next-nearest neighbours to O-bonded C atoms. b C atoms surrounding a single C surface vacancy.
Disclaimer/Publisher’s Note: The statements, opinions and data contained in all publications are solely those of the individual author(s) and contributor(s) and not of MDPI and/or the editor(s). MDPI and/or the editor(s) disclaim responsibility for any injury to people or property resulting from any ideas, methods, instructions or products referred to in the content.