Featured Application
The food industry is continually looking for innovative techniques to accelerate fermentation while preserving the final products’ essential bioactivity and physical attributes. This study highlights the potential of ultrasound pre-treatment as a powerful tool to achieve these critical goals. By fine-tuning ultrasound parameters, manufacturers can significantly enhance the fermentation process, fostering the growth of lactic acid bacteria. This method not only modifies the texture and color of the products but does so without sacrificing the retention of valuable bioactive compounds. Producers can use this advanced approach to create high-quality fermented vegetable products that boast improved efficiency and consistency and enhanced nutritional value. This strategy addresses the burgeoning demand for functional, health-oriented, and minimally processed foods, ultimately paving the way for a new food production era prioritizing quality and consumer wellness.
Abstract
This study examined the influence of ultrasound pre-treatment and its parameters on the physical and chemical properties of bell peppers undergoing lactic acid fermentation. Two ultrasound methods were employed: immersion (for 15 and 30 min) and contact (for 1, 3, and 5 min). The fermentation process was carried out with the addition of Lactiplantibacillus plantarum ATTC 4080. The physicochemical and structural properties of both fresh and fermented bell peppers, including pre-treated and untreated samples, were analyzed, with untreated fresh and fermented peppers serving as control samples. The findings revealed that ultrasonic pre-treatment significantly affected the peppers’ physical, chemical, and structural characteristics. Specifically, ultrasound reduced dry matter content, with fresh bell peppers exhibiting the highest dry matter content (10.58%). Dry matter content decreased by 16–24% after ultrasound pre-treatment and by 0–14% after fermentation. The immersion method and longer sonication times had the most pronounced effects on dry matter reduction. In addition, ultrasound caused changes in color and texture, while fermentation influenced attributes such as hardness, elasticity, cohesiveness, and chewiness. The most significant changes occurred with 30 min of ultrasound treatment, leading to a 25.6% increase in red color, whereas the contact method increased yellow color, with a 30.3% increase between 15 and 30 min of immersion sonication. Fermentation generally reduced the proportion of red and yellow color compared to fresh samples, except for samples treated with contact ultrasound for 5 min, which retained higher red and yellow coloration after fermentation. Fermentation significantly softened the peppers, reducing hardness by up to 85% compared to fresh untreated samples. Chewiness followed a similar trend, decreasing from 17% to 80% in pre-treated samples and up to 90.65% after fermentation. Elasticity and cohesiveness also decreased with increasing sonication time and fermentation, but not significantly. Ultrasound pre-treatment had no significant effect on total polyphenol and carotenoid contents in fresh samples, which ranged from 43.55 mg β-carotene/100 g dry matter to 147.89 mg β-carotene/100 g dry matter. However, fermentation significantly increased carotenoid levels, with a 40% increase observed in samples treated with 5 min of contact ultrasound. In addition, pre-treatment methods helped to preserve polyphenols in fermented peppers. Levels of lactic acid bacteria (LAB) in fermented samples varied according to pre-treatment, with the highest LAB levels found in peppers exposed to immersion ultrasound for 30 min (10.55 log CFU/g). Despite ultrasound-induced tissue damage, fermentation proceeded effectively, resulting in consistent pH levels (ranging from 3.01 to 3.06) across all samples. Structural analysis showed that tissue damage increased with longer sonication times. In conclusion, ultrasonic pre-treatment significantly affected the physicochemical, structural, and bioactive properties of sweet peppers. While it reduced dry matter content and altered texture and color, it also helped to preserve polyphenols in fermented samples and increased carotenoid content after fermentation. The immersion method and longer sonication times had the most pronounced effects, highlighting ultrasound as a promising tool for modifying the properties of fermented vegetables.
1. Introduction
Food is a natural material susceptible to various physical, chemical, enzymatic, and biological changes during handling, preparation, and storage [1]. These alterations can significantly affect the food’s sensory properties and suitability for consumption. The action of microorganisms and enzymes primarily causes these changes [2]. To stabilize foodstuffs and mitigate the adverse effects of microbial and enzymatic activity, the food industry employs various preservation techniques, often in combination. Conventional methods include thermal processing, such as refrigeration, freezing, blanching, heating, drying, pasteurization, and sterilization [3]. In contrast, non-thermal food processing techniques, which operate without heat, include high pressure processes (HPP), ultrasound, cold plasma, pulsed electric fields (PEF), and supercritical carbon [4]. These innovative non-thermal technologies can be utilized to create products with specific forms and properties and are helpful in general food processing and the pre-processing of raw materials. These methods are particularly effective when mass transfer within the raw material is crucial, such as drying, pressing, extraction, or osmotic dehydration [5].
Ultrasound refers to sound waves with frequencies above 16 kHz, typically ranging from 20 kHz to 10 MHz, beyond human hearing. It propagates through elastic media, causing longitudinal displacement and creating alternating areas of compression and rarefaction [6,7]. Two standard ultrasound pre-treatment techniques are ultrasonic water baths and sonotrodes. Effective sonication requires samples to be fully immersed in a liquid medium at a typical material-to-liquid ratio of 1:4 [8,9]. This process occurs at room temperature, facilitating mass transfer between the raw material and the medium. In ultrasonic baths, transducers convert electrical energy into sound energy, generating high-intensity waves at frequencies from 20 to 40 kHz for durations of five to 30 min. The sonotrode method delivers sonic waves directly into the liquid, operating at frequencies of 20 to 24 kHz, making it more suitable for small volumes due to rapid temperature increases [8,9,10].
Ultrasound impacts vegetable quality, affecting texture, color, taste, and nutrition. For instance, Gabaldón-Leyva et al. [11] reported that ultrasound damaged cell wall structures in peppers, enhancing diffusion. Meanwhile, Pinheiro et al. [12] noted that ultrasound delayed tomato softening and improved the preservation of texture and color. Wang and Fan [13] found that sonicated green asparagus stored at 4 °C retained higher levels of total soluble solids (TSS) and vitamin C, attributed to cavitation effects on enzyme activity. Additionally, the combination of ultrasound and ultraviolet radiation increased the nutritional content in tomatoes [14]. Ultrasound pre-treatment of beetroots resulted in notable color changes without significant pigment loss [15].
Recent research has extensively explored the role of ultrasound as a pre-treatment in various food processing methods, including drying, extraction, crystallization, filtration, and freezing. However, its influence on lactic fermentation is less discussed. Recent research can enhance the growth of microorganisms during fermentation by increasing the availability of essential nutrients [7], which is attributed to cell structure modification and improved mass transfer [16,17]. Still, its effects on lactic fermentation are less explored. Ultrasound can enhance microbial growth during fermentation by improving nutrient availability and mass transfer due to cell structure modification [18]. However, it can also cause damage to microorganisms through cavitation. Hashemi et al. [19] used ultrasound (50 W, 30 kHz) on mandarin juice, finding increased L. reuteri cell counts after fermentation. The highest viable cell counts and increase in antioxidant capacity were observed after 5 min.
Interest in red bell pepper consumption is motivated mainly by the presence of bioactive compounds that act as essential antioxidants in the diet. Red bell pepper is an excellent source of vitamin C, carotenoids, and polyphenols. The phytochemical composition of peppers can be affected by various factors, including maturity, genotype, cultivation practices, processing methods, and storage conditions [20]. Red bell pepper fruits typically contain between 70 to 400 mg of vitamin C per 100 g of fresh weight, with the highest concentrations found in colored fruits and those that are overripe, although levels decrease significantly in overripe specimens [21].
In a study conducted by Zhang and Hamauzu [20], it was observed that the levels of ascorbic acid, carotenoids, and phenols varied among red, yellow, and green peppers at full fruit maturity. Red bell peppers exhibited higher levels of ascorbic acid than green and yellow peppers. Additionally, red and yellow peppers showed higher carotenoid content than green peppers. Among the varieties, the red sweet red bell pepper, Slonovo uvo, exhibited the highest vitamin C and polyphenol content, with 204 mg/100 g and 202.6 mg GAE/100 g, respectively. The characteristic flavor of peppers is attributed to capsaicin, which is present in both sweet and hot varieties, although hot varieties contain higher levels of it. The red coloration of ripe peppers is due to carotenoid pigments such as capsanthin, capsorubin, cryptoxanthin, zeaxanthin, or β-carotene. The intensity of the red color primarily depends on the amount of the pigments capsanthin and capsorubin, which account for 30–60% and 6–18% of the total carotenoid content, respectively. Research shows that most vegetables can undergo lacto-fermentation due to their natural sugar content. Red bell peppers, recognized for their outstanding nutritional benefits, present an up-and-coming candidate for this process [22,23].
This study aimed to assess the effects of the non-thermal pre-treatment method on the red bell pepper fermentation process. Two different types of ultrasound methods were used: ultrasound by immersion and ultrasound with sonotrode. Different times for the application of US were tested too. The research examined the physical and chemical properties of red bell peppers, including dry matter content, color, polyphenol content, antioxidant activity, carotenoid content, texture, and structure, both before and after the ultrasound pre-treatment. In the final phase, this study included fermentation with the lactic acid bacterial strain Lactiplantibacillus plantarum ATCC 4080, assessing the properties, pH, and lactic acid bacteria counts in the fermented product.
The following research hypotheses were tested:
- The application of ultrasound pre-treatment, varying in duration and method, significantly affects the lactic acid fermentation process of red bell peppers inoculated with a single bacterial strain.
- Ultrasound pre-treatment induces measurable changes in red bell peppers’ physical and chemical properties, including carotenoid and polyphenol content, texture, dry matter, pH, color, and internal structure.
2. Materials and Methods
2.1. Chemical Reagents
For the extraction of bioactive compounds, as well as the determination of polyphenol and carotenoid content and antioxidant activity, the following chemical reagents were used: Folin–Ciocalteu reagent, anhydrous sodium carbonate, potassium ferricyanide, trichloroacetic acid, ABTS (2,2′-azino-bis(3-ethylbenzothiazoline-6-sulfonic acid)), and potassium persulfate, 2,2-diphenyl-1-picrylhydrazyl (DPPH). Trolox and chlorogenic acid were from Sigma-Aldrich (St. Louis, MO, USA). Ethanol (96% v/v), methanol, ferric chloride, petroleum ether, and acetone were obtained from VWR Chemicals (Darmstadt, Germany). All reagents used were of analytical grade, chlorogenic acid-certified reference material.
2.2. Material
The research material included red bell pepper fruits Capsicum annuum (var. California Wonder) sourced from a local market in Warsaw, Poland. Fruits of comparable dimensions, color, and degree of maturation were selected for the investigation. Before analysis, the peppers were stored under refrigeration (10 °C, relative humidity 95%) for one day. Used as a starter culture, the Lactiplantibacillus plantarum strain ATTC 4080 was obtained from the American Type Culture Collection (Manassas, VA, USA).
2.3. Preparation of the Test Material
Seed nests, defects, and green parts were removed from each fruit, constituting a marginal portion of the test material. The material was then cut into pieces of approximately 3 × 4 cm.
2.3.1. Application of Ultrasound
- Ultrasonic washer—immersion method
About 50 g of cut red bell pepper rectangles were placed in the chamber of an ultrasonic cleaner with a power of 300 W, a frequency of 21 kHz, and dimensions of 25 × 15 × 10 cm (MKD-3, MKD Ultrasonic, Warsaw, Poland), and were flooded with tap water in a ratio of 1:4 at a temperature of about 21 °C. Sonication was performed for 15 or 30 min. After the set time, the tube was gently dried on filter paper.
- Sonotrode—contact method
The material was placed in a glass beaker and poured over tap water in a ratio of 1:4. The H22L2D sonotrode stylus (Hielsher, Berlin, Germany) was immersed in the solution to a depth of 4 cm. Sonication was performed with a UP400S at 400 W and a frequency of 24 kHz, with an amplitude of 100%. Treatments were carried out for 1, 3, and 5 min.
2.3.2. Fermentation
Approximately 200 g of the material (cut red bell pepper with or without pre-treatment) was placed in clean jars, then flooded with the previously prepared brine (1% salt solution) and inoculated with Lactiplantibacillus plantarum strain ATTC 4080 (1% v/v). The brine contained 1 × 10⁸ CFU/cm3. Fresh and pre-treated peppers were fermented (Table 1). The process was carried out at a constant temperature of 26 °C for 7 days. The fermentation process was carried out for each treatment in two independent repetitions.

Table 1.
Sample codes.
The additional symbol _F appears in this paper to indicate that the sample has undergone lactic acid fermentation. For example, US_15_F indicates a fermented sample previously subjected to 15 min of immersion sonication.
2.4. Methods of Analysis
This study involved the determination of dry matter content, color, total polyphenol content (TPC), antioxidant activity—using the ferric ion reduction method, DPPH, and ABTS assays—carotenoid content, and textural parameters such as hardness, elasticity, cohesion, and chewiness in fresh, treated, and post-fermented materials. The pH and the population of lactic acid bacteria in the fermented material were also analyzed. Structural studies were conducted using scanning electron microscopy (SEM), computed tomography (µCT), and FT-IR and TGA thermogravimetric spectra analysis.
2.4.1. Determination of Lactic Acid Bacteria Count
In total, 10 g of post-fermentation material were collected and transferred to bags. Then, 90 cm3 of saline solution was added and the mixture was homogenized using a Stomacher 400 Circulator (Seward Ltd., London, UK) at 230 rpm for 30 s. Subsequently, decimal dilutions were prepared, and deep cultures were performed on Man Rogosa and Sharpe Agar (MRS, Biomaxima, Lublin, Poland). Afterward, the plates were incubated at 30 °C for 48 h. The resulting colonies were counted (ProtoCOL 3—Automatic colony counting and zone measuring, Synbiosis, Cambridge, UK), and the findings were converted to CFU/g and log CFU/g.
2.4.2. Determination of Dry Matter Content
In each testing phase, the material was processed in an analytical grinder (IKA A11 basic, IKA Werke GmbH & Co. KG, Staufen, Germany). Approximately 2 g of samples were placed into pre-dried and weighed glass weighing dishes. These vessels were then dried in a vacuum dryer (Memmert VO400, Schwabach, Germany) at 75 °C for 24 h under a reduced pressure of 10 mPa [24]. The percentage of dry matter was calculated based on the weight loss of the samples after the drying period. This determination was conducted twice for each sample type.
2.4.3. Determination of pH
The pH levels were assessed in the experiment by placing a pH meter electrode (Mettler Toledo s210-SevenCompact, Zurich, Switzerland) directly into the brine containing fermented cut red bell pepper samples. Three replicates were made for each sample.
2.4.4. Determination of Color Parameters
The samples underwent color testing using a Konica Minolta (Konica Minolta Sensing Inc., Osaka, Japan) colorimeter, which employed the CIE L*a*b* reflectance method with the following parameters: light source D65, angle 2 degrees C. Before measurement, the instrument was calibrated in black and white. Each sample (skin and flesh separately) was measured four times, and the average of the results was computed.
2.4.5. Determination of Total Polyphenols in TPC
The material was ground using an analytical mill (IKA A11 basic; IKA-Werke GmbH, Staufen, Germany). Approximately 3 g of the sample was placed in a test tube, and 10 mL of extraction solution (80% ethanol) was added. The extraction process was carried out using a shaker (Multi Reax, Heidolph Instruments, Schwabach, Germany) for 12 h at room temperature with limited light exposure. After extraction, the samples were centrifuged for 2 min at 3000 rpm using a laboratory centrifuge (MegaStar 600, VWR, Leuven, Belgium). The obtained supernatant was carefully transferred into 0.2 mL PCR tubes. The extracts were analyzed for polyphenol content and antioxidant activity. The material was finely ground using an analytical mill (IKA A11 basic; IKA-Werke GmbH, Staufen, Germany). Approximately 3 g of the material and 10 mL of extraction reagent (80% ethanol) were combined in a tube. The extraction process occurred on a shaker (Multi Reax, Heidolph Instruments, Schwabach, Germany) for 12 h at room temperature with limited light exposure. The solution was centrifuged for 2 min at 3000 rpm using a laboratory centrifuge (MegaStar 600, VWR, Leuven, Belgium). The resulting supernatant was carefully transferred to 0.2 mL PCR tubes. The solutions were then analyzed for polyphenol content and antioxidant activity.
The total content of polyphenolic compounds was determined spectrophotometrically using the Folin–Ciocalteu reagent according to the method of Singleton and Rossi [25]. Next, 10 µL of ethanolic extract and 10 µL of distilled water were added to 96-well plates. Then, 40 µL of 5-fold diluted Folin’s reagent was added and mixed and, after 3 min of reaction, 250 µL of 7% sodium carbonate solution was added. Incubation was performed for 60 min in the dark at room temperature. Absorbance was measured using a plate reader (Multiskan Sky, Thermo Electron Co., Waltham, MA, USA) at 750 nm. An extracting reagent instead of a sample was used in a blank sample. The analysis was carried out in duplicate for each sample extract. The quantitative content of total polyphenols was plotted against a calibration curve for chlorogenic acid in the range 0–100 µg/mL. The results are expressed as mg chlorogenic acid per 100 g dry weight of the sample.
2.4.6. Determination of Antiradical Activity
Spectrophotometric methods were used to evaluate the antioxidant properties of the samples, consisting of the determination of the ability to reduce Fe3+ ions (RP), the 2,2-diphenyl-1-picrylhydrazyl radical (DPPH), and the cationic radical 2,2-azynobis(3-ethylbenzothiazoline-6-sulfonate) (ABTS).
- Iron ion reduction method
The iron reduction was tested following the Świeca [26] method with minor modifications. For the assay, 25 µL of extract, 75 µL of distilled water, and 50 µL of a 1% potassium ferricyanide solution were added to a 96-well microplate. This mixture was then incubated (INCU-Line ILS 10; VWR, Radnor, PA, USA) in the dark at 50 °C for 20 min. After incubation, 50 µL of 10% trichloroacetic acid solution was added. Subsequently, 100 µL of the solution was transferred to a new well, and 100 µL of distilled water and 20 µL of a 0.1% ferric chloride solution were added. After mixing for 10 min, absorbance values were measured at 700 nm against a reagent sample. The ferric ion reduction power was quantified in mg Trolox, and the assay was duplicated.
- DPPH and ABTS method
Stock solutions of DPPH and ABTS radicals were prepared 24 h before the analysis. For the DPPH solution, 25 mg of 2,2-diphenyl-1-picrylhydrazyl was accurately weighed and transferred into a 100 mL volumetric flask, which was then filled to the mark with a 99% methanol solution. The ABTS stock solution was prepared by dissolving 38.4 mg of 2,2-azino-bis(3-ethylbenzothiazoline-6-sulfonic acid) and 6.6 mg of potassium persulfate in 10 mL of distilled water. Both solutions were stored under refrigeration until further use. Before conducting the analysis, the stock solutions were diluted with 80% ethanol to obtain working solutions with an absorbance of approximately 0.7 AU (absorbance unit) in a 1 cm cuvette, measured at 515 nm for DPPH and 734 nm for ABTS. The reactions were carried out in 96-well plates, as detailed by Kowalska et al. [27] The analyte solution was diluted 5-fold. Ten µL of extract and 250 µL of radical solution were mixed in the wells. Absorbance was measured for DPPH after 10 min at 515 nm and for ABTS after 6 min at 734 nm using 80% ethanol as a blank. The antiradical activity was calculated from the decrease in the absorbance of the radical solution in the presence of the antioxidant and expressed as mg Trolox/g dry matter. Each extract was tested in duplicate.
2.5. Total Carotenoid Content
A modified method of carotenoid content measurement in red bell pepper tissues was used [28,29]. Each sample was analyzed in triplicate using spectrophotometric measurement. The analysis involved weighing 0.2 g of ground material, and the absorbance of the colored solutions was measured at 450 nm using a Spectronic 200 spectrophotometer from Thermo Fisher Scientific Inc., Waltham, MA, USA. The total carotenoid content (TCC) was calculated using the following Equation (1):
where:
- A450—absorbance;
- m2—mass of total extract (g);
- —extinction coefficient of β-carotene in petroleum ether (value 4);
- m1—sample mass (g);
- d.m.—dry substance specific for each sample (-).
Texture Determination
The textural properties of both the raw and fermented samples were analyzed using texture profile analysis (TPA) with a TA.XT2i texture analyzer (Stable Micro Systems, Surrey, UK) [30]. Cylindrical samples (5 mm height, 5 mm diameter) underwent 2 compression cycles using a 75 mm piston, with a 5 s interval between cycles. A 5 kg force sensor and a speed of 0.5 mm/s were used for ten repetitions, calculating hardness, elasticity, cohesion, and chewability.
2.6. Internal Structure
The materials were freeze-dried to examine their internal structure. They were first frozen at −40 °C for 4 h (Shock Freezer HCM 51.20, Irinox, Treviso, Italy) and then transferred to a freeze-dryer at 20 °C and 0.630 bar (Gamma 1-16 LSC, Martin Christ Gefriertrocknungsanlagen GmbH, Osterode am Harz, Germany). After the process, the material was sealed in light- and air-barrier aluminum bags (PET12/Al8/PE100).
- Scanning Electron Microscopy SEM
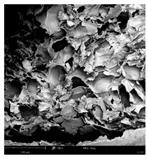
The dried material was placed on a double sticky tape, and a layer with 5 mm of gold was added (Leica EM ACE200; Leica Mikrosysteme GmbH, Vienna, Austria). Observations were made using a Phenom XL scanning electron microscope (Thermo Fisher Scientific, Waltham, MA, USA) at an accelerating voltage of 10 kV and a vacuum of 10 Pa. For each sample, at least four images were taken at 150× magnification.
- µCT microtomography
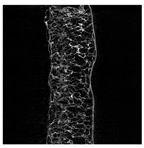
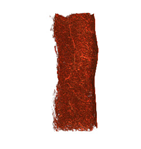
Images of the internal structure of the pepper were captured using a Skyscan 1272 computerized microtomography system (Bruker, Kontich, Belgium) [31]. The material, measuring approximately 2 × 5 cm, was affixed to a stage with a diameter of 25 mm. Scanning was performed at a source voltage of 40 kV, a current of 193 µA, with rotation steps of 0.3° across a 180° arc, and a resolution of 25 µm. The raw images were binarized within the range of 25–755 using CTAn software (Bruker, Kontich, Belgium). A cross-sectional image from the central part of the sample was selected to illustrate the internal structure. For the reconstruction of 2D images into 3D representations, NRecon software (Bruker, Kontich, Belgium) was used.
2.7. FT-IR Spectra
Spectral analysis was performed using a Cary 630 spectrometer (Agilent Technologies Inc., Santa Clara, CA, USA) equipped with an ATR system. Approximately 1 g of ground dried material was applied to the measurement window and pressed against the crystal surface. Spectra were recorded in the wave number range of 650–4000 cm−1. The analysis was conducted with a resolution of 4 cm−1, and 32 scans were performed per sample [31]. The background spectrum was collected before each sample analysis. The recorded spectra were processed using MicroLab PC 5.7 software (Agilent Technologies Inc., Santa Clara, CA, USA). The analyses were carried out in triplicate.
2.8. TGA—Thermogravimetric Analysis
Analysis was performed using a TGA thermogravimeter (TGA/DSC 3+, Mettler Toledo, Greifensee, Switzerland) to determine the thermal stability and degradation of the drought [31,32]. The sample (approximately 7–8 mg) was heated at 5 °C per minute from 30 to 600 °C in a nitrogen atmosphere (N2 flow rate was 50 mL per minute). TGA and DTG curves were recorded and analyzed. Decomposition zones and maximum transformation temperatures were determined. Two measurements were carried out for each sample.
2.9. Statistical Methods
The results in graphs and tables represent the means and standard deviations, with each measurement based on a minimum of 3 replicates. Statistical analysis was conducted using Statistica v 13.3 (Statsoft Polska Sp. Z.o.o., Poland, Warsaw). Tukey’s test was used to compare means and establish homogeneous groups at a significance level of α = 0.05. In the graphs, means marked with different symbols indicate statistically significant differences, while means marked with the same symbol form homogeneous groups.
3. Results and Discussion
3.1. The Effect of Pepper Pre-Treatment on the Count of LAB After Fermentation
In all fermented samples, an increase in the number of lactic acid bacteria was observed, which indicates that the fermentation process had taken place (Figure 1). The count of lactic acid bacteria ranged from 8.73 log CFU/g for the sample not treated with ultrasound to 10.55 log CFU/g for the sample pre-treated with ultrasound in a water bath. In the case of ultrasound generated using a sonotrode, no effect of pre-treatment time on the differences in the count of microorganisms was observed (ranging from 9.53 to 9.57 log CFU/g). However, after using ultrasound in a water bath for a longer time, an increase of about 1 logarithmic cycle in the count of microorganisms was observed in the fermented samples (ranging from 9.74 to 10.55 log CFU/g). This may indicate a greater efficiency at loosening the plant tissue, which allows microorganisms to penetrate inside this tissue.
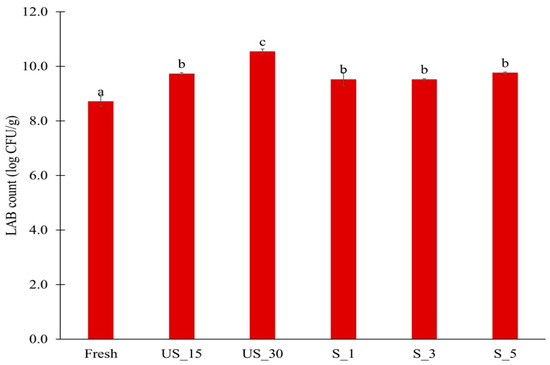
Figure 1.
Number of lactic acid bacteria in fermented peppers after 7 days of fermentation. Different letters indicate statistically significant differences according to Tukey’s test at α = 0.05. Sample codes are described in Table 1.
Using starter cultures enhances the likelihood of proper microbial development during fermentation, resulting in products with desirable sensory characteristics and consistent quality. The count of lactic acid bacteria indicates a successful lactic acid fermentation process [33]. Additionally, this count is inversely related to undesirable microorganisms in fermented products, such as pathogenic and saprophytic microorganisms, that can be transmitted through water and food. This relationship occurs because the pH of the product decreases during fermentation, inhibiting the growth of other microorganisms [34].
In other studies, ultrasound was used after the inoculation of Citrus reticulata cv. Bakraei juice with Limosilactobacillus reuteri bacteria. A positive effect on the number of LAB was observed after the application of ultrasound for up to 5 min, while extending this process to 6 min resulted in a reduction of the number of L. reuterii [19]. In turn, ultrasound pre-treatment of pumpkin increased the number of Lacticaseibacillus rhamnosus GG bacteria during the fermentation process compared to the untreated raw material by about 1 logarithmic cycle, but did not significantly increase the number of Lactiplantibacillus plantarum 299v [7]. The increase in the number of L. plantarum in this study after ultrasound treatment may be due to the different chemical compositions of pumpkin and pepper and the use of a different strain of these microorganisms. Liu et al. indicated that using ultrasound may damage the cell membrane and release nutrients, contributing to the increased growth of LAB [35].
3.2. Physical Properties of Bell Pepper Samples
The dry matter content in vegetables is a crucial factor influencing quality, storability, and nutritional value. High water content in plants can reduce the concentration of essential nutrients such as sugars, proteins, and fats, ultimately affecting their dietary value. Additionally, increased water content can promote the growth of microorganisms, further diminishing the raw material’s shelf life. The dry matter content in fresh vegetables typically ranges from 5% to 25%, with values varying based on species, cultivation conditions, and technological processing parameters [36,37].
Studies on bell peppers have shown that the dry matter content in the examined fruits ranges from 4.80% to 10.58% (Table 2). Fresh bell peppers displayed the highest dry matter content at 10.58%. Samples that underwent ultrasonic treatment showed a reduction in dry matter content, ranging from 16–24% before fermentation and 0–14% after fermentation. The dry matter values in these treated samples ranged from 8.03% (for peppers treated with ultrasonic immersion for 15 min) to 8.18% (for peppers not subjected to any treatment). The lowest dry matter content was observed in fermented samples, which ranged from 4.80% (for peppers treated with ultrasound for 30 min) to 5.60%. The dry matter content in bell peppers depended on the type of treatment and its parameters. The impact of ultrasonic treatment on dry matter content was significant, particularly with longer treatment durations.

Table 2.
Selected physical properties of bell pepper before and after fermentation.
In the context of contact ultrasonic methods, an increase in treatment duration decreased dry matter content, with values ranging from 8.90% after 1 min to 8.18% after 5 min. Fermentation also substantially influenced dry matter content, especially in contact methods like sonication. Notably, samples that underwent sonication using the contact method for three minutes exhibited a dry matter content that was 12.59% lower than those that received five minutes of sonication (Table 2).
It is hypothesized that physical phenomena such as cavitation may play a role in reducing dry matter content in bell peppers subjected to ultrasonic treatment. These processes contribute to tissue disintegration, the formation of microflows, and the leakage of mineral components into the surrounding medium [36,38].
The reduction in dry matter content of samples treated with ultrasound or pulsed electric fields can be attributed to cavitation and electropermeabilization. These phenomena trigger various physical processes that affect tissue breakdown, the formation of microfluidic structures and, ultimately, the release of minerals into the environment. This effect has been previously documented by Kobus [39], who observed that ultrasonic treatment of carrot pulp increased the dry matter content of the juice, indicating a leaching of dry matter from the pulp. The extent of the decrease in dry matter content of the pulp was found to depend on the intensity and duration of the treatment, with higher reductions occurring at higher intensity and longer treatment times. Similarly, a decline in the dry matter content of fermented broccoli, carrots, and peppers was reported by Kiczorowski et al. [40]. In the case of fresh peppers, the dry matter content was recorded at 14.82%, which decreased to 12.67% following fermentation.
The factors influencing consumer acceptance of food are crucial, encompassing aspects such as color, taste, texture, and nutritional value. pH levels significantly impact pigments like carotenoids, chlorophyll, and anthocyanins, which contribute to the coloration of vegetables. Moreover, pH affects texture and overall shelf life. During food processing, pH plays a vital role in protein denaturation, enzymatic activity, and the growth and survival of microorganisms. Therefore, a thorough understanding of pH is essential for ensuring the safety and quality of food products [41]. Fresh red bell peppers typically have a pH of around 5.2. However, this pH level tends to increase over time, often accompanied by visible signs of spoilage [42]. Lactic fermentation has been demonstrated to gradually lower fermented vegetables’ pH [43]. The pH levels indicate the optimal endpoint of fermentation (pH ≤ 3.9) and reflect the effectiveness of the fermentation process.
After seven days of lactic fermentation, the pH levels in the bell pepper samples ranged from 3.01 (S_5) to 3.06 (S_1 and S_3), signifying adequate fermentation and the completion of the process (Table 2). No significant differences in pH were observed between samples subjected to varying levels of ultrasound and those that received no treatment. Furthermore, no correlation was found between the nature of the pre-treatment, the parameters used, and pH, as the variations in pH were negligible.
- Color
The color of vegetables, especially peppers, is a key quality characteristic for consumers, determined by bioactive compounds such as chlorophyll, anthocyanins, and carotenoids. The skin of the pepper, particularly its cuticle, differs in color from the flesh; therefore, color was measured separately for the top and bottom of each sample [44,45].
Following ultrasound treatments, the majority of samples exhibited enhanced brightness (L*) and a more pronounced red hue (a*), accompanied by a decrease in yellow coloration (b*). This phenomenon was noted in the top and bottom measurements of a* and b* (Figure 2). The peak brightness was observed after 15 min of ultrasound immersion. The effects on skin color vary based on the methods and parameters employed. Notably, a 30 min ultrasound treatment resulted in an approximate 25.6% increase in red coloration, while the contact ultrasound method led to an elevation in yellow color. Extending the sonication duration from 15 to 30 min resulted in a 30.3% rise in yellow color. In contrast, the contact method, with a duration extension from 1 to 5 min, caused a reduction of about 13.1% in yellow coloration.
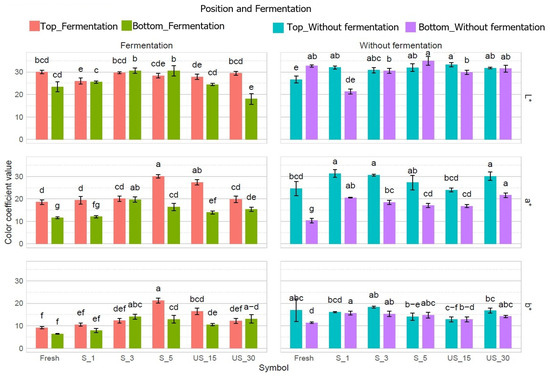
Figure 2.
Differences in color coefficients after pre-treatment and fermentation of bell pepper. Different letters indicate significant differences according to Tukey’s test at α = 0.05 for each parameter separately.
Lactic acid fermentation resulted in a modest increase in brightness but led to a significant reduction in red and yellow color compared to fresh samples (Figure 2). After fermentation, skin brightness showed a slight improvement in most samples, while the proportions of red and yellow decreased notably compared to unfermented peppers without pre-treatment. An exception was noted for the pepper subjected to a 5 min contact ultrasound treatment, which exhibited a significant increase in red and yellow color post-fermentation, achieving the highest yellow color proportion among all samples.
All pre-treated and fermented samples exhibited higher levels of red and yellow coloration in the skin than untreated, fermented peppers. Notably, increasing the duration of immersion sonication from 15 to 30 min led to a significant reduction in the proportions of red and yellow colors, decreasing by approximately 27.6% and 25.8%, respectively. In contrast, extending contact sonication from 1 to 5 min increased the proportions of red and yellow colors by about 54.8% and 101.6%, respectively (Figure 2).
An analysis of the color in the lower layer revealed that ultrasound treatment slightly decreased brightness (L*) across most samples. In contrast, the proportions of red (a*) and yellow (b*) increased significantly compared to untreated peppers. The treatment parameters had a notable effect on the red coloration in the flesh. Specifically, extending the immersion sonication time from 15 to 30 min led to a 29.1% increase in red color, with the highest concentration of red observed in the latter sample. In the contact method, the sample that was sonicated for 5 min exhibited a significantly lower red proportion than the sample for just 1 min.
After lactic fermentation, noticeable color differences appeared. Ultrasound treatment significantly increased the proportion of red color in the fermented samples compared to the untreated peppers. However, there were no significant differences in the red color of the flesh of the fermented peppers, regardless of the pre-treatment parameters, compared to the unfermented and untreated samples.
The pre-treatment methods, their specific parameters, and the subsequent fermentation process significantly impacted the coloration of the studied pepper fruits. This finding is supported by existing scientific literature. Notably, Nowacka and Wedzik [46] demonstrated considerable changes in carrot color through experiments that employed ultrasound as a pre-treatment. They identified sonication time as a crucial factor; while ultrasound application for 10 or 20 min resulted in only slight color changes in carrots, extending the treatment to 30 min led to marked differences, irrespective of the ultrasound frequency. Prolonged sonication was associated with decreased brightness and lower values of the a* and b* parameters compared to raw carrots. Similarly, Janiszewska-Turak, Hornowska, Pobiega, Gniewosz, and Witrowa-Rajchert [43] reported that the brightness of pepper skin remained unchanged post-fermentation, although the proportion of red color diminished while the yellow color increased. In the case of the lower portion of the red peppers, brightness decreased after fermentation, and both red and yellow color proportions increased. Correspondingly, similar patterns were observed in the current study regarding the proportion of red color in peppers following fermentation.
3.3. Texture of Bell Pepper Samples
The texture is a sensory and functional expression of food’s structural, mechanical, and surface characteristics, as perceived through human senses. Texture is a multidimensional sensory property that can only be detected by humans, encompassing attributes such as crispness and chewiness. It arises from the food’s molecular, microscopic, and macroscopic structures and is primarily perceived through touch and pressure [47,48].
Texture analysis (TPA) simulates the chewing process, providing insights into essential texture attributes such as hardness, elasticity, cohesiveness, and chewiness. During TPA tests, samples are compressed between flat plates. Hardness refers to the force needed to compress the sample, elasticity describes the material’s ability to return to its original shape after compression, cohesiveness indicates how much the material can be deformed before breaking, and chewiness is the energy required to reduce solid food to a swallow able form [49].
The hardness of the red bell pepper ranged from 9.67N (S_1_F—after fermentation) to 36.26N (fresh) (Figure 3a). The hardness of most sonicated samples remained similar to that of fresh red bell pepper, except for (US_15) and (S_3), where hardness decreased by 16.66% and 22.06%, respectively. Statistically significant differences in hardness were found between the treatment methods, but the parameters within each technique did not affect this texture attribute.
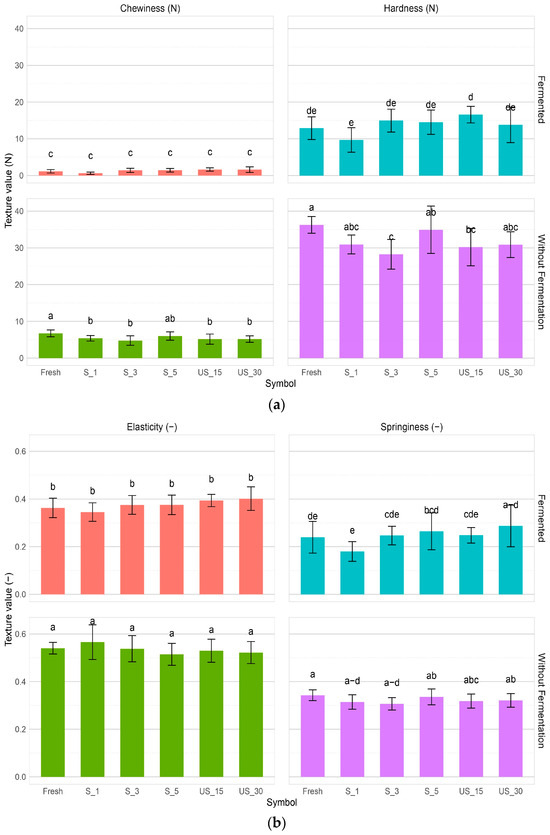
Figure 3.
Different texture determinants correlated with US pre-treatment and fermentation process. (a) Chewiness and hardness, (b) elasticity and springiness. Different letters indicate statistically significant differences according to Tukey’s test at α = 0.05 for each parameter separately.
The results show that both fresh red bell pepper and those subjected to sonication required significantly more force than fermented red bell pepper, indicating that fermentation softens the product. After fermentation, the hardness decreased from 27 (US_30_F) to 85% (Fresh_F) compared to fresh non-treated red bell pepper. Pre-fermentation treatments did not differ significantly in use.
Chewiness ranged from 1.14 (Fresh_F) to 6.74N (Fresh) (Figure 3a). A significant decrease in chewiness was observed between the fresh control and pre-treated samples, from 17% (S_5) to 80% (S_1). Statistically significant differences were found between treatments, with PEF-treated samples showing significantly lower chewiness than sonicated samples, similar to the trend observed for hardness. Fermentation caused a significant reduction in chewiness, even to 90.65% (S_1), compared to fresh bell pepper. A huge decrease in chewiness was observed when the pre-treated samples were compared with their post-fermentation counterparts. However, no statistically significant changes were observed between samples after fermentation and pre-treatment.
Elasticity in bell pepper ranged from 34.52% (S_1_F—after fermentation) to 56.56% (S_1) (Figure 3b). No significant differences were found between the fresh control and pre-treatment samples before fermentation. As sonication time increased from 15 to 30 min for the immersion method and from 1 to 5 min for the contact method, elasticity decreased by 1.89% and 10.53%, respectively. However, a decreasing trend in elasticity was observed with increasing sonication time, though not statistically significant. Fermentation led to a significant reduction in elasticity, from 25% (US_30_F) to 36% (S_1_F) compared to fresh bell pepper sample.
Springiness ranged from 0.18 (S_1_F so after fermentation) to 0.34 (Fresh and S_5) (Figure 3b). No significant differences in cohesiveness were observed between the fresh control and pre-treated samples. Most pre-treated samples showed decreased cohesiveness, except for (S_5). The drop in cohesiveness suggests that treatments such as sonication reduce the firmness of the bell pepper tissue [44,50].
Fermentation led to a significant decrease in springiness, ranging from 16% (US_15_F) to 47% (S_1_F) compared to the fresh sample. Pre-fermented samples subjected to sonication exhibited higher springiness than the control, though not statistically significant.
Similar trends for hardness and cohesiveness were observed for fresh red bell peppers in studies by Janiszewska-Turak, Witrowa-Rajchert, Rybak, Rolof, Pobiega, Woźniak, and Gramza-Michałowska [30]. However, they reported lower elasticity and chewiness values, which could relate to the raw material used. Guiné and Barroca [51] found higher elasticity and similar chewiness in green bell peppers compared to this study. Research on the effects of sonication on vegetable texture is limited. Studies on sweet potatoes treated with ultrasound showed no significant changes in firmness compared to untreated samples, likely due to water filling the empty cell spaces [52]. Similarly, most samples in this study did not show significant changes in firmness after sonication.
3.4. Structure of the Bell Pepper Samples
The internal structure of plant material is a critical factor influencing tissue appearance and structural properties, such as shrinkage and porosity. These characteristics significantly affect processes like water diffusion during various biological activities. The structure is shaped by processing methods, including freezing, drying, ultrasound treatment, pulsed electric fields, and fermentation [30,46,53].
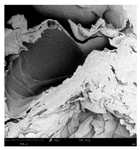
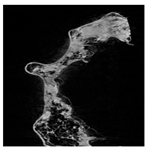
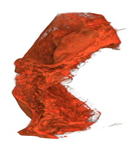
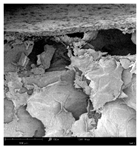
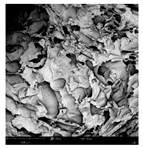
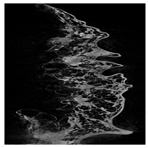
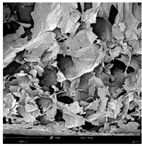
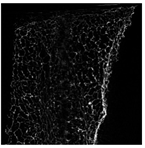
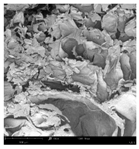
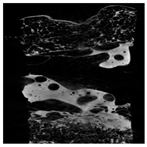
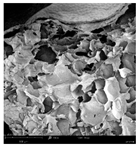
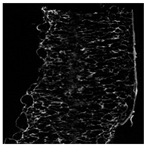
The microstructure of pepper samples was analyzed using scanning electron microscopy (SEM) and µCT microtomography, revealing notable differences in internal structures.
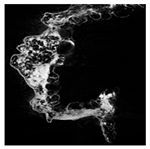
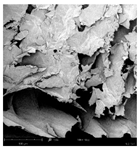
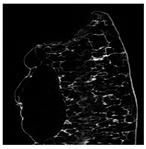
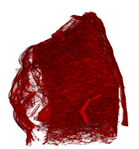
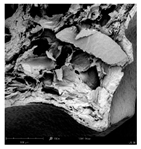
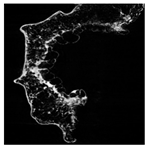
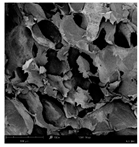
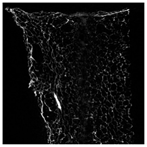
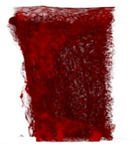
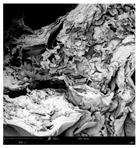
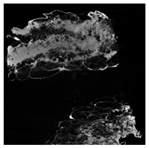
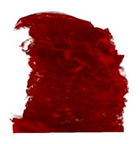
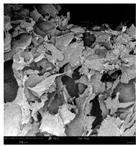
Cross-sectional images obtained via SEM and two- and three-dimensional µCT microtomography (Table 3) illustrated significant structural changes. Fresh, untreated peppers displayed a closed, homogeneous texture with few small pores. In contrast, peppers subjected to ultrasound treatment exhibited damaged tissue structures, including more shrinkage and numerous large, irregularly shaped pores forming open spaces. The extent of the tissue damage increased with longer sonication times for both immersion and contact methods, particularly in sample S_5.

Table 3.
Structure of the samples. Photography from scanning microscope and micro-tomography.
Control samples showed reduced uniformity, with larger pores forming open spaces. Pores were also visible on the peel, and the tissue had a shredded appearance. Fermented samples with pre-treatment showed greater damage than the control fermented sample, characterized by ruptured pore boundaries and larger open spaces. The degree of tissue damage correlated with pre-treatment methods and parameters. Longer sonication times or higher pulsed electric field energy exacerbated tissue damage.
Similar findings were reported by Nowacka and Wedzik [46], where carrot tissue subjected to ultrasound showed greater damage than untreated samples. Larger pores formed, and damage increased with longer sonication times, regardless of ultrasound frequency. The cavitation effect likely caused these changes, creating microscopic channels that evolved into interconnected pores. Ultrasound-induced structural changes could influence polyphenol content, carotenoids, and color.
Janiszewska-Turak et al. [54] observed that fermentation relaxed the tissue structure in vegetables such as beetroot, carrot, and red pepper, irrespective of raw material type. Fermentation also caused discrepancies in cell size, possibly due to saltwater migration into tissues. Large voids were observed within the tissue post-fermentation, reflecting significant structural alterations.
- Thermal properties
Thermogravimetric analysis (TGA) is a method used to evaluate the thermal stability of materials and the integrity of cell wall-forming polymers in plant tissues [55]. TGA measures the weight loss of a sample during heating, which is depicted on a TGA curve. In contrast, the differential thermogravimetric (DTG) curve illustrates the rate of mass change as the temperature varies. Analyzing TGA and DTG curves reveals three distinct stages for both non-fermented and post-fermented samples, each corresponding to specific chemical reactions [53].
A slight mass loss was observed in the initial stage (30–100 °C), ranging from 2–4.7% for fermented samples and 2.5–2.7% for non-fermented samples (Table 4). This mass loss was primarily attributed to the evaporation of water and the release of minimal volatile compounds following freeze-drying.

Table 4.
Thermogravimetric information for tested samples (TGA results).
The second stage of decomposition (100–480 °C) demonstrated the most pronounced weight loss, averaging 63.7% for non-fermented samples and 64.6% for fermented samples. This stage involves the breakdown of various compounds, including proteins, sugars (such as glucose and sucrose), and polysaccharides (including hemicellulose, cellulose, and lignin). In the third stage (480–600 °C), weight losses of 5.6% and 1.7% were observed for non-fermented and fermented samples, respectively, which can be attributed to the decomposition of residual compounds [31].
The effects of pre-treatment were noted, although they appeared to be inconsistent. The application of ultrasound facilitated the partial breakdown of polysaccharides, resulting in greater weight reduction and accelerated pyrolysis [56].
The DTG curve (Figure S1) for the unfermented pepper samples displayed two distinct peaks, occurring at approximately 190 °C and 312 °C for each sample. According to Rybak, Wiktor, Kaveh, Dadan, Witrowa-Rajchert, and Nowacka [31], the degradation temperature ranges for glucose and sucrose are between 150–200 °C and 170–212 °C, respectively. In contrast, hemicellulose and cellulose have degradation temperatures ranging from 220–315 °C to 250–450 °C, respectively. These observations suggest that the identified peaks may correspond to the degradation of these specific compounds.
As shown in Figure S1, which presents the DTG curve for the fermented pepper samples, at least five elongated peaks were detected at temperatures of approximately 150 °C, 190 °C, 260 °C, 290 °C, and 390 °C, respectively. The first two peaks may indicate the degradation of monosaccharides. Notably, these peaks are less pronounced than those observed in the non-fermented pepper samples (Figure S1), suggesting a lower concentration of monosaccharides in the fermented samples. Additionally, the peak around 190 °C may represent the point at which lactic acid degradation occurs [57]. The subsequent two peaks could be linked to the degradation of hemicellulose and cellulose. Furthermore, the peak at 290 °C might signify strong gas adsorption of the degradation products on the surface of the newly formed phase [53]. The peak at 390 °C, along with the smaller peaks observed at higher temperatures, could also provide essential insights.
3.5. FT-IR
Fourier transform infrared spectroscopy (FTIR) is an analytical technique for identifying and verifying chemical compounds. This method allows for the determination of molecular composition and the elucidation of molecular structure. Compounds exhibit selective absorption of infrared radiation based on their characteristic functional groups. When these compounds absorb energy, their molecules undergo stretching and bending vibrations influenced by their geometric configurations. The spectrum can be expressed as a function of wave number within the range of 14,000 cm−1 to 25 cm−1. However, the spectrum most commonly employed in sample analysis is the mid-infrared spectrum, i.e., within the wave number range from 4000 cm−1 to 400 cm−1. Occasionally, the spectrum is also represented in terms of transmission as a function of wave number. The absorption spectrum functions as a molecular identifier, with its distinctive pattern enabling qualitative and quantitative analyses. According to Beer’s law, the intensity of the bands within the IR spectrum is proportional to the concentration of the compounds [58,59,60].
The spectral analysis revealed absorption bands corresponding to the vibrations of functional groups from the main components of peppers, including carotenoids, phenolic compounds, and ascorbic acid [61]. The 3000–3600 cm−1 band was attributed to hydroxyl group (–OH) stretching vibrations from water and phenolic compounds. In the 3000–2800 cm−1 range, two peaks indicated alkyl group (–CH2 and –CH3) stretching vibrations. The 1730–1650 cm−1 bands confirmed the presence of aldehydes, ketones, and carboxylic acids through carbonyl group (C=O) vibrations. Adjacent bands at 1617–1580 cm−1 and 960 cm−1 represented C=C bond vibrations from carotenoids. Bands at 1460–1430 cm−1 and 1400–1360 cm−1 were linked to methylene (–CH2) and methyl (–CH3) group vibrations, while those at 1270–1220 cm−1 and 1160–1120 cm−1 corresponded to (–C–O–C), (–C–O), and (C–N) group vibrations, indicating saccharides and other compounds. Bands at 1050-990 cm−1 suggested the presence of (–C–O) and (–C–C) bonds, and those at 860–730 cm−1 were attributed to aromatic (C–H) and C-Cl bonds [24,31,58,60,61].
Sonication altered the intensity of functional group bands, affecting antioxidant properties (Figure 4). Samples subjected to brief sonication (S_1, S_3) had reduced (–OH) group intensities but increased alkyl group (–CH2 and –CH3) intensities, impacting aroma and flavor. Immersion ultrasound treatments (US_15, US_30) showed opposite trends. Similar patterns were observed for (C=O), (–C–O–C), (C-–N), and (–C–O) groups. The (C=C) group showed consistent intensities, except in US_15, where they decreased. The highest and lowest intensities for (–C–C) and aromatic (CH) groups were seen in US_30 and US_15, respectively. These results indicate pre-treatment parameters influenced the chemical composition and properties of peppers.
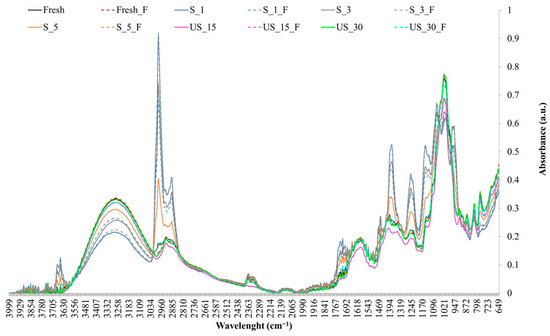
Figure 4.
FTIR spectra of red bell pepper samples subjected to different ultrasound pre-treatment conditions before and after lactic acid fermentation.
Fermented pepper samples also exhibited variability in functional group intensities (Figure 4). The (-OH) group was most intense in fermented samples with prior sonication (S_5_F) and the fermented control, while it was weakest in samples with brief contact sonication (S_3_F, T_1_F). Conversely, alkyl groups (–CH2, –CH3) and others (C=O, C=C, (––C–O–C), (C–N)) were most intense in S_3_F and T_1_F. The (–C–C) and aromatic (CH) groups showed consistent intensities except in S_3_F and S_1_F, where they were lower. Fermentation and sonication influenced the chemical composition, particularly in contact sonication for 1–3 min.
Comparable FTIR results were reported for Capsicum annum L. var. serrano [61]. Rybak, Wiktor, Kaveh, Dadan, Witrowa-Rajchert, and Nowacka [31] highlighted ultrasound effects on dried red pepper composition, showing reduced functional group intensities post-treatment. Differences in methodologies, raw material quality, and parameters may explain study variations. Janiszewska-Turak, Tracz, Bielińska, Rybak, Pobiega, Gniewosz, Woźniak, and Gramza-Michałowska [24] observed functional group intensity changes before and after fermentation but noted no clear influence of fermentation type or starter cultures.
3.6. Carotenoids
Carotenoids perform various biological functions, exhibiting antioxidant properties that protect the body against reactive oxygen species and free radicals. They are the primary precursors in synthesizing vitamin A and represent its main source in the human body. Carotenoids are responsible for the orange color of many fruits and vegetables, with red peppers considered one of the richest natural sources of carotenoids [62,63].
In the present study, the mean total carotenoid content in red pepper fruits ranged from 43.55 mg β-carotene/100 g dry matter to 147.89 mg β-carotene/100 g dry matter (Figure 5). The application of ultrasound as a pre-treatment did not yield statistically significant differences when compared to fresh, untreated peppers, except for the use of contact ultrasound for 5 min, which resulted in the lowest total carotenoid content among all samples at 43.55 mg β-carotene/100 g dry matter. In most pre-treated samples, there was a decrease in carotenoid content ranging from approximately 2% to 39% compared to fresh, untreated peppers. The processing parameters significantly influenced the total carotenoid content, particularly with ultrasound treatments (immersion and contact methods). The findings indicate that extending the treatment duration (up to 30 min for immersion and 5 min for contact) resulted in a notable reduction of about 33% in carotenoid content relative to samples subjected to the shortest processing times of 15 min (immersion) and 1 min (contact method).
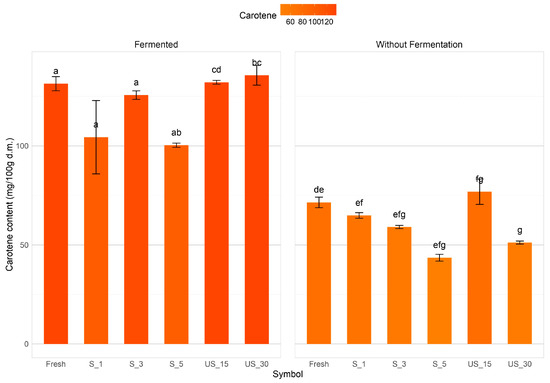
Figure 5.
Carotenoid content of red bell pepper samples subjected to different ultrasound pre-treatment conditions before and after lactic acid fermentation. Different letters indicate significant differences according to Tukey’s test at α = 0.05.
Lactic fermentation resulted in a significant increase in carotenoid levels across all samples. In samples subjected to fermentation, total carotenoid content exhibited an approximate 40% increase in peppers following 5 min of contact ultrasound treatment. However, most fermented samples did not demonstrate any substantial variation in carotenoid content. The parameters of contact ultrasound treatment substantially influenced the total carotenoid content of fermented red peppers. The highest recorded carotenoid content (125.7 mg β-carotene/100 g dry matter) was observed in peppers treated for 3 min, while the lowest (100.38 mg β-carotene/100 g dry matter) occurred after 5 min of treatment. These results suggest that the pre-treatment method and its parameters affect the total carotenoid content in the studied fermented peppers.
In contrast, studies by Rybak et al. [64] reported significantly lower carotenoid levels in sonicated red pepper samples than in untreated ones. These findings were attributed to the impact of reactive oxygen species, free radicals, and structural changes induced by ultrasound treatments on carotenoid levels. Rybak et al. [65] further corroborated this observation, demonstrating that ultrasound applied to freeze-dried peppers reduced carotenoid content compared to untreated freeze-dried samples. This observation explains the reduction in carotenoid content observed in most pre-treated samples in the current study. Janiszewska-Turak, Witrowa-Rajchert, Rybak, Rolof, Pobiega, Woźniak, and Gramza-Michałowska [30] observed an increase in carotenoid content in red peppers following lactic fermentation, irrespective of the bacterial strain used. This was attributed mainly to the rupture of tissues storing carotenoids. A similar outcome was reported by Kiczorowski, Kiczorowska, Samolińska, Szmigielski, and Winiarska-Mieczan [40], who also found increased carotenoid levels in red peppers following lactic fermentation.
3.7. Polyphenols/Antioxidant Properties
Red bell pepper fruits have been found to contain vitamin C, carotenoids, polyphenols, and other compounds that have been identified as being responsible for their antioxidant properties [66]. The ferric ion reduction assay (FRAP) is a method commonly used to assess the antioxidant capacity of antioxidants based on their ability to reduce Fe(III). Due to the complexity of antioxidant capacity in plant material, it is recommended that at least two different methods be used to assess antioxidant activity [67].
In the present study, three methods were used to obtain a more complete picture of the antioxidant properties of the samples tested. The total antioxidant capacity of bell pepper, as determined by the FRAP method, ranged from 3.30 mg TE/g d.m. to 4.58 mg TE/g d.m. (Figure 6). In this ultrasound, pre-treatment led, in most cases, to a reduction in antioxidant activity compared to untreated samples. However, the results indicate that process parameters such as ultrasonic time and intensity can influence the results. For example, increasing the ultrasonic treatment time using the immersion method to 30 min increased the antioxidant activity by about 11% compared to 15 min.
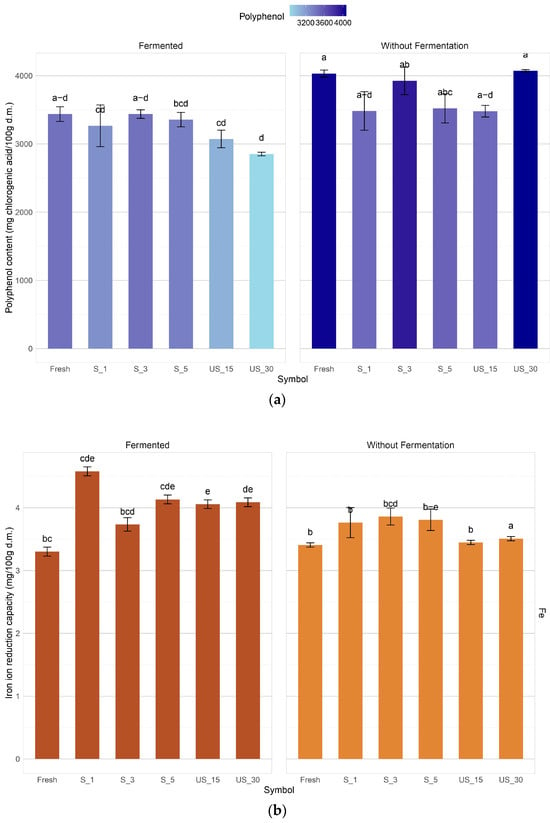
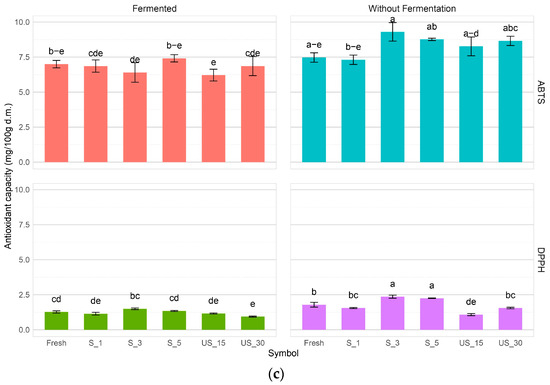
Figure 6.
Antioxidant properties of red bell pepper samples subjected to different ultrasound pre-treatment conditions before and after lactic acid fermentation. (a) Polyphenols, (b) iron reduction, (c) antioxidant activity in range of ABTS and DPPH methods. Different letters indicate significant differences according to Tukey’s test at α = 0.05.
In the ABTS test, the antioxidant activity in most fermented samples was not significantly different; the method used and its parameters had no apparent effect on the antioxidant activity. There was a slight increase in the antioxidant activity against ABTS+ of the fermented peppers with an increase in time (from 15 to 30 min) in the case of prior sonication by the immersion method; in the contact method, the highest ABTS+ scavenging capacity, i.e., 7.41 mg TE/g d.m., was achieved by the sample previously subjected to 5 min sonication.
In the DPPH free radical scavenging method and the ABTS ion radical scavenging method, the antioxidant activity of red bell pepper was found to range from 0.94 mg TE/g d.m. to 2.41 mg TE/g d.m. (DPPH) and from 6.21 mg TE/g d.m. to 9.3 mg TE/g d.m. (ABTS), respectively. The variations observed in the results of these methods may be attributed to the differing sensitivities of each assay to specific bioactive compounds, such as polyphenols and vitamin C. Additionally, the assays demonstrated varying sensitivities to the polarity of the bioactive compounds, which may have further contributed to the discrepancies in results. Statistical analysis indicated that the treatment methods and their corresponding parameters significantly influenced free radical scavenging capacity. Notably, the three-minute ultrasonic contact treatment enhanced antioxidant activity against the DPPH radical by 42.1%.
In the DPPH free radical scavenging method and the ABTS ion radical scavenging method, the antioxidant activity of the tested pepper fruits ranged from 0.94 mg TE/g d.m. to 2.41 mg TE/g d.m. for DPPH, and from 6.21 mg TE/g d.m. to 9.3 mg TE/g d.m. for ABTS. The observed variations in the results may be attributed to the differing sensitivities of the two tests to specific bioactive compounds, such as polyphenols and vitamin C. Additionally, the tests demonstrated varying degrees of sensitivity to the polarity of the bioactive compounds, which could explain the discrepancies in the findings [68,69]. Statistical analysis indicated that the treatment methods and their parameters significantly influenced the free radical scavenging capacity. For example, an ultrasonic contact treatment lasting three minutes led to a 42.1% increase in antioxidant activity against the DPPH radical compared to the fresh sample. In contrast, lactic fermentation mainly resulted in decreased activity towards DPPH, although a lesser decline was also noted, albeit to a smaller extent than with DPPH.
A review of the existing literature confirms the varying effects of non-thermal pre-treatment methods on the antioxidant activity of vegetables. Wang et al. [70] demonstrated that the use of ultrasound before drying enhanced antioxidant activity in both FRAP and ABTS assays. Similarly, Ren et al. [71] reported increased antioxidant activity in sublimation-dried onions, reinforcing the connection between the extraction efficiency of bioactive compounds and the processing method employed. In another study, Rybak, Wiktor, Witrowa-Rajchert, Parniakov, and Nowacka [64] found that ultrasound boosted antioxidant activity in red peppers. Janiszewska-Turak, Hornowska, Pobiega, Gniewosz, and Witrowa-Rajchert [43] indicated that lactic fermentation can enhance antioxidant activity against DPPH, attributing this effect to increased vitamin C content.
The findings from the current study did not align with the results documented in the existing literature. The antioxidant activity of fermented vegetables may be affected by several factors, such as the accumulation of antioxidant compounds during the fermentation process, the production of antioxidant enzymes by lactic acid bacteria, or the specific timing of fermentation, as illustrated by the research conducted by Yang et al. [72].
4. Conclusions
This study demonstrated that pre-treatment methods and parameters significantly influenced the physical and chemical properties of both unfermented and fermented peppers, with effects varying based on the method and sonication time. The lactic fermentation process also played a crucial role, and all research hypotheses were confirmed. The number of lactic acid bacteria (LAB) in fermented samples depended on the pre-treatment conditions, with the highest LAB count observed in peppers sonicated for 30 min using the immersion method. Ultrasound treatment led to a notable reduction in dry matter content, further intensified by fermentation. Increasing sonication time in the immersion method resulted in lower dry matter content, regardless of fermentation. Color changes occurred in both fermented and unfermented peppers following ultrasound treatment, with effects dependent on the method and parameters used. Fermentation had the greatest impact on texture, significantly reducing firmness, elasticity, cohesiveness, and chewiness, while ultrasound decreased hardness and chewiness in non-fermented samples. However, pre-treatment had no significant effect on the texture of fermented peppers. Total polyphenol and carotenoid content remained unaffected by pre-treatment, but it influenced the preservation of polyphenols in fermented samples. Carotenoid levels increased significantly after fermentation, with final content depending on the pre-treatment method and parameters. Structural damage in pre-treated peppers varied with method and treatment conditions, increasing with longer sonication times. Fermented samples exhibited more tissue damage, which intensified as pre-treatment parameters increased.
Supplementary Materials
The following supporting information can be downloaded at: https://www.mdpi.com/article/10.3390/app15062988/s1, Figure S1. TGA curves for bell pepper fermented and ultrasound-treated samples with (a) derivative and (b) mass lost.
Author Contributions
Conceptualization, E.J.-T. and K.R.; methodology, E.J.-T., K.R. and K.P.; software, E.J.-T.; validation, E.J.-T., K.R. and K.P.; formal analysis, E.J.-T., K.R., K.P. and S.O.; investigation, E.J.-T., K.R., K.P. and S.O.; data curation, E.J.-T., K.R. and K.P.; writing—original draft preparation, E.J-T., K.R., K.P. and S.O.; writing—review and editing, E.J.-T., K.R. and K.P.; visualization, E.J.-T.; supervision, E.J.-T. All authors have read and agreed to the published version of the manuscript.
Funding
This research received no external funding.
Institutional Review Board Statement
Not applicable.
Informed Consent Statement
Not applicable.
Data Availability Statement
The authors confirm that all data supporting the findings of this study are available within the article and its Supplementary Materials.
Acknowledgments
The authors would like to thank Mikołaj Radzicki for his kind help with some formal analysis.
Conflicts of Interest
The authors declare no conflicts of interest.
References
- Janowicz, M.; Lenart, A. Selected physical properties of convection dried apples after HHP treatment. LWT-Food Sci. Technol. 2015, 63, 828–836. [Google Scholar] [CrossRef]
- Pott, D.M.; Vallarino, J.G.; Osorio, S. Metabolite changes during postharvest storage: Effects on fruit quality traits. Metabolites 2020, 10, 187. [Google Scholar] [CrossRef]
- Sahoo, M.; Titikshya, S.; Aradwad, P.; Kumar, V.; Naik, S. Blanching, pasteurization and sterilization: Principles and applications. In Thermal Food Engineering Operations; Wiley: Hoboken, NJ, USA, 2022; pp. 75–115. [Google Scholar]
- Tsevdou, M.; Dimopoulos, G.; Gogou, E.; Dermesonlouoglou, E.; Taoukis, P. Nonthermal Processing Technologies: Synergies and new applications in food engineering. In Nonthermal Processing in Agri-Food-Bio Sciences: Sustainability and Future Goals; Springer: Berlin/Heidelberg, Germany, 2022; pp. 311–384. [Google Scholar]
- Ambadgatti, S.; Patil, S.; Dabade, A.; Ss, A.; Bhushette, P.; Sonawane, S.K. A Review on Recent Trends of Ultrasound Assisted Processing in Food Segment. J. Microbiol. Biotechnol. Food Sci. 2020, 10, 1–4. [Google Scholar] [CrossRef]
- Taha, A.; Mehany, T.; Pandiselvam, R.; Anusha Siddiqui, S.; Mir, N.A.; Malik, M.A.; Sujayasree, O.J.; Alamuru, K.C.; Khanashyam, A.C.; Casanova, F.; et al. Sonoprocessing: Mechanisms and recent applications of power ultrasound in food. Crit. Rev. Food Sci. Nutr. 2024, 64, 6016–6054. [Google Scholar] [CrossRef]
- Radziejewska-Kubzdela, E.; Kidoń, M.; Kowiel, A.; Waszkowiak, K.; Szymandera-Buszka, K.; Bednarek, M.; Kuligowski, M.; Kobus-Cisowska, J.; Mierzwa, D. The Effect of Ultrasound and Lactic Acid Fermentation on the Selected Quality Parameters and Bioactive Compounds Content in Fermented Pumpkin (Cucurbita pepo L.). Molecules 2024, 29, 5586. [Google Scholar] [CrossRef] [PubMed]
- Pelizaro, T.A.G.; Tolaba, A.G.; Rodriguez-Chanfrau, J.E.; Veranes-Pantoja, Y.; Guastaldi, A.C. Influence of the application of ultrasound during the synthesis of calcium phosphates. J. Bionanoscience 2018, 12, 733–738. [Google Scholar] [CrossRef]
- Feng, H. The thermodynamic and kinetic aspects of power ultrasound processes. In Food Engineering Series; Springer: Berlin/Heidelberg, Germany, 2011; pp. 107–123. [Google Scholar]
- Ain, H.B.U.; Tufail, T.; Saeed, F.; Arshad, M.U.; Afzaal, M.; Tufail, T.; Din, A.; Niazi, M.K.; Hussain, M. Sonication: An overview. In Ultrasound and Microwave for Food Processing: Synergism for Preservation and Extraction; Academic Press: Cambridge, MA, USA, 2022; pp. 1–18. [Google Scholar]
- Gabaldón-Leyva, C.A.; Quintero-Ramos, A.; Barnard, J.; Balandrán-Quintana, R.R.; Talamás-Abbud, R.; Jiménez-Castro, J. Effect of ultrasound on the mass transfer and physical changes in brine bell pepper at different temperatures. J. Food Eng. 2007, 81, 374–379. [Google Scholar] [CrossRef]
- Pinheiro, J.; Alegria, C.; Abreu, M.; Gonçalves, E.M.; Silva, C.L. Influence of postharvest ultrasounds treatments on tomato (Solanum lycopersicum, cv. Zinac) quality and microbial load during storage. Ultrason. Sonochemistry 2015, 27, 552–559. [Google Scholar] [CrossRef]
- Wang, J.; Fan, L. Effect of ultrasound treatment on microbial inhibition and quality maintenance of green asparagus during cold storage. Ultrason. Sonochemistry 2019, 58, 104631. [Google Scholar] [CrossRef]
- Esua, O.J.; Chin, N.L.; Yusof, Y.A.; Sukor, R. Effects of simultaneous UV-C radiation and ultrasonic energy postharvest treatment on bioactive compounds and antioxidant activity of tomatoes during storage. Food Chem. 2019, 270, 113–122. [Google Scholar] [CrossRef]
- Fijałkowska, A.; Nowacka, M.; Witrowa-Rajchert, D. Effect of ultrasound waves on drying process and selected properties of beetroot tissue. Food Sci. Technol. Qual. 2015, 2, 138–149. [Google Scholar] [CrossRef]
- Hasheminya, S.M.; Dehghannya, J. Non-thermal processing of black carrot juice using ultrasound: Intensification of bioactive compounds and microbiological quality. Int. J. Food Sci. Technol. 2022, 57, 5848–5858. [Google Scholar] [CrossRef]
- Starek, A.; Kobus, Z.; Sagan, A.; Chudzik, B.; Pawłat, J.; Kwiatkowski, M.; Terebun, P.; Andrejko, D. Influence of ultrasound on selected microorganisms, chemical and structural changes in fresh tomato juice. Sci. Rep. 2021, 11, 3488. [Google Scholar] [CrossRef] [PubMed]
- Ojha, K.S.; Mason, T.J.; O’Donnell, C.P.; Kerry, J.P.; Tiwari, B.K. Ultrasound technology for food fermentation applications. Ultrason. Sonochemistry 2017, 34, 410–417. [Google Scholar] [CrossRef]
- Hashemi, S.M.B.; Jafarpour, D.; Soto, E.R.; Barba, F.J. Ultrasound-assisted lactic acid fermentation of Bakraei (Citrus reticulata cv. Bakraei) juice: Physicochemical and bioactive properties. Fermentation 2022, 9, 37. [Google Scholar] [CrossRef]
- Zhang, D.; Hamauzu, Y. Phenolic compounds, ascorbic acid, carotenoids and antioxidant properties of green, red and yellow bell peppers. J. Food Agric. Environ. 2003, 1, 22–27. [Google Scholar]
- Valšíková, M.; Rehuš, M.; Komár, P.; Paulen, O. The impact of varieties, ripeness, and heat treatment on the retention of vitamin C and content of soluble solids in sweet pepper. Potravin. Slovak J. Food Sci. 2017, 11, 210–215. [Google Scholar] [CrossRef][Green Version]
- Tang, Y.; Gan, Y.; Zhang, G.; Shen, X.; Shi, C.; Deng, X.; Lu, Y.; Brotman, Y.; Yang, S.; Ouyang, B. Identification of carotenoids and candidate genes shaping high pigment chili pepper variety. Sci. Hortic. 2024, 327, 112799. [Google Scholar] [CrossRef]
- Tian, S.L.; Li, L.; Shah, S.N.M.; Gong, Z.H. The relationship between red fruit colour formation and key genes of capsanthin biosynthesis pathway in Capsicum annuum. Biol. Plant. 2015, 59, 507–513. [Google Scholar] [CrossRef]
- Janiszewska-Turak, E.; Tracz, K.; Bielińska, P.; Rybak, K.; Pobiega, K.; Gniewosz, M.; Woźniak, Ł.; Gramza-Michałowska, A. The Impact of the Fermentation Method on the Pigment Content in Pickled Beetroot and Red Bell Pepper Juices and Freeze-Dried Powders. Appl. Sci. 2022, 12, 5766. [Google Scholar] [CrossRef]
- Singleton, V.L.; Rossi, J.A. Colorimetry of total phenolics with phosphomolybdic-phosphotungstic acid reagents. Am. J. Enol. Vitic. 1965, 16, 144–158. [Google Scholar] [CrossRef]
- Świeca, M. Hydrogen peroxide treatment and the phenylpropanoid pathway precursors feeding improve phenolics and antioxidant capacity of quinoa sprouts via an induction of L-tyrosine and L-phenylalanine ammonia-lyases activities. J. Chem. 2016, 2016, 1936516. [Google Scholar] [CrossRef]
- Kowalska, H.; Trusinska, M.; Rybak, K.; Wiktor, A.; Witrowa-Rajchert, D.; Nowacka, M. Shaping the Properties of Osmo-Dehydrated Strawberries in Fruit Juice Concentrates. Appl. Sci. 2023, 13, 2728. [Google Scholar] [CrossRef]
- Janiszewska-Turak, E.; Sitkiewicz, I.; Janowicz, M. Influence of Ultrasound on the Rheological Properties, Color, Carotenoid Content, and Other Physical Characteristics of Carrot Puree. Appl. Sci. 2024, 14, 10466. [Google Scholar] [CrossRef]
- Scott, K.J. Detection and Measurement of Carotenoids by UV/VIS Spectrophotometry. In Current Protocols in Food Analytical Chemistry; Wiley: Hoboken, NJ, USA, 2001; p. F2.2.1. [Google Scholar] [CrossRef]
- Janiszewska-Turak, E.; Witrowa-Rajchert, D.; Rybak, K.; Rolof, J.; Pobiega, K.; Woźniak, Ł.; Gramza-Michałowska, A. The Influence of Lactic Acid Fermentation on Selected Properties of Pickled Red, Yellow, and Green Bell Peppers. Molecules 2022, 27, 8637. [Google Scholar] [CrossRef]
- Rybak, K.; Wiktor, A.; Kaveh, M.; Dadan, M.; Witrowa-Rajchert, D.; Nowacka, M. Effect of Thermal and Non-Thermal Technologies on Kinetics and the Main Quality Parameters of Red Bell Pepper Dried with Convective and Microwave–Convective Methods. Molecules 2022, 27, 2164. [Google Scholar] [CrossRef]
- Wierzbicka, A.; Janiszewska-Turak, E. Influence of the Salt Addition during the Fermentation Process on the Physical and Chemical Properties of Dried Yellow Beetroot. Appl. Sci. 2024, 14, 524. [Google Scholar] [CrossRef]
- Janiszewska-Turak, E.; Rybak, K.; Witrowa-Rajchert, D.; Pobiega, K.; Wierzbicka, A.; Ossowski, S.; Sękul, J.; Kufel, A.; Wiśniewska, A.; Trych, U.; et al. Influence of Heat Treatment and Lactic Acid Fermentation on the Physical and Chemical Properties of Pumpkin Juice. Molecules 2024, 29, 4519. [Google Scholar] [CrossRef]
- Rhee, S.J.; Lee, J.-E.; Lee, C.-H. Importance of lactic acid bacteria in Asian fermented foods. Microb. Cell Factories 2011, 10, S5. [Google Scholar] [CrossRef] [PubMed]
- Liu, Y.; Zhu, J.; Zhu, C. Effect of ultrasonic pretreatment on fermentation performance and quality of fermented hawthorn pulp by lactic acid bacteria. Food Chem. 2024, 446, 138774. [Google Scholar] [CrossRef]
- Barrett, D.M.; Beaulieu, J.C.; Shewfelt, R. Color, flavor, texture, and nutritional quality of fresh-cut fruits and vegetables: Desirable levels, instrumental and sensory measurement, and the effects of processing. Crit. Rev. Food Sci. Nutr. 2010, 50, 369–389. [Google Scholar] [CrossRef]
- Fakhreddin, S. Recent advances in the ultrasound-assisted osmotic dehydration of agricultural products: A review. Food Biosci. 2023, 51, 102307. [Google Scholar] [CrossRef]
- Rajewska, K.; Mierzwa, D. Influence of ultrasound on the microstructure of plant tissue. Innov. Food Sci. Emerg. Technol. 2017, 43, 117–129. [Google Scholar] [CrossRef]
- Kobus, Z. Wpływ wstępnej obróbki ultradźwiękowej na proces tłoczenia soku marchwiowego. Inżynieria Rol. 2005, 9, 219–226. [Google Scholar]
- Kiczorowski, P.; Kiczorowska, B.; Samolińska, W.; Szmigielski, M.; Winiarska-Mieczan, A. Effect of fermentation of chosen vegetables on the nutrient, mineral, and biocomponent profile in human and animal nutrition. Sci. Rep. 2022, 12, 13422. [Google Scholar] [CrossRef] [PubMed]
- Andrés-Bello, A.; Barreto-Palacios, V.; García-Segovia, P.; Mir-Bel, J.; Martínez-Monzó, J. Effect of pH on color and texture of food products. Food Eng. Rev. 2013, 5, 158–170. [Google Scholar] [CrossRef]
- Rydzkowski, T.; Michalska-Pożoga, I. Wpływ pakowania (MAP) na trwałość i zmiany przechowalnicze świeżej, rozdrobnionej papryki czerwonej. Postępy Tech. Przetwórstwa Spożywczego 2014, 29–33. [Google Scholar]
- Janiszewska-Turak, E.; Hornowska, Ł.; Pobiega, K.; Gniewosz, M.; Witrowa-Rajchert, D. The influence of Lactobacillus bacteria type and kind of carrier on the properties of spray-dried microencapsules of fermented beetroot powders. Int. J. Food Sci. Technol. 2021, 56, 2166–2174. [Google Scholar] [CrossRef]
- Vivek, K.; Sabyasachi, M.; Sasikumar, R. Effect of ultra-sonication on postharvest quality parameters and microbial load on Docynia indica. Sci. Hortic. 2017, 225, 163–170. [Google Scholar] [CrossRef]
- Wang, H.; Tao, Y.; Li, Y.; Wu, S.; Li, D.; Liu, X.; Han, Y.; Manickam, S.; Show, P.L. Application of ultrasonication at different microbial growth stages during apple juice fermentation by Lactobacillus plantarum: Investigation on the metabolic response. Ultrason. Sonochemistry 2021, 73, 105486. [Google Scholar] [CrossRef]
- Nowacka, M.; Wedzik, M. Effect of ultrasound treatment on microstructure, colour and carotenoid content in fresh and dried carrot tissue. Appl. Acoust. 2016, 103, 163–171. [Google Scholar] [CrossRef]
- Scholten, E. Composite foods: From structure to sensory perception. Food Funct. 2017, 8, 481–497. [Google Scholar] [CrossRef] [PubMed]
- Rosenthal, A.; Chen, J. Dimensions of food texture: A conceptual discussion. J. Texture Stud. 2023, 54, 449–455. [Google Scholar] [CrossRef]
- Surmacka-Szczesniak, A. Texture is a sensory property. Food Qual. Prefer. 2002, 13, 215–225. [Google Scholar] [CrossRef]
- Alenyorege, E.A.; Ma, H.; Ayim, I.; Aheto, J.H.; Hong, C.; Zhou, C. Effect of multi-frequency multi-mode ultrasound washing treatments on physicochemical, antioxidant potential and microbial quality of tomato. J. Food Meas. Charact. 2019, 13, 677–686. [Google Scholar] [CrossRef]
- Guiné, R.P.F.; Barroca, M.J. Effect of drying treatments on texture and color of vegetables (pumpkin and green pepper). Food Bioprod. Process. 2012, 90, 58–63. [Google Scholar] [CrossRef]
- Oladejo, A.O.; Ma, H.; Qu, W.; Zhou, C.; Wu, B. Effects of Ultrasound on Mass Transfer Kinetics, Structure, Carotenoid and Vitamin C Content of Osmodehydrated Sweet Potato (Ipomea batatas). Food Bioprocess Technol. 2017, 10, 1162–1172. [Google Scholar] [CrossRef]
- Ciurzyńska, A.; Falacińska, J.; Kowalska, H.; Kowalska, J.; Galus, S.; Marzec, A.; Domian, E. The effect of pre-treatment (blanching, ultrasound and freezing) on quality of freeze-dried red beets. Foods 2021, 10, 132. [Google Scholar] [CrossRef]
- Janiszewska-Turak, E.; Rybak, K.; Pobiega, K.; Nikodem, A.; Gramza-Michałowska, A. Sustainable Production and Characteristics of Dried Fermented Vegetables. Fermentation 2022, 8, 659. [Google Scholar] [CrossRef]
- Morales-Quintana, L.; Tapia-Valdebenito, D.; Castro, R.I.; Rabert, C.; Larama, G.; Gutiérrez, A.; Ramos, P. Characterization of the cell wall component through thermogravimetric analysis and its relationship with an expansin-like protein in Deschampsia antarctica. Int. J. Mol. Sci. 2022, 23, 5741. [Google Scholar] [CrossRef]
- García, N.L.; Famá, L.; Dufresne, A.; Aranguren, M.; Goyanes, S. A comparison between the physico-chemical properties of tuber and cereal starches. Food Res. Int. 2009, 42, 976–982. [Google Scholar] [CrossRef]
- Komesu, A.; Martins Martinez, P.F.; Lunelli, B.H.; Oliveira, J.; Wolf Maciel, M.R.; Maciel Filho, R. Study of Lactic Acid Thermal Behavior Using Thermoanalytical Techniques. J. Chem. 2017, 2017, 4149592. [Google Scholar] [CrossRef]
- Guerrero-Pérez, M.O.; Patience, G.S. Experimental methods in chemical engineering: Fourier transform infrared spectroscopy—FTIR. Can. J. Chem. Eng. 2020, 98, 25–33. [Google Scholar] [CrossRef]
- Van de Voort, F. Fourier transform infrared spectroscopy applied to food analysis. Food Res. Int. 1992, 25, 397–403. [Google Scholar] [CrossRef]
- Nandiyanto, A.B.D.; Oktiani, R.; Ragadhita, R. How to read and interpret FTIR spectroscope of organic material. Indones. J. Sci. Technol. 2019, 4, 97–118. [Google Scholar] [CrossRef]
- Domínguez-Martínez, I.; Meza-Márquez, O.G.; Osorio-Revilla, G.; Proal-Nájera, J.; Gallardo-Velázquez, T. Determination of capsaicin, ascorbic acid, total phenolic compounds and antioxidant activity of Capsicum annuum L. var. serrano by mid infrared spectroscopy (Mid-FTIR) and chemometric analysis. J. Korean Soc. Appl. Biol. Chem. 2014, 57, 133–142. [Google Scholar] [CrossRef]
- Krzykowski, A.; Polak, R.; Rudy, S. Retencja karotenoidów w papryce w zależności od obróbki wstępnej oraz sposobu i warunków suszenia. Inżynieria Rol. 2011, 15, 115–121. [Google Scholar]
- Krzykowski, A.; Dziki, D.; Rudy, S.; Gawlik-Dziki, U.; Polak, R.; Biernacka, B. Effect of pre-treatment conditions and freeze-drying temperature on the process kinetics and physicochemical properties of pepper. LWT 2018, 98, 25–30. [Google Scholar] [CrossRef]
- Rybak, K.; Wiktor, A.; Witrowa-Rajchert, D.; Parniakov, O.; Nowacka, M. The Effect of Traditional and Non-Thermal Treatments on the Bioactive Compounds and Sugars Content of Red Bell Pepper. Molecules 2020, 25, 4287. [Google Scholar] [CrossRef]
- Rybak, K.; Wiktor, A.; Witrowa-Rajchert, D.; Parniakov, O.; Nowacka, M. The quality of red bell pepper subjected to freeze-drying preceded by traditional and novel pretreatment. Foods 2021, 10, 226. [Google Scholar] [CrossRef]
- Hallmann, E.; Rembiałkowska, E. Characterisation of antioxidant compounds in sweet bell pepper (Capsicum annuum L.) under organic and conventional growing systems. J. Sci. Food Agric. 2012, 92, 2409–2415. [Google Scholar] [CrossRef] [PubMed]
- Schlesier, K.; Harwat, M.; Böhm, V.; Bitsch, R. Assessment of antioxidant activity by using different in vitro methods. Free Radic. Res. 2002, 36, 177–187. [Google Scholar] [CrossRef] [PubMed]
- Sanna, D.; Delogu, G.; Mulas, M.; Schirra, M.; Fadda, A. Determination of Free Radical Scavenging Activity of Plant Extracts Through DPPH Assay: An EPR and UV-Vis Study. Food Anal. Methods 2012, 5, 759–766. [Google Scholar] [CrossRef]
- Tachalerdmanee, P.; Moonmangmee, S.; Suwakul, W.; Charnvanich, D. Effect of total phenolic content on free radical scavenging activities of Boletes mushroom extracts. Thai J. Pharm. Sci. 2016, 40, 88–91. [Google Scholar]
- Wang, H.; Zhao, Q.-S.; Wang, X.-D.; Hong, Z.-d.; Zhao, B. Pretreatment of ultrasound combined vacuum enhances the convective drying efficiency and physicochemical properties of okra (Abelmoschus esculentus). LWT 2019, 112, 108201. [Google Scholar] [CrossRef]
- Ren, F.; Perussello, C.; Zhang, Z.; Kerry, J.P.; Tiwari, B.K. Impact of ultrasound and blanching on functional properties of hot-air dried and freeze dried onions. LWT 2018, 87, 102–111. [Google Scholar] [CrossRef]
- Yang, X.; Zhou, J.; Fan, L.; Qin, Z.; Chen, Q.; Zhao, L. Antioxidant properties of a vegetable–fruit beverage fermented with two Lactobacillus plantarum strains. Food Sci. Biotechnol. 2018, 27, 1719–1726. [Google Scholar] [CrossRef]
Disclaimer/Publisher’s Note: The statements, opinions and data contained in all publications are solely those of the individual author(s) and contributor(s) and not of MDPI and/or the editor(s). MDPI and/or the editor(s) disclaim responsibility for any injury to people or property resulting from any ideas, methods, instructions or products referred to in the content. |
© 2025 by the authors. Licensee MDPI, Basel, Switzerland. This article is an open access article distributed under the terms and conditions of the Creative Commons Attribution (CC BY) license (https://creativecommons.org/licenses/by/4.0/).
