Article

A Machine Learning Framework for Student Retention Policy Development: A Case Study

1
Department of Information and Communication Technologies in Education, Faculty of Education, Eastern Mediterranean University, via Mersin 10, Famagusta 99628, North Cyprus, Türkiye
2
Department of Information Technology, School of Computing and Technology, Eastern Mediterranean University, via Mersin 10, Famagusta 99628, North Cyprus, Türkiye
*
Author to whom correspondence should be addressed.
Appl. Sci. 2025, 15(6), 2989; https://doi.org/10.3390/app15062989
Submission received: 23 January 2025 / Revised: 25 February 2025 / Accepted: 6 March 2025 / Published: 10 March 2025
(This article belongs to the Special Issue ICT in Education, 2nd Edition)

Abstract

:
Student attrition at tertiary institutions is a global challenge with significant personal and social consequences. Early identification of students at risk of dropout is crucial for proactive and preventive intervention. This study presents a machine learning framework for predicting and visualizing students at risk of dropping out. While most previous work relies on wide-ranging data from numerous sources such as surveys, enrolment, and learning management systems, making the process complex and time-consuming, the current study uses minimal data that are readily available in any registration system. The use of minimal data simplifies the process and ensures broad applicability. Unlike most similar research, the proposed framework provides a comprehensive system that not only identifies students at risk of dropout but also groups them into meaningful clusters, enabling tailored policy generation for each cluster through digital technologies. The proposed framework comprises two stages where the first stage identifies at-risk students using a machine learning classifier, and the second stage uses interpretable AI techniques to cluster and visualize similar students for policy-making purposes. For the case study, various machine learning algorithms—including Support Vector Classifier, K-Nearest Neighbors, Logistic Regression, Naïve Bayes, Artificial Neural Network, Random Forest, Classification and Regression Trees, and Categorical Boosting—were trained for dropout prediction using data available at the end of the students’ second semester. The experimental results indicated that Categorical Boosting with an F1-score of 82% is the most effective classifier for the dataset. The students identified as at risk of dropout were then clustered and a decision tree was used to visualize each cluster, enabling tailored policy-making.

1. Introduction

With the advent of digitalization, educational institutions have been generating increasingly large amounts of student-related data for decades. These data provide a valuable resource for educational data mining and may be used to help policymakers improve educational processes and address critical challenges. The different nature and aim of each level of education from preschool to postgraduate education requires different regulations and practices resulting in variations in the nature, type, originating source, and domain of the data collected. These variations are important when the data processing frameworks are designed to process them, requiring different approaches for data analysis and modeling. For instance, a very important challenge in all educational institutions is increasing student success and reducing attrition. Student attrition can be considered at primary and secondary education levels, tertiary or higher education levels, or even in specific courses. Specifically, due to age ranges and governing regulations, dropout phenomena in tertiary education differ significantly from foundational or secondary education, both in terms of contributing factors and the available data sources. This study focuses on the prediction of student dropouts from tertiary institutions, which is defined as one of the most complex and detrimental events for both students and institutions [1]. The term dropout is used to describe the act of leaving a university without earning a degree, which is considered a type of failure. This aligns with the dropout definition by Larsen et al. as the withdrawal from a degree course before it is completed [2]. Hence, dropout does not include the extension of studies or temporary leave due to financial or health issues. Dropping out of school is a potentially devastating event in a student’s life and also negatively impacts the university from an economic perspective [3]. According to the Education at a Glance 2022 OECD Indicators Report, only 39% of full-time students in bachelor’s programs graduate within the normal duration of their degree program, 12% of students drop out prior to the second year, and 21% drop out by the end of the degree program duration [4]. Therefore, developing strategies to reduce school dropouts is globally an important goal for education systems.
Student dropout is a crucial concern not only for individuals and educational institutions but also for the social and economic development of communities and countries. Talamás-Carvajal et al. identified dropouts as one of the biggest problems universities currently face [5]; Liu et al. asserted that university students dropping out of school pose a significant risk for local societies and countries [6]. Similarly, Selim and Rezk argued that school dropout is a serious problem that affects not only education systems but also the development of a country and that social and economic negatives will be reduced over time if the risk of school dropout is identified and decision-makers draw policies to eliminate this problem [7]. According to Rodríguez et al., the school dropout issue causes irreversible harm to both students and society through lower qualification employment, greater rates of poverty and shorter life expectancies, reduced pensions, and increased financial strain on states [8]. Therefore, addressing this challenge and taking proactive measures to prevent or minimize dropouts is critical for improving both individual and social development.
The ever-increasing educational data may be employed to identify students who are at risk of dropping out using advanced analytical methods or data-driven machine learning systems. Subsequently, education administrators may analyze the predictions to develop proactive policies and targeted interventions to support at-risk students and reduce dropout rates effectively. For instance, advanced data analysis techniques such as IRT and the Rasch model have been used to study academic performance and dropout rates of university students and to develop policies [9,10]. Machine learning algorithms have also been used for predicting student dropouts and academic performance extensively [5,6,7,8]. Most of the work in this domain focused on the prediction of dropouts and did not provide solutions or policies to ensure student retention.
The main aim of this study is to design effective mechanisms to predict students at risk of dropping out and allow the university administration to take proactive measures and develop policies to minimize dropout rates and thus the financial burden on institutions and individuals. Minimizing the dropout rates is expected to enable educators to improve the academic environment and increase motivation among the student cohort. Even though there has been a plethora of work on the identification of dropouts, the current study differs in the use of a minimal feature set that is readily available in any registration system. Specifically, the data employed includes demographic information and information used for generating transcripts.
This study proposes a machine learning framework to estimate the graduation and dropout rate at the end of the normal education period by using only the data used for generating academic transcripts or record sheets at the end of the second semester. One important contribution is the use of the data available on any registration system rather than mining the data from different sources such as learning management systems or additional surveys. This enables the early detection system to be implemented as part of the registration systems of the Higher Education Institutions (HEIs), making it easy to identify students at risk of dropout in a timely manner.
Specifically, we address the following questions in this work:
RQ1.
What main personal and educational factors in the student information system may be used to predict whether a student will drop out?
RQ2.
Which machine learning (ML) classifiers are suitable for dropout prediction using the limited data from the registration systems?
RQ3.
How can the predictions be used to develop proactive policies for student retention?
RQ1 is answered by studying the contribution of each feature to the prediction performance of the machine learning algorithms and the correlation among the features. To answer RQ2, we compared the performance of the most frequently used machine learning algorithms. One of the crucial contributions of the current study is that it develops a framework that contains policy-making using dropout predictions so that a comprehensive student retention system can be implemented by the HEIs. To provide an answer to RQ3, we propose an explainable AI approach that clusters the students at risk of dropout and defines each cluster to identify the traits that can be targeted by tailored policies.

2. Literature Review

Predicting students at risk of dropping out is an active field of research in the data mining and machine learning fields. Researchers have studied this problem across different education levels such as secondary and tertiary education and also at different granularities, ranging from a single course to an entire country.
Wang et al. proposed an academic early warning system for Hangzhou Normal University, using extensive data from several different sources including, among others, the educational administration system, library, and various other units for 1712 students [11]. Their systems employed information such as student scores, impoverished student sheets, attendances, library borrowing and returning activities, the credit card records of the library management system, and the entrance guard information of the student dormitory management. The researchers identified credit obtained, average score points, and library lending information as key predictors. They experimented with three machine learning classification algorithms and found that the Naïve Bayes algorithm, utilizing data from students’ first three semesters and the library, provided more accurate predictions.. The researchers presented accuracies of 86% and above for all experiments; as expected, the accuracies increased in proportion with the amount of information, which included data from the first, second, and subsequent semesters.
Kabathova and Drlik conducted a study on course-level data from e-learning environments, exploring the features that can contribute to correct classification using different machine learning approaches [12]. The research focused on data understanding and the data collection stage and presented the limitations of existing datasets. They analyzed data available in a virtual learning environment on 261 students, spanning four academic years for an introductory course at Constantine the Philosopher University and showed that the features based on descriptive statistics of course activity, such as course access time and scores for tests, assignment scores, exams, and projects, contribute to correct prediction of course completion and non-completion. Prediction Accuracy ranged from 77% to 93% for unseen data. The authors also examined the homogeneity of machine learning classifiers, in addition to frequently used metrics, to overcome the effect of the limited size of the dataset. Their results showed that several algorithms performed well on the educational data used, but the classification performance metrics employed are crucial and need to be examined thoroughly.
Selim and Rezk developed a Logistic Regression (LR) classifier model that predicts students at risk of dropping out of school at compulsory primary and secondary education levels, using the Egyptian survey dataset of 2014 [7]. They proposed this model to help prevent many students from dropping out of school, which limits their participation in economic and social activities for the rest of their lives. The aim was to enable the school administrators or policymakers to resolve the problem early and identify students who are constantly vulnerable to the same problem. The researchers reported the performance of their proposed system using the Area Under Curve (AUC) metric as 77%. Selim and Rezk identified five main reasons causing Egyptian students to drop out of school: students’ chronic diseases, co-education, parents’ illiteracy, educational performance, and teachers’ attention.
Talamás-Carvajal et al. used machine learning techniques, namely Decision Trees, K-Nearest Neighbors (KNN), Naïve Bayes (NB), LR, Stacking Classifier, Adaptive Boosting (AdaBoost), and Extreme Gradient Boosting (XGBoost), to organize programs for students who enroll in university with lower-than-normal scores or to work on an early detection model for possible interventions for students who have difficulties in their academic performance [5]. Their model identified students at risk of dropping out of school and offered retention strategies, with little or no academic background data required. The stacking ensemble using the features extracted after the first semester resulted in an Accuracy of 88.41%.
Singh et al. developed a framework using XGBoost, Light Gradient Boosting Machine (LightGBM), SVM with a Linear Kernel Gaussian Naïve Bayes (Gaussian NB), Extremely Randomized Trees Classifier (Extra Trees), Bootstrap Aggregating (Bagging), Random Forest (RF), and Multi-layer Perceptron (MLP) Neural Network for predicting student performance, which can identify various factors that directly affect it, identifying students with low academic performance and suggesting corrective actions to reduce the dropout rate and low performance [13]. The researchers collected data from various sources and employed information ranging from academic to personal to identify the dropouts from specific departments in a university. The features utilized for training classifiers include, among others, high school grades from specific subjects, family related information such as parents’ work information, the psychology of the student, and scores in course assessments such as midterms and quizzes. The developed model can detect at-risk students with over 96.5% Accuracy using the Extra Trees ML classifier.
Rodríguez et al. designed a machine learning framework using Categorical Boosting (CatBoost), XGBoost, LightGBM, and Decision Tree classifiers to predict school dropout at levels below university education, as the problem of school dropout increased due to the COVID-19 epidemic [8]. Building on previous research, the researchers analyzed individual student paths by considering their school and family situations, along with various other factors and events, to predict dropout. Based on administrative data from the education system and known factors of school dropout, they also followed the methodology and created a model for the Chilean case. They employed and performed a thorough analysis of a very large range of features such as the grades of the student, average attendance rates, the number of times the student changed schools, health-related information on the students such as pregnancy, residences or municipalities where the student resided, etc. According to the results of the study, they obtained a 20% higher estimate of dropout rates than those obtained in previous studies with relevant sample sizes. The researchers reported an F1-score of 51.90% and a Geometric Mean Score of 90.39% as their highest performance.
Hassan et al. implemented a supervised ML methodology and empirically investigated it to predict and solve the problems of high student dropout rates in Somaliland [14]. The study gathered data from the source of the National Education Accessibility Survey (NEAS) 2022, in which 1957 households were surveyed. Several machine learning models were employed to forecast the dropout rates, such as Logistic Regression, Probit Regression, Naïve Bayes, Decision Tree, Random Forest, Support Vector Machine (SVM), and K-Nearest Neighbors (KNN). The overall dropout rate reported by empirical tests was 12.67%. The key dropout predictors included in the model are age, grade level, household income, housing type, and school type. According to estimated results, the Random Forest model was found to be the most successful ML technique in forecasting student outcomes, which provided the highest Accuracy rate of 95% among all the models that were examined.
Another similar study, which was undertaken by Cho et al., also implemented the machine learning algorithm to predict student dropouts at Sahmyook University by analyzing academic records from 20,050 students, covering the period 2010–2022 [15]. Cho et al. implemented six different machine learning models—Logistic Regression, Decision Tree, Random Forest, Support Vector Machine, Deep Neural Network, and Light Gradient Boosting Machine (LightGBM)—to investigate dropout rates by students who were enrolled at Sahmyook University. The key focus of their research was that they addressed the challenge of data imbalance in dropout cases. To mitigate this issue, they experimented with various oversampling methods, including SMOTE, ADASYN, and Borderline-SMOTE. Among the tested models, the LightGBM model has been found to be the most effective one, which reported the highest F1-score of 84%.
Likewise, Mduma, N. conducted data balancing techniques for predicting student dropout by using the ML approach, which is a challenging problem in the education sector [16]. Mduma intended to employ a data balancing technique for his estimations due to the imbalances of student dropout data. He reported that the number of enrolled students is always more than the number of dropouts. In this study, 57,348 records from the Uwezo dataset and 13,430 records from the India dataset were used together. The solution to the data imbalance issue was studied using Random Over Sampling (ROS), Random Under Sampling (RUS), Synthetic Minority Over Sampling Technique (SMOTE), SMOTE with Edited Nearest Neighbor (SMOTE-ENN), and SMOTE with Tomek Links (SMOTE-TOMEK). Such methods were conducted to enhance the prediction Accuracy of the minority class while maintaining satisfactory overall classification performance. These techniques were evaluated in combination with three widely used classification models, such as Logistic Regression (LR), Random Forest (RF), and Multi-layer Perceptron (MLP), which are in conformity with our estimation methods. The results demonstrated that SMOTE-ENN achieved the highest classification performance and Logistic Regression correctly classified the highest number of dropout students. The application of these models enables the development of early intervention strategies to reduce school dropout rates by ensuring that students at risk are accurately identified.
Similarly, Villegas-Ch et al. developed a model to predict student dropouts by integrating machine learning and artificial intelligence techniques into the sustainability of education [17]. The Support Vector Machine (SVM), Random Forest, Gradient Boosting, K-Nearest Neighbors (KNN), and Logistic Regression algorithms were used for estimating student dropouts. Villegas-Ch et al. collected data samples, which consisted of 500 students’ academic records, attendances, demographics, socioeconomic status, and engagement factors of participation in extracurricular activities during the 2021 academic year. The Neural Network model provided the highest dropout prediction, and the estimated results obtained are as follows: Precision 85%, Recall 80%, and F1-score 82%. The empirical results obtained by Neural Network are robust and the scores above 80% can be considered highly reliable.
The research recently undertaken by Kok et al. employed big data and applied a machine learning approach to identify key factors that are contributing to student dropout [18]; moreover, they developed a predictive model to enable education authorities to monitor students in real time and intervene when necessary. Kok et al. conducted a data sample with 197 students’ demographics and academic record information for the period 2006–2011 at a private university in Malaysia. The study carried out by Kok et al. examined information about students’ socioeconomic backgrounds and psychological factors. The Logistic Regression (LR) classification model was employed by Kok et al. and the estimated results reported that they achieved an Accuracy rate of 85%, Precision of 83%, and Recall of 80%, as well as a high F1-score rate of 81%, which revealed that academic performance is the most important predictor of student attrition. Additionally, early courses such as Mechanics and Materials, Machine Element Design, and Instrumentation and Control also significantly impacted dropout rates. The study recommended more proactive engagement strategies, targeted academic assistance, and curriculum adjustments that better support students in their core courses, which aimed to improve retention rates.
The majority of the work in dropout prediction using machine learning frameworks focused on improving the performance of the proposed systems analyzing the predictive power of the features employed. It can be seen in the previous discussion that most of the prior work has employed descriptive features, providing mainly static information on students. Diagnostic features representing the challenges faced by the students such as failures are also employed in some cases. Therefore, it can be argued that the machine learning research on dropout prediction has employed predictive, descriptive, and diagnostic features at various levels to improve the overall performance of the classifiers. Since the aim of educational institutions is to increase student retention, the main goal of these systems should be to provide the ability to develop or generate retention strategies for the continued enrolment of at-risk students. There has been increasingly more work conducted on this topic [14,17].
Existing works on student dropout prediction differ in the level and granularity of their target environment and employ data from different data sources such as virtual learning environments [12], registration systems [2,5,7,11,13,15,17,18], and surveys [7,14,16]. As the number and type of data sources and the amount of data or features used increase, the data processing tasks become intricate and time-consuming. The current study proposes a framework that retrieves a minimal amount of data from a single data source, namely only the registration system data available on student record sheets, ensuring that the proposed system is applicable to all tertiary institutions.

3. Methodology

3.1. Data Collection and Dataset Description

The dataset utilized in this study comprises information from the registration system of Eastern Mediterranean University (EMU) pertaining to 20,974 students who enrolled during the academic years 2015–2016 through 2019–2020. Of these records, 12,453 correspond to undergraduate students who graduated, while the remaining 8521 correspond to students who dropped out as shown in Table 1. As the table shows, the overall ratio of the majority to the minority class in our dataset is 3:2. The resulting imbalance ratio of 1.5 is considered a slight imbalance that is not expected to pose a problem to ML classifiers [19]. Therefore, the current study did not employ any explicit oversampling or undersampling techniques.
The retrieved data were divided into training and testing datasets using random sampling, with a 70:30 ratio, to train the machine learning algorithms. The ML models were tested using the remaining unseen 30%.

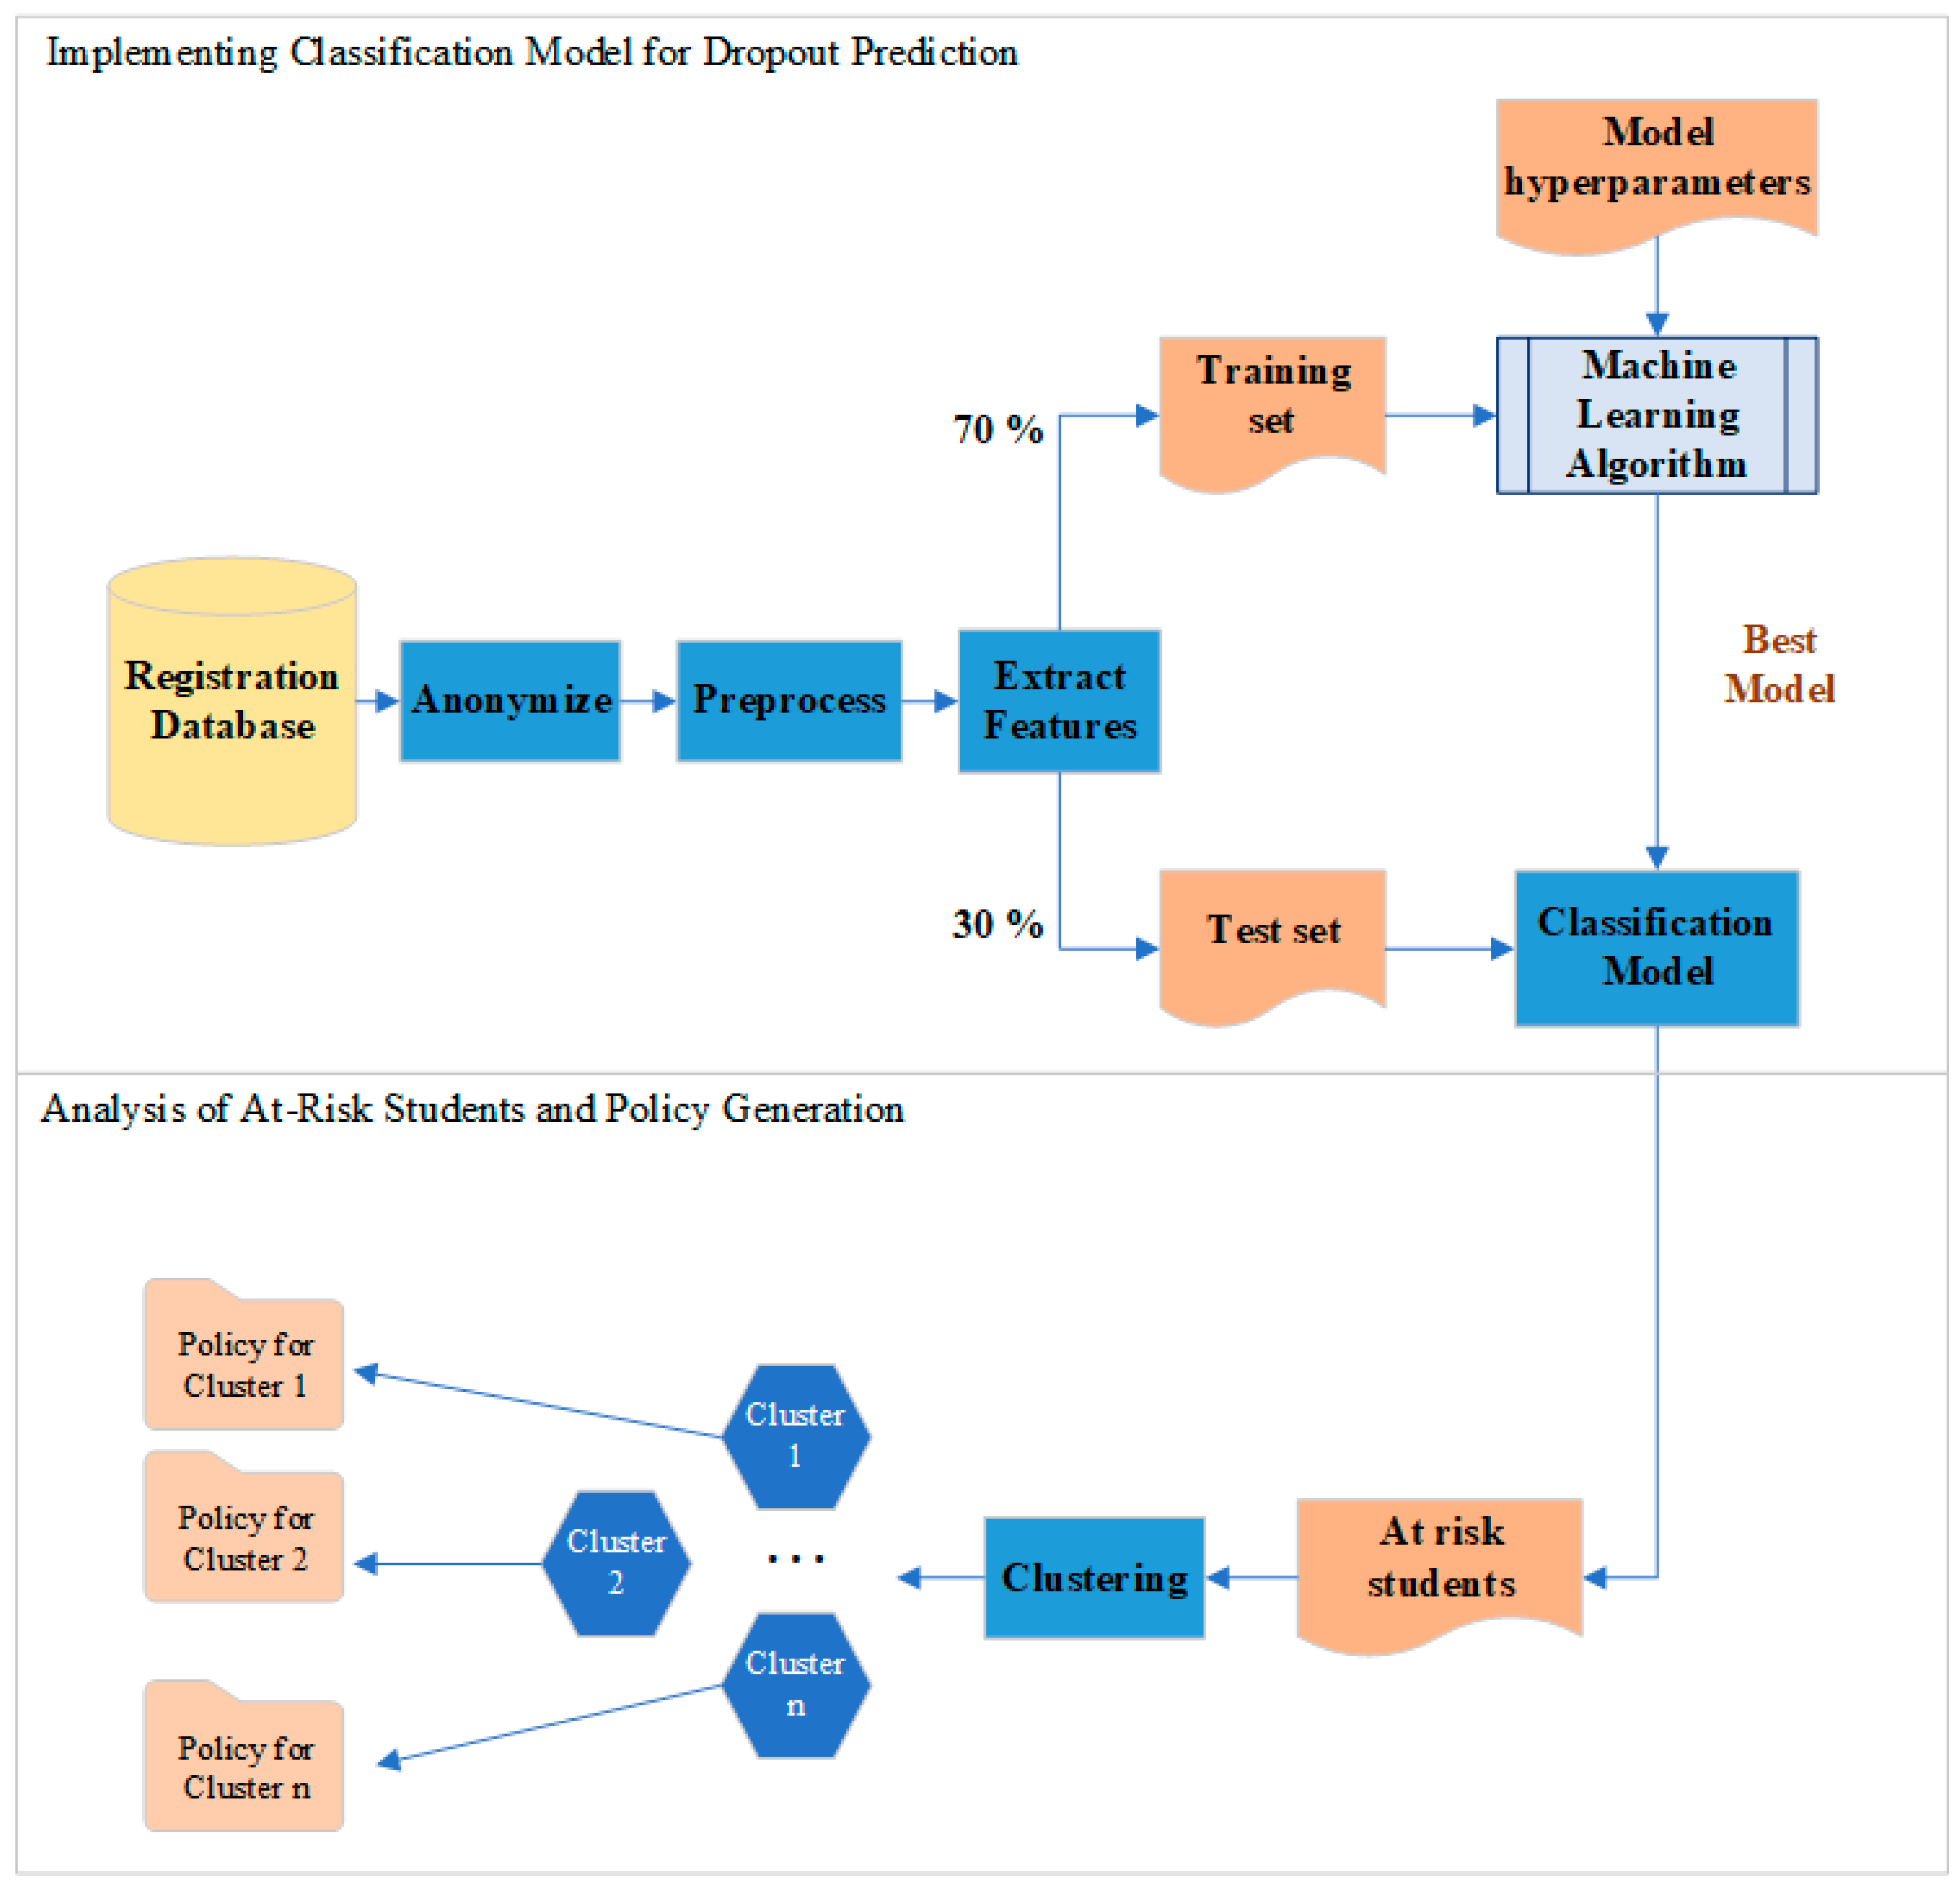
3.2. Proposed Framework

The framework proposed for early prediction of dropouts at the end of the first year of enrolment is presented in Figure 1. This framework is a well-established ML classification framework where the ML classifiers are trained using training data and the performance is evaluated using the previously unseen test data; the same framework was used for dropout prediction by the authors of [7,14,17].
The top part of the figure corresponds to the training and testing of the ML algorithms to design a classifier for dropout prediction. As the figure shows, the data retrieved are anonymized and pre-processed prior to feature extraction. The ML algorithms are fine-tuned to improve performance. Once a classifier is implemented, it is used as shown in the second part of the figure to analyze and visualize the students at risk of dropout using tools such as clustering and decision trees. This process is intended to enable policymakers and HEI administrators to develop and generate specific policies tailored for at-risk students.

3.2.1. Data Pre-Processing and Feature Extraction

The data preparation process for training the machine learning models consisted of three stages. In the first stage, data including key demographic details and first-year performance of the students was anonymized and extracted from the registration system database. To ensure anonymity, all identifying information was removed, and specific dates in the registration system were generalized to include year and month only. In the second stage, the data were pre-processed to remove extraneous details resulting from the process of compiling data from various modules within the registration system. The data retrieved contained missing values, which were resolved by inserting the mean of the respective feature into numerical fields and using random assignments for categorical data, such as gender. During the third stage, shown as a feature extraction block in Figure 1, all non-numeric data, including registration year, registration date, nationality, gender, faculty, department, high school graduation date, and status, were encoded to prepare the dataset for machine learning classifiers. Furthermore, course registration information was processed to extract academic performance metrics, such as the number of courses passed and failed by the student in the first semester, the number of courses passed and failed by the end of the second semester, and the number of courses the student is currently repeating.
Table 2 presents the features extracted. As the table shows, 5 features are categorized as demographic information, 7 features are categorized as enrolment, and 5 features are categorized as academic performance information. Demographic features define the student by providing personal and background information of students and are known prior to registration. Enrolment features define a student by providing information related to the timing and the process of student enrolment at the university and are known at the time of registration. Academic performance features are related to students’ performance in their courses. Since the aim is to predict the at-risk students, using solely the data available at the registration systems for generating transcripts, information such as course attendance or detailed performance metrics such as letter grades or exam scores are not included. The academic performance features employed in the current study are high-level features that are available at the end of the semester in the transcript or end-of-semester report. As shown in Table 2, the features used in this study are mainly descriptive features such as gender and age, providing factual information on the students. The entry type of the student and scholarship rate may be correlated with the student’s prior success and can be considered as predictive features. The features about the number of courses failed can be thought of as diagnostic features representing the struggles of the students. It should be noted that it is possible to use more informative predictive or diagnostic features, such as the entrance exam or evaluation scores or the courses that the students have failed, as such information is also available at the majority of the registration systems, but for this study, a more limited and general set of features was considered.

3.2.2. Machine Learning Models Used

We tested eight of the most frequently employed machine learning algorithms during the dropout prediction phase of the proposed framework, allowing us to identify the highest-performing model for predicting at-risk students. Following the prediction stage, two additional machine learning algorithms were applied to visualize the students identified as at risk of dropout, supporting the policy-making phase. Below, we provide brief definitions of all 8 machine learning algorithms used for predicting at-risk students in this study:
  • Support Vector Classifier (SVC) is a model designed especially for binary classification problems. It is a statistical learning method that can handle both linear and nonlinear problems by constructing a line or hyperplane to separate the data into different classes. Kernel tricks such as radial basis function (RBF) are used to map the data into higher dimensional spaces to allow the classification of nonlinear data using hyperplanes [14,20].
  • K-Nearest Neighbors (KNN) is a lazy algorithm that determines the class of a sample by assigning a given sample to the class that is most frequently represented among its “K” nearest data points based on a similarity measure. This approach relies on the principle that similar data points tend to be close to each other in the feature space [21].
  • Random Forest (RF) is an ensemble learning algorithm that enhances predictive performance by combining the outputs of multiple decision trees. Each tree in the Random Forest is trained on a random subset of the data, and the final prediction is determined by aggregating the predictions of all individual trees. Ensemble methods aim to produce a more robust and superior model by combining several weak learners [20].
  • The Categorical Boosting (CatBoost) algorithm model is effective in classification problems. CatBoost uses categorical variant-specific variations of gradient boosting algorithms to improve the handling and use of categorical variables. Categorical variables are variables that have non-numeric values that represent class labels in classification problems [22].
  • Multi-layer Perceptron (MLP) is a fully connected feedforward Artificial Neural Network class. MLP creates a model for classifying data using multi-layer neural networks [11].
  • The Naïve Bayes (NB) algorithm is based on Bayes’ theorem and the assumption of independence between features. NB is a probability-based model that is effective in classification problems [12].
  • Logistic Regression (LR) is a statistical model used to explain or predict a dependent variable (usually a categorical or binary variable) by a set of independent variables. LR is used to estimate the probability distribution of the dependent variable [23].
  • Classification and Regression Trees (CART) is a machine learning algorithm used for classification and regression tasks. The purpose of this algorithm is to give the piecewise constant estimator of a classifier or a regression function from the training sample of observations. This algorithm creates branches and leaves by splitting the dataset to create decision trees. It is based on binary tree-structured partitions and a penalized criterion that allows some “good” tree-structured estimators to be selected from a large collection of trees [24].
Table 3 presents a comparison of the ML classifiers employed in the current study. It can be seen that SVC, MLP, RF, CatBoost, and CARTs are computationally more demanding compared to KNNs, NB, and LR, which are simpler algorithms. Furthermore, the ensemble-based ML algorithms CatBoost, RF, and CARTs are known for their inherent capabilities to handle slight imbalances during their training process [25].
A challenge of the machine learning frameworks is the interpretability of the results. Specifically for dropout prediction, it is not sufficient to predict the students who are likely to drop out. The framework must provide policymakers with tools and information they can use to devise intervention strategies or retention policies. To enable the decision-making and policy-generation process, the current study clusters the students into categories and then fits a decision tree to allow verbalization of the clusters. These clusters are used as visualization tools to support the policy generation process. These ML algorithms are briefly described below:
  • The clustering (K-means) algorithm applies a simple and straightforward approach to divide a particular dataset into a specified number of clusters [41]. The aim is to form the clusters so that inter-cluster similarities between the members of a cluster are maximized. At the same time, each cluster is expected to be dissimilar to all other clusters; that is, the intra-cluster similarities are minimized.
  • The Decision Tree (DT) algorithm is a supervised learning algorithm used frequently for classification problems [42]. The decision tree method creates a model in the form of a tree structure consisting of a root, inner nodes that are decision or feature nodes, and leaf nodes that represent the target class. The root and inner nodes contain predicates, i.e., they are labeled with a question. Branches leaving these nodes indicate possible answers to the predicate. Thus, each decision node represents a prediction for the solution of the problem [43].

3.2.3. Evaluation Measures

The evaluation of classifier performance in this study is conducted using the metrics of Recall, Precision, and F1-score. These evaluation metrics are based on the prediction performance indicators True Positive (TP), True Negative (TN), False Positive (FP), and False Negatives (FN), which are defined as follows:
A c c u r a c y = T P + T N T P + F P + T N + F N
P r e c i s i o n = T P T P + F P
R e c a l l = T P T P + F N
F 1 S c o r e = 2 × R e c a l l × P r e c i s i o n R e c a l l + P r e c i s i o n
W e i g h t e d F 1 S c o r e = i = 1 N S u p p o r t i × F 1 S c o r e i i = 1 N S u p p o r t i
M a c r o F 1 S c o r e = 1 N i = 1 N F 1 S c o r e
The value TP represents the total number of positive entries in the dataset that are predicted correctly as positive by the classifier, whereas FP represents the total number of negative entries in the dataset that are incorrectly predicted as positive by the classifier. Similarly, TN represents the total number of negative values the classifier predicts correctly as negative, and FN represents the total number of positive entries that the classifier predicts incorrectly as negative.
As demonstrated in Equation (1), Accuracy provides the ratio of correctly identified instances to the total number of instances in the dataset. The Precision shown in Equation (2) represents the ratio of correctly predicted positive instances to the total number of positive predictions. On the other hand, Recall, which is also known as sensitivity, represents the ratio of the correctly predicted positive samples to the total number of positive samples in the dataset as presented in Equation (3). The F1-score given in Equation (4) is the harmonic mean of Precision and Recall and is the preferred metric in cases where the dataset is imbalanced. When aggregating the performance of multiple classes, the weighted F1-score shown in Equation (5) averages the F1-score of the classes by considering their distribution in the dataset. Thus, it assigns more weight to the majority class that has more instances. In Equation (5), Supporti is the number of true instances in class i. On the other hand, the Macro F1-score given in Equation (6) computes the average of F1-scores calculated for each class independently, treating each class equally regardless of the number of instances it contains.
Using the F1-score, Macro F1-score, and weighted-average F1-score provides a comprehensive evaluation of classifier performance. The F1-score is useful for assessing the balance between Precision and Recall for individual classes. The Macro F1-score gives equal importance to all classes, which is valuable when dealing with imbalanced datasets. The weighted-average F1-score, in contrast, considers the size of each class and hence ensures that the classes influence the overall score in proportion to their occurrence. Therefore, for imbalanced datasets, where the minority class is the target, the Macro F1-score is more suitable. Unless stated otherwise, the term F1-score refers to the Macro F1-score when discussing our experimental results.

4. Experimental Results and Discussion

4.1. Feature Analysis of the Dataset

In order to answer RQ1, we studied the contribution of each feature to classifier performance. It should be noted that due to the nature of the dropout prediction task that requires timely results, the current study employed only a limited set of demographic and educational features available on the student record sheets.
Feature importance is a technique used to understand the importance or contribution of a feature to the prediction of a given model. A feature importance graph presents the relative contribution of each feature to the classification process, thereby enabling the evaluation of which features are crucial for the performance of the underlying machine learning algorithm.

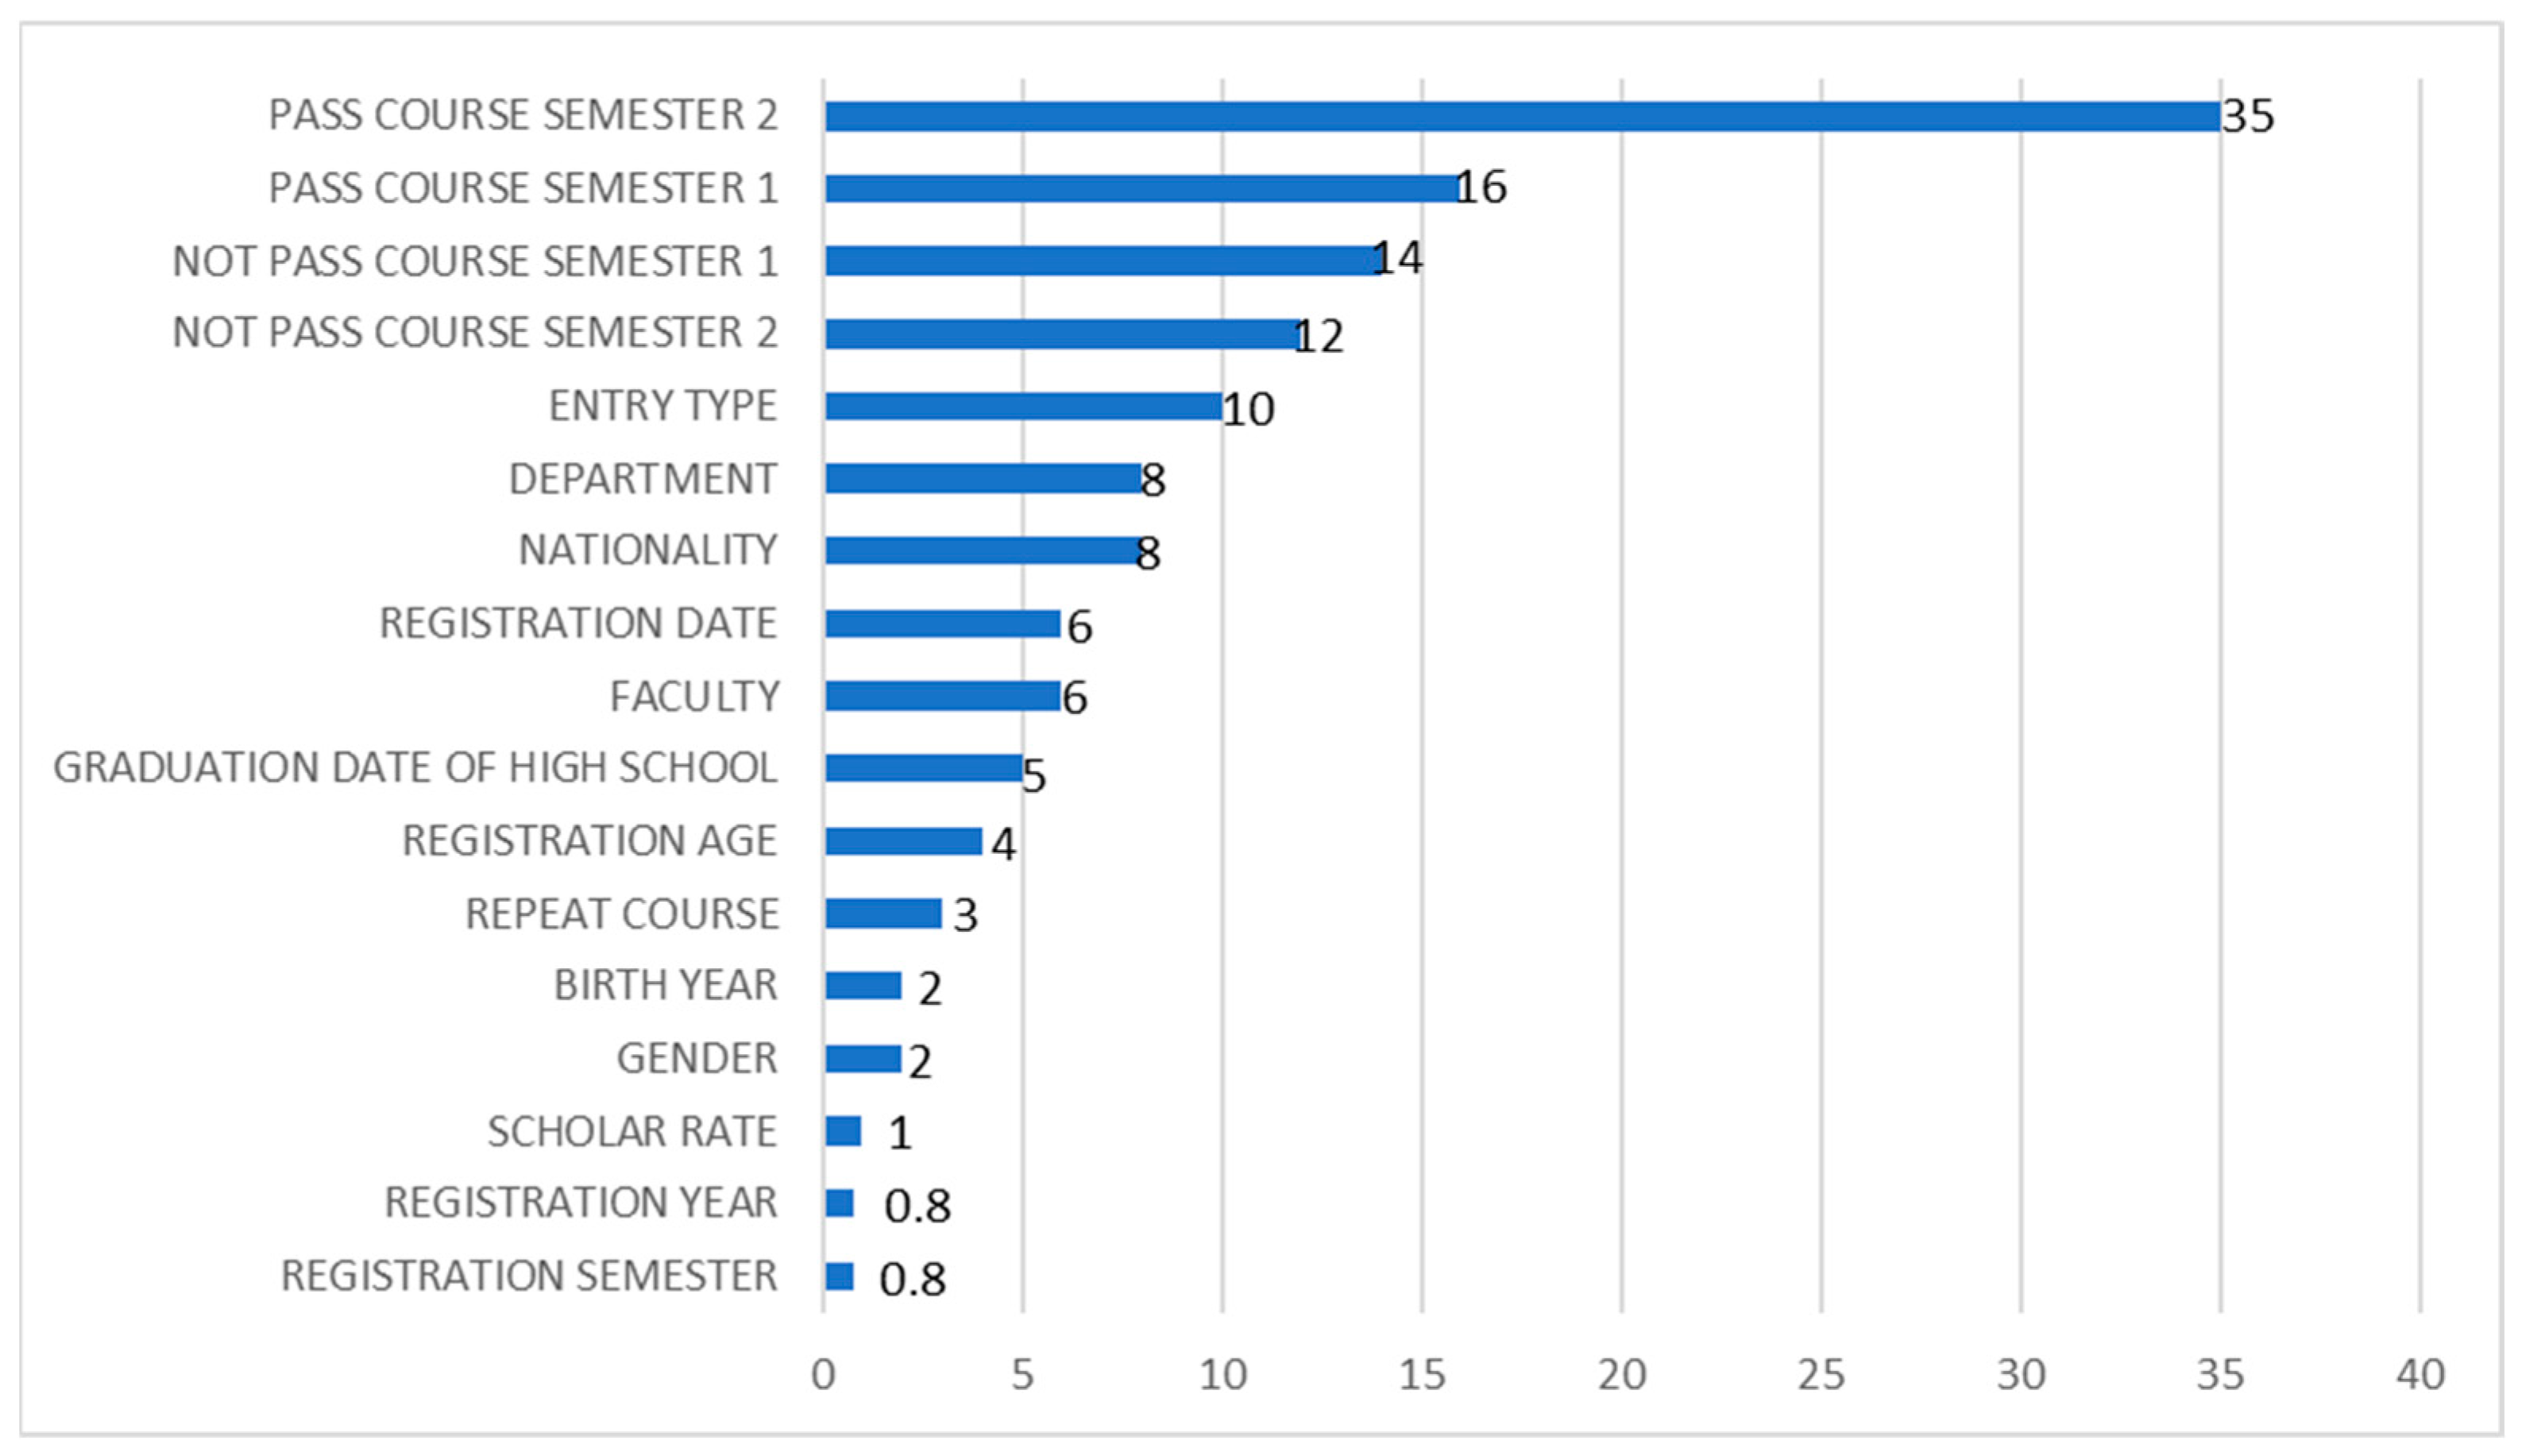
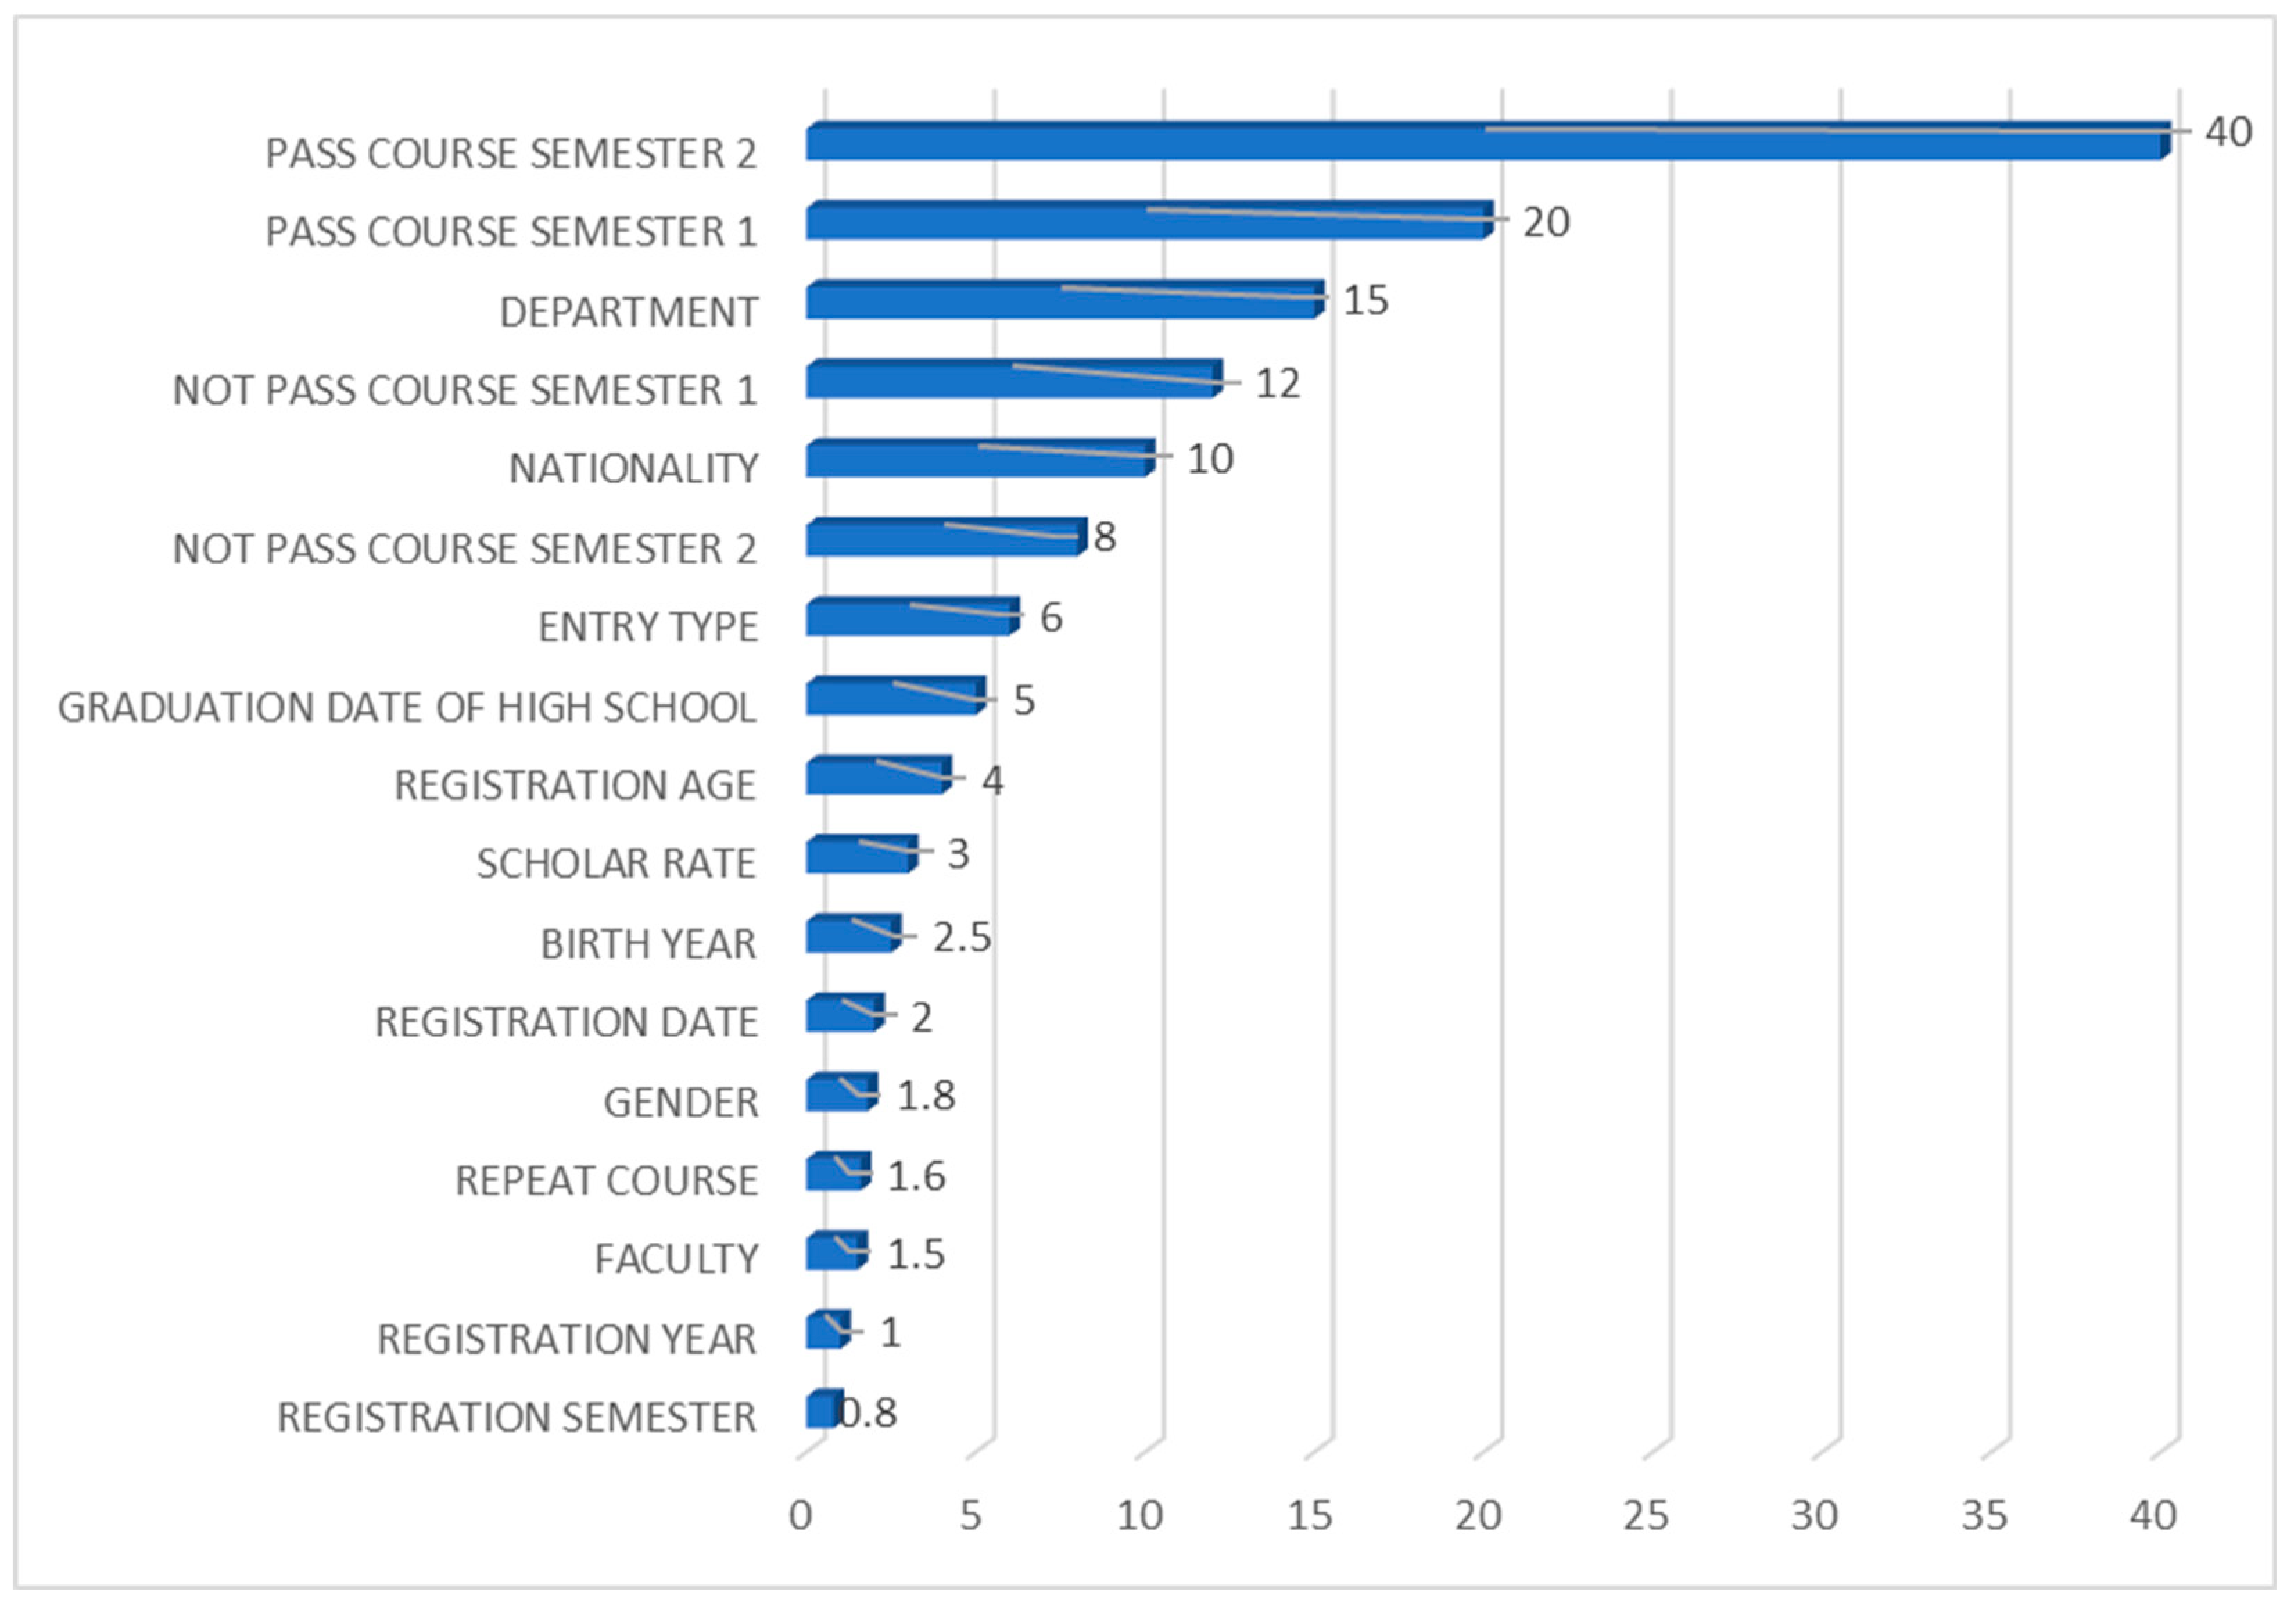
4.1.1. Feature Importance Analysis for the Random Forest Classifier

It can be seen in Figure 2 that the number of courses a student passed at the end of the second semester is significantly more important than the other features for increasing the classification performance of the RF classifier. This is followed by the number of courses passed at the end of the first semester. The total number of courses failed by students at the end of the first semester and the second semester, respectively, follow in importance. Figure 2 shows a gradual decline in the importance of the remaining features, with registration year, semester, and scholarship rate showing negligible contributions to prediction Accuracy.

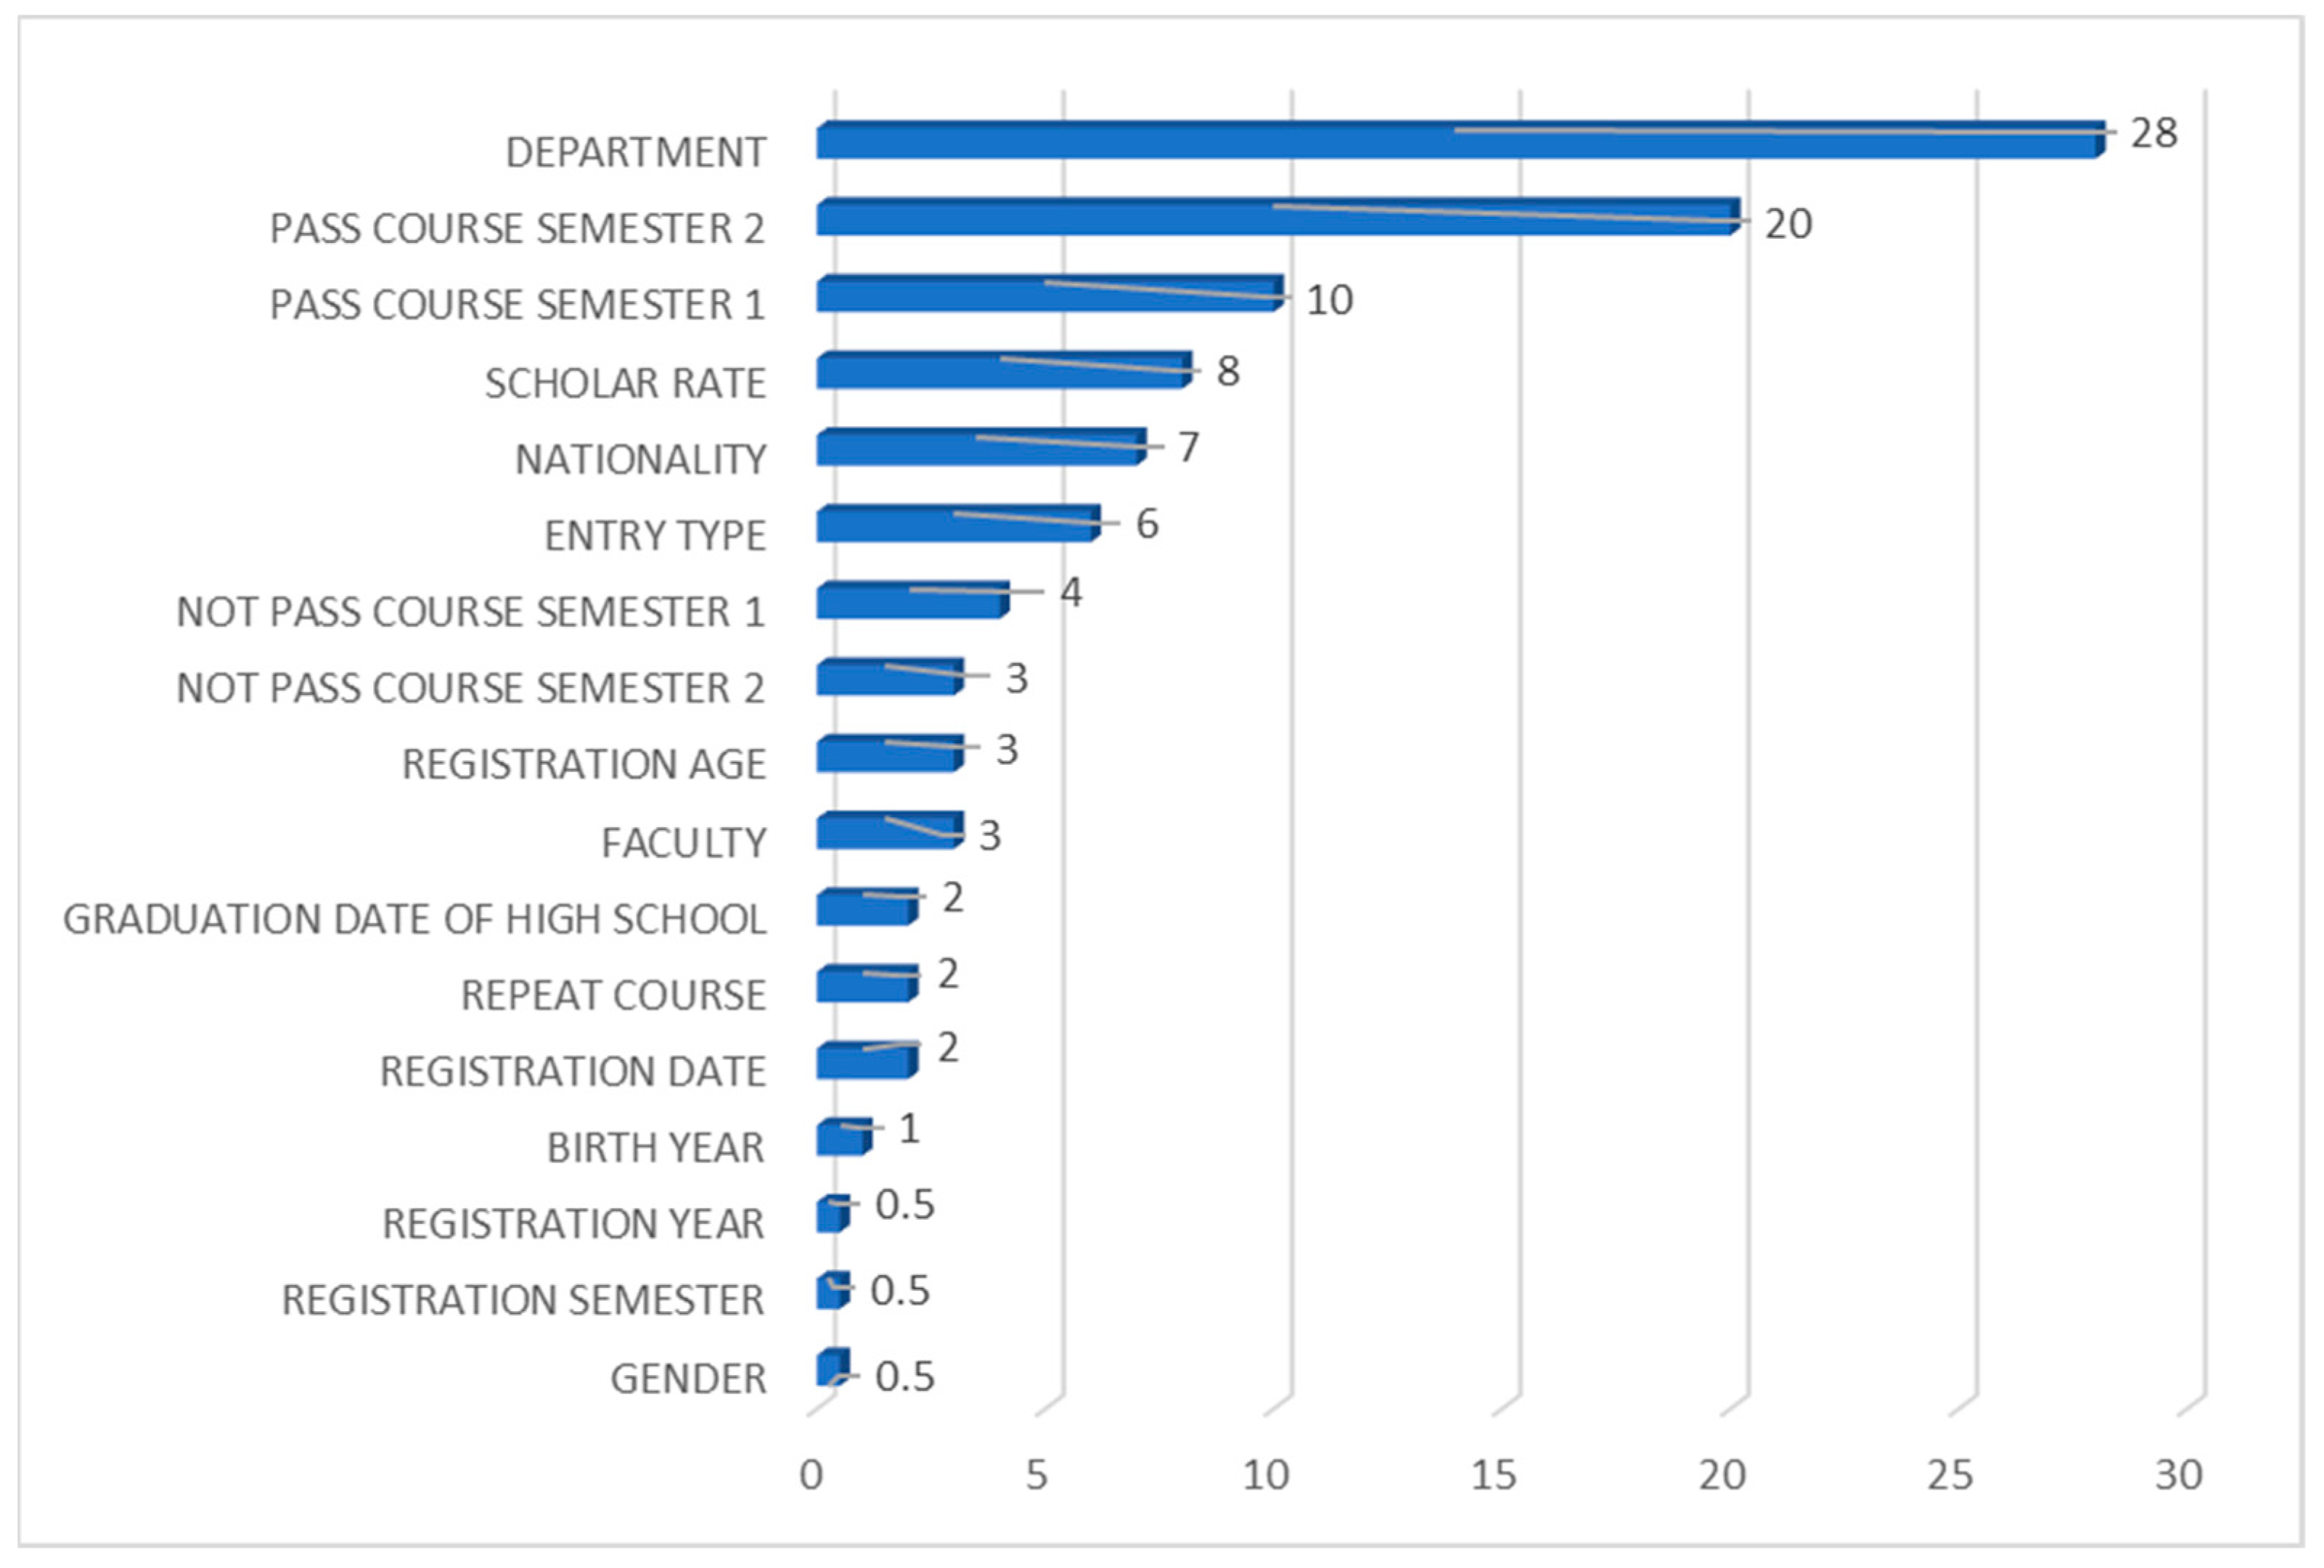
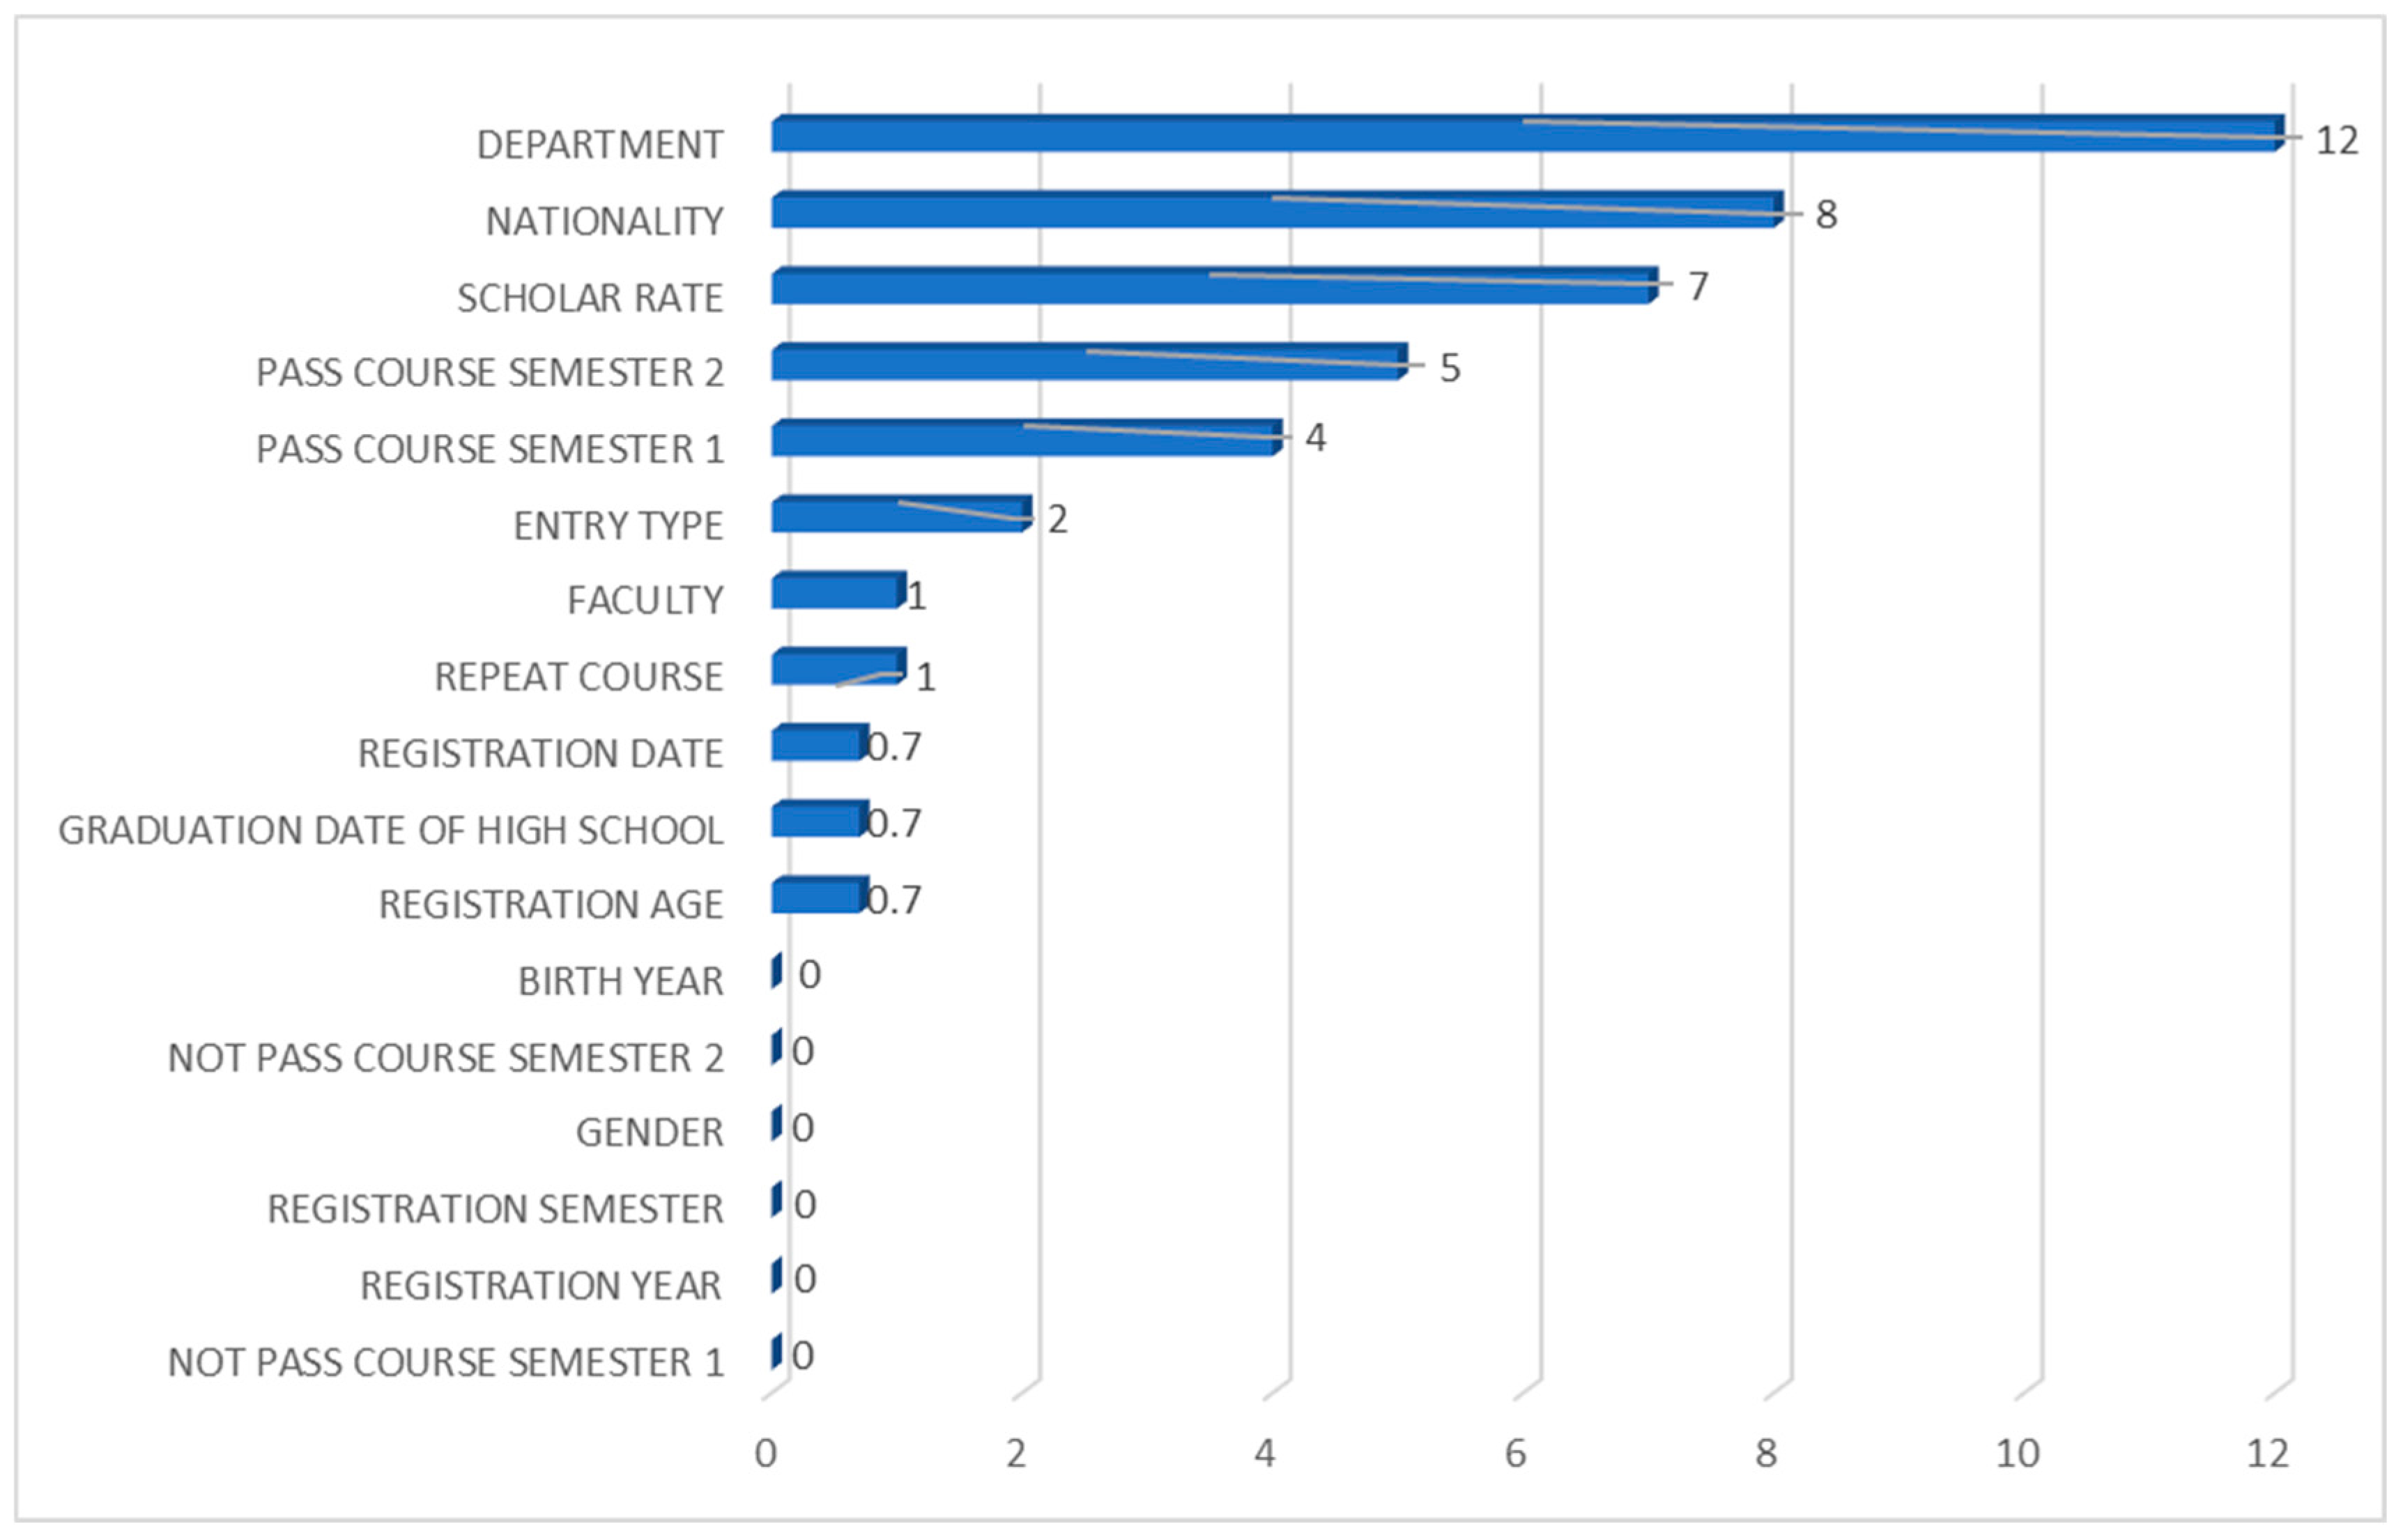
4.1.2. Feature Importance Analysis for the Support Vector Classifier

Figure 3 illustrates that for the Support Vector Classifier, the department of the student is the most important feature when deciding whether the student will drop out or not. This is followed by two positive academic metrics namely the number of courses the student has passed at the end of the first semester and the total number of courses the student has passed at the end of the second semester, respectively. The scholarship rate and nationality of the students follow in importance. It can also be deduced from Figure 3 that date-related features, such as registration date, birth year, registration year, and registration semester, as well as gender, do not contribute to the prediction Accuracy.

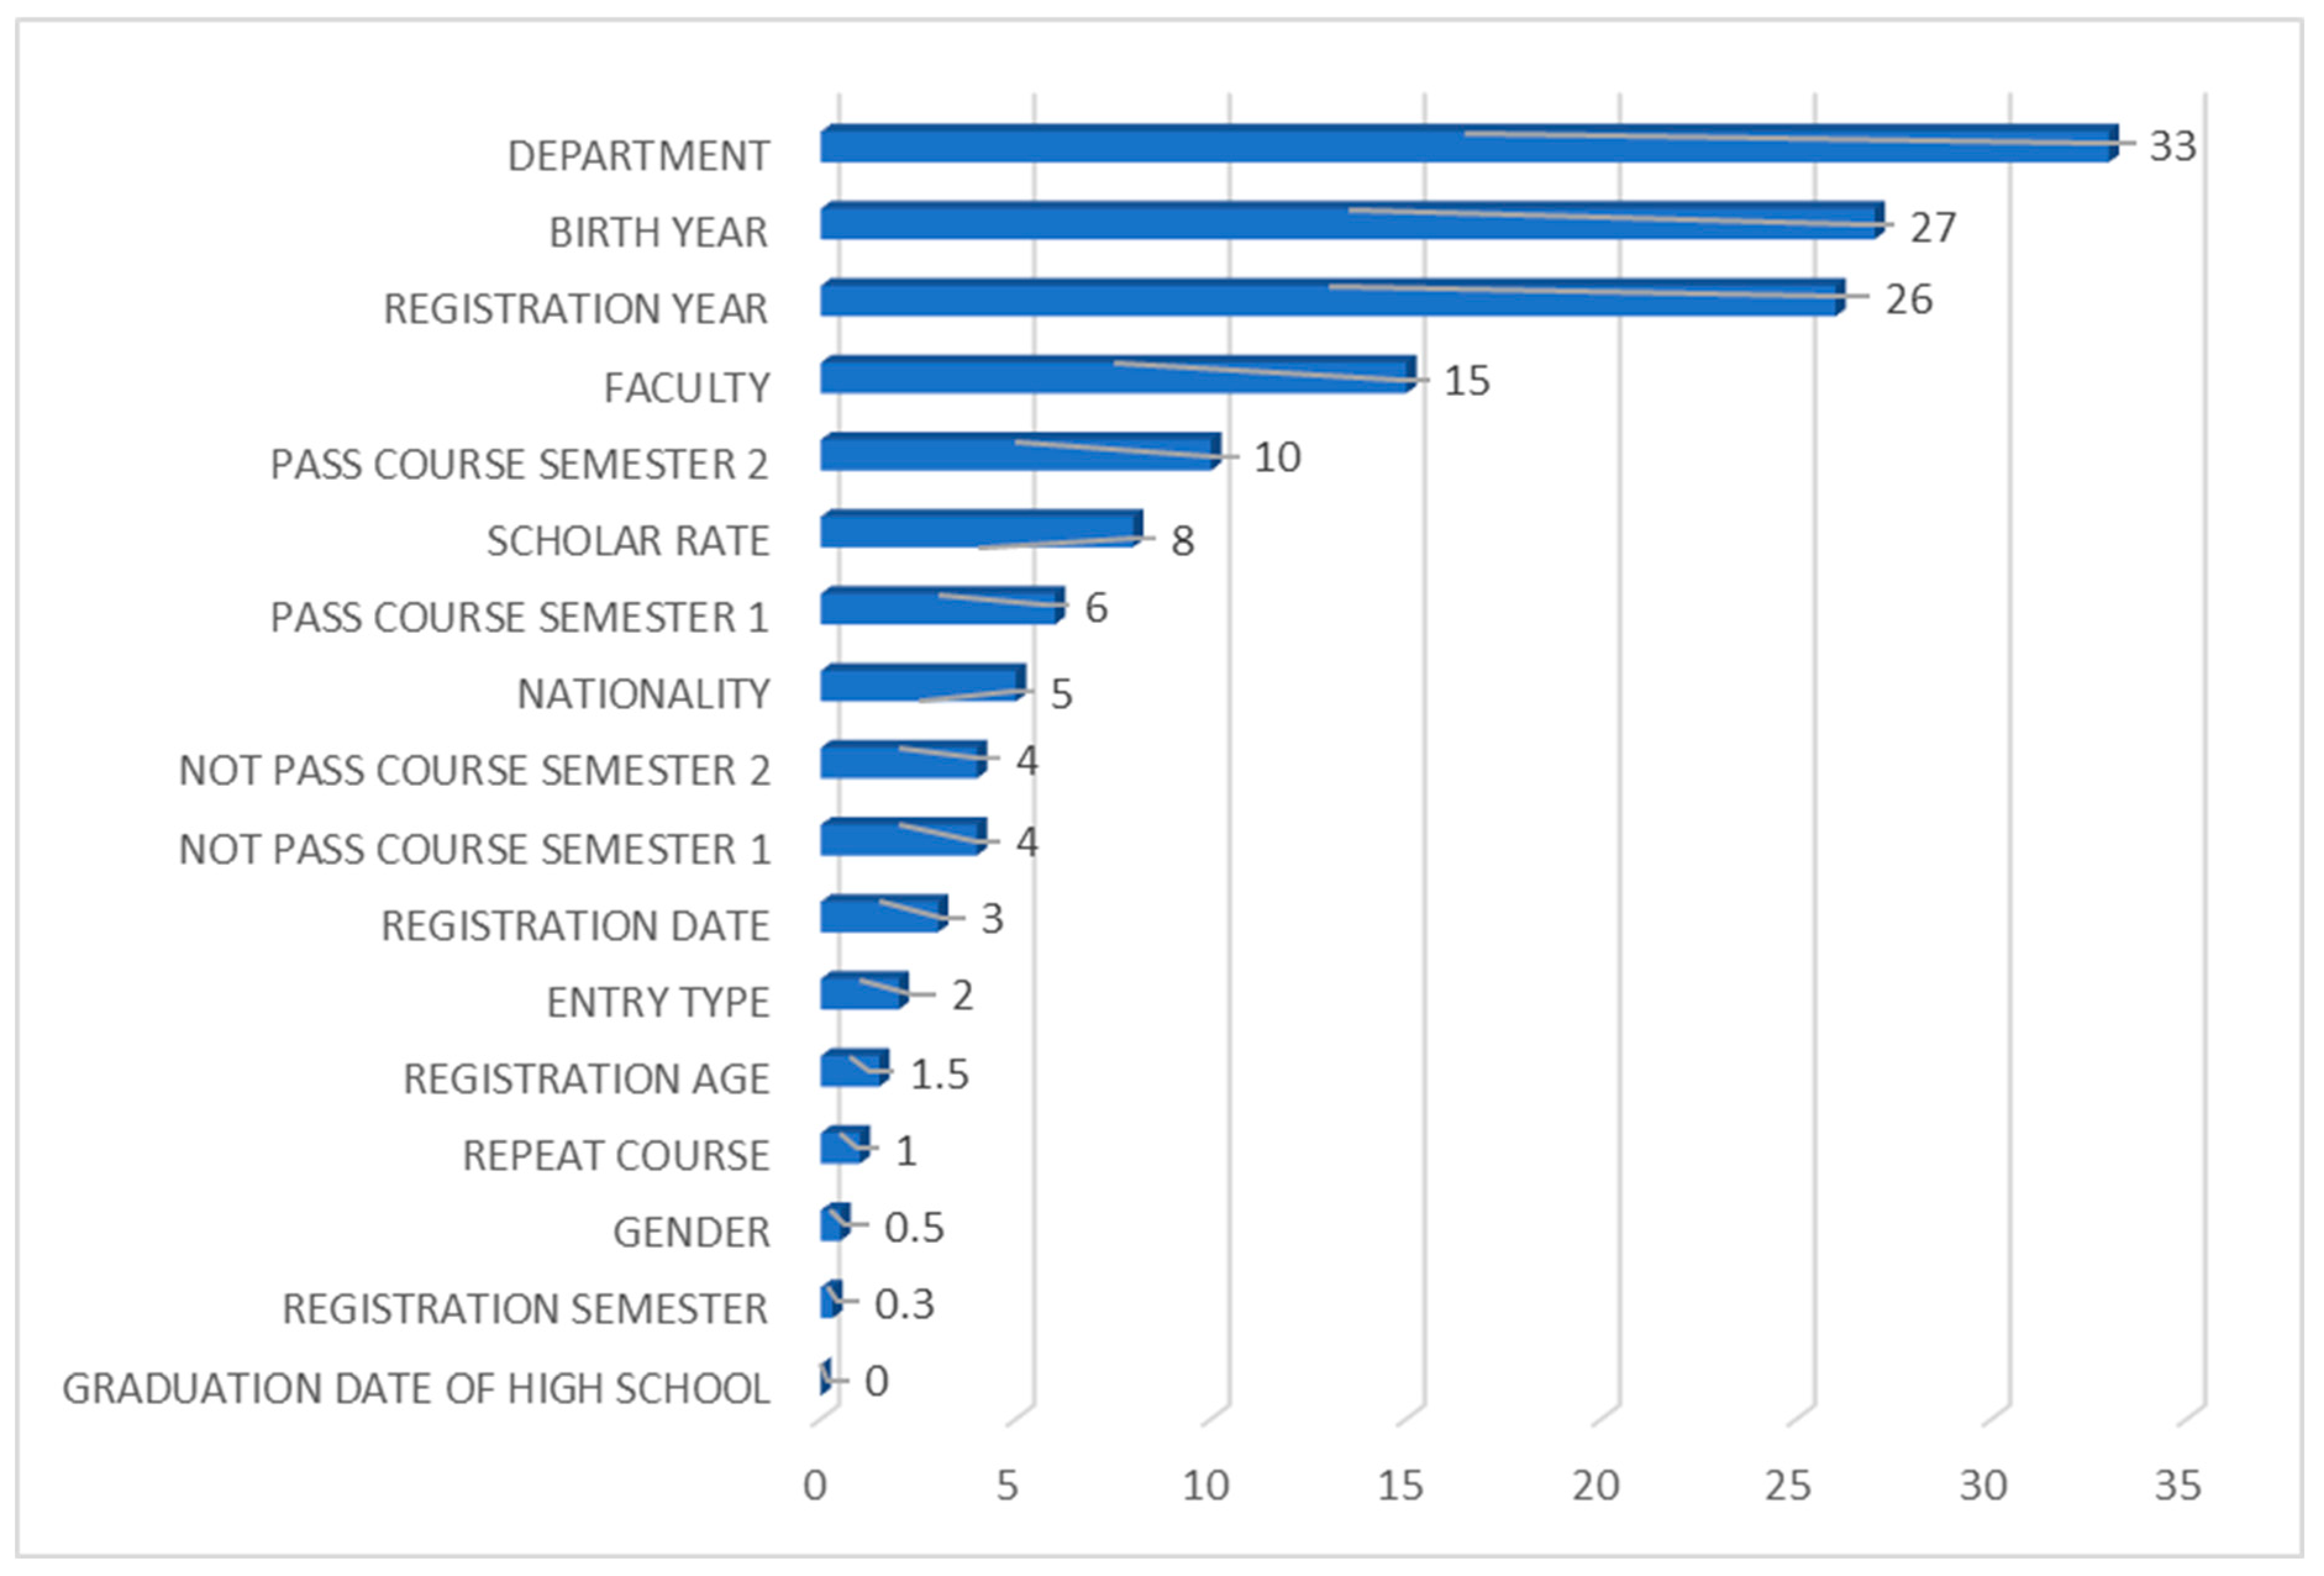
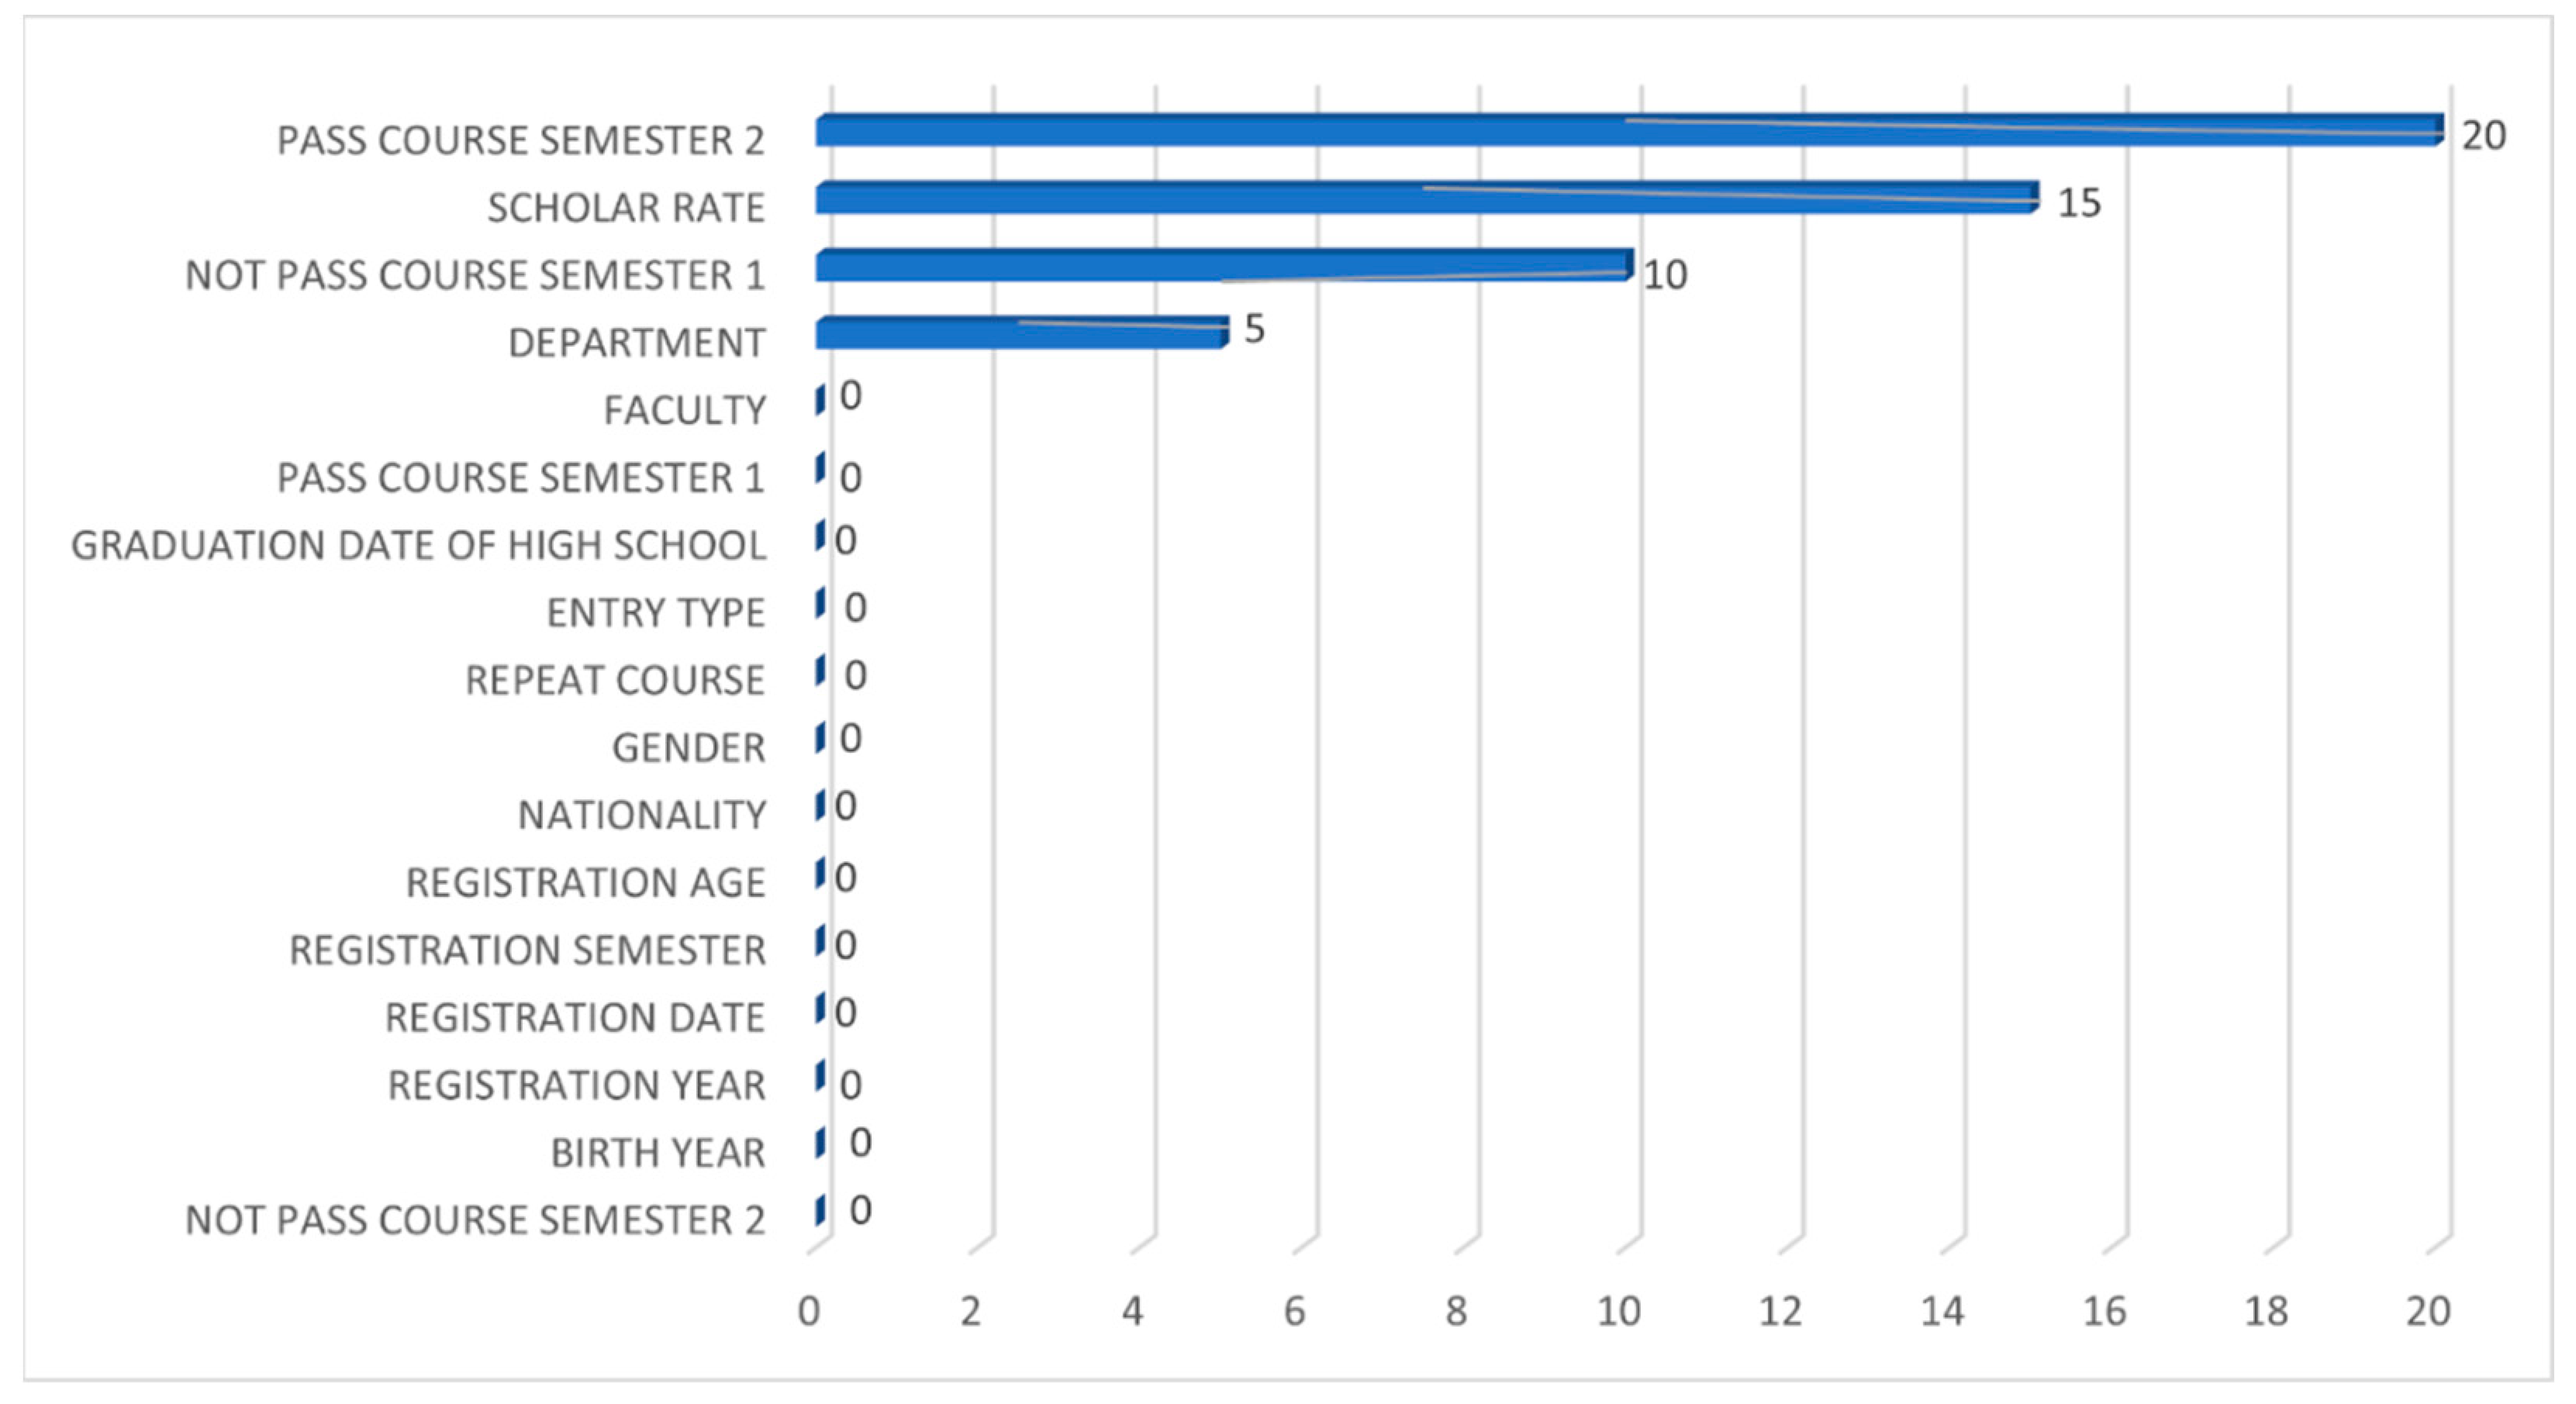
4.1.3. Feature Importance Analysis for the Logistic Regression Classifier

Figure 4 presents the feature importance plot for the Logistic Regression classifier using the extracted dataset. It is noteworthy that the top four important features contributing to the classification of the LR model are the student’s department, birth year, registration year, and faculty, none of which are directly related to the student’s academic performance. Following these are the number of courses passed by the student at the end of the second semester, the student’s nationality, and the number of courses passed at the end of the first semester.

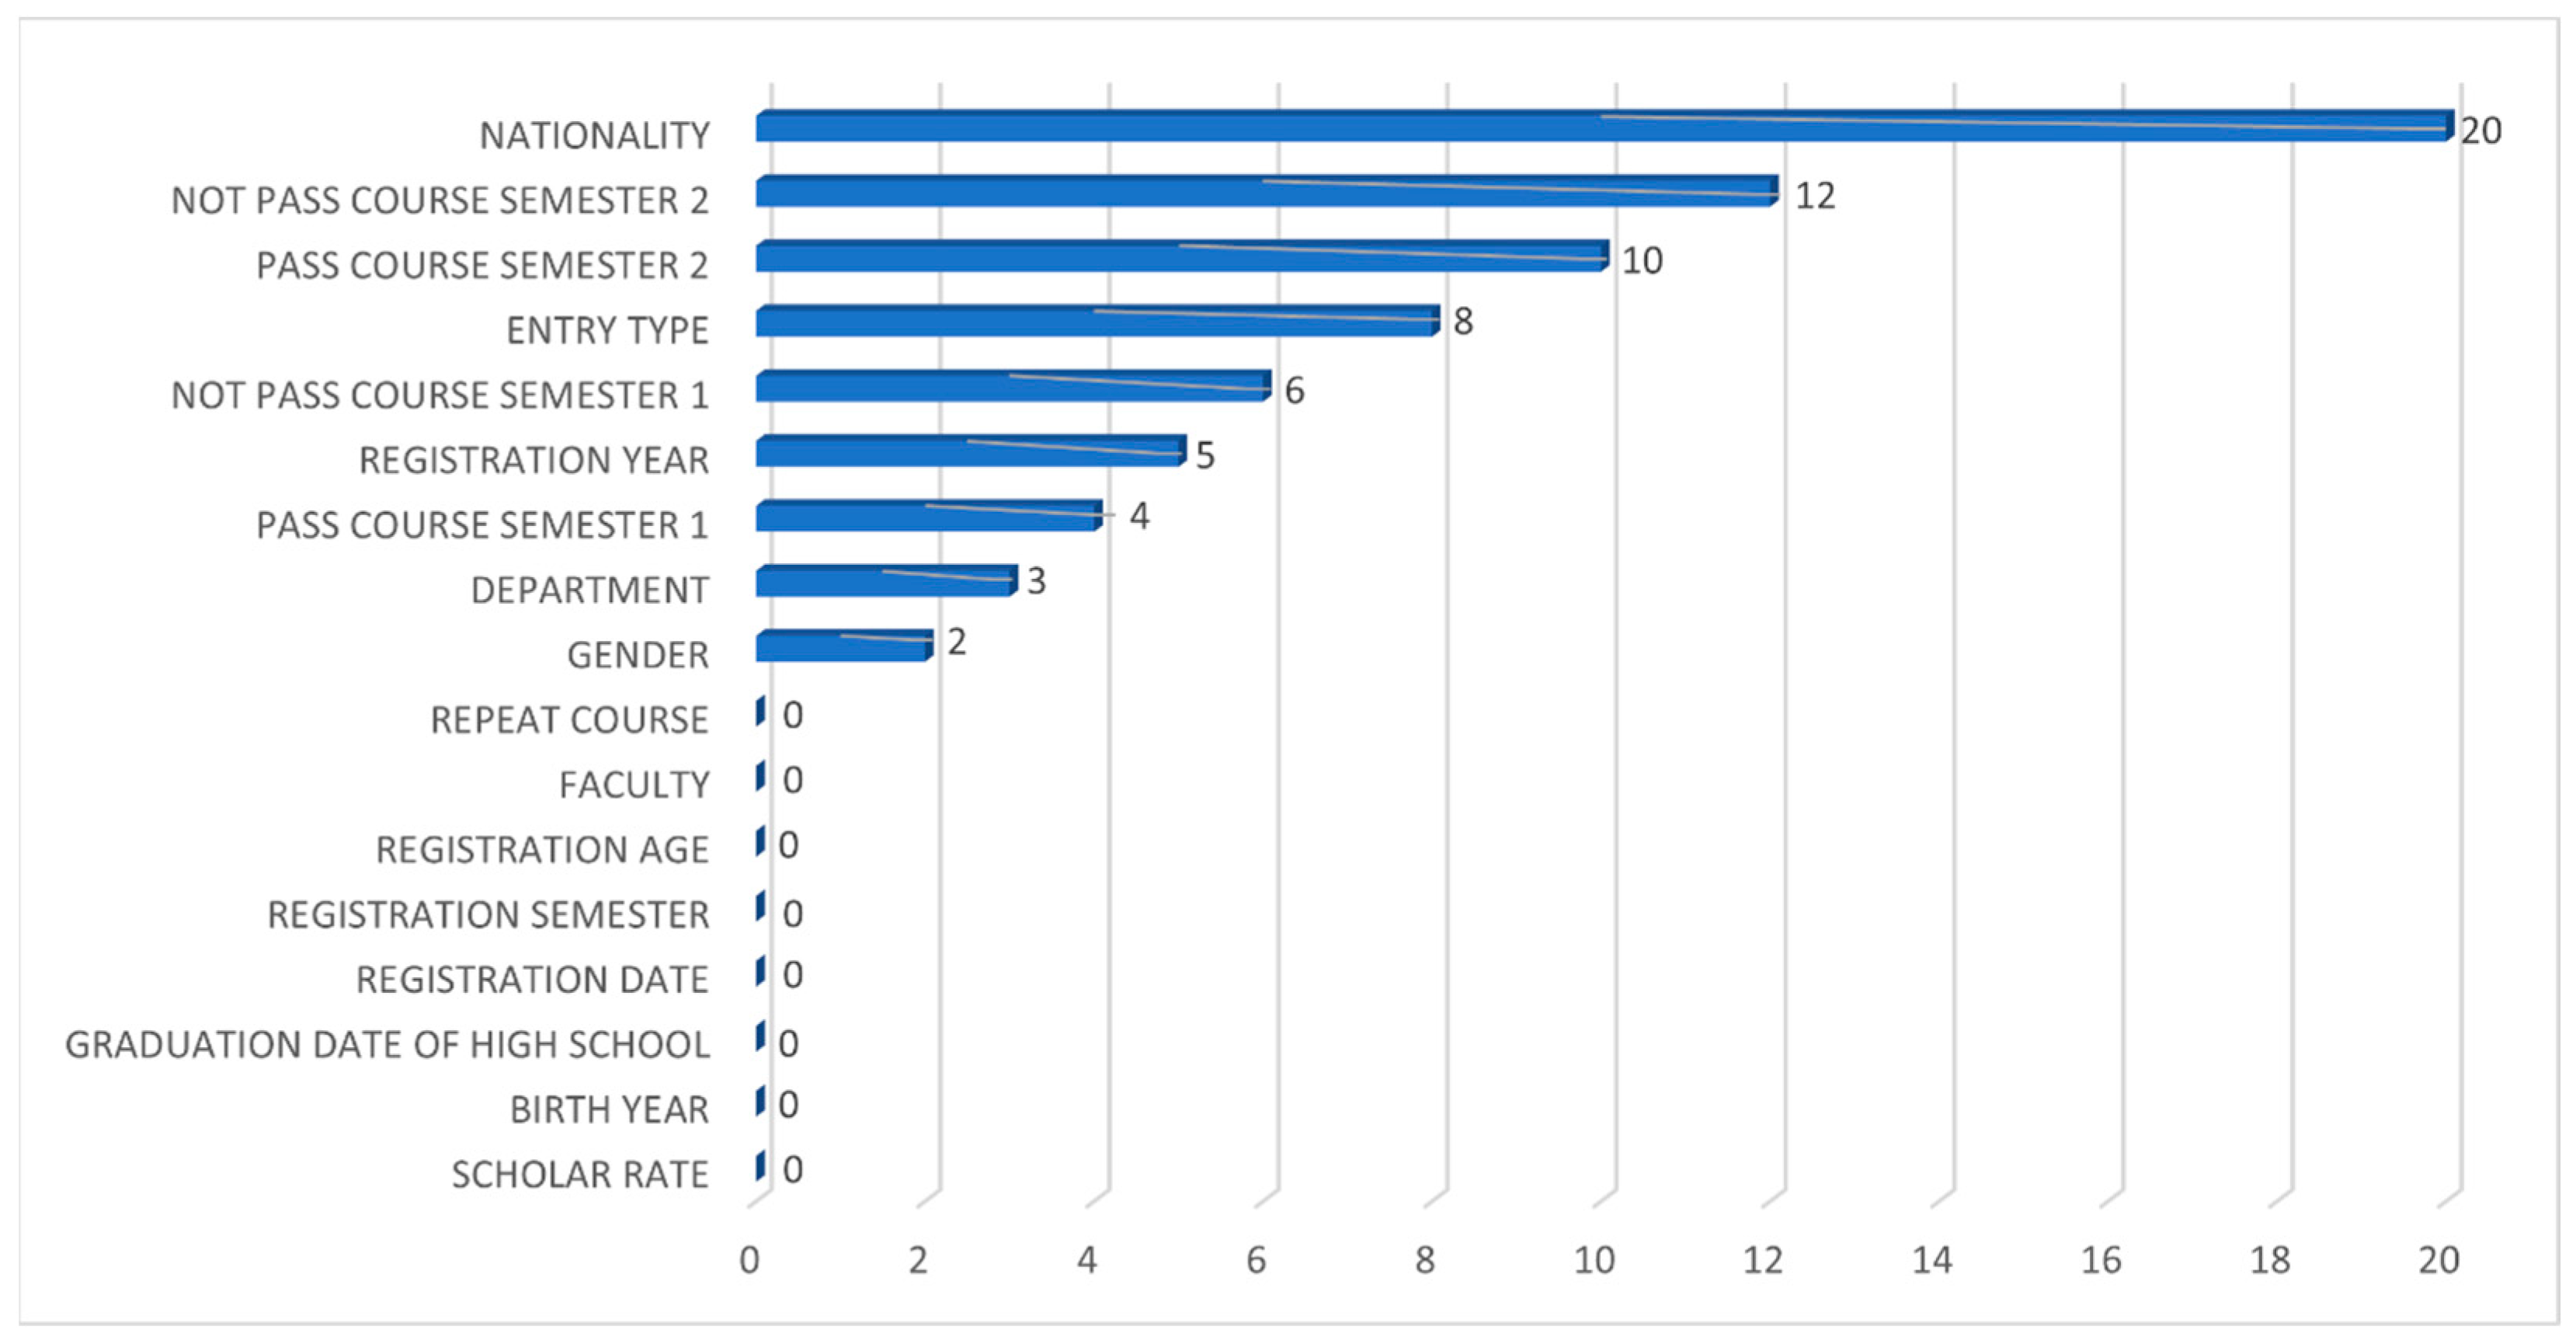
4.1.4. Feature Importance Analysis for the Categorical Boosting Classifier

For the Categorical Boosting classifier, the number of courses a student passed by the end of the second semester is the most important feature as indicated by Figure 5. This is followed by the number of courses passed at the end of the first semester. The department of the student and total number of courses failed by students at the end of the first semester and nationality, respectively, follow in importance. It can also be deduced from Figure 5 that the registration year or semester and faculty do not contribute to the prediction Accuracy.

4.1.5. Feature Importance Analysis for the K-Nearest Neighbors Classifier

The feature importance graph of K-Nearest Neighbors is shown in Figure 6. As the figure shows, the most important feature for the K-Nearest Neighbors classifier is the department and the second is the student’s nationality. These are followed, respectively, by the scholarship rate, the number of courses passed at the end of the first semester, and the number of courses passed at the end of the second semester. Furthermore, it can be deduced from Figure 6 that the registration year and registration semester do not contribute to the prediction Accuracy.

4.1.6. Feature Importance Analysis for the Artificial Neural Network Classifier

The contribution of each feature to the prediction of the Artificial Neural Network classifier employed in our study is presented in Figure 7. It can be seen that only four features, namely the number of courses passed at the end of semester 2, scholarship rate, the number of courses failed at the end of semester 1, and the student’s department, contribute to the Accuracy of the Artificial Neural Network classifier.

4.1.7. Feature Importance Analysis for Naïve Bayes Classifier

The feature importance graph of the Naïve Bayes classifier in Figure 8 indicates that nationality is the most significant feature in the case of the Naïve Bayes classifier. This is followed by the number of courses failed by the end of the second semester, the total number of courses passed, and the type of university entry. It is interesting to note that none of the date-related features such as registration or high school graduation date are found to be important for the Naïve Bayes classifier.

4.1.8. Feature Importance Analysis for the Classification and Regression Trees Classifier

Inspecting the feature importance graph of CARTs in Figure 9 reveals that the number of courses passed at the end of the second semester is singularly the most important feature. This feature is followed in importance by entry type, nationality, and the number of courses failed at the end of the second semester. The feature importance of the remaining features decreases gradually such that registration date-related features of registration date, registration semester, and registration year do not contribute to the prediction of CARTs.

4.1.9. Feature Importance Analysis Across All Classifiers

Using the feature importance analysis across all classifiers, we can answer RQ1 by identifying the most frequently selected features. The five most important features across all machine learning (ML) models include the total number of courses passed by the end of the second semester, the student’s department, nationality, the number of courses passed by the end of the first semester, and the number of courses failed by the end of the first semester. Among these, the number of courses passed by the end of the second semester consistently emerges as the most critical feature, being ranked as the top feature in four out of the eight ML models and consistently appearing among the top five features across all models evaluated. It is also shown in Figure 2, Figure 3, Figure 4, Figure 5, Figure 6, Figure 7, Figure 8 and Figure 9 that two or more features related to academic performance are listed among the top five contributors for all ML models except for LR with only one academic performance feature in the top five. This underlines the existence of a strong correlation between academic performance and dropout risk, which aligns with expectations. The inclusion of multiple features related to academic performance among the top features further emphasizes that academic success or failure is an important predictor for dropout prediction.
The student’s department, identified as one of the most important five features in six of the eight ML models, is ranked as the second most frequently utilized feature. This finding supports the observations regarding the perceived difficulty of certain departments and the correspondingly higher dropout rates among students registered in those departments. Nationality is another important feature, appearing among the top five in five of the eight ML models, making it the third most frequently employed feature. The importance of nationality may be attributed to the economic and psychological challenges associated with studying abroad, which could affect a student’s decision to continue or withdraw from their studies.
In contrast, the inspection of Figure 2, Figure 3, Figure 4, Figure 5, Figure 6, Figure 7, Figure 8 and Figure 9 reveals that the demographic features of birth year and graduation date (month and year) of high school and the enrolment features of registration semester and registration date (month and year) have no impact on classification in three out of the eight ML models. This suggests that these attributes may not contribute to dropout prediction in the context of this study. It can also be seen that the top five contributing features do not include any enrolment attributes other than the department and faculty.

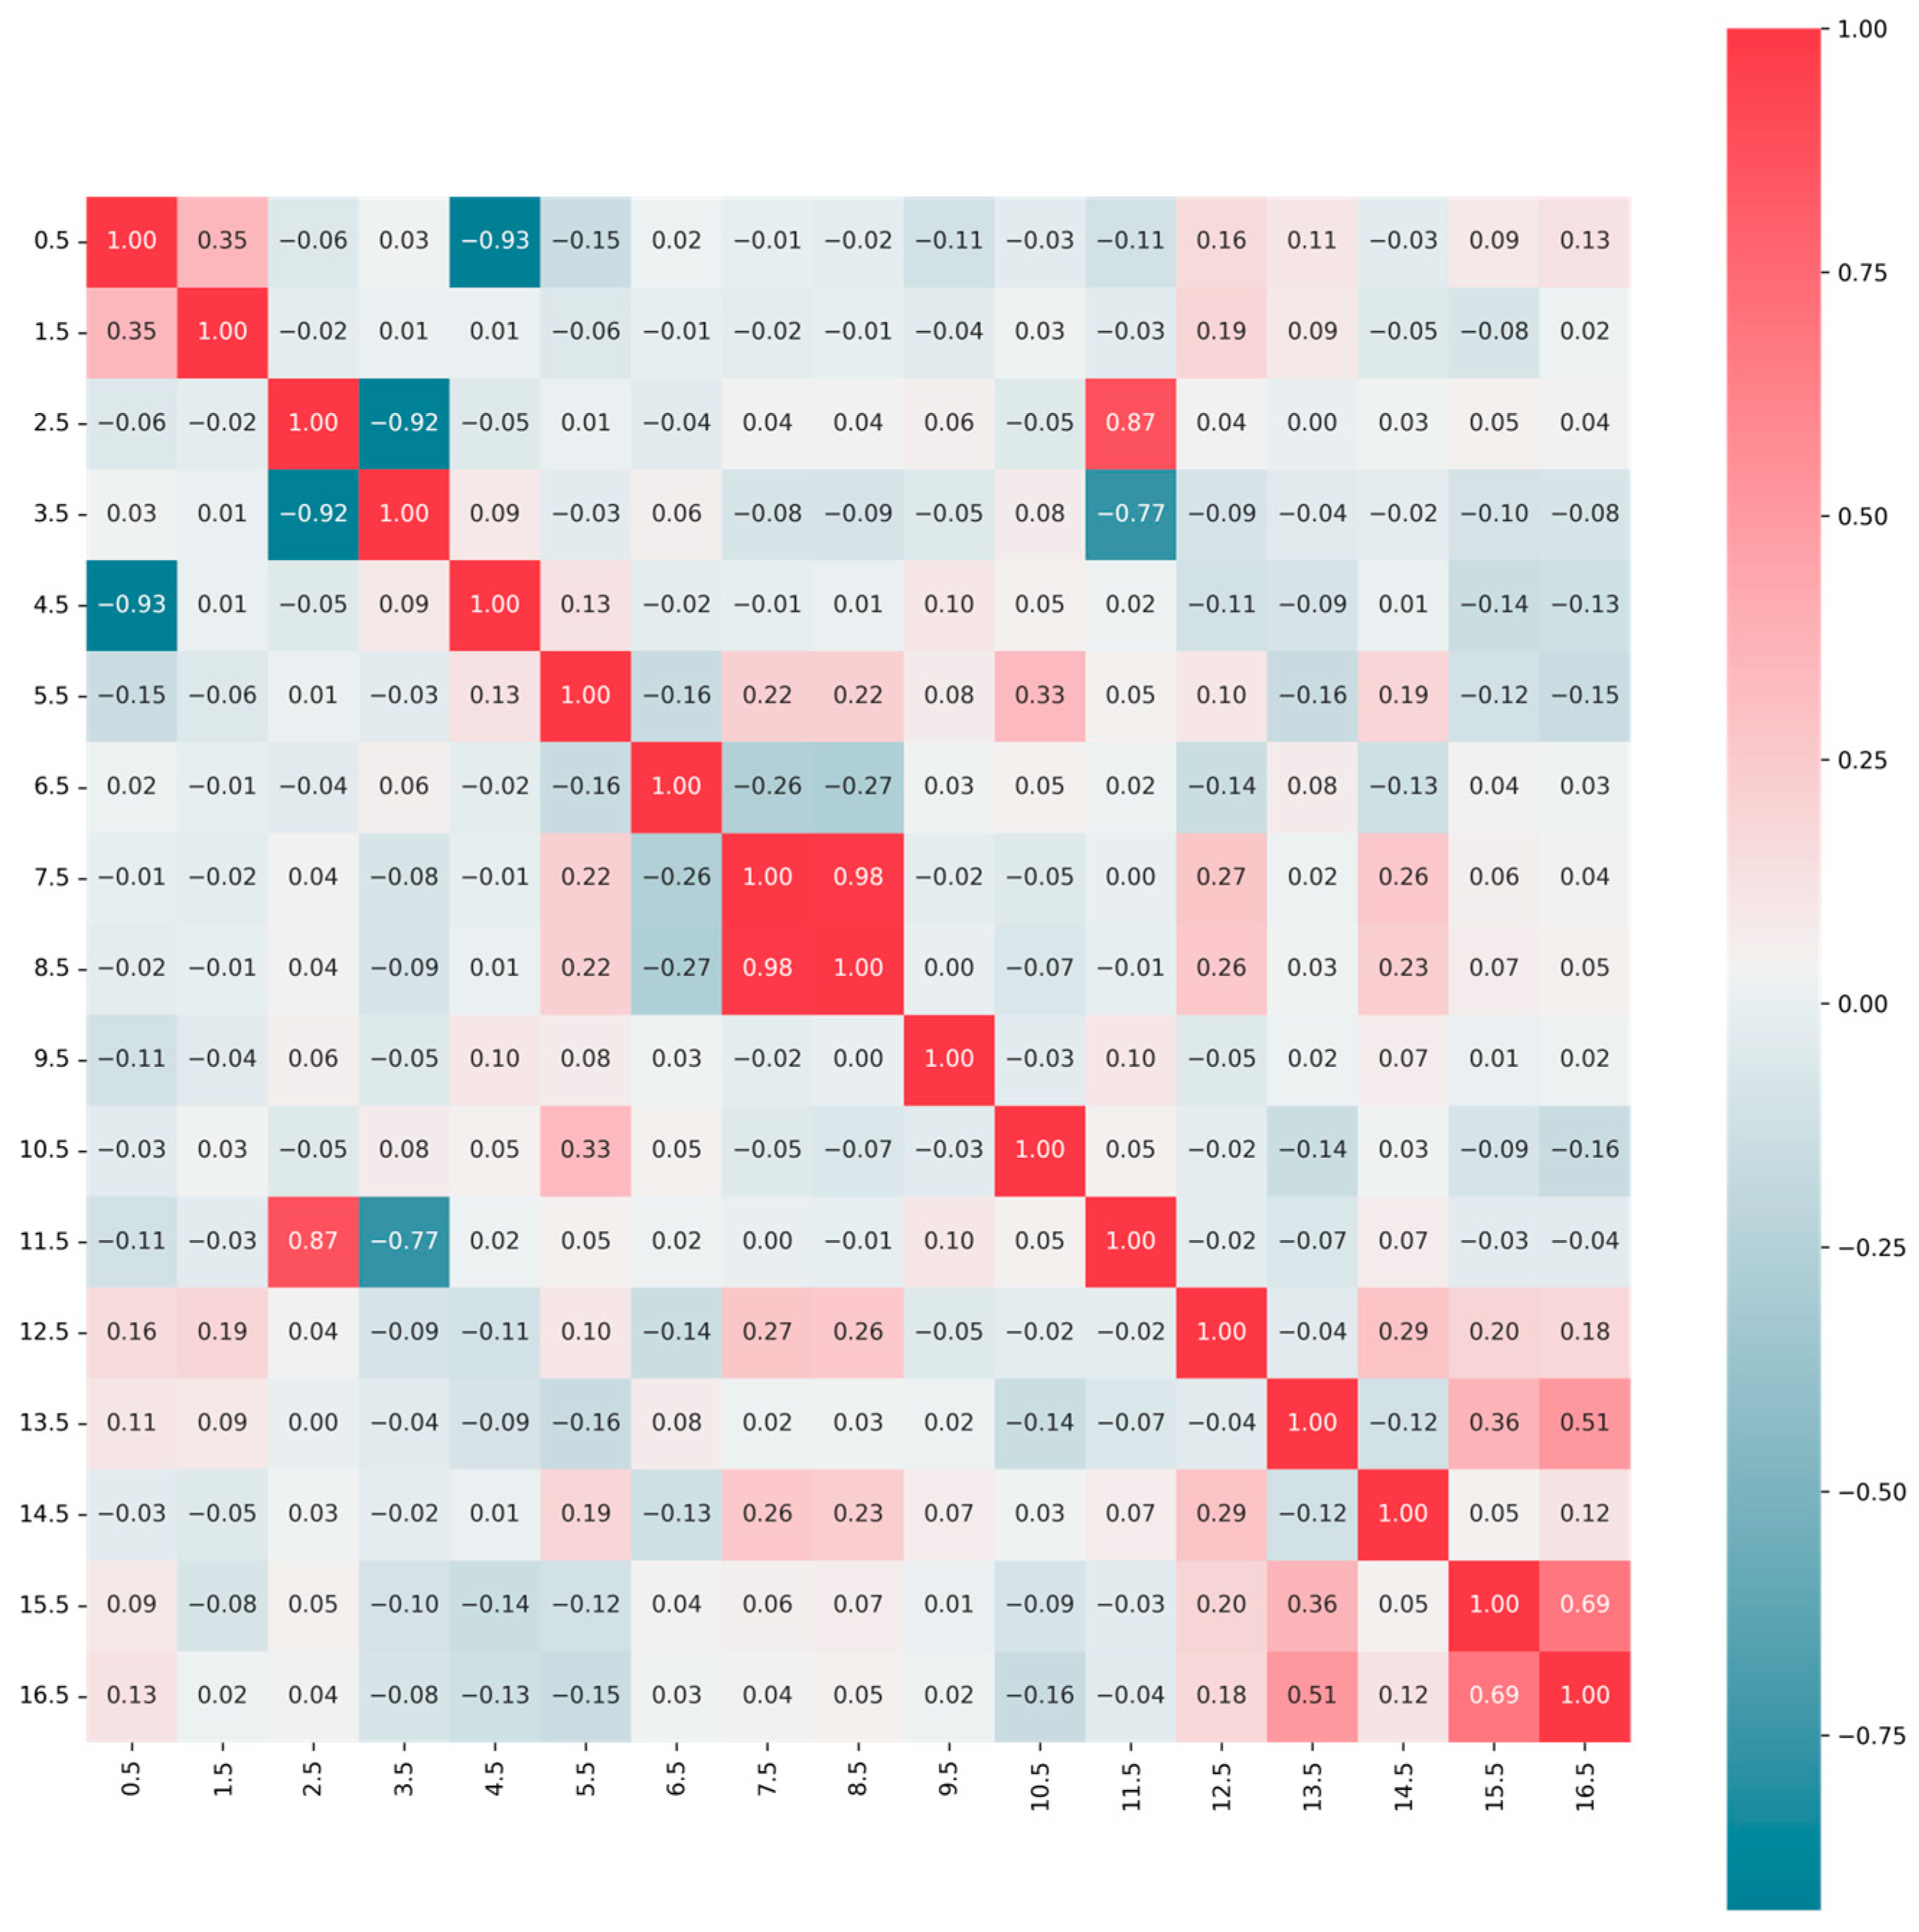
4.1.10. Correlation Analysis of Features

Feature correlation is a metric that shows the relationships between two features. Understanding the dependencies or strong correlations between two features is important for choosing the most optimal and minimum feature set when training ML classifiers. The correlation heatmap of the extracted features shown in Figure 10 illustrates how the features are interrelated such that correlation coefficients range from −1 to 1, where 1 indicates a perfect positive correlation, −1 indicates a perfect negative correlation, and 0 indicates no correlation. As shown in Figure 10, there is a very strong positive correlation between the features of faculty and department with a correlation coefficient of 0.98. This is followed by the high school graduation date and university registration date, which are also positively correlated with a coefficient of 0.87. Additionally, it can also be seen that, as expected, the number of courses a student repeats is positively correlated with both the number of courses failed in the first and second semesters with correlation coefficients 0.51 and 0.69, respectively. Since strongly correlated features may provide redundant information to the model, further work to eliminate the redundant attributes may contribute to performance.
Negative correlations are indicative of a correlation, meaning that as one feature increases, the other decreases. As expected, registration age and birth year have a strong negative correlation of −0.93. Registration semester has strong negative correlations with both the registration date and graduation date of high school. As noted previously, the registration date and high school graduation date are positively correlated. Features that have correlation coefficients close to zero are relatively independent and hence each of these features offers distinct information to the model.
The correlation heatmap provides valuable insights into the relationships between pairs of features and understanding these relationships and choosing the most relevant features that have unique contributions will enable ML models to accurately identify at-risk students.

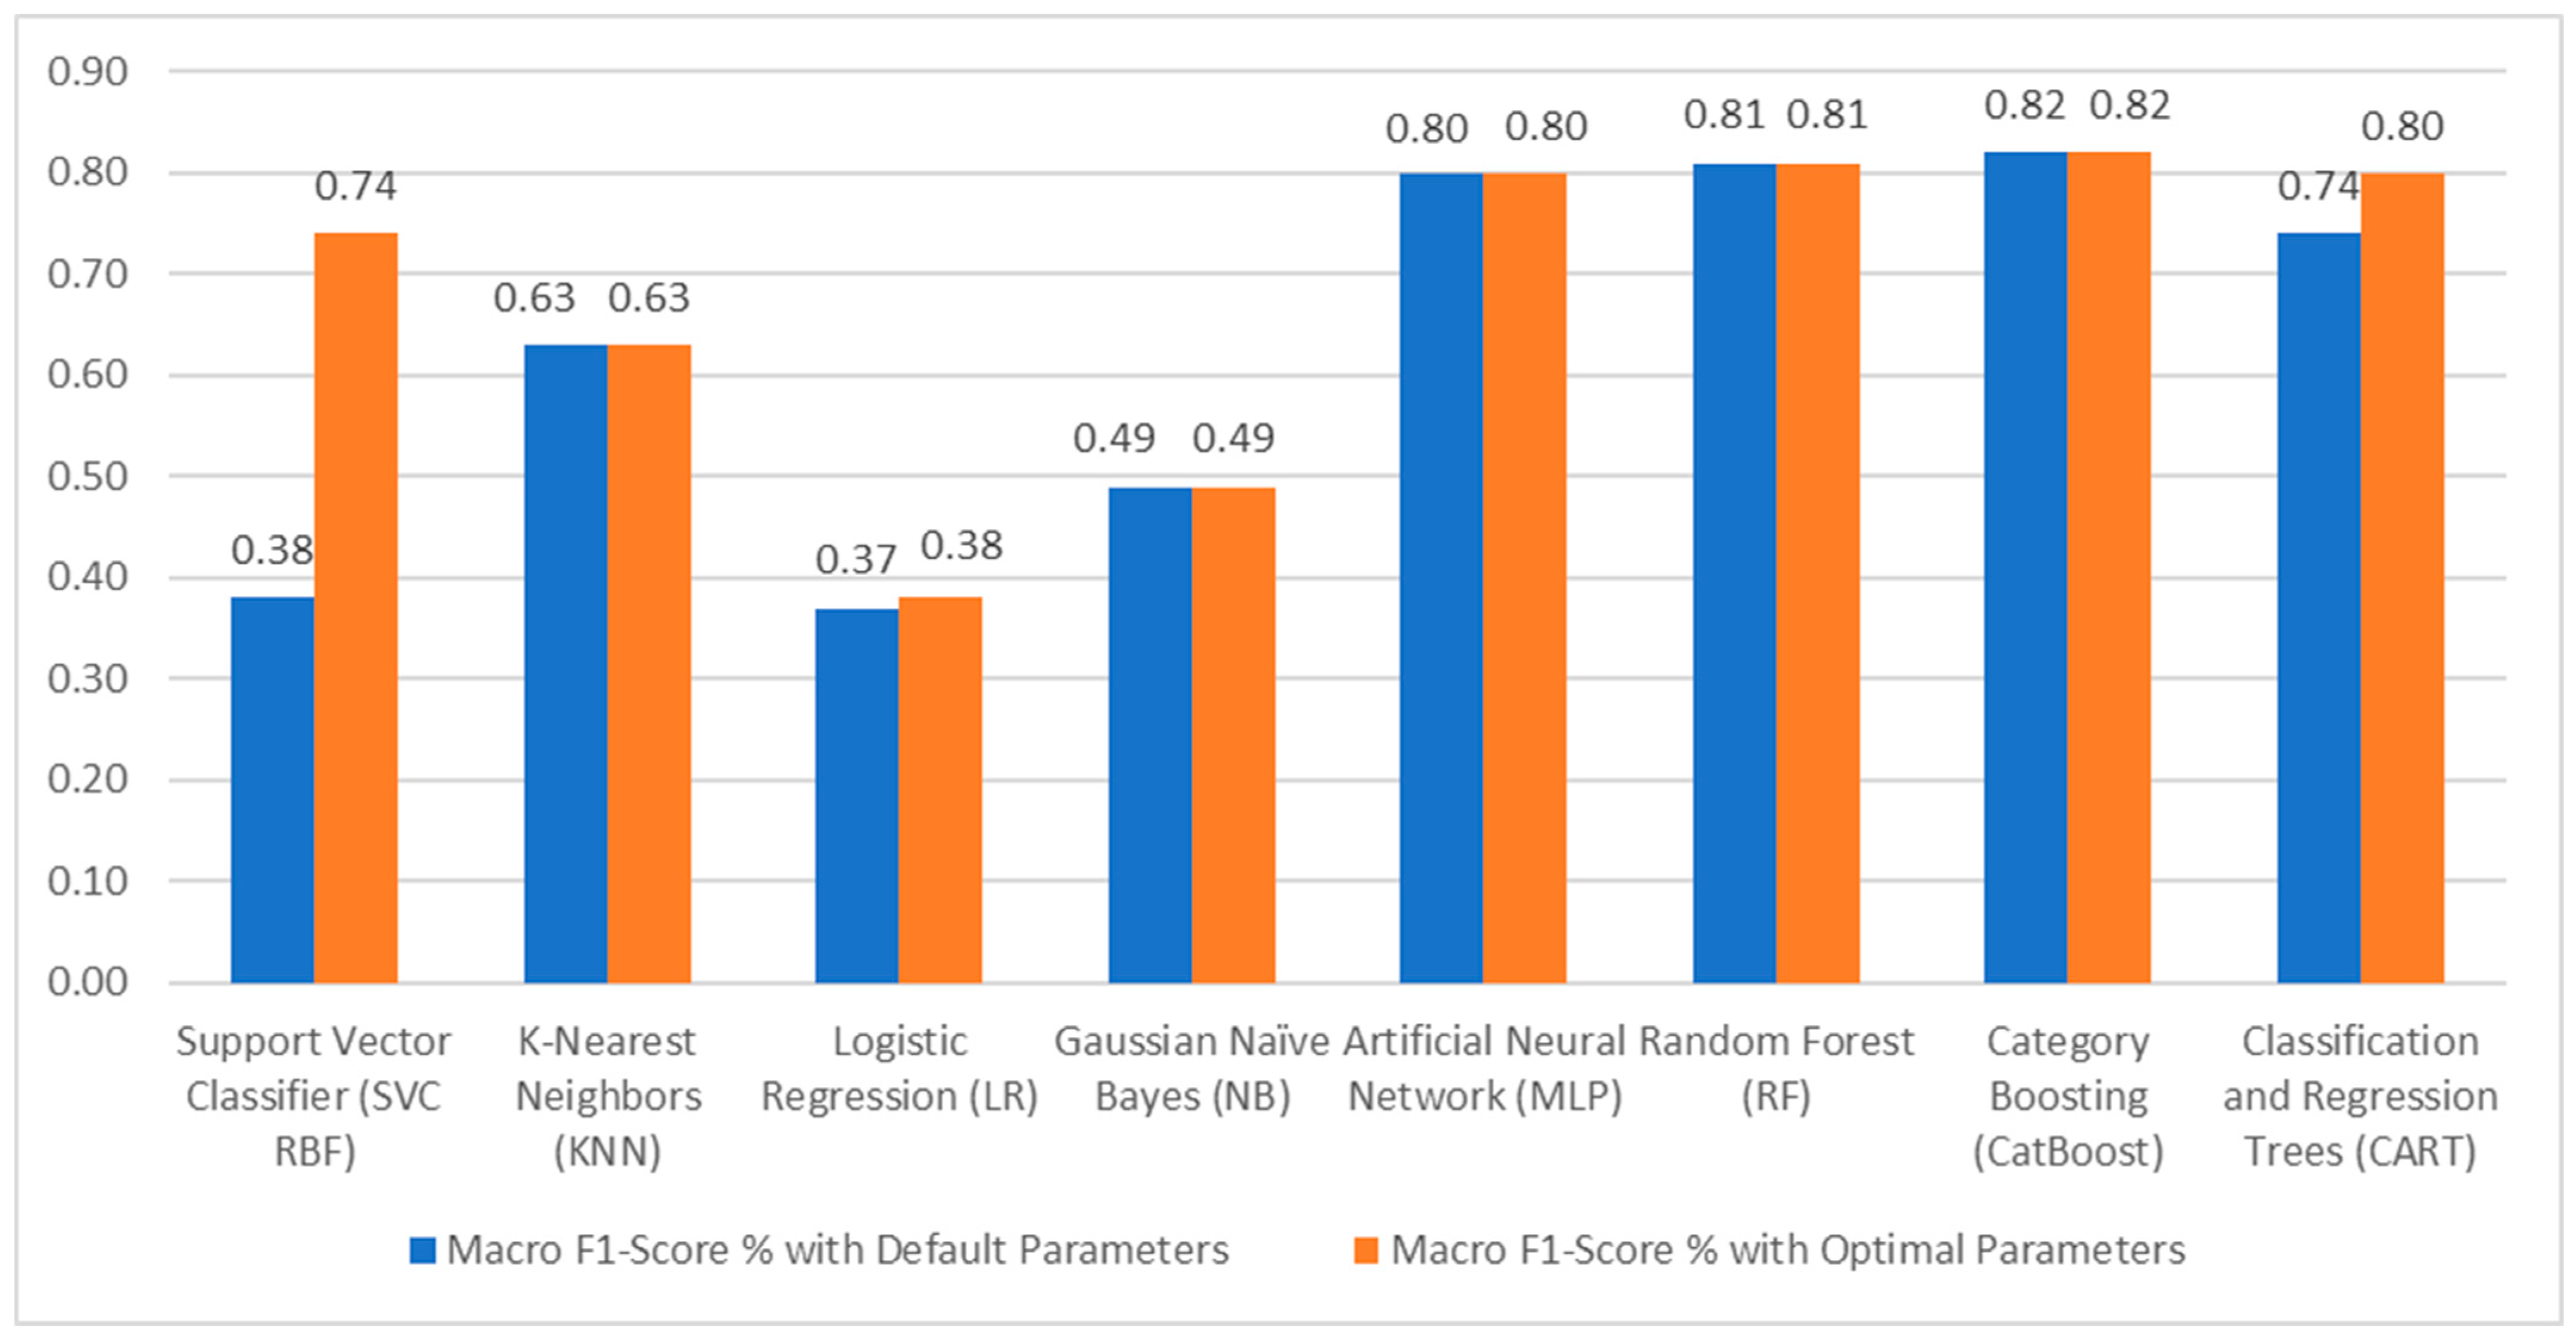
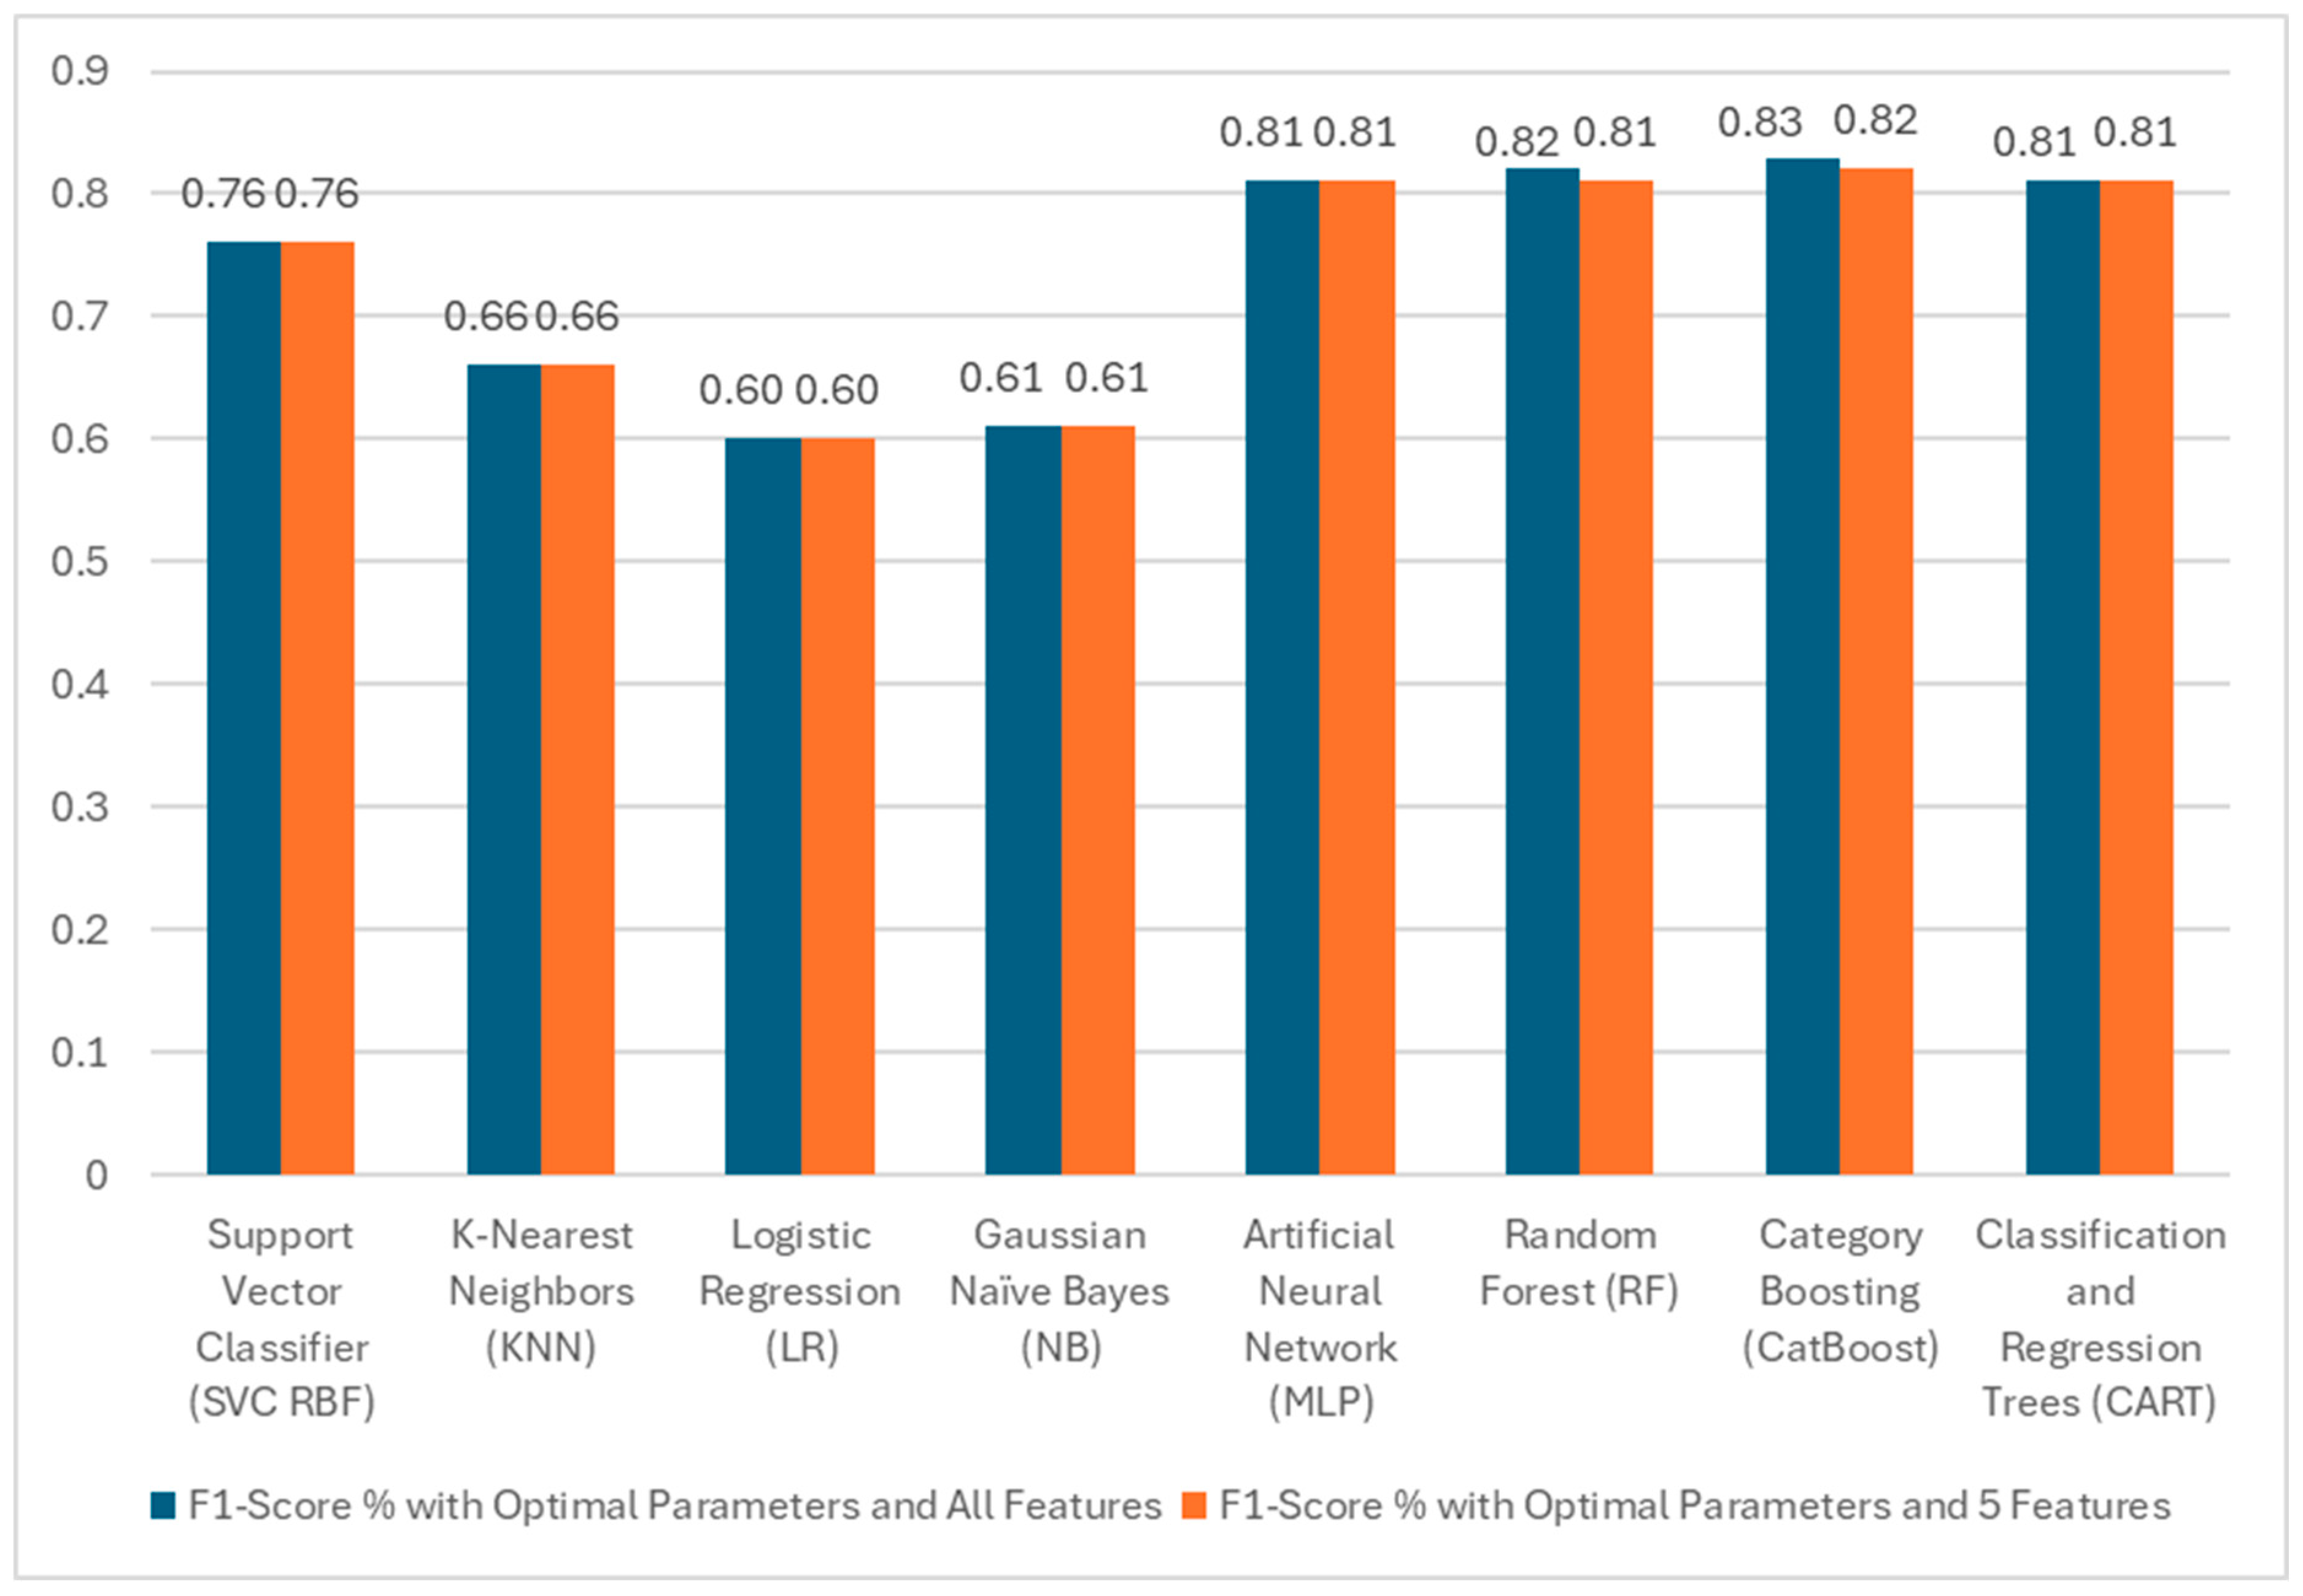
4.2. Dropout Prediction Using Machine Learning Algorithms

In order to answer RQ2, we studied the predictive performance of eight commonly used ML classifiers. Generally, the performance of machine learning algorithms may be improved through feature engineering and parameter tuning. For each of the machine learning classifiers, parameter tuning was performed using the heuristic parameter tuning method grid search. The proposed framework was employed to test the performance of the ML classifiers using optimal parameter settings.
The performance of machine learning classifiers with default parameters, trained using all features, is summarized in Table 4. With the default settings, the highest Accuracy and F1-score were achieved by the CatBoost classifier with an Accuracy of 83% and an F-score of 82%. The RF classifier achieved the second-highest results, with an F1-score of 81% and an Accuracy of 82%. MLP followed suit with an F1-score of 80% and the remaining machine learning models, namely NB, LR, KNN, and SVC, exhibited lower performance, with F1-scores of 49%, 37%, 63%, and 38%, respectively.
Following parameter tuning, all ML algorithms were retrained using the optimal parameter settings. The highest improvement was seen for CARTs where the F1-score was improved by 6%. The results are shown in Table 5. The performance of both CatBoost and Random Forest classifiers improved by 1%. The MLP was the third highest performing classifier with an F1-score of 80% and an Accuracy of 81%.
As Figure 11 shows, the parameter tuning process improved the Macro F1-score of the SVC significantly from 38% to 74%, highlighting the importance of optimizing hyperparameters. Similarly, the CARTs model also shows improvements after tuning, with the Accuracy rate increasing from 74% to 80%. The LR model shows a modest improvement of 1%, resulting in a Macro F1-score of 38%. This indicates that while some models can achieve a high Macro F1-score, their effectiveness depends heavily on parameter selection.
Among the models evaluated, the best classification performances were achieved, following the tuning process, by the optimized CatBoost, RF, and MLP algorithms with Macro F1-scores of 82%, 81%, and 80%, respectively. This suggests that these intrinsic ensemble methods, which aggregate predictions from multiple models, are especially effective for this type of classification problem. It is also worth noting that these three models showed strong performance even with their default parameters, highlighting their ability to manage the dataset’s complexities.
Table 6 shows the performance of the classifiers using only the most important four features identified for each model on the test dataset. With the optimal settings, the highest Accuracy and F1-score were achieved by the CatBoost classifier with an Accuracy of 82% and an F-score of 81%.
From the analysis, it is evident that MLP, RF, CatBoost, and CARTs classifiers consistently achieve high-performance metrics, indicating their suitability for dropout prediction. These models’ robustness in handling complex relationships within the data makes them ideal for developing early prediction frameworks. However, models like Logistic Regression and Gaussian Naïve Bayes showed significantly lower performance, highlighting the need for advanced feature engineering and the potential benefits of ensemble methods.
In conclusion, the results presented in Table 5 and Table 6 indicate that CatBoost, CARTs, MLP, and RF have the highest Accuracy, dropout F1-scores, and Macro F1-scores. Thus, in response to Research Question 2, these classifiers are identified as suitable for dropout prediction using limited registration data. For the framework presented in this study, the highest performing classifier CatBoost was used to predict the at-risk students that are discussed in Section 4.3. Furthermore, an analysis of Figure 12 shows that a comparable performance was achieved using only the top five features instead of all the features. This is an indication that the ML models will benefit from a systematic feature elimination approach such as recursive elimination.

4.3. Using Prediction Results to Enhance Student Retention Policies

Our third research question examined how an HEI’s student retention policy-making process can be supported. Using ML algorithms to identify students at risk of dropping out is the first step of the student retention process. The ultimate goal is not only to predict students at risk of dropping out but to generate or enable the generation of effective strategies or policies to prevent these students from dropping out. It should be noted that this does not exclude human intervention. Devising retention policies must align with the mission and strategic plan of an HEI and take into account budget and human resource-related constraints.

4.3.1. Visualization of Results by the HEI

The proposed framework employs clustering followed by a decision tree analysis as a visualization tool. In previous research, clustering and decision trees have proven to be effective tools for identifying patterns in student behavior and linking these patterns to academic performance outcomes [44,45,46,47]. For instance, Križanić, S. [44] and Hoca and Dimililer [47] employed decision trees to provide a visualization for clusters formed for the educational data used. In our study, we employ clustering and decision tree analysis as visualization tools in a similar way: first predicting students at risk, then categorizing them into clusters, and finally applying decision tree analysis to enable tailored retention strategies for each cluster. One of the main aims of this work is to provide a framework that can be used by HEIs to profile at-risk students and devise tailored intervention strategies or policies to retain these students. In Figure 1, this stage is indicated as the “Analysis of At-Risk Students and Policy Generation” framework.
An HEI may devise several different policies to retain students at risk of dropping out. The clustering algorithm is used to partition all at-risk students into classes where similar students are grouped together and thus a policy may be devised to target each group. However, clusters are not easy to interpret, and additional tools must be used to visualize them. When the data are multidimensional, 2D cluster plots might be insufficient for visualization. Therefore, decision trees that are categorized as intrinsically explainable ML models may be used as a visualization tool by policymakers to understand and visualize the clusters formed. In the current case study, the predictions of the best classifier, namely CatBoost, are fed into the clustering algorithm producing three clusters. The number of clusters corresponds to the number of different policies or strategies an HEI is planning to implement. The data can be analyzed to identify the optimal number of clusters using methods such as the Elbow method or Silhouette analysis, but that may result in a higher number of clusters or policies, which may be impractical for HEIs. Figure 13 presents the first three levels of the decision tree built using the data on at-risk students with cluster labels. The decision tree is pruned at level three to allow better visualization of the clustering logic. This choice of limiting the tree depth results in a more human-interpretable tree at the expense of Accuracy as can be seen in the impurity values of the leaf nodes of the tree.
Inspection of the decision tree of Figure 13 shows that academic performance in terms of the number of courses repeated is an important determinant for clusters. Additionally, the number of courses passed at the end of semester 2 and the number of courses failed at the second semester are used to partition the date at the second level of the decision tree. This is in line with the expectation that academic performance is an important determinant of the risk of dropping out. Note that the data used for clustering and building the decision tree can be augmented with additional data from the HEI data resources such as attendance and homework marks. Employing additional information at this level may enable a more accurate analysis of the needs of students.

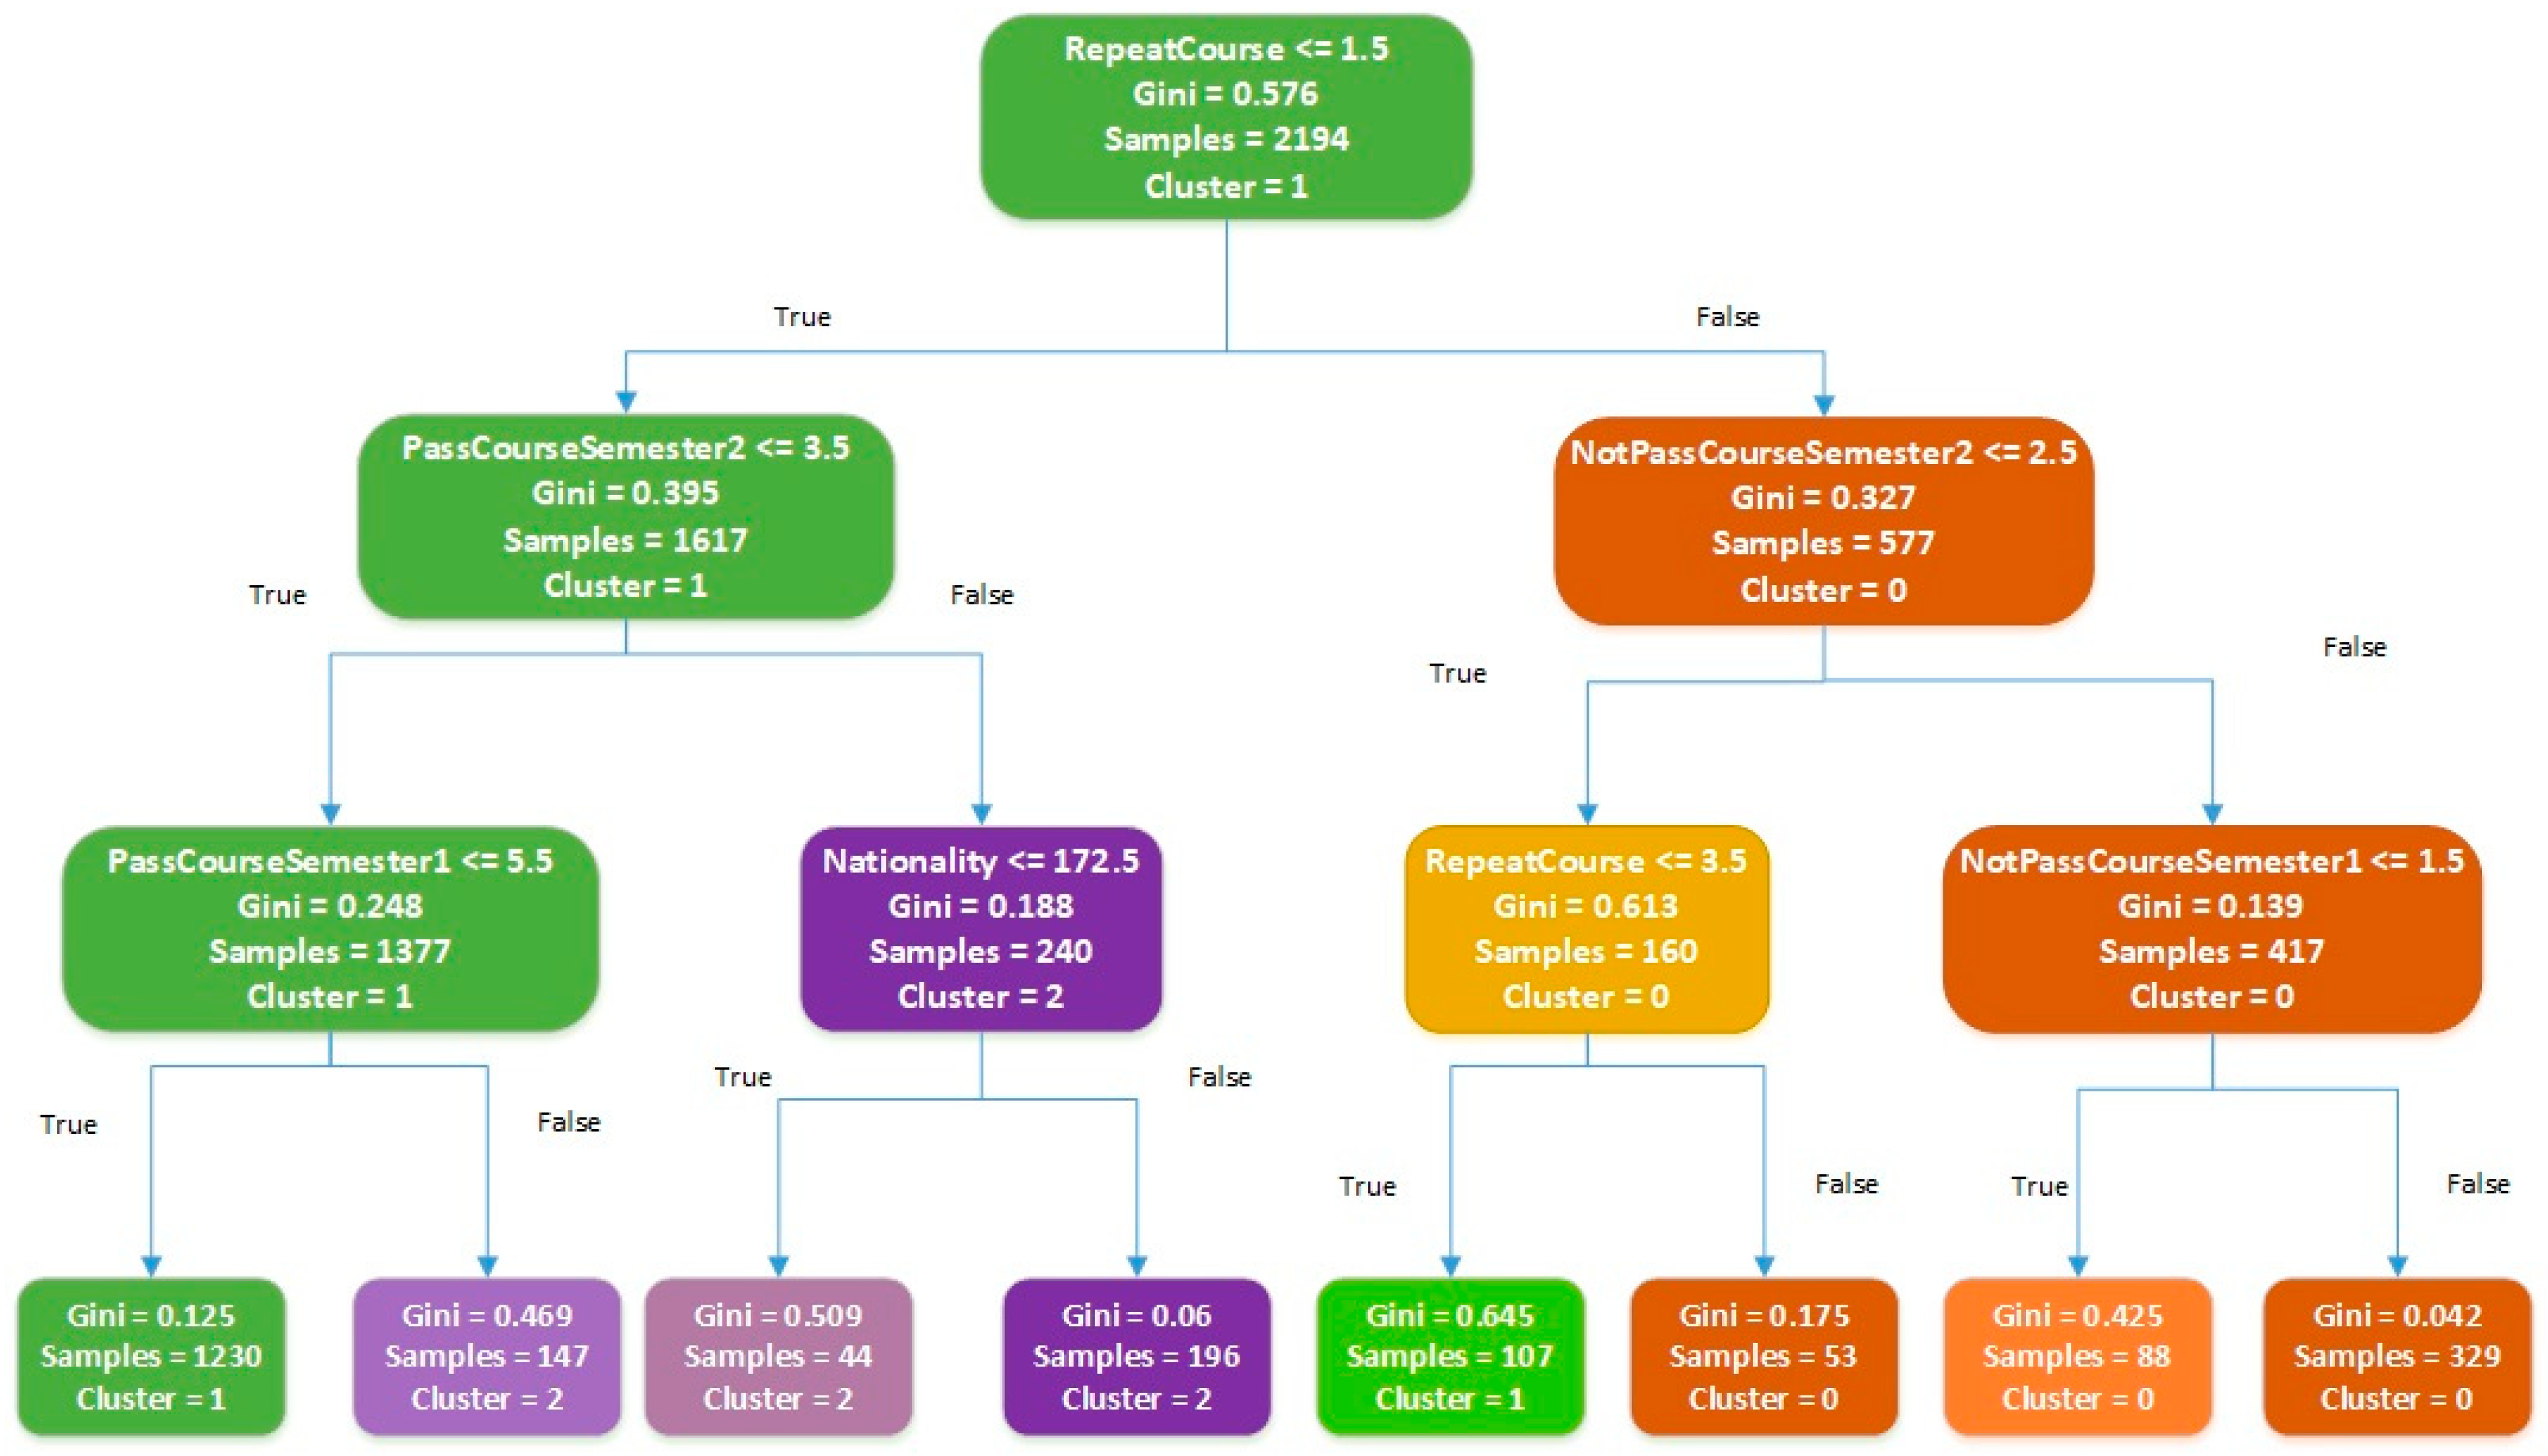
4.3.2. Example Scenario: Using Clustering and Decision Trees for Student Retention

Establishing a support system and modifying regulations and practices for learning processes has been employed successfully to decrease the dropout rates at universities [9]. Once the students at risk of dropout are identified, they may be analyzed to design tailored policies and support programs to prevent their dropout. A possible policy-making scenario using only the information available in the decision tree is presented below. The decision tree provides a human-interpretable presentation of the cluster definitions. Note that this discussion is provided as an example of how the policy-making process may be supported by the proposed framework. The ability to describe the clusters and in effect the students in each cluster allows HEI administrators to design tailored policies for each cluster. Examining the DT reveals the main characteristics of the clusters that can be mapped to some common retention strategies as summarized in Table 7. It should be emphasized that in this study, both the analysis for policy generation require domain experts at decision-making levels within an HEI.
The three clusters of students at risk of dropout and a corresponding retention policy tailored for the cluster are defined in more detail regarding the information in the first three levels of the decision tree as follows:
  • Cluster 0: Students with consistent challenges
The students who are repeating two or more courses and have failed three or more courses in the second semester are placed in cluster 0. These are the students who are consistently failing two or more courses in both semesters. Another group of students who are placed in this cluster have failed less than two courses in the second semester, but they have repeated more than four courses. This indicates that they had very bad performance in their first semester.
  • Retention Policy
Since these are students whose academic performance is consistently low, they may be struggling with the major they have chosen. These students may be offered academic and career counseling that recommends a change in major. Intensive academic support implementing personalized academic advising and personalized tutoring may also be offered to help these students. The students may be scrutinized to see if the consistent failure is due to a deficiency in the academic foundation. For such students, bridging programs may be offered to help them improve their academic performance and transition into their studies more effectively. For instance, in this study, an analysis of the students in cluster 0 showed that most of them are engineering students who were admitted to the university based on their provided credentials, such as high school diplomas, academic performance, and other exam results. However, since these students did not take an official entrance exam, they may have a weaker foundational background compared to the students who were admitted through official entrance exams. Therefore, these students might be given a choice of changing majors or taking bridge courses. Resilience and social adaptation have been linked with academic success and retention [48]. This suggests the design of social and psychological support programs for the students in this cluster as a possible proactive measure to prevent their dropout.
  • Cluster 1: Students with moderate or declining performance
The leftmost branch in Figure 13 corresponds to students who have not repeated any courses or who repeated at most one course but have passed a maximum of three courses in the second semester and at the most five courses in the first semester. Since these are students who have not repeated more than one course, it means they did not fail more than one course in the first semester showing a moderate performance compared to the students in cluster 0. This analysis indicates that these are the students whose performance is declining.
Another group of students in cluster 1 is described as having repeated from two to three courses and having failed no more than two courses by the end of their second semester. These students are consistently struggling with two or three of the courses they are taking, which corresponds generally to half of their academic load.
In both cases, these students are facing challenges with their courses, especially in the second semester. This may indicate that they lack the background for the increasingly more difficult courses in the corresponding curriculum or they may lose interest in their studies. The HEI administration must try to identify the general causes of such a decline in performance. For instance, certain courses offered across all majors or major-related foundation courses might be identified as being challenging for these students.
  • Retention Policy
Since these students are relatively more successful, regular check-ins may be employed to support their academic development. For students repeating two or a maximum of three courses, the specific courses may be identified, and tutoring may be provided by their department for these subjects. The retention policy for this cluster might involve faculty support and faculty-wide social activities to maintain the students’ interest in their majors and hence increase their motivation to study. Alternatively, if there is a university-wide problem with courses such as mathematics, the teaching and learning tools employed as well as the syllabi might be revised, and students might be given additional opportunities to overcome these challenges before the third semester. Tutoring approaches have been positively correlated with higher success and retention behavior [9,49]. Additionally, career mentoring or career guidance may be offered to help students plan their professional future. This will increase their motivation and enable them to focus on their academic development.
  • Cluster 2: Relatively more successful students
According to the decision tree shown in Figure 13, cluster 2 contains students who repeated at most one course and passed more than three courses in the second semester. Since we studied the data at the end of the second academic semester, a lower value for repeat courses implies that these students were successful in the first semester, failing at most one course. The second semester of these students can also be considered relatively successful.
The tree shows that there is another group of students who are also categorized as cluster 2. These students have lower performance in the second semester, but their first-semester performance is quite high since they have passed more than five courses.
  • Retention Policy
The DT indicates that this cluster includes higher-performing students compared to the other clusters. Therefore, it can be deduced that the challenges for these students are not the courses, but they may be struggling with socioeconomic or personal challenges. Moreover, it should be noted that in addition to dropout, some students terminate their studies in order to transfer to another HEI. In the registration system used for the case study, the students who transfer to other institutions are recorded as dropouts. Hence, this cluster may contain students who may be considering transferring out. Inspection of the dataset employed shows that cluster 2 includes mainly international students; therefore, language and cultural support may be provided to assist with language barriers and cultural adaptation. Furthermore, these students may be offered scholarships or student assistantships, thus fostering a sense of belonging, which can enhance their academic engagement and well-being.

4.4. Comparison with Existing Systems

The work presented in the current study involves previously used ML algorithms as components of a well-established ML-based classification framework, for example, as in [7,13,14], but the dataset employed is unique to the case study. Therefore, a direct comparison with prior work on this topic is not possible. Nevertheless, the related work on the practical application of dropout prediction using ML algorithms is summarized in Table 8.
As the table shows, the case studies generally differ in terms of the size and content of the dataset used. Furthermore, as shown in Table 8, the majority of the work conducted on this topic employs data on information such as attendance and detailed performances of the students and in some cases socioeconomic features. Even though most of this information is available at all tertiary institutions, it is usually scattered across various modules. Therefore, collecting all information in one location to extract the features suitable for training ML classifiers is very difficult and, in many cases, it is not easily accessible. Our strengths are the competitive F1-scores, as evident in the table, with limited data that are contained in any student report or transcript, which in turn allows broad implementation of the framework. As shown by [17,18], the use of socioeconomic data or detailed course performance could improve the prediction performance, but it would come at a cost. Furthermore, collecting data on psychological or socioeconomic issues concerning the students through surveys and similar instruments is both costly and time-consuming and may also raise ethical issues. Since timely intervention is an important goal of the dropout prediction task, we decided to use a limited amount of features/information without time delays and intricacies that would be caused by data integration and transformation. However, the framework may be extended and improved by incorporating socioeconomic and detailed learning-related data that may be available in some of the registration systems.

5. Conclusions and Future Work

Student retention in universities is an important educational challenge that affects all stakeholders from economic, quality, and psychological aspects. The proposed framework identifies the students at risk of dropping out at the end of the first year. Since a significant percentage of dropouts occur before the second year, our study employs the academic performance information of students in their first year. The data used for the system are accessible through any student registration system; specifically, it comprises the data used for generating student record sheets or transcripts. Despite the previous work, which employs data from a very large number of sources or utilizes detailed data pertaining to specific departments or classes, the proposed framework is self-contained in the registration or transcript generation system of any educational institution. This facilitates the broad application of the proposed solution to other educational institutions.
In this case study, to implement the first workflow of the proposed framework, a comprehensive feature analysis followed by a comparison of the most frequently used machine learning models was performed on the dataset extracted from the registration system. The findings suggest that even though certain models like CatBoost and RF inherently perform well, other models such as SVC and MLP can achieve competitive performance with parameter tuning or feature engineering. Therefore, parameter optimization and optimal feature extraction may be employed to improve their performance for dropout prediction. The experimental results indicated that the CatBoost classifier is the best-performing classifier and it was employed in the proposed framework to predict the at-risk students in the context of the current case study. The second workflow in the proposed framework for student retention involves clustering the dropouts into categories to enable the design of tailored retention policies. To provide a human interpretable representation of the clustering, a decision tree with a maximum depth of three levels was used in the current work. The decision tree provides the policymakers with a verbal description of each of the clusters formed. This verbalization may then be used by the policymakers to interpret and comprehend the clusters formed and thus devise tailored policies for each cluster. The results of this study show that, even with limited information used for training, the system achieved a high predictive performance with an F1-Score of 82%. The proposed framework is adaptable for use in any HEI as it relies exclusively on the data used to generate student transcripts.
The decision to employ limited data aligns with the goal of designing an accessible system that can be adopted by higher education institutions globally. Moreover, the results presented in this study show that even without behavioral or socioeconomic features, competitive prediction performance is possible. However, the framework could be enhanced by incorporating additional information from the registration database, such as students’ grades in specific courses or course groups, as well as data from the institution’s learning management systems, at both the dropout prediction and policy-making stages of the framework. It is anticipated that using more comprehensive data that covers, in addition to the mainly descriptive features employed in this study, predictive and diagnostic information, will further improve the predictive performance of the dropout prediction stage. Tailoring retention policies would also benefit from these additional data. For example, in the visualization or analysis stages, including information about the specific courses in which students struggle would enable policymakers to better identify the underlying causes of these challenges. Furthermore, the policy-making process could also be enhanced using various visualization tools and explainable AI techniques.
The ultimate aim of dropout prediction is to devise timely intervention strategies to increase student retention. Therefore, higher education institutions should implement these ML-based systems and retention strategies and evaluate their performance to test the effectiveness of the retention strategies. The emphasis of future work should be on the identification of the early dropout indicators such as pre-enrolment or first semester data, enabling timely identification of the students at risk, and thus enabling the implementation of timely intervention strategies. Another important direction for future work in this domain is expanding the dataset to include longitudinal studies across multiple institutions and analyzing the long-term impact of retention policies, ensuring that intervention strategies are both effective and sustainable.
The student retention process can be considered as a continuous cycle where first at-risk students are identified, then tailored retention policies or strategies are developed to support their continued enrollment or graduation, followed by implementation of these policies and evaluation of their success, and finally, the results are incorporated into the system to continuously improve its effectiveness. Achieving this requires collaboration among domain experts from multiple fields such as educational administration, machine learning, psychology, and financial planning as well as the administrators and decision-makers of HEIs. However, it remains unclear how the cycle should be effectively closed: how predictions can be translated into policies and how to measure the effect of these policies on student attrition and performance. Future research should explore mechanisms for more automated and efficient policy generation frameworks, as well as implementation and validation strategies for these policies.

Author Contributions

S.H.: data acquisition, data processing, implementation, analysis, writing. N.D.: supervision, conceptualization, analysis, writing. All authors have read and agreed to the published version of the manuscript.

Funding

This work was supported partially by the EMU BAPC-0A-23-01 BAPC Project Fund.

Institutional Review Board Statement

Ethics approval was provided by the Research and Publication Ethics Board of Eastern Mediterranean University (Eastern Mediterranean University Ethics Committee Number: ETK00-2022-0168, Date: 13 June 2022).

Informed Consent Statement

Not applicable.

Data Availability Statement

The datasets presented in this article are not readily available because they are proprietary and belong to Eastern Mediterranean University. Access to the data may be granted upon reasonable request and with permission from Eastern Mediterranean University.

Conflicts of Interest

The authors declare no conflicts of interest.

References

  1. Del Bonifro, F.; Gabbrielli, M.; Lisanti, G.; Zingaro, S.P. Student Dropout Prediction. In Artificial Intelligence in Education. AIED 2020. Lecture Notes in Computer Science; Bittencourt, I., Cukurova, M., Muldner, K., Luckin, R., Millán, E., Eds.; Springer: Cham, Switzerland, 2020; Volume 12163, pp. 124–135. [Google Scholar] [CrossRef]
  2. Larsen, M.S.; Kornbeck, K.P.; Kristensen, R.; Larsen, M.R.; Sommersel, H.B. Dropout Phenomena at Universities: What Is Dropout? Why Does Dropout Occur? What Can Be Done by the Universities to Prevent or Reduce it? Danish Clearinghouse for Educational Research, Aarhus University: 2013; Report No. 15. Available online: https://pure.au.dk/ws/portalfiles/portal/55033432/Evidence_on_dropout_from_universities_technical_report_May_2013_1_.pdf (accessed on 10 January 2025).
  3. Jadrić, M.; Garača, Ž.; Čukušić, M. Student Dropout Analysis with Application of Data Mining Methods. Manag. J. Contemp. Manag. Issues 2010, 15, 31–46. Available online: https://hrcak.srce.hr/file/81744 (accessed on 10 January 2025).
  4. OECD. Education at a Glance 2022; OECD Publishing: Paris, France, 2023; Available online: https://www.oecd.org/en/publications/education-at-a-glance-2022_3197152b-en.html (accessed on 20 February 2025).
  5. Talamás-Carvajal, J.A.; Ceballos, H.G. A stacking ensemble machine learning method for early identification of students at risk of dropout. Educ. Inf. Technol. 2023, 28, 12169–12189. [Google Scholar] [CrossRef]
  6. Liu, H.; Chen, X.; Zhao, F. Learning behavior feature fused deep learning network model for MOOC dropout prediction. Educ. Inf. Technol. 2024, 29, 3257–3278. [Google Scholar] [CrossRef]
  7. Selim, K.S.; Rezk, S.S. On predicting school dropouts in Egypt: A machine learning approach. Educ. Inf. Technol. 2023, 28, 9235–9266. [Google Scholar] [CrossRef]
  8. Rodríguez, P.; Villanueva, A.; Dombrovskaia, L.; Valenzuela, J.P. A methodology to design, develop, and evaluate machine learning models for predicting dropout in school systems: The case of Chile. Educ. Inf. Technol. 2023, 28, 10103–10149. [Google Scholar] [CrossRef]
  9. Takács, R.; Kárász, J.T.; Takács, S.; Horváth, Z.; Oláh, A. Applying the Rasch model to analyze the effectiveness of education reform in order to decrease computer science students’ dropout. Humanit. Soc. Sci. Commun. 2021, 8, 1–8. [Google Scholar] [CrossRef]
  10. Takács, R.; Takács, S.; Kárász, J.T.; Oláh, A.; Horváth, Z. The impact of the first wave of COVID-19 on students’ attainment, analysed by IRT modelling method. Humanit. Soc. Sci. Commun. 2023, 10, 127. [Google Scholar] [CrossRef]
  11. Wang, Z.; Zhu, C.; Ying, Z.; Zhang, Y.; Wang, B.; Jin, X.; Yang, H. Design and implementation of early warning system based on educational big data. In Proceedings of the International Conference on Systems and Informatics, Nanjing, China, 10–12 November 2018; Volume 5, pp. 549–553. [Google Scholar] [CrossRef]
  12. Kabathova, J.; Drlik, M. Towards Predicting Students’ Dropout in University Courses Using Different Machine Learning Techniques. Appl. Sci. 2021, 11, 3130. [Google Scholar] [CrossRef]
  13. Singh, H.; Kaur, B.; Sharma, A.; Singh, A. Framework for suggesting corrective actions to help students intended at risk of low performance based on experimental study of college students using explainable machine learning model. Educ. Inf. Technol. 2024, 29, 7997–8034. [Google Scholar] [CrossRef]
  14. Hassan, M.A.; Muse, A.H.; Nadarajah, S. Predicting student dropout rates using supervised machine learning: Insights from the 2022 National Education Accessibility Survey in Somaliland. Appl. Sci. 2024, 14, 7593. [Google Scholar] [CrossRef]
  15. Cho, C.H.; Yu, Y.W.; Kim, H.G. A study on dropout prediction for university students using machine learning. Appl. Sci. 2023, 13, 12004. [Google Scholar] [CrossRef]
  16. Mduma, N. Data balancing techniques for predicting student dropout using machine learning. Data 2023, 8, 49. [Google Scholar] [CrossRef]
  17. Villegas-Ch, W.; Govea, J.; Revelo-Tapia, S. Improving student retention in institutions of higher education through machine learning: A sustainable approach. Sustainability 2023, 15, 14512. [Google Scholar] [CrossRef]
  18. Kok, C.L.; Ho, C.K.; Chen, L.; Koh, Y.Y.; Tian, B. A novel predictive modeling for student attrition utilizing machine learning and sustainable big data analytics. Appl. Sci. 2024, 14, 9633. [Google Scholar] [CrossRef]
  19. Vieira, P.M.; Rodrigues, F. An automated approach for binary classification on imbalanced data. Knowl. Inf. Syst. 2024, 66, 2747–2767. [Google Scholar] [CrossRef]
  20. Ahmad, G.N.; Shafiullah, S.; Fatima, H.; Abbas, M.; Rahman, O.; Imdadullah, I.; Alqahtani, M.S. Mixed Machine Learning Approach for Efficient Prediction of Human Heart Disease by Identifying the Numerical and Categorical Features. Appl. Sci. 2022, 12, 7449. [Google Scholar] [CrossRef]
  21. Navamani, J.M.A.; Kannammal, A. Predicting performance of schools by applying data mining techniques on public examination results. Res. J. Appl. Sci. Eng. Technol. 2015, 9, 262–271. [Google Scholar] [CrossRef]
  22. Prokhorenkova, L.; Gusev, G.; Vorobev, A.; Dorogush, A.V.; Gulin, A. CatBoost: Unbiased boosting with categorical features. Advances in Neural Information Processing Systems 31 (NeurIPS 2018). In Proceedings of the 31st Conference on Neural Information Processing Systems (NeurIPS 2018), Montréal, QC, Canada, 3–8 December 2018. Available online: https://proceedings.neurips.cc/paper/2018/hash/14491b756b3a51daac41c24863285549-Abstract.html (accessed on 10 January 2025).
  23. Pan, C.; Poddar, A.; Mukherjee, R.; Ray, A.K. Impact of categorical and numerical features in ensemble machine learning frameworks for heart disease prediction. Biomed. Signal Process. Control 2022, 76, 103666. [Google Scholar] [CrossRef]
  24. Gey, S.; Nedelec, E. Model Selection for CART Regression Trees. IEEE Trans. Inf. Theory 2005, 51, 658–670. [Google Scholar] [CrossRef]
  25. Krawczyk, B. Learning from imbalanced data: Open challenges and future directions. Prog. Artif. Intell. 2016, 5, 221–232. [Google Scholar] [CrossRef]
  26. Cortes, C.; Vapnik, V. Support-vector networks. Mach. Learn. 1995, 20, 273–297. [Google Scholar] [CrossRef]
  27. Boser, B.E.; Guyon, I.M.; Vapnik, V. A training algorithm for optimal margin classifiers. In Proceedings of the COLT ‘92: Proceedings of the Fifth Annual Workshop on Computational Learning Theory, Pittsburgh, PA, USA, 27–29 July 1992; pp. 144–152. [Google Scholar]
  28. Cover, T.; Hart, P. Nearest neighbor pattern classification. IEEE Trans. Inf. Theory 1967, 13, 21–27. [Google Scholar] [CrossRef]
  29. Duda, R.O.; Hart, P.E.; Stork, D.G. Pattern Classification, 2nd ed.; Wiley-Interscience: Hoboken, NJ, USA, 2001. [Google Scholar]
  30. Hosmer, D.W.; Lemeshow, S. Applied Logistic Regression; Wiley-Interscience: New York, NY, USA, 2000. [Google Scholar]
  31. Menard, S. Applied Logistic Regression Analysis, 2nd ed.; SAGE Publications: Thousand Oaks, CA, USA, 2002. [Google Scholar]
  32. Rish, I. An empirical study of the naive Bayes classifier. In Proceedings of the IJCAI 2001 Workshop on Empirical Methods in Artificial Intelligence, Seattle, WA, USA, 4–10 August 2001; Volume 3, No. 22, pp. 41–46. [Google Scholar]
  33. Zhang, H. The optimality of Naïve Bayes. In Proceedings of the Seventeenth International FLAIRS Conference, Sandestin Beach, FL, USA, 19–21 May 2024; pp. 562–567. [Google Scholar]
  34. LeCun, Y.; Bengio, Y.; Hinton, G. Deep learning. Nature 2015, 521, 436–444. [Google Scholar] [CrossRef] [PubMed]
  35. Goodfellow, I.; Bengio, Y.; Courville, A. Deep Learning; MIT Press: Cambridge, MA, USA, 2016. [Google Scholar]
  36. Breiman, L. Random forests. Mach. Learn. 2001, 45, 5–32. [Google Scholar] [CrossRef]
  37. Louppe, G. Understanding random forests: From theory to practice. arXiv 2014, arXiv:1407.7502. [Google Scholar]
  38. Dorogush, A.V.; Ershov, V.; Gulin, A. CatBoost: Gradient boosting with categorical features support. arXiv 2018, arXiv:1810.11363. [Google Scholar]
  39. Breiman, L.; Friedman, J.H.; Olshen, R.A.; Stone, C.J. Classification and Regression Trees; CRC Press: New York, NY, USA, 1984. [Google Scholar] [CrossRef]
  40. Hastie, T.; Tibshirani, R.; Friedman, J. The Elements of Statistical Learning; Springer: New York, NY, USA, 2009. [Google Scholar]
  41. Kodinariya, T.M.; Makwana, P.R. Review on Determining Number of Clusters in K-Means Clustering. Int. J. 2013, 1, 90–95. Available online: https://www.researchgate.net/publication/313554124_Review_on_Determining_of_Cluster_in_K-means_Clustering (accessed on 10 January 2025).
  42. Sharma, D.; Kumar, N. A review on machine learning algorithms, tasks and applications. Int. J. Adv. Res. Comput. Eng. Technol. 2017, 6, 1548–1552. Available online: https://www.researchgate.net/publication/320609700_A_Review_on_Machine_Learning_Algorithms_Tasks_and_Applications (accessed on 10 January 2025).
  43. Sharma, H.; Kumar, S. A survey on decision tree algorithms of classification in data mining. Int. J. Sci. Res. 2016, 5, 2094–2097. Available online: https://www.researchgate.net/publication/324941161_A_Survey_on_Decision_Tree_Algorithms_of_Classification_in_Data_Mining (accessed on 10 January 2025).
  44. Križanić, S. Educational Data Mining Using Cluster Analysis and Decision Tree Technique: A Case Study. Int. J. Eng. Bus. Manag. 2020, 12, 1847979020908675. [Google Scholar] [CrossRef]
  45. Tang, H. Person-centered analysis of self-regulated learner profiles in MOOCs: A cultural perspective. Educ. Technol. Res. Dev. 2021, 69, 1247–1269. [Google Scholar] [CrossRef]
  46. Mohd Hashim, M.H.; Tasir, Z. An e-learning environment embedded with sign language videos: Research into its usability and the academic performance and learning patterns of deaf students. Educ. Technol. Res. Dev. 2020, 68, 2873–2911. [Google Scholar] [CrossRef]
  47. Hoca, S.; Dimililer, N. Comparative Analysis of Pre- and Post-COVID-19 Student Dropout Patterns Using Clustering: A Case Study. In Proceedings of the 15th International Congress on Social Sciences, Humanities, and Education, Istanbul, Turkey, 9–10 December 2023; pp. 492–499. [Google Scholar]
  48. Tuero, E.; Bernardo, A.B.; Blanco, E.; Vázquez-Merino, D. University dropout and transfer intention: What is the influence of resilience and social adaptation on the two types of dropout? J. Coll. Stud. Retent. Res. Theory Pract. 2024, 15210251241268812. [Google Scholar] [CrossRef]
  49. Ramirez-Levine, R.; Rennar-Potacco, D.; Sharma, V.; Chen, P.Z. The longitudinal retention of STEM students through a multifaceted mentoring and tutoring program. Mentor. Tutoring Partn. Learn. 2024, 1, 20. [Google Scholar] [CrossRef]
Figure 1. Block diagram of the proposed system for predicting at-risk students.
Applsci 15 02989 g001
Figure 2. Feature importance graph for the Random Forest classifier.
Applsci 15 02989 g002
Figure 3. Feature importance graph for the Support Vector Classifier.
Applsci 15 02989 g003
Figure 4. Feature importance graph for the Logistic Regression classifier.
Applsci 15 02989 g004
Figure 5. Feature importance graph for the Categorical Boosting classifier.
Applsci 15 02989 g005
Figure 6. Feature importance graph for the K-Nearest Neighbors classifier.
Applsci 15 02989 g006
Figure 7. Feature importance graph for the Artificial Neural Network classifier.
Applsci 15 02989 g007
Figure 8. Feature importance graph for the Gaussian Naïve Bayes classifier.
Applsci 15 02989 g008
Figure 9. Feature importance graph for the Classification and Regression Trees classifier.
Applsci 15 02989 g009
Figure 10. Correlation heatmap of the features employed.
Applsci 15 02989 g010
Figure 11. Comparison of Macro F1-score rates for machine learning models with default and optimized parameters.
Applsci 15 02989 g011
Figure 12. Comparison of Macro F1-score rates for machine learning models with optimized parameters for all features and five features.
Applsci 15 02989 g012
Figure 13. Decision tree showing clusters of at-risk students.
Applsci 15 02989 g013
Table 1. Dataset statistics: the number of graduate and dropout students.
Number of GraduatesNumber of DropoutsTotalImbalance Ratio
12,453852120,9741.5
Table 2. Features extracted from the dataset.
FeatureDescriptionCategory
BirthYearBirth year of the studentDemographic
GenderThe biological sex of the studentDemographic
GraduateDateHighSchoolYear and month of the high school graduation dateDemographic
NationalityStudent’s nationalityDemographic
RegistrationAgeStudent’s age at registration yearDemographic
DepartmentThe department where the student is enrolledEnrolment
EntryTypeThe admission type (university entrance exam, international exams, etc.) of the studentEnrolment
FacultyThe faculty where the student is enrolledEnrolment
RegistrationDateYear and month of the registration dateEnrolment
RegistrationSemesterShows the intake semester (fall or spring)Enrolment
RegistrationYearThe academic year in which a student enrolls typically begins in September of one year and ends in June of the following yearEnrolment
ScholarRateThe scholarship percentage of the studentEnrolment
NotPass_Course_Semester1Number of courses the student did not pass at the end of the first semesterAcademic performance
NotPass_Course_Semester2Number of courses the student did not pass at the end of the second semesterAcademic performance
Pass_Course_Semester2Number of courses the student passed at the end of the second semesterAcademic performance
Pass_Course_Semester1Number of courses the student passed at the end of the first semesterAcademic performance
Repeat_CourseNumber of courses the student repeatedAcademic performance
Table 3. Comparison of the classifiers used.
ML AlgorithmProsCons
Support Vector Classifier (SVC)Powerful for high-dimensional data and works well with small to medium-sized datasets [26].Computationally expensive for large datasets, requiring alternative approaches like linear SVMs or deep learning [27].
K-Nearest Neighbors (KNN)Simple, effective for small datasets, and adaptable to various data distributions [28].Expensive and slow for large datasets, making it impractical in big data applications [29].
Logistic Regression (LR)Simple, interpretable, and efficient for linear problems [30].Struggles with complex, nonlinear relationships and high-dimensional data [31].
Gaussian Naïve Bayes (NB)Efficient, works well with small datasets, and is effective in high-dimensional spaces [32].The assumption of feature independence is often unrealistic, leading to poor performance when features are correlated [33].
Artificial Neural Network (MLP)Excels at capturing complex nonlinear relationships, making them ideal for tasks like image recognition and NLP [34].Require high computational power and are prone to overfitting without proper regularization [35].
Random Forest (RF)Highly accurate, robust to overfitting, and works well with diverse datasets [36].Expensive and difficult to interpret, especially with many trees [37].
Categorical Boosting (CatBoost)Excels at handling categorical data efficiently and reduces overfitting, making it ideal for tabular datasets with many categorical features [22].Expensive and slower compared to simpler models, especially for large datasets [38].
Classification and Regression Trees (CART)Easy to interpret and useful for decision-making in domains requiring transparency [39].Prone to overfitting unless pruning or ensemble methods are applied [40].
Table 4. Performance measures of ML models with default parameters set using all features.
ModelsAccuracyPrecisionRecallDropout F1Grad F1Macro F1 Weighted F1
Support Vector Classifier (SVC)0.600.500.500.00.750.380.45
K-Nearest Neighbors (KNN)0.660.640.630.540.730.630.65
Logistic Regression (LR)0.590.300.500.00.750.370.44
Gaussian Naïve Bayes (NB)0.610.580.530.230.740.490.54
Artificial Neural Network (MLP)0.810.810.790.740.850.800.81
Random Forest (RF)0.820.810.800.760.850.810.82
Categorical Boosting (CatBoost)0.830.830.810.780.860.820.83
Classification and Regression Trees (CART)0.750.740.750.700.790.740.75
Table 5. Performance measures of ML models with optimal parameters using all features. An upward arrow (↑) indicates an increase in performance, while a downward arrow (↓) denotes a decrease.
ModelsAccuracyPrecisionRecallDropout F1Grad F1Macro F1Weighted F1
Support Vector Classifier (SVC)↑0.76↑0.75↑0.740.670.81↑0.740.75
K-Nearest Neighbors (KNN)0.660.640.630.540.730.630.65
Logistic Regression (LR)↑0.600.300.500.00.75↑0.380.45
Gaussian Naïve Bayes (NB)0.610.580.530.230.740.490.54
Artificial Neural Network (MLP)0.81↑0.81↓0.790.750.850.800.81
Random Forest (RF)0.82↑0.820.800.760.860.810.82
Categorical Boosting (CatBoost)0.830.830.810.770.870.820.83
Classification and Regression Trees (CART)↑0.81↑0.81↑0.800.750.85↑0.800.81
Table 6. Performance measures of ML models with optimal parameters and only the 5 most important features.
ModelsAccuracyPrecisionRecallDropout F1Grad F1Macro F1Weighted F1
Support Vector Classifier (SVC)0.760.760.740.680.810.750.76
K-Nearest Neighbors (KNN)0.660.640.630.540.720.630.65
Logistic Regression (LR)0.600.300.500.01.00.380.45
Gaussian Naïve Bayes (NB)0.610.580.520.170.740.460.52
Artificial Neural Network (MLP)0.810.810.790.750.850.800.81
Random Forest (RF)0.810.800.780.740.850.790.80
Categorical Boosting (CatBoost)0.820.820.800.760.860.810.82
Classification and Regression Trees (CART)0.810.800.790.750.850.800.81
Table 7. Cluster characteristic–retention strategy mapping.
ClusterKey CharacteristicsRecommended Intervention
Cluster 0: Consistent ChallengesRepeating and failing many coursesPersonalized tutoring, academic counseling
Cluster 1: Moderate StrugglesSome failures, declining performanceEarly-warning alerts, faculty mentorship
Cluster 2: High-Achievers at RiskGood grades but possibly disengagedPeer mentoring, social integration programs
Table 8. Comparison of the existing student dropout prediction studies.
StudyDataset SizeML Models UsedBest Performing ModelFeatures Used
Our Case Study20,974 students (1 university, multiple departments)CatBoost, RF, MLP, SVM, LR, KNNs, NB, CARTsF1-score: 82%Demographics, enrolment, academic performance
[5]University data (various features)
63,912 students
Stacking Classifier, AdaBoost, XGBoost, KNNs, DT, LRAccuracy: 88.41%First-semester academic performance, demographic data
[11]University dataset
1712 students
DT, MLP, NBAccuracy: 86% and aboveAcademic, library usage
[12]Course level data from e-learning system (261 students) 2016–2020NB, RF, MLP, LR, SVM, DTF1-score: 91%Course access, assignments, tests
[13]University dataset (multiple departments)
669 students
XGBoost, LightGBM, RF, MLP, SVM, Extra TreesAccuracy: 96.5%Academic, personal, family, psychology, assessments
[15]Academic information system of Sahmyook University
20,050 students between 2010 and 2022
LR, DT, RF, SVM, DNN, LightGBMF1-score: 84%Demographic, book loan information, scholarship information, counsel information, extra course information, academic status information, grade information
[17]500 students from the 2021 academic yearMLP, SVM, KNNs, Gradient Boosting, RF, LR
F1-score: 82%Student demographics, academic data, attendance data, and socioeconomic variables
[18]Private university in Malaysia
197 students between 2006 and 2011
LR F1-score: 81%Demographics, academic records, and surveys for gathering information about student’s socioeconomic background and psychological factors
Disclaimer/Publisher’s Note: The statements, opinions and data contained in all publications are solely those of the individual author(s) and contributor(s) and not of MDPI and/or the editor(s). MDPI and/or the editor(s) disclaim responsibility for any injury to people or property resulting from any ideas, methods, instructions or products referred to in the content.

