Article

Detection of Water Surface Using Canny and Otsu Threshold Methods with Machine Learning Algorithms on Google Earth Engine: A Case Study of Lake Van

Engineering and Natural Sciences Faculty, Osmaniye Korkut Ata Universtiy, 80000 Osmaniye, Turkey
Appl. Sci. 2025, 15(6), 2903; https://doi.org/10.3390/app15062903
Submission received: 28 January 2025 / Revised: 27 February 2025 / Accepted: 5 March 2025 / Published: 7 March 2025
(This article belongs to the Special Issue Advanced Image Analysis and Processing Technologies and Applications)

Abstract

:
Water is an essential necessity for maintaining the life cycle on Earth. These resources are continuously changing because of human activities and climate-related factors. Hence, adherence to effective water management and consistent water policy is vital for the optimal utilization of water resources. Water resource monitoring can be achieved by precisely delineating the borders of water surfaces and quantifying the variations in their areas. Since Lake Van is the largest lake in Turkey, the largest alkaline lake in the world, and the fourth largest terminal lake in the world, it is very important to determine the changes in water surface boundaries and water surface areas. In this context, the Normalized Difference Water Index (NDWI), Modified Normalized Difference Water Index (MNDWI) and Automatic Water Extraction Index (AWEI) were calculated from Landsat-8 satellite images of 2014, 2017, 2020 and 2023 in June, July, and August using the Google Earth Engine (GEE) platform. Water pixels were separated from other details using the Canny edge detection algorithm based on the calculated indices. The Otsu thresholding method was employed to determine water surfaces, as it is the most favored technique for calculating NDWI, AWEI, and MNDWI indices from Landsat 8 images. Utilizing the Canny edge detection algorithm and Otsu threshold detection approaches yielded favorable outcomes in accurately identifying water surfaces. The AWEI demonstrated superior performance compared to the NDWI and MNDWI across all three measures. When the effectiveness of the classification techniques used to determine the water surface is analyzed, the overall accuracy, user accuracy, producer accuracy, kappa, and f score evaluation criteria obtained in 2014 using CART (Classification and Regression Tree), SVM (Support Vector Machine), and RF (Random Forest) algorithms as well as NDWI and AWEI were all 100%. In 2017, the highest producer accuracy, user accuracy, overall accuracy, kappa, and f score evaluation criteria were all 100% with the SVM algorithm and AWEI. In 2020, the SVM algorithm and NDWI produced the highest evaluation criteria values of 100% for producer accuracy, user accuracy, overall accuracy, kappa, and f score. In 2023, using the SVM and CART algorithms as well as the AWEI, the highest evaluation criteria values for producer accuracy, user accuracy, overall accuracy, kappa, and f score were 100%. This study is a case study demonstrating the successful application of machine learning with Canny edge detection and the Otsu water surfaces thresholding method.

1. Introduction

Lakes, beyond their aesthetic appeal, are crucial in supporting human livelihoods, economic activities, and ecosystem services [1]. They are not just bodies of water; they are essential and distinct strategic assets for maintaining ecological balance, preserving biodiversity, and impacting the global carbon cycle [2,3]. Lakes serve a multitude of essential roles, including erosion mitigation, safeguarding coastlines, preventing floods, regulating water levels, preserving biodiversity, supporting wildlife, enhancing water quality, mitigating climate change, and providing opportunities for ecotourism and recreation [2,4]. Understanding and preserving the ecological health of lakes is not just a scientific endeavor; it is a responsibility we all share.
Lake Van is the largest lake with a high concentration of salt and soda and one of the world’s endorheic lakes. Soda lakes, like Lake Van, are considered severe habitats due to their high alkalinity, confined basin origins, and frequent exposure to high evaporation rates [5]. Until 2018, the sole fish species identified in the brackish water of Van Lake was Alburnustarichi, often known as Pearl mullet. This Cyprinid fish, belonging to the same family, is typically collected when the spring floods occur [6]. In 2018, scientists identified a previously unknown species of fish named Oxynoemacheilus ercisianus within a microbialite [5]. However, there is a recorded presence of 103 different types of phytoplankton in the lake, including Brown algae, Diatoms, Flagellates, Green algae, and Cyanobacteria. The lake has been documented to contain 36 zooplankton species, including Rotatoria, Cladocera, and Copepoda. Considering all these features, determining the boundaries of Lake Van or determining the lake water surface area is very important in terms of protecting the lake habitat. However, no study has been found in the literature regarding the water surface area of Lake Van or the determination of lake boundaries.
Remote sensing (RS) is a crucial method for collecting data in various vital fields, such as urban planning, risk assessment, and mitigation of natural calamities, ecosystem resilience [7], and global climate change [8]. RS approaches are characterized by their superior efficiency, lower cost, and faster speed than alternative methods [9,10,11,12,13]. At the same time, Landsat images are widely used in remote sensing; these Landsat satellites have provided essential data for over 50 years, enabling users to utilize remote sensing technologies to accurately identify water surfaces [14,15,16,17].
GEE offers users access to a wide range of freely accessible, public, multi-temporal remote sensing data. GEE offers a scalable and cloud-based platform for retrieving and processing geospatial data. GEE, with its supply of planetary-scale free geographic big data, effectively addresses the challenges of data availability, data storage, and data preprocessing. It also offers no-cost computer resources, enabling researchers and practitioners to perform computationally intensive geospatial big data analysis even with limited local computing and storage capabilities [18]. Researchers across all disciplines can now develop comprehensive insights at different scales (local, national, regional, continental, and global) thanks to the geospatial big data and computational capabilities provided by GEE [19]. There are many studies in the literature where lake area boundaries can be determined successfully with the GEE platform [1,20,21,22].
RS images, GEE, and spectral water body extraction indices such as Automated Water Extraction Index (AWEI), Modified Normalized Difference Water Index (MNDWI), and Normalized Difference Water Index (NDWI) are commonly used to accurately determine the surface areas of bodies of water and observe lakes. Green and near-infrared (NIR) bands are used to determine the properties of water and calculate the NDWI [23]. Nevertheless, NDWI is unable to completely remove the interference caused by gloomy metropolitan areas that are combined with bodies of water. In order to solve that problem, a modified version of the NDWI [24] was suggested. With this modification, the Shortwave Infrared (SWIR) band is employed instead of the Near-Infrared (NIR) band used in the NDWI. This change allows for the purpose of extracting water surfaces while simultaneously reducing the interference caused by developed areas. It is significant to note that several urban features (such as shadows, roadways, and other dark objects) make MNDWI and NDWI unsuitable for precisely detecting water bodies in urban high-resolution images that also produce strong signals in these two indices [25,26]. Ref. [27] presented the Automated Water AWEI, a novel method that offers a consistently reliable threshold value for water extraction. Some studies in which these indexes are used are examined; the demarcation of the boundaries of the glacial lake in the Tibetan Plateau by [20] using the Landsat 8 satellite image and the MNDWI. In another study [1], annual lake maps of the Mongolian plateau were extracted from water mass maps created using all available Landsat images with the water mass mapping algorithm using vegetation and water indices (MNDWI, EVI, NDVI). In another study, lakes and reservoirs were determined completely automatically by combining Landsat 8 OLI data, GEE, AWEI, and for the period 2014–2018 in New Zealand [21].
Each pixel in the generated indices is assigned a gray value. Different thresholding techniques are employed to separate water surfaces from other elements based on their respective gray values. There are various thresholding methods, including manual thresholding and automatic thresholding methods like the Otsu threshold method and Canny edge detection [28,29]. The Canny edge detection and Otsu method is a fusion of the Otsu algorithm and the Canny edge detector. The Canny edge detector and the Otsu algorithm are frequently employed in the tasks of edge detection and image segmentation. The Otsu threshold algorithm determines the threshold by identifying the highest variance across classes in the data histogram [30,31], whereas the Canny detector identifies edge regions by applying Gaussian filtering and calculating the gradient magnitude between neighboring pixels [32]. The Otsu and Canny edge detection algorithm utilizes the Otsu threshold to provide automatic threshold segmentation, thus addressing the issue of subjective dual threshold settings in Canny edge detection [33,34]. The Canny algorithm is an edge detection algorithm used to clearly extract the boundaries of the object by determining the appropriate parameters. The Otsu threshold detection algorithm calculates the high threshold value that is important for the Canny algorithm and then uses this threshold value to detect the edge of the object in the Canny algorithm. The Otsu algorithm is used to select the threshold value to be used in the Canny algorithm, and in this way, the edge extraction effect of the Canny algorithm can be increased [35].
Machine learning-based image classification methods effectively extract water surface areas of water bodies from remote sensing images [2,36,37]. With the ongoing advancements in remote sensing technology and the accessibility of data with high resolution sets, valuable data and information must be extracted utilizing RS images. Commonly used methods for the classification of images in RS and related fields include RF, SVM, and CART [38,39,40,41,42,43,44]. Machine learning algorithms utilize training samples for image classification, relying on an important amount of training data [45]. The Otsu technique addresses the limitation of a uniform threshold in conventional algorithms [46]. However, it encounters threshold anomalies when there is a wide range of water pixels in the image. To solve the above problems, in regions with lots of information, such as Lake Van, it is necessary to determine the boundaries of the particular lake area and the surface size of the lake by accurately computing the appropriate threshold value by automated means. The advent of the GEE has revolutionized the conventional method of processing remote sensing data. GEE is a cloud-based platform designed for the analysis of large geographical data [47]. This platform offers customers access to high-resolution satellite imagery data from satellites such as the Sentinel and Landsat. Additionally, it executes image preprocessing procedures on a cloud-based platform.
In light of all these studies, the following knowledge can be gained:
-
Since Lake Van is the world’s largest soda lake and the largest lake in Turkey, it is very important to protect its unique habitat. In order to protect this situation, it is very important to know the boundaries and water surface area of the lake in order to take the necessary measures. When the literature on this subject was analyzed, no study on the determination of the boundaries and water surface area of Lake Van was found.
-
The validity of the Otsu thresholding method was investigated in order to eliminate the problem of double thresholding in the Canny edge detection algorithm in large water bodies such as Lake Van and to determine the appropriate threshold automatically.
-
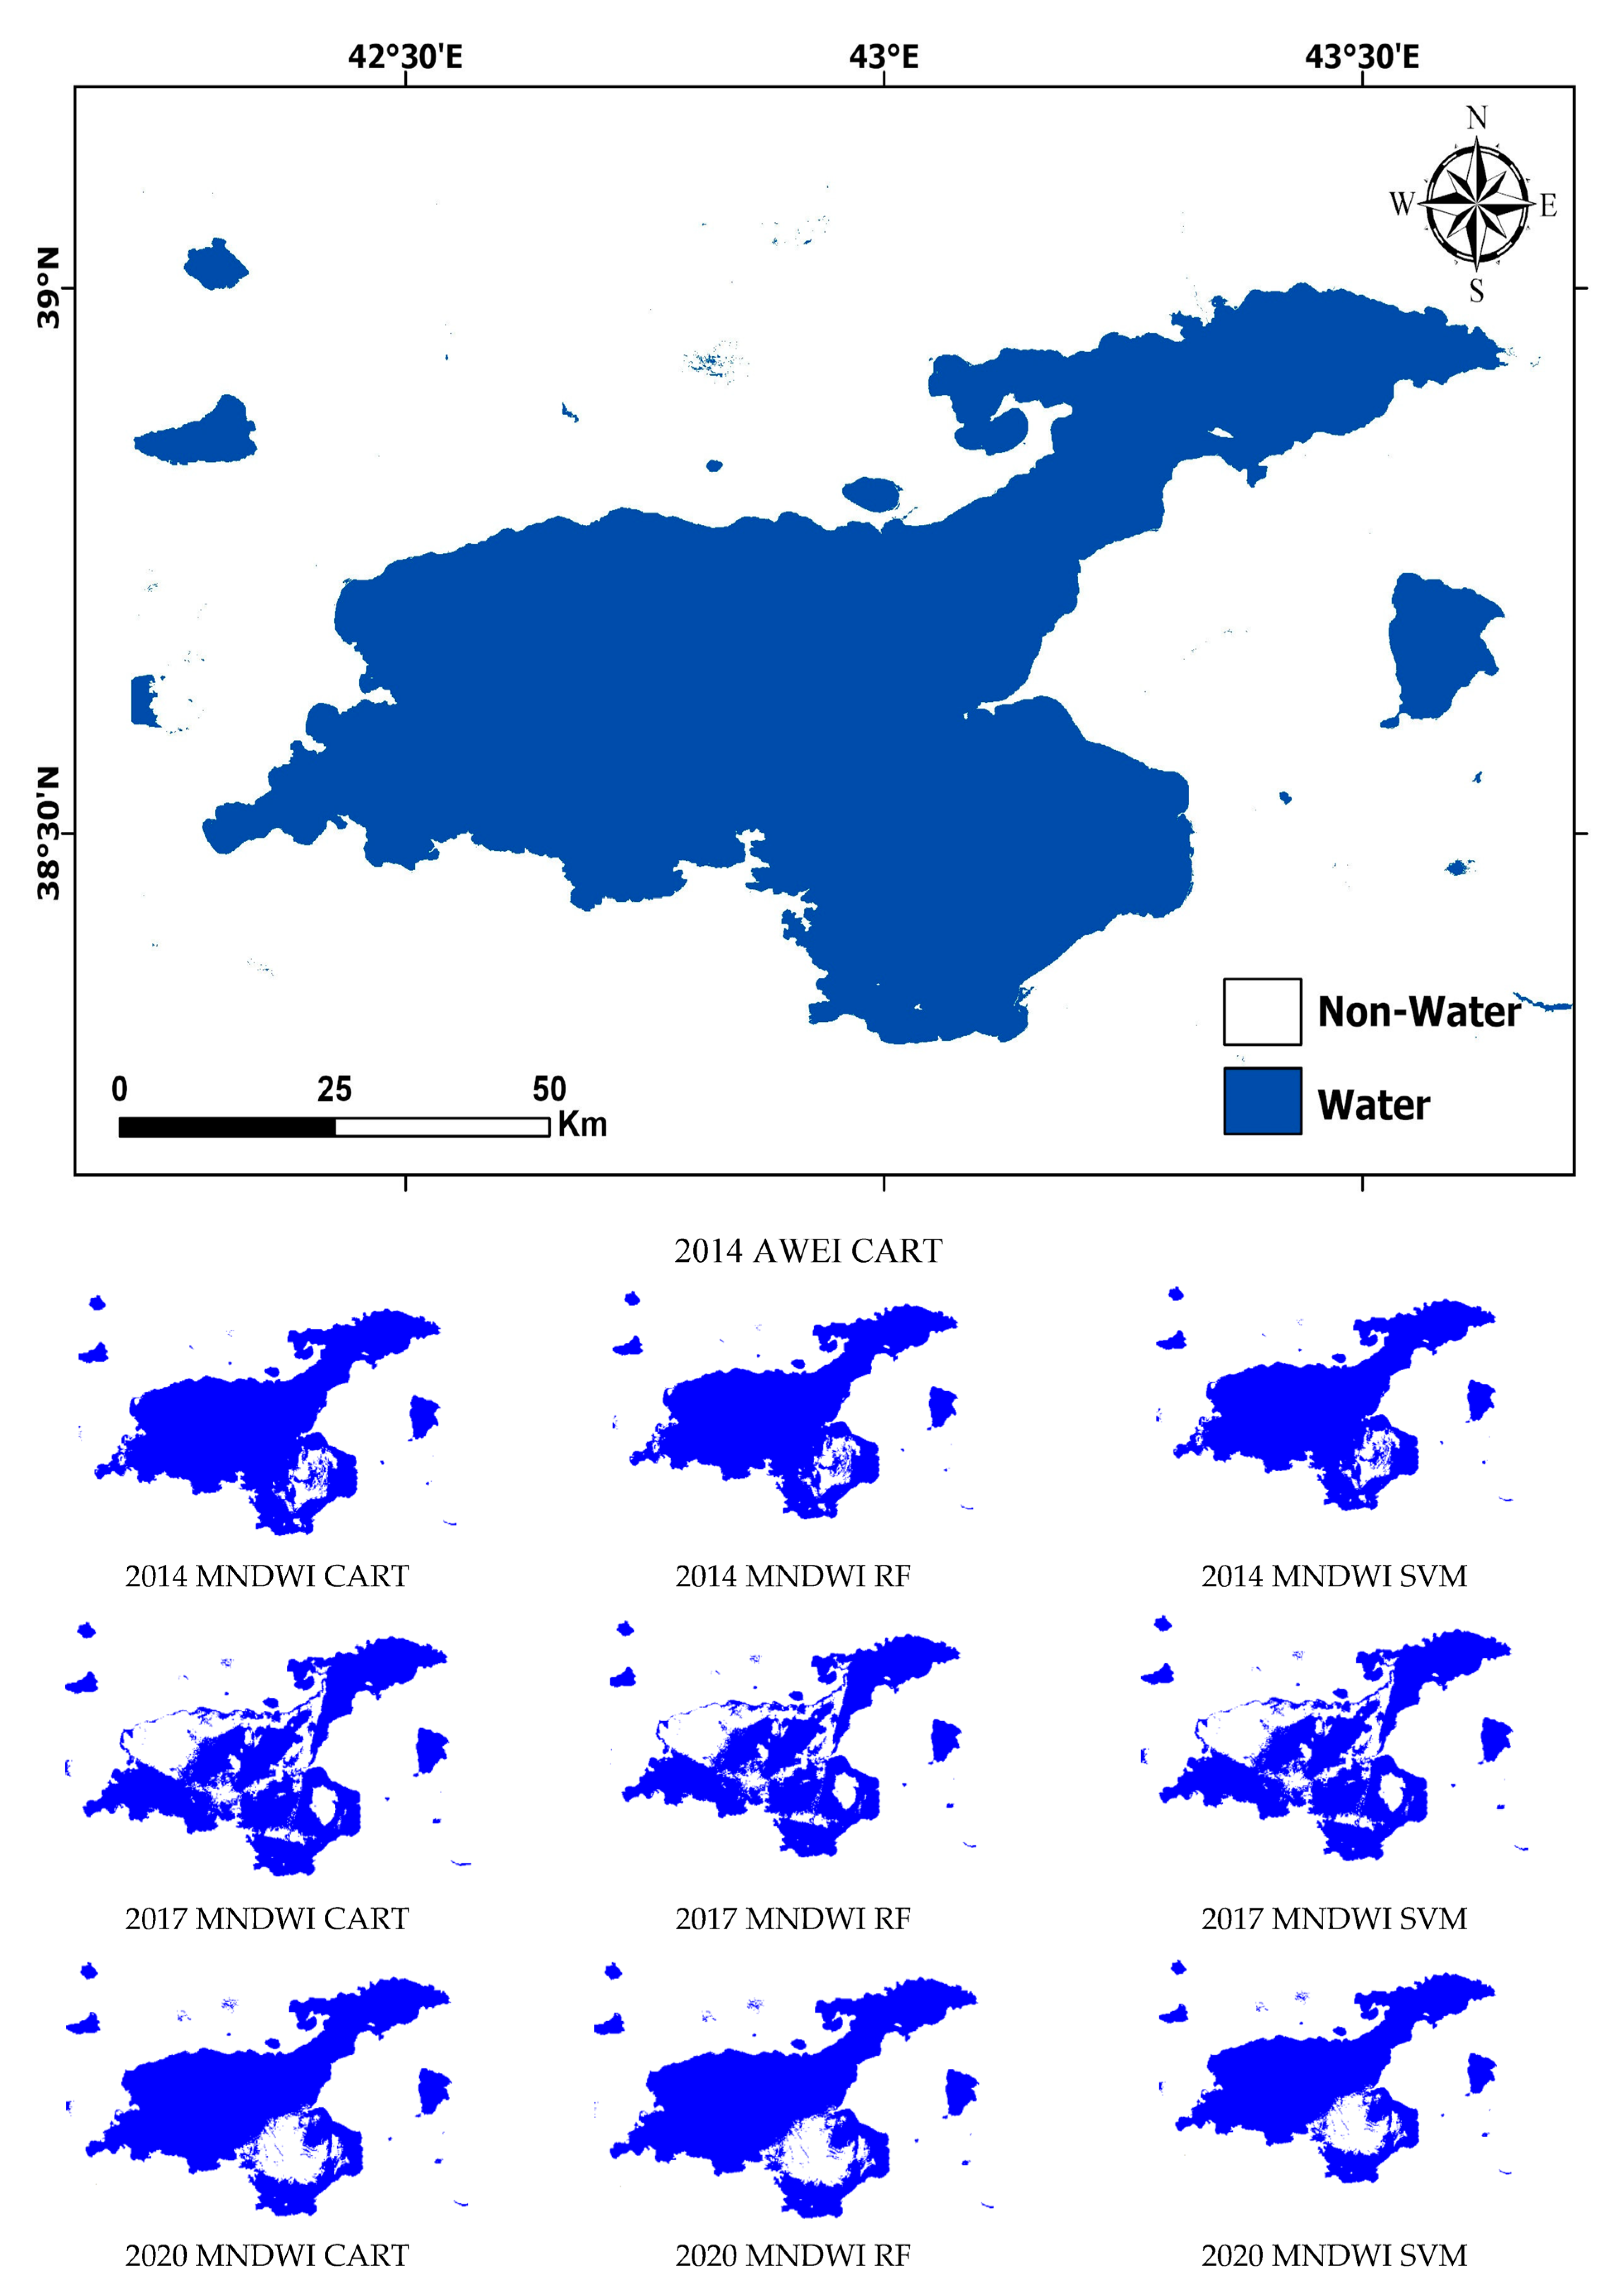
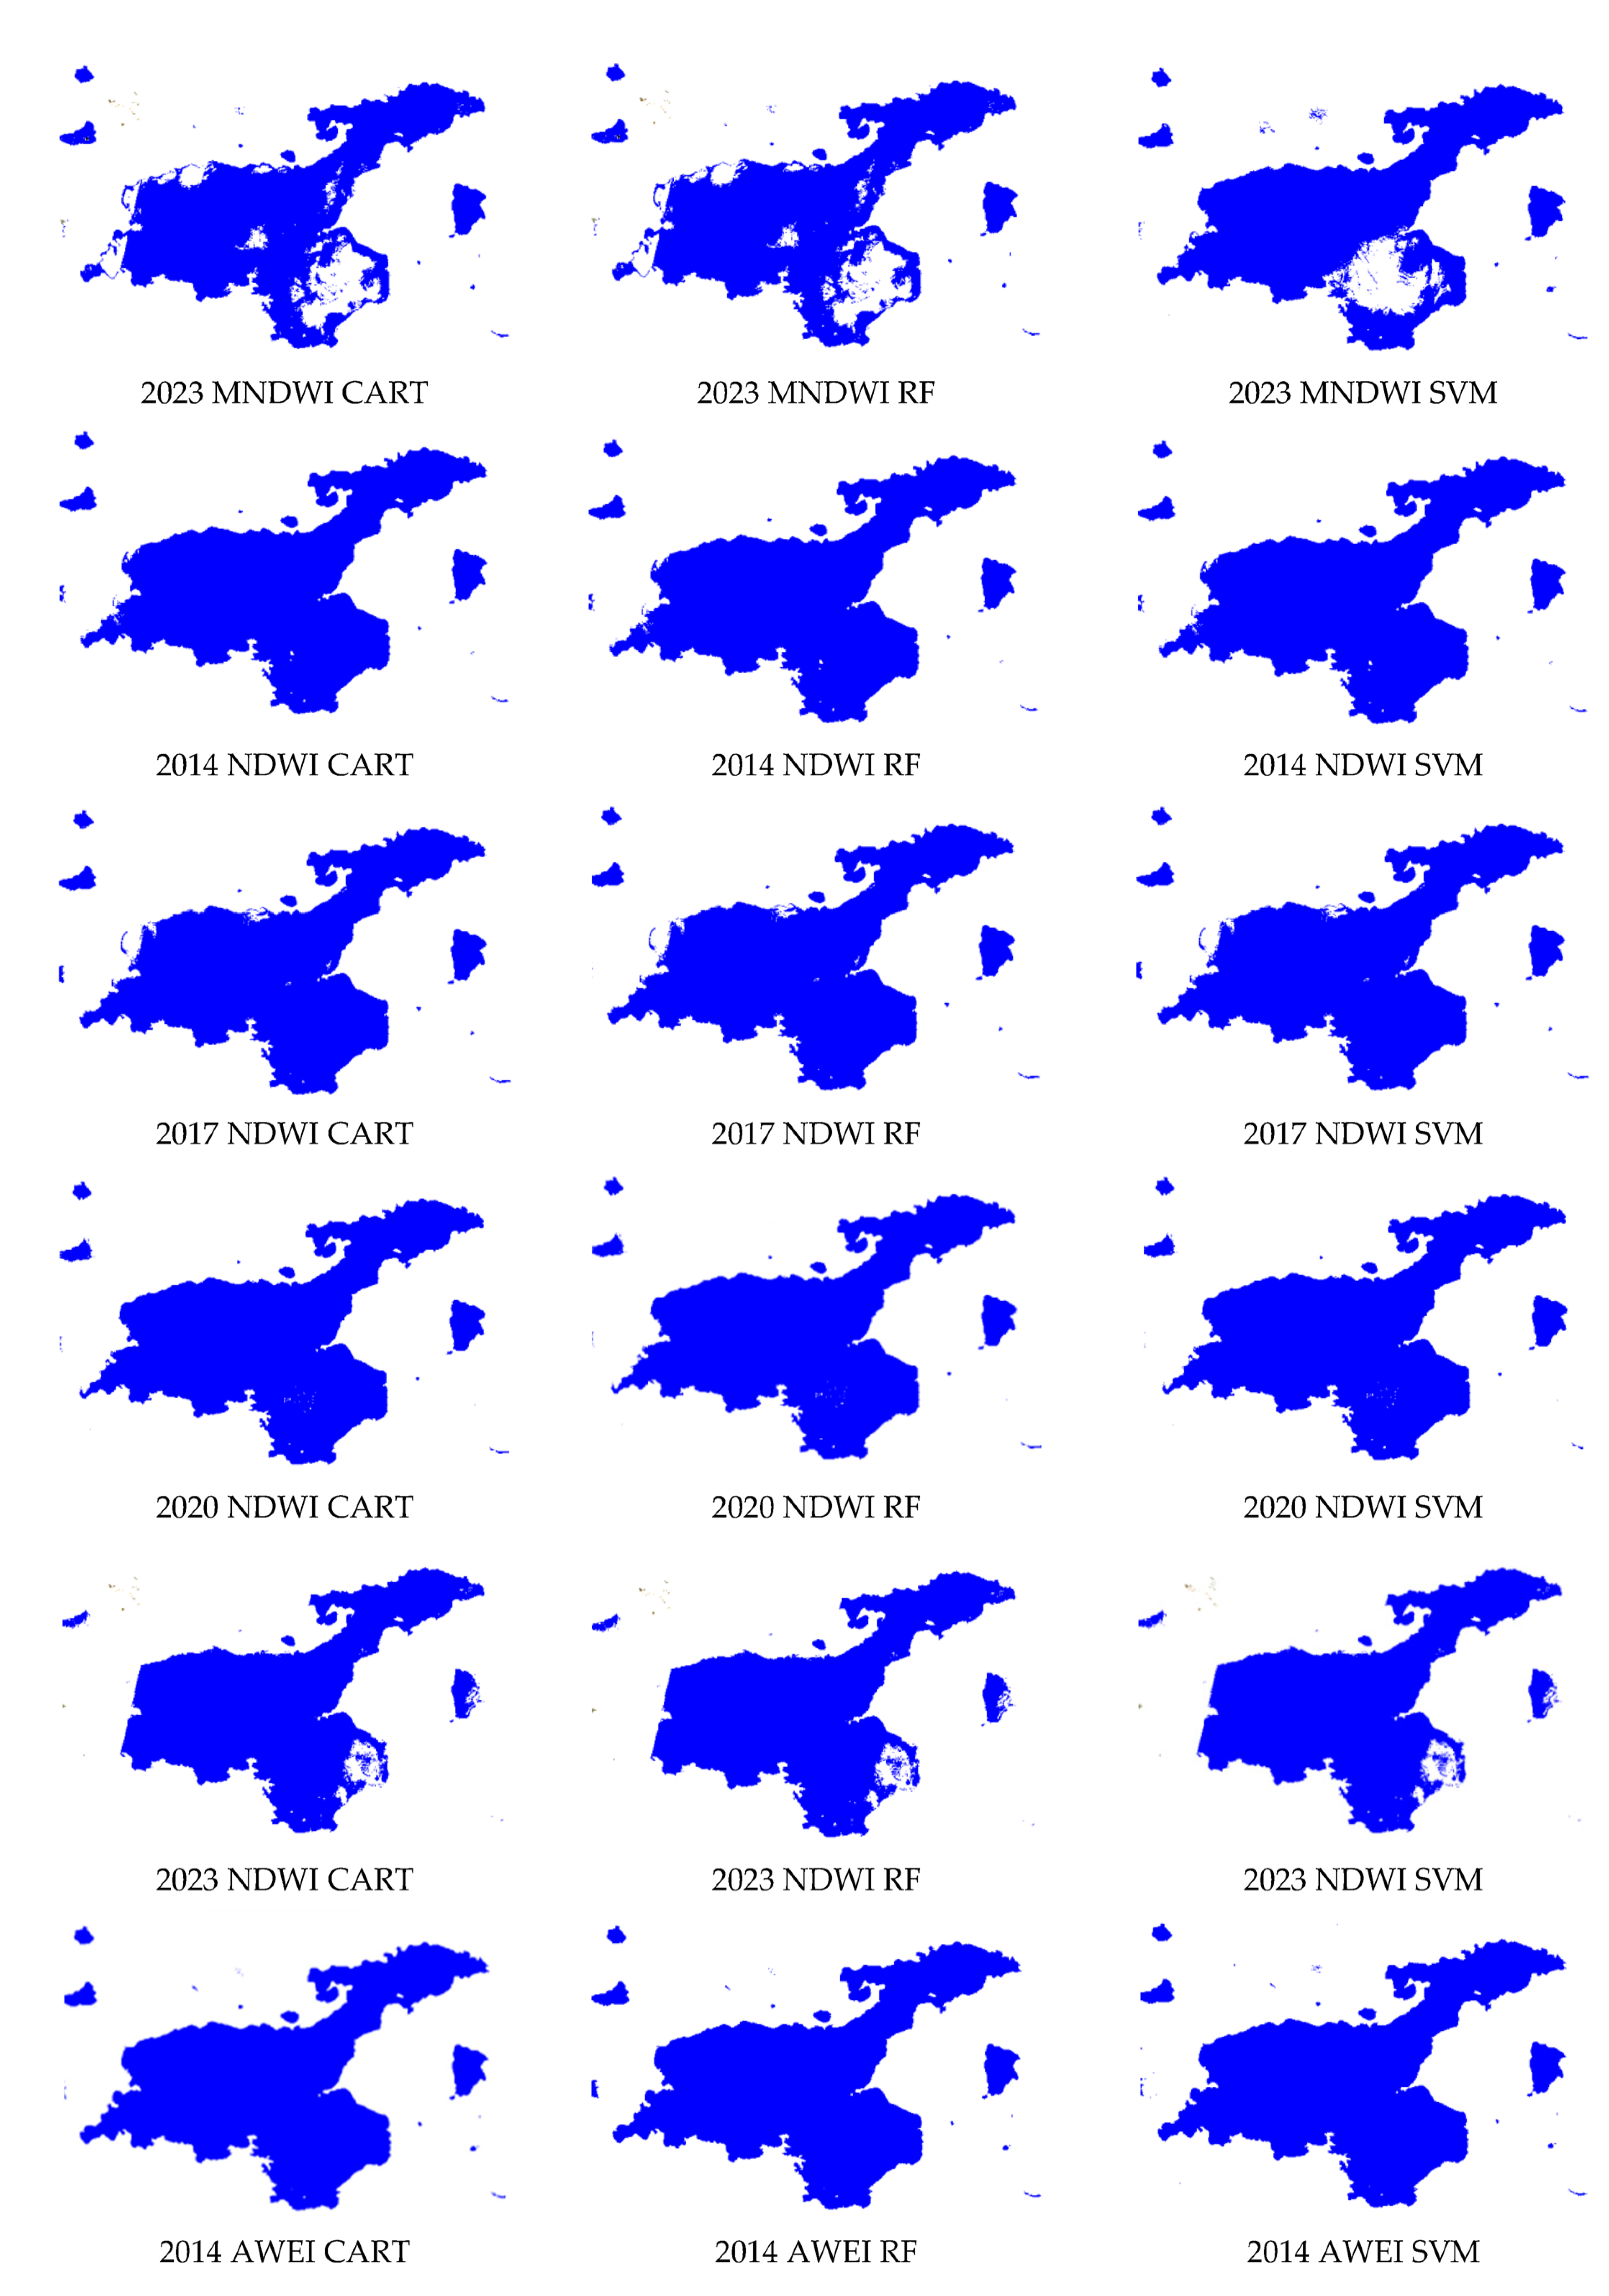
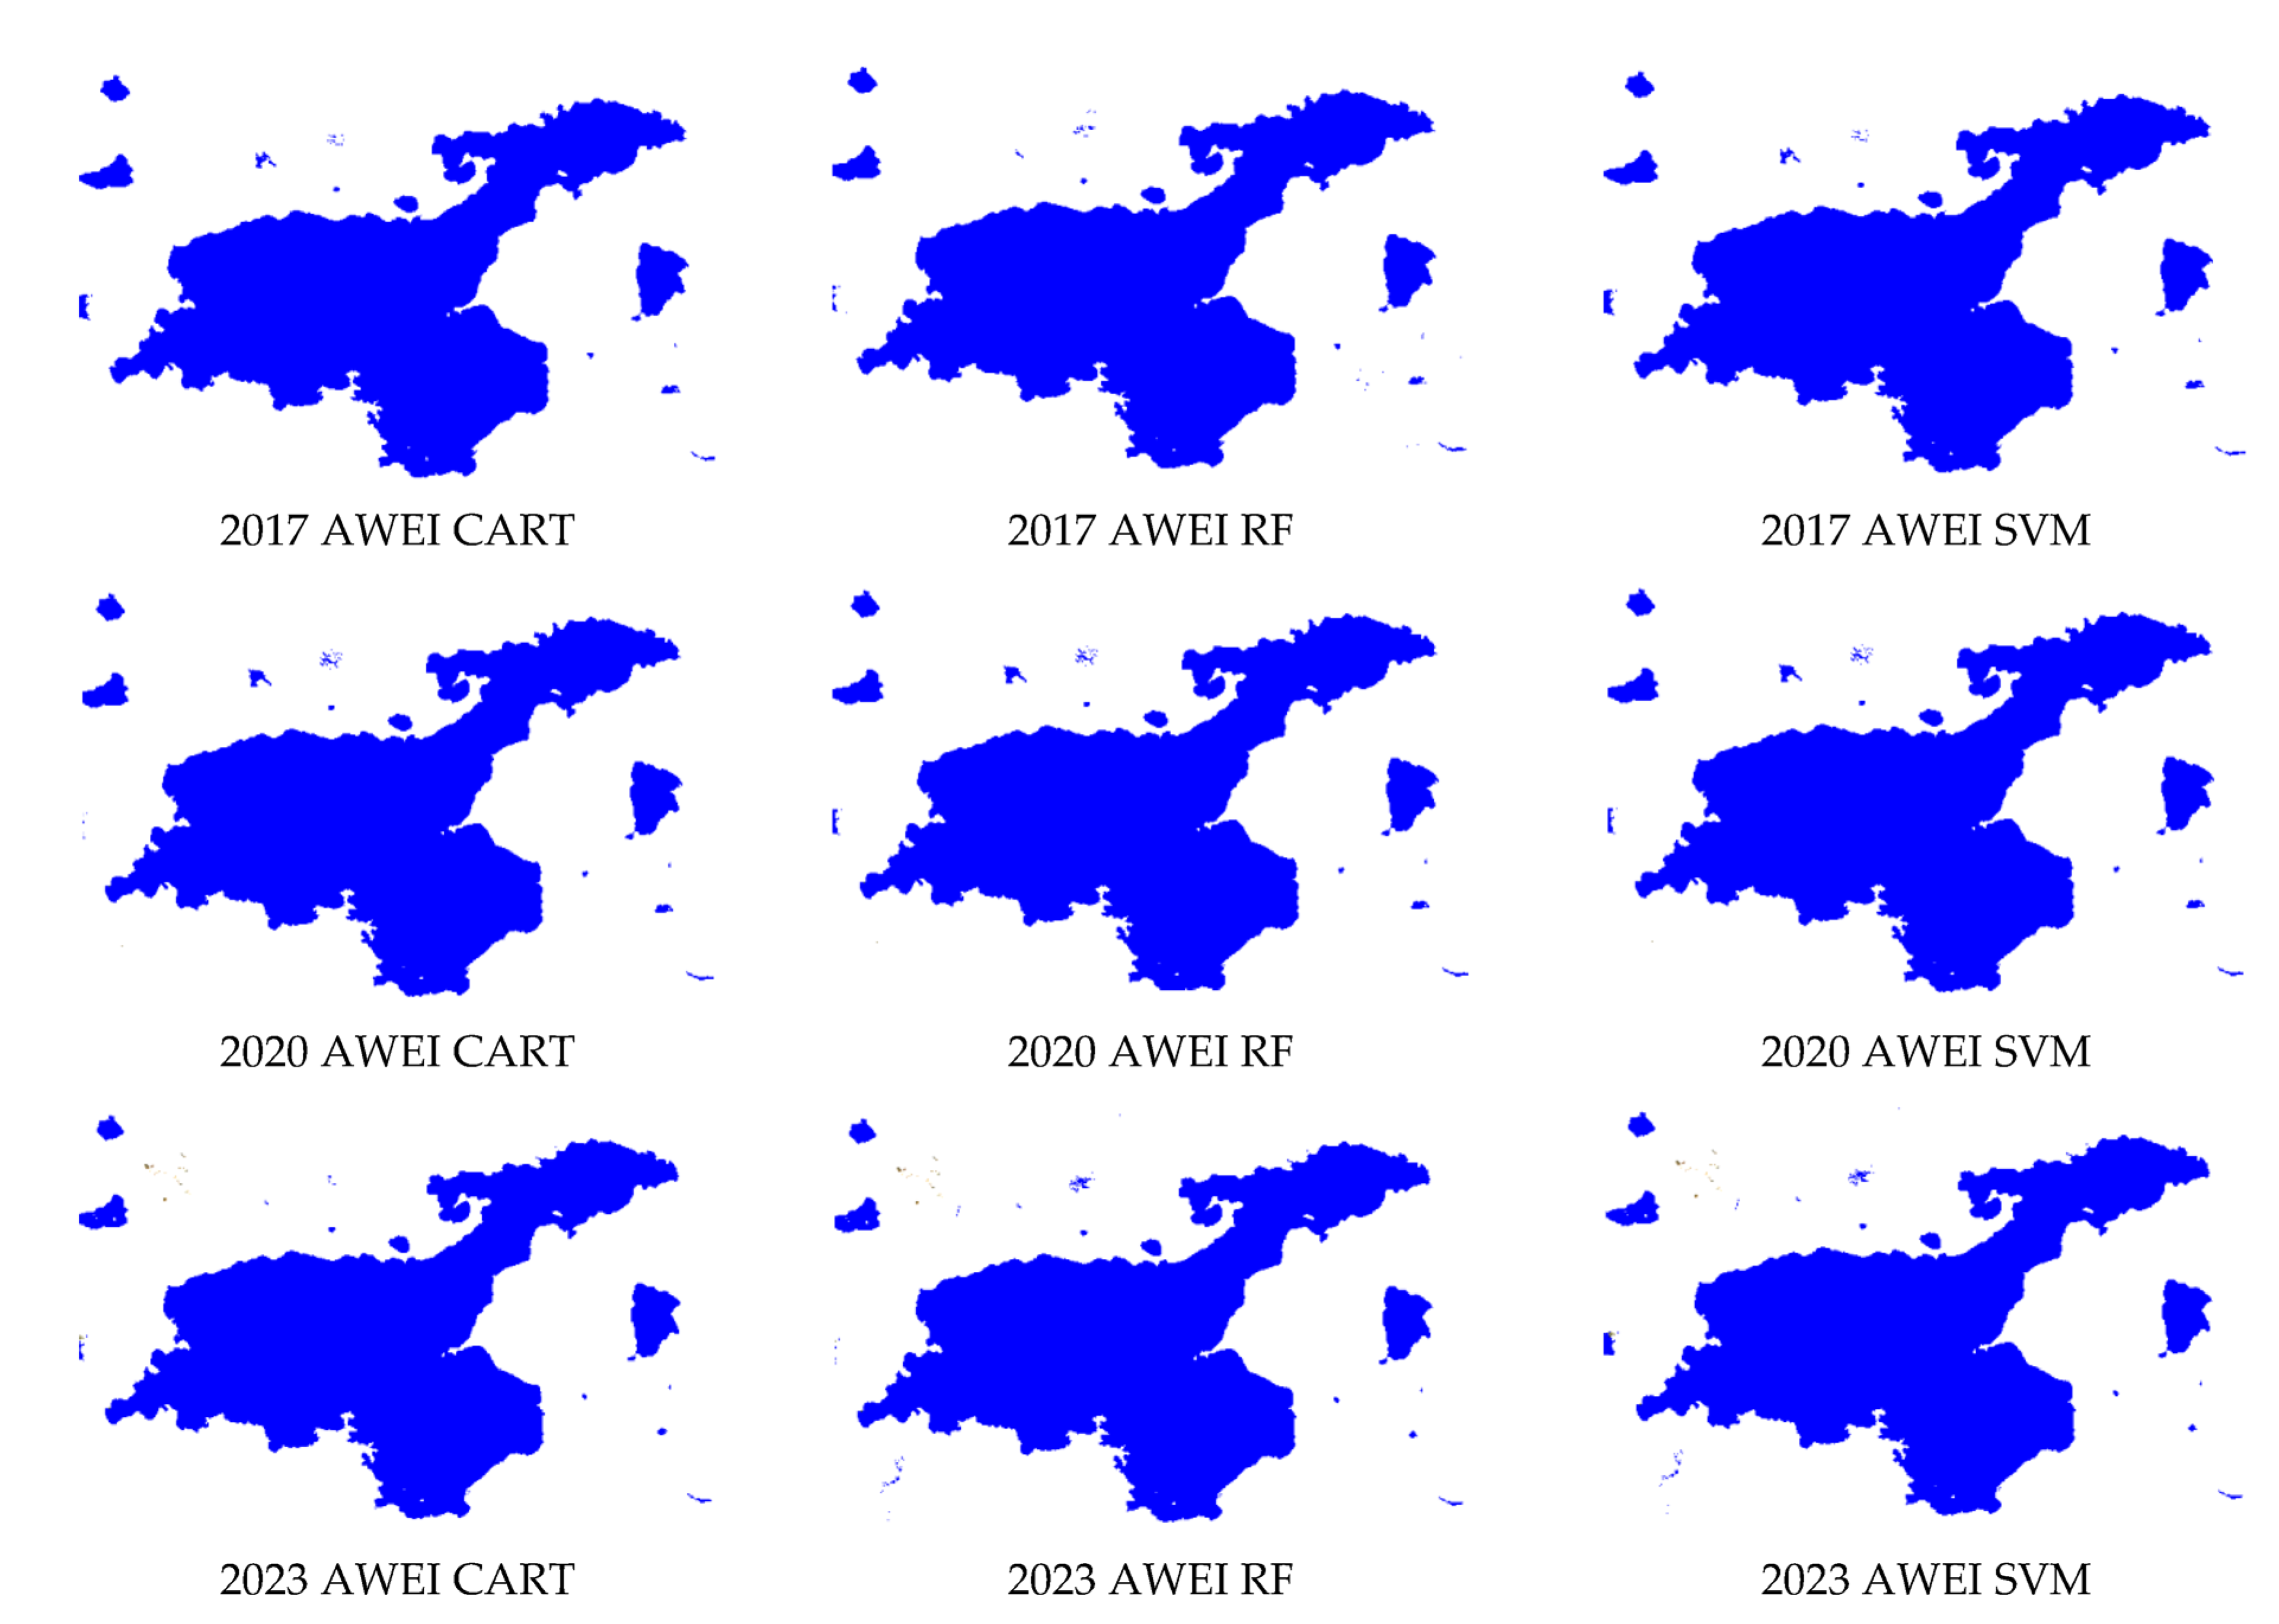
In large water bodies such as Lake Van, the performances of the SVM, RF, and CART machine learning algorithms used in the study were compared by determining the boundaries and water surface areas of the lake on the GEE platform.
This is the first study in which Canny edge detection and Otsu thresholding methods and AWEI, NDWI, and MNDWI indices are included in the analyses to determine the water boundaries of Lake Van using CART, SVM, and RF methods (all analyses are performed in GEE). In order to determine the correct lake area boundaries, each image was preprocessed at the same level on the GEE platform (Section 2.2) and spectral indices were calculated after cloud, scale, and date filtering (Section 2.5). The Canny edge detection algorithm was calculated with the optimal threshold selected by the Otsu method (Section 2.3 and Section 2.4). Finally, the accuracy assessment and performance of the model in extracting the surface boundaries of Lake Van were compared with the machine learning algorithms: CART, SVM, and RF methods (Section 2.6 and Section 2.7). The results of all the methods used in the study show that this model shows that the boundaries of Lake Van can be extracted quite accurately (Section 3).

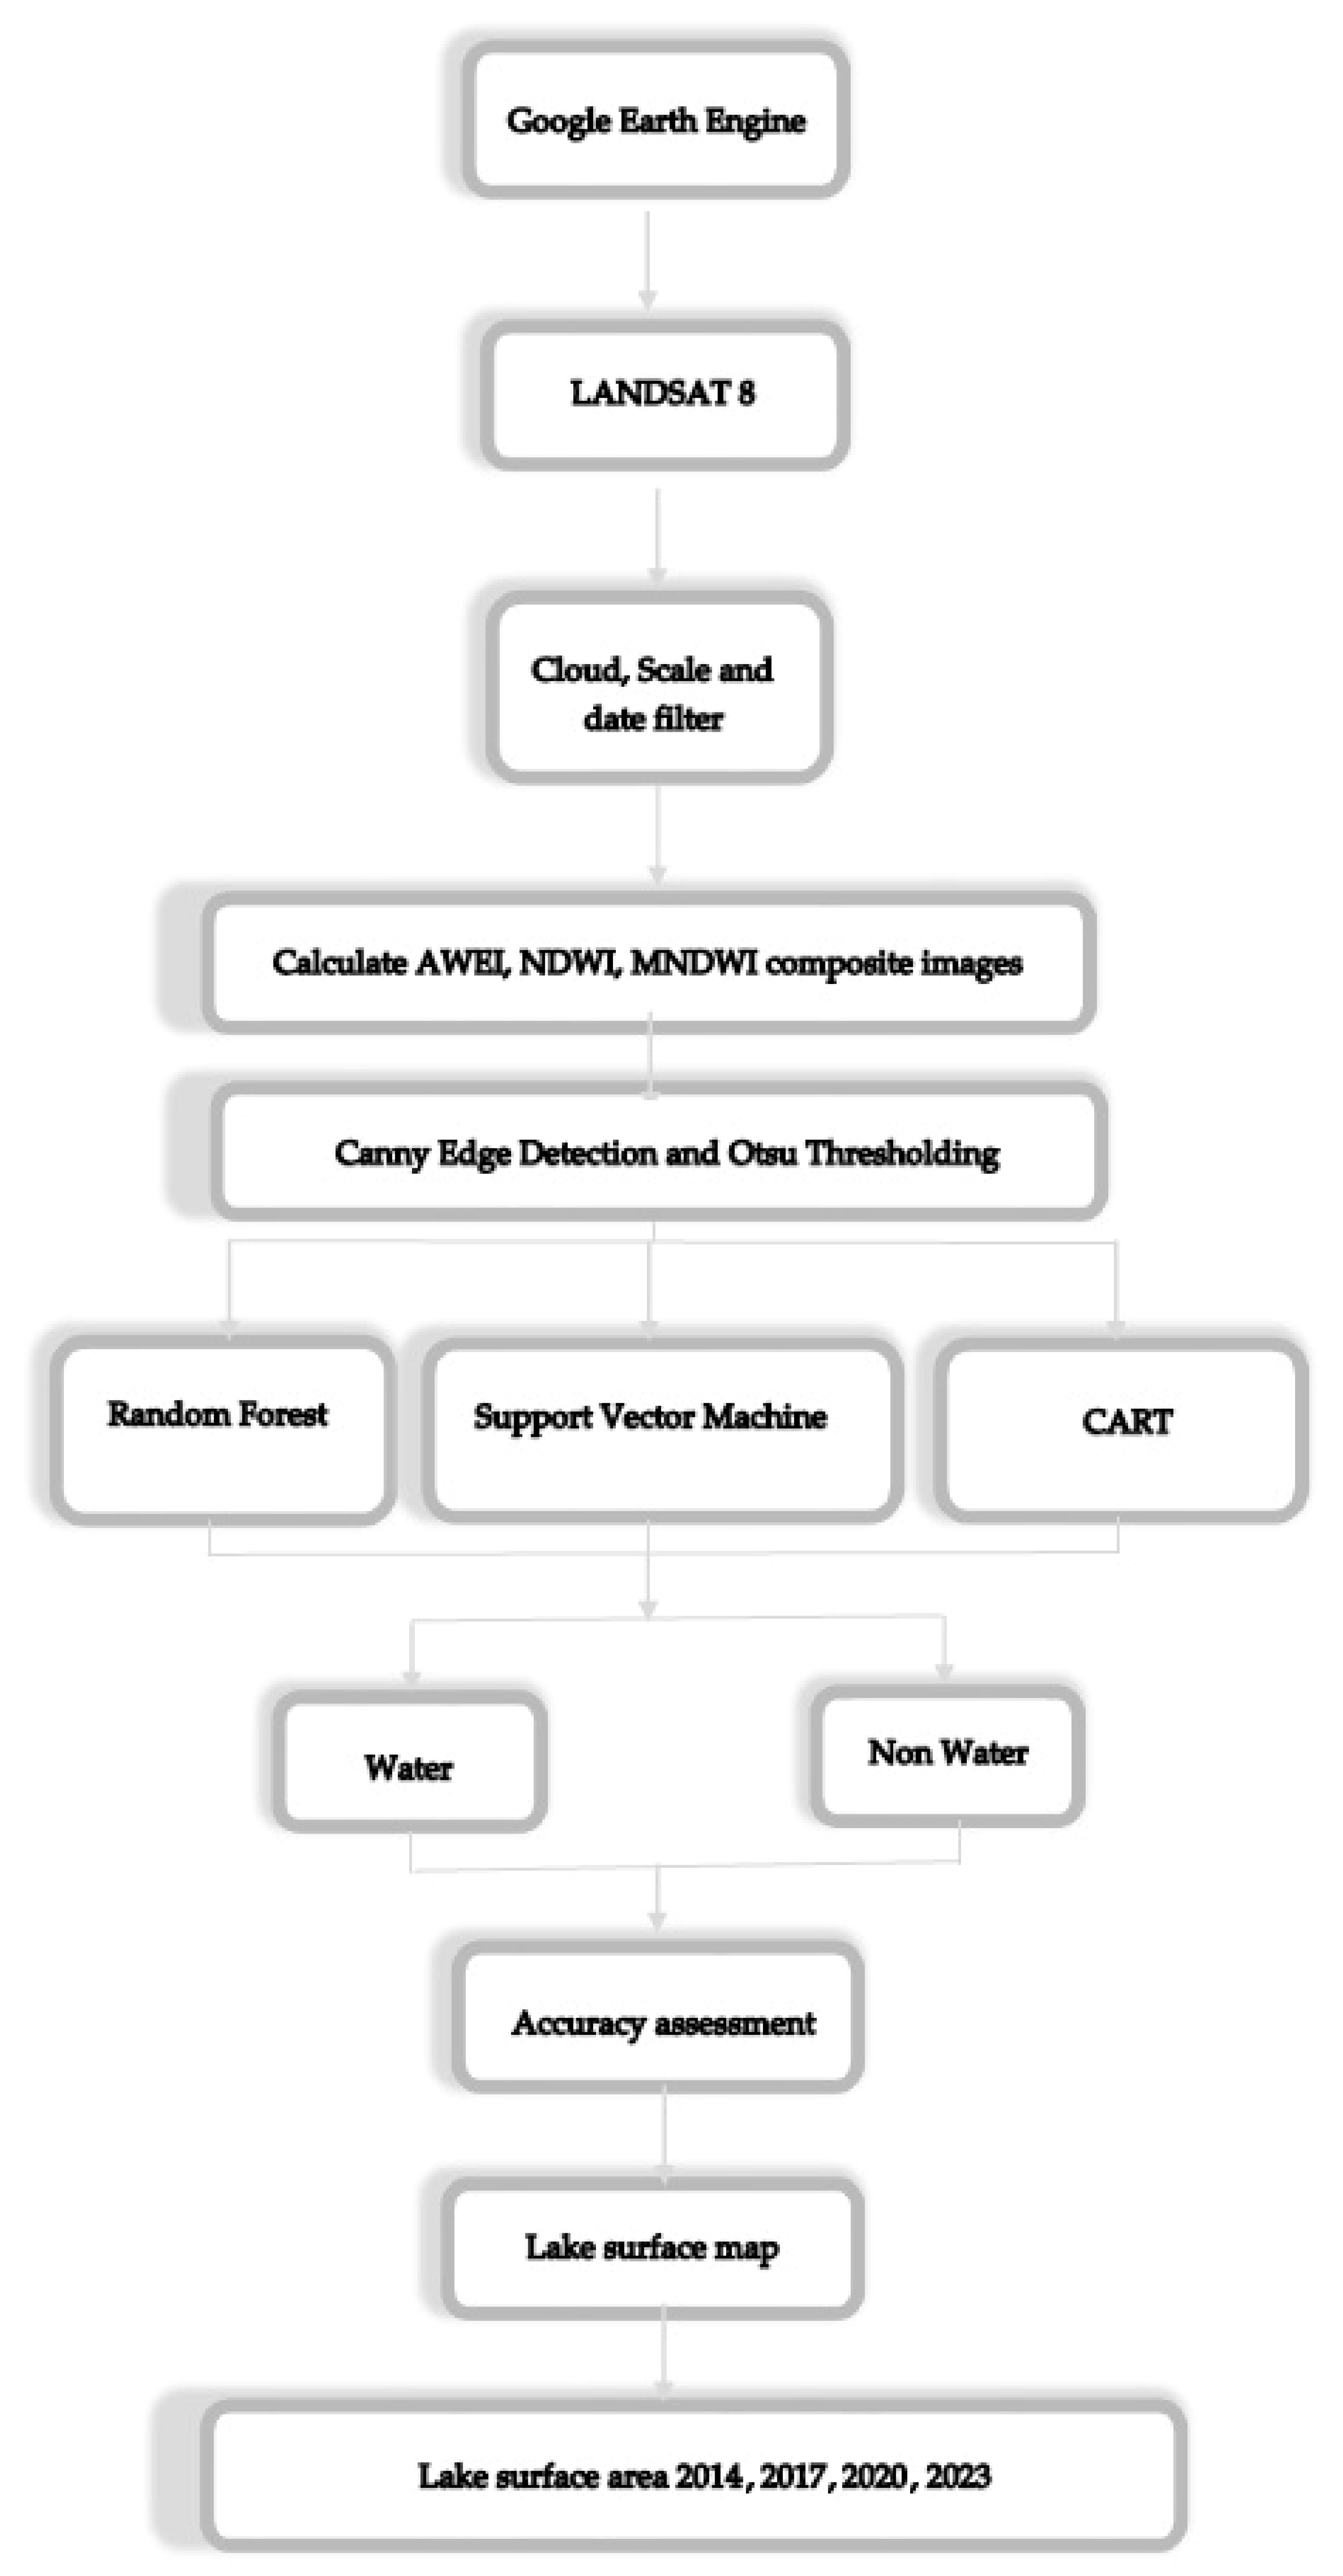
2. Materials and Methods
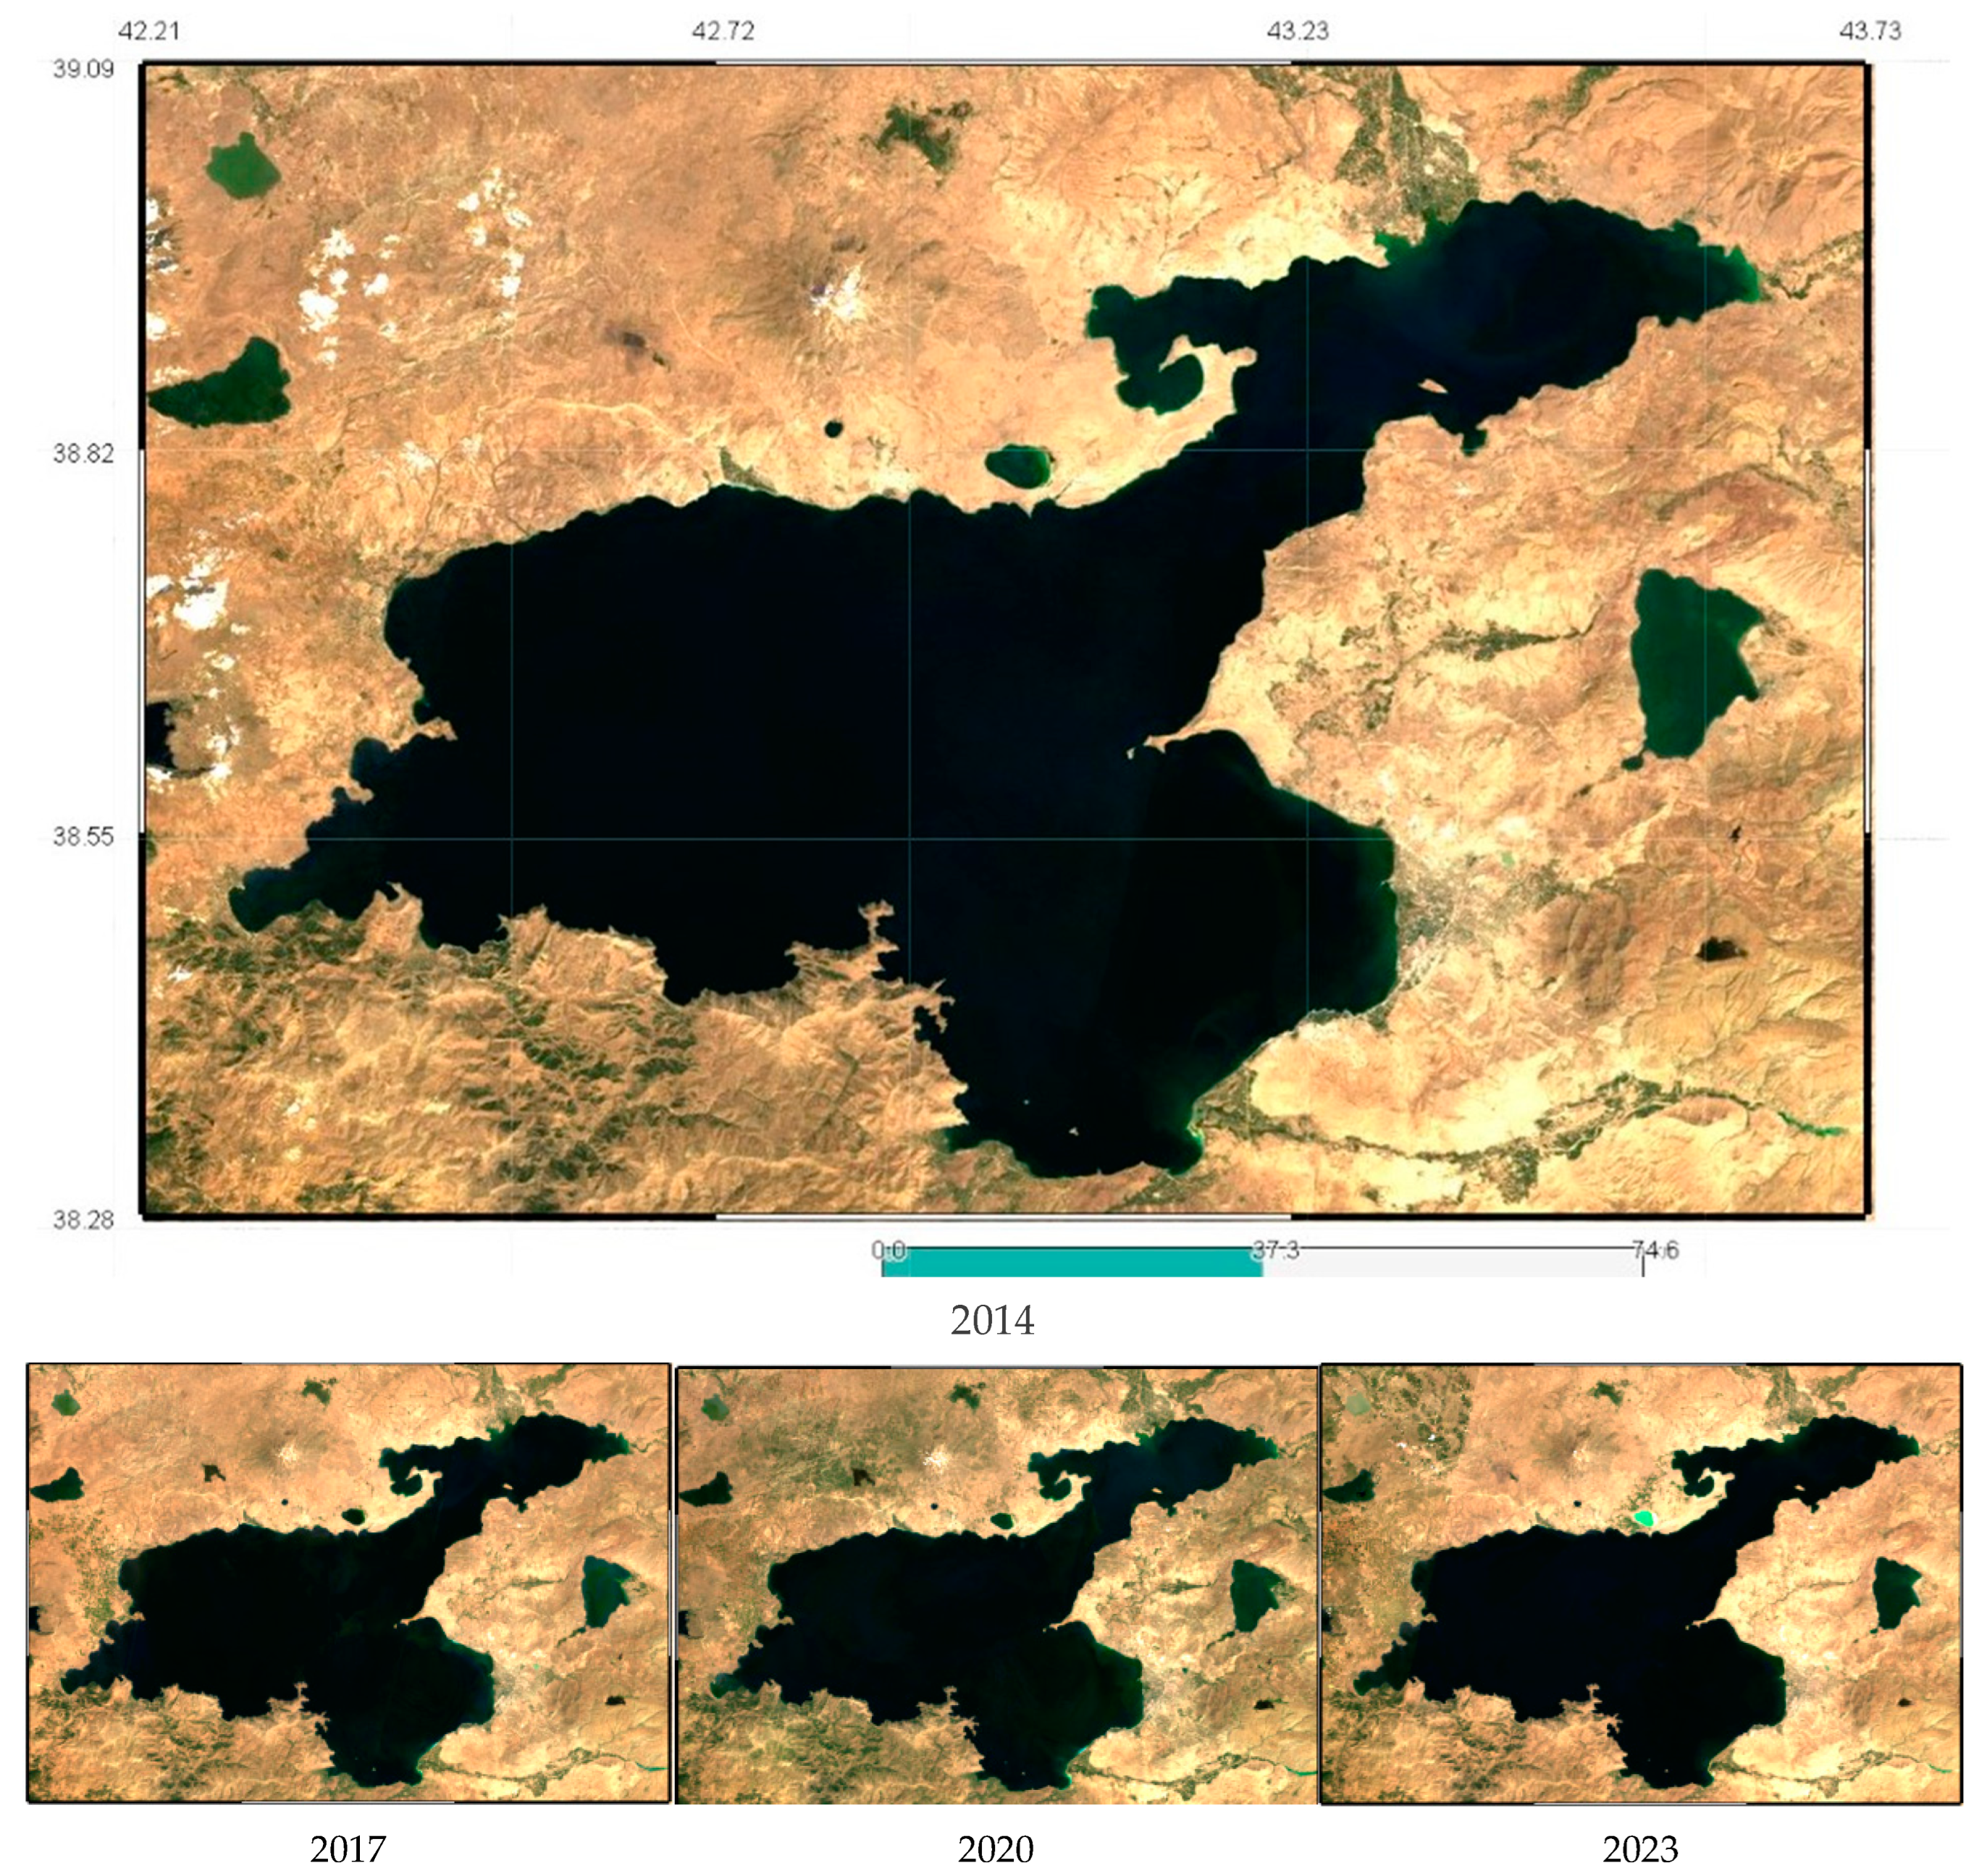
2.1. Study Area

Lake Van is the largest lake in Turkey, the largest alkaline lake in the world, and the world’s fourth-largest terminal lake. Lake Van is 3602 km2 in surface area and has a maximum bottom depth of 451 m [48,49,50]. Standing 1648 m above sea level, the lake is situated in eastern Turkey on the East Anatolian Plateau [50]. This lake was formed when the Nemrut Stratovolcano erupted approximately 600,000 years ago and created a barrier on the lake’s western edge [51]. Located on a high plateau, Lake Van stretches over 130 km. The lake’s water is alkaline (pH ~9.8) and saline (pH ~21.4) down to 450 m below the surface [52].
A central terminal lake in eastern Anatolia in Turkey, Lake Van is situated between the Caspian, Mediterranean, and Black seas in a climate-vulnerable area. Lake Van is a confined basin lake that noticed significant impacts from changes in the climate throughout the Quaternary period. The process of precipitation reaching the lake may need a span of multiple years. In the basin, characterized by a high and continental climate, the predominant form of precipitation is snowfall. The process of snow melting, subterranean infiltration, and subsequent arrival in the lake typically spans several years.
The most important water sources around Lake Van that feed Lake Van are the Karasu, Deliçay, Bendimahi, Zilan, Karmuç, Sapur, Güzelkonak, Engil, Akköprü, and Memedik streams. In addition, many small streams flow into Lake Van seasonally. These water resources are used for fishing, energy production, irrigation, transportation, drinking and potable water, and tourism [53]. Pearl mullet, an endemic fish species that can live in salty and highly soda waters, lives in Lake Van [54].
The coastal regions of Lake Van exhibit a diverse array of characteristics, including mountains, castles, lakes, beaches, historical landmarks, and tourism assets, each possessing distinct qualities. The islands of Akdamar, Çarpanak, Adır, and Kuşare are situated eastward of the lake. These islands have notable destinations for tourism. The island region has been officially designated as a protected zone since 1990. Due to all these features of Lake Van and its surroundings, and because the water level in the lake has not yet been investigated, Lake Van was chosen as the study area.

2.2. Data

In February 2013, the Landsat 8 satellite was launched, and it is equipped with Operational Land Image (OLI) capabilities. It has a 30 m spatial resolution and is scheduled to be revisited every 16 days. The aforementioned data consists of surface reflection data, which were obtained by physically normalizing the image values throughout time, irrespective of variations in meteorological conditions [55]. These images unequivocally comprise five VNIR bands, two SWIR bands, and one TIR band, all skillfully processed to deliver accurate orthorectified surface temperatures. They also include QA bands and intermediate bands that are utilized to calculate the ST products.
All analyses in the study were performed on the GEE platform. The workflow of the methodology is shown in Figure 1. GEE is a feature-rich platform that makes geographic dataset analysis and visualization easier for scientists. It caters to diverse users, including academics, non-profit organizations, businesses, and government entities. Earth Engine is a platform that hosts satellite imagery and preserves it in a publicly accessible data archive. This collection contains historical earth photographs spanning over four decades. The images, which are taken daily, are subsequently accessible for the purpose of global-scale data mining. In addition, Earth Engine provides APIs and other tools that facilitate the examination of extensive databases. Images captured by Landsat 8 are associated with the identifiers “LANDSAT/LC08/C02/T1_L2” on the GEE cloud platform. The LaSRC algorithm creates data from Landsat 8 SR [56].
It is noteworthy to mention that regarding cloud-related issues, a criterion employed for analyzing Landsat images involved the creation of a digital processing script to mask clouds and their shadows within a designated range for satellites and sensors. The script was modified in accordance with the guidelines provided by the basic algorithm.

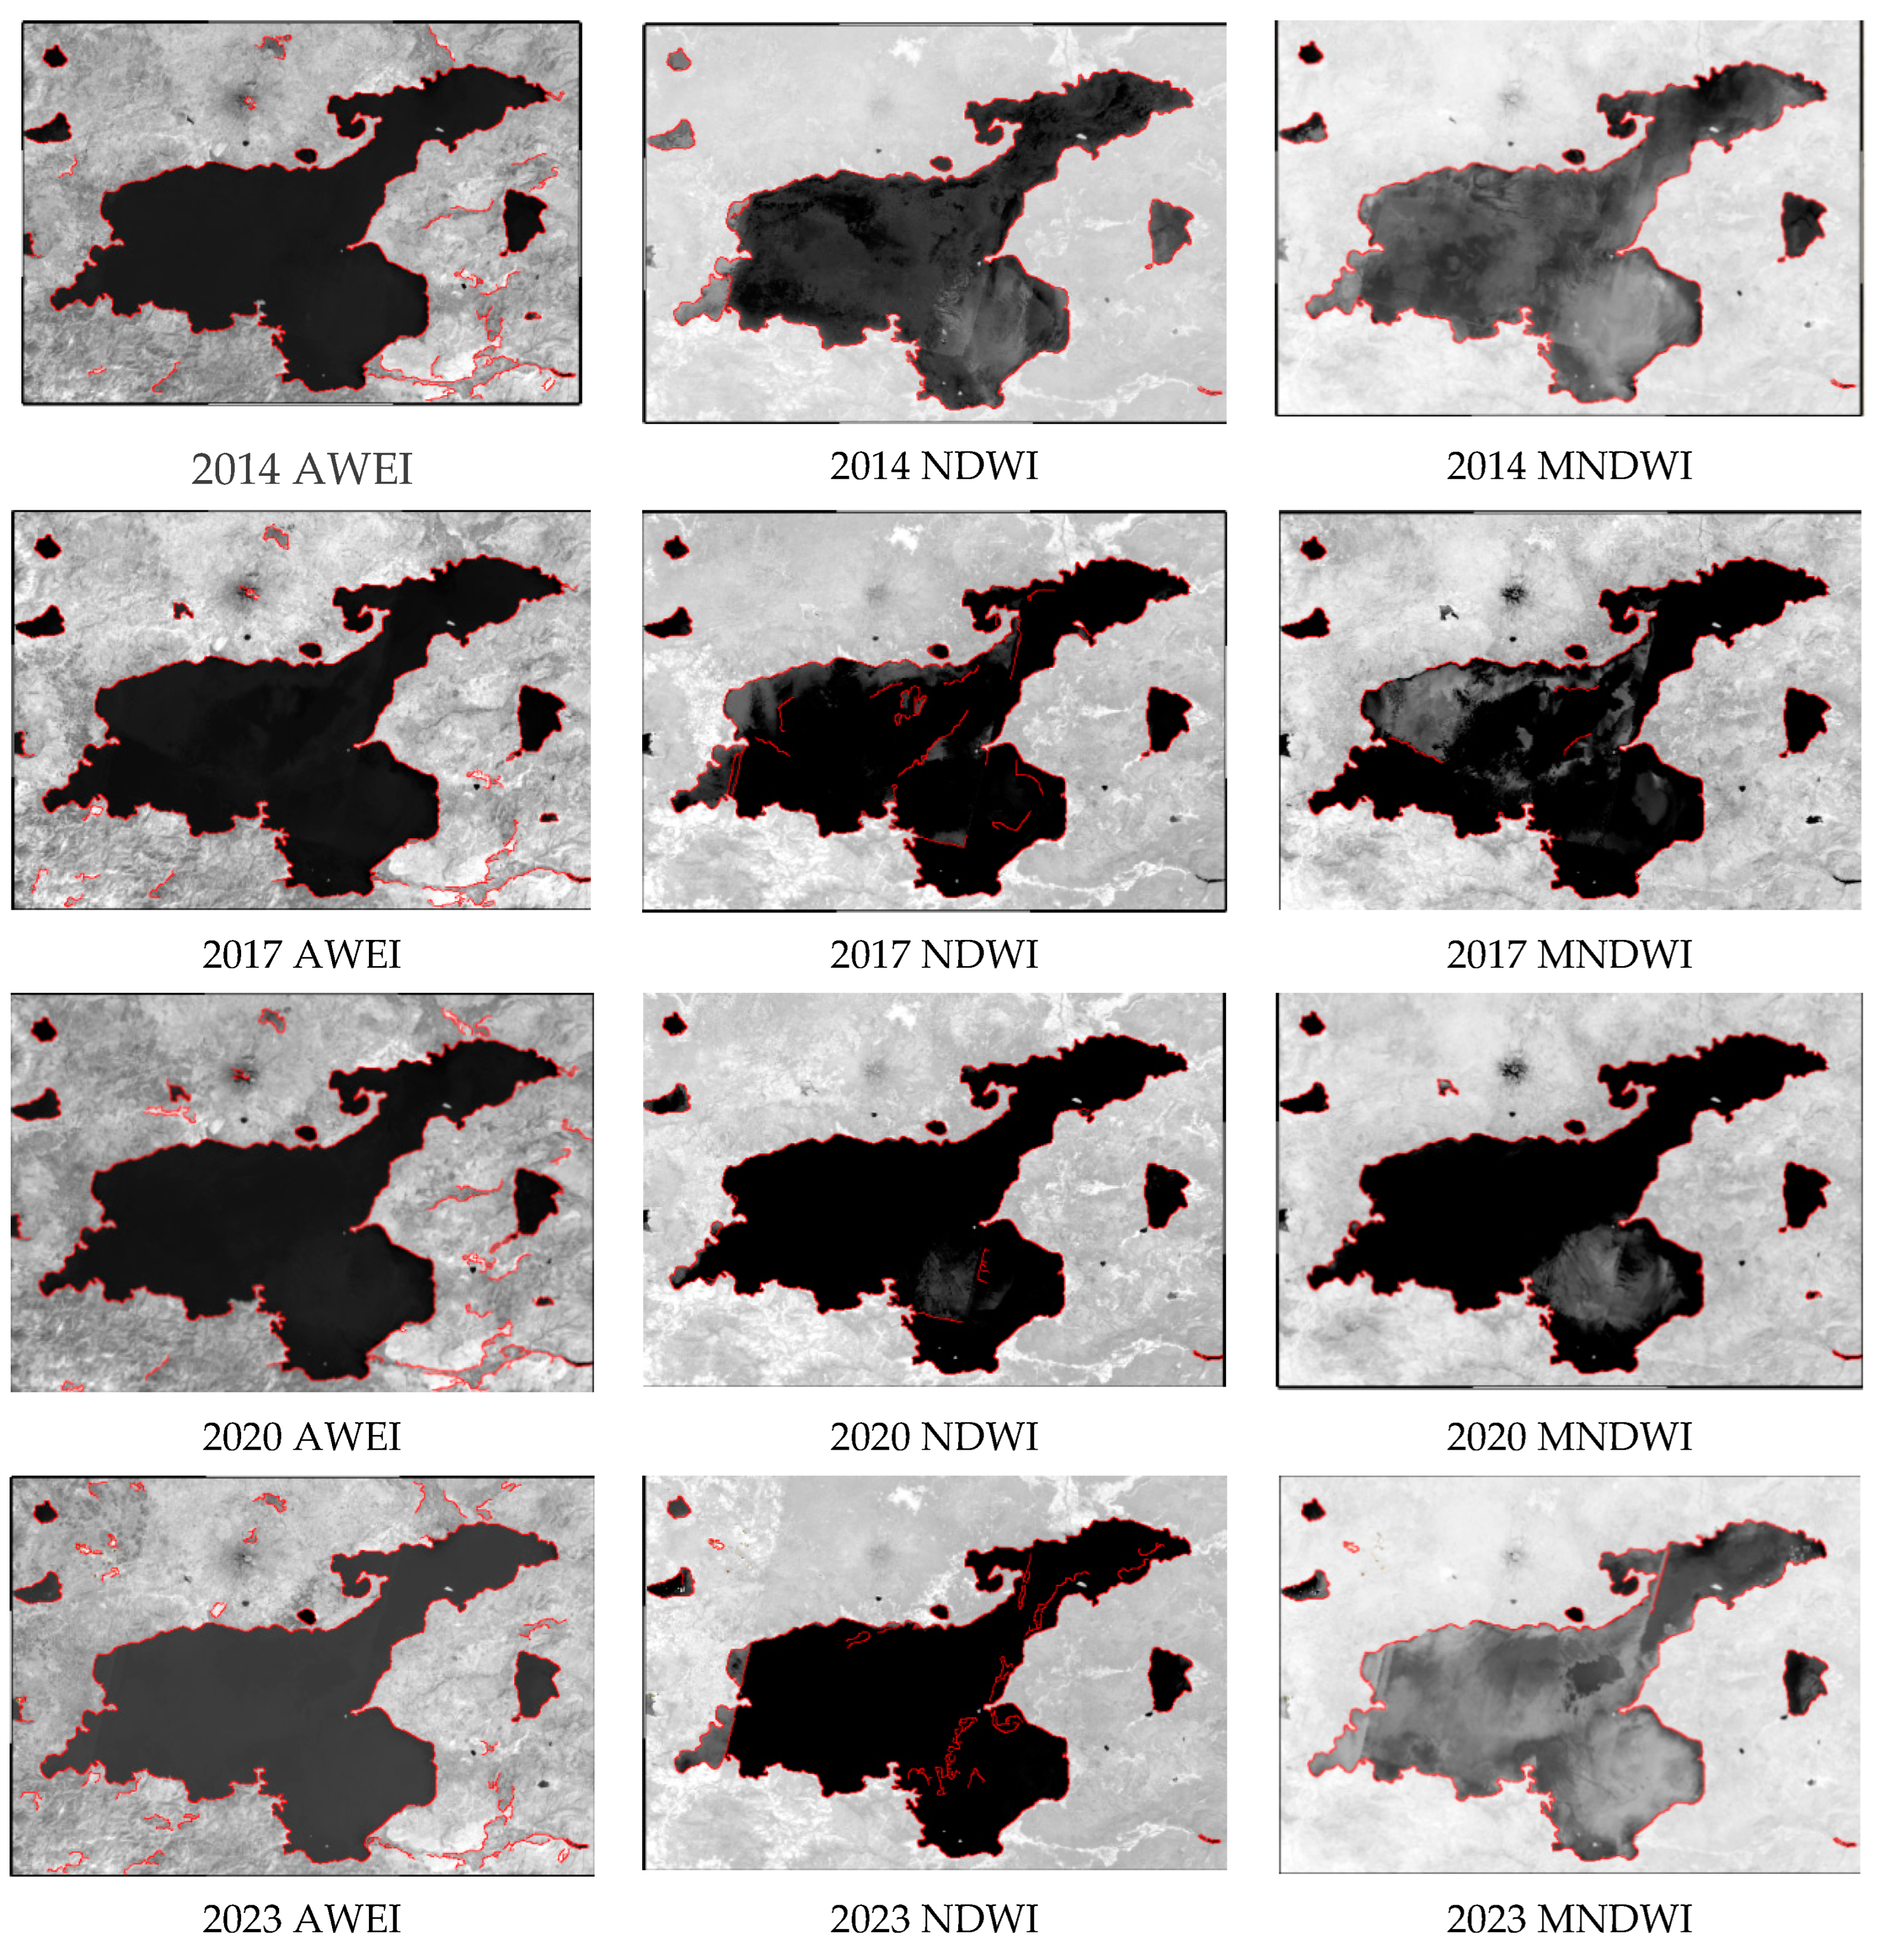
2.3. Canny Edge Detection

Edge detection is widely acknowledged as a valuable technique for extracting the boundaries of a certain image [57,58].
The Canny technique utilizes three factors to optimize edge detection, according to [59]:
-
Finding edges with minimal error: This standard requires the detector to measure the signal-to-noise ratio and captures the true edge precisely.
-
Precise localization: This standard dictates that the operator must be as precise as feasible concerning the edge’s center.
-
A single response for a single edge: This criteria necessitates marking each edge point just once.
The following phases were part of the conventional Canny edge detection process [60]:
1.
Applying a Gaussian filter to smooth the image: The image’s noise is removed.
2.
Calculating the gradient’s intensity involves determining the gradient’s direction.
3.
Non-maximum suppression: The goal of this stage is to remove erroneous edge detection reactions.
4.
To identify possible edges, use double thresholds: This phase involves two threshold levels. Th > Tl for both the low threshold level, Tl, and the high threshold level, Th. If a point’s gradient value is greater than Th, it is regarded as an edge point. A point is not regarded as an edge point if the gradient value of that point is smaller than Tl. The region surrounding the edge points will be considered when determining the edge points for points bigger than Tl but smaller than Th.

2.4. Otsu Thresholding

The Nobuyuki OTSU method, also referred to as the OTSU algorithm, is the best approach for image segmentation threshold determination [61]. An additional name for the algorithm: maximum between-cluster variance approach. The algorithm calculates the high threshold using the least squares approach using gray histogram information. This is a reliable threshold segmentation algorithm and the best segmentation threshold in statistics [59]. This method’s primary idea is to employ the highest value in between-cluster variances to isolate the targeted object from the background after choosing an appropriate threshold [60]. The background value impact was eliminated in this study by using the Otsu threshold approach.

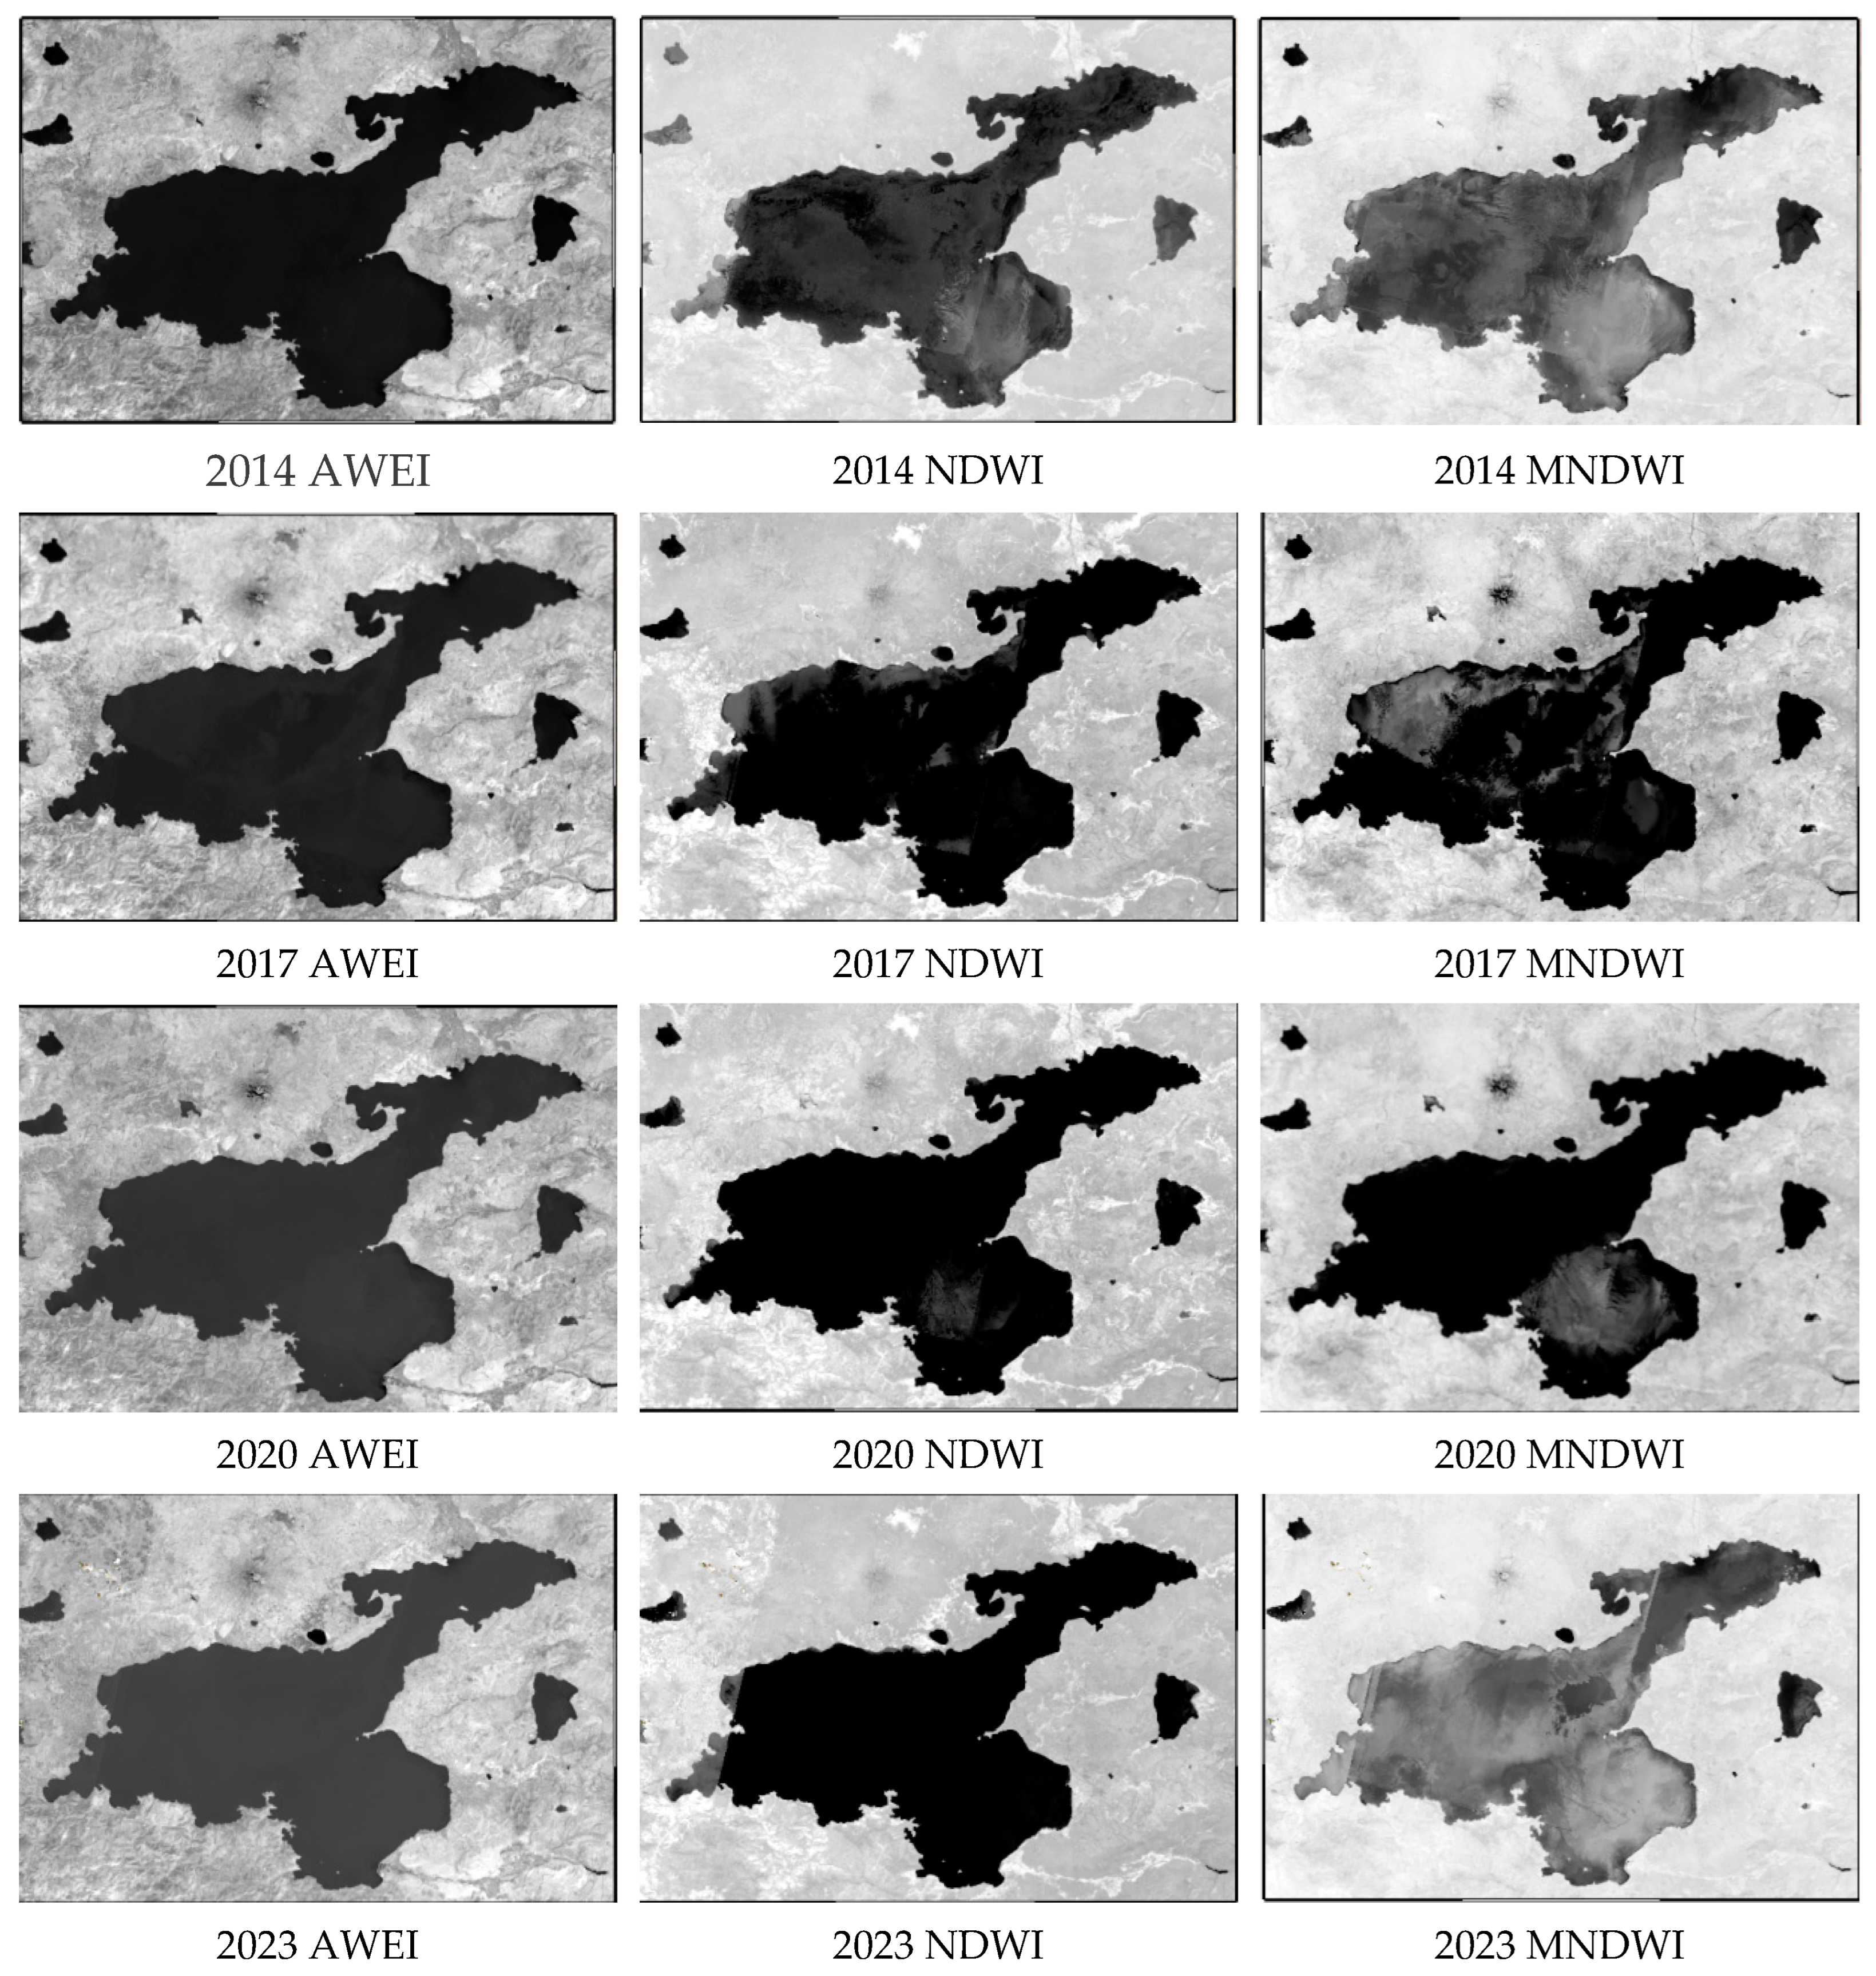
2.5. Spectral Indices

A remote sensing index is a mathematical technique that transforms spectral data from two or more bands to visually highlight pixels with similar spectral values within a specific range, hence emphasizing specific geographical features. Every type of land cover’s pattern as well as the spectral response of characteristic features serve as the foundation for establishing an index [62].
Certain points emphasize the importance of individual bands as features. They are as follows: Water is highly reflective in visible wavelengths and lowly reflective in SWIR and NIR wavelengths. The NIR band is where the water reflects less light than the red band; except for murky water pixels, water absorbs NIR and SWIR radiation, giving the NIR and green bands, and SWIR and green bands a strong contrast [41]. These reflectance variations are used by spectral indices, including NDWI, MNDWI, and AWEI, to distinguish between pixels that contain water and those that do not.
Spectral index equations of AWEI [27], MNDWI [24], and NDWI [23] calculated in this manuscript are listed as Equations (1)–(3).
AWEI = 4 Green SWIR 1 0.25 × NIR + 2.75 × SWIR 2
NDWI = Green NIR Green + NIR
MNDWI = Green SWIR Green + SWIR
The NDWI endeavors to maximize the reflectance of water, minimize the low NIR reflectance of water features, and take advantage of the high NIR reflectance of plant and soil characteristics by employing green wavelengths. Water characteristics are consequently increased because they have positive values, but vegetation and soil typically have zero or negative values, which means they are repressed [23]. Given that NDWI is unable to effectively suppress the signal coming from structured surfaces, and using the NDWI threshold of 0 cannot accurately distinguish structured surfaces from water pixels, a new band, the MNDWI band, has been suggested by substituting the SWIR band for the NIR band in the NDWI [24]. Optimizing the separability of water and non-water pixels through band differencing, addition, and using different coefficients was the primary objective in developing the AWEI [27]. The best water and land segmentation threshold for all water indices under various sensor settings must be established using Canny edge detection in the water–land border extraction process [63].

2.6. Machine Learning Algorithms

2.6.1. CART

According to [64], CART is a binary decision tree that may be used for both classification and regression. The decision tree is constructed in decision trees using the training data. For every tree node, the optimal feature is chosen using an index. CART determines the forecast by going through the tree [65]. Continuous or discrete variables can serve as an input for the supervised classification method CART. The CART method is capable of performing both classification and regression tasks, distinguishing it from other decision tree algorithms. Regarding the classification problem, a model that predicts the target variable is created by learning a basic decision rule from features in the data. The decision tree of CART can be shown, and its premise is easier to understand than those of other machine learning algorithms. Furthermore, only minimal data preparation is needed for the input data for CART, including normalization, the elimination of blank values, and the introduction of dummy variables [66].

2.6.2. Random Forest

The basis of RF, an ensemble machine learning technique, is that a smaller group of variables is chosen randomly to build a set of decision trees. The output of the trees receiving the greatest number of votes is considered the outcome. This can raise a simple decision tree’s prediction accuracy [67]. A meta estimator called RF fits multiple DT classifiers on different subsamples of the dataset, controlling over-fitting and enhancing prediction accuracy by averaging [37].

2.6.3. Support Vector Machine

One popular supervised learning technique for regression and classification tasks is support vector machines (SVM) [68]. SVM is founded on structural risk minimization (SRM) principles and statistical learning theory. Due to its good generalization performance, SVM is a suitable method for performing image categorization using a limited training sample set and a large-dimensional feature space [69,70].
SVM is a method for classifying data by separating it using a hyperplane [71]. In another saying, the algorithm produces an ideal hyperplane that separates only one data from the provided labeled training data (supervised learning). Generally, non-regularity data—that is, data with an uncertain distribution—benefit from the SVM technique [37]. Optimizing the efficiency of the classification hyperplane maximizes the classification margin while accurately differentiating the positive and negative samples. In a higher dimensional feature space, the purpose of the kernel function is to convert the initially inseparable data into data that can be separated linearly. By modifying the regularization parameter, SVM can disregard outliers and concentrate on the maximum margin during training [72]. SVM can efficiently handle datasets with a higher number of features compared to the number of samples [66].

2.7. Accuracy Assessment

The accuracy assessment was performed with the confusion matrix methodology, as described by [73]. This methodology, commonly employed in remote sensing, ensures the reliability and verification of classification [74]. Statistical calculations were performed for each classification map. These are user’s accuracy (UA), producer’s accuracy (PA), overall accuracy (OA), and kappa [75]. Furthermore, the appropriateness of the classifier for each class was assessed using F-Score [76].

3. Results and Discussion

The acquisition of the satellite images used in the study, pre-processing, Canny edge detection algorithm, Otsu thresholding method, machine learning methods, and evaluation metrics were all performed on the GEE platform. This research study used LANDSAT/LC08/C02/T1_L2 Landsat 8 images available on the GEE platform. The images were taken in June, July, and August, when the cloud cover was 5% in 2014, 2017, 2020, and 2023. This collection comprises surface reflectance data that has been atmospherically corrected. The data are generated from the imagery captured by the Landsat 8 OLI/TIRS sensors. Since Landsat 8 Collection 2 data were used, a scaling factor was applied to the images. A cloud mask was implemented to enhance the accuracy of the outcomes. The Landsat 8 Collection 2 includes a quality assessment (QA) band called QA_PIXEL, which provides vital information about certain conditions seen in the data. This band enables users to implement filters on a per-pixel basis. The QA band consists of unsigned integers that indicate combinations of surface, atmospheric, and sensor conditions, which are bit-packed. The generated images underwent a median filter. The median filter decreases the image dataset by computing the median value of all the values at each pixel in the set of corresponding bands. These images were then composited to obtain a single image, as seen in Figure 2. Image composition is the process of merging images that overlap in space into a single image, where the median value for each band in the monthly collection is used. The water index images for water surface area maps were compared point-by-point with the data taken from the study region-based Sentinel image segment to show how accurate the results were.
NDWI, MNDWI, and AWEI water indices were calculated from these composite images, as seen in Figure 3. All combinations, including NDWI, MNDWI, and AWEI or all three, support previous studies [77,78] on the ability of these indices to accurately separate water and non-water pixels.
The Canny operator is a highly used algorithm for image edge detection, mostly attributed to its outstanding results [79,80]. The Canny edge detection was executed using the “ee.Algorithms. CannyEdgeDetector” module in the Google Earth Engine (GEE) framework. Figure 4 illustrates a specific outcome for each Canny Edge detection technique step.
In this study [29], since the independent variables cannot produce reliable results when the Otsu algorithm is used alone, water and non-water places were obtained with very high accuracy using the Canny algorithm. This study presents a method that combines the Canny edge detection technique with Otsu thresholding to accurately determine the surface boundaries of lakes. According to [58], the Otsu algorithm enhances edge detection performance by optimizing Canny’s dual threshold. The initial threshold of 0.7 was determined using this study’s trial and error approach, which involved evaluating several average training samples in GEE. The primary purpose of the initial threshold was to distinguish between water and non-water regions and obtain preliminary water samples. The threshold values calculated for each water index were determined, as shown in Table 1. The optimum threshold values for AWEI were calculated as −0.7821, −0.7207, −0.7204, and −0.8446 for the years 2014, 2017, 2020 and 2023, in the order mentioned. The optimum threshold values for NDWI were calculated as 0.2029, 0.1412, 0.3170, and 0.7809 for the years 2014, 2017, 2020, and 2023, respectively. The optimum threshold values for MNDWI were calculated as 0.0548, 0.0234, 0.0858, and 0.0542 for the years 2014, 2017, 2020, and 2023, respectively. The results can be compared with the advantage that threshold determination is faster and simpler, especially in Lake Van, which has a larger water surface. It gives more stable and accurate results in cases where there are few water pixels and small water bodies [78].
The lake surface areas of Lake Van according to NDWI, MNDWI, and AWEI indices for the years 2014, 2017, 2020, and 2023 are shown in Figure 5. Accordingly, the lake surface areas determined by the NDWI were obtained as 3738.22 km2 for 2014, 3578.79 km2 for 2017, 3784.73 km2 for 2020, and 3335.98 km2 for 2023. Lake surface areas determined by the MNDWI were obtained as 3698.02 km2 for 2014, 2913.13 km2 for 2017, 3394.72 km2 for 2020, and 3235.05 km2 for 2023. Lake surface areas determined by the AWEI were obtained as 3784.73 km2 for 2014, 3801.96 km2 for 2017, 3806.76 km2 for 2020, and 3753.50 km2 for 2023.
As seen in Table 2, Van Lake surface area pixels were accurately classified by SVM, RF, and CART machine learning algorithms utilized by Landsat 8. The satellite images used in the study were taken between 1 June and 1 September. Producer accuracy, user accuracy, overall accuracy, kappa, and f score accuracy assessment parameters were used to determine the lake surface area. Table 2 provides the accuracy assessment of Lake Van, and Figure 5 presents the lake surfaces obtained according to the water indices used. When compared to other water indices in Lake Van in 2014, the AWEI showed the highest performance with 100%, and the MNDWI showed the lowest performance with 97%, according to the producer accuracy, user accuracy, overall accuracy, kappa, and f score evaluation criteria. According to the accuracy evaluation parameters of 2017, the AWEI showed the highest performance with 100%, and the MNDWI showed the lowest performance with 89%. According to the accuracy evaluation parameters of 2020, the NDWI showed the highest performance with 100%, and the MNDWI showed the lowest performance with 93%. According to the accuracy evaluation parameters of 2023, the AWEI showed the highest performance with 100%, and the MNDWI showed the lowest performance with 90%.
When the success of the classification methods used in determining the water surface is examined, the values of the overall accuracy, user’s accuracy, producer accuracy, kappa, and f score evaluation criteria obtained by using CART, SVM, and RF algorithms, NDWI and AWEI in 2014 were obtained as 100%. In 2017, the highest values of the producer accuracy, user accuracy, overall accuracy, kappa, and f score evaluation criteria obtained using the SVM algorithm and AWEI were obtained as 100%. The lowest values were obtained using the MNDWI and RF method as 0.86, 0.81, 0.67, 0.70, and 0.89, respectively. In 2020, the highest values of the producer accuracy, user accuracy, overall accuracy, kappa, and f score evaluation criteria obtained using the SVM algorithm and NDWI were obtained as 100%. Using the MNDWI and RF method at the lowest values, 0.95, 0.94, 0.90, 0.91, 0.93 were obtained, respectively. In 2023, the highest values of the producer accuracy, user accuracy, overall accuracy, kappa, and f score evaluation criteria obtained using SVM and CART algorithms and the AWEI were obtained as 100%. Using the MNDWI and NDWI and RF and CART methods at the lowest values in f score, 0.90 were obtained.
The lake area results obtained by the band combination of MNDWI and B6 bands are displayed in Figure 6, and the classification results are also shown in Table 2. Water pixels are organized based on their greater NDWI and lower SWIR values due to greater water absorption at the SWIR2 wavelength. The NDWI aims to increase water reflectance, decrease low NIR reflectance from water features, and utilize green wavelengths by using the high NIR reflectance from plant and soil properties. Water features are enhanced due to their positive values, while soil and vegetation generally exhibit zero or negative values, indicating their suppression [23]. In [24], it is suggested to replace the NIR band with the SWIR band in the NDWI to form a new band known as the MNDWI band. This modification addresses the limitations of NDWI in effectively suppressing the signal from structured surfaces and accurately distinguishing them from water pixels when using a threshold of 0. Specific factors highlight the significance of individual bands as characteristics. Water displays high reflectance in the visible spectrum while displaying low reflectance in the NIR and SWIR wavelengths. Within the NIR band, water exhibits lower light reflection than the red band. With the exception of pixels that represent unclear water, water has the ability to absorb NIR and SWIR radiation. This leads to a noticeable difference in color intensity between the green and NIR bands, as well as the green and SWIR bands [41]. Although the MNDWI offers a high level of precision in separating objects, it is not adequate for accurately identifying water bodies in this study. However, as was the main purpose of formulating AWEI in which the B7 band was included, the study found that the distinction between water and non-water pixels was optimized by employing band differentiation, addition, and different coefficients [27]. These reflectance variations are used by spectral indices, including NDWI, MNDWI, and AWEI, to distinguish between pixels that contain water and non-water. When terrain pixels exhibit a pronounced NDWI response, which may occur in regions with high reflectivity or shadow, using supplementary data such as the SWIR band (B7) improves the outcomes. This improvement can be observed visually in Figure 6 of the classification results [27,77].
Upon visual inspection of Figure 6, the lake surface boundaries obtained by the MNDWI and CART, RF, and SVM methods are determined, but there is a lot of noise in the lake. It is seen that accuracy assessment parameters also support this situation. The accuracy of classifying water surfaces varies depending on several criteria, including the combination of bands used in the satellite image, the information required including the date when the satellite image was obtained, the atmospheric conditions prevailing on that particular day, the spatial resolutions of the images, and the methods employed. Lake surface boundaries were successfully obtained with NDWI, MNDWI, and AWEI indices using CART, RF, and SVM classification methods for Landsat-8 (OLI) images; they have a spatial resolution of 30 m. In general, the accuracy of SVM classification processes utilized to the AWEI combination is more successful. Supporting the study conducted by [67], it was noted that the SVM method showed a greater kappa value than the CART and RF methods.
In general, when Lake Van is compared to Lake Urmia, which is approximately 150 km away from it, Lake Van exhibits climatic, orographic, and geographical characteristics comparable to Urmia, although it has lower salinity and greater depth. Despite the relatively short distance between them, water volume and surface changes have varied considerably during the last two decades. The proportions and configuration of Van Lake have remained unaltered. Nevertheless, Urmia Lake saw a substantial alteration, wherein its southern section nearly disappeared, leading to a decrease of approximately 60% from its initial size in the early 2000s. The primary factor contributing to the significant decrease in water levels in the southern and eastern perimeters of the lake is the shallow depth and substantial decrease in water discharge from the Zarineh River subsequent to the construction of the dam. The significant differences in land use and land cover (LULC) changes observed in the two lakes indicate that the drying up of Urmia cannot be solely attributable to climatic changes in the Middle East [81]. This is particularly evident when considering the lack of significant water depletion in Lake Van. In addition to variations in coastline characteristics, water salinity, lake level, precipitation rates, snowfall, and snowmelt, it appears that disparities in environmental hydrology policies implemented by Turkish and Iranian authorities have a substantial impact on the depletion of the lake [82].

4. Conclusions

In this study, the water surface boundaries of Lake Van, the largest lake in Turkey, were determined using the Canny edge detection algorithm, Otsu threshold determination methods, and various water extraction indices, and the performances of these metrics were evaluated and compared. Optical images collected by the Landsat satellite between 1 June and 1 September in 2014, 2017, 2020, and 2023 were used. Additionally, different algorithms and indices were employed to evaluate the performance of Landsat 8 data for classification. Utilizing indices to extract water surfaces is a feasible approach compared to alternative methods [28]. Estimating the threshold for extracting water surfaces using indices is a time-consuming process, and the choice of threshold value may include a subjective judgment [83]. The absence of a standardized threshold value for water content in various water bodies across different geographical areas is the reason for this [84]. To eliminate this problem, the Canny edge detection algorithm and Otsu threshold matching methods were used. CART, RF, and SVM methods were used in classification. The classification accuracy was assessed using the metrics of UA, PA, and OA, Kappa, and F score statistical tests. It is seen that the algorithm and water extraction indices selected by the Canny algorithm and the Otsu thresholding method increase the reliability of the study. The suitable water surface detection index that has been established for Lake Van is AWEI, and the algorithm is SVM. The subsequent investigations in the literature validate these conclusions. The SVM algorithm is commonly regarded as the most favored classification method in numerous studies [2,67].
In order to develop a more significant correlation between the surface water in the area and the generated water index values, it is necessary to consider the unique spectral and environmental characteristics of the water. Variations in atmospheric conditions, changes in the angle of incidence of sunlight on the surface, and modifications in the chemical and biophysical properties of water can influence the particular wavelengths of light that are reflected by bodies of water [85]. Moreover, identifying water surfaces might serve as a crucial input in numerous research endeavors. Hence, the investigation into the efficacy of various data kinds, indices, and algorithms for identifying water surfaces will persist in garnering the interest of researchers. Water surface mapping is crucial for the effective management of water resources and the successful execution of engineering projects. Although cloud platforms such as GEE have made significant developments in machine learning and artificial intelligence techniques, there are still constraints in effectively detecting water bodies [14,86]. One of the limitations we encountered in our study was that the study area was too large and therefore we could not work with Sentinel 2 images. The GEE platform has a memory capacity problem. In later studies, the aim is to make longer-term and 3-monthly observations of the lake surface. In addition to these parameters, lake surface temperature values and meteorological parameters will be included in the study, and how the lake area is affected by these parameters will be investigated. At the same time, in future studies, the boundaries of the lake area will be determined using CNN based detection (i.e., binary classification) methods.

Funding

This research received no external funding.

Data Availability Statement

GEE freely gave all the data utilized in this study. Using this platform, anyone has access to these data.

Acknowledgments

Thank you to the GEE platform, where data are obtained and processed free of charge.

Conflicts of Interest

The author declares no conflicts of interest.

References

  1. Zhou, Y.; Dong, J.; Xiao, X.; Liu, R.; Zou, Z.; Zhao, G.; Ge, Q. Continuous monitoring of lake dynamics on the Mongolian Plateau using all available Landsat imagery and Google Earth Engine. Sci. Total Environ. 2019, 689, 366–380. [Google Scholar] [CrossRef] [PubMed]
  2. Tercan, E.; Atasever, U.H. Effectiveness of auto encoder for lake area extraction from high-resolution RGB imagery: An experimental study. Environ. Sci. Pollut. Res. 2021, 28, 31084–31096. [Google Scholar] [CrossRef] [PubMed]
  3. Shen, G.; Yang, X.; Jin, Y.; Xu, B.; Zhou, Q. Remote sensing and evaluation of the wetland ecological degradation process of the Zoige Plateau Wetland in China. Ecol. Indic. 2019, 104, 48–58. [Google Scholar] [CrossRef]
  4. Debanshi, S.; Pal, S. Wetland delineation simulation and prediction in deltaic landscape. Ecol. Indic. 2020, 108, 105757. [Google Scholar] [CrossRef]
  5. Akkuş, M.; Sarı, M.; EkmekÓi, F.G.; YoğurtÓuoğlu, B. The discovery of a microbialite-associated freshwater fish in the world’s largest saline soda lake, Lake Van (Turkey). ZoosystEvol 2021, 97, 181–189. [Google Scholar] [CrossRef]
  6. Danulat, E.; Kempe, S. Nitrogenous waste excretion and accumulation of urea and ammonia in Chalcalburnustarichi (Cyprinidae), endemic to the extremely alkaline Lake Van (Eastern Turkey). Fish Physiol. Biochem. 1992, 9, 377–386. [Google Scholar] [CrossRef]
  7. Elhaddad, H.; Sultan, M.; Yan, E.; Abdelmohsen, K.; Mohammad, A.T.; Badawy, A.; Hadi, K.; Hassan, S.; Mustafa, M. Optimization of floodwater redistribution from Lake Nasser could recharge Egypt’s aquifers and mitigate its excessive floods. Commun. Earth Environ. 2024, 5, 385. [Google Scholar] [CrossRef]
  8. Lakshmi, V. Enhancing human resilience against climate change: Assessment of hydroclimatic extremes and sea level rise impacts on the Eastern Shore of Virginia, United States. Sci. Total Environ. 2024, 947, 174289. [Google Scholar]
  9. Ghaffarian, S.; Kerle, N.; Filatova, T. Remote sensing-based proxies for urban disaster risk management and resilience: A review. Remote Sens. 2018, 10, 1760. [Google Scholar] [CrossRef]
  10. Avtar, R.; Komolafe, A.A.; Kouser, A.; Singh, D.; Yunus, A.P.; Dou, J.; Kumar, P.; Gupta, R.D.; Johnson, B.A.; Minh, H.V.T.; et al. Assessing sustainable development prospects through remote sensing: A review. Remote Sens. Appl. Soc. Environ. 2020, 20, 100402. [Google Scholar] [CrossRef]
  11. Peng, L.; Wu, H.; Li, Z. Spatial–temporal evolutions of ecological environment quality and ecological resilience pattern in the middle and lower reaches of the Yangtze River Economic Belt. Remote Sens. 2023, 15, 430. [Google Scholar] [CrossRef]
  12. Levin, E.; Beisekenov, N.; Wilson, M.; Sadenova, M.; Nabaweesi, R.; Nguyen, L. Empowering climate resilience: Leveraging cloud computing and big data for community Climate Change Impact Service (C3IS). Remote Sens. 2023, 15, 5160. [Google Scholar] [CrossRef]
  13. Zafeiropoulos, C.; Tzortzis, I.N.; Rallis, I.; Doulamis, A. Development of a Support System for Improved Resilience and Sustainable Urban Areas to Cope with Climate Change and Extreme Events Based on GEOSS and Advanced Modelling Tools. In Proceedings of the International Conference on Transdisciplinary Multispectral Modeling and Cooperation for the Preservation of Cultural Heritage, Athens, Greece, 22–23 March 2023; Springer Nature: Cham, Switzerland; pp. 364–374. [Google Scholar]
  14. Yilmaz, O.S.; Gulgen, F.; BalikSanli, F.; Ates, A.M. The performanc eanalysis of different water indices and algorithms using sentinel-2 and landsat-8 images in determining water surface: Demirkopru dam casestudy. Arab. J. Sci. Eng. 2023, 48, 7883–7903. [Google Scholar] [CrossRef]
  15. Nagaraj, R.; Kumar, L.S. Extraction of Surface Water Bodies using Optical Remote Sensing Images: A Review. Earth Sci. Inform. 2024, 17, 893–956. [Google Scholar] [CrossRef]
  16. Liu, S.; Wu, Y.; Zhang, G.; Lin, N.; Liu, Z. Comparing water indices for landsat data for automated surface water body extraction under complex ground background: A case study in Jilin Province. Remote Sens. 2023, 15, 1678. [Google Scholar] [CrossRef]
  17. Chen, M.; Zhang, R.; Jia, M.; Cheng, L.; Zhao, C.; Li, H.; Wang, Z. Accurate and Rapid Extraction of Aquatic Vegetation in the China Side of the Amur River Basin Based on Landsat Imagery. Remote Sens. 2024, 16, 654. [Google Scholar] [CrossRef]
  18. Google Erath Engine. Available online: https://developers.google.com/earth-engine/guides (accessed on 24 February 2025).
  19. Yang, L.; Driscol, J.; Sarigai, S.; Wu, Q.; Chen, H.; Lippitt, C.D. Google Earth Engine and artificial intelligence (AI): A comprehensive review. Remote Sens. 2022, 14, 3253. [Google Scholar] [CrossRef]
  20. Chen, F.; Zhang, M.; Tian, B.; Li, Z. Extraction of glacial lake outlines in Tibet Plateau using Landsat 8 imagery and Google Earth Engine. IEEE J. Sel. Top. Appl. Earth Obs. Remote Sens. 2017, 10, 4002–4009. [Google Scholar] [CrossRef]
  21. Nguyen, U.N.; Pham, L.T.; Dang, T.D. An automatic water detection approach using Landsat 8 OLI and Google Earth Engine cloud computing to map lakes and reservoirs in New Zealand. Environ. Monit. Assess. 2019, 191, 235. [Google Scholar] [CrossRef]
  22. Karakus, P. Investigation of Meteorological Effects on Çivril Lake, Turkey, with Sentinel-2 Data on Google Earth Engine Platform. Sustainability 2023, 15, 13398. [Google Scholar] [CrossRef]
  23. McFeeters, S.K. Theuse of the Normalized Difference Water Index (NDWI) in the delineation of open water features. Int. J. Remote Sens. 1996, 17, 1425–1432. [Google Scholar] [CrossRef]
  24. Xu, H. Modification of normalised difference water index (NDWI) to enhance open water features in remotely sensed imagery. Int. J. Remote Sens. 2006, 27, 3025–3033. [Google Scholar] [CrossRef]
  25. Bochow, M.; Heim, B.; Küster, T.; Rogaß, C.; Bartsch, I.; Segl, K.; Reigber, S.; Kaufm, H. On the use of airborne imaging spectroscopy data for the automatic detection and delineation of surface water bodies. In Remote Sensing of Planet Earth; InTech: London, UK, 2012; pp. 1–22. [Google Scholar]
  26. Uzun, M. Analysis of Manyas Lake surface area and shoreline change over various periods with dsas tool. Türkiye Uzak. Algılama Derg. 2024, 6, 35–56. [Google Scholar] [CrossRef]
  27. Feyisa, G.L.; Meilby, H.; Fensholt, R.; Proud, S.R. Automated Water Extraction Index: A new technique for surface water mapping using Landsat imagery. Remote Sens. Environ. 2014, 140, 23–35. [Google Scholar] [CrossRef]
  28. Yılmaz, O.S. Automatic detection of water surfaces using K-means++ clustering algorithm with Landsat-9 and Sentinel-2 images on the Google Earth Engine Platform. Bilge Int. J. Sci. Technol. Res. 2023, 7, 105–111. [Google Scholar] [CrossRef]
  29. Donchyts, G.; Schellekens, J.; Winsemius, H.; Eisemann, E.; Van de Giesen, N. A 30 m Resolution Surface Water Mask Including Estimation of Positional and Thematic Differences Using Landsat 8, Srtm and Open Street Map: A Case Study in the Murray-Darling Basin, Australia. Remote Sens. 2016, 8, 386. [Google Scholar] [CrossRef]
  30. Sari, Y.; Prakoso, P.B.; Baskara, A.R. Road crack detection using support vector machine (SVM) and OTSU algorithm. In Proceedings of the 2019 6th International Conference on Electric Vehicular Technology (ICEVT), Bali, Indonesia, 18–21 November 2019; pp. 349–354. [Google Scholar]
  31. Zhu, D.; Zhou, C.; Zhu, Y.; Wang, T.; Zhang, C. Monitoring of supraglacial lake distribution and full-year changes using multisource time-series satellite imagery. Remote Sens. 2023, 15, 5726. [Google Scholar] [CrossRef]
  32. Elwan, M.; Amein, A.S.; Mousa, A.; Ahmed, A.M.; Bouallegue, B.; Eltanany, A.S. SAR image matching based on local feature detection and description using convolutional neural network. Secur. Commun. Netw. 2022, 2022, 5669069. [Google Scholar] [CrossRef]
  33. Yu, X.; Wang, Z.; Wang, Y.; Zhang, C. Edge detection of agricultural products based on morphologically improved canny algorithm. Math. Probl. Eng. 2021, 2021, 6664970. [Google Scholar] [CrossRef]
  34. Yang, P.; Song, W.; Zhao, X.; Zheng, R.; Qingge, L. An improved Otsu threshold segmentation algorithm. Int. J. Comput. Sci. Eng. 2020, 22, 146–153. [Google Scholar] [CrossRef]
  35. Fang, M.; Yue, G.; Yu, Q. The study on an application of otsu method in canny operator. In Proceedings of the 2009 International Symposium on Information Processing (ISIP 2009), San Francisco, CA, USA, 13–16 April 2009; Academy Publisher: Guwahati, India, 2009; p. 109. [Google Scholar]
  36. Kesikoglu, M.H.; Atasever, U.H.; Dadaser-Celik, F.; Ozkan, C. Performance of ANN, SVM and MLH techniques for land use/cover change detection at Sultan Marshes wetland, Turkey. Water Sci. Technol. 2019, 80, 466–477. [Google Scholar] [CrossRef] [PubMed]
  37. Acharya, T.D.; Subedi, A.; Lee, D.H. Evaluation of machine learning algorithms for surface water extraction in a Landsat 8 scene of Nepal. Sensors 2019, 19, 2769. [Google Scholar] [CrossRef] [PubMed]
  38. Tassi, A.; Vizzari, M. Object-oriented lulc classification in google earth engine combining snic, glcm, and machine learning algorithms. Remote Sens. 2020, 12, 3776. [Google Scholar] [CrossRef]
  39. Li, H.; Zech, J.; Ludwig, C.; Fendrich, S.; Shapiro, A.; Schultz, M.; Zipf, A. Automatic mapping of national surface water with Open Street Map and Sentinel-2 MSI data using deep learning. Int. J. Appl. Earth Obs. Geoinf. 2021, 104, 102571. [Google Scholar]
  40. Karakuş, P. Object Based Classification in Google Earth Engine Combining SNIC and Machine Learning Methods (Case Study: Lake Köyceğiz). Turk. J. Remote Sens. GIS 2024, 5, 125–137. [Google Scholar] [CrossRef]
  41. Rajendiran, N.; Kumar, L.S. Pixel level feature extraction and machine learning classification for water body extraction. Arab. J. Sci. Eng. 2023, 48, 9905–9928. [Google Scholar] [CrossRef]
  42. Wu, Y.; Pan, J. Detecting Changes in Impervious Surfaces Using Multi-Sensor Satellite Imagery and Machine Learning Methodology in a Metropolitan Area. Remote Sens. 2023, 15, 5387. [Google Scholar] [CrossRef]
  43. Akosman, E.N.; Makineci, H.B. Sentinel-2A Verileriyle Trabzon İli 2019–2020 Yılları Arasında Ortaya Çıkan Sınıflandırma Farklarının Çeşitli Algoritmalarla Değerlendirilmesi. Türkiye Uzak. Algılama Derg. 2023, 5, 78–88. [Google Scholar]
  44. Cezayirlioğlu, C.; Çelik, R.; Matcı, D.K. Landsat Verileri ve Makine Öğrenme Algoritmaları ile Su Yüzeyi Değişiminin Belirlenmesi Ve Tahmini; Marmara Gölü Örneği. Türkiye Uzak. Algılama Derg. 2022, 4, 43–52. [Google Scholar]
  45. Mafanya, M.; Tsele, P.; Zengeya, T.; Ramoelo, A. An assessment of image classifiers for generating machine-learning training samples for mapping the invasive Campuloclinium macrocephalum (Less.) DC (pompom weed) using DESIS hyperspectral imagery. ISPRS J. Photogramm. Remote Sens. 2022, 185, 188–200. [Google Scholar] [CrossRef]
  46. Zhang, G.; Wu, M.; Wei, J.; He, Y.; Niu, L.; Li, H.; Xu, G. Adaptive threshold model in google earth engine: A case study of Ulva prolifera extraction in the south yellow sea, China. Remote Sens. 2021, 13, 3240. [Google Scholar] [CrossRef]
  47. Gorelick, N.; Hancher, M.; Dixon, M.; Ilyushchenko, S.; Thau, D.; Moore, R. Google Earth Engine: Planetary-scale geospatial analysis for everyone. Remote Sens. Environ. 2017, 202, 18–27. [Google Scholar] [CrossRef]
  48. Kwiecien, O.; McCormack, J.; Pickarski, N.; Bontogniali, T.R.; Baldermann, A.; Yue, J.; Litt, T. So Far... The Best of Lake Van (No. EGU24-15977). In Proceedings of the Copernicus Meetings, Online, 11 October 2024. [Google Scholar]
  49. Coşkun, S. Van Gölü Kapalı Havzasında Yağışların Trend Analizi. Mühendislik Bilim. Tasarım Derg. 2020, 8, 521–532. [Google Scholar] [CrossRef]
  50. Çağatay, M.N.; Damcı, E.; Bayon, G.; Sarı, M. Microbialites on the northern shelf of Lake Van, eastern Türkiye#: Morphology, texture, stable isotope geochemistry and age. Sedimentology 2023, 71, 850–870. [Google Scholar]
  51. Stockhecke, M.; Sturm, M.; Brunner, I.; Schmincke, H.U.; Sumita, M.; Kipfer, R.; Anselmetti, F.S. Sedimentary evolution and environmental history of Lake Van (Turkey) over the past 600 000 years. Sedimentology 2014, 61, 1830–1861. [Google Scholar] [CrossRef]
  52. Litt, T.; Anselmetti, F.S.; Cagatay, M.N.; Kipfer, R.; Krastel, S.; Schmincke, H.U.; Sturm, M. A 500,000-year-long sediment archive drilled in eastern Anatolia. Eos. Trans. Am. Geophys. Union 2011, 92, 477–479. [Google Scholar] [CrossRef]
  53. Atıcı, A.A.; Sepil, A.; Fazıl, Ş.E.N. Van Gölü havzası tuzlu sularının su kalitesi özellikleri ve ağır metal kirlilik indeksinin belirlenmesi. Ege Üniversitesi Ziraat Fakültesi Derg. 2021, 58, 285–294. [Google Scholar] [CrossRef]
  54. T.C. Tarım ve Orman Bakanlığı Van İl Tarım v eOrman Müdürlüğü. Available online: https://van.tarimorman.gov.tr/ (accessed on 28 May 2024).
  55. Pacifici, F.; Longbotham, N.; Emery, W.J. The importance of physical quantities for the analysis of multitemporal and multiangular optical very high spatial resolution images. IEEE Trans. Geosci. Remote Sens. 2014, 52, 6241–6256. [Google Scholar] [CrossRef]
  56. Landsat Algorithms. Available online: https://developers.google.com/earth-engine/guides/landsat (accessed on 25 March 2024).
  57. Zhang, D.D.; Zhao, S. An improved edge detection algorithm based on canny operator. Appl. Mech. Mater. 2013, 347, 3541–3545. [Google Scholar] [CrossRef]
  58. Cao, J.; Chen, L.; Wang, M.; Tian, Y. Implementing a parallel image edge detection algorithm based on the Otsu-Canny operator on the Hadoop Platform. Comput. Intell. Neurosci. 2018, 3598284. [Google Scholar] [CrossRef]
  59. Wang, Y.; Li, J. An improved Canny algorithm with adaptive threshold selection. MATEC Web Conf. 2015, 22, 01017. [Google Scholar] [CrossRef]
  60. Hu, X.; Wang, Y. Monitoring coastline variations in the Pearl River Estuary from 1978 to 2018 by integrating Canny edge detection and Otsu methods using long time series Landsat dataset. Catena 2022, 209, 105840. [Google Scholar] [CrossRef]
  61. You, N.; Han, L.; Liu, Y.; Zhu, D.; Zuo, X.; Song, W. Research on Wavelet Transform Modulus Maxima and OTSU in Edge Detection. Appl. Sci. 2023, 13, 4454. [Google Scholar] [CrossRef]
  62. Bouhennache, R.; Bouden, T.; Taleb-Ahmed, A.; Cheddad, A. A new spectral index for the extraction of built-up land features from Landsat 8 satellite imagery. Geocarto Int. 2019, 34, 1531–1551. [Google Scholar] [CrossRef]
  63. Zhang, X.; Zhang, Y.; Zheng, R. Image edge detection method of combining wavelet lift with Canny operator. Procedia Eng. 2011, 15, 1335–1339. [Google Scholar] [CrossRef]
  64. Breiman, L.; Friedman, J.H.; Olshen, R.A.; Stone, C.J. Classification and Regression Trees, 1st ed.; Chapman & Hall/CRC: Boca Raton, FL, USA, 1984. [Google Scholar]
  65. Breiman, L.; Friedman, J.H.; Olshen, R.A.; Stone, C.J. Classification and Regression Trees; Routledge: New York, NY, USA, 2017. [Google Scholar]
  66. Wang, R.; Guo, L.; Chen, B.; Yang, Y.; Zheng, H.; Deng, F.; Liu, J. Spatiotemporal variations and overflow risk analysis of the Salt Lake in the Hoh Xil Region using machine learning methods. Front. Earth Sci. 2023, 10, 1084540. [Google Scholar] [CrossRef]
  67. Huang, X.; Xie, C.; Fang, X.; Zhang, L. Combining pixel-and object-based machine learning for identification of water-body types from urban high-resolution remote-sensing imagery. IEEE J. Sel. Top. Appl. Earth Obs. Remote Sens. 2015, 8, 2097–2110. [Google Scholar] [CrossRef]
  68. Cortes, C.; Vapnik, V. Support-vector networks. Mach. Learn. 1995, 20, 273–297. [Google Scholar] [CrossRef]
  69. Chapelle, O.; Haffner, P.; Vapnik, V.N. Support vector machines for histogram-based image classification. IEEE Trans. Neural Netw. 1999, 10, 1055–1064. [Google Scholar] [CrossRef]
  70. Melgani, F.; Bruzzone, L. Classification of hyperspectral remote sensing images with support vector machines. IEEE Trans. Geosci. Remote Sens. 2004, 42, 1778–1790. [Google Scholar] [CrossRef]
  71. Yao, X.; Tham, L.; Dai, F. Landslide susceptibility mapping based on support vector machine: A case study on natural slopes of Hong Kong, China. Geomorphology 2008, 101, 572–582. [Google Scholar] [CrossRef]
  72. Sarp, G.; Ozcelik, M. Water body extraction and change detection using time series: A case study of lake burdur, Turkey. J. Taibah Univ. Sci. 2017, 11, 381–391. [Google Scholar] [CrossRef]
  73. Foody, G.M. On the compensation for chance agreement in image classification accuracy assessment. Photogramm. Eng. Remote Sens. 1992, 58, 1459–1460. [Google Scholar]
  74. Acharki, S. PlanetScope contributions compared to Sentinel-2, and Landsat-8 for LULC mapping. Remote Sens. Appl. Soc. Environ. 2022, 27, 100774. [Google Scholar] [CrossRef]
  75. Congalton, R.G. A review of assessing the accuracy of classifications of remotely sensed data. Remote Sens. Environ. 1991, 37, 35–46. [Google Scholar] [CrossRef]
  76. Rijsbergen, C.V. Information Retrieval; Butterworth-Heinemann: Oxford, UK, 1979. [Google Scholar]
  77. Bangira, T.; Alfieri, S.M.; Menenti, M.; Van Niekerk, A. Comparing thresholding with machine learning classifiers for mapping complex water. Remote Sens. 2019, 11, 1351. [Google Scholar] [CrossRef]
  78. Cordeiro, M.C.; Martinez, J.M.; Peña-Luque, S. Automatic water detection from multidimensional hierarchical clustering for Sentinel-2 images and a comparison with Level 2A processors. Remote Sens. Environ. 2021, 253, 112209. [Google Scholar] [CrossRef]
  79. Rong, W.; Li, Z.; Zhang, W.; Sun, L. An improved Canny edge detection algorithm. In Proceedings of the 2014 IEEE International Conference on Mechatronics and Automation, Tianjin, China, 3–6 August 2014; pp. 577–582. [Google Scholar]
  80. Zalaoğlu, D.; Karakus, P. İşlenebilirlikte Kenar Belirleme Algoritmalarının Kullanılabilirliği. Osman. Korkut Ata Üniversitesi Fen Bilim. Enstitüsü Derg. 2022, 5, 707–719. [Google Scholar] [CrossRef]
  81. Zittis, G.; Almazroui, M.; Alpert, P.; Ciais, P.; Cramer, W.; Dahdal, Y.; Fnais, M.; Francis, D.; Hadjinicolaou, P.; Howari, F. Climate change and weather extremes in the Eastern Mediterranean and Middle East. Rev. Geophys. 2022, 60, e2021RG000762. [Google Scholar] [CrossRef]
  82. Hamzeh, N.H.; Shukurov, K.; Mohammadpour, K.; Kaskaoutis, D.G.; Saadatabadi, A.R.; Shahabi, H. A comprehensive investigation of the causes of drying and increasing saline dust in the Urmia Lake, northwest Iran, via ground and satellite observations, synoptic analysis and machine learning models. Ecol. Inform. 2023, 78, 102355. [Google Scholar] [CrossRef]
  83. Ji, L.; Zhang, L.; Wylie, B. Analysis of dynamic thresholds for the normalized difference water index. Photogramm. Eng. Remote Sens. 2019, 75, 1307–1317. [Google Scholar] [CrossRef]
  84. Worden, J.; de Beurs, K.M. Surface water detection in the Caucasus. Int. J. Appl. Earth Obs. Geoinf. 2020, 91, 102159. [Google Scholar] [CrossRef]
  85. Zhang, Y.; Feng, L.; Li, J.; Luo, L.; Yin, Y.; Liu, M.; Li, Y. Seasonal–spatial variation and remote sensing of phytoplankton absorption in Lake Taihu, a large eutrophic and shallow lake in China. J. Plankton Res. 2010, 32, 1023–1037. [Google Scholar] [CrossRef]
  86. Tang, H.; Lu, S.; Baig, M.H.A.; Li, M.; Fang, C.; Wang, Y. Large-scale surface water mapping based on landsat and sentinel- 1 images. Water 2022, 14, 1454. [Google Scholar] [CrossRef]
Figure 1. The workflow of the methodology.
Applsci 15 02903 g001
Figure 2. Composite images from 2014, 2017, 2020, and 2023.
Applsci 15 02903 g002
Figure 3. AWEI, NDWI, and MNDWI water index maps in 2014, 2017, 2020 and 2023.
Applsci 15 02903 g003
Figure 4. Canny edge detection results.
Applsci 15 02903 g004
Figure 5. Lake surface areas for NDWI, MNDWI, and AWEI water index.
Applsci 15 02903 g005
Figure 6. Water surface boundaries of Lake Van obtained according to different water indices and machine learning algorithms.
Applsci 15 02903 g006aApplsci 15 02903 g006bApplsci 15 02903 g006c
Table 1. Calculated threshold values for several water indices within the designated study region.
Multiband IndexAWEINDWIMNDWI
Optimum thresholdsOptimum thresholdsOptimum thresholds
2014−0.78210.20290.0548
2017−0.72070.14120.0234
2020 −0.72040.31700.0858
2023−0.84460.78090.0542
Table 2. Classification accuracies for different water indices and classification methods, that is, CART, RF, and SVM.
2014CARTRFSVM2017CARTRFSVM
NDWI
Producer accuracy111Producer accuracy0.980.980.99
User accuracy111User accuracy0.970.970.98
Overall accuracy111Overall accuracy0.930.940.98
Kappa111Kappa0.940.960.98
F score111F score0.960.970.99
MNDWI
Producer accuracy0.980.980.99Producer accuracy0.940.860.95
User accuracy0.970.980.98User accuracy0.920.810.93
Overall accuracy0.940.970.97Overall accuracy0.870.670.87
Kappa0.950.980.98Kappa0.870.700.89
F score0.970.980.99F score0.910.890.93
AWEI
Producer accuracy111Producer accuracy0.990.991
User accuracy111User accuracy0.990.981
Overall accuracy111Overall accuracy0.990.991
Kappa111Kappa0.980.981
F score111F score0.990.991
2020CARTRFSVM2023CARTRFSVM
NDWI
Producer accuracy0.990.991Producer accuracy0.930.930.94
User accuracy0.980.981User accuracy0.910.900.91
Overall accuracy0.970.981Overall accuracy0.810.800.83
Kappa0.980.981Kappa0.840.830.86
F score0.980.991F score0.900.940.95
MNDWI
Producer accuracy0.970.950.96Producer accuracy0.920.920.95
User accuracy0.970.940.93User accuracy0.890.880.93
Overall accuracy0.960.900.90Overall accuracy0.820.830.89
Kappa0.950.910.92Kappa0.850.830.91
F score 0.970.930.94F score0.900.900.94
AWEI
Producer accuracy0.970.990.98Producer accuracy10.991
User accuracy0.940.980.96User accuracy10.991
Overall accuracy0.950.990.97Overall accuracy10.981
Kappa0.950.980.97Kappa10.981
F score0.980.990.99F score10.991
Disclaimer/Publisher’s Note: The statements, opinions and data contained in all publications are solely those of the individual author(s) and contributor(s) and not of MDPI and/or the editor(s). MDPI and/or the editor(s) disclaim responsibility for any injury to people or property resulting from any ideas, methods, instructions or products referred to in the content.

