Article

An Experimental Study on Physical and Mechanical Properties of Fractured Sandstone Grouting Reinforcement Body Under Freeze–Thaw Cycle

1
School of Resource and Safety Engineering, University of Science and Technology Beijing, Beijing 100083, China
2
China Coal Research Institute CCRI, Beijing 100013, China
3
National Engineering Research Center of Deep Shaft Construction, Beijing 100013, China
4
Beijing Key Laboratory of Urban Underground Space Engineering, University of Science and Technology Beijing, Beijing 100083, China
*
Authors to whom correspondence should be addressed.
Appl. Sci. 2025, 15(5), 2801; https://doi.org/10.3390/app15052801
Submission received: 16 January 2025 / Revised: 13 February 2025 / Accepted: 16 February 2025 / Published: 5 March 2025
(This article belongs to the Special Issue Underground Rock Support and Excavation)

Abstract

:
Freeze–thaw cycles lead to progressive damage in macro-defects within the rock mass, compromising its structural stability and ultimately resulting in frost-induced damage in rock mass engineering. Grouting plays a critical role in reinforcing fractured rock masses and enhancing their structural integrity. Investigating the physical and mechanical properties of grouted reinforcement bodies subjected to freeze–thaw cycles is of substantial theoretical and practical importance for ensuring the safe operation of rock engineering. This study focuses on fractured sandstone grouting reinforcement bodies to evaluate the impact of freeze–thaw cycles on their microscopic pore structure and macroscopic mechanical properties. Nuclear magnetic resonance (NMR) T2 spectra demonstrate that freeze–thaw cycles progressively enlarge internal pores within the grouted reinforcement body, with pore characteristics evolving from micropores to mesopores and from mesopores to macropores. Triaxial compression test results indicate that as the number of freeze–thaw cycles increases, the peak strength, elastic modulus, cohesion, and internal friction angle of the grouted reinforcement body decrease, with both peak strength and elastic modulus following an exponential decline relative to the number of cycles. Furthermore, the crack dip angle and confining pressure exert significant influence on the failure mode of the grouted reinforcement body.

1. Introduction

Rock masses in nature are subjected to prolonged and complex geological tectonic stresses, leading to the formation of discontinuous structural planes such as cracks, joints, and faults [1]. In seasonal frozen regions, long-term freeze–thaw cycles induce water-ice phase transitions within these macro- and micro-defects, generating frost heave forces that promote the expansion of pre-existing defects and the formation of new cracks. Over time, this process leads to the interconnection of joints and cracks, ultimately causing fracture failure, which directly compromises the stability of rock mass engineering and contributes to widespread frost damage [2,3,4]. Numerous engineering practices have demonstrated that the grouted reinforcement of fractured rock masses is one of the most effective and practical solutions for addressing these issues [5,6]. Grouting allows the slurry to permeate and fill fractures within the rock mass, which then solidifies, cementing the cracks and creating an integrated reinforcement. This process enhances the structural integrity of fractured rock masses, significantly improving their physical and mechanical properties [7]. However, prolonged exposure to freeze–thaw cycles in seasonally frozen regions severely compromises the internal structure and mechanical properties of grouted reinforcement bodies, posing substantial risks to the stability and safety of rock mass engineering. Therefore, to mitigate freeze–thaw hazards affecting grouting projects in seasonal frozen regions and to ensure the safety of engineering structures, it is essential to investigate the physical and mechanical properties of fractured rock grouting reinforcement bodies under the influence of freeze–thaw cycles.
Current research on the physical and mechanical properties of grouted reinforcement bodies in fractured rock primarily focuses on the reinforcement effects of grouting on fractured rocks and the factors influencing the mechanical performance of grouting reinforcement body. Studies on the mechanical properties of fractured rock masses before and after grouting predominantly employ shear tests, uniaxial compression tests, and triaxial compression tests. A series of shear tests on the mechanical properties of fractured rock masses before and after grouting revealed that grouting significantly enhanced the shear mechanical properties, including peak strength, residual strength, and stiffness, demonstrating the effectiveness of grouting in improving the mechanical performance of fractured rock masses [8,9,10,11,12,13,14]. Uniaxial and triaxial compression tests on grouted fractured rock samples indicated that grouting and confining pressure markedly altered the stress–strain relationship of the rock samples, improving the post-peak ductility and deformation characteristics of the fractured rock masses [15,16]. These studies highlight the role of grouting in enhancing the deformation characteristics of rock masses, especially under complex stress conditions.
Research on the factors influencing the mechanical properties of grouting reinforcement body has primarily centered on grouting materials and fracture geometry. Drop hammer tests and uniaxial compression tests on grouted bodies with different grouting materials demonstrated that the choice of grouting material significantly influenced grouting effectiveness, with epoxy resins exhibiting superior reinforcement performance compared to cement-based materials [17,18]. Feng and Liu et al. further elucidated that the strength of grouted bodies is negatively correlated with the viscosity of the grouting material and the particle size of the fractured rock mass [19,20]. These studies provide critical insights for the selection of grouting materials. Moreover, Uniaxial compression tests and high-speed camera technology analyses on grouted bodies with varying fracture dip angles showed that the strength of grouting reinforcement body initially decreased and then increased with increasing fracture dip angles, while the failure modes transitioned from axial splitting to shear failure, revealing the failure mechanisms under different stress conditions [21,22,23]. These findings reveal the failure mechanisms of grouted bodies under different stress conditions, offering theoretical support for engineering practices. The aforementioned research on fractured rock grouting reinforcement bodies has predominantly focused on normal temperature environments, with limited studies examining the effects in seasonally frozen regions. As grouting technology continues to develop and be applied in these regions, more grouting projects will be subjected to the impact of freeze–thaw cycles. Therefore, it is crucial to investigate the physical and mechanical properties of grouted reinforcement bodies under freeze–thaw cycles in seasonally frozen environments.
This paper investigates grouting reinforcement bodies with varying crack dip angles as the primary research focus. Through a series of laboratory tests, including freeze–thaw cycling tests, nuclear magnetic resonance (NMR) tests, and uniaxial and triaxial compression tests, this research examines the grouted sandstone from multiple perspectives, ranging from the micro-scale pore structure to the macro-scale mechanical properties. The study provides a quantitative analysis of the micro-pore evolution and mechanical property changes of the grouting reinforcement body during freeze–thaw cycles. Additionally, the influence of crack dip angle on the failure modes of the grouting reinforcement body is also explored. The findings of this study will offer theoretical support for the design and safe construction of grouting projects in cold regions. They will also serve as a valuable reference for the long-term monitoring and maintenance of grouting projects in cold regions, which is conducive to the development of more monitoring scientific plans and maintenance strategies to ensure the safe operation of the projects.

2. Experimental Materials and Methods

2.1. Materials and Sample Preparation

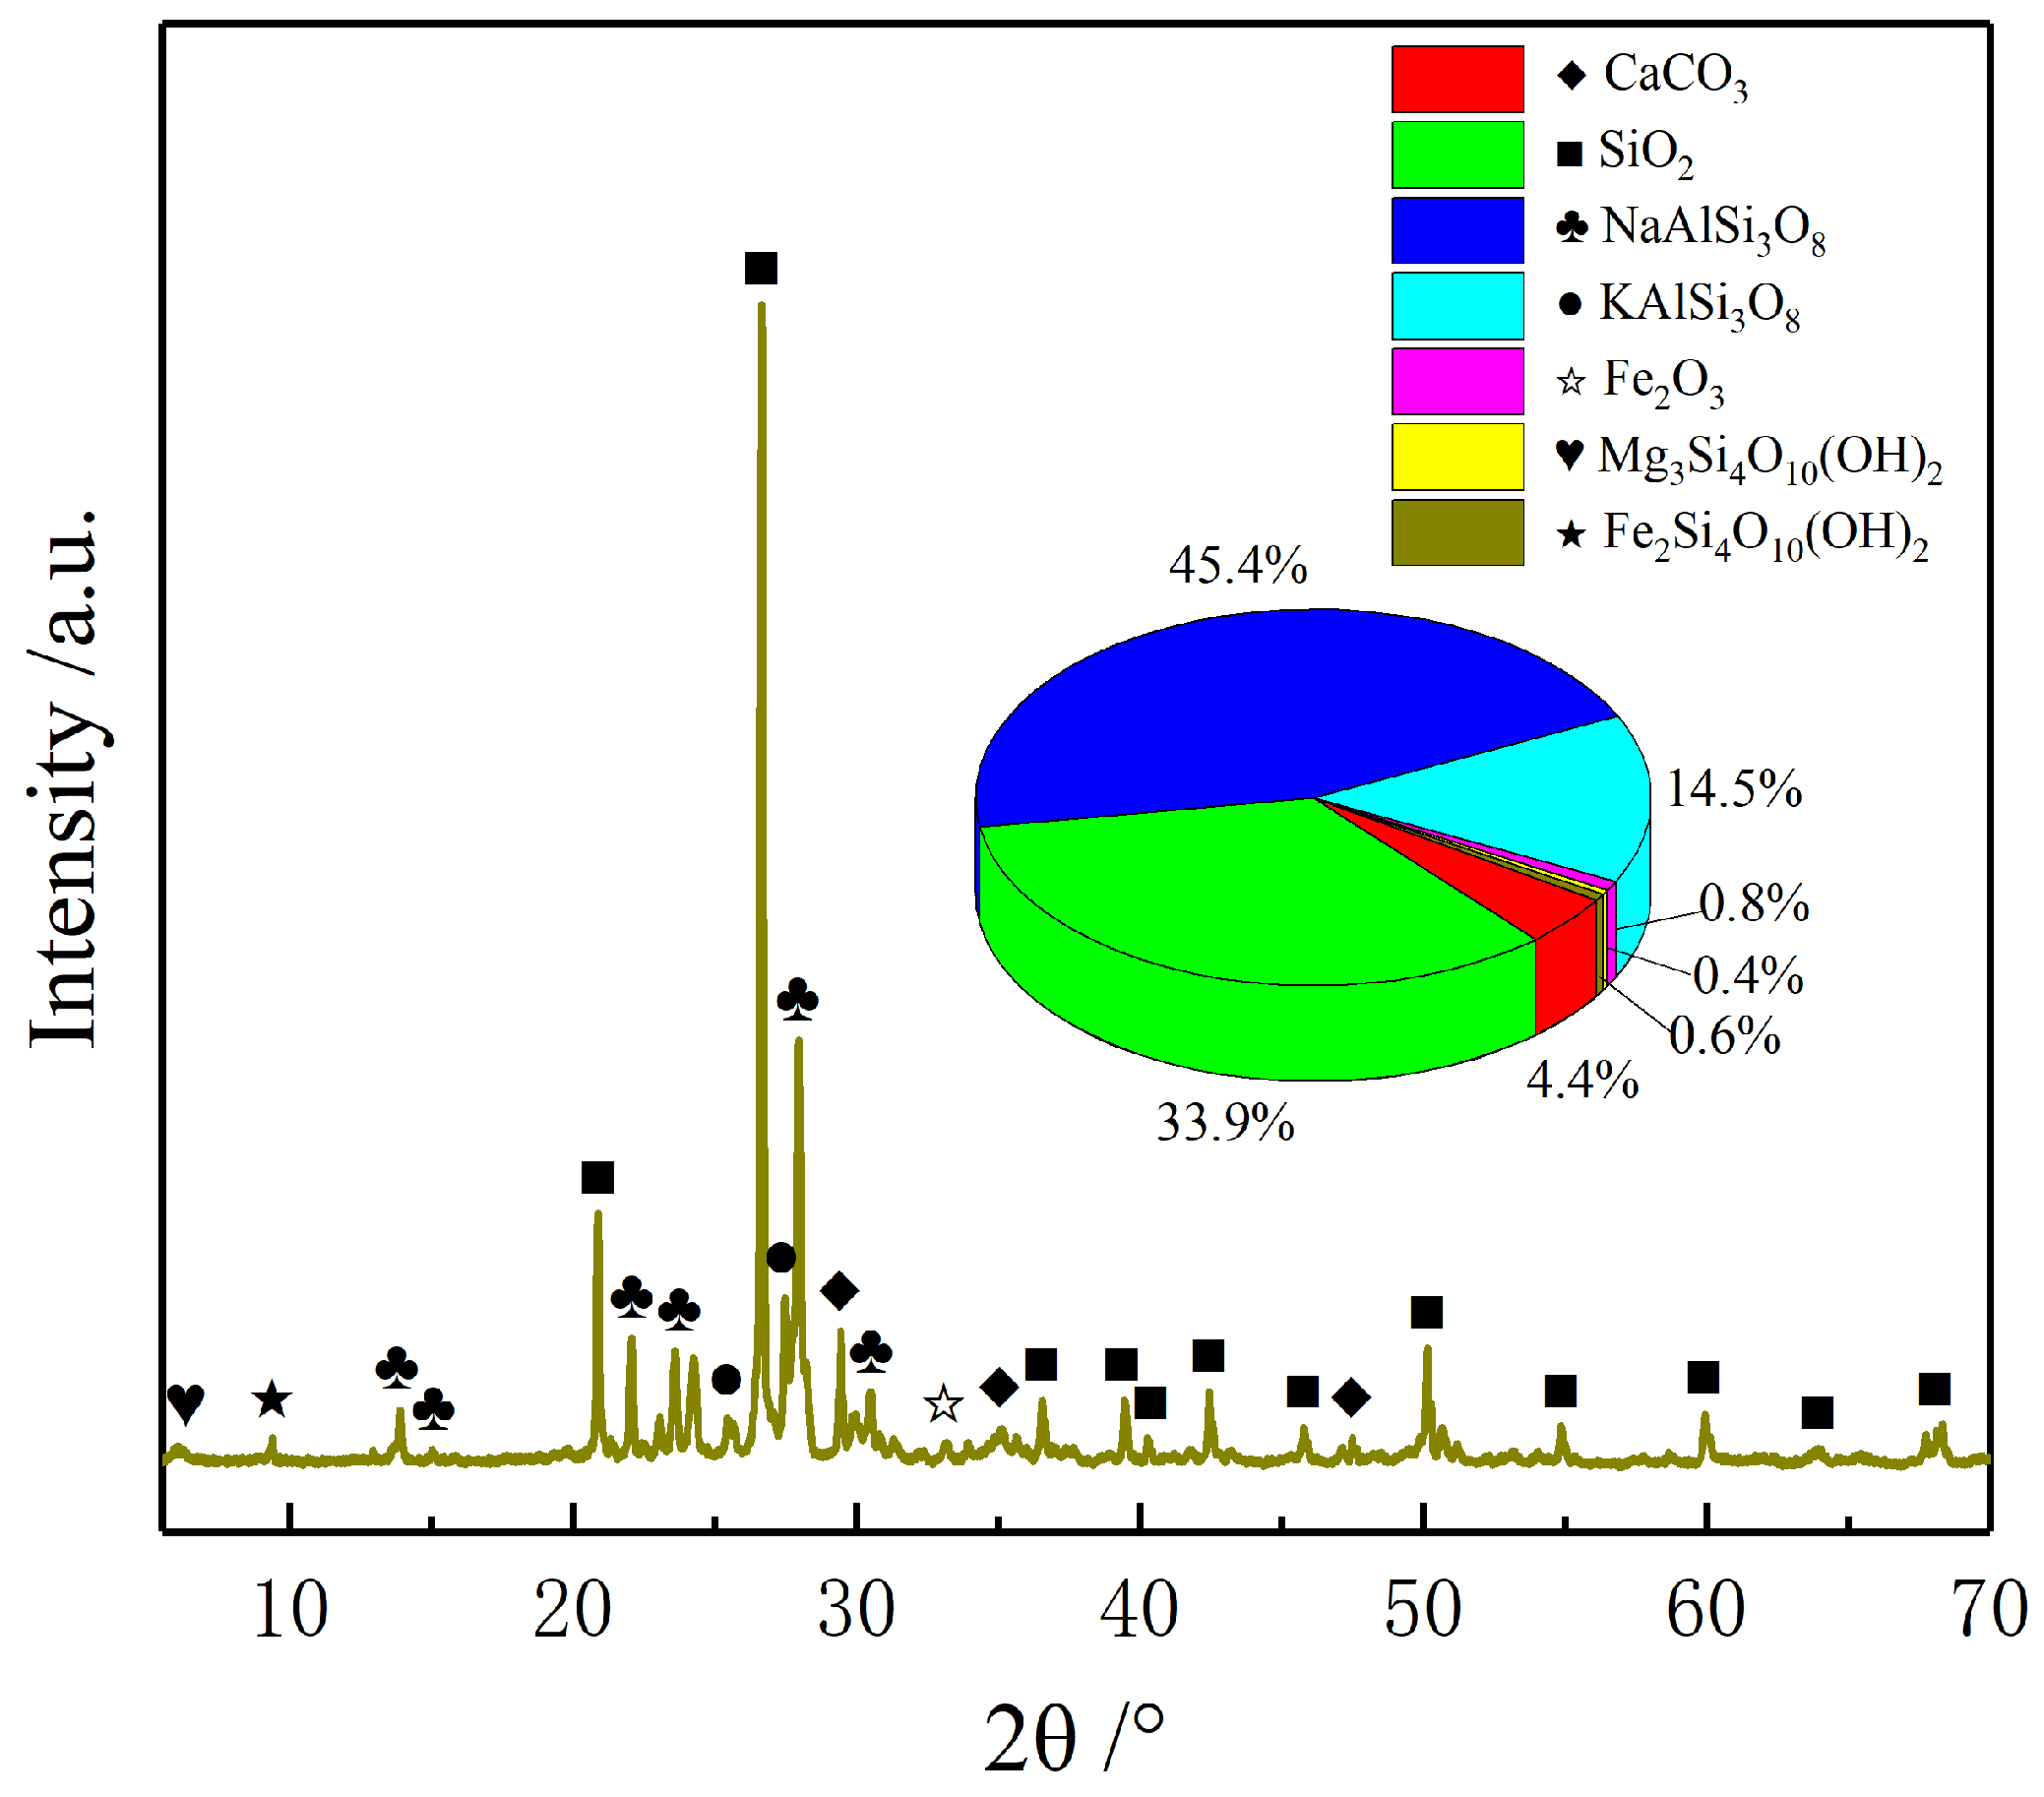
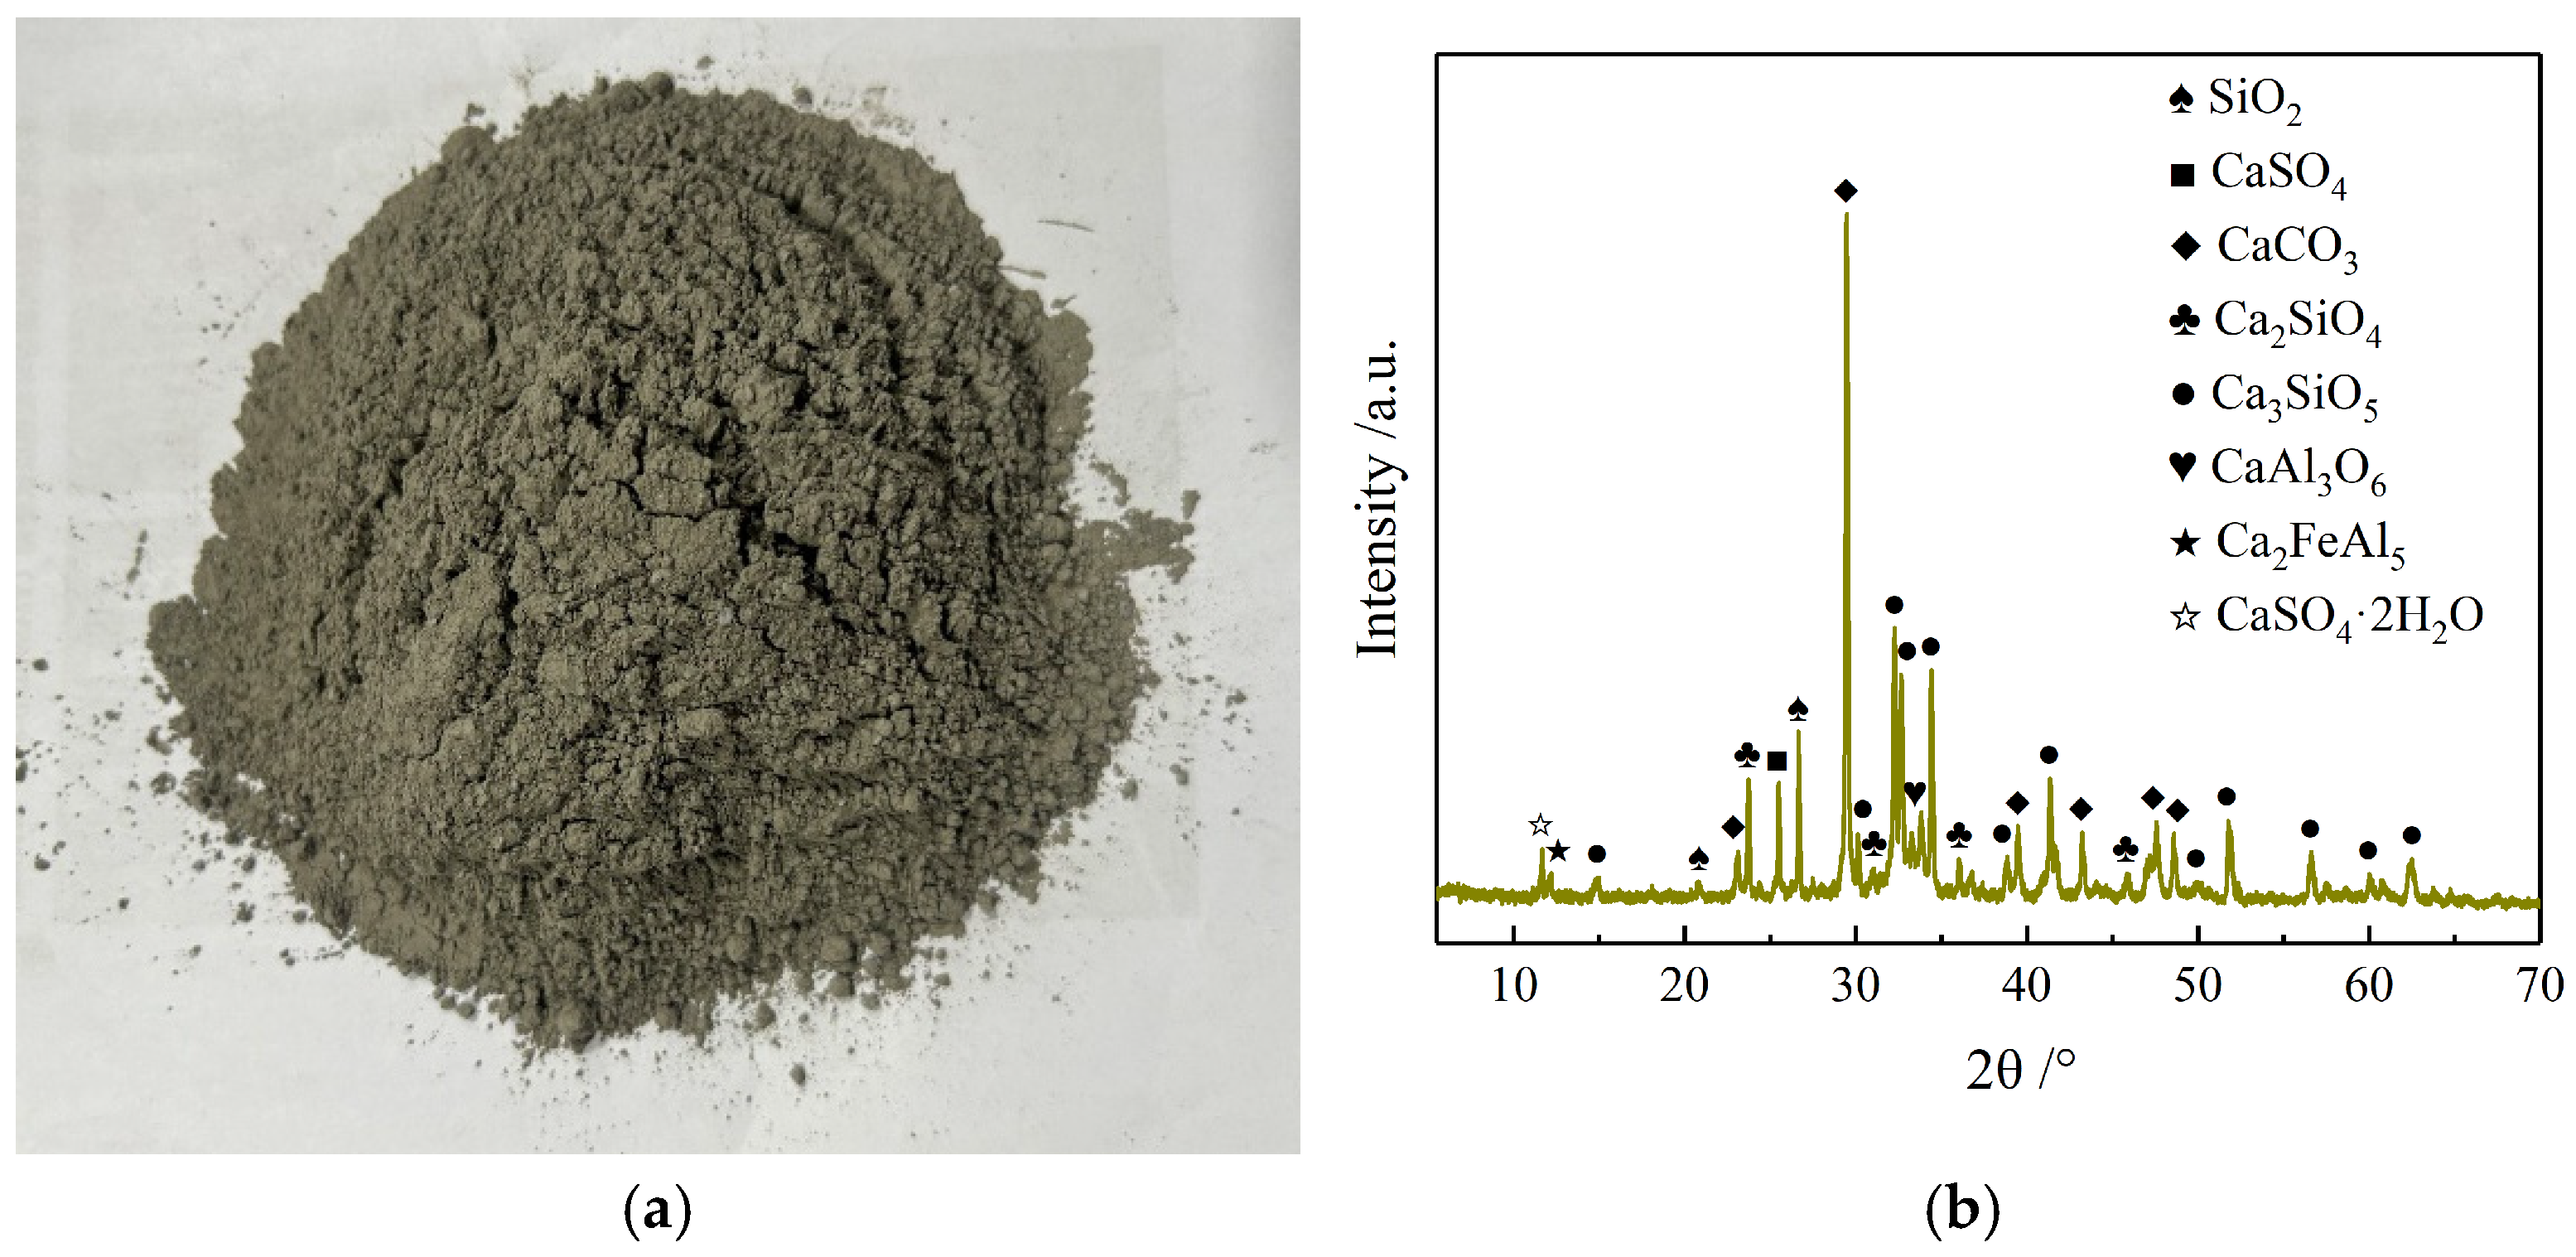
2.1.1. Experimental Materials

The rock samples used in this study were sourced from the Beishan extra-long tunnel in Huzhu, Qinghai Province, China. The phase composition of the rock samples was determined using X-ray diffraction (XRD) analysis, and the resulting XRD spectrum is presented in Figure 1. The crack opening in each sample was designed to be 4 mm. To ensure that the height of the grouted reinforcement body remained within the range of 100 mm ± 2 mm, the original rock was first cut into circular samples with a diameter of 50 mm and a height of 96 mm using a rock-cutting machine. The longitudinal wave velocity of each sample was then measured using an NM-4B non-metallic ultrasonic testing analyzer (manufactured by KangKeRui Ultrasonic Engineering Co., Ltd., Beiijing, China). Samples with similar longitudinal wave velocities were selected and grouped according to the experimental scheme to ensure homogeneity and minimize variability in the test results. Once the prototype samples were selected, a rock-cutting machine was used to create smooth, penetrating cracks at dip angles of 0°, 30°, 45°, and 60° along the middle of each sample, as shown in Figure 2.
Ultrafine cement overcomes many of the limitations associated with conventional Portland cement. The slurry has a low water precipitation rate, does not shrink upon solidification, exhibits excellent fluidity and high injectability, and allows cement particles to penetrate the rock more easily. The cement used in this experiment is 800-mesh ultrafine cement (manufactured by SINO-SINA, Beiijing, China). It has a specific surface area exceeding 800 m2/kg, an average particle size of less than 5 μm, and a water-to-cement ratio of 0.4:1 for the grouting slurry. The primary components of the test cement were determined using X-ray diffraction (XRD) analysis, as detailed in Table 1. The ultrafine cement and its corresponding XRD spectrum are shown in Figure 3.

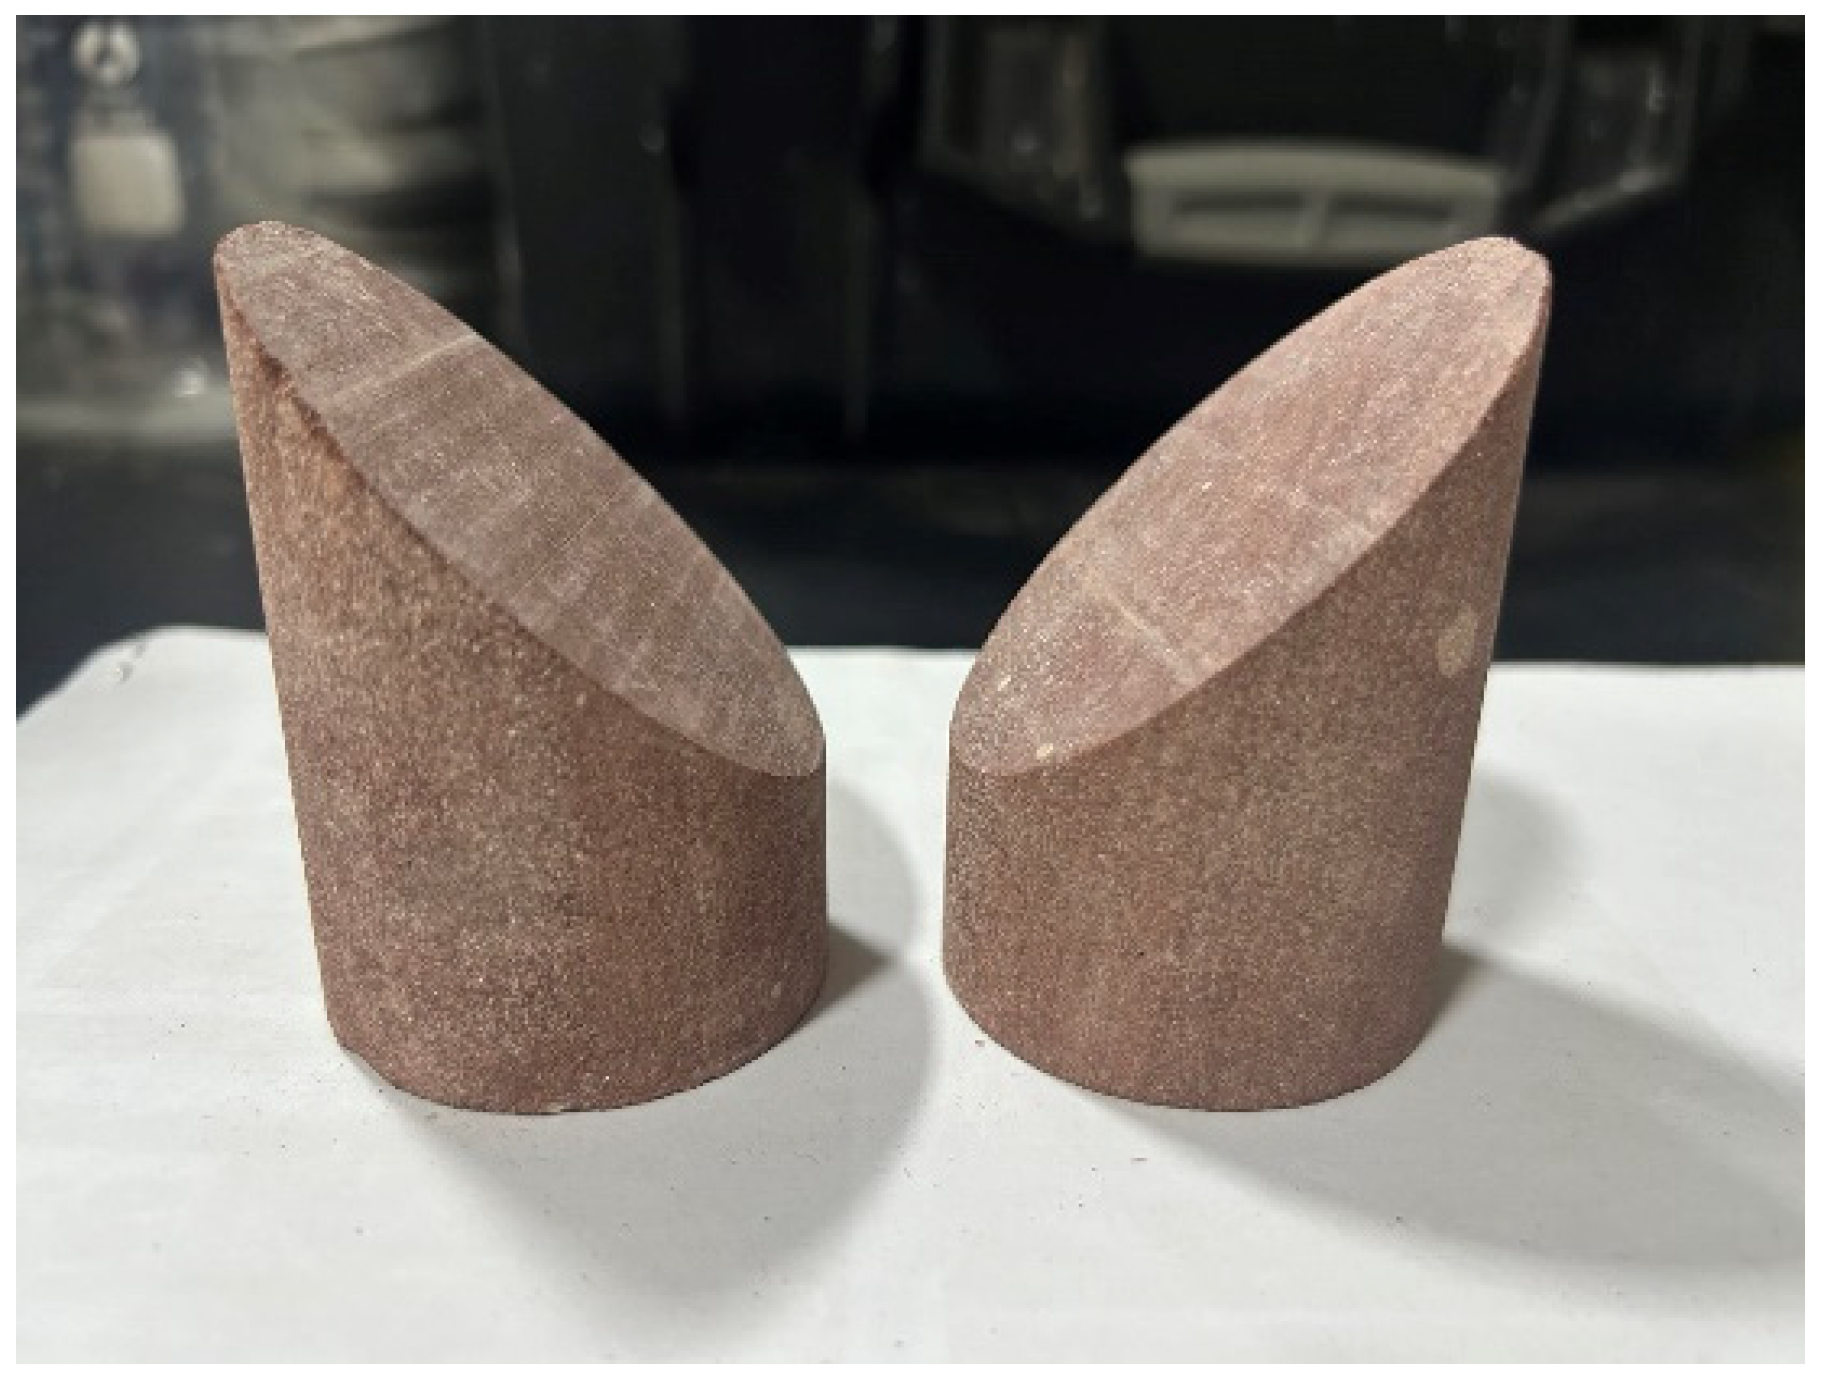
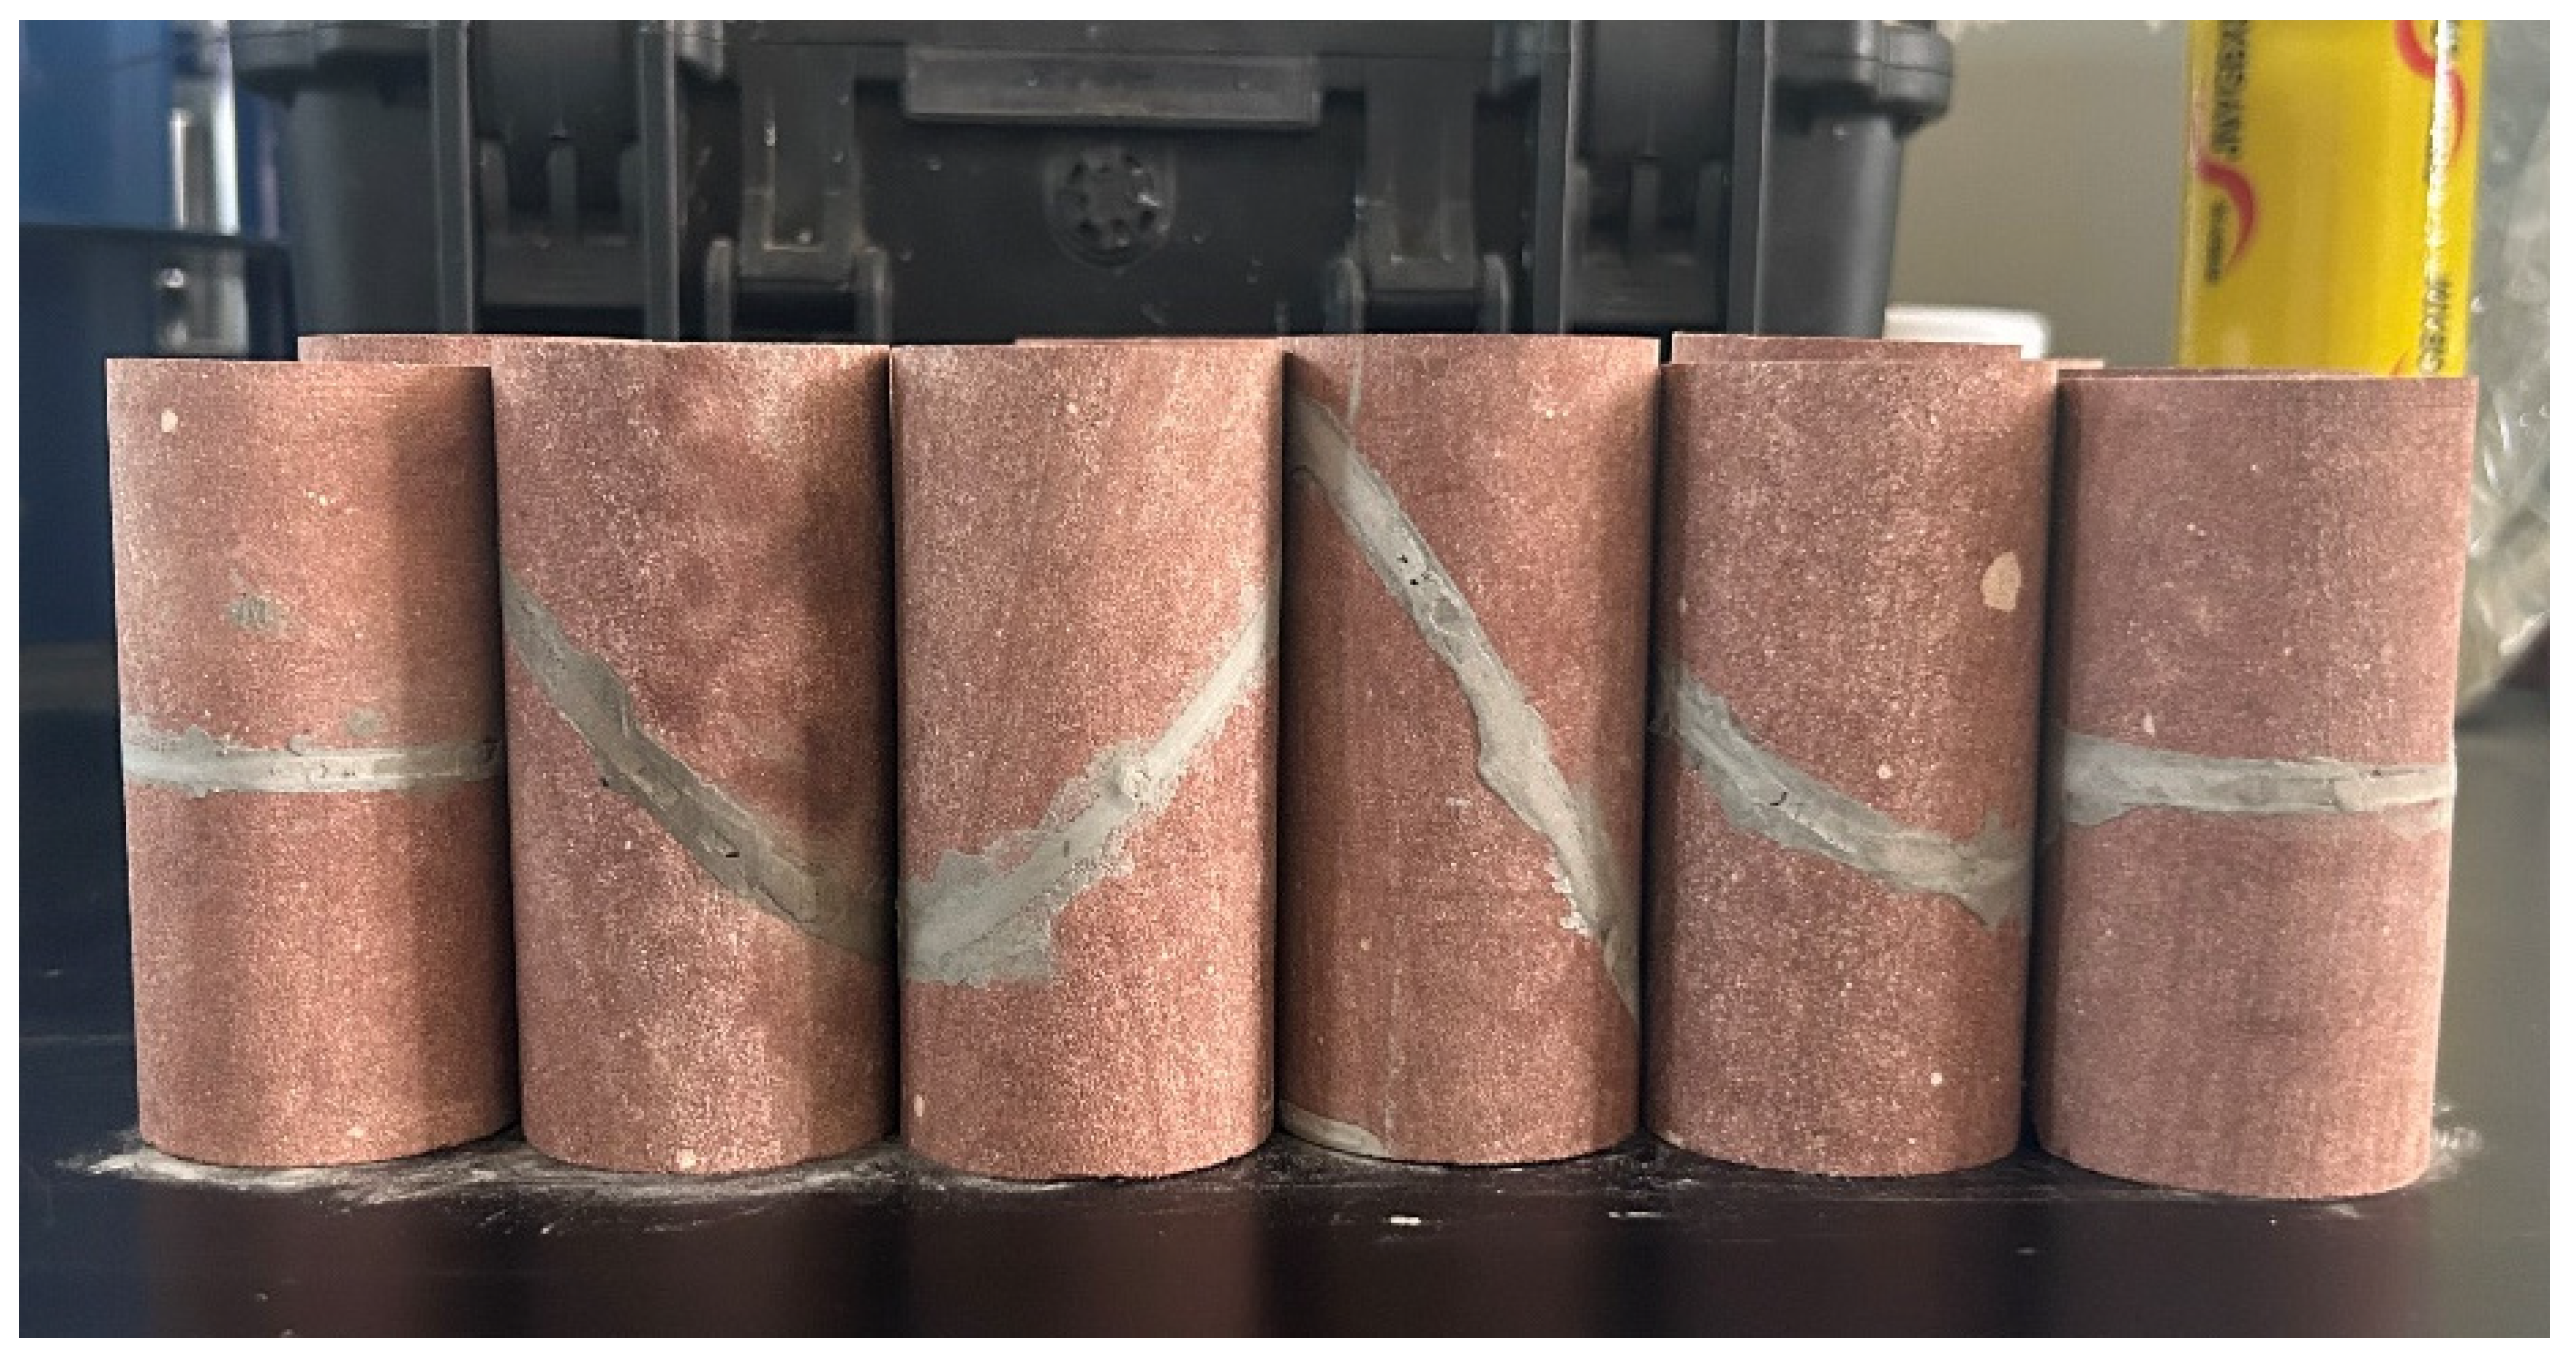
2.1.2. Sample Preparation

Per the experimental design, a custom grouting mold was fabricated using organic glass as the primary material. The inner semi-circular groove, extending half the length of the mold, was precisely manufactured using laser milling. The inner wall and cutting surface were burr-free and smooth, with the semi-circular base seamlessly connected to the organic glass. A silicone hose of a specified length, matching the dimensions of the slurry flow channel, was embedded within the semi-circular groove of the grouting mold. The syringe containing the cement slurry was securely attached to the extended end of the silicone hose, ensuring compliance with the grouting requirements for standard fractured rock samples. The grouting process is illustrated in Figure 4.
Upon completion of the grouting process, the sample was placed in a standard concrete curing chamber at a temperature of 20 ± 2 °C and a relative humidity of ≥95% for an initial curing period of 24 h. Afterward, the mold was removed, and the sample remained under the same curing conditions for an additional 28 days. The resulting slurry-stone-rock composite is referred to as the grouting reinforcement body, as shown in Figure 5.

2.2. Experimental Procedure

This study primarily investigates the effects of freeze–thaw cycles and varying crack dip angles on both the macroscopic physical and mechanical properties, as well as the microscopic pore characteristics, of fractured sandstone grouting reinforcement bodies. The experimental procedure is illustrated in Figure 6. The physical properties are assessed by analyzing changes in mass and wave velocity, while the mechanical properties are evaluated using a rock triaxial test system. The distribution of water in saturated samples is examined through nuclear magnetic resonance (NMR) imaging, which also provides insights into the microscopic pore characteristics of the grouting reinforcement body. The study involves four key experiments: the drying and saturation test, the freeze–thaw cycle test, the nuclear magnetic resonance (NMR) test, and the triaxial compression test.

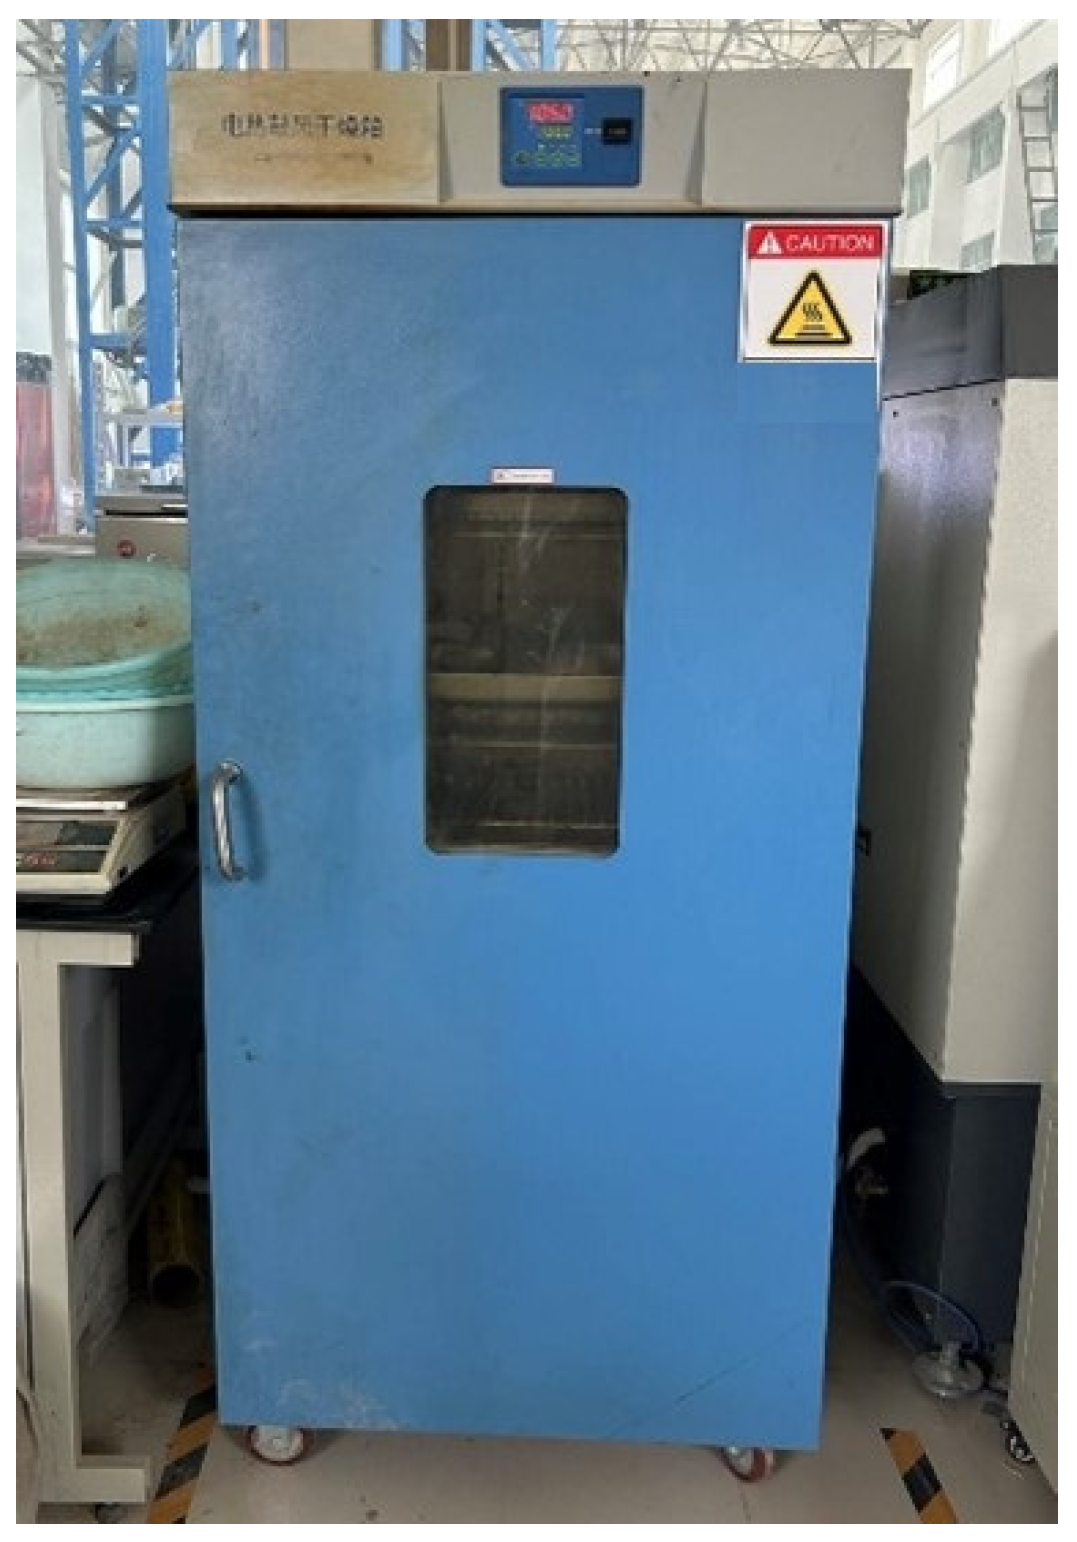
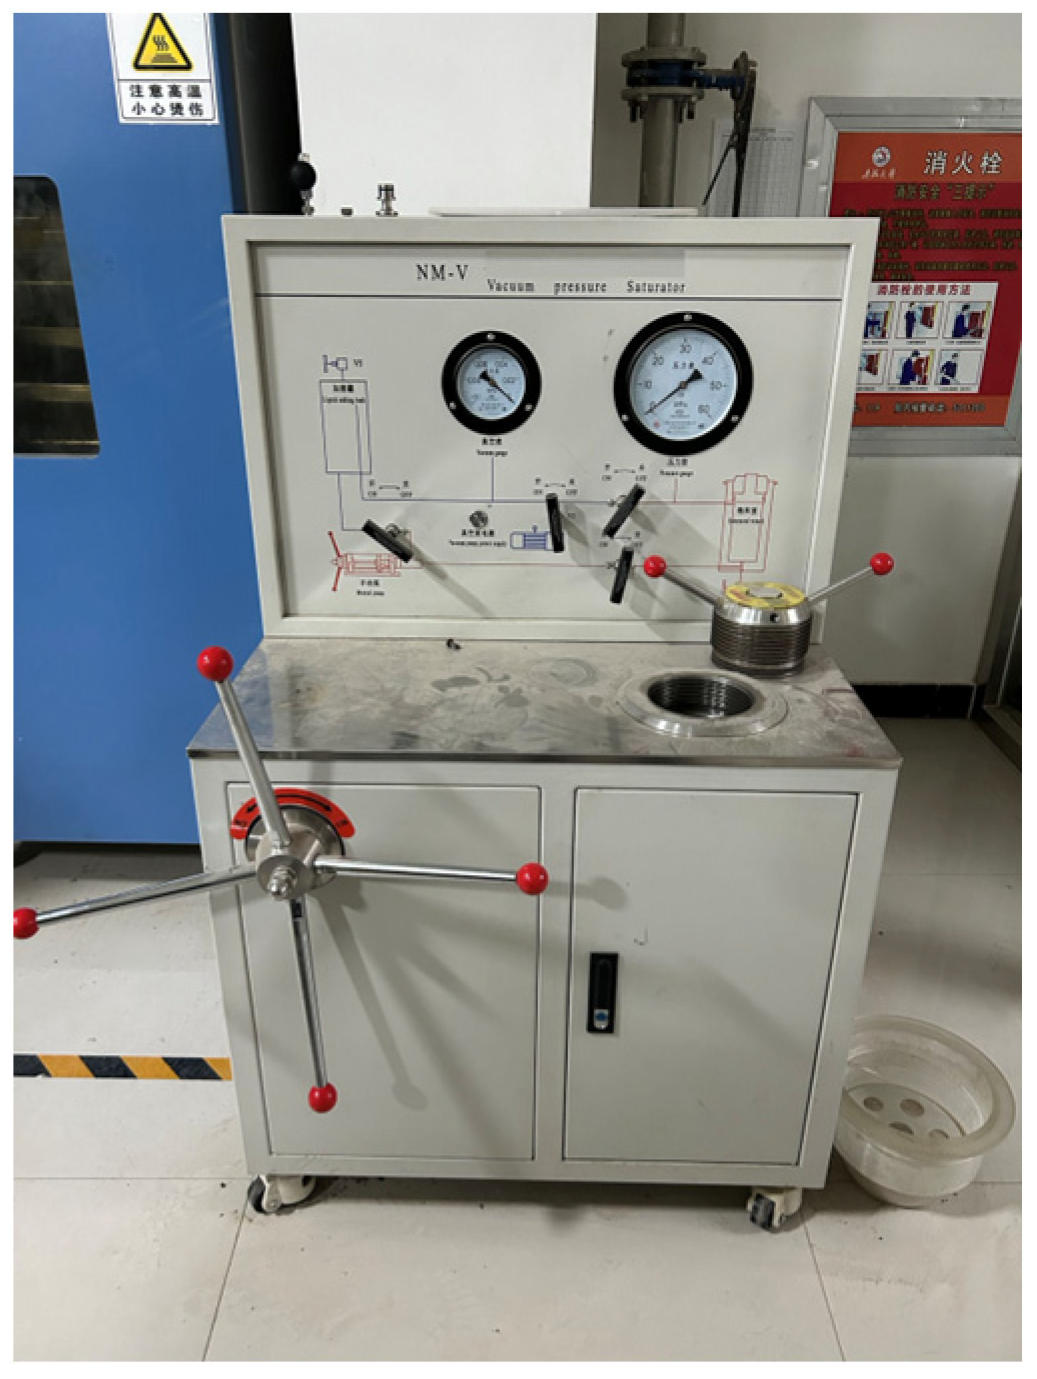
2.2.1. Drying and Saturation Test

The well-cured grouting reinforcement body samples were first dried using an electric blast drying oven (manufactured by YI Heng Co., Ltd., Shanghai, China), as shown in Figure 7. The samples were placed in the oven at a temperature of 105 °C for 48 h. After drying, the mass of each sample was measured using a high-precision electronic scale.
The water content in the grouting reinforcement body plays a crucial role in determining its susceptibility to freeze–thaw damage. Before conducting the freeze–thaw cycle test and nuclear magnetic resonance (NMR) test, the grouting reinforcement body must first be fully saturated. Saturation methods are generally classified into two types: the free saturation method and the vacuum-forced saturation method. In this study, the vacuum-forced saturation method, known for its superior effectiveness, was chosen. Saturation was carried out using the NM-V vacuum pressure saturation device (manufactured by Tuo Chuang Co., Ltd., Jiangsu, China), as shown in Figure 8. After 48 h of forced saturation, the samples were removed, quickly weighed, and sealed with plastic wrap to prevent moisture loss.

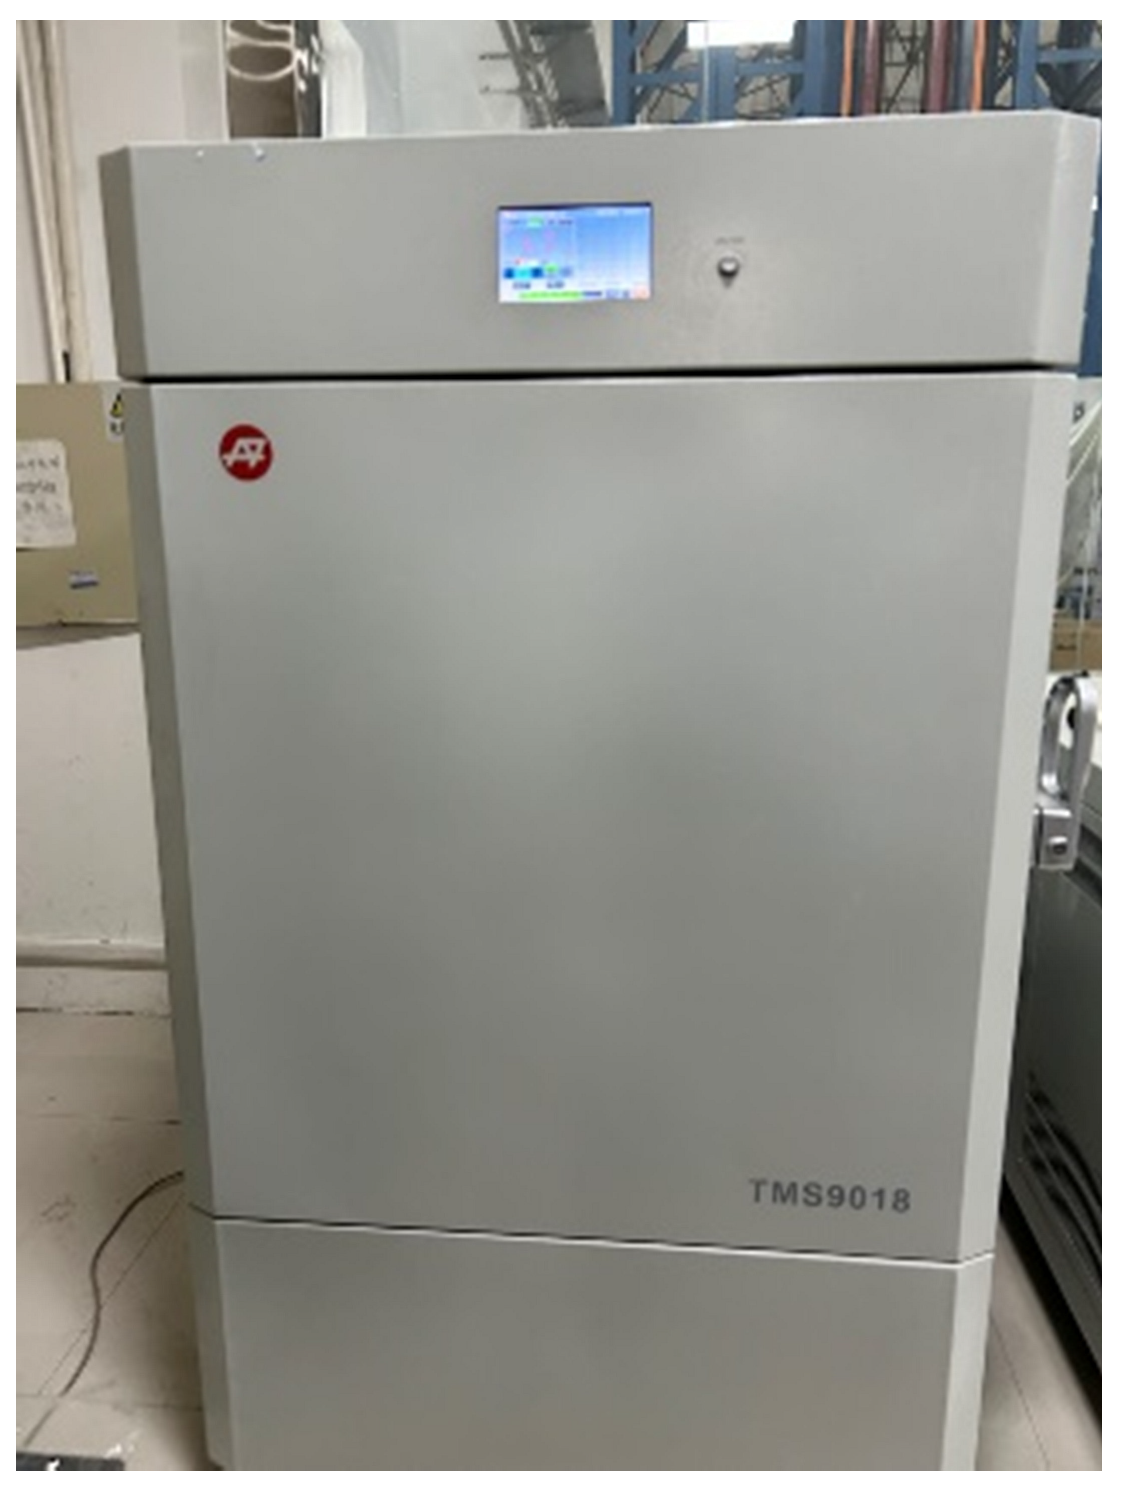
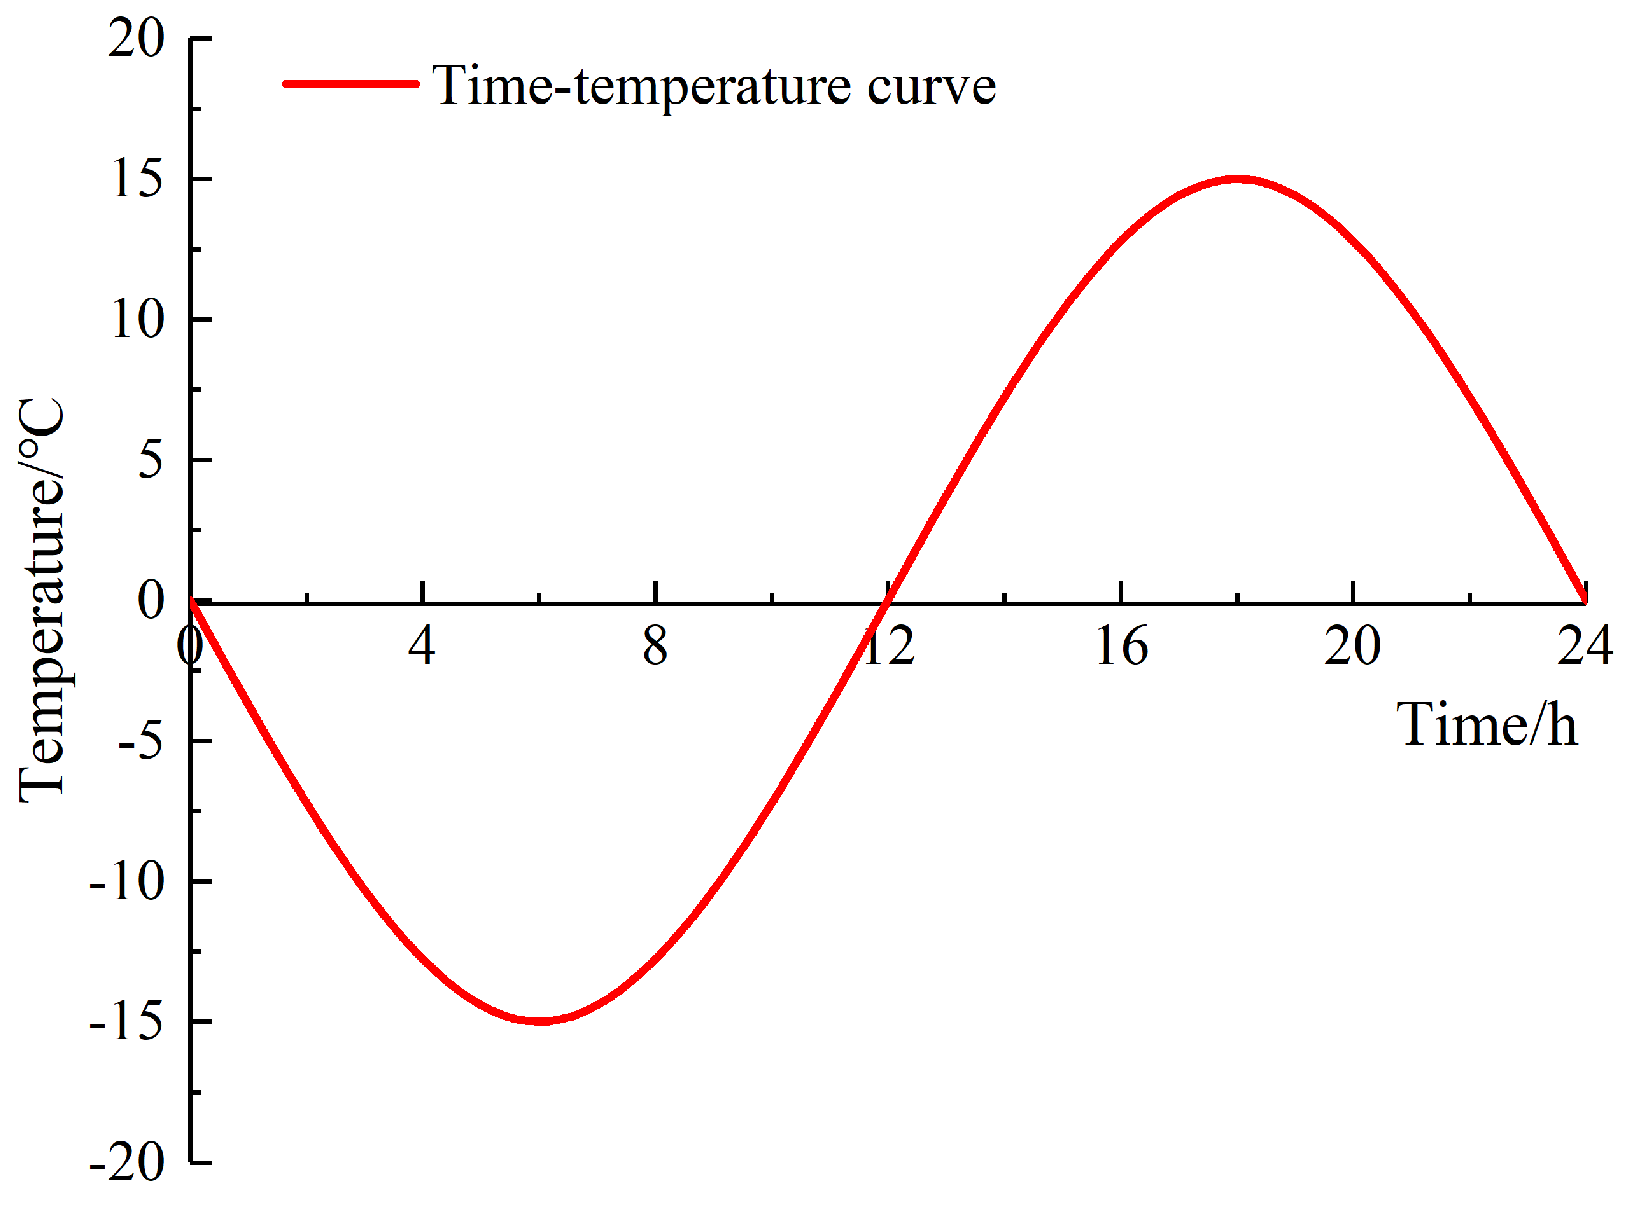
2.2.2. Freeze–Thaw Cycle Test

The freeze–thaw cycle test was conducted using the TMS9018 freeze–thaw cycle chamber (manufactured by Tomos Technology Co., Ltd., Zhejiang, China), as shown in Figure 9. This chamber allows for the setup of various freeze–thaw temperature curves, including linear, sinusoidal, and cosine patterns. Based on local temperature fluctuations in Qinghai Province, a cosine-like freeze–thaw temperature profile was selected for this experiment, as illustrated in Figure 10, with a maximum temperature of 15 °C and a minimum of −15 °C. Each freeze–thaw cycle lasted 24 h. According to the experimental design, tests were conducted at intervals of 0, 5, 10, 15, 20, 25, and 30 cycles. After completing the designated number of freeze–thaw cycles, the samples were removed, and their mass and longitudinal wave velocity were measured.

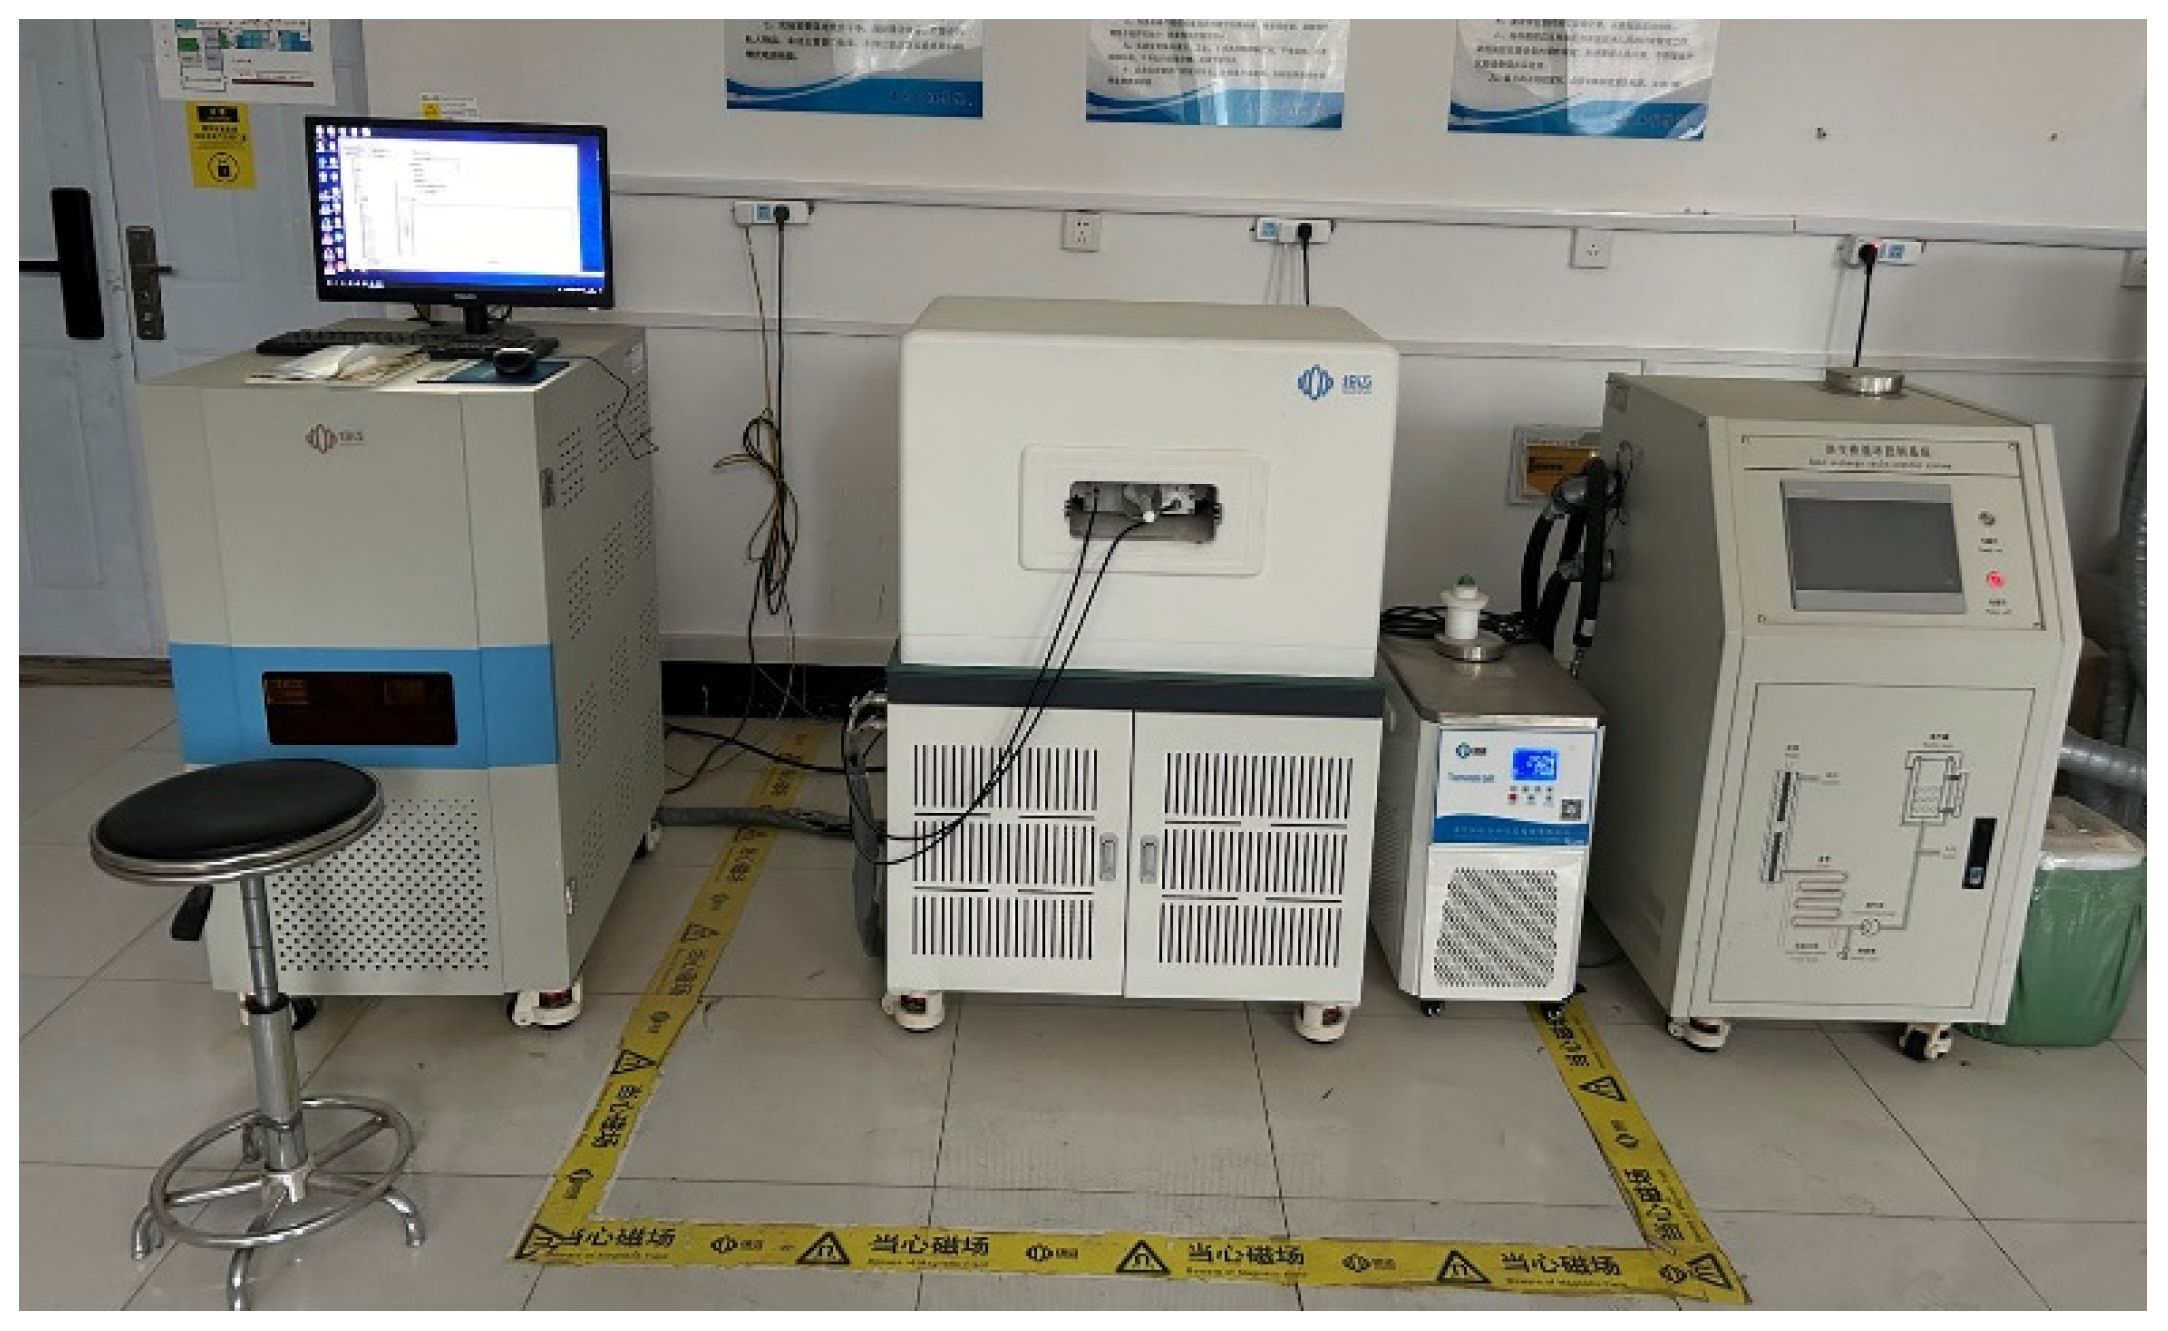
2.2.3. Nuclear Magnetic Resonance Principle and Test

In recent years, low-field nuclear magnetic resonance (NMR) has emerged as a rapid, non-destructive, and intuitive detection technology in the geotechnical field, effectively revealing the microstructural pore characteristics of rocks. Under natural conditions, the spin states of 1H nuclei are randomly oriented and unmagnetized. When a sample is placed in the test chamber of an NMR instrument, the primary magnetic field causes the 1H nuclei to become magnetized. The interaction between the spin magnetization of the 1H nuclei and the applied magnetic field generates a measurable signal, which is a prerequisite for nuclear magnetic resonance. This phenomenon, known as nuclear magnetic resonance (NMR), involves the nuclei aligning with the applied magnetic field while releasing energy into their surroundings. The transition from a high-energy state to a low-energy state is called nuclear magnetic resonance relaxation. The transverse relaxation time decay (T2 decay) contains critical physical information about most porous samples, making T2 the primary parameter for rock NMR detection. Based on the principles of NMR detection, the grouting reinforcement body undergoes vacuum-forced saturation to ensure complete water saturation of its internal pores. The T2 spectra of the grouting reinforcement body are generated through NMR testing of the 1H nuclei in the water. By analyzing these spectra, the internal pore characteristics and their variation patterns can be determined.
The T2 relaxation time is classified into surface T2 relaxation, free T2 relaxation, and diffusion T2 relaxation. In porous materials, such as the grouting reinforcement body, the relaxation time is primarily governed by surface T2 relaxation. Therefore, T2 can be expressed using the following Equation [24]:
1 T 2 = ρ 2 S V
where T2 is transverse relaxation time (ms), ρ 2 is the surface relaxation strength of T2 (μm/ms), S is pore surface area (cm2), and V is pore volume (cm3).
It can be observed that the transverse relaxation time T2 is proportional to the pore-specific surface area (S/V) and the surface relaxation strength. Thus, Equation (1) can be further simplified as follows:
r = ρ 2 F 2 T 2
where r is the pore radius (μm). F 2 is the shape aggregation factor, which is 3 for spherical pores and 2 for columnar pores, and ρ 2 is the surface relaxation strength of T2 (μm/ms). The corresponding values of these parameters are provided in Table 2 [25]. The value of ρ 2 F 2 ranges from 0.01 to 0.15 μm/ms [26,27]; meanwhile, in this study, a value of 0.01 μm/ms is adopted. Thereby, the relationship between the T2 and the pore radius (r) is established. A larger T2 value corresponds to a larger pore radius, while a smaller T2 indicates a smaller pore size.
The pore structure of the grouting reinforcement body includes both pore distribution and pore size, with the latter having a direct impact on the macroscopic strength of the samples. Pores are generally categorized into micropores, mesopores, and macropores, although no universally accepted classification standard currently exists. Table 3 summarizes the commonly used classification methods. Different classification schemes have been proposed for micropores, mesopores, and macropores. In this study, the pore size classification follows the method proposed by Yan Jianping. According to this scheme, micropores are defined as pores with r < 0.1 μm, corresponding to T2 < 10 ms; mesopores are those with 0.1 μm < r < 1 μm, corresponding to 10 ms < T2 < 100 ms; and macropores are defined as pores with r > 1 μm, corresponding to T2 > 100 ms.
The instrument used in this experiment is the NIUMAG MesoMR12-060H-1 CORE MRI system (manufactured by Niumai Co., Ltd., Suzhou, China), and the test equipment is shown in Figure 11. The experimental procedure was as follows: (1) The grouting reinforcement body samples, after being subjected to vacuum-forced saturation, were sealed in plastic wrap to prevent water evaporation; (2) the nuclear magnetic resonance test system was initialized, the standard test sample was placed in the test chamber, and the test parameters were configured; (3) the standard sample was removed, and the plastic-wrapped sample was inserted into the system’s test chamber for analysis; (4) after the test was completed, the sample was removed, the results were processed and recorded, and the system was subsequently shut down.

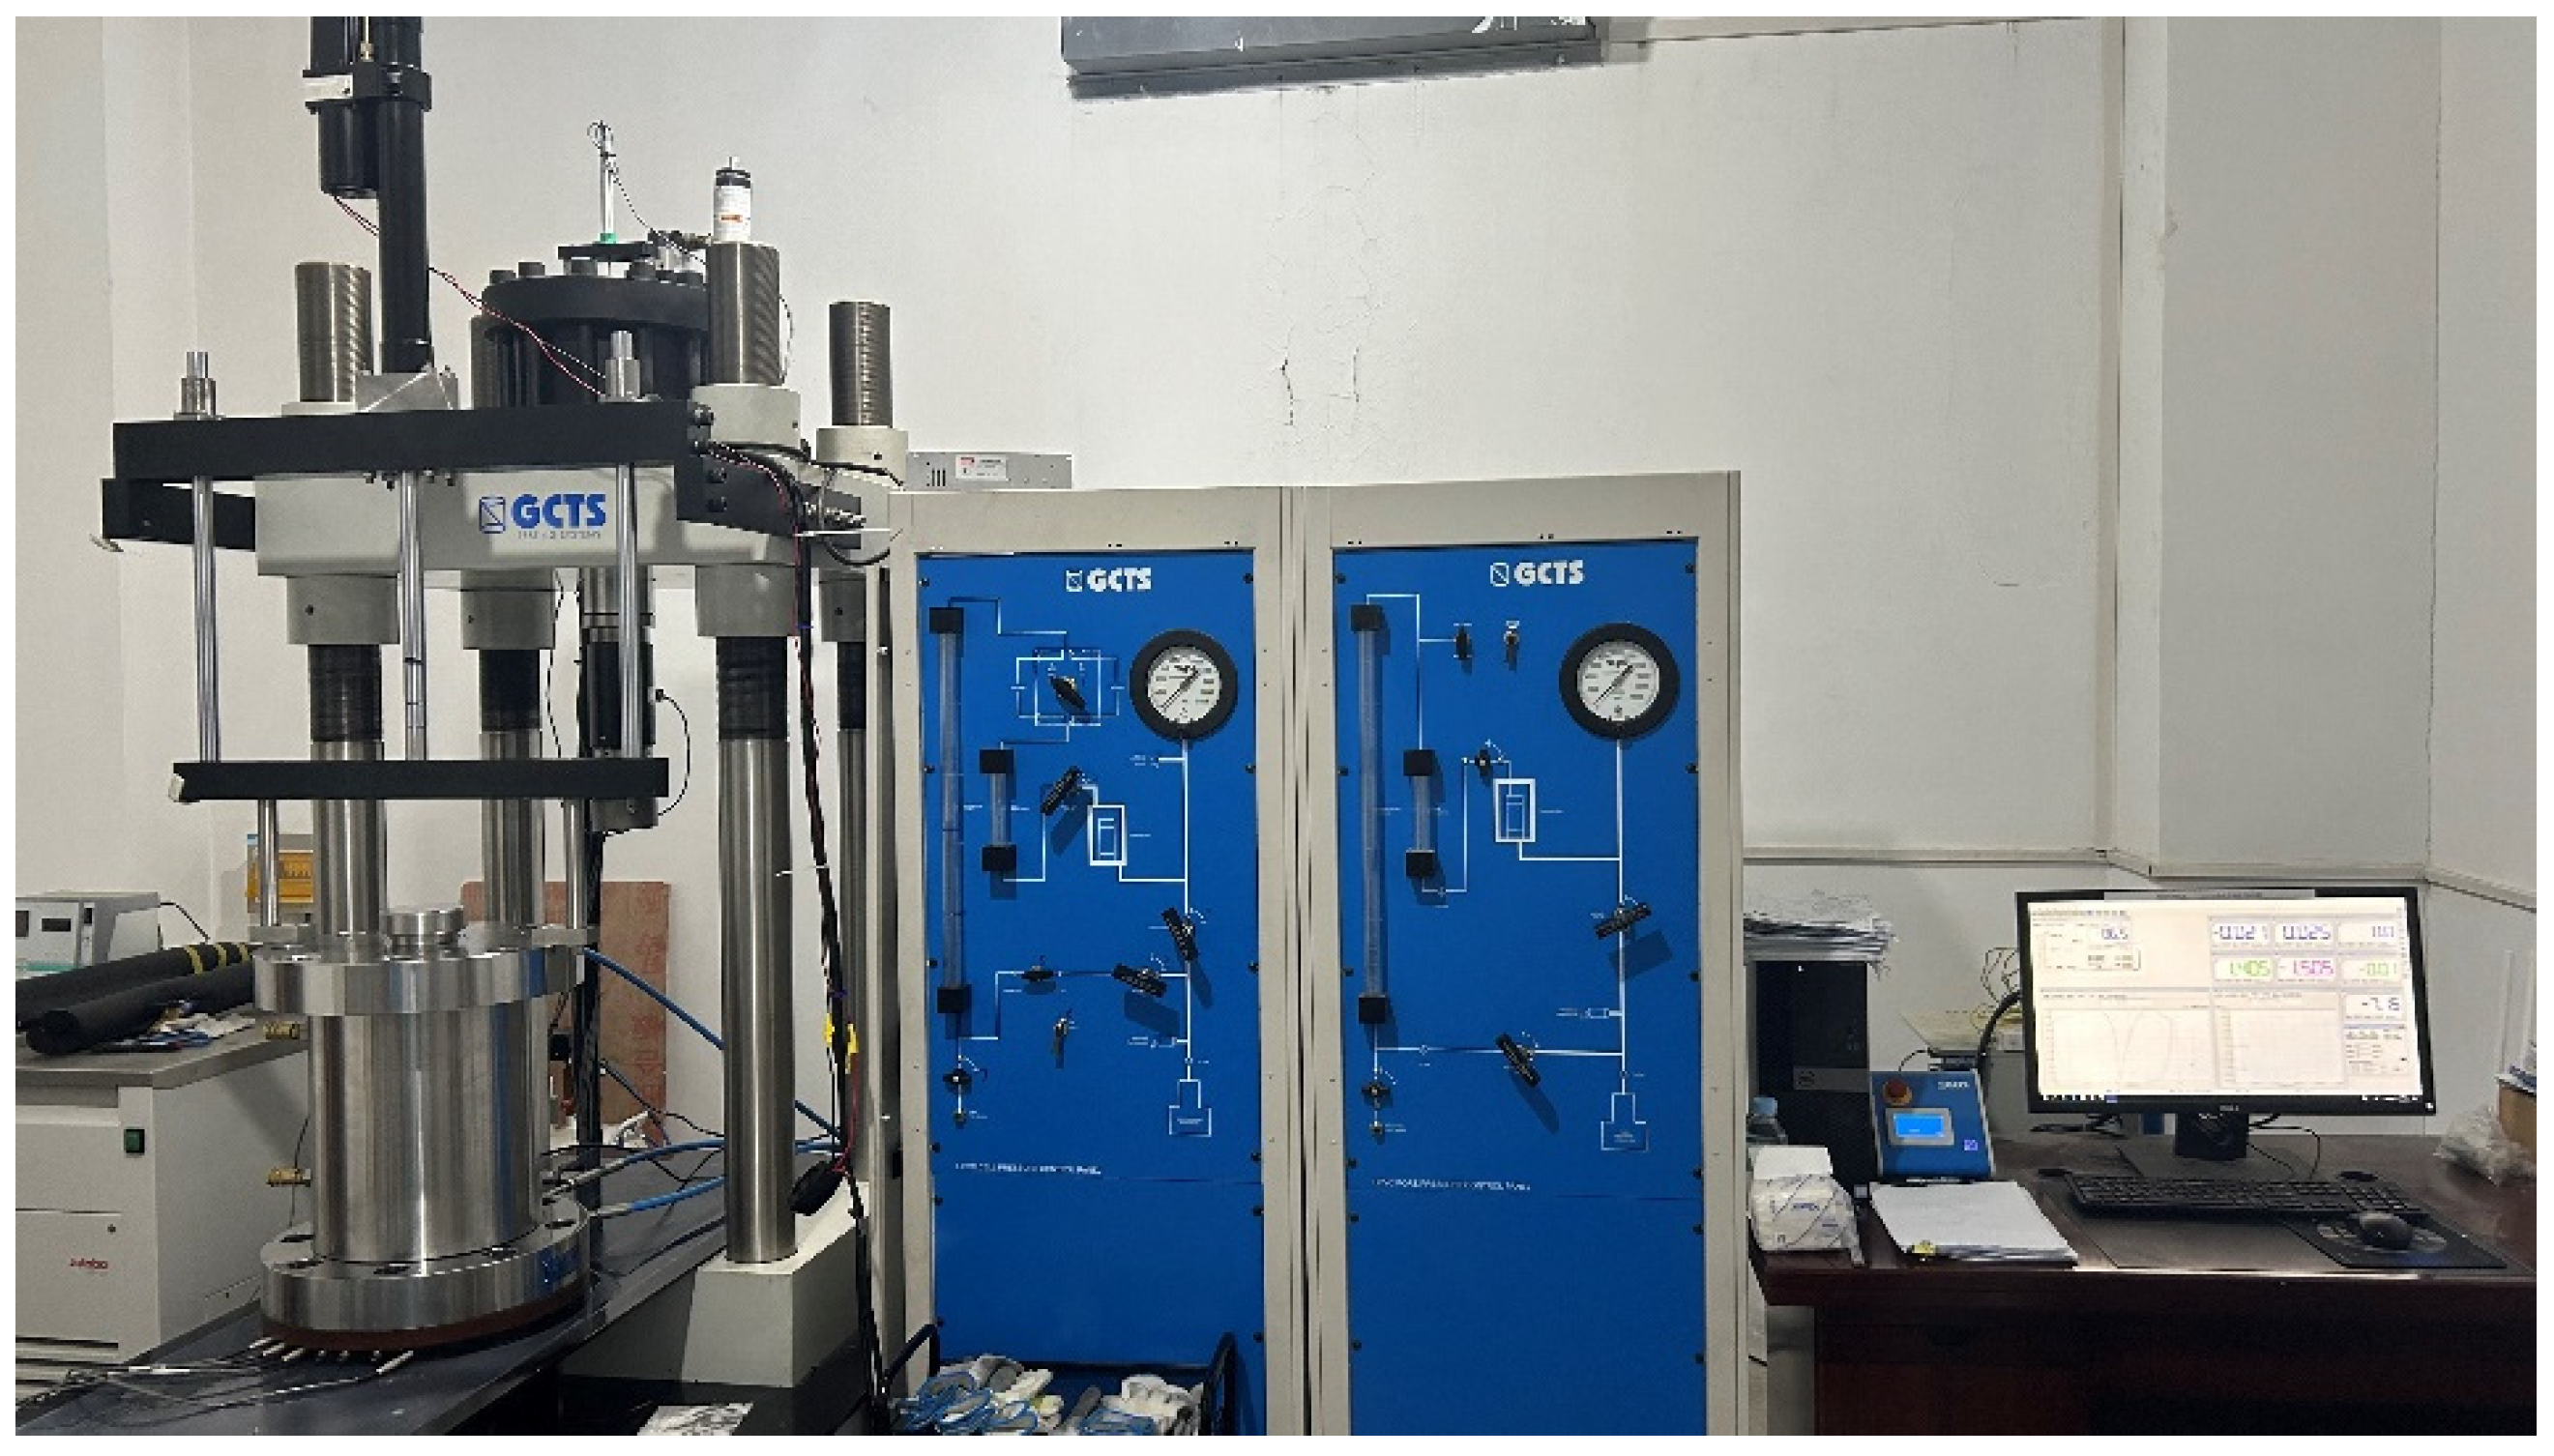
2.2.4. Triaxial Compression Test

A triaxial compression test was conducted on the grouting reinforcement body subjected to varying freeze–thaw cycles. The test equipment used was the FRTX-1000 low-temperature high-pressure servo-controlled rock triaxial test system (manufactured by GeotechnicalConsulting & Testing Systems, USA), as shown in Figure 12. The confining pressures applied during the test were 0 MPa, 3 MPa, 6 MPa, and 9 MPa.

3. Results and Discussion

3.1. Physical Properties
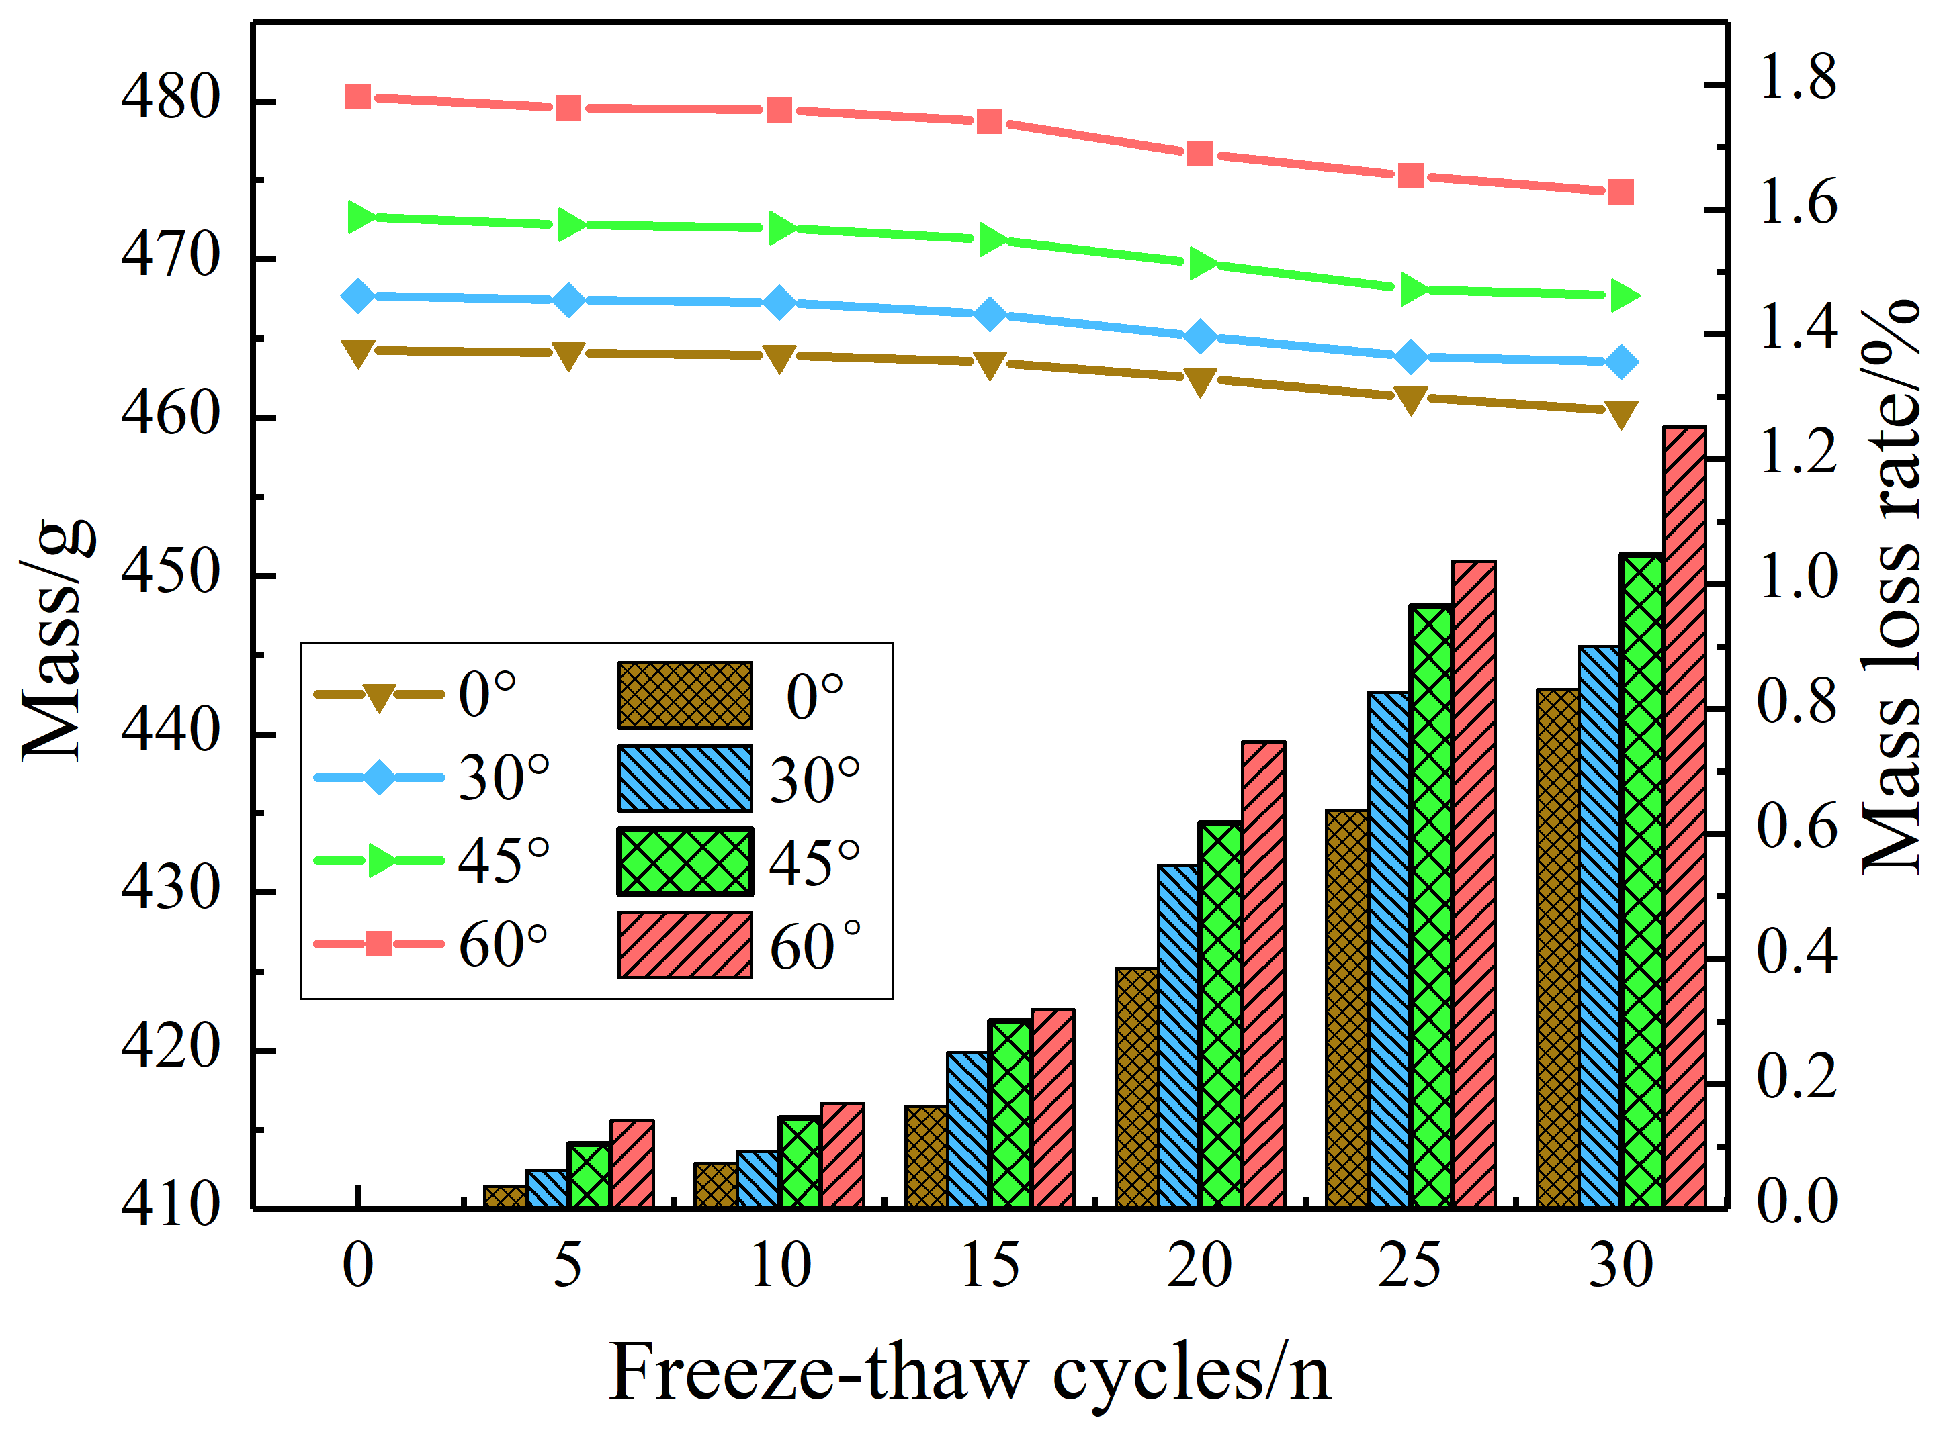
3.1.1. Mass

The mass change proportion following freeze–thaw cycles serves as an indicator for assessing the frost resistance and stability of the grouting reinforcement body, providing valuable insights for engineering design and material selection. This proportion is typically represented by the freeze–thaw mass loss rate, which can be calculated using the following equation:
K m = m 0 m n m 0 × 100 %
where K m is the freeze–thaw mass loss rate (%); m 0 denotes the mass before freeze–thaw cycling (g), and m n refers to the mass after n freeze–thaw cycles (g). Meanwhile, n is 5, 10, 15, 20, 25, or 30.
Figure 13 illustrates the mass and mass loss rate of grouting reinforcement bodies with varying crack dip angles as a function of the number of freeze–thaw cycles. The figure shows that the mass loss trend for grouting reinforcement bodies with different crack dip angles generally follows a consistent pattern. As the number of freeze–thaw cycles increases, the mass of the grouting reinforcement body decreases, while the mass loss rate progressively rises. Similarly, as the crack dip angle increases, the mass loss rate exhibits a corresponding gradual increase. For example, with a crack inclination angle of 60°, after 5 and 10 freeze–thaw cycles, the mass loss of the grouting reinforcement body remains minimal, with maximum mass loss rates of 0.07% and 0.12%, respectively. After 30 freeze–thaw cycles, the mass loss rate increased to 1.25%. This phenomenon occurs due to frost heaving forces during the freeze–thaw process, which causes crystals and particles to detach from the specimen surface and along the edges of prefabricated cracks. This effect is most pronounced at the specimen edges and crack tips.

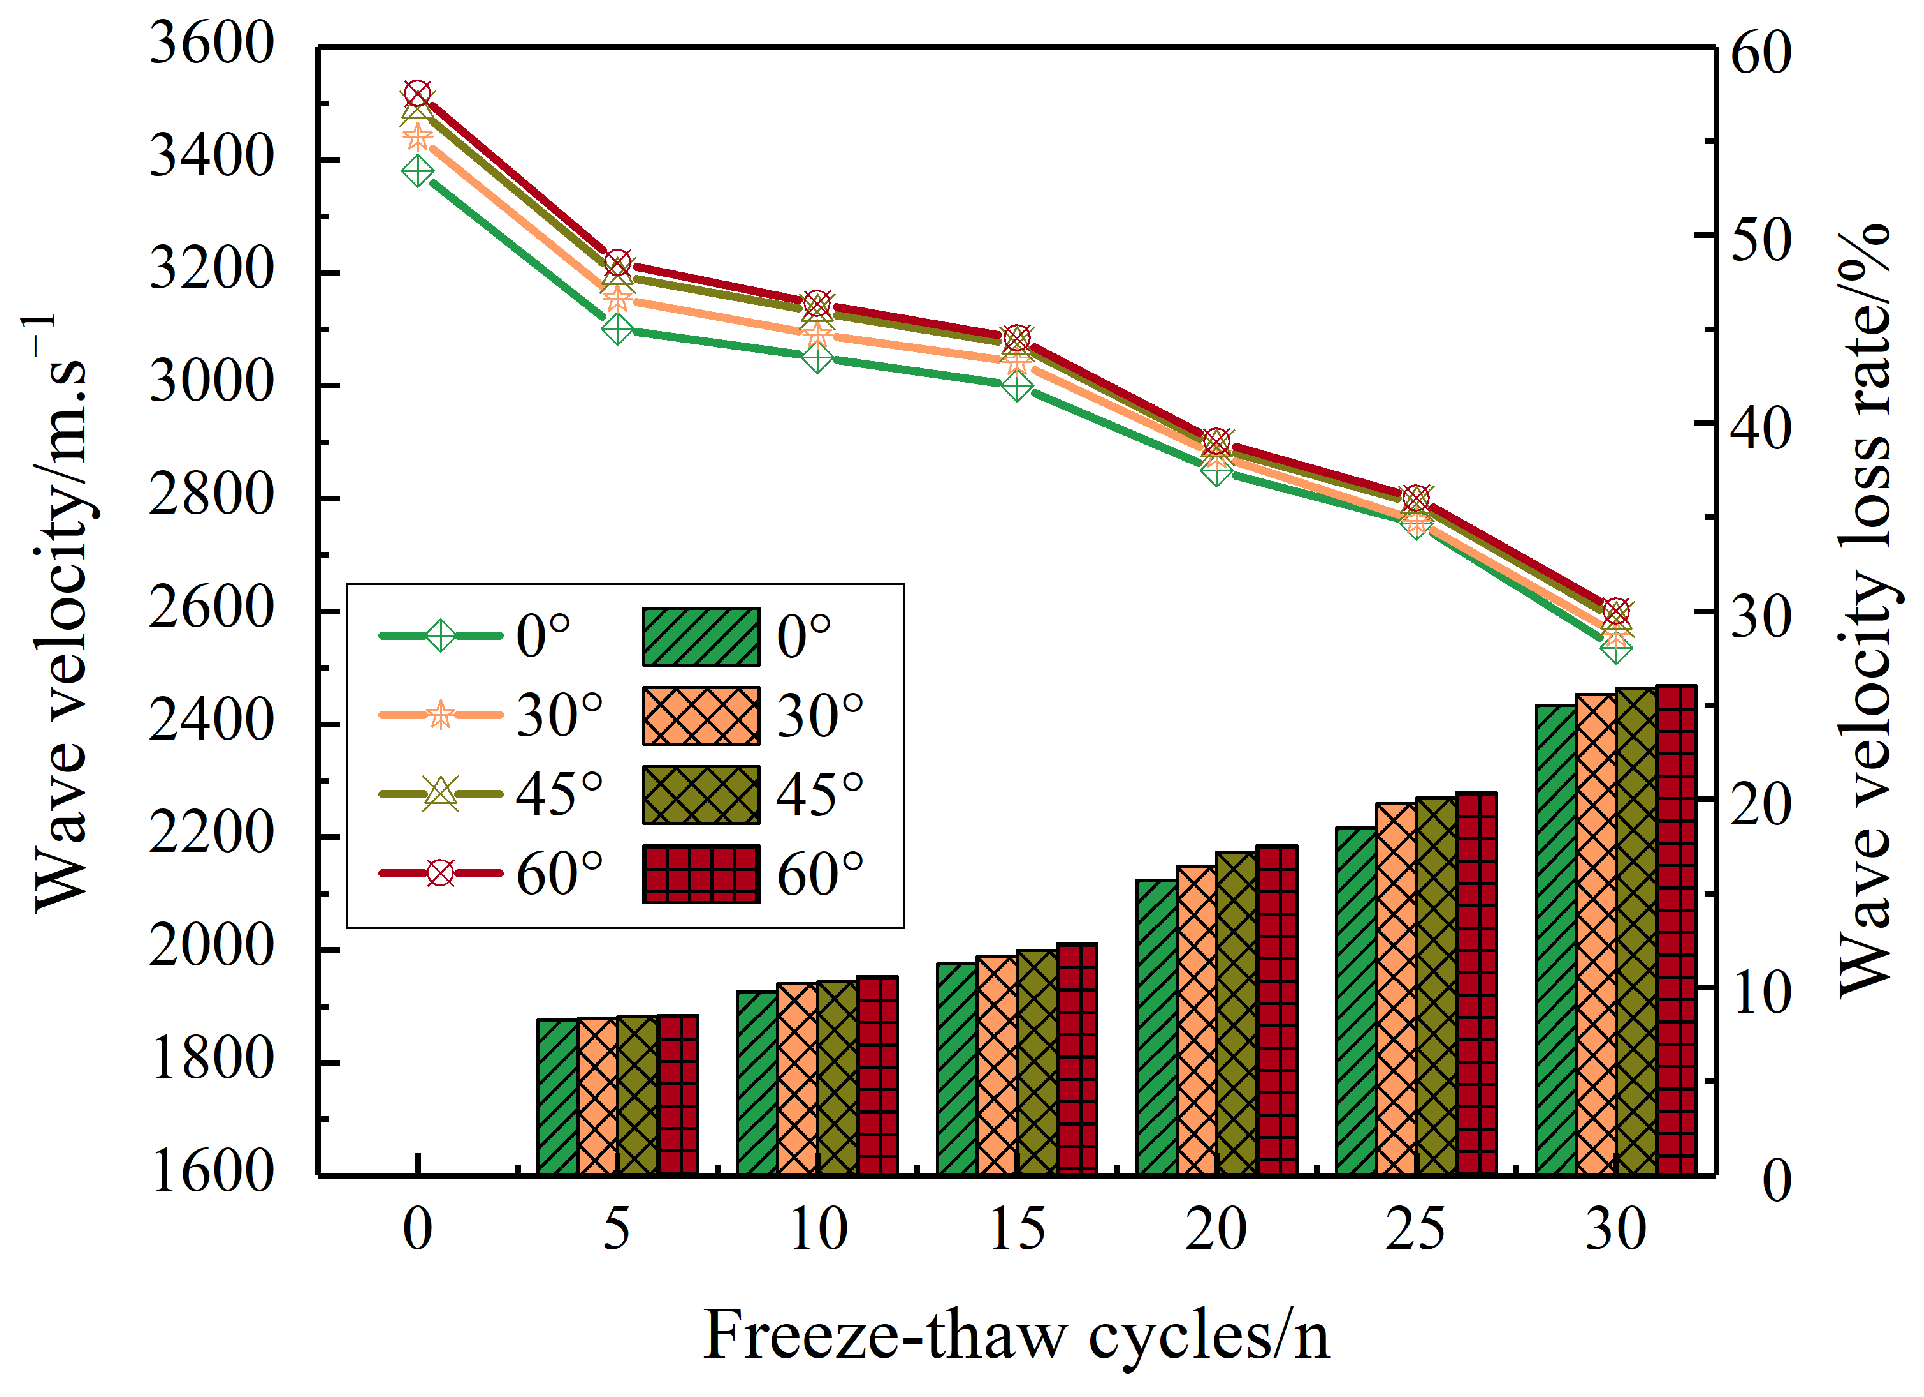
3.1.2. Wave Velocity

Wave velocity refers to the speed at which sound waves propagate through the grouting reinforcement body, offering valuable insight into the internal structure and density of the material. This information is essential for evaluating its mechanical properties and suitability for engineering applications. The wave velocity loss of grouted solids, measured before and after freeze–thaw cycles, serves as an indicator of the internal structural changes occurring within the material during these cycles. Wave velocity loss is commonly expressed as the wave velocity loss rate, which is calculated using the following Equation:
K v = v 0 v n v 0 × 100 %
where K v is wave velocity loss rate (%), v 0 denotes the wave velocity before freezing and thawing (g), and v n is the wave velocity after n freeze–thaw cycles (g) for n = 5, 10, 15, 20, 25, 30.
Figure 14 illustrates the longitudinal wave velocity and wave velocity loss rate of the grouting reinforcement body as the number of freeze–thaw cycles increases. The figure reveals that the trend in wave velocity loss across grouting reinforcement bodies with varying crack dip angles follows a generally consistent pattern. As the number of freeze–thaw cycles increases, the wave velocity of the grouting reinforcement body decreases, while the wave velocity loss rate correspondingly rises. A rapid decline in wave velocity occurs after 15 freeze–thaw cycles, with the wave velocity loss rate exceeding 25% after 30 cycles. This phenomenon occurs because, during the freeze–thaw cycles, internal pores are continuously subjected to water migration and frost heaving forces, causing both the expansion of existing pores and cracks and the formation of new ones. As waves pass through these pores and cracks, refraction, reflection, and energy dissipation occur, leading to a reduction in wave velocity. Consequently, as the number of pores and cracks increases, the loss rate of longitudinal wave velocity also increases.

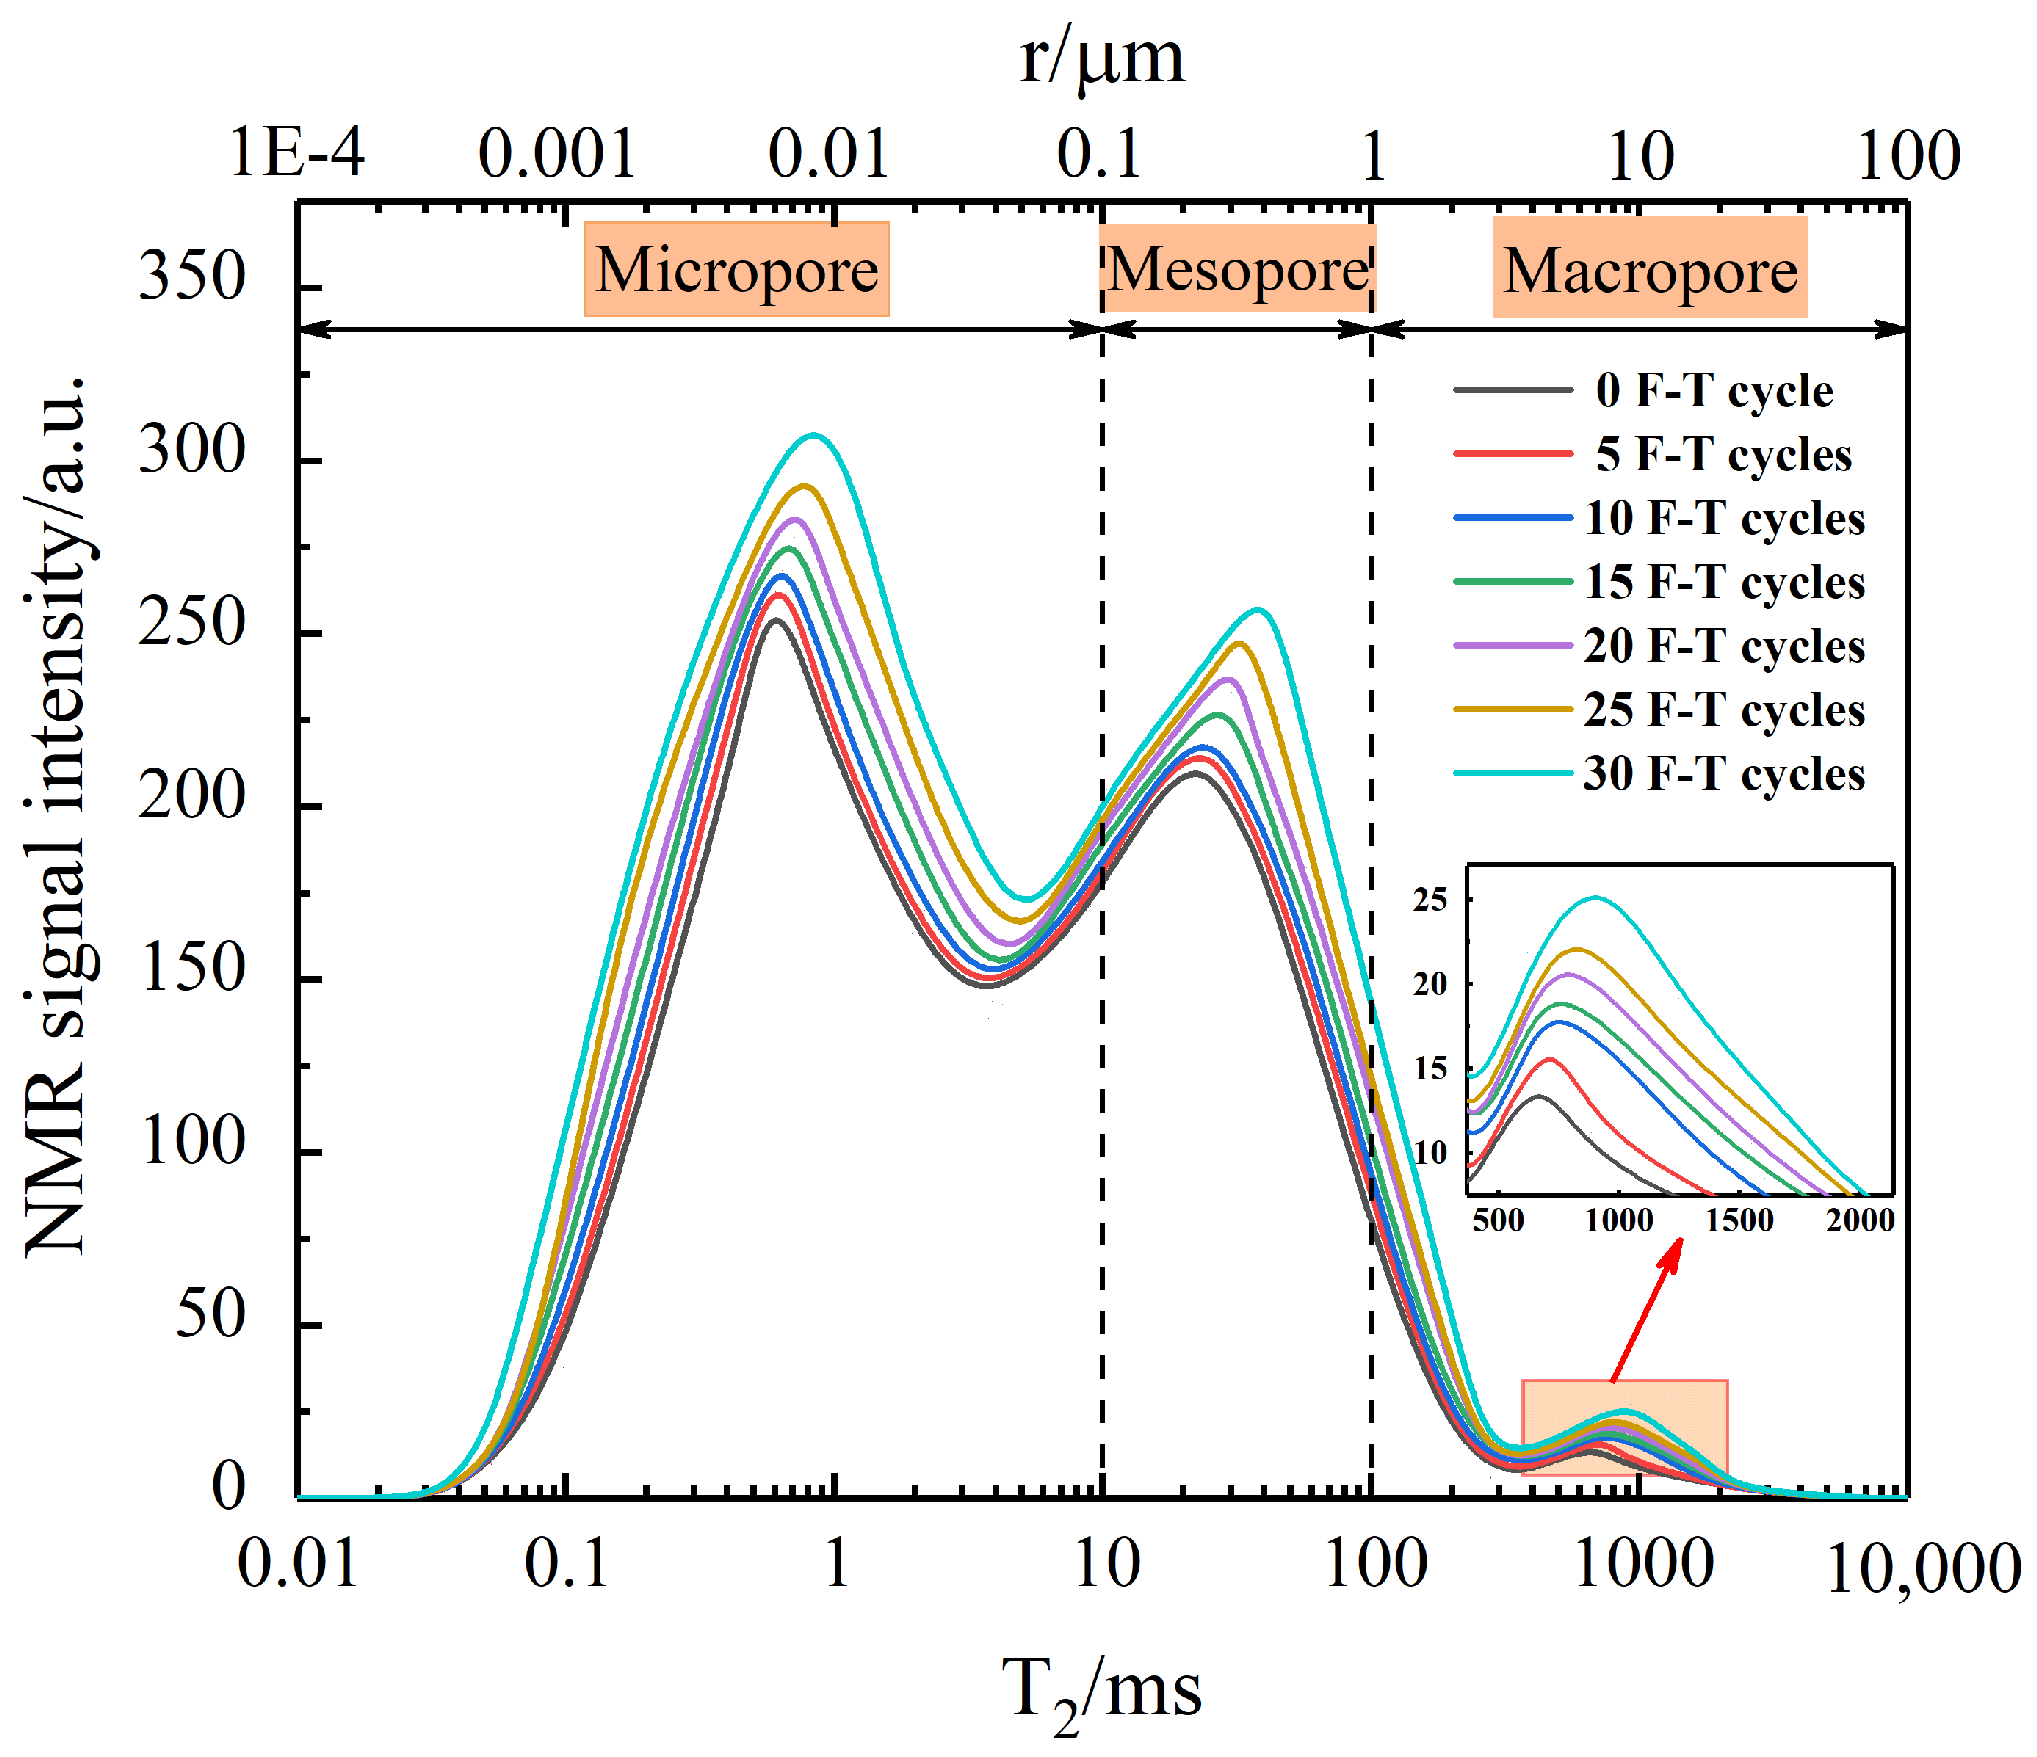
3.2. Microscopic Pore Characteristics

Nuclear magnetic resonance (NMR) tests were conducted on the grouting reinforcement body subjected to varying numbers of freeze–thaw cycles. The test results indicated that the T2 spectrum curves of grouting reinforcement bodies with different crack dip angles exhibited minimal differences after undergoing freeze–thaw cycles. This similarity can be attributed to the fact that aside from differences in crack dip angles and slurry stone volumes, the grouting reinforcement body is primarily composed of red sandstone, which experiences similar freeze–thaw deterioration. Furthermore, the slurry stone volume constitutes only a small portion of the overall grouting reinforcement body volume. As a result, the overall microscopic pore characteristics of the slurry stones with varying crack dip angles remain relatively consistent. Figure 15 presents the T2 map of the sample after freeze–thaw cycles with a crack dip angle of 30°, where the upper axis represents the converted pore radius. This figure also reflects the pore evolution characteristics of the grouting reinforcement bodies for all four crack dip angles.
As illustrated in Figure 15: (1) During the first 30 cycles of freeze–thaw, the NMR signal intensity of the grouting reinforcement body sample exhibited a progressive increase, indicating the continuous development of internal pores and a corresponding expansion in porosity; (2) the T2 spectra of the sample reveal three distinct peaks. The first peak, spanning T2 values from 0.01–5 ms, corresponds to pore sizes of 0.001–0.05 μm, indicative of microporous structures. The second peak, predominantly spanning T2 values between 5–350 ms, corresponds to pore sizes of 0.05–3.5 μm, primarily indicating mesoporous structures, with minor contributions from both micropores and macropores. The third peak, characterized by T2 values between 350–10,000 ms, corresponds to pore sizes ranging from 3.5–100 μm, indicative of macroporous structures; (3) as the number of freeze–thaw cycles increases, the T2 spectra of the specimen exhibit a noticeable upward growth, with the intensity of the NMR signal’s three peaks rising accordingly, reflecting an expansion in the peak area. Moreover, as the freeze–thaw cycles progress, the three peaks display a distinct rightward shift, characterized by three pore transition phenomena: the increase of micropores transitioning to mesopores, the increase in mesopores shifting toward macropores, and the continuous increase in macropores. These observations indicate the overall deterioration of the sample under repeated freeze–thaw action, with an increase in internal pores and expansion of pore sizes.
To quantitatively elucidate the evolution of micropore characteristics in the grouting reinforcement body during freeze–thaw cycles, the sample with a 30° crack dip angle was taken as a representative case to calculate the T2 spectra areas for micropores, mesopores, and macropores under varying freeze–thaw conditions. The corresponding results are presented in Table 4. The nuclear magnetic resonance (NMR) T2 spectra area is calculated by integrating the ordinates of all points along the T2 curve, and its magnitude is positively correlated with both the pore number and size in the sample. Consequently, the variation in the T2 spectra area directly reflects the evolution of pore characteristics within the sample.
To investigate the evolutionary patterns of pore sizes in the grouting reinforcement body, the variations in T2 spectral areas and pore proportions of micropores, mesopores, and macropores under different freeze–thaw cycles are plotted and analyzed, as depicted in Figure 16. At 0 freeze–thaw cycles, the T2 spectral areas for micropores, mesopores, and macropores are 9931.66 a.u., 3053.76 a.u., and 220.48 a.u., respectively. The micropores exhibit the largest proportion at 75.21%, followed by mesopores at 23.12%, and macropores constituting the smallest fraction at 1.67%, suggesting the presence of initial cracks in the grouting reinforcement body, predominantly microcracks and micropores.
With the increase in freeze–thaw cycles, the proportions of micropores, mesopores, and macropores all increase, but the evolution of these three pore types shows differences. While the number of micropores continues to rise, their proportion in the total T2 spectral area gradually decreases. After 30 freeze–thaw cycles, the proportion of micropores reached 53.73%, signifying an increase in micropores alongside their transition into mesopores and macropores. At 20, 25, and 30 freeze–thaw cycles, the mesopore proportions were 30.91%, 32.39%, and 32.22%, respectively, exhibiting an initial increase followed by a slight decline. This indicates that mesopores increase consistently during the initial stages of freeze–thaw cycles. This growth is attributed partly to the increase in initial mesopores and partly to the transformation of micropores into mesopores. In the later stages of the freeze–thaw cycle, the proportion of mesopores first increases gradually and then begins to decline. This decline is attributed to intensified freeze–thaw damage, which accelerates the transition of mesopores to macropores, thereby reducing the proportion of mesopores. The proportion of macropores increases with the number of freeze–thaw cycles, exhibiting slow growth during the early stages (0–15 cycles) and rapid growth in the later stages (20–30 cycles). After 30 freeze–thaw cycles, the proportion of macropores reached 14.05%.

3.3. Mechanical Properties

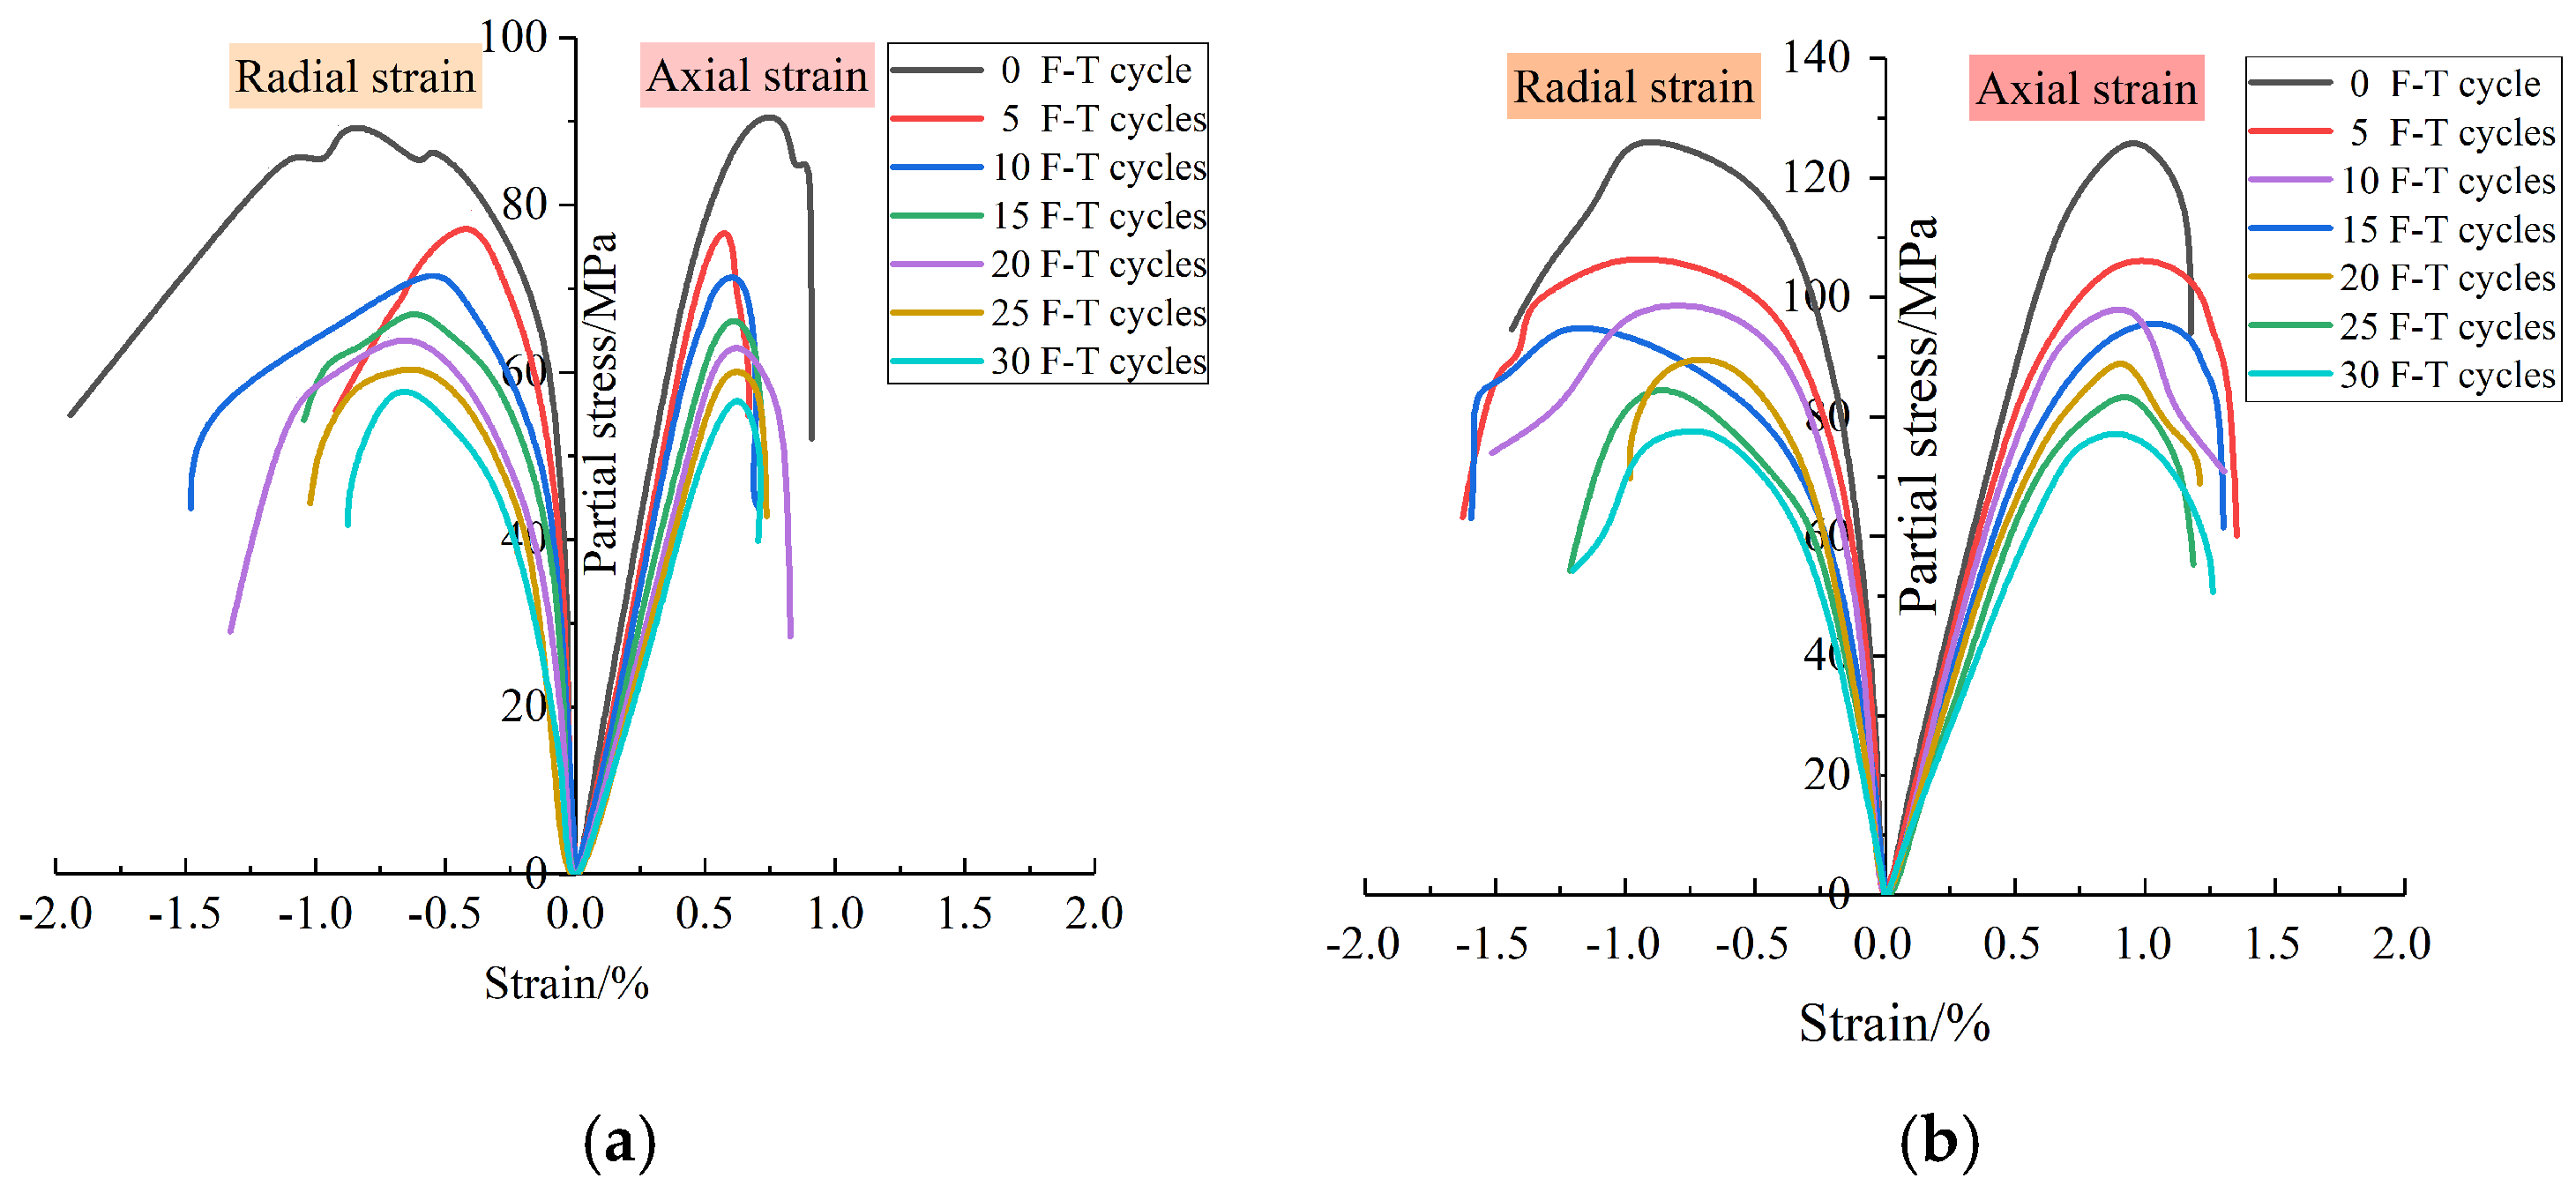
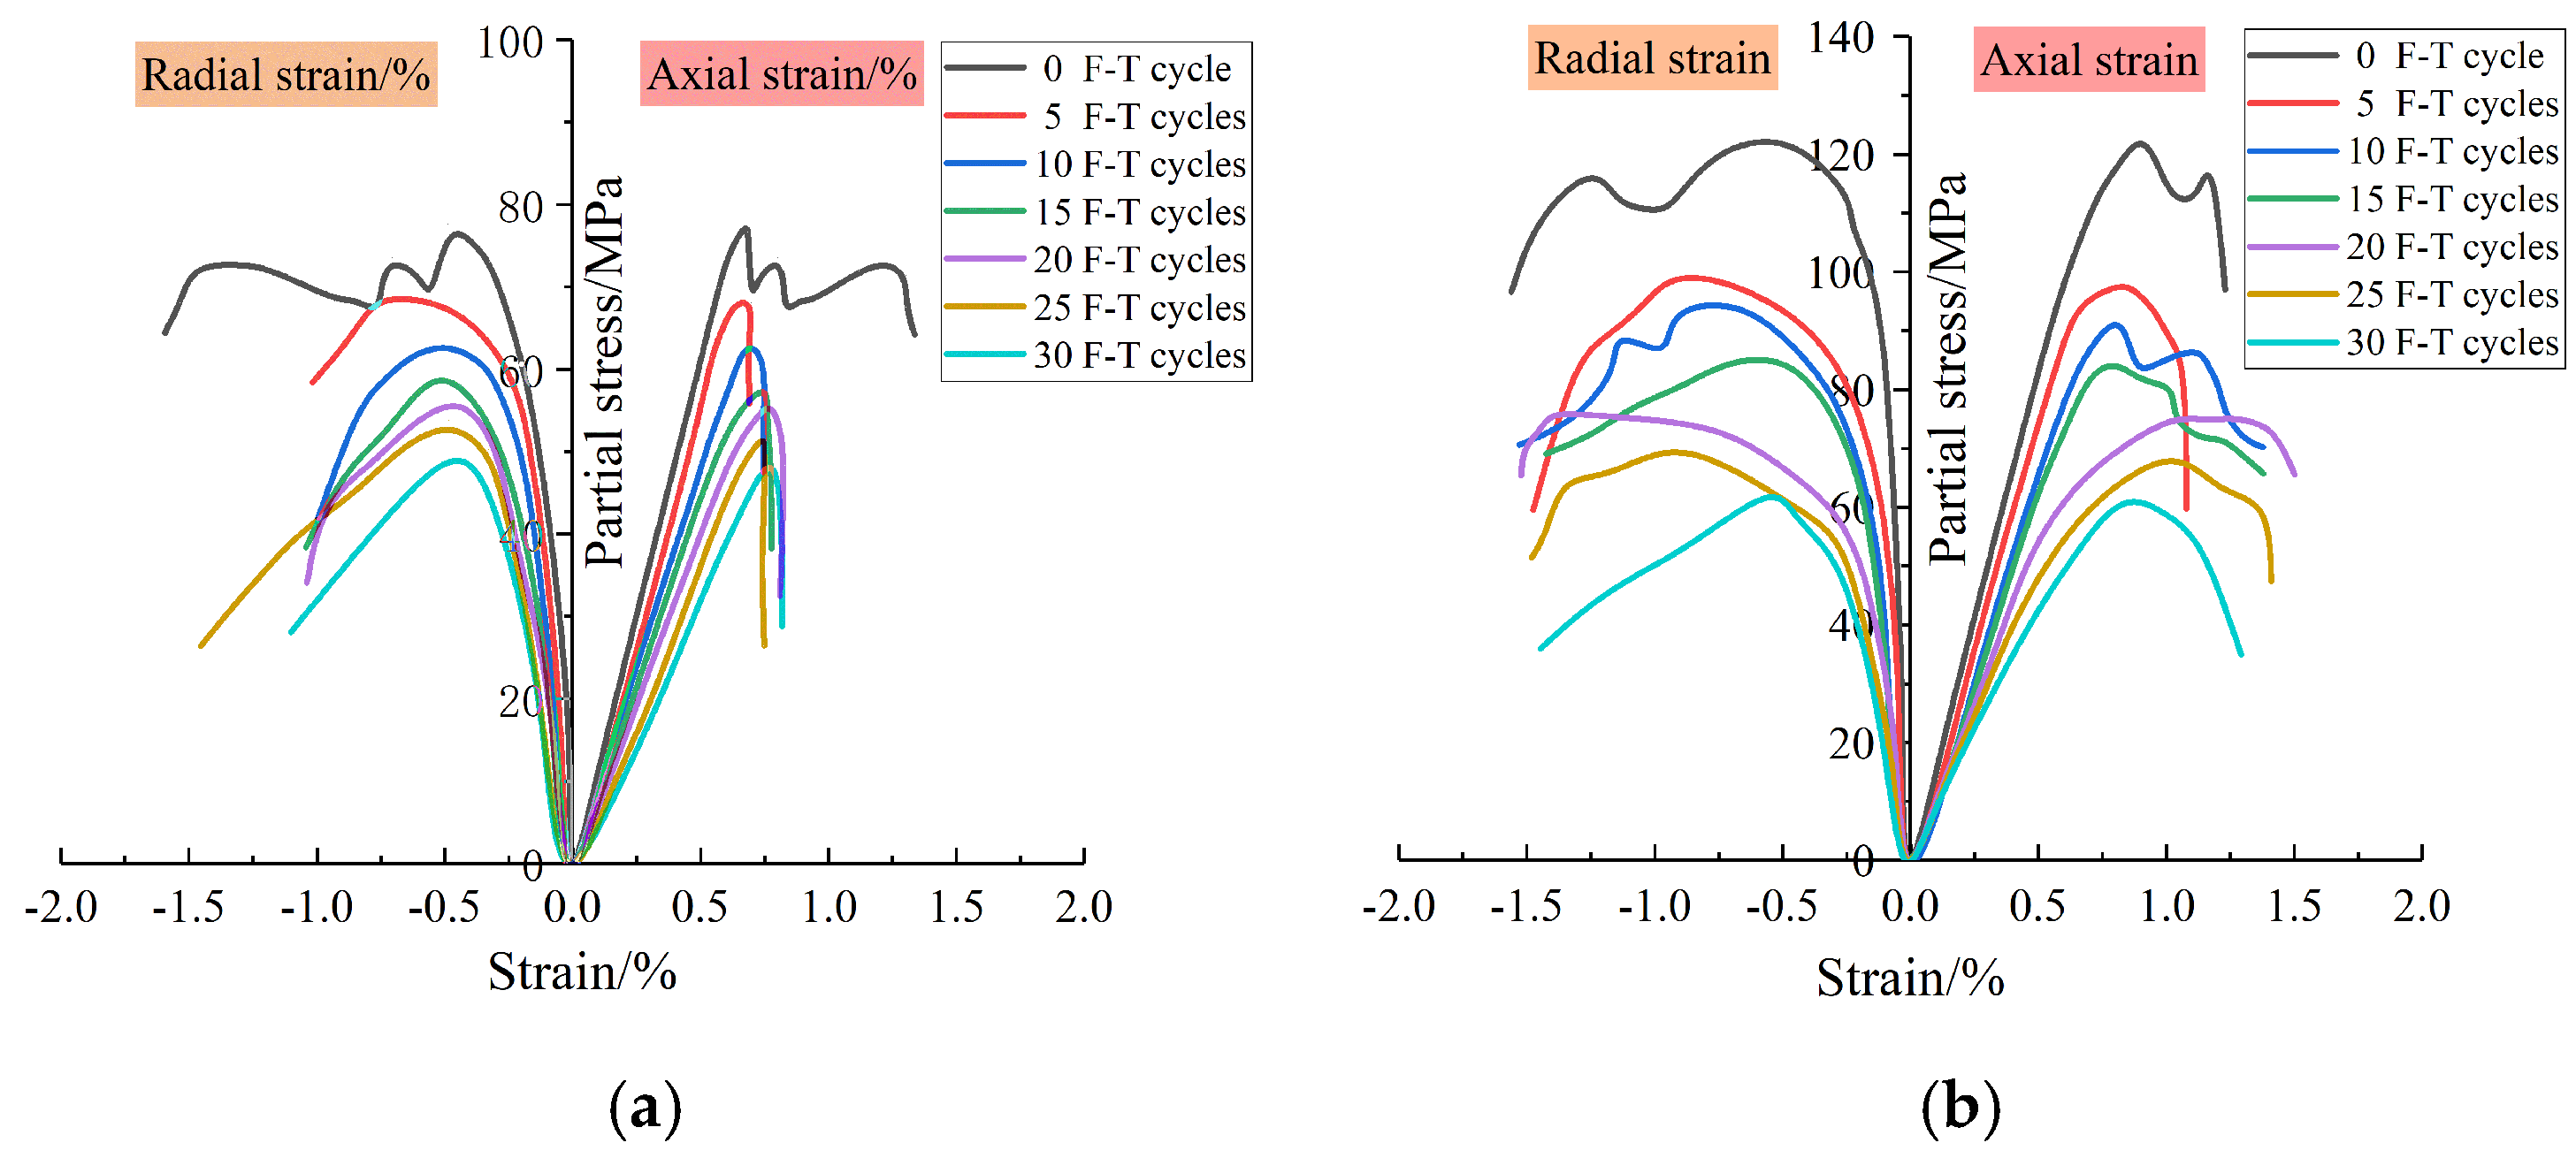
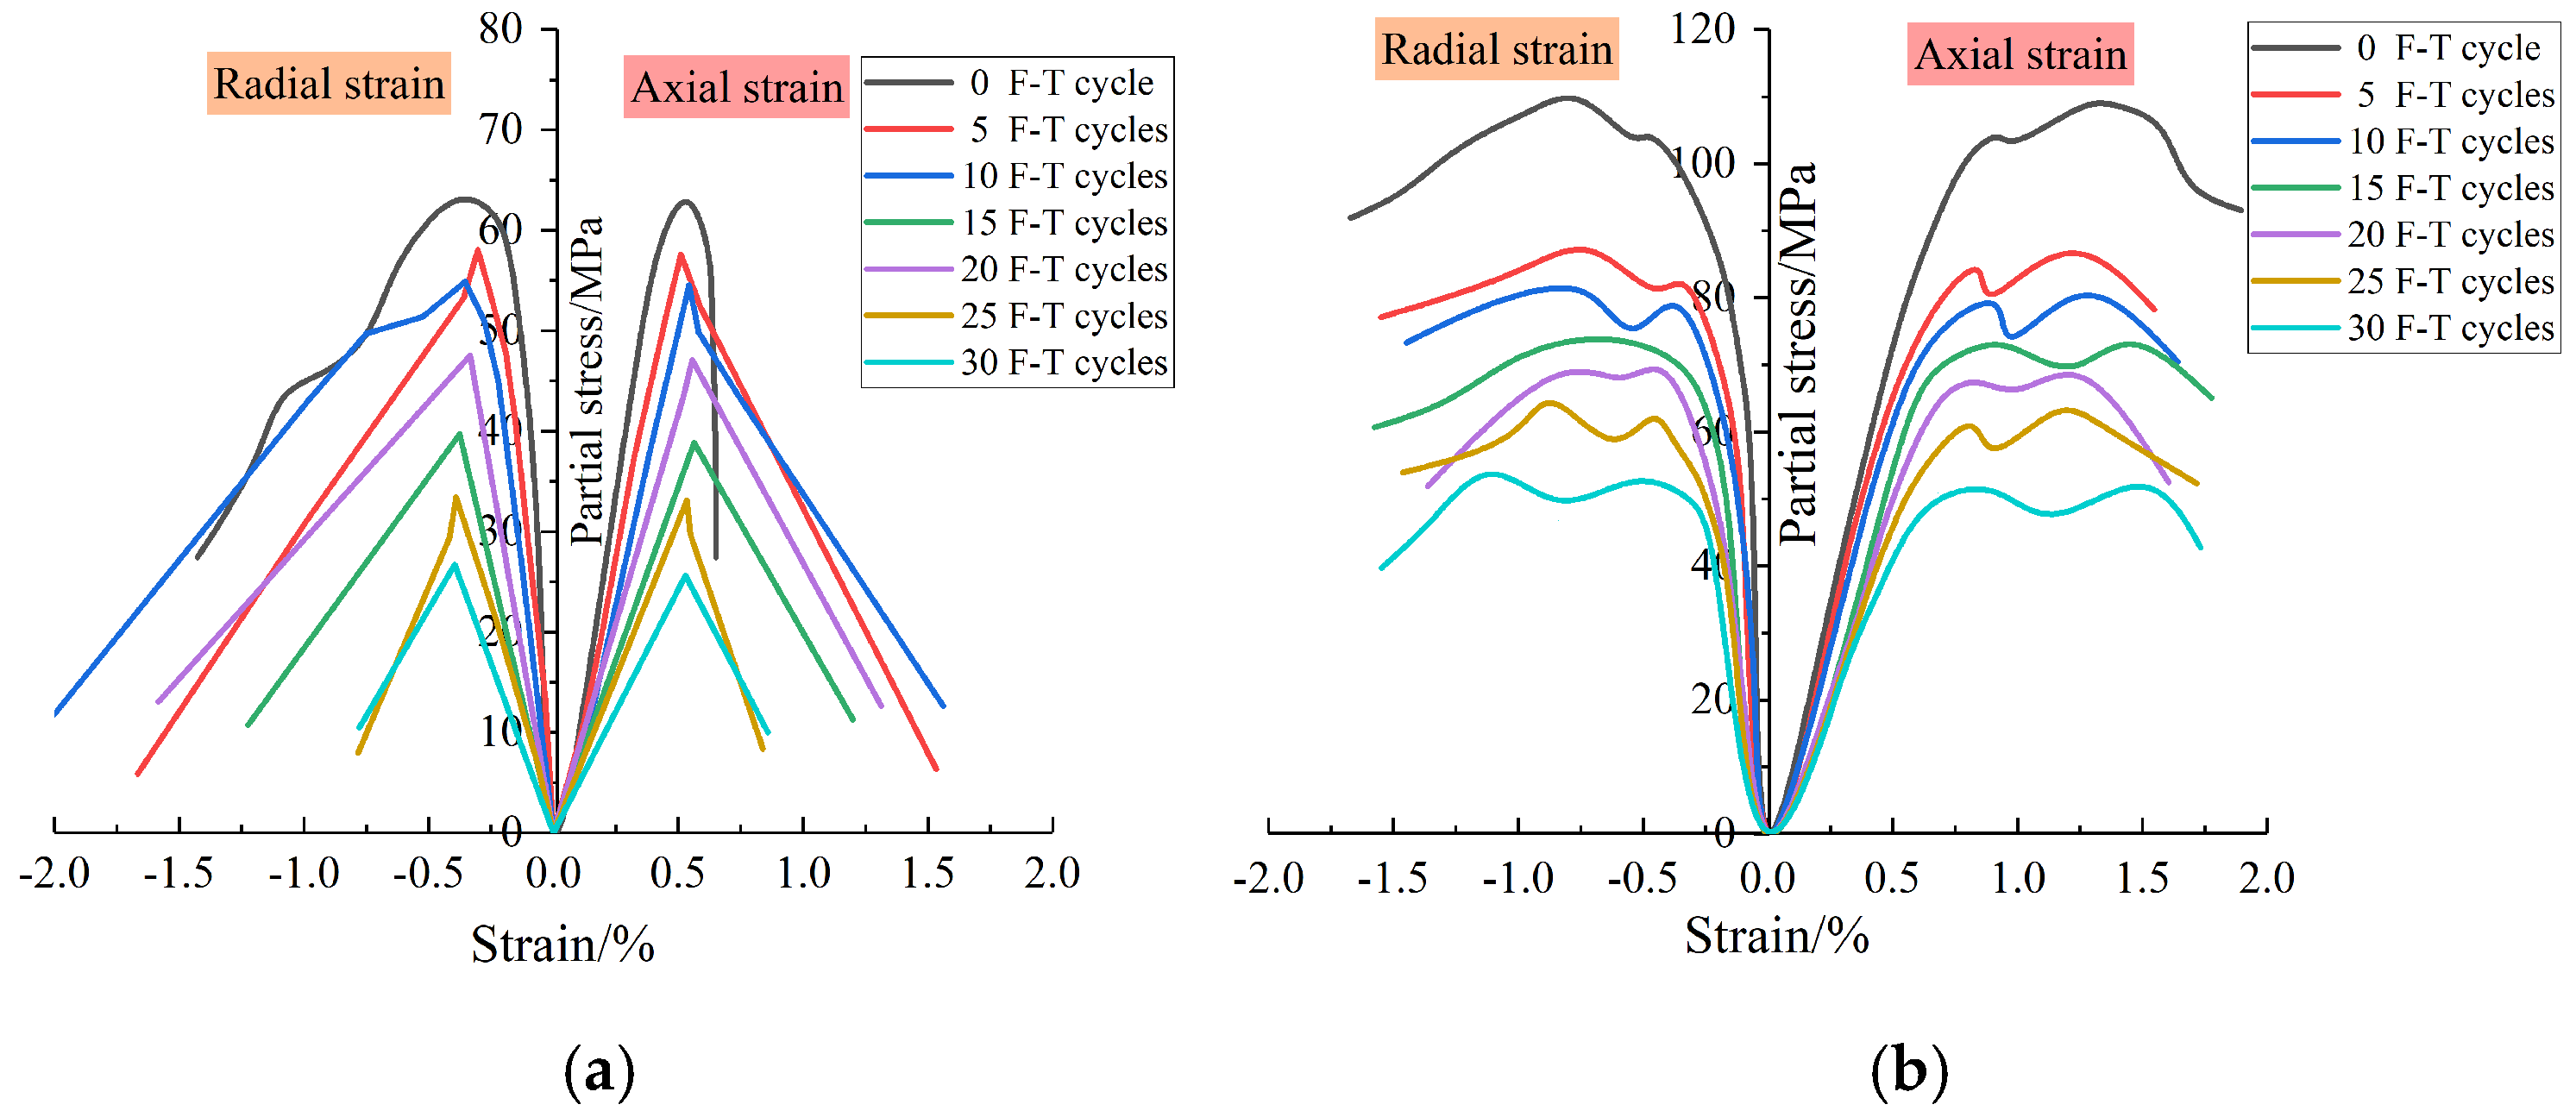
3.3.1. Stress–Strain Curve

Following water saturation and freeze–thaw cycles, grouting reinforcement bodies with varying crack dip angles were subjected to uniaxial and triaxial compression testing. The analysis of the experimental data revealed a significant influence of crack dip angle, confining pressure, and freeze–thaw cycles on the stress–strain behavior of the grouting reinforcement body. To explore the effect of these factors, the stress–strain relationship curves for grouting reinforcement bodies with different crack dip angles were analyzed under confining pressures of 3 MPa and 9 MPa.
As shown in Figure 17, when the crack dip angle is 0° and the confining pressure is set at 3 MPa and 9 MPa, the stress–strain curve of the grouting reinforcement body closely resembles that of intact red sandstone. The primary deformation characteristics of the grouting reinforcement body, under varying confining pressure conditions, can be divided into five distinct stages: (1) Compaction stage: In the initial loading stage, the axial stress–strain curve of the grouting reinforcement body exhibits a mildly concave trend. As the axial stress gradually increases, the original micropores and cracks within the sample progressively close, leading to compaction. This follows a nonlinear concave pattern, while the radial strain remains minimal, with overall behavior dominated by compressive deformation; (2) Transition from elastic deformation to stable propagation of micro-elastic cracks: This stage is visible in the curve, where the axial stress–strain relationship follows an approximately linear trajectory; (3) stable propagation of micro-elastic cracks: The curve deviates from the previous linear path, showing slight nonlinear deformation. Micro-cracks begin to form within the grouting reinforcement body, marking the onset of irreversible deformation; (4) unstable fracture propagation: As axial stress intensifies, micro-cracks propagate and accumulate, causing the grouting reinforcement body to transition from elasticity to plasticity. The accumulation of micro-cracks at various locations leads to peak strength and eventual catastrophic failure. During this stage, radial strain increases rapidly, with the grouting reinforcement body displaying pronounced shear dilation behavior; (5) post-peak fracture stage: After reaching peak strength, the internal structure of the grouting reinforcement body is compromised, and fracture behavior extends beyond micro-crack expansion. With continued axial pressure, cracks within the sample propagate rapidly, forming an interconnected macroscopic fracture surface. The deformation of the sample is characterized by sliding along this macroscopic fracture surface, resulting in a rapid decline in load-bearing capacity, a sharp drop in axial stress, and the occurrence of a significant brittle fracture, accompanied by an audible cracking sound.
The failure characteristics of the grouting reinforcement body under varying freeze–thaw cycles during the triaxial compression test were analyzed. As shown in Figure 17, with an increase in freeze–thaw cycles, the concavity of the compaction stage curve slightly increases, and the duration of the compaction stage is extended. The slope of the nearly linear stress–strain curve in the elastic deformation phase decreases, and the phase gradually shortens. The peak strength of the sample decreases, the brittle characteristics weaken, and the plastic characteristics enhance.
Figure 17a,b demonstrate that confining pressure has a pronounced effect on the stress–strain curve of the grouting reinforcement body. As confining pressure increases, both the peak stress of the grouted reinforcement and the slope of the elastic deformation stage curve rise notably. Additionally, with increasing confining pressure, the strain at failure for the grouted reinforcement exhibits a substantial increase. This effect arises because confining pressure facilitates the closure of internal cracks within the sample, thereby enhancing its plastic deformation capacity.
Figure 18 presents the stress–strain curves of the grouting reinforcement body with a 30° crack dip angle subjected to various freeze–thaw cycles under confining pressures of 3 MPa and 9 MPa. The stress–strain curves of grouting reinforcement bodies with 30° and 0° crack dip angles exhibit no significant differences from the compaction stage through the elastic and unstable extension stages. However, noticeable differences arise in the post-peak strength region. In Figure 18a, multiple peaks are observed following the peak strength in the stress–strain curve of the grouting reinforcement body subjected to 0 freeze–thaw cycles. This phenomenon is attributed to the confining pressure restricting slippage along the fracture surface, allowing the sample to continue bearing a portion of the axial stress. In the same figure, the stress–strain curve of the grouting reinforcement body after undergoing freeze–thaw cycles is similar to that of the sample with a 0° crack dip angle under a 3 MPa confining pressure. After reaching peak strength, the axial stress decreases rapidly, leading to brittle fracture. This behavior is attributed to the weakening effect of freeze–thaw cycles on the confining pressure, which alters the internal pore structure of the rock and diminishes the cohesive forces between internal particles. The stress–strain curves in Figure 18b show significant differences compared to those in Figure 18a. Notably, after reaching peak strength, the stress does not sharply decline, and the sample does not experience immediate brittle failure. This behavior is observed because these samples are subjected to triaxial compression under a high confining pressure of 9 MPa, where the weakening effect of freeze–thaw cycles on the confining pressure is not as pronounced.
Figure 19 presents the stress–strain relationship curves for the grouting reinforcement body with a 45° crack dip angle, subjected to varying confining pressures and freeze–thaw cycles. As depicted in Figure 19a, under a confining pressure of 3 MPa, the stress–strain curve of the grouting reinforcement body reaches peak strength shortly after the elastic deformation phase, following a brief compaction stage. As axial strain increases, the axial stress rapidly decreases, leading to the brittle failure of the grouting reinforcement body. This behavior is attributed to the initial load being borne by both the grouting reinforcement body and the slurry–rock interface layer during axial loading. When the stress increases and reaches the shear strength of the slurry–rock interface layer, the rock block begins to slip along the fracture surface. Due to the low confining pressure, the restriction on rock block slippage is minimal, preventing the slip from being adequately controlled, which results in the observed curve.
As illustrated in Figure 19b, under a confining pressure of 9 MPa, the stress–strain curve of the grouting reinforcement body exhibits two distinct peaks. After each peak, the stress slightly decreases before gradually increasing with strain, demonstrating a trend of strain hardening. The first peak signifies the moment when the grouting reinforcement body reaches its compressive strength. However, due to the restraining effect of the confining pressure, slippage along the fracture surface is prevented, allowing the rock to continue bearing the axial stress, which leads to the formation of a second peak. In comparison to Figure 19a, the increased confining pressure significantly alters the stress–strain curve of the grouting reinforcement body and effectively limits the slippage of the rock block along the fracture surface.
Figure 20 presents the stress–strain relationship curves of the grouting reinforcement body with a 60° crack dip angle under varying confining pressures and freeze–thaw cycles. As depicted in the figure, regardless of whether the confining pressure is 3 MPa or 9 MPa, the stress–strain curve of the grouting reinforcement body does not exhibit a plastic deformation stage. Instead, the curves reveal that after reaching the peak, axial stress drops instantaneously. This behavior occurs because the stress reaches the shear strength of the slurry–rock interface layer, leading to shear slip failure along the fracture surface. Additionally, the large crack dip angle, combined with the smooth fracture surface, promotes slip shear failure along the extended fracture surface, even under high confining pressure.
In summary, the stress–strain curve of the grouting reinforcement body varies with changes in crack dip angle, confining pressure, and the number of freeze–thaw cycles. When the crack dip angle is 0°, 30°, or 45°, the grouted reinforcement exhibits clear plastic deformation and ductility following peak strength. At a crack dip angle of 60°, the stress–strain curve shows no plastic deformation stage, regardless of the confining pressure, and the axial stress drops instantaneously upon reaching its peak. The primary cause of this behavior is the stress surpassing the shear strength of the slurry–rock interface layer, leading to shear slip failure along the fracture planes of the rock block.
Moreover, the number of freeze–thaw cycles has a profound influence on the stress–strain behavior of the grouting reinforcement body. Under consistent crack dip angles and confining pressures, an increase in freeze–thaw cycles extends the compaction stage of the grouting reinforcement body, marginally enhances the curve’s concavity, shortens the elastic deformation stage, flattens the slope, and reduces peak strength. This phenomenon is predominantly attributed to the freeze–thaw damage sustained by the grouting reinforcement body following repeated freeze–thaw cycles. With temperature changes, the pore water in the sample continuously undergoes water–ice phase transitions. Under the influence of frost heaving forces, internal pores progressively expand and interconnect, leading to a gradual increase in their volume and size within the sample. During the thawing process, the deformation of internal pores in the rock becomes irreversible, and mineral components precipitate due to water erosion, weakening the cohesive forces between internal particles. Consequently, the internal structure degrades after multiple freeze–thaw cycles.

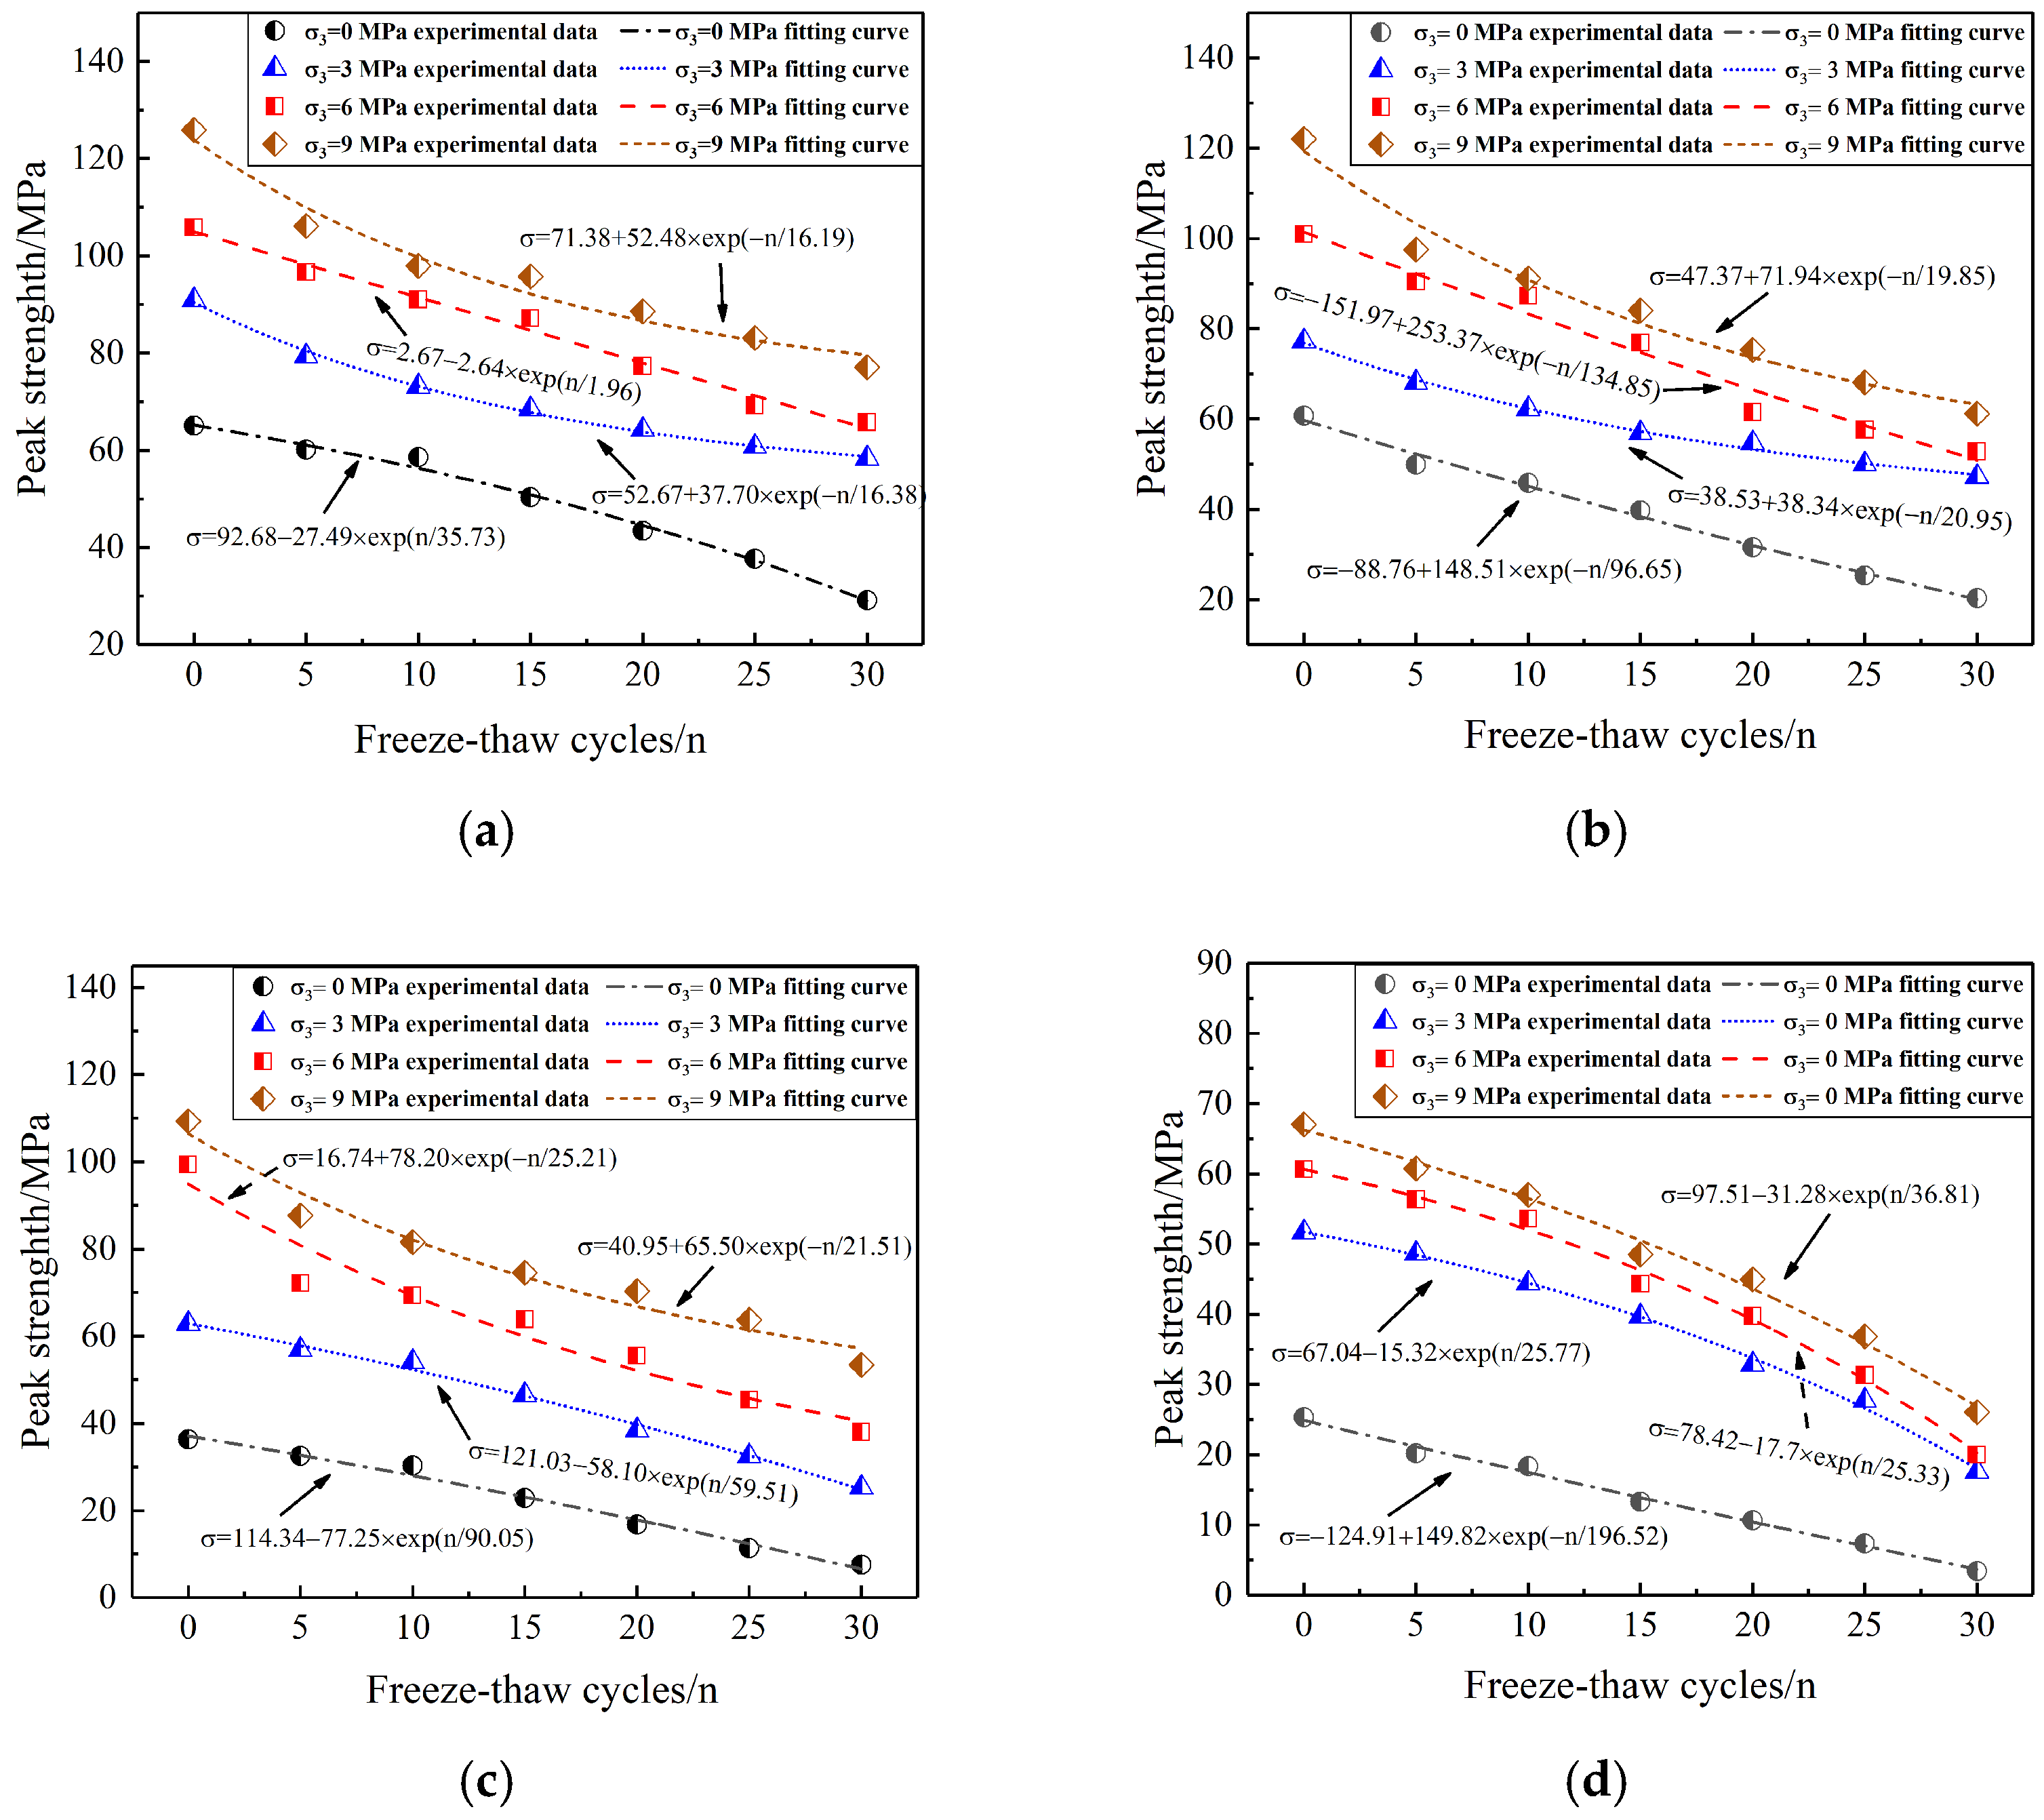
3.3.2. Peak Strength

The triaxial compressive strength of the grouting reinforcement body is a critical parameter for assessing its engineering characteristics, reflecting its maximum bearing capacity under various practical engineering conditions. Variations in the triaxial compressive strength of the grouting reinforcement body following freeze–thaw cycles effectively indicate the extent of freeze–thaw damage, providing valuable reference points for the design and construction safety of geotechnical engineering in cold regions. The test results have been organized, and the effect of freeze–thaw cycles on the peak strength of the grouting reinforcement body is depicted in the curve shown in Figure 21.
As shown in Figure 21, the peak strength of grouting reinforcement bodies with different crack dip angles follows a largely consistent variation pattern as the number of freeze–thaw cycles increases. As the number of freeze–thaw cycles increases, the peak strength of the grouting reinforcement body decreases, with the rate of decline progressively accelerating. This trend is consistent with a negative exponential function. The relationship between peak strength and freeze–thaw cycles for the grouting reinforcement body, under varying confining pressures, is individually fitted to a negative exponential function. The detailed fitting equations are provided in Figure 21, with correlation coefficients ranging from 0.94 to 0.99, indicating a strong fit.
As demonstrated in Figure 21, confining pressure significantly influences the peak strength of the grouting reinforcement body, with its impact becoming more pronounced as the crack dip angle increases. For example, the effect of confining pressure on peak strength is analyzed for a grouting reinforcement body with a 60° crack dip angle. As illustrated in Figure 21d, under the same number of freeze–thaw cycles, the peak strength of the grouting reinforcement body increases proportionally with rising confining pressure. Using 30 freeze–thaw cycles as a reference, compared to a sample with a confining pressure of 0 MPa, the peak strength increases by 410.32%, 479.13%, and 655.87% when the confining pressure is 3 MPa, 6 MPa, and 9 MPa, respectively.

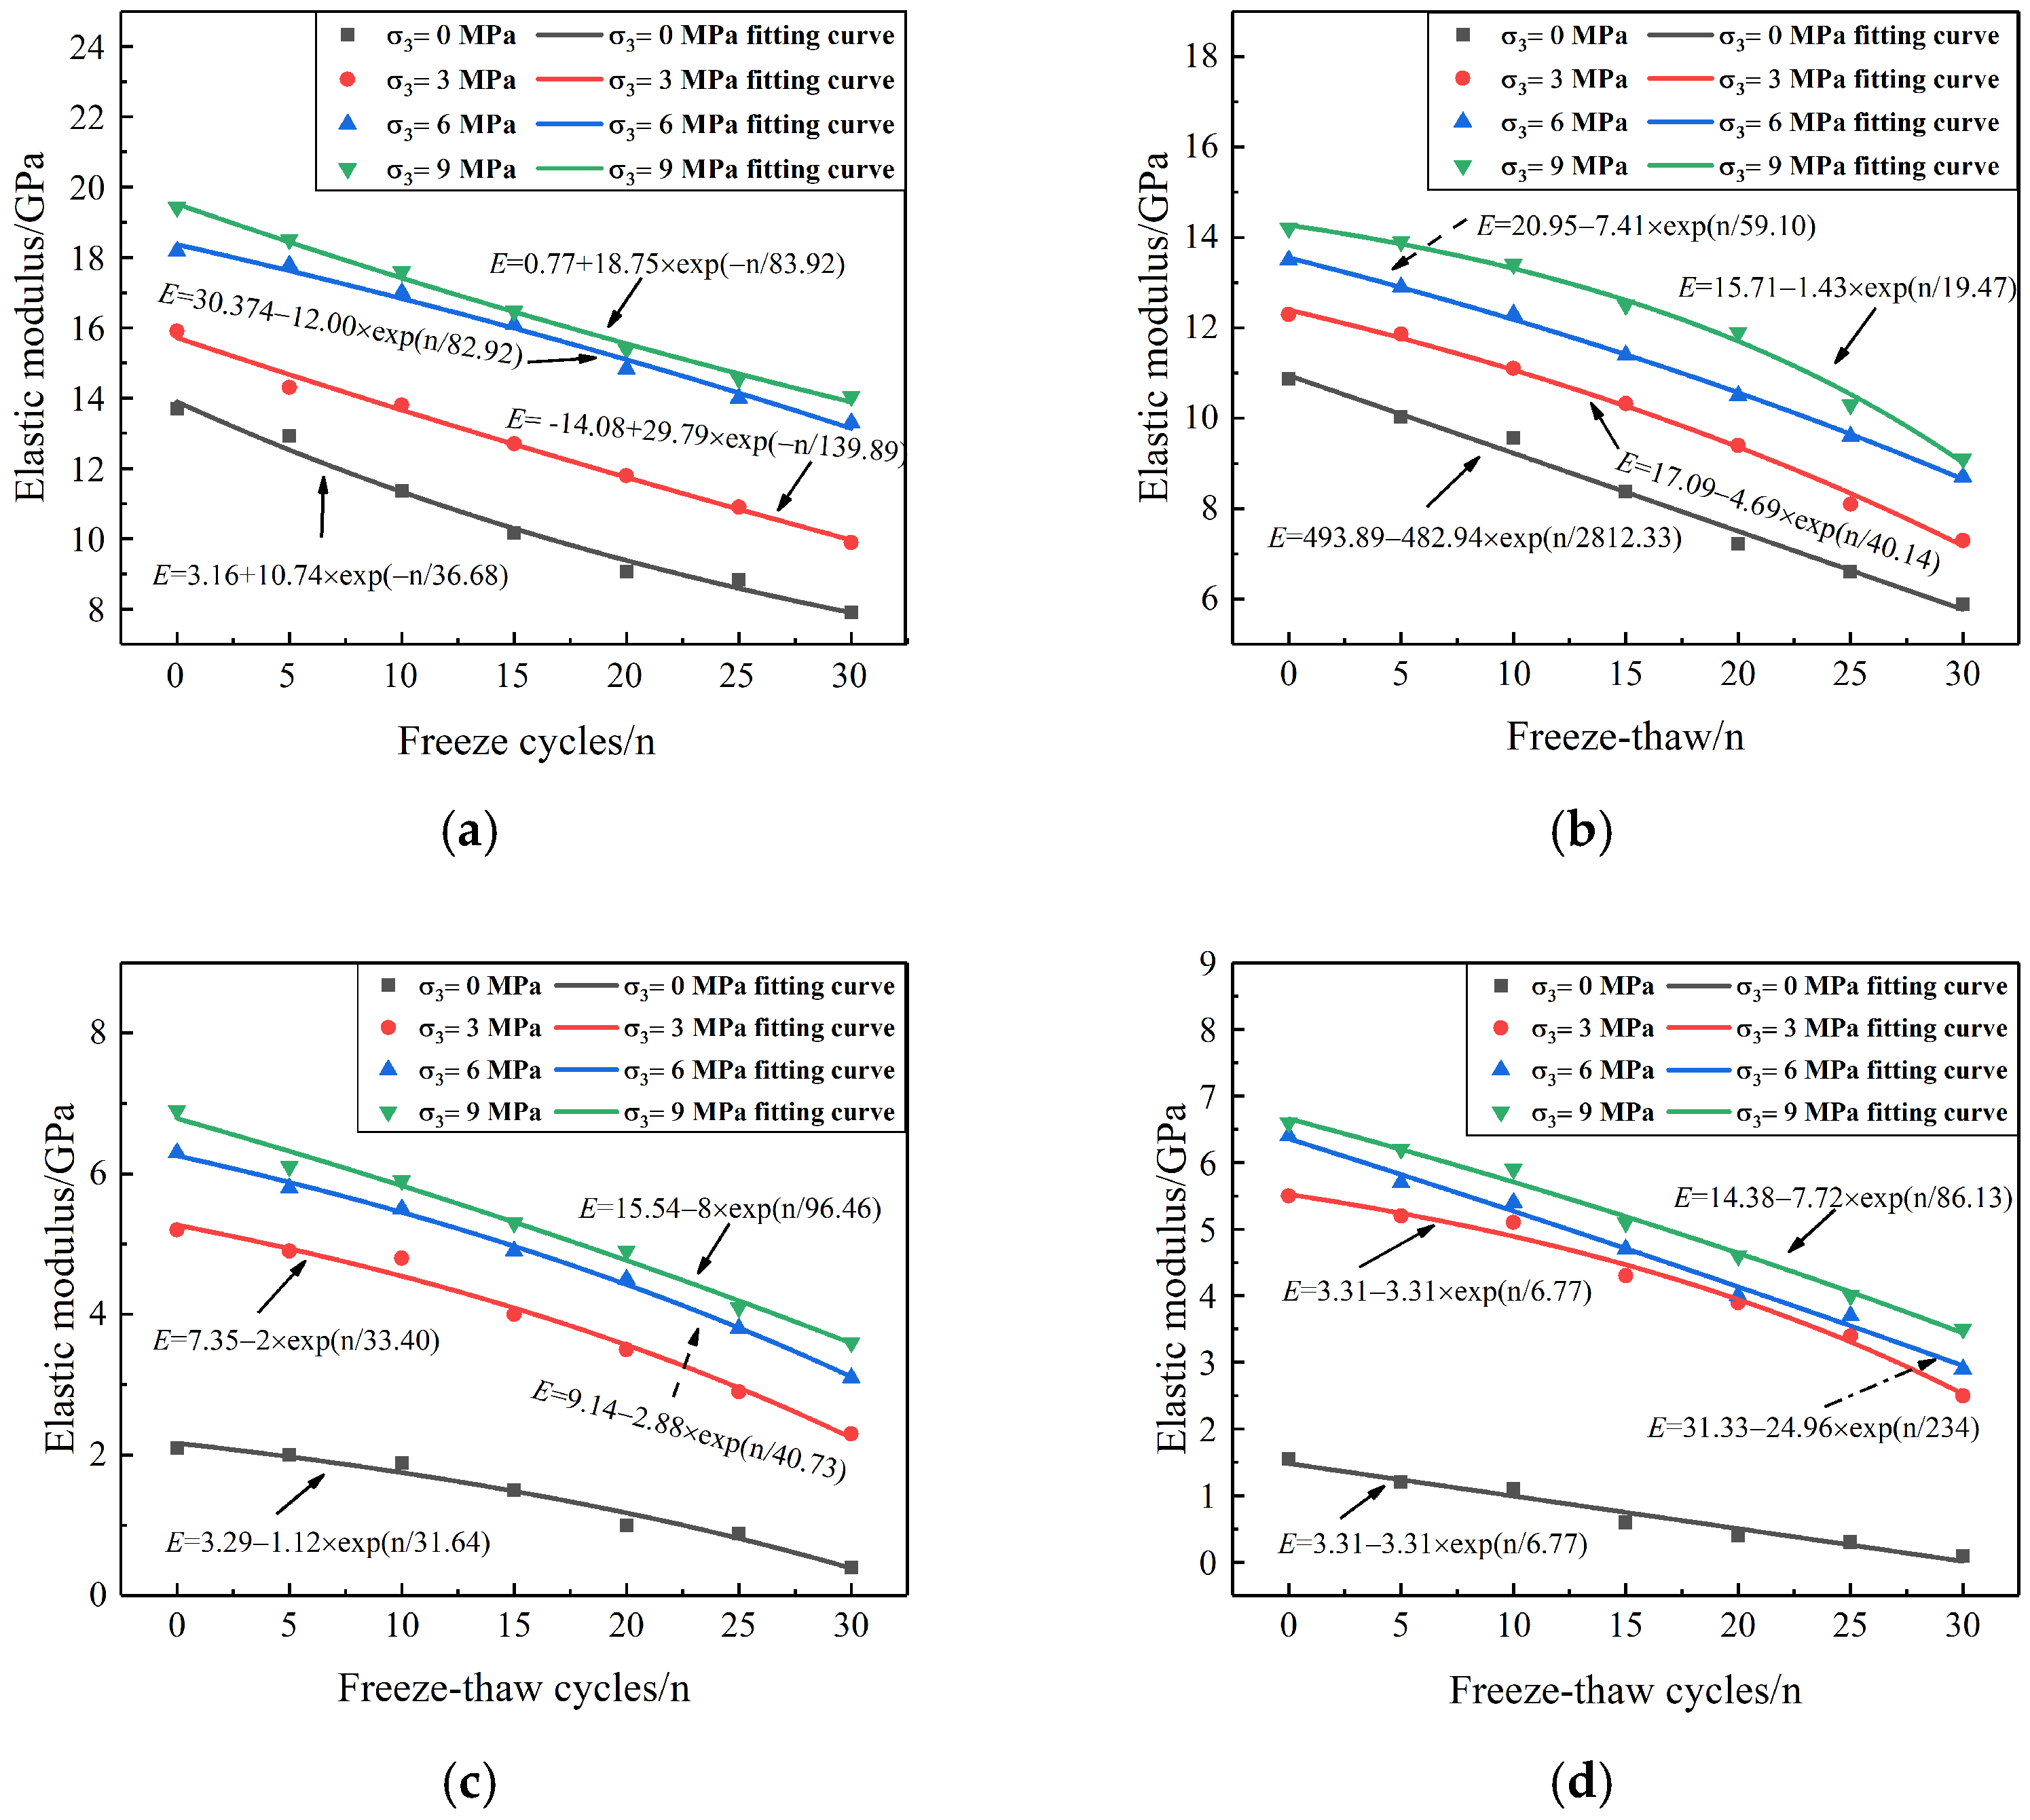
3.3.3. Elastic Modulus

The elastic modulus of the grouting reinforcement body defines its stiffness, specifically indicating the material’s resistance to deformation under applied loads. As such, it is a critical parameter in the analysis of mechanical properties. The elastic modulus is calculated by determining the slope of the linear segment in the elastic stage of the stress–strain curve for the sample using Equation (5):
E = σ a 2 σ a 1 ε a 2 ε a 1
where E is the elastic modulus of the grouted solid (GPa), σ a 1 is the stress value (MPa) at the initial point of the linear segment on the axial stress–strain curve, and σ a 2 is the stress value (MPa) at the endpoint of the same linear segment. Similarly, ε a 1 and ε a 2 correspond to the axial strain values at these stress points, respectively.
The elastic modulus of each sample was calculated, and the results were organized. The influence of freeze–thaw cycles on the elastic modulus of the grouting reinforcement body is shown in the curve plotted in Figure 22.
As shown in Figure 22, the elastic modulus of grouting reinforcement bodies, across various crack dip angles and confining pressures, exhibits a consistent trend as the number of freeze–thaw cycles increases. Specifically, the elastic modulus decreases with an increasing number of freeze–thaw cycles, with the rate of decline progressively accelerating. This behavior follows a negative exponential function. The relationship between the elastic modulus and freeze–thaw cycles of grouting reinforcement bodies under varying confining pressures is fitted using a negative exponential function, as detailed in Figure 22. The correlation coefficients for the fitting range from 0.92 to 0.99, indicating a strong fit.
Figure 22 also demonstrates that both crack dip angle and confining pressure significantly influence the elastic modulus of the grouting reinforcement body. For the same crack dip angle and the same number of freeze–thaw cycles, the elastic modulus increases with rising confining pressure, with the most pronounced effects observed at 45° and 60° crack dip angles. The elastic modulus of samples subjected to confining pressure is notably different from those without confining pressure. This difference arises because, in the absence of confining pressure, shear slip failure occurs directly along the fracture surface once the stress on the grouting reinforcement body reaches the shear strength of the slurry–rock interface layer. However, when confining pressure is applied, the slip of the rock block is restricted, which enhances both the compressive and deformation capacities of the sample, ultimately increasing its elastic modulus.

3.3.4. Shear Strength Parameters

Investigating shear strength parameters is essential for understanding the mechanical behavior and failure mechanisms of grouting reinforcement bodies. The internal friction angle and cohesion are the two primary parameters that govern shear strength, collectively determining the stability and deformation characteristics of the sample under shear stress. The internal friction angle reflects the resistance to relative motion between rock particles, while cohesion represents the bonding strength between them. Analyzing these parameters allows for a comprehensive discussion of the mechanical properties of the grouting reinforcement body under various engineering conditions, providing a scientific foundation and technical support for geotechnical engineering.
Regression analysis is performed using the Coulomb strength criterion to determine the cohesion and internal friction angle of the grouting reinforcement body. The criterion is expressed in terms of maximum principal stress and confining pressure, as represented by the following equation:
σ 1 f = b + a σ 3
where a and b are strength criterion parameters, σ 1 f is maximum axial stress, and σ 3 is confining pressure. Meanwhile, it can be observed that the σ 1 f of a rock sample is linearly related to the σ 3 . The relationship between the values of a and b and the cohesion (C) and internal friction angle ( φ ) is expressed in Equations (7) and (8):
a = 1 + sin φ 1 sin φ
b = 2 C cos φ 1 sin φ
Using confining pressure as the independent variable (abscissa) and peak strength as the dependent variable (ordinate), a scatter diagram is plotted, and linear fitting is performed to obtain the fitting equation and the correlation coefficient. The cohesion and internal friction angle of the grouting reinforcement body is calculated using Equations (7) and (8). The fitting results and corresponding calculations are presented in Table 5.
The relationship between the shear strength parameters of the grouting reinforcement body and the number of freeze–thaw cycles is depicted in Figure 23. As illustrated in Figure 23a, the cohesion of the grouting reinforcement body decreases with an increase in freeze–thaw cycles. Initially, during the early stages of the freeze–thaw cycles, the cohesion of the grouting reinforcement bodies with crack dip angles of 0° and 45° slightly increases, before undergoing a continuous decline as the cycles progress. After 30 freeze–thaw cycles, the extreme value ratios of cohesion for grouting reinforcement bodies with 0°, 30°, 45°, and 60° crack dip angles are 1.80, 1.77, 3.77, and 3.61, respectively. Figure 23b demonstrates that the internal friction angle of the grouting reinforcement body similarly decreases as the number of freeze–thaw cycles increases. After 30 freeze–thaw cycles, the extreme value ratios of the internal friction angle for grouting reinforcement bodies with 0°, 30°, 45°, and 60° crack dip angles are 1.19, 1.21, 1.09, and 1.66, respectively.
The data reveal that the extreme value ratio of cohesion in the grouting reinforcement body is significantly greater than that of the internal friction angle, suggesting that the effect of freeze–thaw cycles primarily induces damage related to the weakening of the cementation between rock particles. Under low-temperature conditions, the internal pore water within the grouting reinforcement body freezes, generating frost heave forces that lead to an increase in the internal pore volume. With repeated freeze–thaw cycles, internal damage within the grouting reinforcement body progressively accumulates. As the internal pore water increases, the frost heave forces generated during freezing intensify, gradually reducing the cohesion of the grouting reinforcement body after multiple freeze–thaw cycles, thereby directly affecting its macroscopic physical and mechanical properties. In the initial stages of the freeze–thaw cycle, the cement damage within the rock is minimal, resulting in only a slight decrease in cohesion. However, after repeated freeze–thaw cycles, severe damage to the cementation within the rock leads to a sharp decline in the cohesion of the grouting reinforcement body.

3.4. Discussion

3.4.1. The Influence Mechanism of Freeze–Thaw Cycle on Grouting Reinforcement Body

In this study, the impact of freeze–thaw cycles on the physical and mechanical properties of grouting reinforcement body was investigated through a comprehensive series of experimental tests. Extensive freeze–thaw testing has demonstrated that the mass and wave velocity of grouting reinforcement exhibit significant declines as the number of freeze–thaw cycles increases [38,39]. Correspondingly, the mass loss rate and wave velocity loss rate progressively rise. The macroscopic mechanical properties of grouting reinforcement body also deteriorate gradually, with notable reductions in peak strength, elastic modulus, and shear strength parameters [40,41]. The peak strength and elastic modulus are found to have a negative exponential relationship with the number of freeze–thaw cycles, which is consistent with the experimental results obtained in this study. This phenomenon can be primarily attributed to the freezing of pore water within the grouting reinforcement body as ambient temperatures decrease. The expansion of frozen water generates frost heave forces that act upon the rock and cement particles. These forces exert a destructive influence on particles with weaker cementation strength, leading to localized damage within the grouting reinforcement body. As temperatures rise, the water within the grouting reinforcement body thaws, resulting in the release of freezing stress and the migration of water. With increasing freeze–thaw cycles, these localized damage zones gradually coalesce into microcracks. The continuous propagation of these microcracks leads to a progressive reduction in the strength and stiffness of the grouting reinforcement body, ultimately causing particle fracture and spalling.
During the freeze–thaw cycle, the freezing and thawing of water in the pores lead to the expansion of the original pores and fissures and the formation of new fissures. The evolution law of internal pores in grouting reinforcement body can be obtained by nuclear magnetic resonance T2 spectrum [42]. In this study, with the increase of the number of freeze–thaw cycles, the T2 spectrum curve of the sample continued to grow upward and the NMR signal intensities of the three peaks continued to increase. With the increase of the number of freeze–thaw cycles, the three peaks all showed a rightward trend, which was manifested in the pore characteristics of micropores increasing and transitioning to mesopores, mesopores increasing and transitioning to macropores, and macropores increasing continuously. The change of the pore structure directly leads to the decrease of the macroscopic mechanical properties of the grouting reinforcement body.

3.4.2. The Influence of Crack Dip Angle on Grouting Reinforcement Body

This study also analyzes the influence of different crack dip angles on the performance of sandstone grouting reinforcement. The results show that when the crack dip angle is 0°, 30°, or 45°, the grouting reinforcement has obvious plastic deformation and ductility after the peak strength. When the fracture dip angle is 60°, the stress–strain relationship curve has no plastic deformation stage regardless of the confining pressure, and it decreases instantaneously after the axial stress reaches the peak value. The main reason is that the stress reaches the shear strength of the weak surface of the rock-slurry consolidation body, resulting in shear slip failure of the rock along the fracture surface. With the increase of crack dip angle, the failure mode of the grouting reinforcement body gradually changes from axial splitting failure to axial splitting-shear mixed failure, and finally to shear failure. This is relatively consistent with the research results of Rong et al. [22]. The change in this failure mode further illustrates the importance of crack dip angle to the stability of the grouting reinforcement body.

4. Conclusions

Given the limited research on the physical and mechanical properties of grouting reinforcement bodies in cold regions, coupled with the challenges and high costs associated with in-situ testing of fractured rock masses, this study focuses on fractured sandstone grouting reinforcement bodies. It utilizes a combination of wave velocity testing, nuclear magnetic resonance (NMR) analysis, triaxial compression tests, and other laboratory techniques. A series of investigations into the physical and mechanical properties of fractured sandstone grouting reinforcement bodies subjected to freeze–thaw cycles have been conducted, leading to the following key conclusions:
  • As the number of freeze–thaw cycles increases, both the mass and wave velocity of the grouting reinforcement body decrease, while the mass loss rate and wave velocity loss rate increase. After 30 freeze–thaw cycles, the maximum mass loss rate of the sample is 1.25%, and the wave velocity loss rate exceeds 25%. Under the same number of freeze–thaw cycles, the mass loss rate increases with the increase in crack dip angle.
  • The NMR T2 spectra curve of the grouting reinforcement body shifts to the right as the number of freeze–thaw cycles increases, indicating that the freeze–thaw process promotes the continuous initiation, development, and expansion of internal pores within the grouting reinforcement body. In the initial stages of the freeze–thaw cycle, pore size evolution progresses from micropores to mesopores and macropores. In the later stages of the freeze–thaw cycle, the evolution is primarily from mesopores to macropores.
  • The freeze–thaw cycle weakens the mechanical properties of the grouting reinforcement body. As the number of freeze–thaw cycles increases, both the peak strength and elastic modulus of the grouting reinforcement body decline, following a negative exponential function under varying confining pressures. Cohesion and the internal friction angle progressively decrease with increasing freeze–thaw cycles. Under the same number of freeze–thaw cycles, the peak strength and elastic modulus of the grouting reinforcement body decrease as the crack dip angle increases but increases with higher confining pressures. The relationship between peak strength and confining pressure adheres to the Coulomb linear strength criterion.
  • The crack dip angle and confining pressure significantly influence the failure mode of the grouting reinforcement body. Plastic flow is observed after the peak of the stress–strain curve for grouting reinforcement bodies subjected to high confining pressures with crack dip angles of 0°, 30°, or 45°, leading to a marked enhancement in ductility. In contrast, the stress–strain curves of grouting reinforcement bodies with a 45° crack dip angle under low confining pressure and a 60° crack dip angle exhibit a substantial decline after reaching the peak. This decline is primarily attributed to the stress exceeding the shear strength of the slurry–rock interface layer, resulting in shear slip along the fracture planes.

Author Contributions

All authors contributed to the study’s conception and design. S.L.: formal analysis, investigations, and writing-original draft; J.Z. (Jiwei Zhang): funding acquisition, supervision, and writing-review; Z.Y.: methodology, investigation, experiment; T.Z.: writing-review and editing; J.Z. (Jiahao Zhang): assisting writing-review. All authors have read and agreed to the published version of the manuscript.

Funding

National Natural Science Foundation of China, Grant No. 51804157, J.Z. (Jiwei Zhang), Bingtuan Financial Science and Technology Project, Grant No. 2023AB016-02, J.Z. (Jiwei Zhang), Shaanxi Province key research and development Project (Grant No. 2024GX-YBXM-479), J.Z. (Jiwei Zhang).

Data Availability Statement

All data, models, or codes that support the findings of this study are available from the corresponding author upon reasonable request.

Acknowledgments

This research is jointly supported by the National Natural Science Foundation of China (Grant No. 51804157), Bingtuan Financial Science and Technology Project (Grant No. 2023AB016-02) and Shaanxi Province key research and development Project (Grant No. 2024GX-YBXM-479).

Conflicts of Interest

The authors declare that they have no known competing financial interests or personal relationships that could have appeared to influence the work reported in this paper.

References

  1. Yuan, Y.; Pan, P.; Zhao, S.; Wang, B.; Song, G. The failure process of marble with filled crack under uniaxial compression based on digital image correlation. Chin. J. Rock Mech. Eng. 2018, 37, 339–351. [Google Scholar] [CrossRef]
  2. Pudasaini, S.P.; Krautblatter, M. A two-phase mechanical model for rock-ice avalanches. J. Geophys. Res. Earth Surf. 2014, 119, 2272–2290. [Google Scholar] [CrossRef]
  3. Krautblatter, M.; Funk, D.; Günzel, F.K. Why permafrost rocks become unstable: A rock-ice-mechanical model in time and space. Earth Surf. Process. Landf. 2013, 38, 876–887. [Google Scholar] [CrossRef]
  4. Huang, H.; Chen, J.; Zhang, D. Lateral asymptotic deflection evolution and mechanical behavior of secondary linings of freeze-thaw tunnels in cold regions. Chin. J. Geotech. Eng. 2019, 41, 2126–2132. [Google Scholar]
  5. Gustafson, G.; Ciaesson, J.; Fransson, A. Steering parameters for rock grouting. J. Appl. Math. 2013, 2013, 269594. [Google Scholar] [CrossRef]
  6. Tani, M.E. Grouting rock fractures with cement grout. Rock Mech. Rock Eng. 2012, 45, 547–561. [Google Scholar] [CrossRef]
  7. Hu, S.; Liu, Q.; Li, S. Advance and review on grouting critical problems in fractured rock mass. Coal Sci. Technol. 2022, 50, 112–126. [Google Scholar]
  8. Evdokimov, P.D.; Adamovich, A.N.; Fradkin, L.P.; Denisov, V.N. Shear strengths of fissures in ledge rock before and after grouting. Hydrotech. Constr. 1970, 4, 229–233. [Google Scholar] [CrossRef]
  9. Han, L.; Zong, Y.; Han, G.; Zhang, H. Study of shear properties of rock structure plane by grouting reinforcement body. Rock Soil Mech. 2011, 32, 2570–2576. [Google Scholar] [CrossRef]
  10. Liu, Q.; Zhou, Y.; Lu, C.; Zhang, J. Experimental study on mechanical properties of mudstone fracture before and after grouting. J. Min. Saf. Eng. 2016, 33, 509–514+520. [Google Scholar] [CrossRef]
  11. Salimian, M.H.; Baghbanan, A.; Hashemolhosseini, H.; Dehghanipoodeh, M.; Norouzi, S. Effect of grouting on shear behavior of rock joint. Int. J. Rock Mech. Min. Sci. 2017, 98, 159–166. [Google Scholar] [CrossRef]
  12. Sharafisafa, M.; Aliabadian, Z.; Tahmasebinia, F.; Shen, L. A comparative study on the crack development in rock-like specimens containing unfilled and filled flaws. Eng. Fract. Mech. 2021, 241, 107405. [Google Scholar] [CrossRef]
  13. Stavropoulou, E.; Dano, C.; Boulon, M. Shear Response of Wet Weak Carbonate Rock/Grout Interfaces Under Cyclic Loading. Rock Mech. Rock Eng. 2021, 54, 2791–2813. [Google Scholar] [CrossRef]
  14. Lu, H.; Zhu, C.; Liu, Q. Study on shear mechanical properties of structural planes grouted with different materials. Chin. J. Rock Mech. Eng. 2021, 40, 1803–1811. [Google Scholar] [CrossRef]
  15. Shen, J.; Liu, B.; Chen, J.; Li, Y.; Cheng, Y.; Song, Y. Experimental study on mechanical properties of diabase fracture-grouting mass. Chin. J. Rock Mech. Eng. 2020, 39 (Suppl. 1), 2804–2817. [Google Scholar] [CrossRef]
  16. Zong, Y.; Han, L.; Han, G. Experimental study on mechanical properties of confined grouting reinforcement body of fractured rock mass. J. Min. Saf. Eng. 2013, 30, 483–488. [Google Scholar]
  17. Wang, Z.; Qin, W.; Zhang, L. Experimental study on static and dynamic mechanical properties of cracked rock after grouting reinforcement body. Chin. J. Rock Mech. Eng. 2020, 39, 2451–2459. [Google Scholar] [CrossRef]
  18. Le, H.; Sun, S. Effects of grouting material and inclination angle of preexisting flaw on uniaxial compressive strength and failure mode of rock-like specimens. Rock Soil Mech. 2018, 39, 211–219. [Google Scholar] [CrossRef]
  19. Feng, G.; Ma, J.; Li, Z.; Qi, T.; Cui, J.; Guo, W.; Zhao, Y.; Hou, B. Bearing characteristics and damage mechanism of grouting reinforced body for broken surrounding rock. J. China Coal Soc. 2023, 48, 411–423. [Google Scholar] [CrossRef]
  20. Liu, R.; Zheng, Z.; Li, S.; Yang, H. Mechanical properties of fractured rock mass with consideration of grouting reinforcement. Chin. J. Highw. Transp. 2018, 31, 284–291. [Google Scholar]
  21. Rong, M. Study on the Mechanical Behavior and Failure Mechanism of the Fractured Surrounding Rock by Grouting Reinforcement Body. Ph.D. Dissertation, Shijiazhuang Tiedao University, Shijiazhuang, China, 2022. [Google Scholar]
  22. Hu, W.; Sui, W.; Wang, D.; Ma, L. Experimental investigation on mechanical properties and representative elementary volume for chemically grouted fractured rock masses. China Sci. Pap. 2013, 8, 408–412. [Google Scholar] [CrossRef]
  23. Huang, Y.; Yang, W.; Zhao, A.; Guo, W. Shear Strength and Re-Failure Characteristics of Intact Red Sandstone and Grouting-Reinforced Body of Fractured Red Sandstone under Different Shear Angles. Minerals 2022, 12, 1580. [Google Scholar] [CrossRef]
  24. Wang, K.; Li, N. Numerical simulation on effects of reservoir characteristics and saturation on T2 spectra of nuclear magnetic resonance. Acta Pet. Sin. 2009, 30, 422–426. [Google Scholar]
  25. AlGhamdi, T.M.; Arns, C.H.; Eyvazzadeh, R.Y. Correlations between NMR-relaxation response and relative permeability from tomographic reservoir-rock images. SPE Reserv. Eval. Eng. 2013, 16, 369–377. [Google Scholar] [CrossRef]
  26. Li, J.; Kaunda, R.B.; Zhou, K. Experimental investigations on the effects of ambient freeze-thaw cycling on dynamic properties and rock pore structure deterioration of sandstone. Cold Reg. Sci. Technol. 2018, 154, 133–141. [Google Scholar] [CrossRef]
  27. Zhang, J.; Deng, H.; Deng, J.; Gao, R. Fractal analysis of pore structure development of sandstone: A nuclear magnetic resonance investigation. IEEE Access 2019, 7, 47282–47293. [Google Scholar] [CrossRef]
  28. De Quervain, F. Technische Gesteinskunde. In Lehrbücher und Monographien aus dem Gebiete der exakten Wissenschaften. Mineralogisch-geotechnische Reihe, Bd 1; Birkhäuser: Basel, Switzerland, 1967. [Google Scholar]
  29. Dubinin, M.M. Micropore structures of charcoal adsorbents. 1. A general characterization of micro- and supermicropores in the fissure model. Proc. Acad. Sci. USSR 1979, 8, 1691–1696. [Google Scholar]
  30. Gregg, S.J.; Sing, K.S.W. Adsorption, Surface Area and Porosity. Academic Press: London, UK, 1982. [Google Scholar]
  31. Klopfer, H. Feuchte. In Lehrbuch der Bauphysik; Lutz, P., Jenisch, R., Klopfer, H., et al., Eds.; Teubner Verlag: Stuttgart, Germany, 1985. [Google Scholar]
  32. DIN 66131; Bestimmung der spezifischen Oberfläche von Feststoffen durch Gasadsorption nach Brunauer, Emmett und Teller (BET). Beuth Verlag: Berlin, Germany, 1993.
  33. Kodikara, J.; Barbour, S.L.; Fredlund, D.G. Changes in clay structure and behavior due to wetting and drying. Aust. Geomech. 1999, 8. [Google Scholar]
  34. He, Y.; Mao, Z.; Xiao, L.; Zhang, Y. A new method for constructing capillary pressure curves by using T2 distribution of NMR. J. Jilin Univ. 2005, 35, 177–181. [Google Scholar]
  35. Lønøy, A. Making sense of carbonate pore systems. AAPG Bull. 2006, 90, 1381–1405. [Google Scholar] [CrossRef]
  36. Yan, J.; Wen, D.; Li, Z.; Bin, G.; Jin-Gong, C.; Qiang, L.; Yu, Y. Quantitative evaluation method for pore structure of low permeability sandstone based on NMR logging: Taking sand four segments of south slope of Dongying sag as an example. J. Geophys. 2016, 59, 1543–1552. [Google Scholar]
  37. Fang, T.; Zhang, L.; Liu, N.; Zhang, L.; Wang, W.; Yu, L.; Li, C.; Lei, Y. Quantitative characterization of pore structure of tight sandstone gas reservoirs by NMR technique: Taking Carboniferous-Permian tight sandstone reservoirs in eastern Linqing depression as an example. Acta Pet. Sin. 2017, 38, 902–915. [Google Scholar]
  38. Deprez, M.; De Kock, T.; De Schutter, G.; Cnudde, V. A review on freeze-thaw action and weathering of rocks. Earth-Sci. Rev. 2020, 203, 103143. [Google Scholar] [CrossRef]
  39. Momeni, A.; Abdilor, Y.; Khanlari, G.R.; Heidari, M.; Sepahi, A.A. The effect of freeze–thaw cycles on physical and mechanical properties of granitoid hard rocks. Bull. Eng. Geol. Environ. 2016, 75, 1649–1656. [Google Scholar] [CrossRef]
  40. Hosseini, M.; Khodayari, A.R. Effect of freeze-thaw cycle on strength and rock strength parameters (A Lushan sandstone case study). J. Min. Environ. 2019, 10, 257–270. [Google Scholar]
  41. Mousavi, S.Z.S.; Tavakoli, H.; Moarefvand, P.; Rezaei, M. Assessing the effect of freezing-thawing cycles on the results of the triaxial compressive strength test for calc-schist rock. Int. J. Rock Mech. Min. Sci. 2019, 123, 104090. [Google Scholar] [CrossRef]
  42. Webber, J.B.W.; Corbett, P.; Semple, K.T.; Ogbonnaya, U.; Teel, W.S.; Masiello, C.A.; Fisher, Q.J.; Valenza, J.J., II; Song, Y.Q.; Hu, Q. An NMR study of porous rock and biochar containing organic material. Microporous Mesoporous Mater. 2013, 178, 94–98. [Google Scholar] [CrossRef]
Figure 1. XRD spectrum and composition content of rock.
Applsci 15 02801 g001
Figure 2. Red sandstone sample (45° crack dip angle).
Applsci 15 02801 g002
Figure 3. Ultrafine cement and XRD spectrum. (a) Ultrafine cement; (b) XRD spectrum of cement.
Applsci 15 02801 g003
Figure 4. Sample grouting process. (a) Grouting mold; (b) fix specimen; (c) grouting.
Applsci 15 02801 g004
Figure 5. Grouting reinforcement body.
Applsci 15 02801 g005
Figure 6. Experimental setup. (a) Sample preparation; (b) sample pretreatment; (c) sample performance test.
Applsci 15 02801 g006
Figure 7. Electric blast drying oven.
Applsci 15 02801 g007
Figure 8. NM-V vacuum pressure saturation device.
Applsci 15 02801 g008
Figure 9. TMS9018 freeze–thaw cycle chamber.
Applsci 15 02801 g009
Figure 10. Time-temperature curve.
Applsci 15 02801 g010
Figure 11. NIUMAG MesoMR12-060H-1 CORE MRI system.
Applsci 15 02801 g011
Figure 12. FRTX-1000 low-temperature high-pressure servo-controlled rock triaxial test system.
Applsci 15 02801 g012
Figure 13. Mass and mass loss rate of grouting reinforcement body.
Applsci 15 02801 g013
Figure 14. Wave velocity and wave velocity loss rate.
Applsci 15 02801 g014
Figure 15. T2 spectra of grouting reinforcement body in the freeze–thaw process.
Applsci 15 02801 g015
Figure 16. Evolution law of pore diameter of grouting reinforcement body.
Applsci 15 02801 g016
Figure 17. Stress–strain curves of sample (0°) (a) σ3 = 3 MPa; (b) σ3 = 9 MPa.
Applsci 15 02801 g017
Figure 18. Stress–strain curves of sample (30°) (a) σ3 = 3 MPa; (b) σ3 = 9 MPa.
Applsci 15 02801 g018
Figure 19. Stress–strain curves of sample (45°) (a) σ3 = 3 MPa; (b) σ3 = 9 MPa.
Applsci 15 02801 g019
Figure 20. Stress–strain curves of sample (60°) (a) σ3 = 3 MPa; (b) σ3 = 9 MPa.
Applsci 15 02801 g020
Figure 21. Effect of freeze–thaw cycles on the peak strength of sample (a) crack dip angle = 0°; (b) crack dip angle = 30°; (c) crack dip angle = 45°; (d) crack dip angle = 60°.
Applsci 15 02801 g021
Figure 22. Effect of freeze–thaw cycles on the elastic modulus of sample (a) crack dip angle = 0°; (b) crack dip angle = 30°; (c) crack dip angle = 45°; (d) crack dip angle = 60°.
Applsci 15 02801 g022
Figure 23. Effect of freeze–thaw cycle on shear strength parameters of sample (a) cohesion; (b) angle of internal friction.
Applsci 15 02801 g023
Table 1. Primary components of cement for test.
ComponentsSiO2CaCO3Ca2(SiO4)Ca3(SiO4)OCa2FeAlO5Ca3(Al2O6)Ca(SO4)(H2O)2Ca(SO4)
Cement/%3.827.518.832.010.13.50.53.8
Table 2. T2 surface relaxation strength values for reference.
ρ 2 (μm/ms)WaterClaySolids
Water0.0000.0100.003
Clay0.0100.0100.003
Solids0.0030.0030.000
Table 3. Comparison of common pore aperture division methods.
ReferenceMicropore/μmMesopor/μmMacropore/μm
De Quervain (1967) [28]<55–200200–2000
Dubinin (1979) [29](0.0012–0.0014)
(0.003–0.0032)
(0.003–0.0032)–
(0.2–0.4)
>(0.2–0.4)
IUPAC (Gregg and Sing1982) [30]<0.0020.002–0.05>0.05
Klopfer (1985) [31]<0.10.1–1000>1000
DIN66131 (1993) [32]<0.0020.002–0.05>0.05
Kodikara et al. (1999) [33]1–3010–1000
He Yudan et al. (2005) [34]<10>10
Lonoy (2006) [35]10–5050–100>100
Yan Jianping et al. (2016) [36]<0.10.1–1>1
Fang Tao et al. (2017) [37]<0.10.1–11–5
Note: “—” indicates that no pore radius range has been assigned to this type of pore.
Table 4. T2 spectral area variation characteristics of grouting reinforcement body.
Freeze–Thaw CyclesMicroporeMesopore MacroporeTotal T2
Spectral Area
09931.663053.76220.4813,205.90
510,553.343454.50324.2314,332.07
1011,098.724522.72597.6216,219.06
1512,323.455610.131002.8518,936.43
2012,529.086304.111557.6620,390.85
2513,089.598455.292400.3723,945.25
3013,096.609293.203660.8726,050.67
Table 5. Shear parameters of grouting reinforcement body.
Crack Dip AngleFreeze–thaw CyclesFitting EquationR2C/MPa φ
0 σ 1 f = 67.29 + 6.58 σ 3 0.98413.1247.40
5 σ 1 f = 62.26 + 5.17 σ 3 0.96913.6942.52
10 σ 1 f = 59.75 + 4.53 σ 3 0.96114.0439.67
15 σ 1 f = 52.19 + 5.16 σ 3 0.96511.4942.48
20 σ 1 f = 46.09 + 4.95 σ 3 0.96710.3641.60
25 σ 1 f = 40.97 + 4.82 σ 3 0.9439.3341.02
30 σ 1 f = 34.90 + 5.04 σ 3 0.9107.7741.98
30°0 σ 1 f = 59.12 + 6.92 σ 3 0.99211.2448.37
5 σ 1 f = 51.70 + 5.51 σ 3 0.94711.0143.85
10 σ 1 f = 47.80 + 5.36 σ 3 0.90910.3243.28
15 σ 1 f = 41.45 + 5.09 σ 3 0.9539.1942.19
20 σ 1 f = 35.09 + 4.59 σ 3 0.9278.1939.96
25 σ 1 f = 29.85 + 4.93 σ 3 0.8956.7241.51
30 σ 1 f = 26.15 + 4.27 σ 3 0.8766.3338.35
45°0 σ 1 f = 38.64 + 8.51 σ 3 0.9406.6252.16
5 σ 1 f = 35.21 + 6.02 σ 3 0.9787.1845.65
10 σ 1 f = 33.48 + 5.63 σ 3 0.9647.0644.29
15 σ 1 f = 26.10 + 5.74 σ 3 0.9585.4544.69
20 σ 1 f = 18.58 + 5.92 σ 3 0.9883.8245.31
25 σ 1 f = 12.69 + 5.67 σ 3 0.9882.6644.44
30 σ 1 f = 8.51 + 5.01 σ 3 0.9441.9041.85
30°0 σ 1 f = 31.05 + 4.47 σ 3 0.8907.3439.37
5 σ 1 f = 27.06 + 4.31 σ 3 0.8406.5238.56
10 σ 1 f = 24.55 + 4.17 σ 3 0.8546.0137.82
15 σ 1 f = 19.90 + 3.67 σ 3 0.8065.1934.87
20 σ 1 f = 15.59 + 3.65 σ 3 0.8814.0834.74
25 σ 1 f = 11.97 + 3.07 σ 3 0.8533.4230.57
30 σ 1 f = 6.23 + 2.34 σ 3 0.8972.0423.65
Disclaimer/Publisher’s Note: The statements, opinions and data contained in all publications are solely those of the individual author(s) and contributor(s) and not of MDPI and/or the editor(s). MDPI and/or the editor(s) disclaim responsibility for any injury to people or property resulting from any ideas, methods, instructions or products referred to in the content.

