
Physiological Evaluation of User Experience in Unstable Automated Driving: A Comparative Study


Abstract
1. Introduction
2. Research Methodology
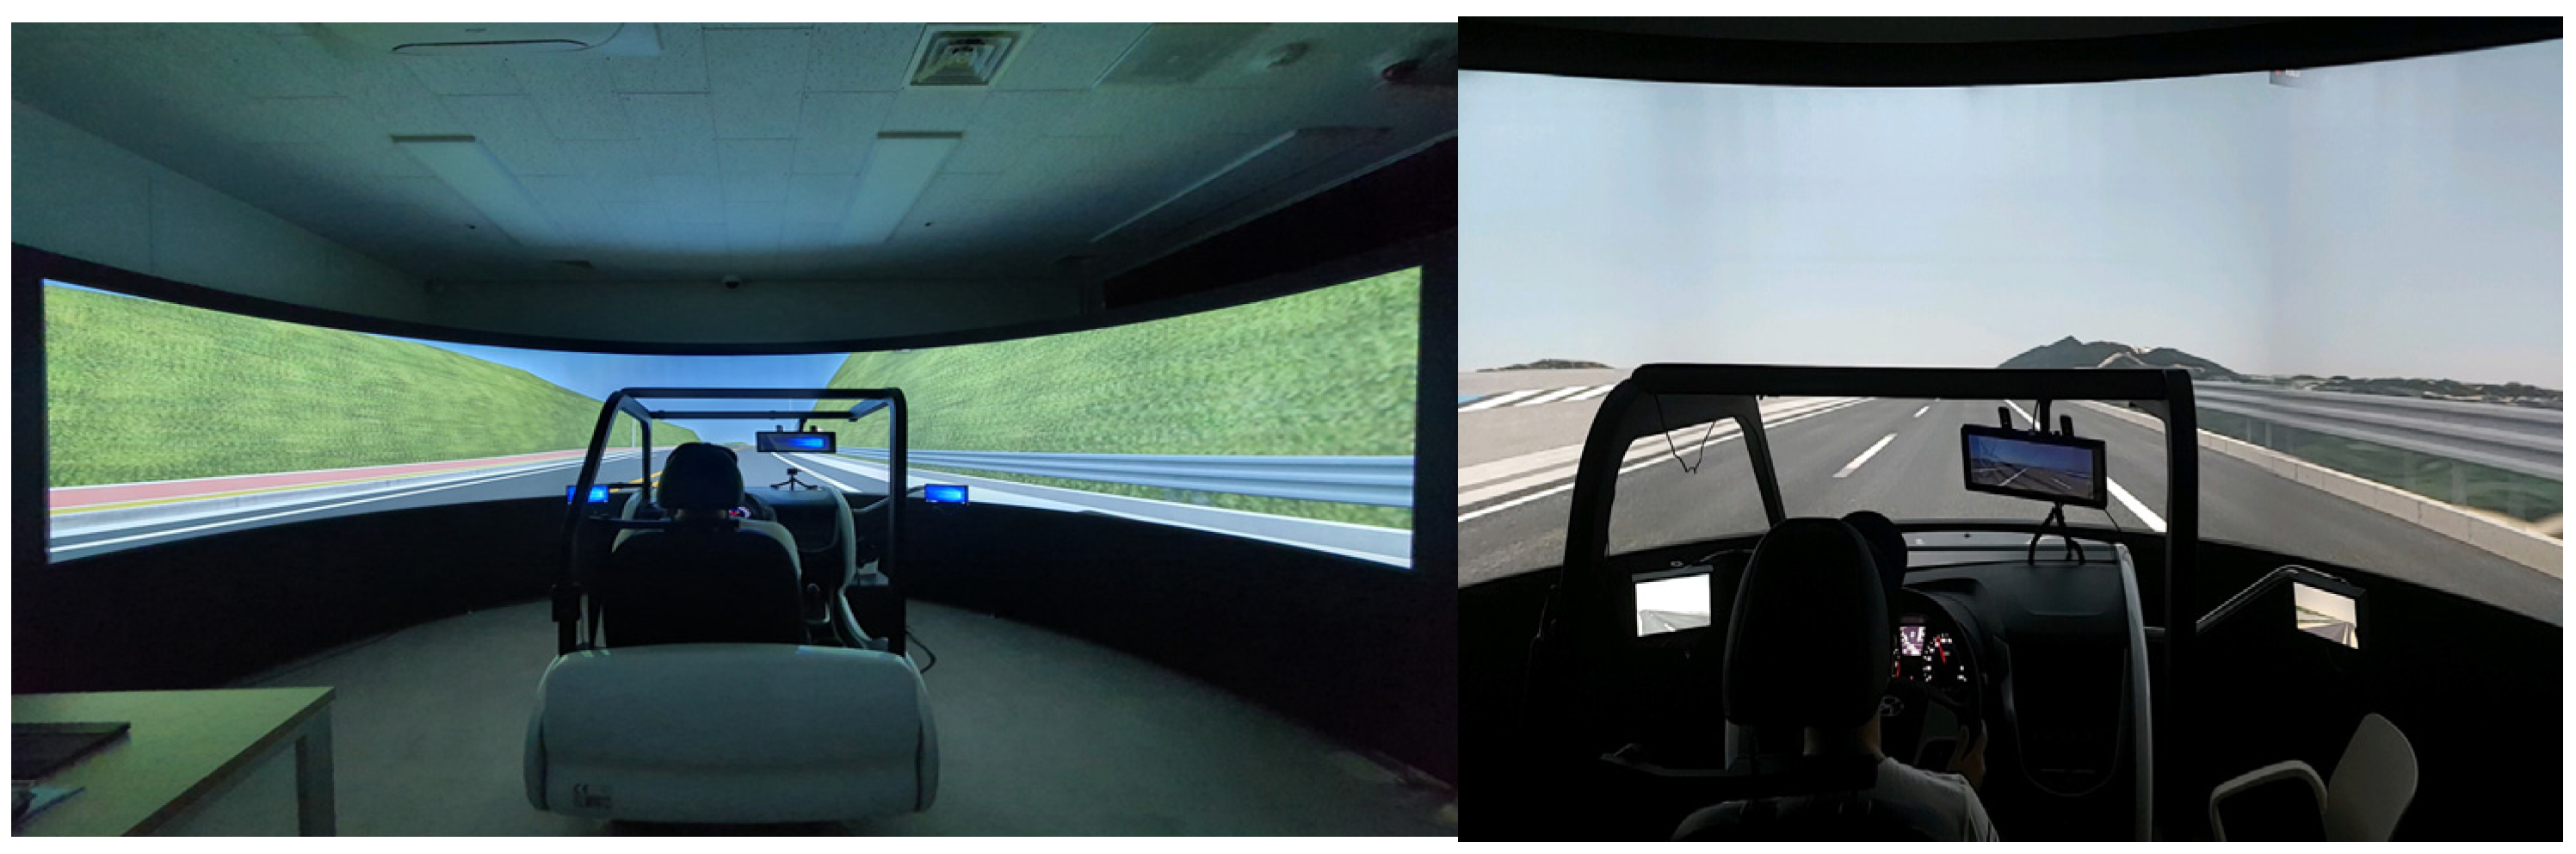
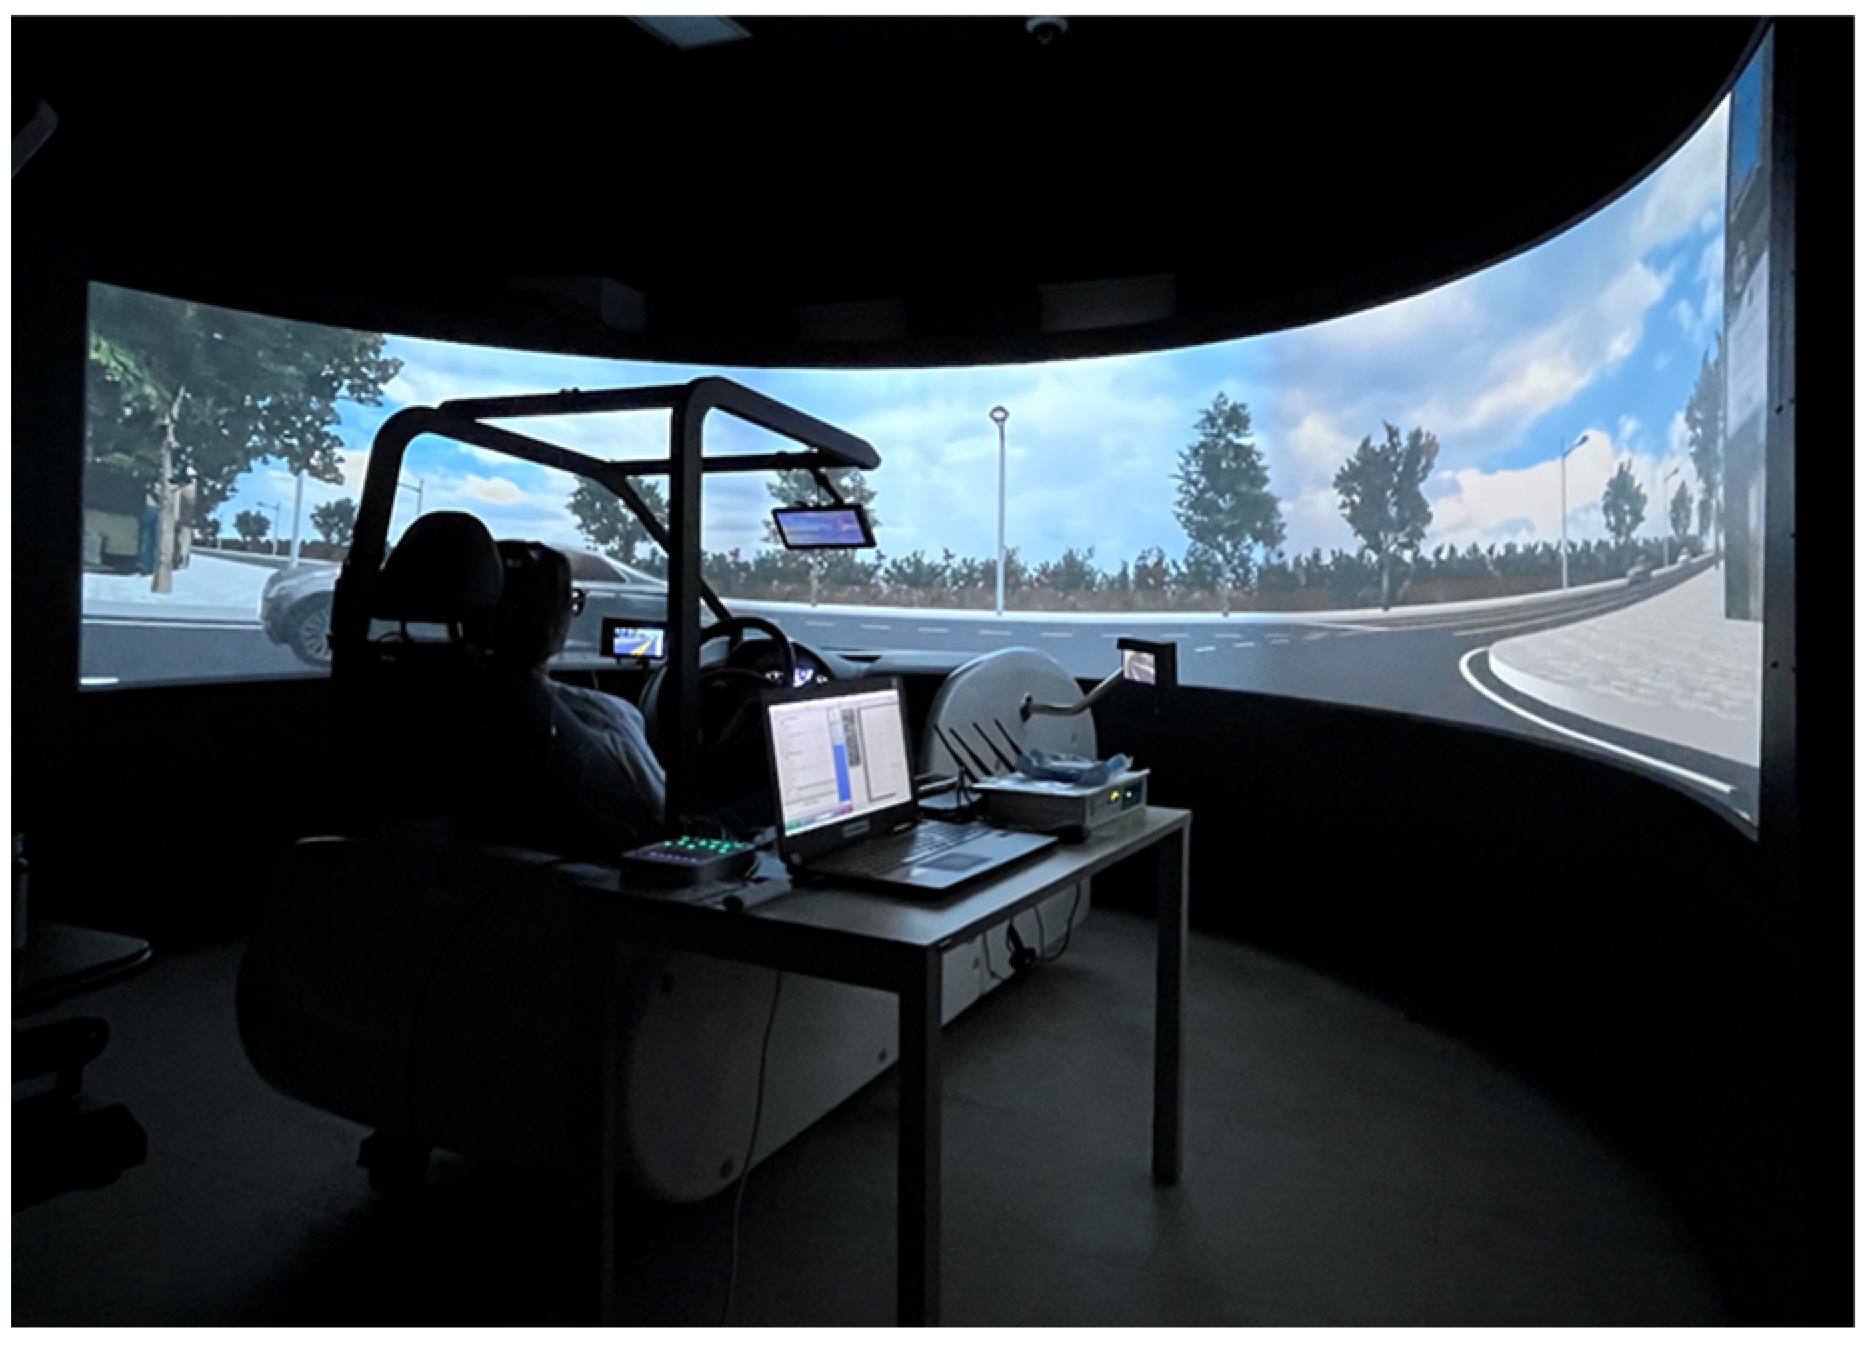
2.1. Experiments with a VR Simulator
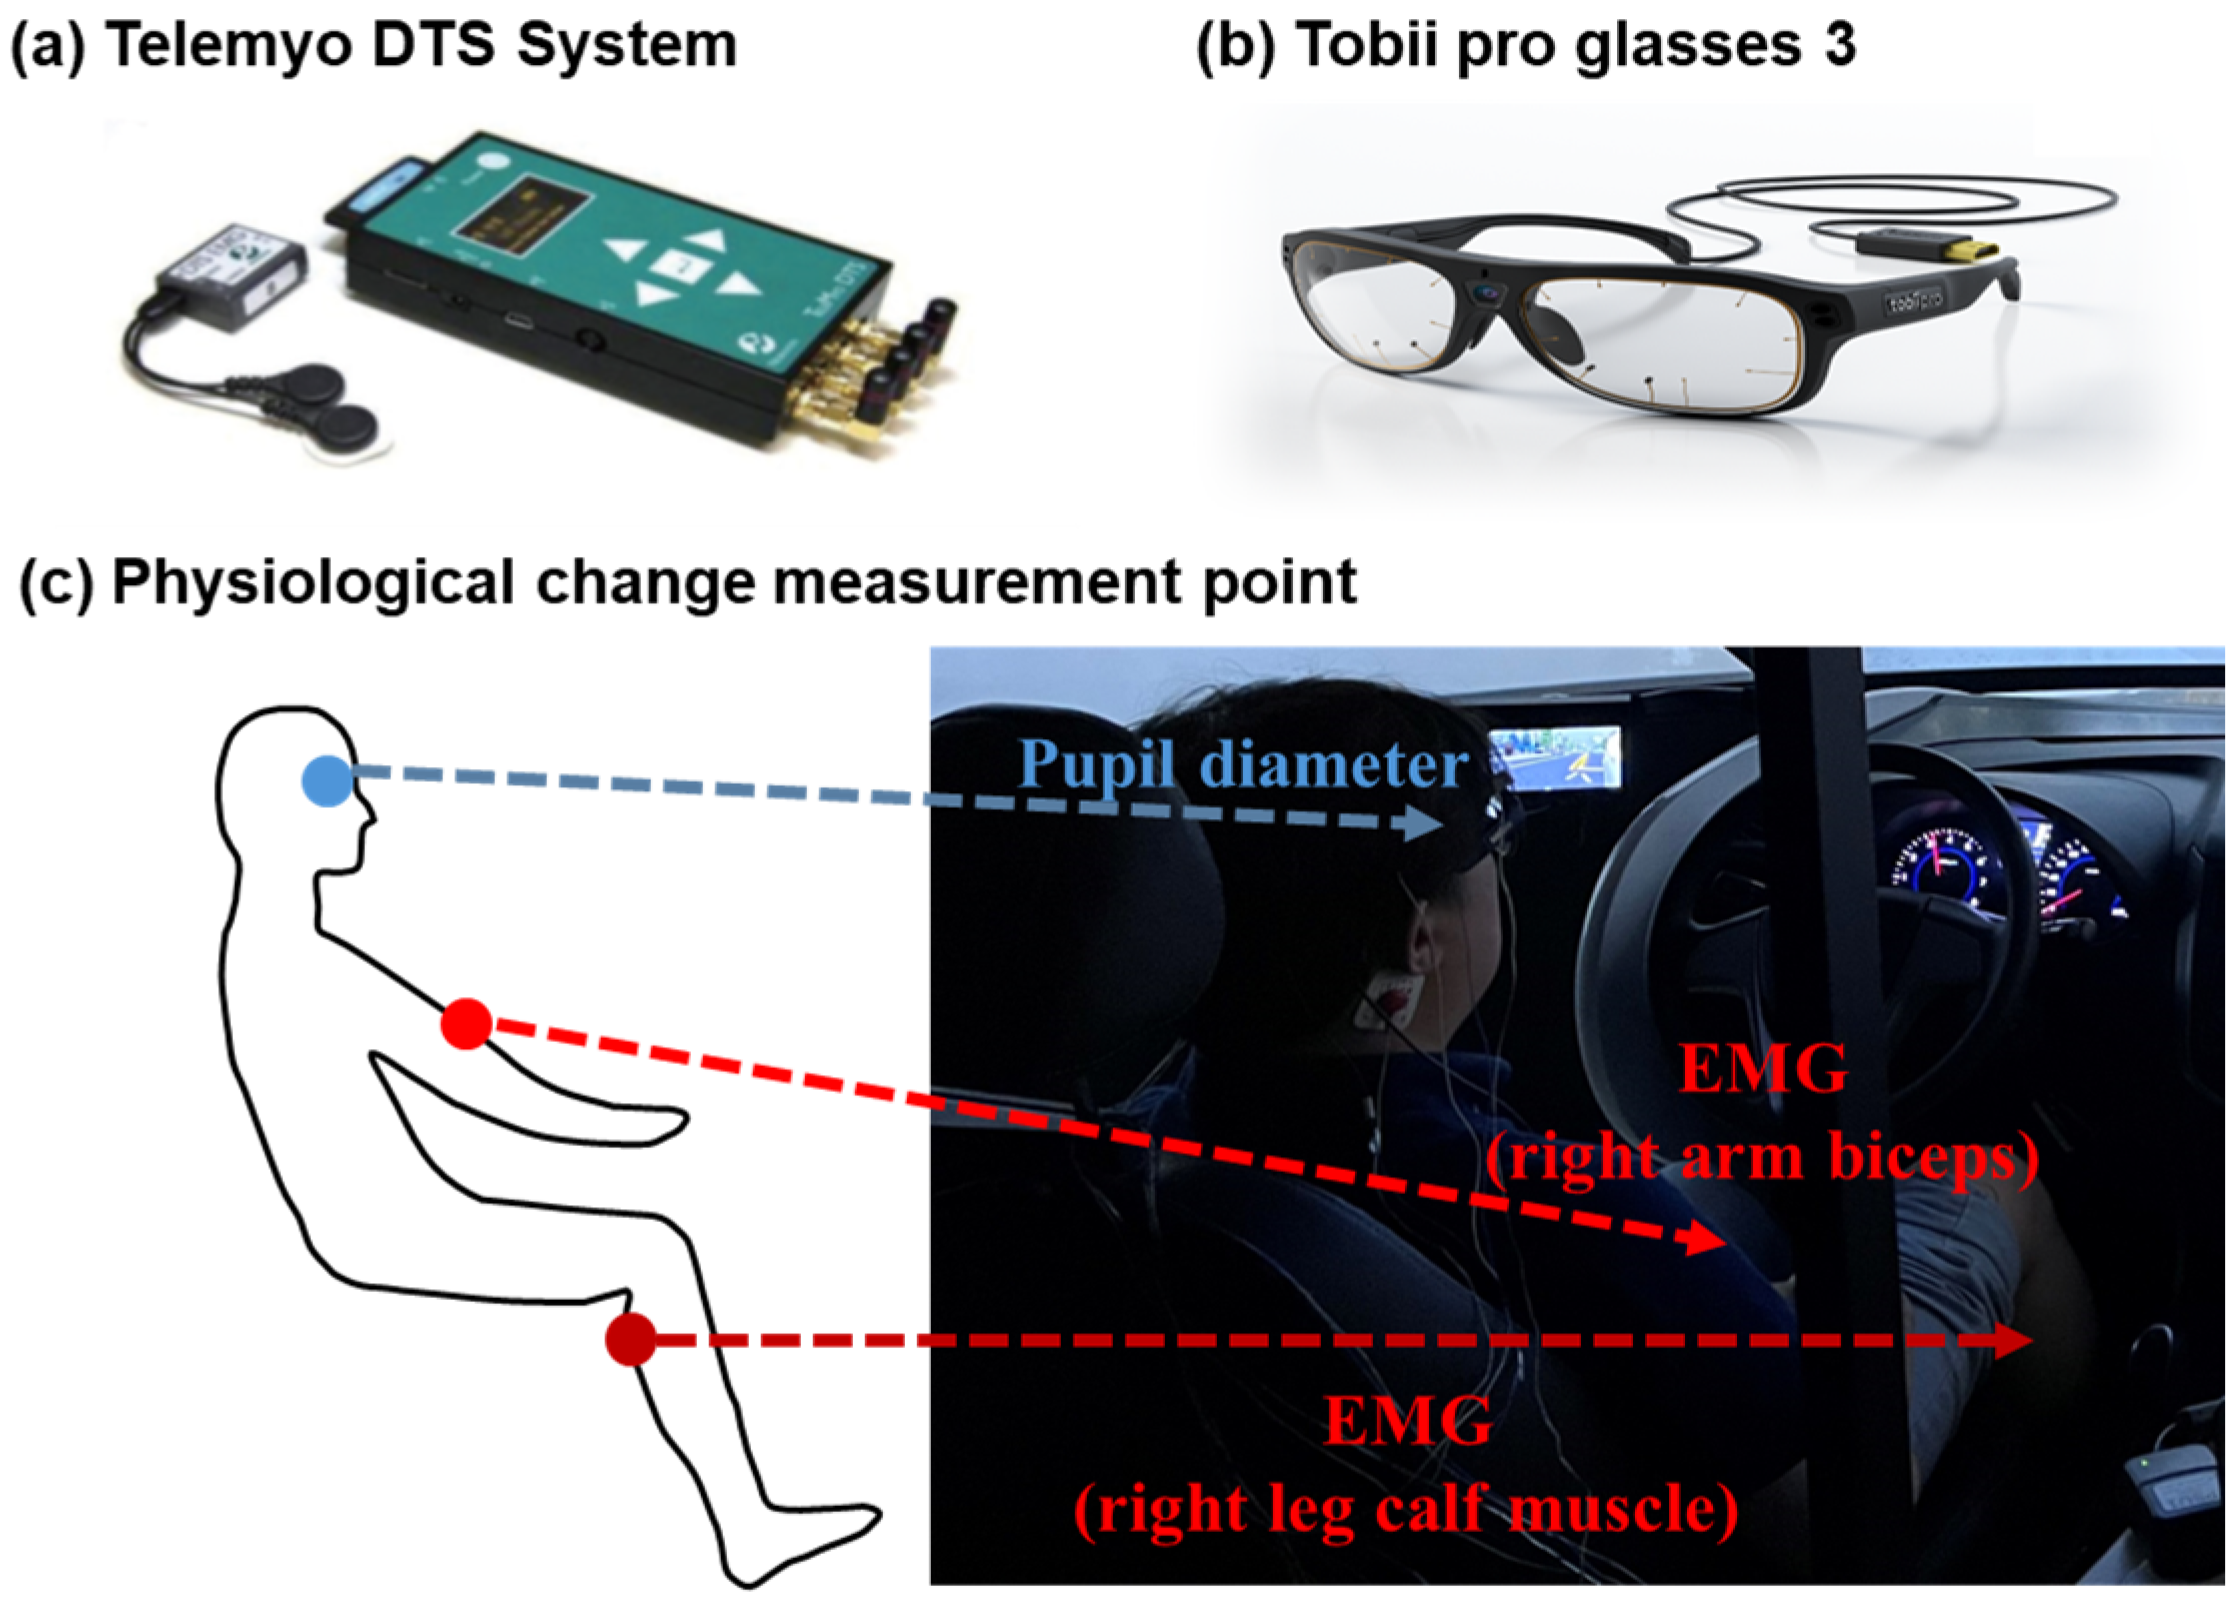
2.1.1. Apparatus
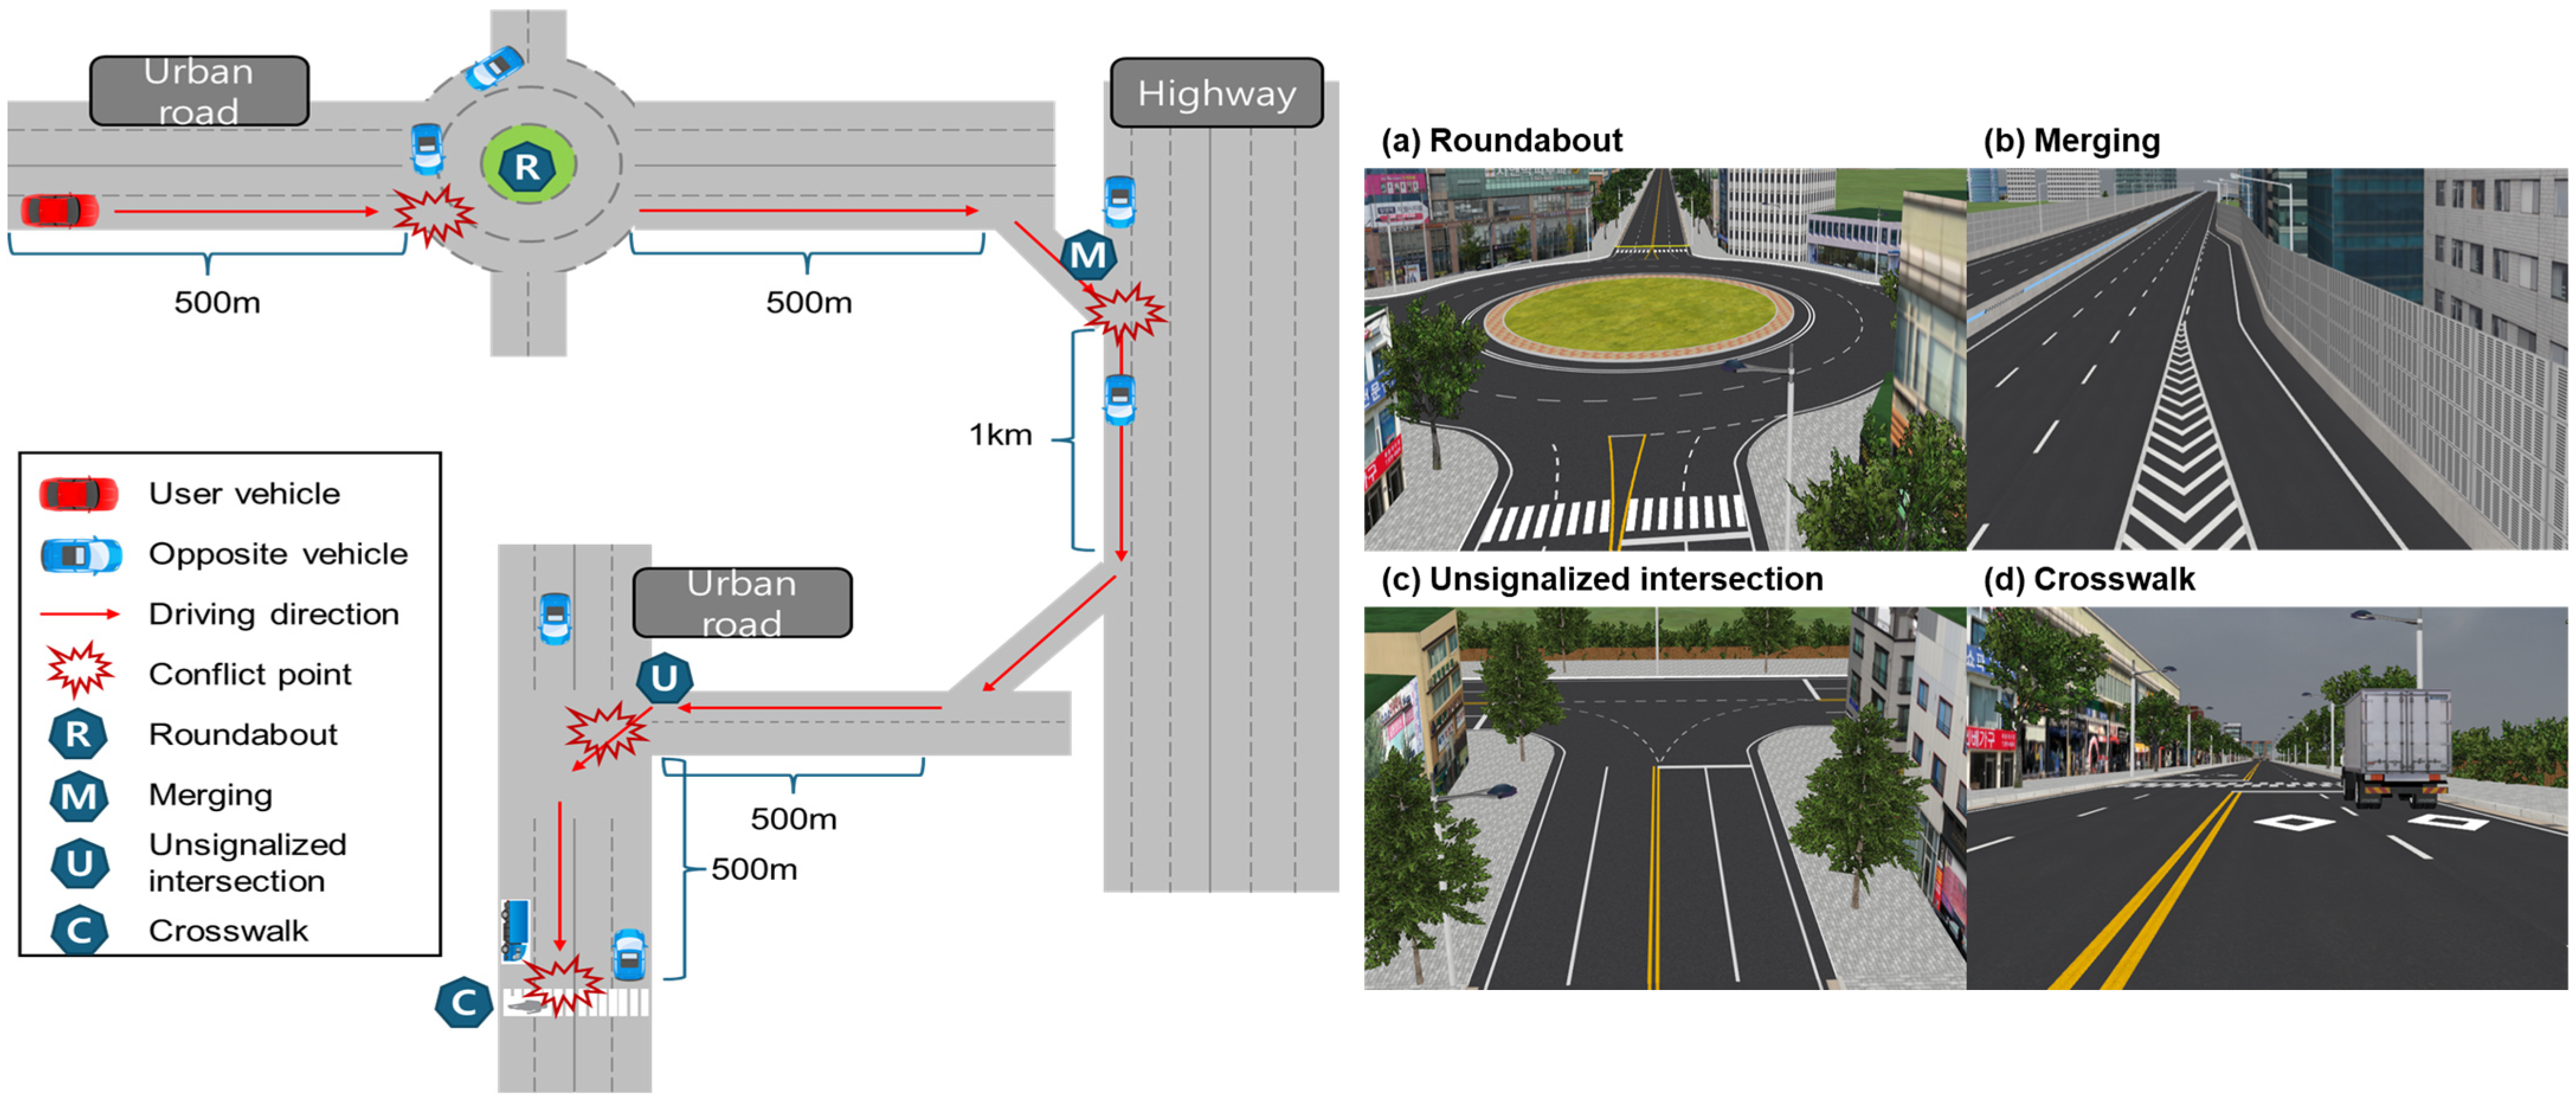
2.1.2. Experimental VR Scenario Design
2.1.3. Automated-Driving Implementation
2.1.4. Implementation of Events for Automated-Driving Evaluation
2.1.5. Automated-Driving Evaluation
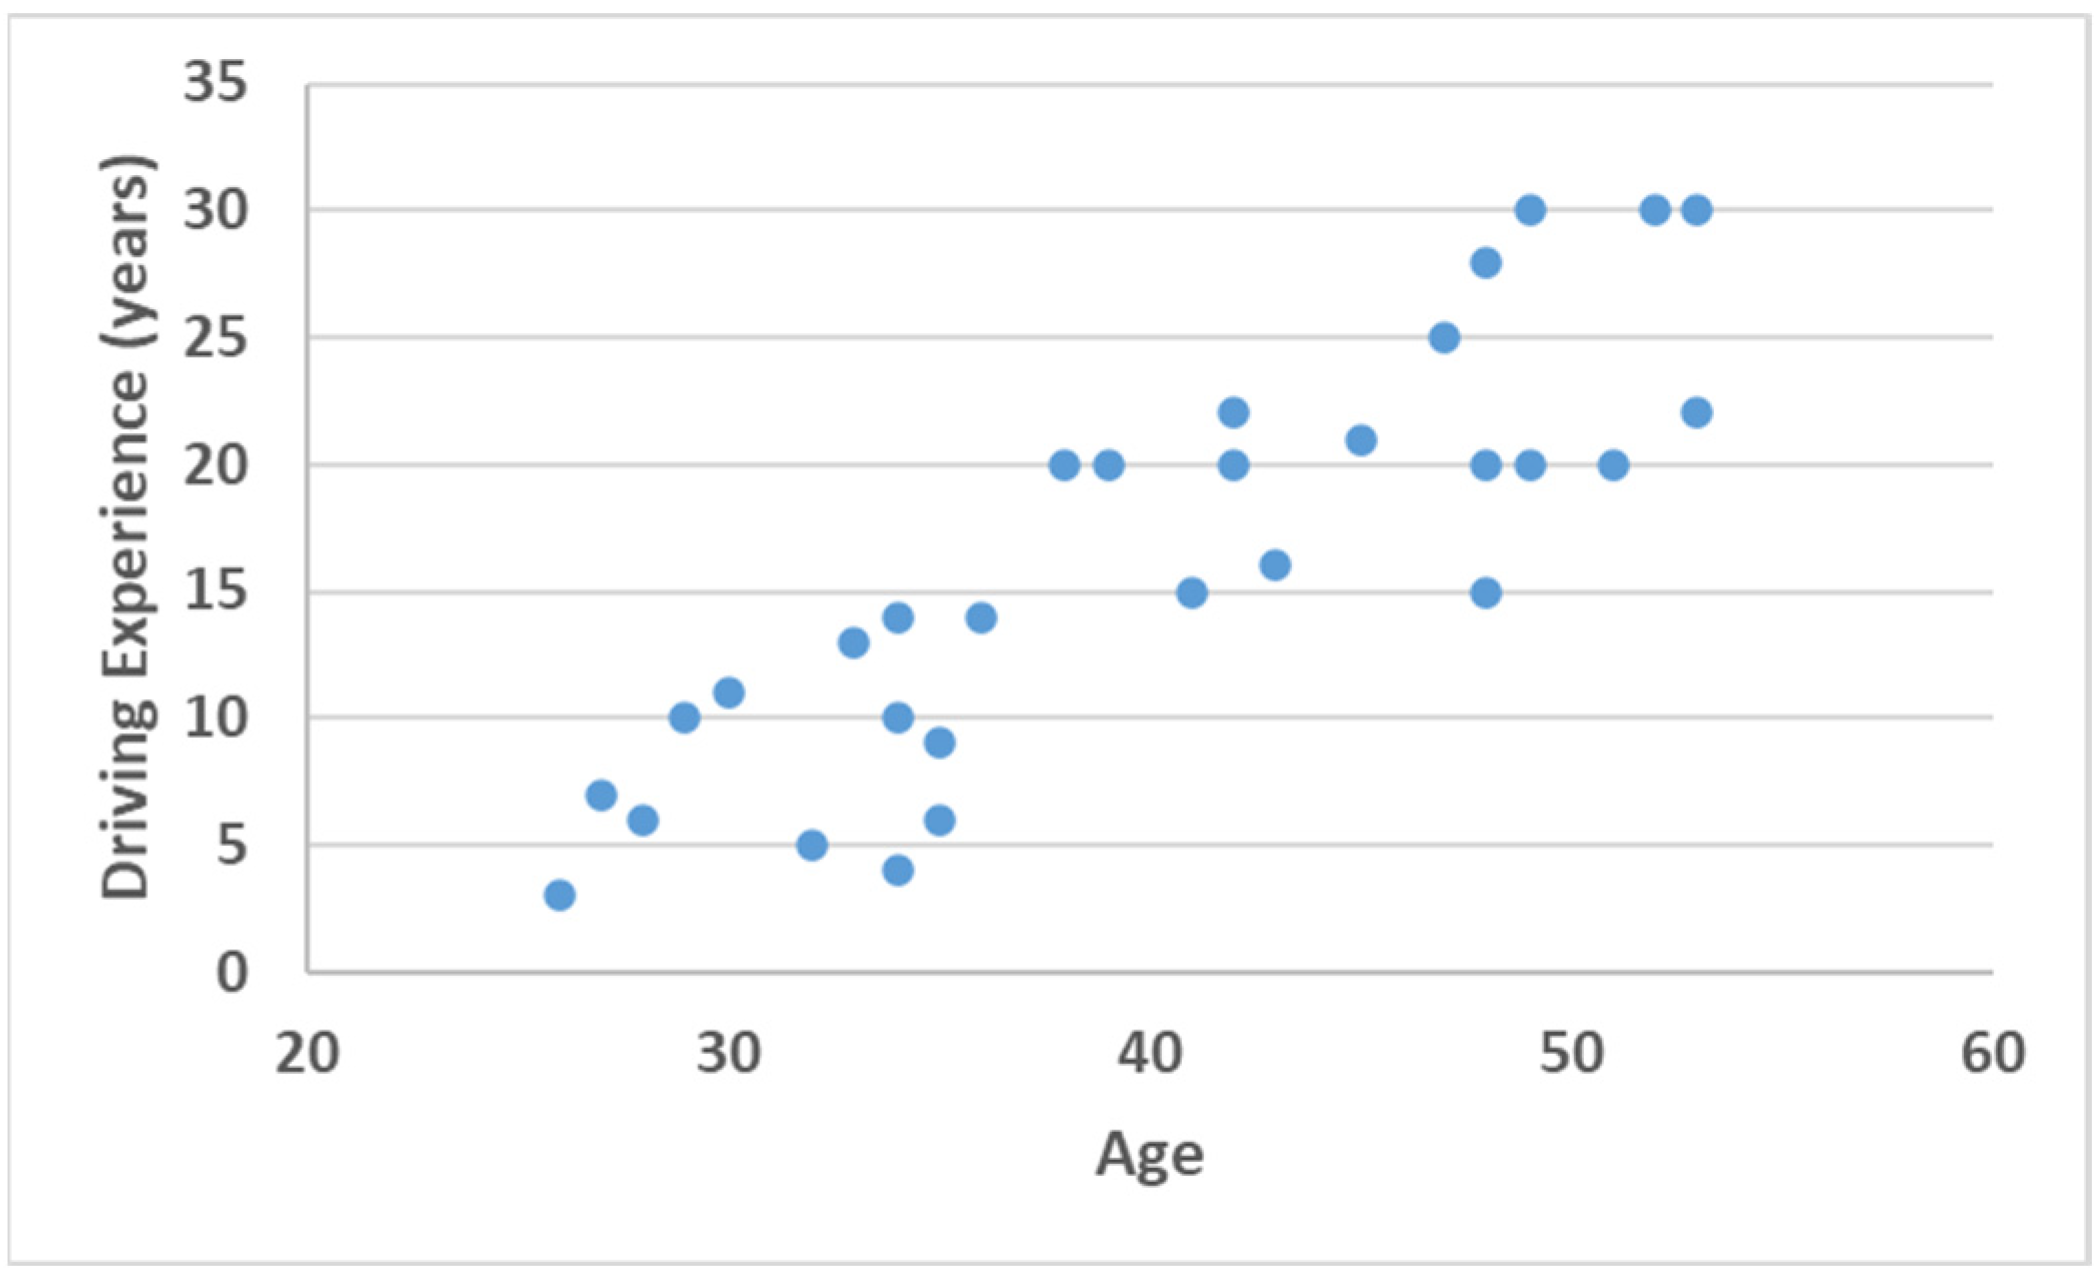
2.2. Participants
2.3. Experiment Procedure
2.4. Analysis Method
2.5. Statistical Analysis Method
3. Results
3.1. User Evaluation of the Overall Automated-Driving Style
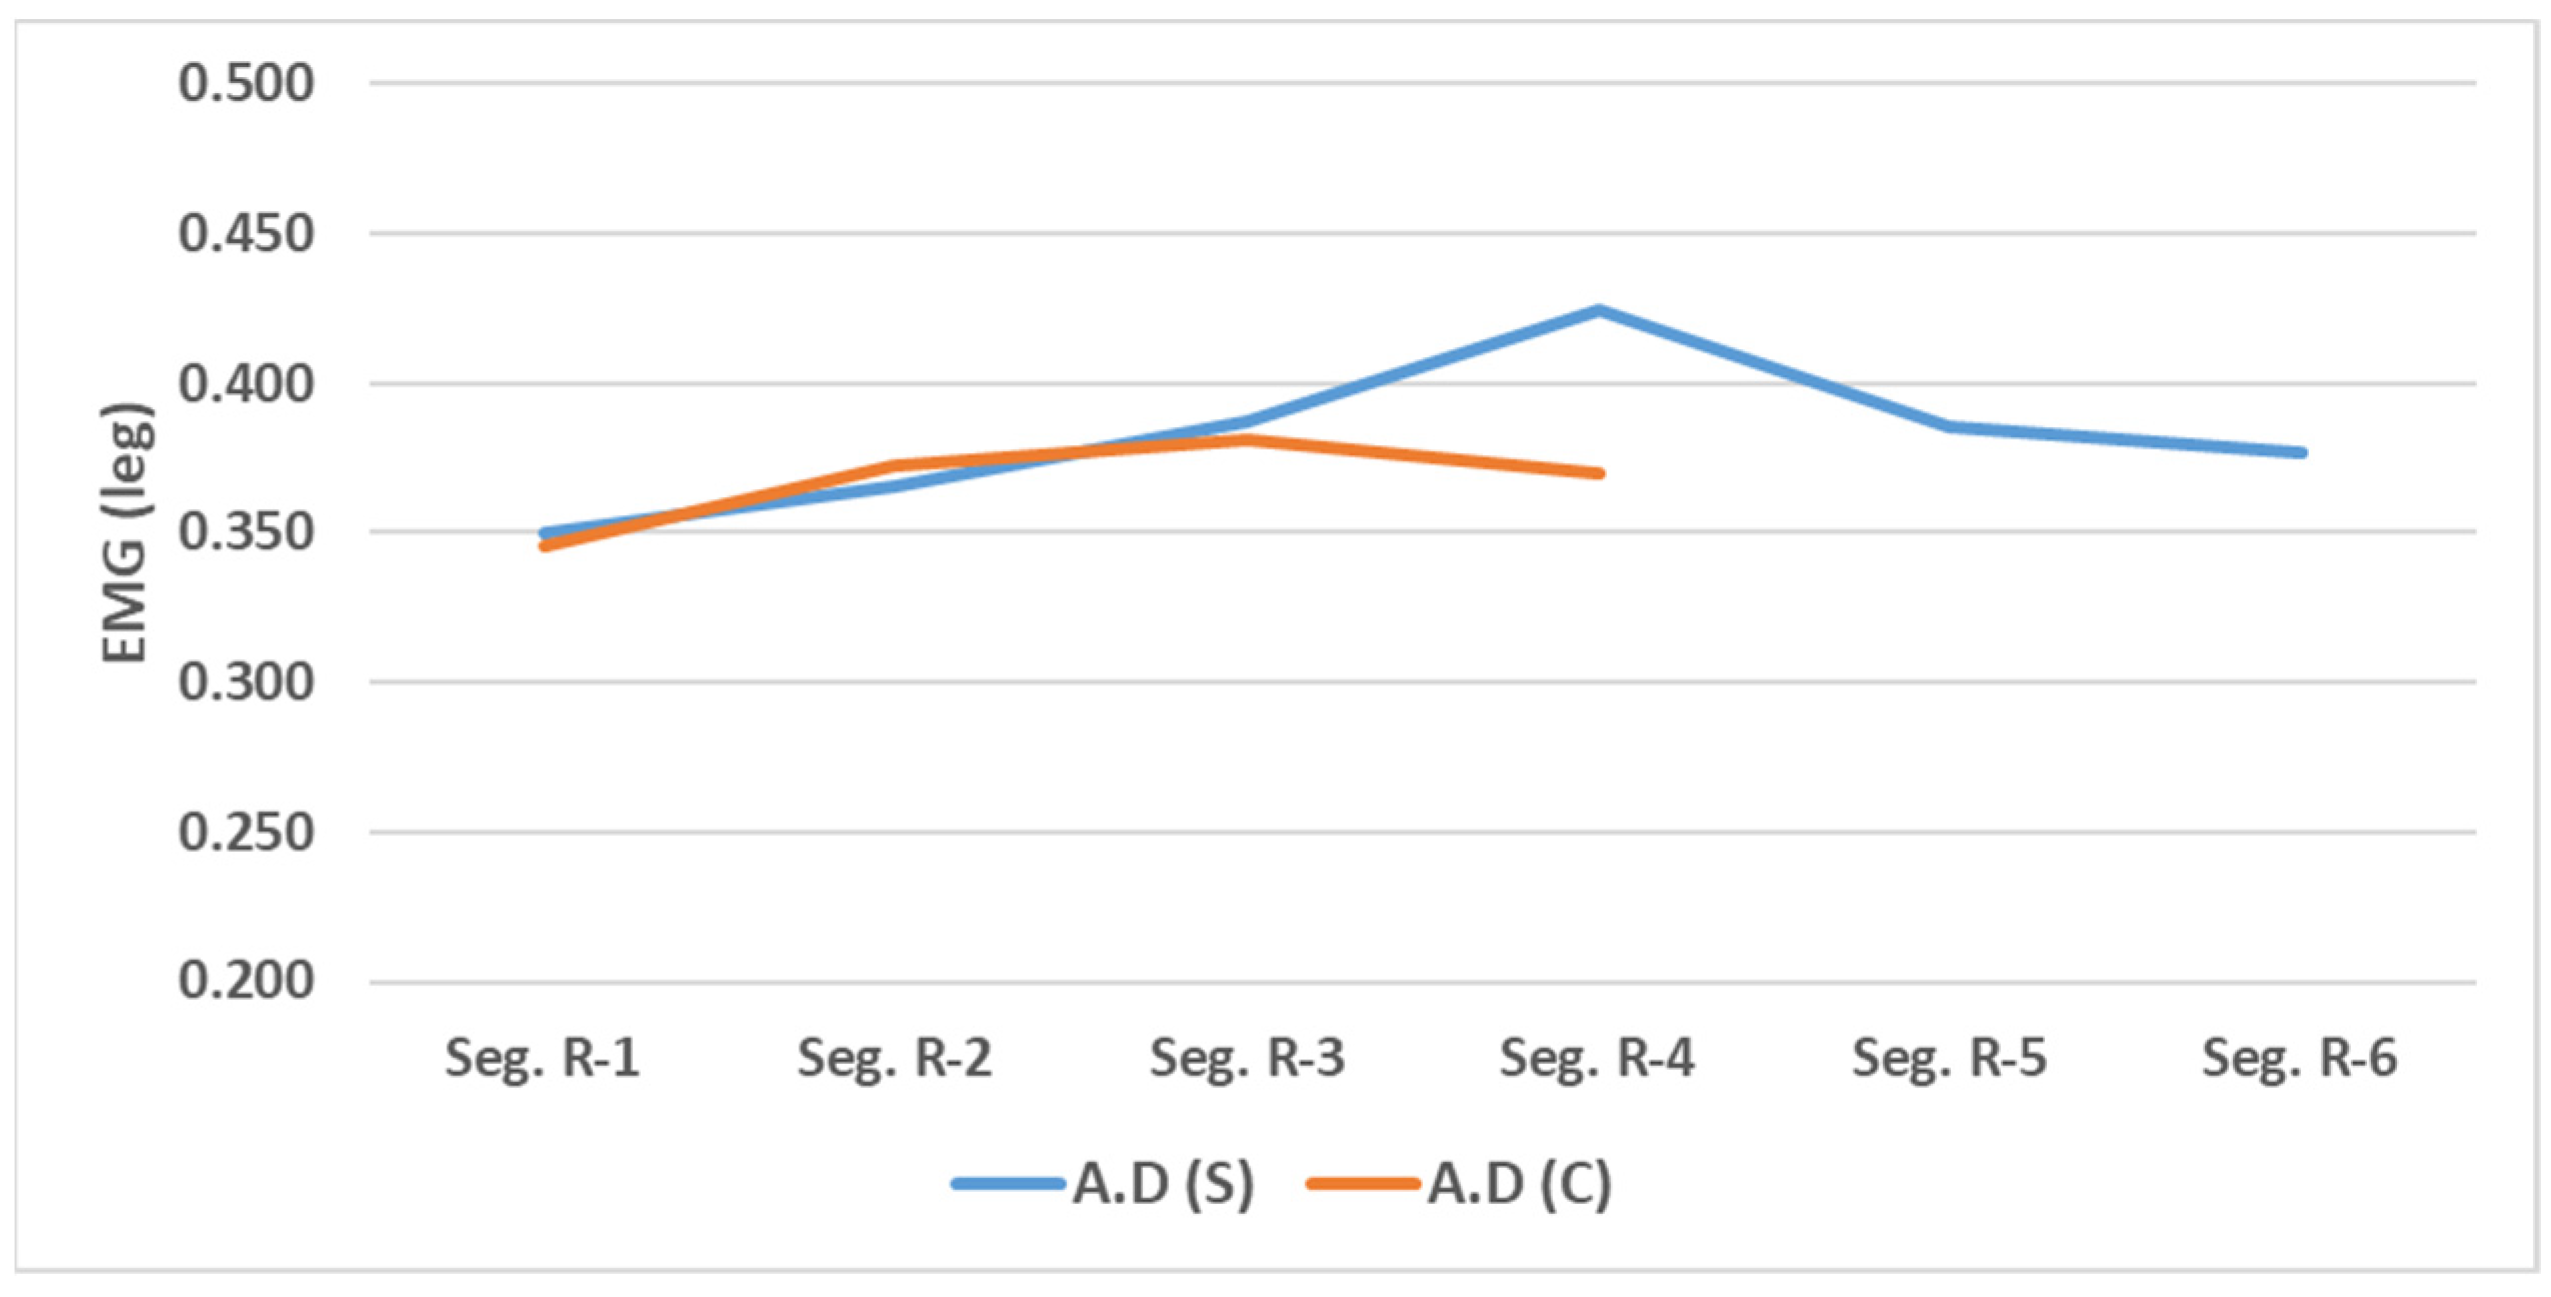
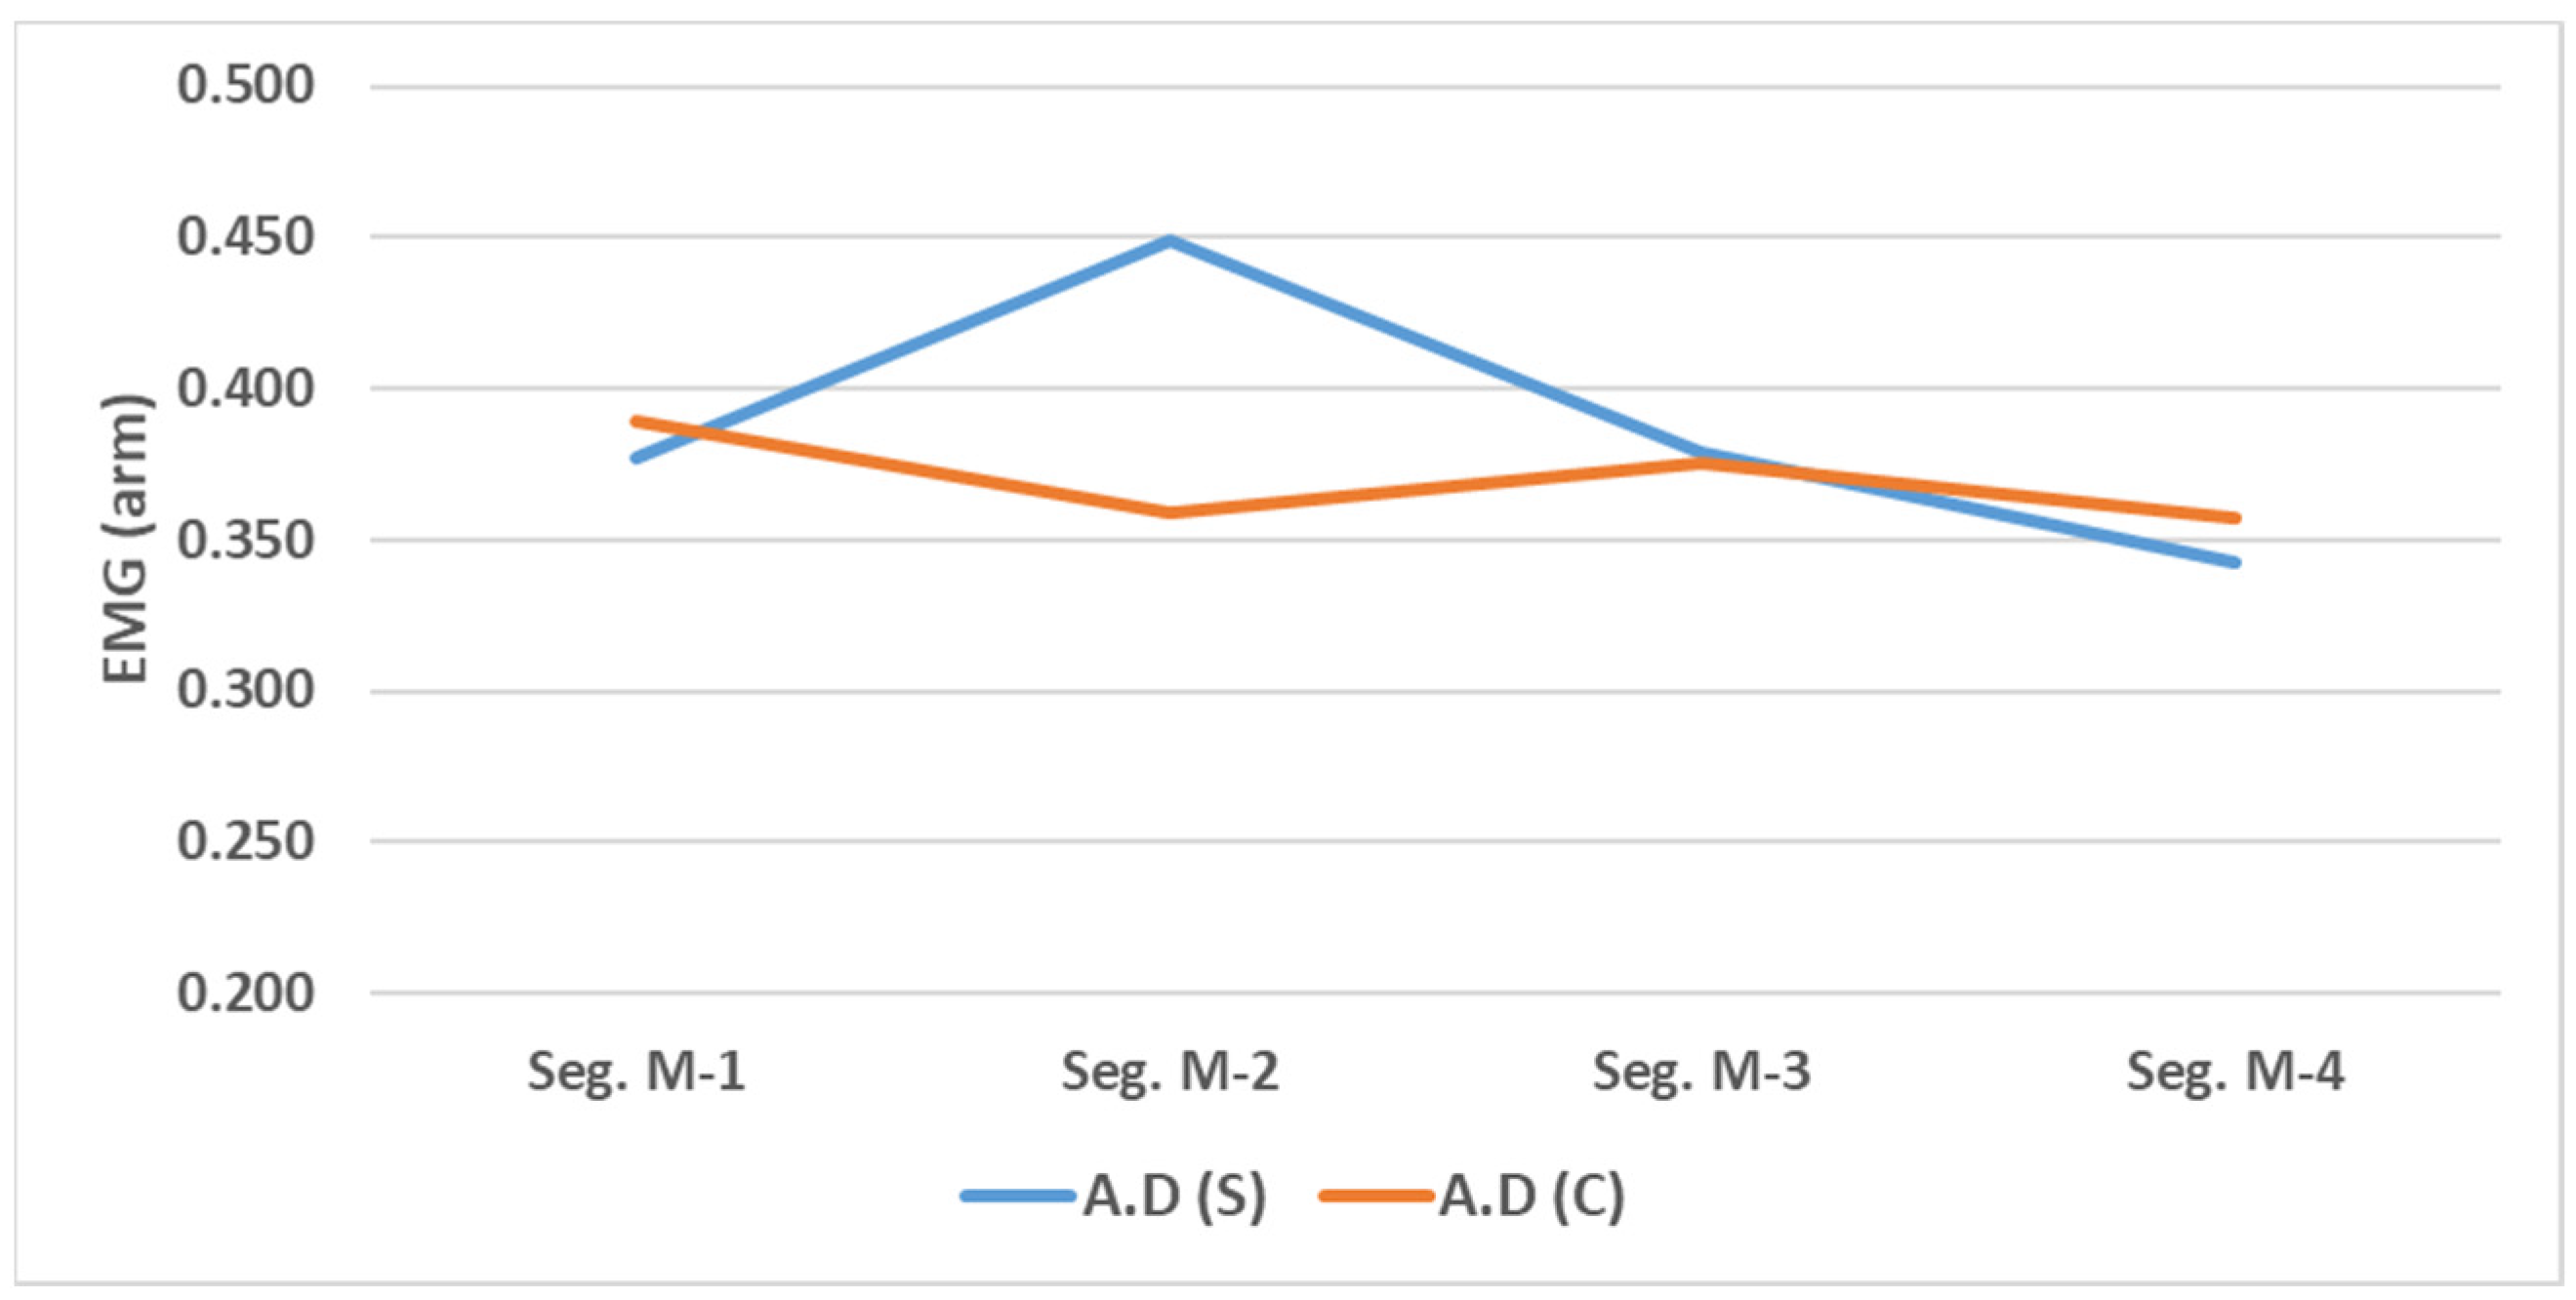
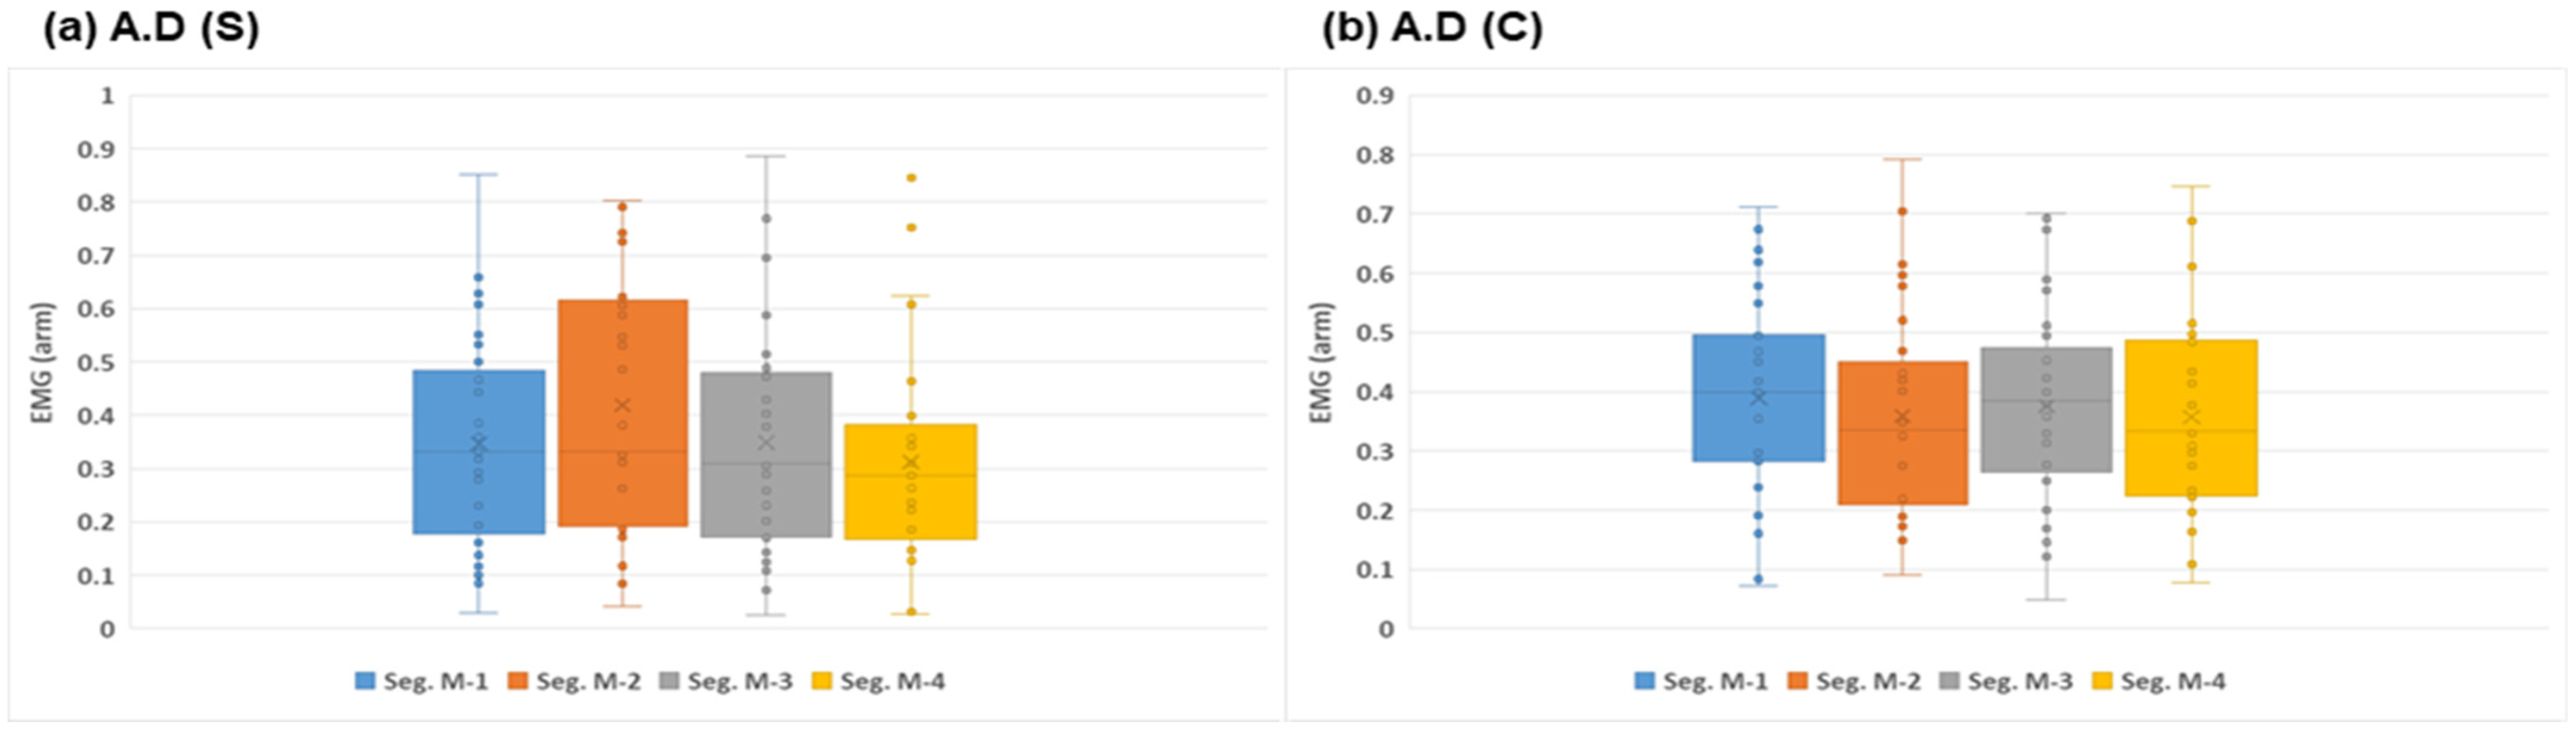
3.2. Evaluation of User Response Under Extended Delay Conditions
3.3. Evaluation of User Response to Unexpected Events
4. Discussion
5. Conclusions
Author Contributions
Funding
Institutional Review Board Statement
Informed Consent Statement
Data Availability Statement
Acknowledgments
Conflicts of Interest
Correction Statement
References
- McAslan, D.; Najar Arevalo, F.; King, D.A.; Miller, T.R. Pilot project purgatory? Assessing automated driving vehicle pilot projects in U.S. cities. Humanit. Soc. Sci. Commun. 2021, 8, 325. [Google Scholar] [CrossRef]
- Wang, Q. Study on the Impact of Autonomous Driving Technology on the Economy and Society. SHS Web Conf. 2024, 208, 01008. [Google Scholar] [CrossRef]
- Boston Consulting Group. The Self-Driving Car Revolution; BCG: Boston, MA, USA, 2023. [Google Scholar]
- Nastjuk, I.; Herrenkind, B.; Marrone, M.; Brendel, A.B.; Kolbe, L.M. What drives the acceptance of autonomous driving? An investigation of acceptance factors from an end-user’s perspective. Technol. Forecast. Soc. Chang. 2020, 161, 120319. [Google Scholar] [CrossRef]
- Paddeu, D.; Parkhurst, G.; Shergold, I. Passenger comfort and trust on first-time use of a shared autonomous shuttle vehicle. Transp. Res. Part C Emerg. Technol. 2020, 115, 102604. [Google Scholar] [CrossRef]
- Adnan, N.; Nordin, S.M.; bin Bahruddin, M.A.; Ali, M. How trust can drive forward the user acceptance to the technology? In-vehicle technology for autonomous vehicle. Transp. Res. Part A Policy Pract. 2018, 118, 819–836. [Google Scholar] [CrossRef]
- Peng, C.; Li, W.; Wang, Y.; Zhang, X. Conceptualising user comfort in automated driving: Findings from an expert group workshop. Transp. Res. Interdiscip. Perspect. 2024, 24, 101070. [Google Scholar] [CrossRef]
- Domova, V.; Currano, R.M.; Sirkin, D. Comfort in Automated Driving: A Literature Survey and a High-Level Integrative Framework. Proc. ACM Interact. Mob. Wearable Ubiquitous Technol. 2024, 8, 1–23. [Google Scholar] [CrossRef]
- Häuslschmid, R.; von Buelow, M.; Pfleging, B.; Butz, A. Supporting Trust in autonomous driving. In Proceedings of the 22nd International Conference on Intelligent User Interfaces, Limassol, Cyprus, 13–16 March 2017; pp. 319–329. [Google Scholar]
- Matin, A.; Dia, H. Public perception of connected and automated driving vehicles: Benefits, concerns, and barriers from an Australian perspective. J. Intell. Connect. Veh. 2024, in press. [Google Scholar] [CrossRef]
- Shin, H. Thought I Would Be Thrown Off… Passengers Startled While Riding Autonomous Bus in Seoul. Hankyung. 13 December 2024. Available online: https://www.hankyung.com/article/2024121338307 (accessed on 2 January 2025).
- Kwag, J.; Toth, C. A Review on End-to-End High-Definition Map Generation. Int. Arch. Photogramm. Remote Sens. Spat. Inf. Sci. 2024, 48, 187–194. [Google Scholar] [CrossRef]
- Yurtsever, E.; Lambert, J.; Carballo, A.; Takeda, K. A survey of autonomous driving: Common practices and emerging technologies. IEEE Access 2020, 8, 58443–58469. [Google Scholar] [CrossRef]
- Fayyad, J.; Jaradat, M.A.; Gruyer, D.; Najjaran, H. Deep learning sensor fusion for autonomous vehicle perception and localization: A review. Sensors 2020, 20, 4220. [Google Scholar] [CrossRef] [PubMed]
- Jiang, H.; Yang, X.; Liang, B.; Li, K. A review of traffic behaviour and intelligent driving at roundabouts based on a microscopic perspective. Transp. Saf. Environ. 2024, 6, 124–142. [Google Scholar] [CrossRef]
- Xu, S.Y.; Li, S.E.; Deng, K.; Li, S. Decision-Making Models for Autonomous Vehicles at Unsignalized Intersections Based on Deep Reinforcement Learning. In Proceedings of the 2022 International Conference on Advanced Robotics and Mechatronics (ICARM), Singapore, 4–6 July 2022; pp. 1–6. [Google Scholar]
- Chougule, A.; Jha, V.K.; Mukhopadhyay, D.; Chakraborty, B. A comprehensive review on limitations of autonomous driving and its impact on accidents and collisions. IEEE Open J. Veh. Technol. 2023, 4, 422–438. [Google Scholar] [CrossRef]
- Meinlschmidt, G.; Tegethoff, D.; Pindeus, L.; Lueders, A. Anticipated fear and anxiety of Automated Driving Systems: Estimating the prevalence in a national representative survey. Int. J. Clin. Health Psychol. 2023, 23, 100371. [Google Scholar] [CrossRef]
- Dolins, S.; Straubel, C.; Glickman, L.; Das, A. Sharing anxiety is in the driver’s seat: Analyzing user acceptance of dynamic ridepooling and its implications for shared autonomous mobility. Sustainability 2021, 13, 7828. [Google Scholar] [CrossRef]
- Shariff, A.; Bonnefon, J.F.; Rahwan, I. Psychological roadblocks to the adoption of self-driving vehicles. Nat. Hum. Behav. 2017, 1, 694–696. [Google Scholar] [CrossRef] [PubMed]
- Yazdi, H.; Wickman, C.; Ljung Aust, M.; Selbing, I.; Kowalski, L.; Axelsson, J. Understanding frustration triggers and emotional responses in driving situations. Sci. Rep. 2024, 14, 28613. [Google Scholar] [CrossRef]
- Feng, S.; Wu, X.; Shen, J.; Ma, D. Factors on perceived waiting time and implications on passengers’ satisfaction with waiting time. PROMET-Traffic Transp. 2016, 28, 155–163. [Google Scholar] [CrossRef]
- Stephenson, A.C.; Eimontaite, I.; Caleb-Solly, P.; Morgan, P.L. Effects of an unexpected and expected event on older adults’ autonomic arousal and eye fixations during autonomous driving. Front. Psychol. 2020, 11, 571961. [Google Scholar] [CrossRef]
- Carsten, O.; Lai, F.C.; Barnard, Y.; Jamson, A.H.; Merat, N. Control task substitution in semiautomated driving: Does it matter what aspects are automated? Hum. Factors 2012, 54, 747–761. [Google Scholar] [CrossRef]
- Zheng, R.; Yamabe, S.; Nakano, K.; Suda, Y. Biosignal analysis to assess mental stress in automatic driving of trucks: Palmar perspiration and masseter electromyography. Sensors 2015, 15, 5136–5150. [Google Scholar] [CrossRef] [PubMed]
- Ruscio, D.; Bos, A.J.; Ciceri, M.R. Distraction or cognitive overload? Using modulations of the autonomic nervous system to discriminate the possible negative effects of advanced assistance system. Accid. Anal. Prev. 2017, 103, 105–111. [Google Scholar] [CrossRef]
- Lohani, M.; Payne, B.R.; Strayer, D.L. A review of psychophysiological measures to assess cognitive states in real-world driving. Front. Hum. Neurosci. 2019, 13, 57. [Google Scholar] [CrossRef]
- Arakawa, T.; Hibi, R.; Fujishiro, T. Psychophysical assessment of a driver’s mental state in autonomous vehicles. Transp. Res. Part A Policy Pract. 2019, 124, 587–610. [Google Scholar] [CrossRef]
- Beggiato, M.; Hartwich, F.; Krems, J. Physiological correlates of discomfort in automated driving. Transp. Res. Part F Traffic Psychol. Behav. 2019, 66, 445–458. [Google Scholar] [CrossRef]
- Dillen, N.; Ilievski, M.; Law, E.; Nacke, L.E.; Czarnecki, K.; Schneider, O. Keep calm and ride along: Passenger comfort and anxiety as physiological responses to autonomous driving styles. In Proceedings of the 2020 CHI Conference on Human Factors in Computing Systems, Honolulu, HI, USA, 25–30 April 2020; pp. 1–13. [Google Scholar]
- Strauch, C.; Mühl, K.; Patro, K.; Grabmaier, C.; Reithinger, S.; Baumann, M.; Krems, J. Real autonomous driving from a passenger’s perspective: Two experimental investigations using gaze behaviour and trust ratings in field and simulator. Transp. Res. Part F Traffic Psychol. Behav. 2019, 66, 15–28. [Google Scholar] [CrossRef]
- Kim, H.; Miyakoshi, M.; Kim, Y.; Stapornchaisit, S.; Yoshimura, N.; Koike, Y. Electroencephalography Reflects User Satisfaction in Controlling Robot Hand through Electromyographic Signals. Sensors 2022, 23, 277. [Google Scholar] [CrossRef]
- Grosse, P.; Cassidy, M.J.; Brown, P. EEG-EMG, MEG-EMG and EMG-EMG frequency analysis: Physiological principles and clinical applications. Clin. Neurophysiol. 2002, 113, 1523–1531. [Google Scholar] [CrossRef]
- Anderson, E.A.; Wallin, B.G.; Mark, A.L. Dissociation of sympathetic nerve activity in arm and leg muscle during mental stress. Hypertension 1987, 9, III114–III119. [Google Scholar] [CrossRef]
- Hoehn-Saric, R.; Hazlett, R.L.; Pourmotabbed, T.; McLeod, D.R. Does muscle tension reflect arousal? Relationship between electromyographic and electroencephalographic recordings. Psychiatry Res. 1997, 71, 49–55. [Google Scholar] [CrossRef]
- Tao, X.; Zhou, X.; Wei, L.; Zhang, N. A multimodal physiological dataset for driving behaviour analysis. Sci. Data 2024, 11, 378. [Google Scholar] [CrossRef]
- Habibifar, N.; Salmanzadeh, H. Relationship between driving styles and biological behavior of drivers in negative emotional state. Transp. Res. Part F Traffic Psychol. Behav. 2022, 85, 245–258. [Google Scholar] [CrossRef]
- Lee, C.; Lee, C.; Kim, D.G.; Lim, J. Predicting Driver’s mental workload using physiological signals: A functional data analysis approach. Appl. Ergon. 2024, 118, 104274. [Google Scholar] [CrossRef]
- Wei, H.; Zhu, M.; Cai, G.; Li, J. Takeover Level of Autonomous Vehicle Based on Driver’s Neuromuscular Characteristic; SAE Technical Paper No. 2020-01-5017; SAE International: Warrendale, PA, USA, 2020. [Google Scholar]
- Klingner, J.; Tversky, B.; Hanrahan, P. Effects of visual and verbal presentation on cognitive load in vigilance, memory, and arithmetic tasks. Psychophysiology 2011, 48, 323–332. [Google Scholar] [CrossRef]
- Han, L.; Du, Z.; Kang, X. The impact of visual attractions on drivers’ visual performance and mental workload in highway tunnel access zones. Transp. Res. Part F Traffic Psychol. Behav. 2024, 107, 1232–1256. [Google Scholar] [CrossRef]
- Wang, C.; Yang, X.; Xu, J.; Ma, S. Analysis of Drivers’ Workload States on Highways in High Elevation Regions. Transp. Res. Rec. 2024, 2678, 1523–1544. [Google Scholar] [CrossRef]
- Alnæs, D.; Sneve, M.H.; Espeseth, T.; Endestad, T.; van de Pavert, S.H.P.; Laeng, B. Pupil diameter signals mental effort deployed during multiple object tracking and predicts brain activity in the dorsal attention network and the locus coeruleus. J. Vis. 2014, 14, 1. [Google Scholar] [CrossRef]
- Korn, C.W.; Staib, M.; Tzovara, A.; Castegnetti, G.; Bach, D.R. A pupil diameter response model to assess fear learning. Psychophysiology 2017, 54, 330–343. [Google Scholar] [CrossRef]
- Leuchs, L.; Schneider, M.; Spoormaker, V.I. Measuring the conditioned response: A comparison of pupillometry, skin conductance, and startle electromyography. Psychophysiology 2019, 56, e13283. [Google Scholar] [CrossRef]
- Schneider, T.; Weinmann, M.; vom Brocke, J. Explain yourself! transparency for positive ux in autonomous driving. In Proceedings of the 2021 CHI Conference on Human Factors in Computing Systems, Online, 8–13 May 2021; pp. 1–12. [Google Scholar]
- Tan, H.; Chen, C.; Lyu, N.; Liu, B. User experience & usability of driving: A bibliometric analysis of 2000–2019. Int. J. Hum. Comput. Interact. 2021, 37, 297–307. [Google Scholar]
- Kyriakidis, M.; de Winter, J.C.F.; Stanton, N.; Bellet, T. A human factors perspective on automated driving. Theor. Issues Ergon. Sci. 2019, 20, 223–249. [Google Scholar] [CrossRef]
- Meinlschmidt, G.; Stalujanis, E.; Tegethoff, M. The psychobiology of using automated driving systems: A systematic review and integrative model. Psychoneuroendocrinology 2019, 105, 51–63. [Google Scholar] [CrossRef] [PubMed]
- He, X.; Li, J.; Wu, J.; Zhang, Y.; Wang, W. Modelling perceived risk and trust in driving automation reacting to merging and braking vehicles. Transp. Res. Part F Traffic Psychol. Behav. 2022, 86, 178–195. [Google Scholar] [CrossRef]
- Hwang, S.; Lee, D. Evaluation of Preferred Automated Driving Patterns Based on a Driving Propensity Using Fuzzy Inference System. J. Adv. Transp. 2024, 2024, 6628559. [Google Scholar] [CrossRef]
- Hwang, S.; Lee, D. A Study on User Satisfaction Evaluation of Acceleration-Based Automated Driving Patterns. J. Korea Inst. Intell. Transp. Syst. 2023, 22, 284–298. [Google Scholar] [CrossRef]
- Wang, J.; Li, K.; Lu, X.Y. Effect of Human Factors on Driver Behavior. In Advances in Intelligent Vehicles; Academic Press: Cambridge, MA, USA, 2014; pp. 111–157. [Google Scholar]
- Li, W.; Wang, J.; Xu, L.; Zhao, Y. The Effect of Driver Fatigue on Takeover Reaction Time under Human-Machine Co-Driving. In Proceedings of the 2023 7th International Conference on Transportation Information and Safety (ICTIS), Xining, China, 14–16 July 2023; pp. 1672–1677. [Google Scholar]
- Jeong, S.; Lee, D. Driving Behavior Characteristics of Merging Sections in the Urban Underground Road Junction: A Driving Simulator Study. Appl. Sci. 2024, 14, 6247. [Google Scholar] [CrossRef]
- Kim, D.; Joo, S.; Choi, H.; Ryu, J. A Study on Assessing User Preferences for Autonomous Driving Behavior Using a Driving Simulator. J. Korea Inst. Intell. Transp. Syst. 2023, 22, 147–159. [Google Scholar] [CrossRef]
- Boualam, O.; Hobeika, A.G.; Levin, M.W.; Nambisan, S.S. Impact of autonomous vehicles on roundabout capacity. Sustainability 2022, 14, 2203. [Google Scholar] [CrossRef]
- Campi, E.; Pedrosa, A.M.; Baldi, S.; Martí, R. Roundabouts: Traffic Simulations of Connected and Automated driving vehicles—A State of the Art. IEEE Trans. Intell. Transp. Syst. 2023. early access. [Google Scholar] [CrossRef]
- Jung, M.S. Dream Autonomous Driving Level 5 … No Steering Wheel and Driver, Freely Using Smartphone. Ajunews. 6 April 2019. Available online: https://www.ajunews.com/view/20190406142631856 (accessed on 2 January 2025).
- Van Der Laan, J.D.; Heino, A.; De Waard, D. A simple procedure for the assessment of acceptance of advanced transport telematics. Transp. Res. Part C Emerg. Technol. 1997, 5, 1–10. [Google Scholar] [CrossRef]
- Lakens, D. Sample size justification. Collab. Psychol. 2022, 8, 33267. [Google Scholar] [CrossRef]
- Islam, M.R. Sample size and its role in Central Limit Theorem (CLT). Comput. Appl. Math. J. 2018, 4, 1–7. [Google Scholar]
- Iskander, J.; Attia, M.; Saleh, K.; Nahavandi, D.; Abobakr, A.; Mohamed, S.; Asadi, H.; Khosravi, A.; Lim, C.P.; Nahavandi, S. From car sickness to autonomous car sickness: A review. Transp. Res. Part F Traffic Psychol. Behav. 2019, 62, 716–726. [Google Scholar] [CrossRef]
- Aykent, B.; Merienne, F.; Guillet, C.; Paillot, D.; Kemeny, A. Motion sickness evaluation and comparison for a static driving simulator and a dynamic driving simulator. Proc. Inst. Mech. Eng. Part D J. Automob. Eng. 2014, 228, 818–829. [Google Scholar] [CrossRef]
- Graci, V.; Jones, K.J.; Miller, M.A.; Seacrist, T. The effect of reclined seatback angles on the motion of booster-seated children during lateral-oblique low-acceleration impacts. Accid. Anal. Prev. 2023, 188, 107117. [Google Scholar] [CrossRef]
- Islam, M.J.; Tsuji, K.; Chowdhury, R.H.; Uddin, J.; Hossain, S.M.R.; Amin, M.A.A. Application of min-max normalization on subject-invariant EMG pattern recognition. IEEE Trans. Instrum. Meas. 2022, 71, 1–12. [Google Scholar] [CrossRef]
- Parrinello, C.M.; Grams, M.E.; Couper, D.; Ballantyne, C.M.; Hoogeveen, R.C.; Eckfeldt, J.H.; Selvin, E. Iterative outlier removal: A method for identifying outliers in laboratory recalibration studies. Clin. Chem. 2016, 62, 966–972. [Google Scholar] [CrossRef]
- Menegaldo, L.L. Real-time muscle state estimation from EMG signals during isometric contractions using Kalman filters. Biol. Cybern. 2017, 111, 335–346. [Google Scholar] [CrossRef]
- Cohen, J. Statistical Power Analysis for the Behavioral Sciences, 2nd ed.; Lawrence Erlbaum Associates: Hillsdale, NJ, USA, 1988. [Google Scholar]
- Colley, M.; Rixen, C.; Rukzio, E.; Pfleging, B. Effects of uncertain trajectory prediction visualization in highly automated driving vehicles on trust, situation awareness, and cognitive load. Proc. ACM Interact. Mob. Wearable Ubiquitous Technol. 2024, 7, 1–23. [Google Scholar]
- De Cet, G.; Boussard, C.; Castaing, J.; Delahaye, D. Do we trust automated driving vehicles? A driving simulator study. Transp. Res. Procedia 2024, 78, 174–181. [Google Scholar] [CrossRef]
- Kim, S.; Park, J.; Lee, H.; Kim, M. Designing user interfaces for partially automated driving vehicles: Effects of information and modality on trust and acceptance. Transp. Res. Part F Traffic Psychol. Behav. 2024, 103, 404–419. [Google Scholar] [CrossRef]
- Haboucha, C.J.; Ishaq, R.; Shiftan, Y. User preferences regarding autonomous vehicles. Transp. Res. Part C Emerg. Technol. 2017, 78, 37–49. [Google Scholar] [CrossRef]
- Wang, S.; Zhao, J. Risk preference and adoption of autonomous vehicles. Transp. Res. Part A Policy Pract. 2019, 126, 215–229. [Google Scholar] [CrossRef]
- Gao, B.; Guo, K.; Chen, H.; Wei, K. Personalized adaptive cruise control based on online driving style recognition technology and model predictive control. IEEE Trans. Veh. Technol. 2020, 69, 12482–12496. [Google Scholar] [CrossRef]


| Categories | A.D(S) | A.D(C) | |
|---|---|---|---|
| Driving speed (km/h) | Urban road | 60 km/h | |
| Highway | 80 km/h | ||
| Acceleration () | 1.0 | ||
| Deceleration () | −2.8 | ||
| Gap acceptance (s) | 5 s ≤ | 4 s ≤ | |
| Etc. | Driving assumption based on traffic evaluation using only vehicle sensors and systems | Driving assumption based on traffic evaluation while sharing information with surrounding vehicles and infrastructure | |
| Categories | A.D(S) | A.D(C) |
|---|---|---|
| Roundabout | - Post-stop departure : Gap acceptance after 8 rejections of gaps under 5 s | - Post-stop departure : Gap acceptance after 4 rejections of gaps under 4 s |
| Merging | - Post-stop departure : Gap acceptance after 8 rejections of gaps under 5 s | - Low-speed merge sequence : Gap acceptance after 3 rejections of gaps under 4 s |
| Unsignalized intersection | - Sudden stop activation due to blind-spot latency in oncoming vehicle detection - Post-stop departure : Gap acceptance after 7 rejections of gaps under 5 s | - Controlled deceleration to stop based on early detection of oncoming vehicle - Post-stop departure : Gap acceptance after 3 rejections of gaps under 4 s |
| Crosswalk | - Sudden stop activation and subsequent departure due to blind-spot latency in pedestrian detection | - Controlled stop and departure based on early pedestrian detection |
| Ages | Male | Female | Total |
|---|---|---|---|
| 20s | 2 | 2 | 4 |
| 30s | 8 | 3 | 11 |
| 40s | 8 | 3 | 11 |
| 50s | 3 | 1 | 4 |
| Total | 21 | 9 | 30 |
| Roundabout | Merging | Unsignalized Intersection | Crosswalk | ||||||||
|---|---|---|---|---|---|---|---|---|---|---|---|
| Seg. | A.V(S) | A.V(C) | Seg. | A.V(S) | A.V(C) | Seg. | A.V(S) | A.V(C) | Seg. | A.V(S) | A.V(C) |
| R-1 | Pre-entry (10 s) | M-1 | Pre-entry (10 s) | U-1 | Pre-entry (10 s) | C-1 | Pre-entry (10 s) | ||||
| R-2 | Stop at stop line (3 s) | M-2 | Wait (15 s) | Slow-driving (5 s) | U-2 | Stop at stop line (3 s) | C-2 | Sudden stop activation (3 s) | |||
| R-3 | Gap rejection (10 s) | M-3 | Merging (5 s) | U-3 | Gap rejection (10 s) | ||||||
| R-4 | Rejection of 4 s gap (6 s) | Gap acceptance (6 s) | M-4 | Driving on highway (10 s) | U-4 | Rejection of 4 s gap (6 s) | Gap acceptance (6 s) | ||||
| R-5 | Gap rejection (10 s) | U-5 | Gap acceptance (6 s) | ||||||||
| R-6 | Gap acceptance (6 s) | ||||||||||
| Categories | A.D(S) | A.D(C) | |
|---|---|---|---|
| Overall driving | Usefulness | 3.12 | 3.79 |
| Satisfaction | 2.71 | 3.93 | |
| Roundabout | Usefulness | 2.63 | 3.61 |
| Satisfaction | 2.26 | 3.73 | |
| Merging | Usefulness | 2.66 | 3.03 |
| Satisfaction | 2.24 | 2.89 | |
| Unsignalized intersection | Usefulness | 2.37 | 3.63 |
| Satisfaction | 2.15 | 3.65 | |
| Crosswalk | Usefulness | 1.92 | 3.44 |
| Satisfaction | 2.05 | 3.52 | |
| Categories | A.D(S) | A.D(C) | |||||||
|---|---|---|---|---|---|---|---|---|---|
| Mean | S.D. | Mean Difference (ρ-Value) * | Cohen’s d | Mean | S.D. | Mean Difference (ρ-Value) * | Cohen’s d | ||
| Self-rating of frustration (5 scale) | 3.84 | - | - | - | 1.82 | - | - | - | |
| EMG (arm) (0–1 n.u.) | Seg. R-1 | 0.351 | 0.212 | - | - | 0.333 | 0.142 | - | - |
| Seg. R-2 | 0.360 | 0.204 | 0.009 (0.800) | 0.048 | 0.341 | 0.174 | 0.007 (0.857) | 0.034 | |
| Seg. R-3 | 0.339 | 0.213 | −0.012 (0.796) | 0.048 | 0.355 | 0.150 | 0.022 (0.516) | 0.122 | |
| Seg. R-4 | 0.336 | 0.202 | −0.016 (0.632) | 0.090 | 0.338 | 0.151 | 0.004 (0.897) | 0.024 | |
| Seg. R-5 | 0.345 | 0.206 | −0.006 (0.887) | 0.027 | - | - | - | - | |
| Seg. R-6 | 0.345 | 0.187 | −0.006 (0.901) | 0.023 | - | - | - | - | |
| EMG (leg) (0–1 n.u.) | Seg. R-1 | 0.350 | 0.180 | - | - | 0.345 | 0.185 | - | - |
| Seg. R-2 | 0.366 | 0.203 | 0.016 (0.668) | 0.080 | 0.373 | 0.173 | 0.027 (0.441) | 0.145 | |
| Seg. R-3 | 0.387 | 0.223 | 0.037 (0.421) | 0.152 | 0.381 | 0.147 | 0.036 (0.257) | 0.215 | |
| Seg. R-4 | 0.424 | 0.228 | 0.074 (0.042) ** | 0.396 | 0.370 | 0.182 | 0.025 (0.485) | 0.131 | |
| Seg. R-5 | 0.386 | 0.227 | 0.036 (0.373) | 0.168 | - | - | - | - | |
| Seg. R-6 | 0.377 | 0.208 | 0.027 (0.562) | 0.109 | - | - | - | - | |
| Categories | A.D(S) | A.D(C) | |||||||
|---|---|---|---|---|---|---|---|---|---|
| Mean Value | S.D. | Mean Difference (ρ-Value) * | Cohen’s d | Mean Value | S.D. | Mean Difference (ρ-Value) * | Cohen’s d | ||
| Self-rating of frustration (5 scale) | 3.39 | - | - | 2.37 | - | - | |||
| EMG (arm) (0–1 n.u.) | Seg. M-1 | 0.377 | 0.200 | - | - | 0.389 | 0.167 | - | - |
| Seg. M-2 | 0.449 | 0.238 | 0.072 (0.022) ** | 0.452 | 0.359 | 0.177 | −0.031 (0.377) | 0.167 | |
| Seg. M-3 | 0.379 | 0.214 | 0.002 (0.969) | 0.007 | 0.375 | 0.168 | −0.014 (0.737) | 0.063 | |
| Seg. M-4 | 0.343 | 0.196 | −0.034 (0.426) | 0.150 | 0.357 | 0.166 | −0.033 (0.412) | 0.155 | |
| EMG (leg) (0–1 n.u.) | Seg. M-1 | 0.378 | 0.173 | - | - | 0.390 | 0.162 | - | - |
| Seg. M-2 | 0.408 | 0.176 | 0.029 (0.394) | 0.161 | 0.373 | 0.152 | −0.017 (0.556) | 0.111 | |
| Seg. M-3 | 0.377 | 0.203 | −0.001 (0.983) | 0.004 | 0.357 | 0.189 | −0.033 (0.398) | 0.159 | |
| Seg. M-4 | 0.356 | 0.199 | −0.023 (0.632) | 0.090 | 0.364 | 0.149 | −0.026 (0.340) | 0.180 | |
| Categories | A.D(S) | A.D(C) | |||||||
|---|---|---|---|---|---|---|---|---|---|
| Mean Value | S.D. | Mean Difference (ρ-Value) * | Cohen’s d | Mean Value | S.D. | Mean Difference (ρ-Value) * | Cohen’s d | ||
| Self-rating of frustration (5 scale) | 3.06 | - | - | - | 1.56 | - | - | - | |
| EMG (arm) (0–1 n.u.) | Seg. U-1 | 0.333 | 0.187 | - | - | 0.343 | 0.172 | - | - |
| Seg. U-2 | 0.378 | 0.219 | 0.044 (0.232) | 0.227 | 0.322 | 0.193 | −0.021 (0.620) | 0.034 | |
| Seg. U-3 | 0.343 | 0.176 | 0.010 (0.780) | 0.052 | 0.317 | 0.162 | −0.026 (0.543) | 0.122 | |
| Seg. U-4 | 0.352 | 0.233 | 0.019 (0.669) | 0.080 | 0.315 | 0.202 | −0.028 (0.587) | 0.024 | |
| Seg. U-5 | 0.348 | 0.213 | 0.015 (0.741) | 0.062 | - | - | - | - | |
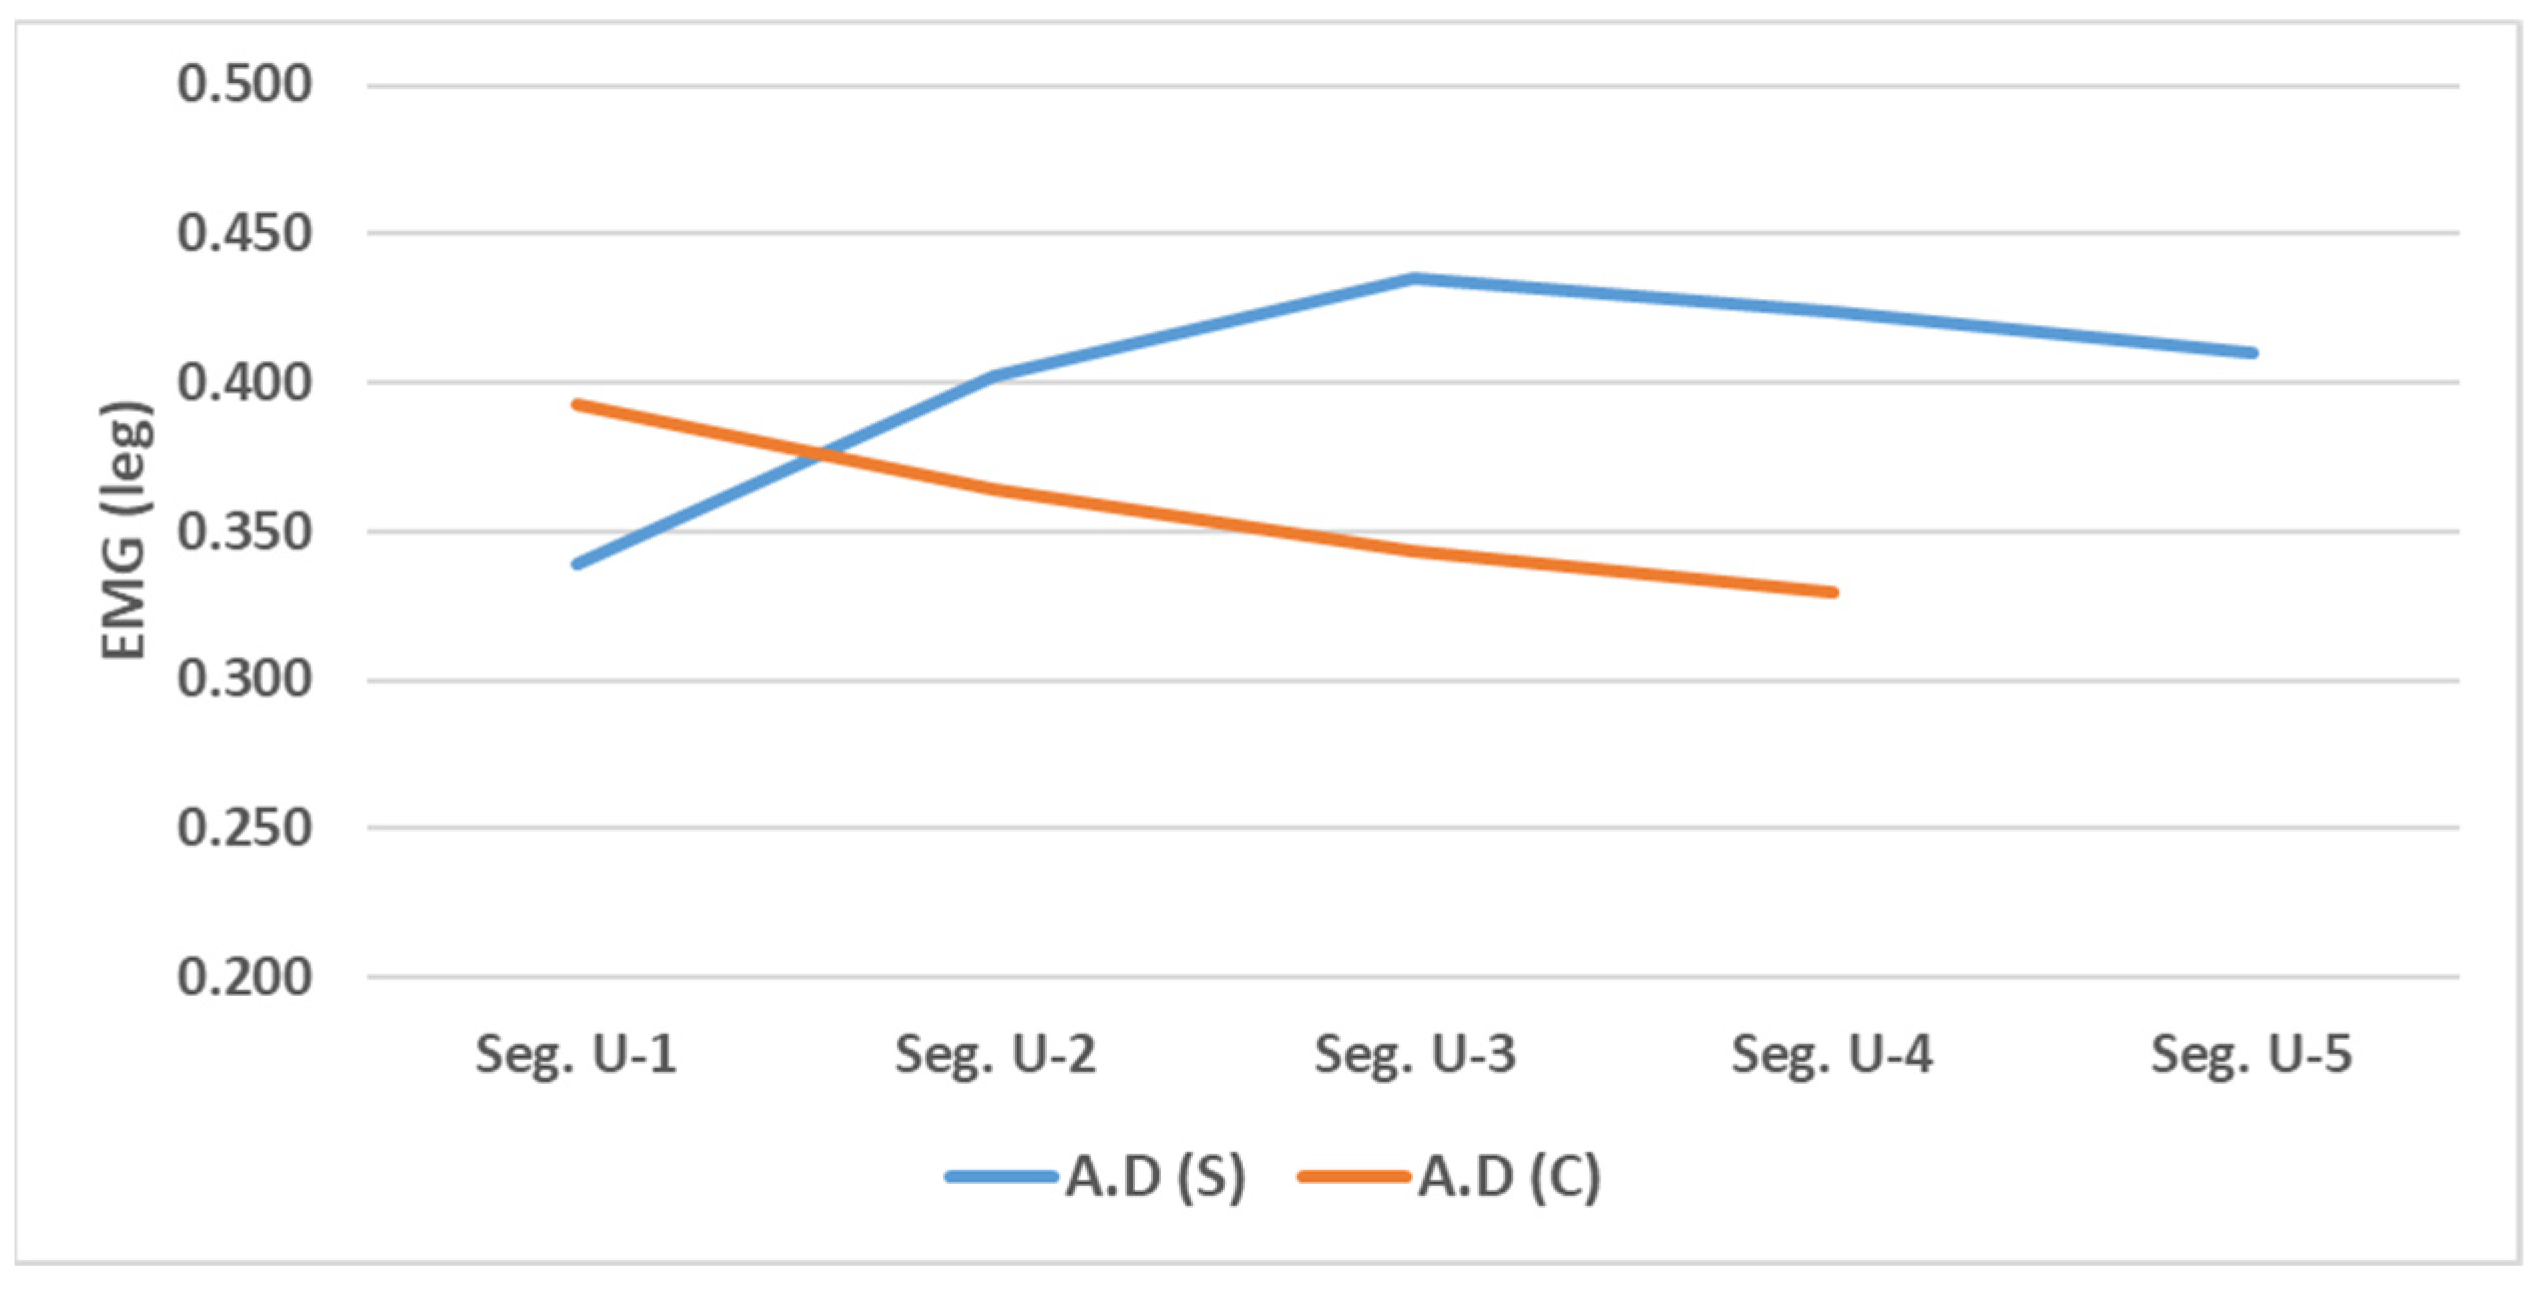
| EMG (leg) (0–1 n.u.) | Seg. U-1 | 0.339 | 0.129 | - | - | 0.393 | 0.206 | - | - |
| Seg. U-2 | 0.402 | 0.192 | 0.062 (0.125) | 0.294 | 0.364 | 0.169 | −0.029 (0.442) | 0.145 | |
| Seg. U-3 | 0.435 | 0.176 | 0.095 (0.006) ** | 0.547 | 0.343 | 0.166 | −0.050 (0.203) | 0.242 | |
| Seg. U-4 | 0.424 | 0.161 | 0.085 (0.018) ** | 0.468 | 0.330 | 0.189 | −0.063 (0.103) | 0.313 | |
| Seg. U-5 | 0.410 | 0.209 | 0.071 (0.055) | 0.372 | - | - | - | - | |
| Categories | A.D(S) | A.D(C) | |||||||
|---|---|---|---|---|---|---|---|---|---|
| Mean Value | S.D. | Mean Difference (ρ-Value) * | Cohen’s d | Mean Value | S.D. | Mean Difference (ρ-Value) * | Cohen’s d | ||
| Self-rating of startle response (5 scale) | 2.56 | - | 1.28 | - | - | ||||
| EMG (arm) (0–1 n.u.) | Seg. U-1 | 0.333 | 0.187 | - | - | 0.343 | 0.172 | - | - |
| Seg. U-2 | 0.378 | 0.219 | 0.044 (0.232) | 0.227 | 0.322 | 0.193 | −0.021 (0.620) | 0.034 | |
| Seg. U-3 | 0.343 | 0.176 | 0.010 (0.780) | 0.052 | 0.317 | 0.162 | −0.026 (0.543) | 0.122 | |
| Seg. U-4 | 0.352 | 0.233 | 0.019 (0.669) | 0.080 | 0.315 | 0.202 | −0.028 (0.587) | 0.024 | |
| Seg. U-5 | 0.348 | 0.213 | 0.015 (0.741) | 0.062 | - | - | - | - | |
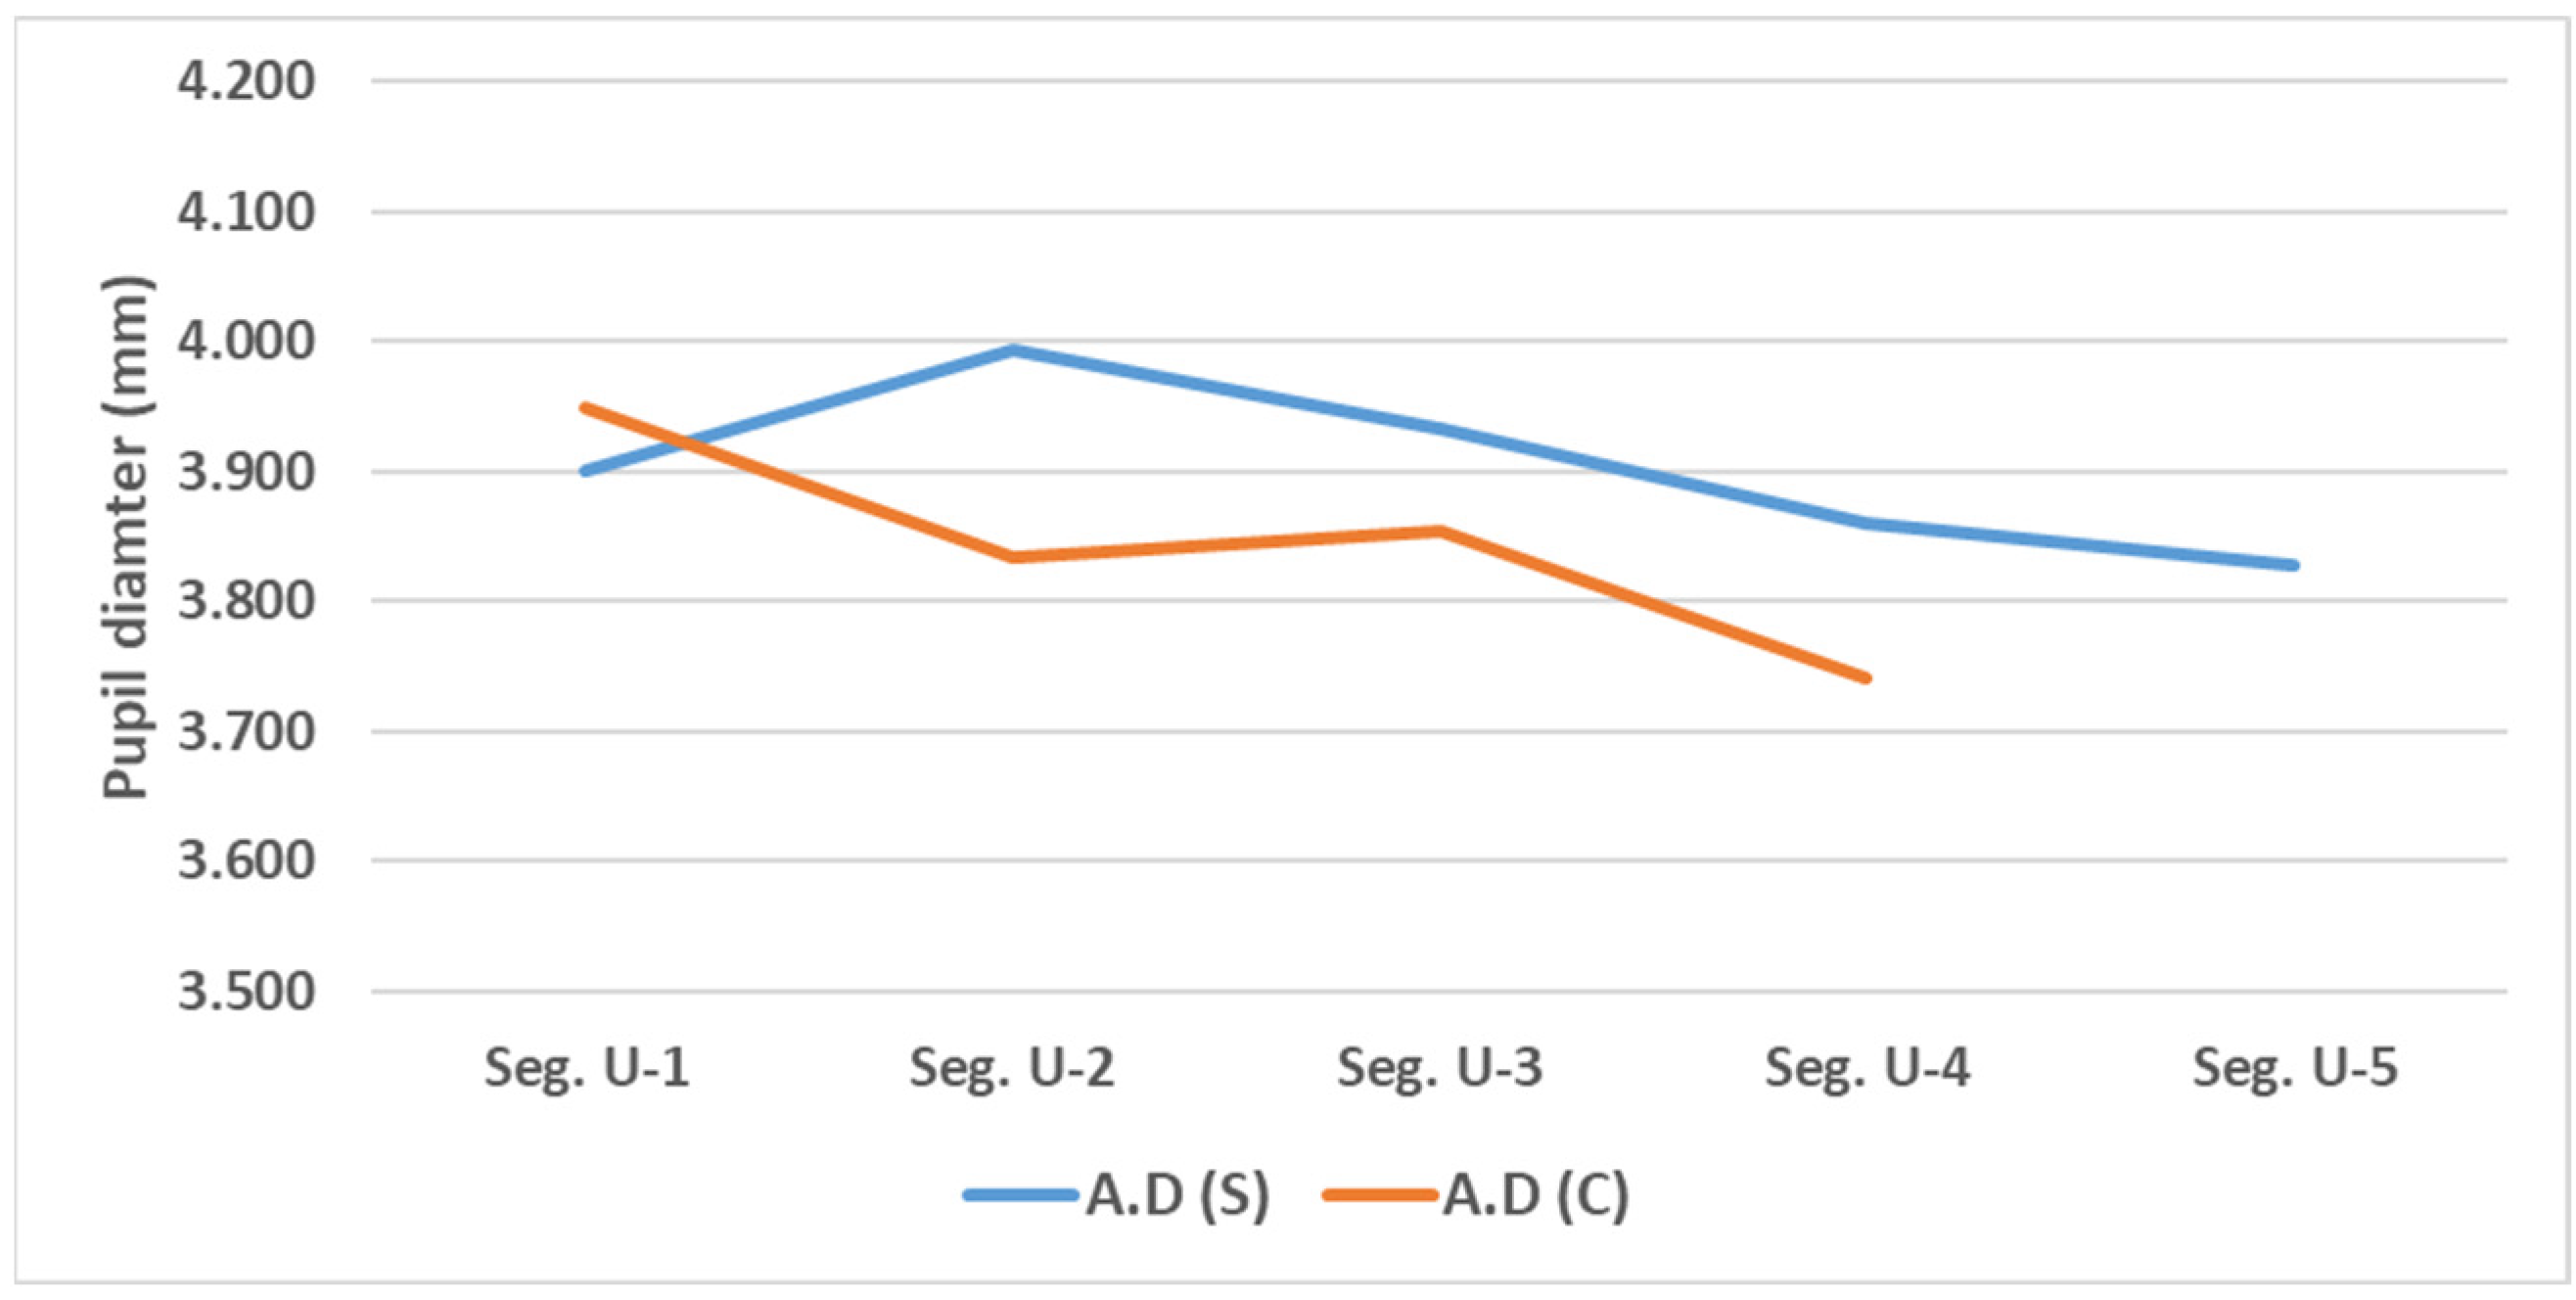
| Pupil diameter (mm) | Seg. U-1 | 3.901 | 0.663 | - | - | 3.949 | 0.609 | - | - |
| Seg. U-2 | 3.994 | 0.621 | 0.093 (0.042) ** | 0.395 | 3.834 | 0.633 | −0.115 (0.002) ** | 0.634 | |
| Seg. U-3 | 3.934 | 0.682 | 0.034 (0.449) | 0.143 | 3.855 | 0.572 | −0.094 (0.060) | 0.364 | |
| Seg. U-4 | 3.861 | 0.596 | −0.040 (0.789) | 0.050 | 3.741 | 0.573 | −0.209 (0.001) ** | 0.916 | |
| Seg. U-5 | 3.828 | 0.615 | −0.072 (0.085) | 0.332 | - | - | - | - | |
| Categories | A.D(S) | A.D(C) | |||||||
|---|---|---|---|---|---|---|---|---|---|
| Mean Value | S.D. | Mean Difference (ρ-Value) * | Cohen’s d | Mean Value | S.D. | Mean Difference (ρ-Value) * | Cohen’s d | ||
| Self-rating of startle response (5 scale) | 3.87 | - | - | - | 1.44 | - | - | - | |
| EMG (arm) (0–1 n.u.) | Seg. C-1 | 0.366 | 0.205 | - | - | 0.395 | 0.161 | - | - |
| Seg. C-2 | 0.472 | 0.192 | 0.106 (0.007) ** | 0.536 | 0.417 | 0.173 | 0.022 (0.573) | 0.106 | |
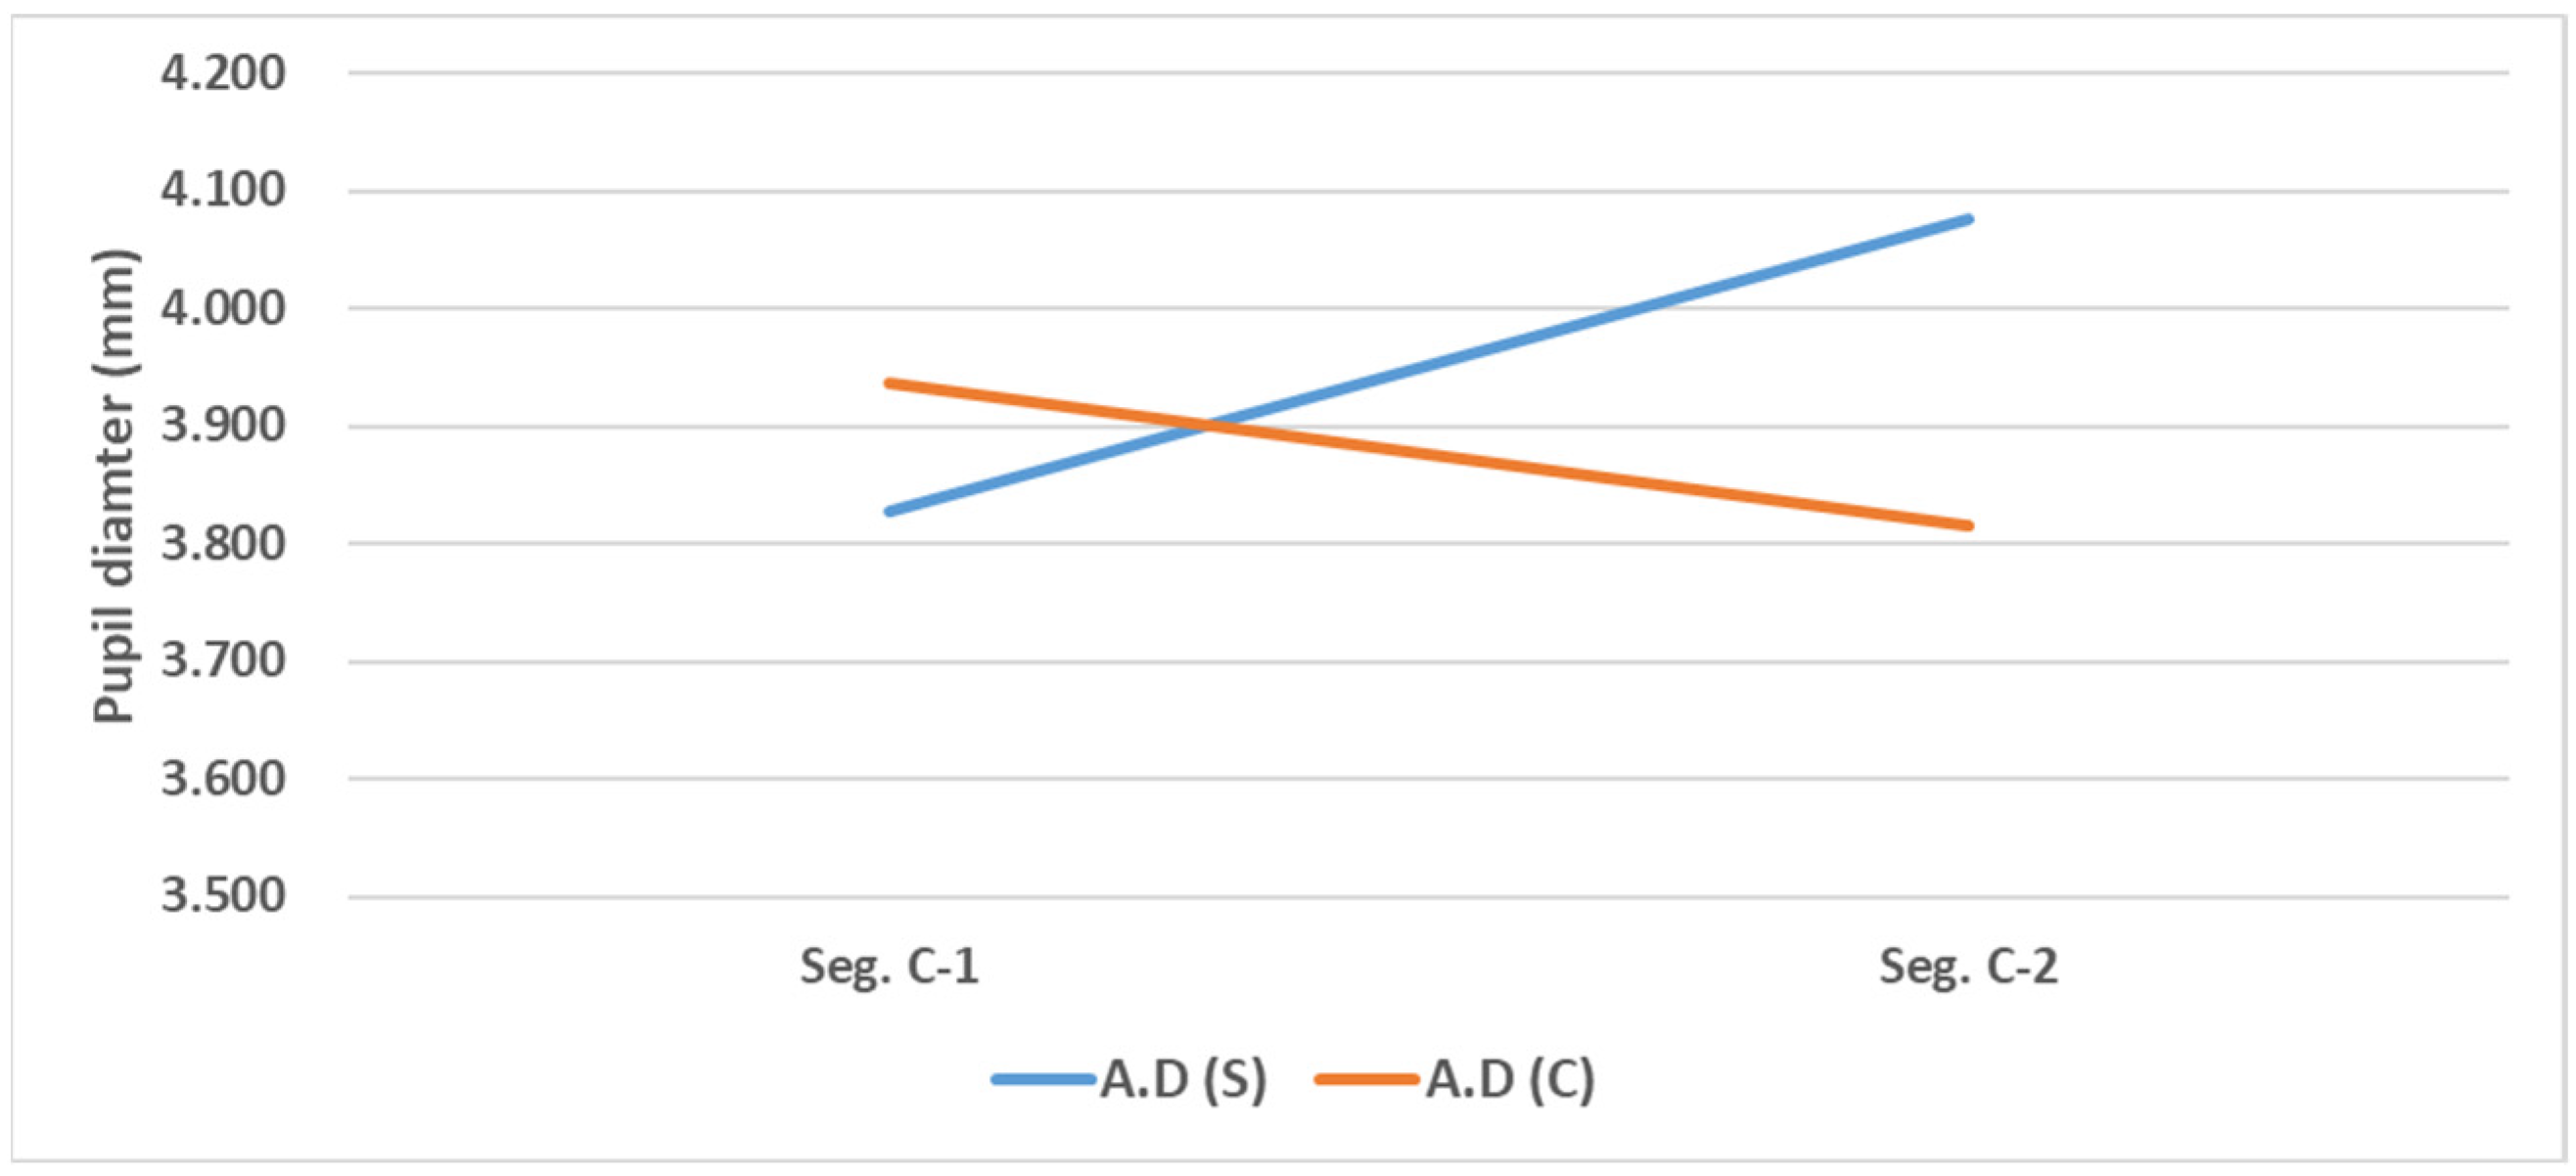
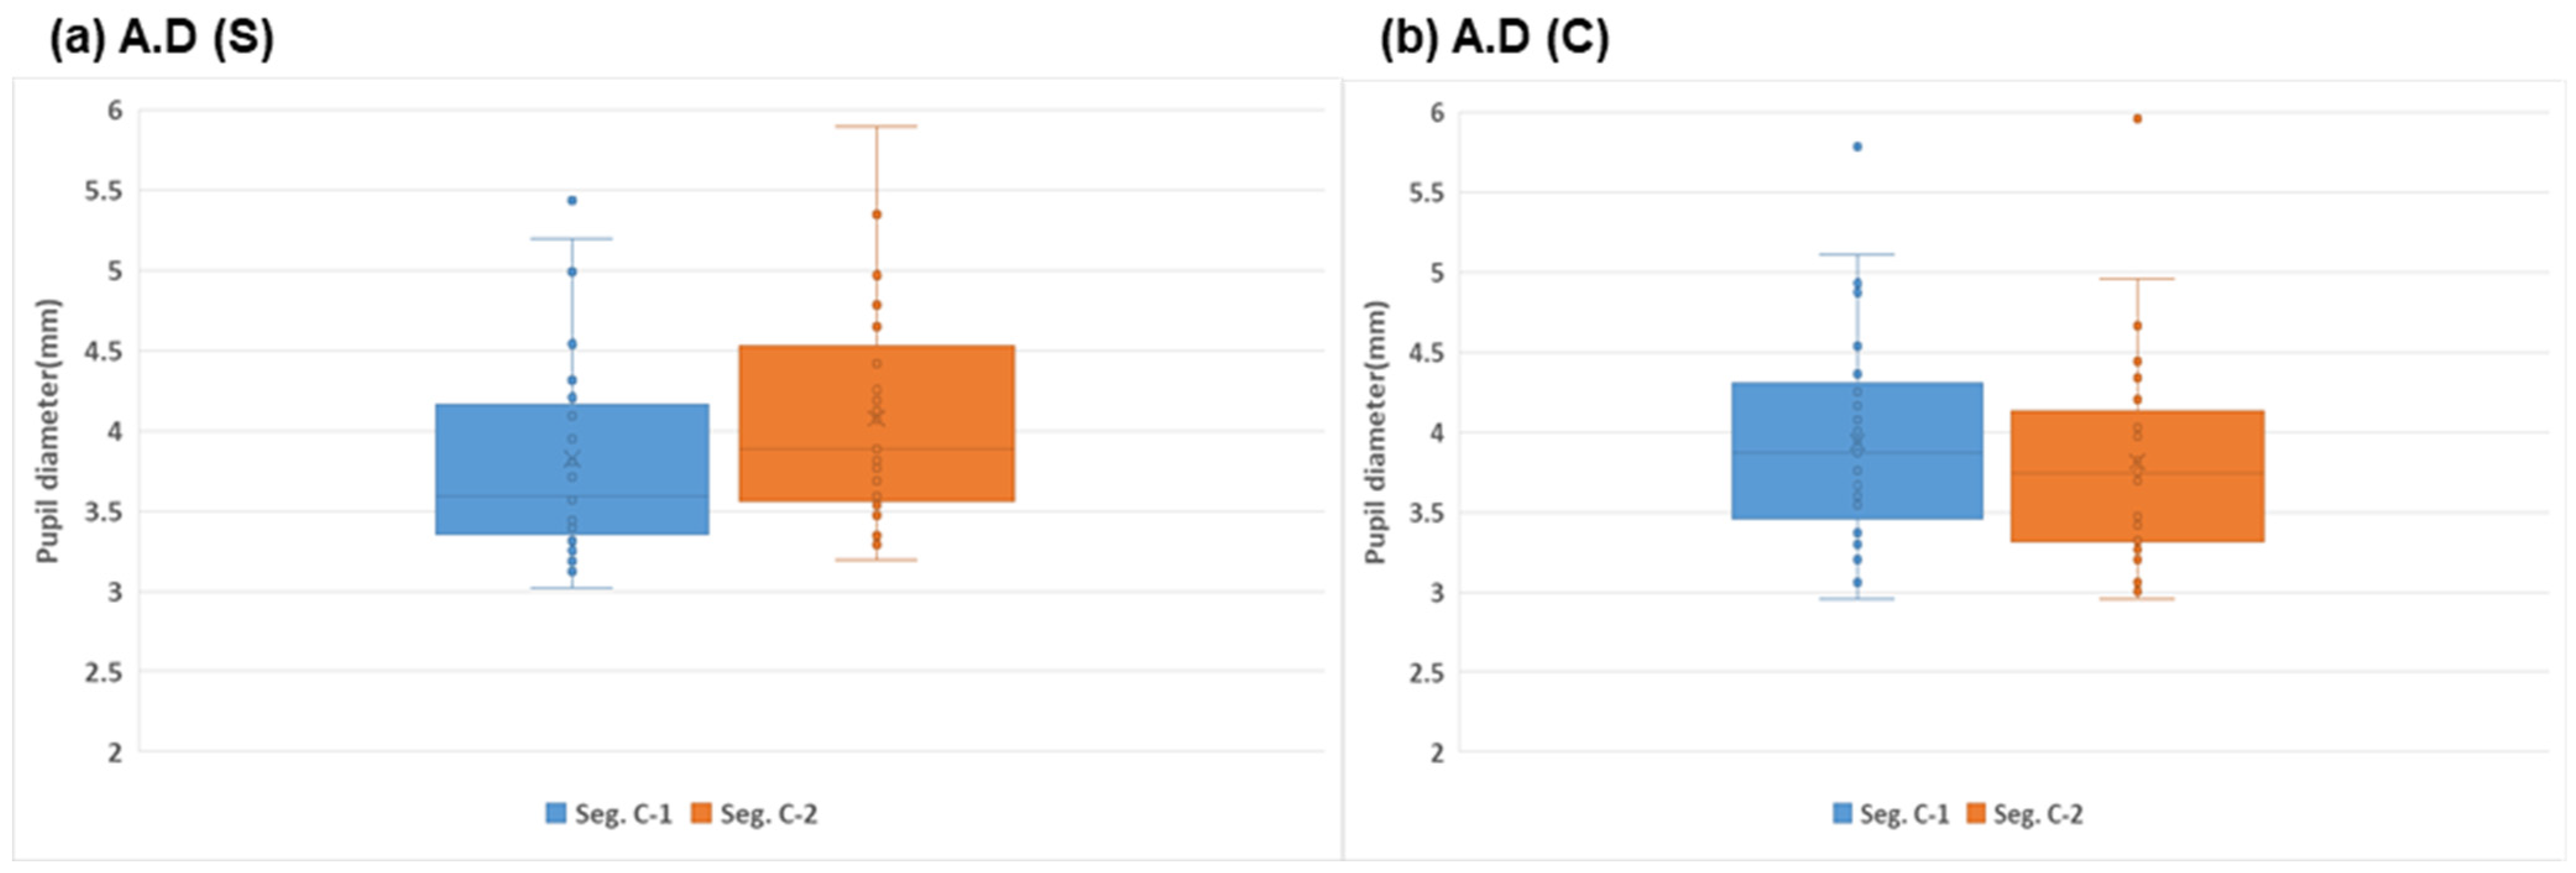
| Pupil diameter (mm) | Seg. C-1 | 3.827 | 0.637 | - | - | 3.936 | 0.667 | - | - |
| Seg. C-2 | 4.075 | 0.662 | 0.248 (0.001) ** | 0.961 | 3.815 | 0.654 | −0.121 (0.001) ** | 0.717 | |
Disclaimer/Publisher’s Note: The statements, opinions and data contained in all publications are solely those of the individual author(s) and contributor(s) and not of MDPI and/or the editor(s). MDPI and/or the editor(s) disclaim responsibility for any injury to people or property resulting from any ideas, methods, instructions or products referred to in the content. |
© 2025 by the authors. Licensee MDPI, Basel, Switzerland. This article is an open access article distributed under the terms and conditions of the Creative Commons Attribution (CC BY) license (https://creativecommons.org/licenses/by/4.0/).
Share and Cite
Hwang, S.; Lee, D. Physiological Evaluation of User Experience in Unstable Automated Driving: A Comparative Study. Appl. Sci. 2025, 15, 2683. https://doi.org/10.3390/app15052683
Hwang S, Lee D. Physiological Evaluation of User Experience in Unstable Automated Driving: A Comparative Study. Applied Sciences. 2025; 15(5):2683. https://doi.org/10.3390/app15052683
Chicago/Turabian StyleHwang, Sooncheon, and Dongmin Lee. 2025. "Physiological Evaluation of User Experience in Unstable Automated Driving: A Comparative Study" Applied Sciences 15, no. 5: 2683. https://doi.org/10.3390/app15052683
APA StyleHwang, S., & Lee, D. (2025). Physiological Evaluation of User Experience in Unstable Automated Driving: A Comparative Study. Applied Sciences, 15(5), 2683. https://doi.org/10.3390/app15052683