1. Introduction
Diabetic retinopathy (DR) is the most common diabetic eye disease and is the leading cause of blindness in those with diabetes. DR is caused by changes in the blood vessels of the retina and may worsen over time [
1,
2]. According to research performed by Varma et al., the number of Americans with DR will nearly double from 7.7 million in 2010 to 14.6 million by 2050 [
3]. This statistic is demonstrated in the bar graph in
Figure 1. Additionally, as highlighted by Spanakis and Golden, in the United States (US), minority populations are generally more prone to the development of DR compared to the white population [
4], as illustrated in
Table 1.
Globally, in 2010, DR was responsible for blindness among 0.8 million individuals and for visual impairments in 3.7 million [
5]. However, with the rising prevalence of diabetes, it is projected that the number of individuals affected by DR will approximately reach 191 million by the year 2030 [
6,
7].
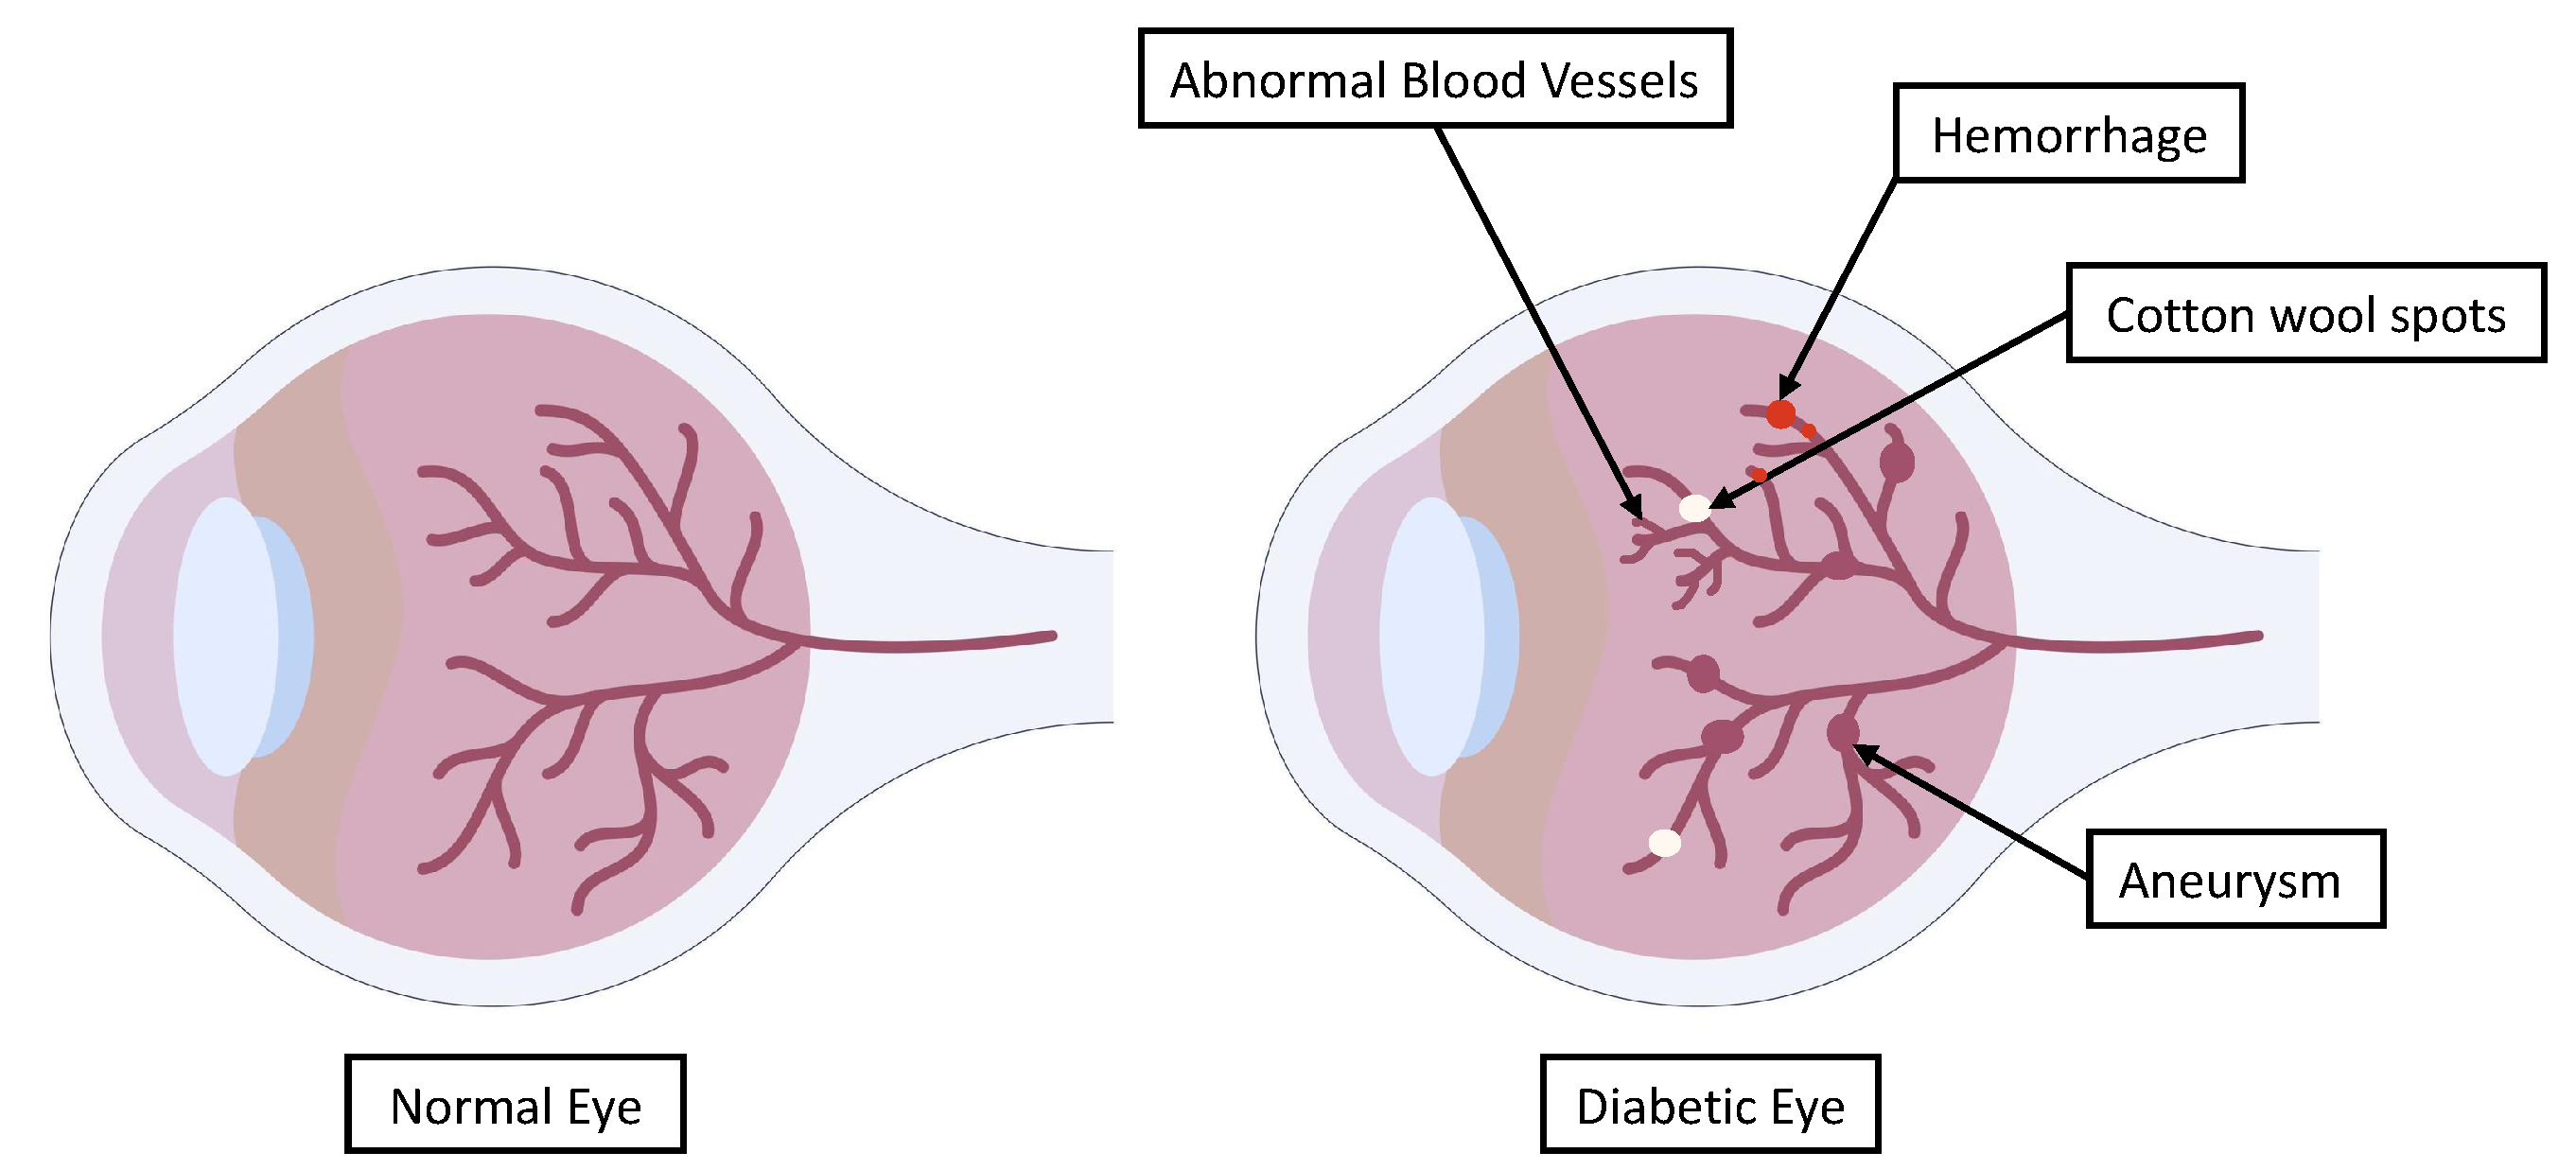
Some individuals with DR exhibit swollen blood vessels in the retina, which leak fluid or blood. Other DR patients exhibit new blood vessels with abnormal growth on the surface of the retina. The main indicators of DR through which a diagnosis can be obtained are shown in
Figure 2. These can be used to indicate the severity of DR and provide clinicians with information about the necessary course of treatment.
DR can be clinically diagnosed based on the presence of one or more retinal lesions, including micro-aneurysms, hemorrhages, hard exudates, and soft exudates [
1,
2]. Some studies have examined patients with different types of DR and considered the early diagnosis and detection of this disease [
8,
9]. Another study focused on patients who received dexamethasone intravitreal implants [
10]. For instance, Oliverio et al. used clinical and optical coherence tomography (OCT) biomarkers as prognostic factors when examining dexamethasone intravitreal implants for diabetic macular edema [
10]. They relied on a database comprising patients who received dexamethasone implants, extracted several features, and explored the links between the biomarkers and the treated eyes through parametric and statistical significance analyses, i.e., using
p-values [
10].
Meanwhile, retinal fundus images have been used to examine patients with different types of DR (who have not undergone treatment) and diagnose retinal diseases early on. Some studies have relied on optical imaging, while others have relied on color Doppler imaging [
9]. Oliverio et al. used features extracted from optical coherence tomography angiography (OCTA) in patients with diabetes mellitus types 1 and 2 [
8]. Their study was a cross-sectional observational investigation, and they examined the statistical significance based on
p-values. Meanwhile, Ratanapakorn et al. used image processing algorithms to detect and identify DR in fundus images. Specifically, they developed an algorithm using the MATLAB Image Processing Toolbox to extract the clinically significant features of DR pathologies and determine the severity [
11]. The DR detection results were precise in comparison with the diagnosis of an ophthalmologist. The error rate was very small, which confirmed the accuracy of the algorithm in detecting DR. Moreover, the software had high accuracy in determining the severity of DR. However, Ratanapakorn et al. stated that the accuracy of the software could be improved by including additional image processing techniques or other methods based on artificial intelligence (AI) or deep learning (DL), although they did not explore this further [
11].
Another study carried out by Gharaibeh et al. provided an effective image processing method for DR detection from retinal fundus images [
12]. They presented a system that could convert red, green, and blue (RGB) images into hue, saturation, and intensity (HSI) images for processing and feature extraction. The main goal of feature extraction was to identify micro-aneurysms, exudates, and hemorrhages and then perform classification based on them. Gharaibeh et al. used machine learning (ML) algorithms such as a support vector machine (SVM) [
13], a probabilistic neural network (PNN), and a support vector machine optimized with a genetic algorithm (SVMGA) for classification [
12]. In order to evaluate the results, they compared the sensitivity, specificity, and accuracy of the three methods used. This showed that SVMGA was equal to or better than SVM and PNN. The first step that they applied was fundus image normalization to improve the quality of the images. The second step involved feature extraction from general fundus images; these were divided into the following three features: optic disks, fovea, and vessel structures. In the third step, algorithms were developed to cover DR pathologies corresponding to the severity classification. The proposed algorithms were separated according to the structure of each pathology in the fundus image. The last step was the determination of the severity of the DR detected [
12].
Moreover, the studies carried out by Liu et al. and Mathews et al. examined the discrimination of DR using ML methods in optical coherence tomography angiography (OCTA) images [
14] and optical coherence tomography (OCT) images [
15], respectively. Liu et al. considered the evaluation of OCTA to discriminate between DR and healthy controls (HC) using 144 images [
14]. Four ML models, namely logistic regression (LR) [
14,
16], logistic regression regularized with an elastic net (LR-EN) penalty, SVM, and the gradient boosting tree (XGBoost), were used to classify wavelet features between groups. OCTA data consisting of the superficial vascular plexus, deep vascular plexus, and retinal vascular network were acquired from 19 DR (38 eyes) patients and 25 HC (44 eyes). A discrete wavelet transform was applied to extract texture features from each image. The area under the curve (AUC) of the receiver operating characteristic (ROC) curve, sensitivity, specificity, and diagnostic accuracy of the classifiers were obtained. The results showed that the LR-EN algorithm had high sensitivity and specificity in identifying DR, indicating that it may be a promising method in facilitating the early diagnosis of DR. However, the used database was insufficient, as it only comprised 144 images.
Other large-scale and multicenter studies have been carried out to assess the applicability of the LR-EN algorithm in DR and related eye diseases, seeking to improve the vision-related outcomes of patients [
17,
18,
19,
20]. Although previous studies have employed DL algorithms, some have focused on OCTA, others on fundus images, and some have focused specifically on detecting non-proliferative DR.
Moreover, in 2023, Fu et al. proposed a novel architecture combining ResNet-50 with a channel attention squeeze-and-excitation network (SENet), designed to extract features, and they introduced a disease attention module to supplement disease-specific information about diabetic macular edema (DME) [
21]. DME is a specific complication of DR in which fluid accumulates in the macula, the central part of the retina that is responsible for sharp, central vision. However, DR is wide-ranging and is considered a general condition caused by damage to the blood vessels in the retina due to prolonged high blood sugar levels in diabetes. Thus, any study that explores DR will include DME, but the opposite is not true; i.e., studying only DME limits the cases that can be obtained by imaging, and the findings would be specific to DME rather than generalizable across all cases of DR.
In addition, Abdelsalam et al. presented a novel approach to early DR detection based on multifractal geometry analysis and SVM, focusing on OCTA macular images [
22,
23]. Their model involved using a supervised ML method, such as the SVM algorithm, on 170 eye images from patients with early-stage DR, which were divided into 90 healthy eyes and 80 eyes. These were obtained from the Ophthalmology Center at Mansoura University, Egypt. The training procedure involved using seven extracted features as the training dataset. The extracted features were specific to the two classified stages, indicating that they were a good choice for the classification process. These features were the
at the maximum of the singularity spectrum (
), the shift in the singularity spectrum’s symmetrical axis, the width of the singularity spectrum (W), the lacunarity, the dimension of box counting (DB), the dimension of information (DI), and the dimension of correlation (DC). These generalized features reflect the self-similarity, morphological characteristics, and pixel correlations. Furthermore, the objective was to classify the input data images into one of two classes, namely normal and non-proliferative diabetic retinopathy (NPDR). Classification was performed using an SVM classifier with a radial basis function (RBF) kernel. The authors showed that their proposed technique achieved the best performance in the early detection of DR compared to the others [
22,
23]. These results could be enhanced by increasing the training dataset [
23,
24,
25,
26,
27].
Furthermore, Zaylaa et al. adopted AI to diagnose DR automatically from optical coherence tomography angiography (OCTA) images [
28]. Their research focused on providing an adequate ML and DL technique to differentiate between normal images and images of patients with DR, using OCTA images obtained from 90 patients [
28]. They used data collected prospectively over the course of a year from a comprehensive medical center in Lebanon. The main algorithms were the mixed convolutional neural network (CNN, SVM) algorithm, the feed-forward backpropagation NN, SVM with a linear kernel, and SVM with a polynomial kernel. The results showed that the proposed combination (CNN, SVM) offered the best detection as compared to the regular SVM, the polynomial-based SVM, and the NN [
28]. However, the authors discussed the importance of employing more algorithms—specifically, pure DL algorithms—and comparing the results to those extracted from fundus images to enable the early detection and diagnosis of DR [
28].
Detecting DR at an early stage is crucial for identifying the disease before its progression to an advanced state, characterized by problems such as vision loss, as early intervention allows for the implementation of suitable treatment methods. In this context, patients with diabetes are required to undergo annual or biannual retina monitoring [
2,
29]. Additionally, as stated by the National Eye Institute, up to 95% of instances of vision loss can be avoided through the early detection and treatment of DR [
29]. The main goal that motivated the present research was the early detection of DR automatically from fundus images. In addition, any method for DR detection must provide adequate results to be considered efficient, i.e., the algorithm must have high accuracy and a low rate of false detection.
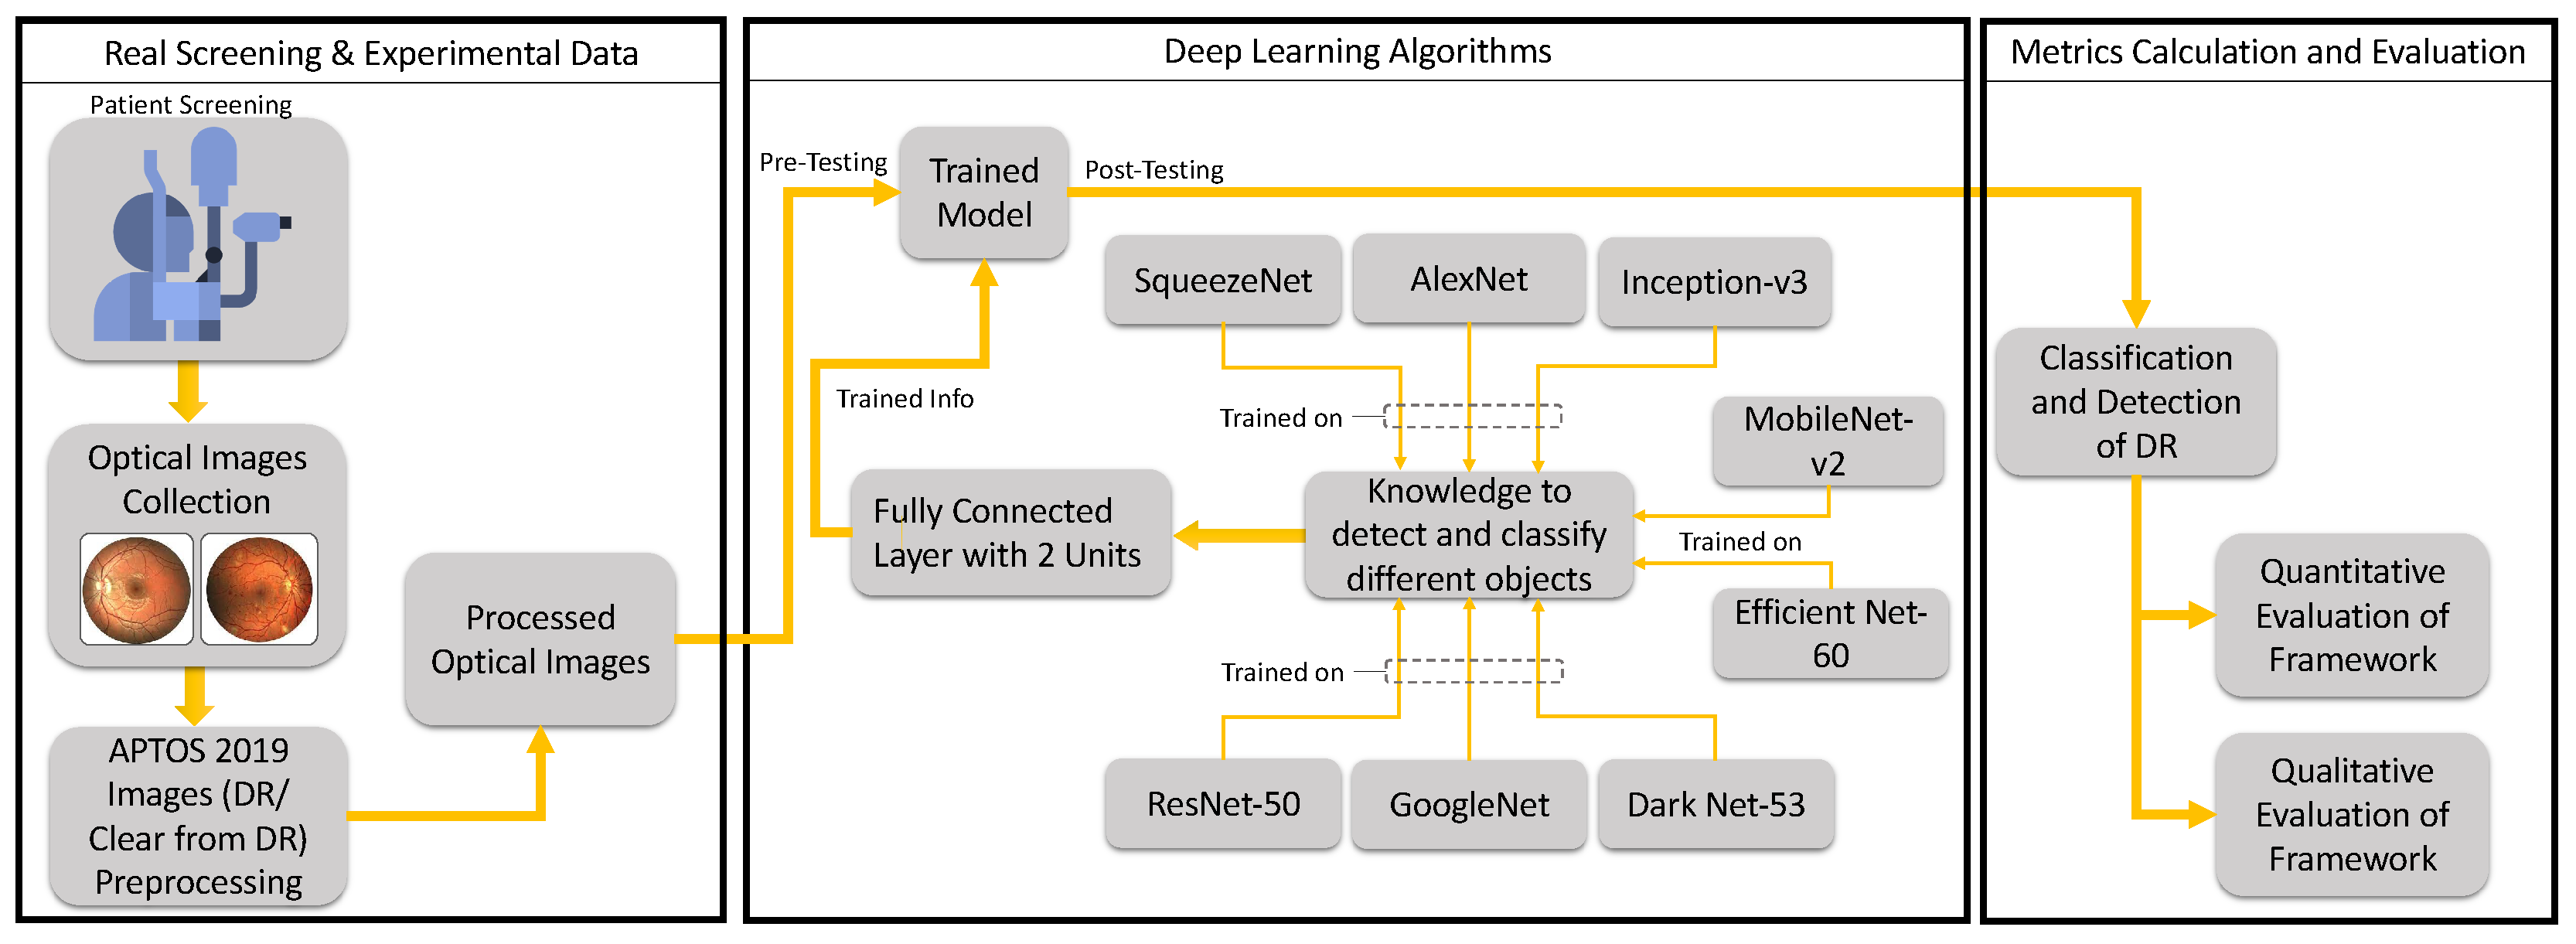
Based on the above, our research aimed to develop a framework that could detect DR automatically based on DL and based on the evaluation of a retrospective, controlled clinical database. This could improve the quality of life of patients with DR and improve the provision of healthcare in this context. This could be achieved by training pre-existing NNs, employing DL algorithms, and evaluating the results quantitatively through sensitivity, specificity, accuracy, and precision metrics, as well as calculating the cross-entropy and loss or error in DR diagnosis. Qualitatively, ROC curves could be used to assess the performance of different algorithms. Although our aim was partly to explore existing networks, several classical and combined networks were presented in an earlier research work [
28], and this was extended in the current work based on a thorough review of the topic. One of the novelties is that this work explores “new processes” and/or “new levels” of diagnosis for patients with DR, thus enhancing the related healthcare services. Another novelty is the discussion of augmented and autonomous clinical decision making (augmented diagnosis), in addition to exploring the power of DL algorithms in the detection of this particular disease (DR) for preventative purposes (to avoid blindness). Moreover, we shed light on the importance of the types of images used, and we target automatic and optimal outputs and minimal errors. Furthermore, at the AI level, we explore the currently used DL algorithms and the optimization of their parameters, as well as calculating the error in DR detection. Meanwhile, at the machine level, we provide a framework that could be integrated with the software of the digital slit lamp in the lab to automate the diagnostic procedure, thus providing an AI-integrated digital slit lamp that could enhance the healthcare system.
This work is divided into five main sections. After introducing the research context and recent studies related to DR detection and diagnosis,
Section 2 describes the experimental materials and methods used, including the collection of the experimental data, a priori information, features, classifiers, and the evaluation method and metrics used.
Section 3 presents the results, which are divided into quantitative and qualitative results. Then,
Section 4 discusses these results. Finally,
Section 5 provides the conclusions and recommends future research directions that can be considered to promote the automatic diagnosis of DR.
3. Experimental Results
The results obtained by applying the novel framework to the experimental optical images referred to a total of eight DNNs pre-trained on MATLAB v2021. The quantitative results regarding the performance of the eight pre-trained DNN networks are shown in
Table 6.
The quantitative results regarding DR detection are shown in
Table 6. GoogleNet exhibited a remarkable sensitivity of 99.44% for DR detection. Although the sensitivity of GoogleNet surpassed that of the other seven networks—AlexNet, ResNet-50, DarkNet-53, EfficientNet-60, SqueezeNet, Inception-v3, and MobileNet-v2—ResNet-50 surpassed all other networks in DR detection, as the specificity and precision were 1.38% and 1.74% higher, respectively, than that obtained by GoogleNet. Meanwhile, their detection accuracies were the same.
On the other hand, among the considered networks, MobileNet-v2 exhibited the lowest sensitivity and AlexNet showed the lowest specificity, accuracy, and precision. It is noteworthy that the overall performance of the eight networks in DR detection was acceptable in terms of all measured aspects, i.e., all measurements were above 87%, as shown in
Table 6.
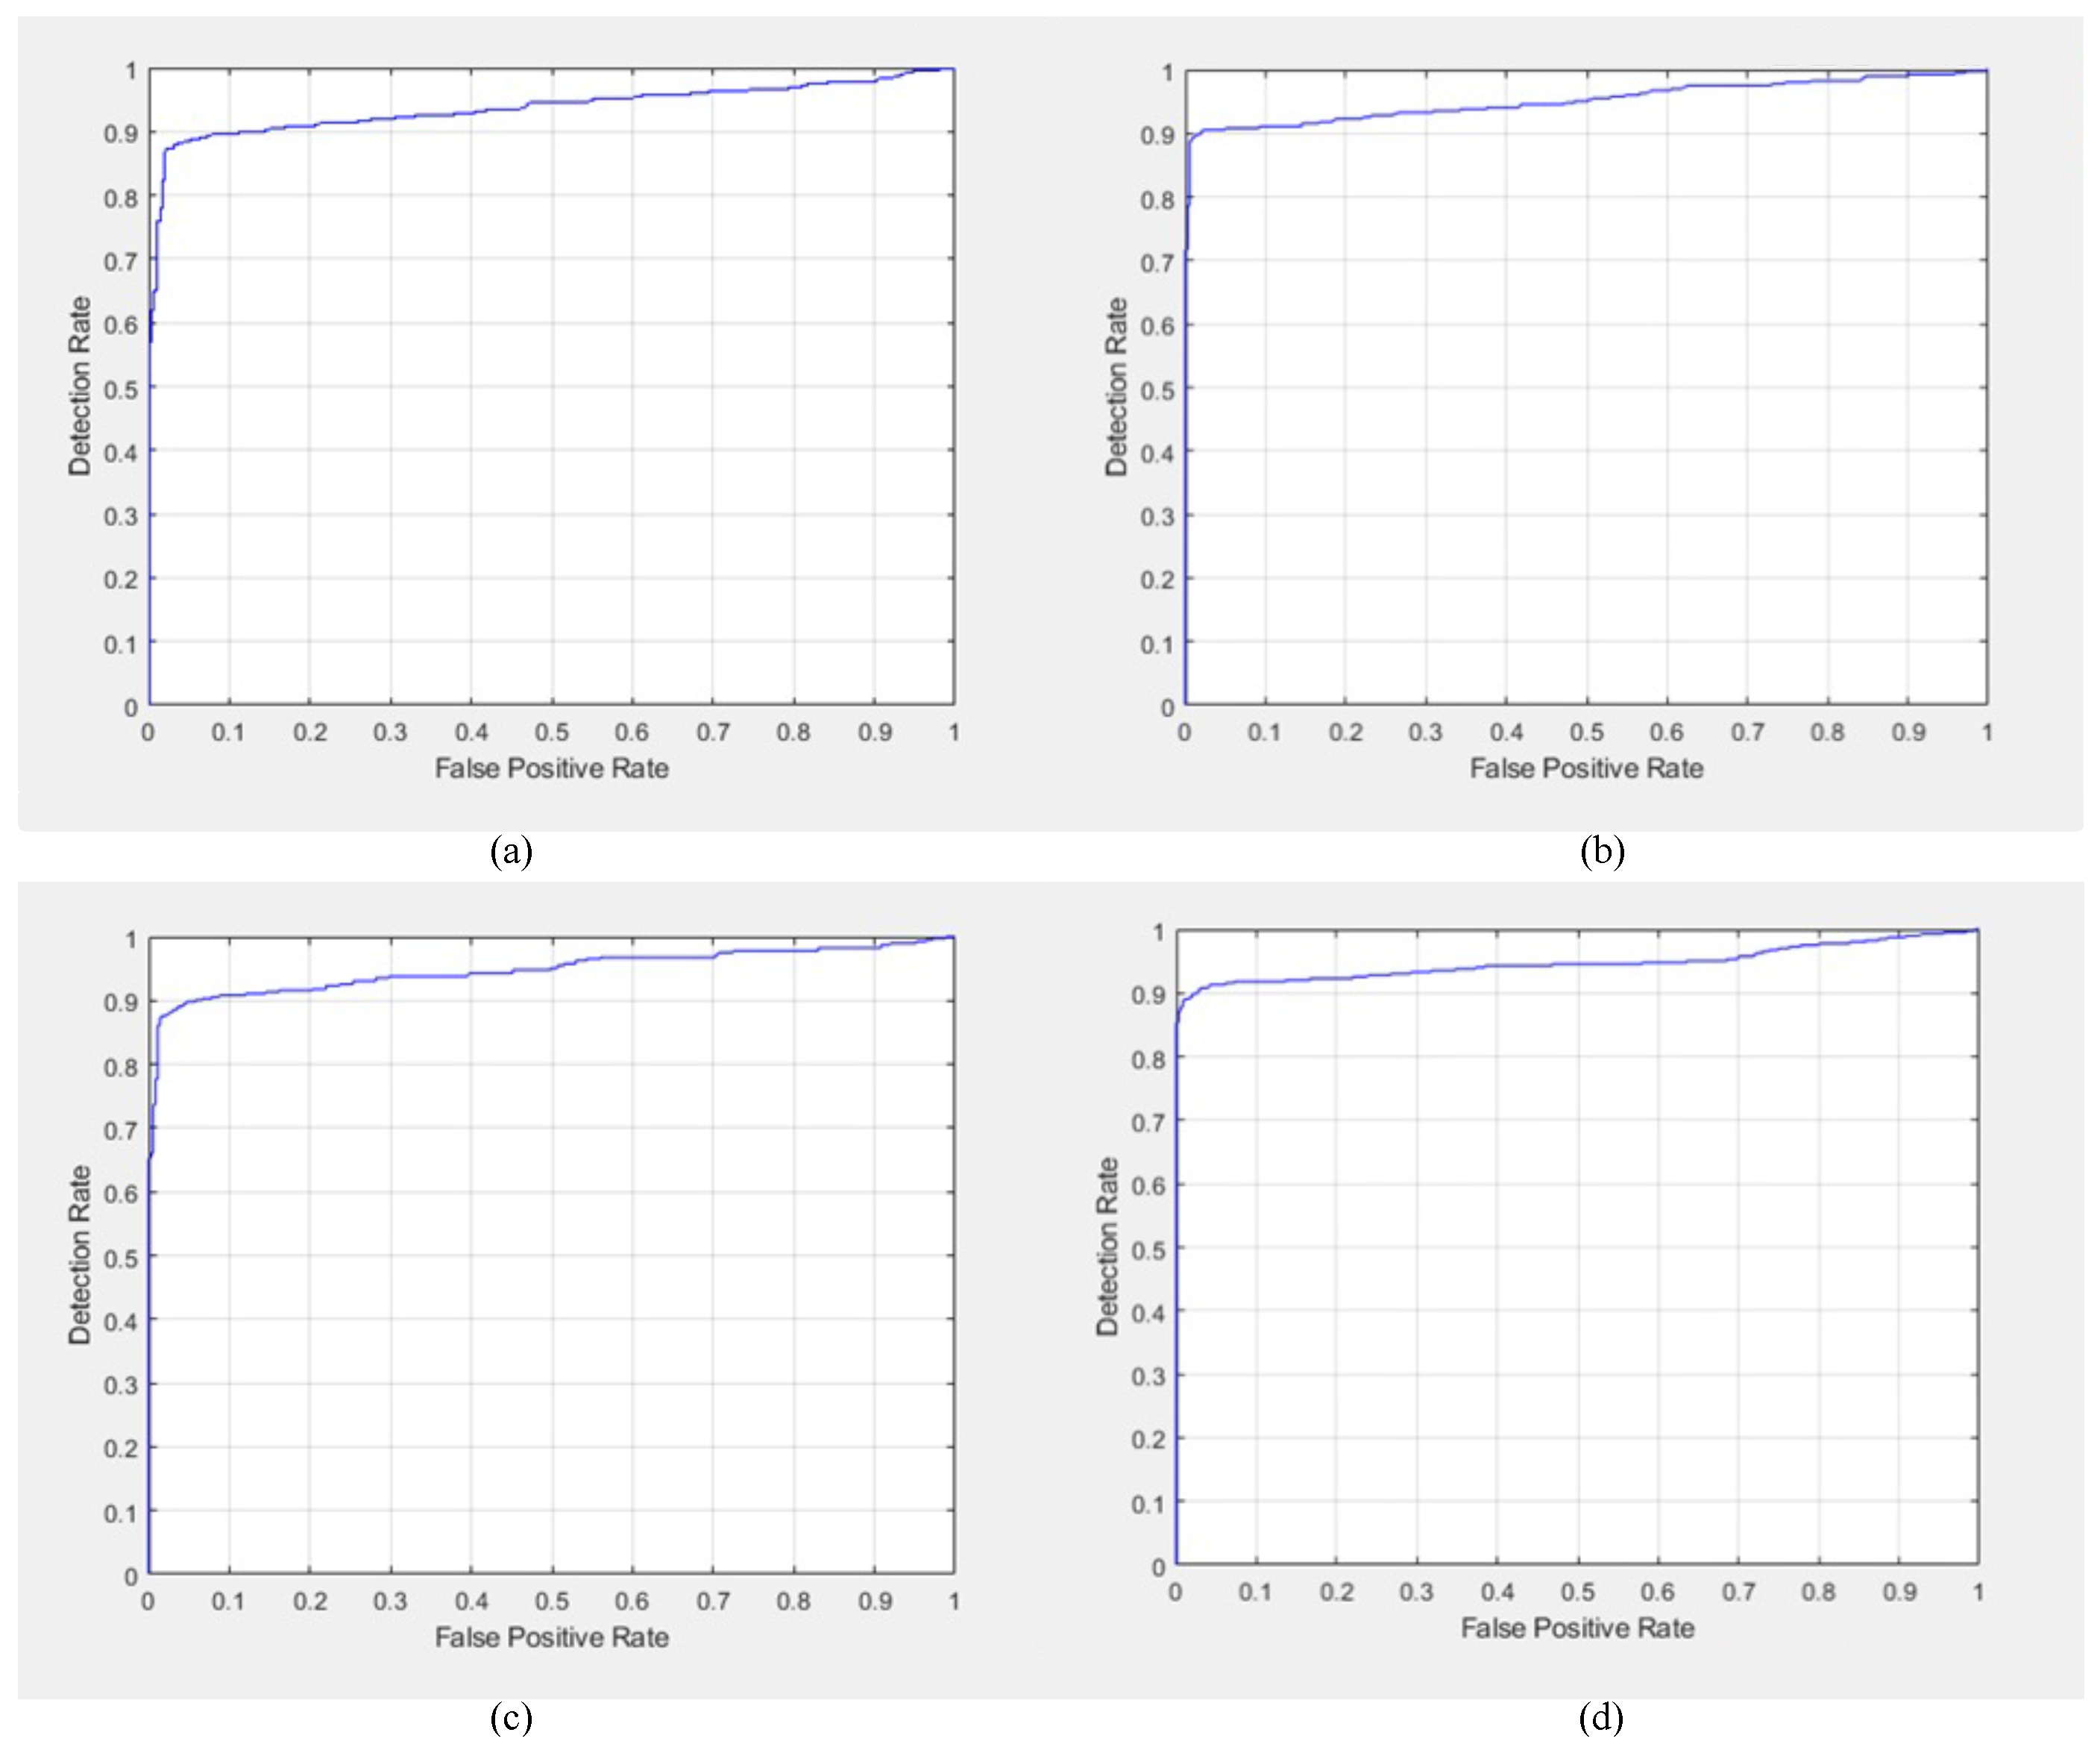
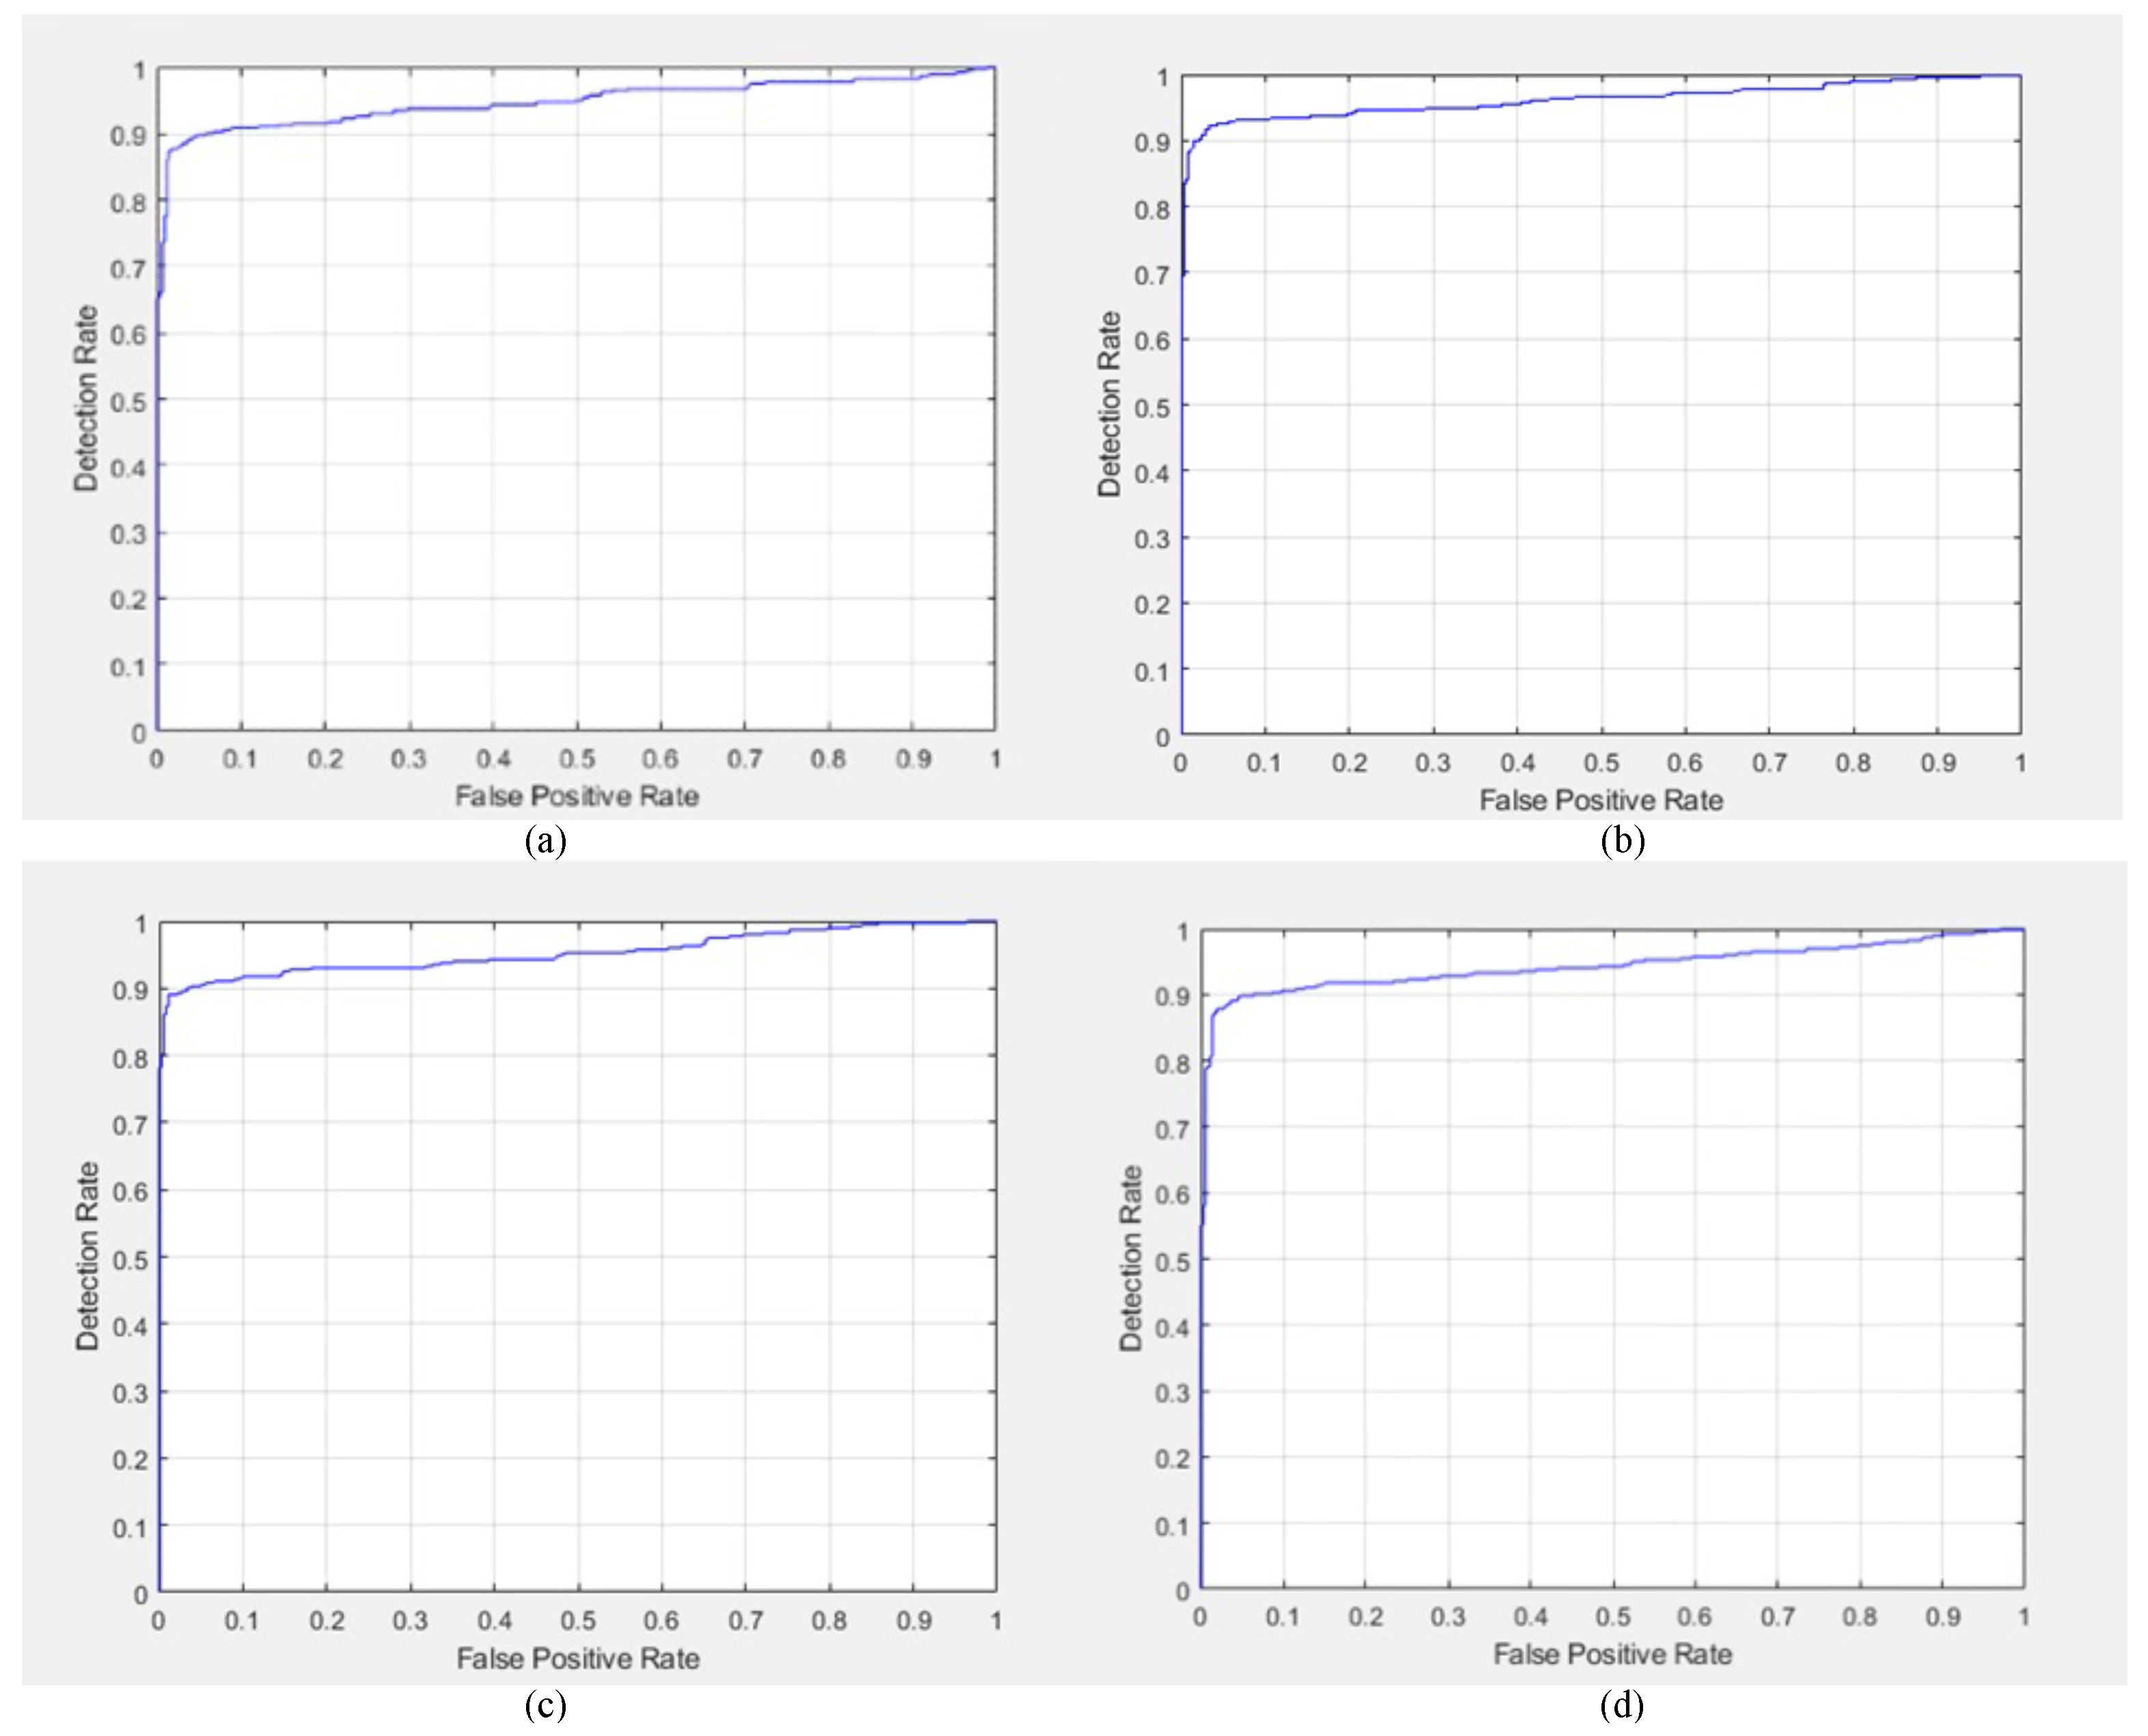
Additional qualitative results regarding DR detection were obtained in the form of the ROC curves for GoogleNet, AlexNet, ResNet-50 DarkNet-53, EfficientNet-60, SqueezeNet, Inception-v3, and MobileNet-v2, as shown in
Figure 7 and
Figure 8.
The ROC curves of AlexNet, GoogleNet, ResNet-50, and DarkNet-53 are shown in
Figure 7a,
Figure 7b,
Figure 7c and
Figure 7d, respectively. Moreover, the ROC curves of EfficientNet-60, SqueezeNet, Inception-v3, and MobileNet-v2 are shown in
Figure 8a,
Figure 8b,
Figure 8c and
Figure 8d, respectively.
Among the tested networks, the sensitivity in DR detection was the highest for GoogleNet and ResNet-50; therefore, the ROC curves of both GoogleNet and ResNet-50 were the best compared to the other networks. Moreover, SqueezeNet showed the second-best performance in DR detection. However, among the explored networks, MobileNet-v2 showed the weakest performance in terms of the ROC. Finally, the general behavior of the ROC curves was acceptable regarding DR detection.
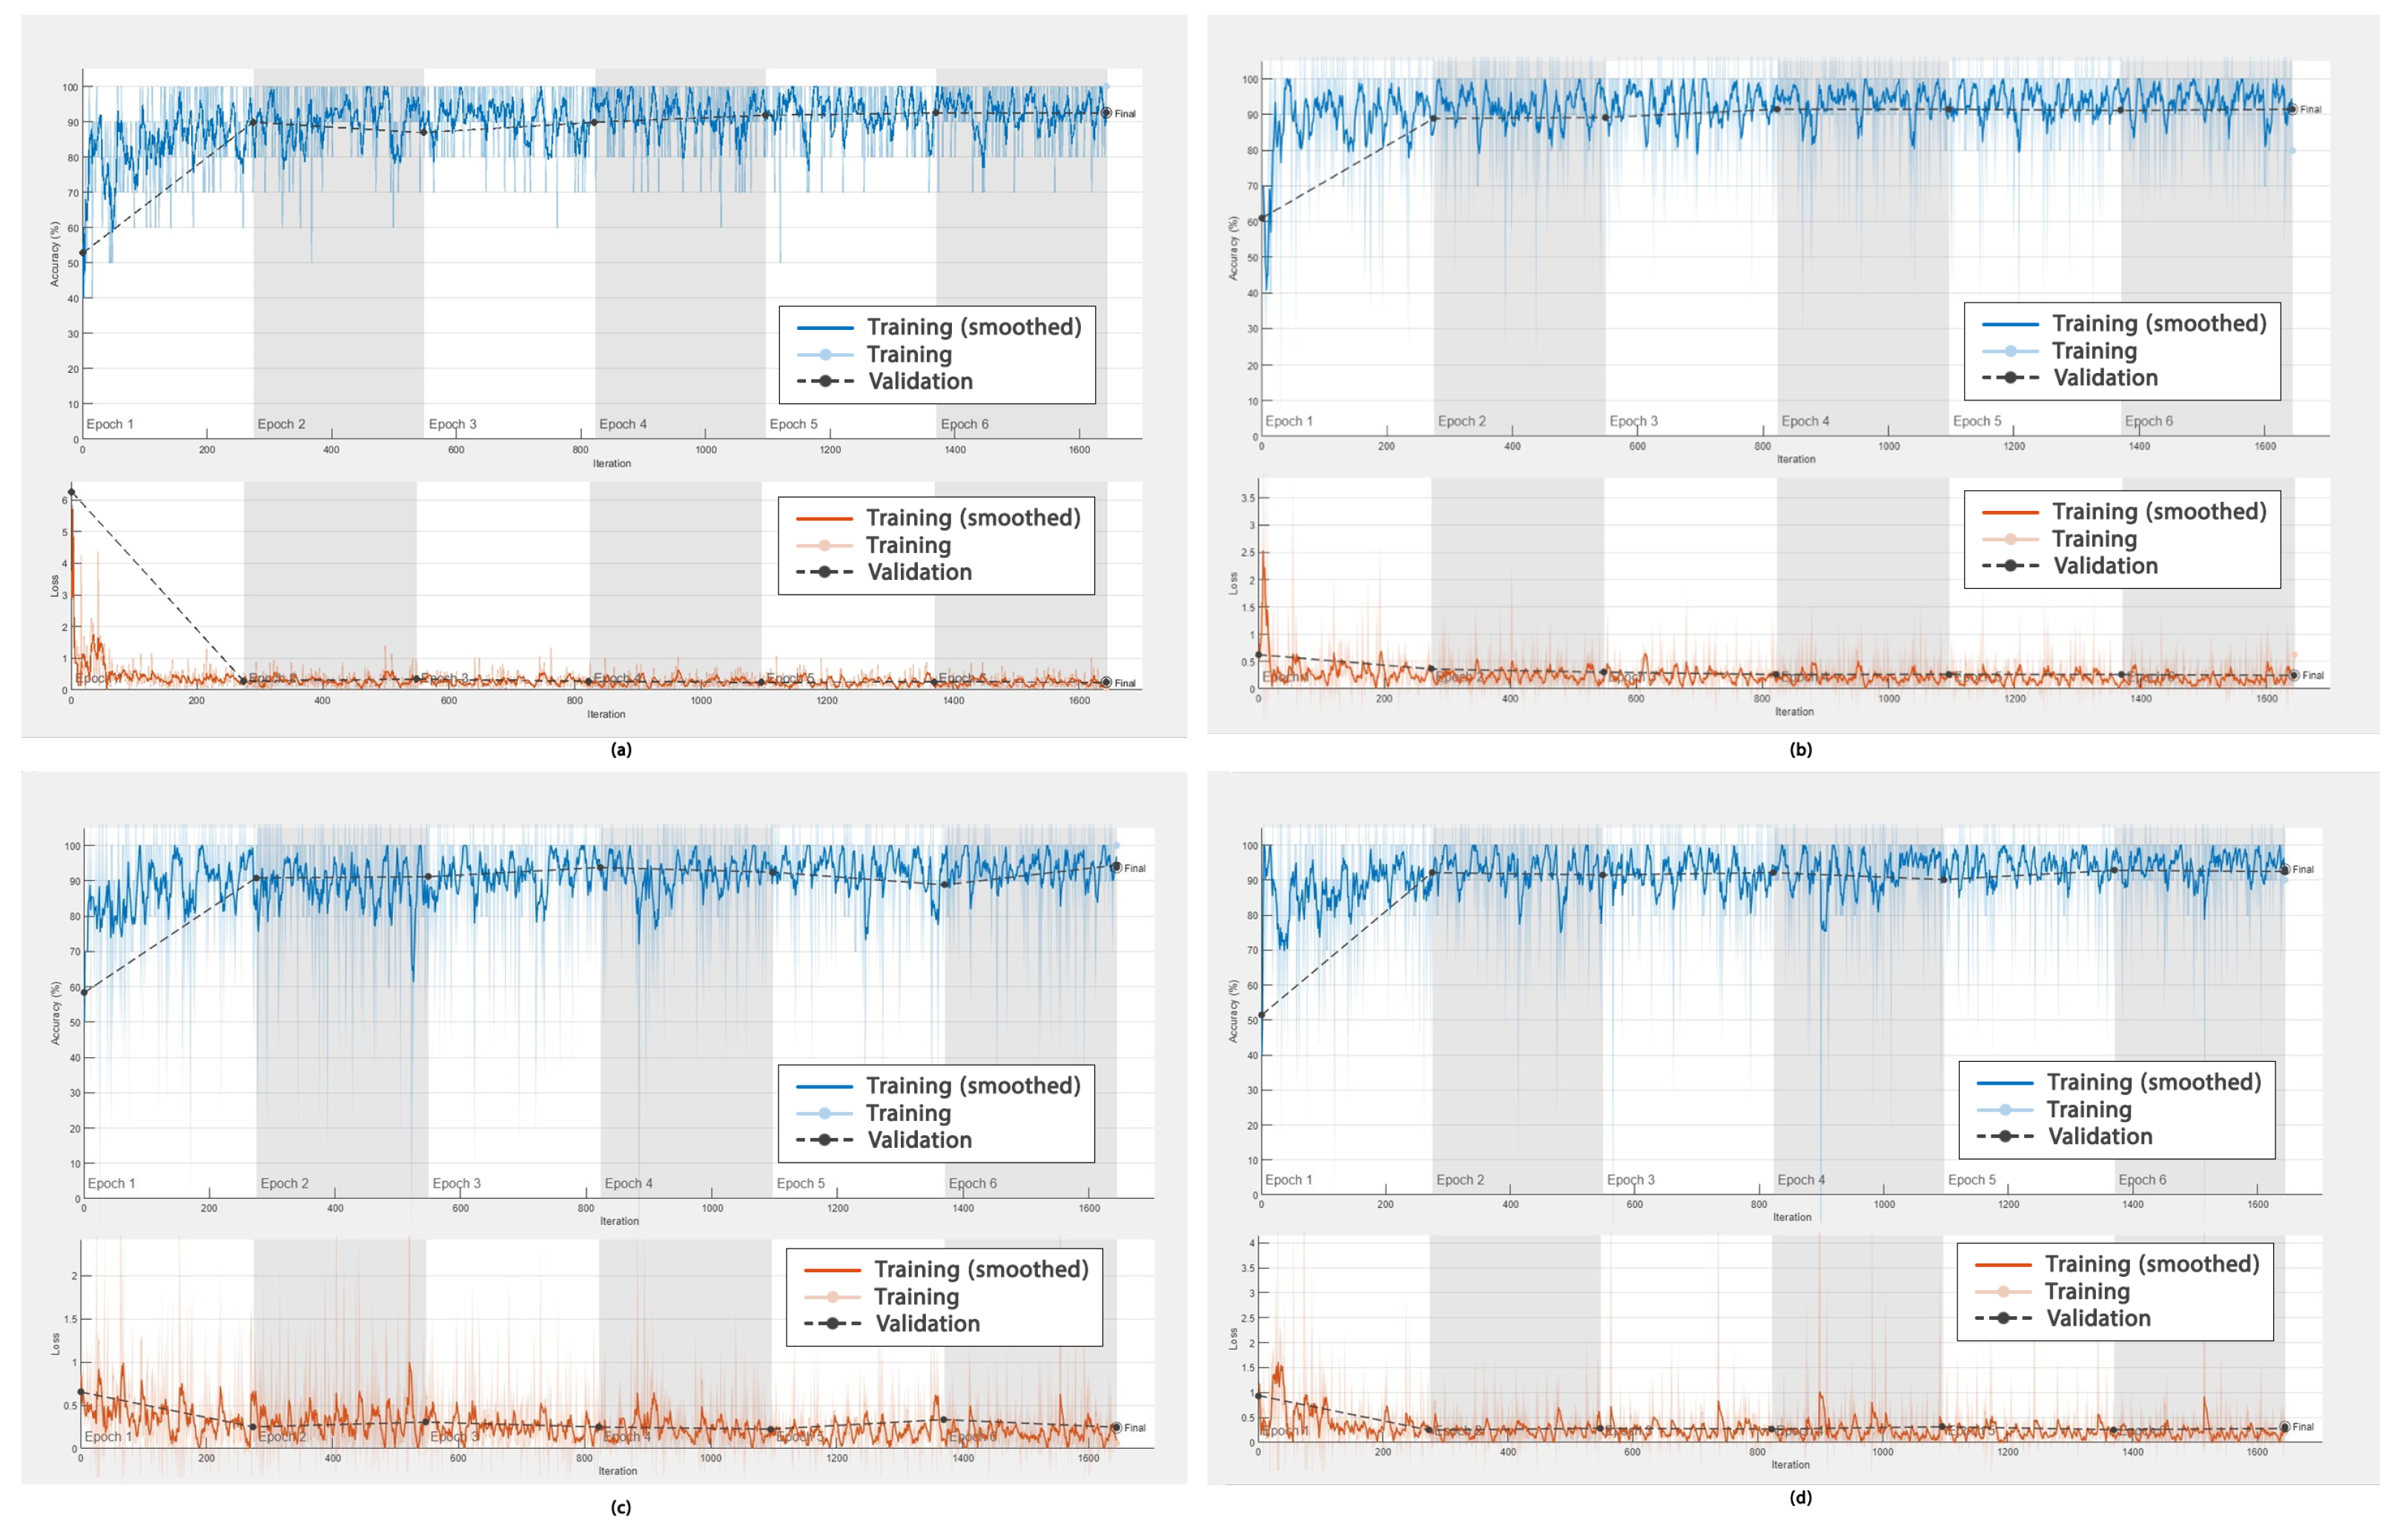
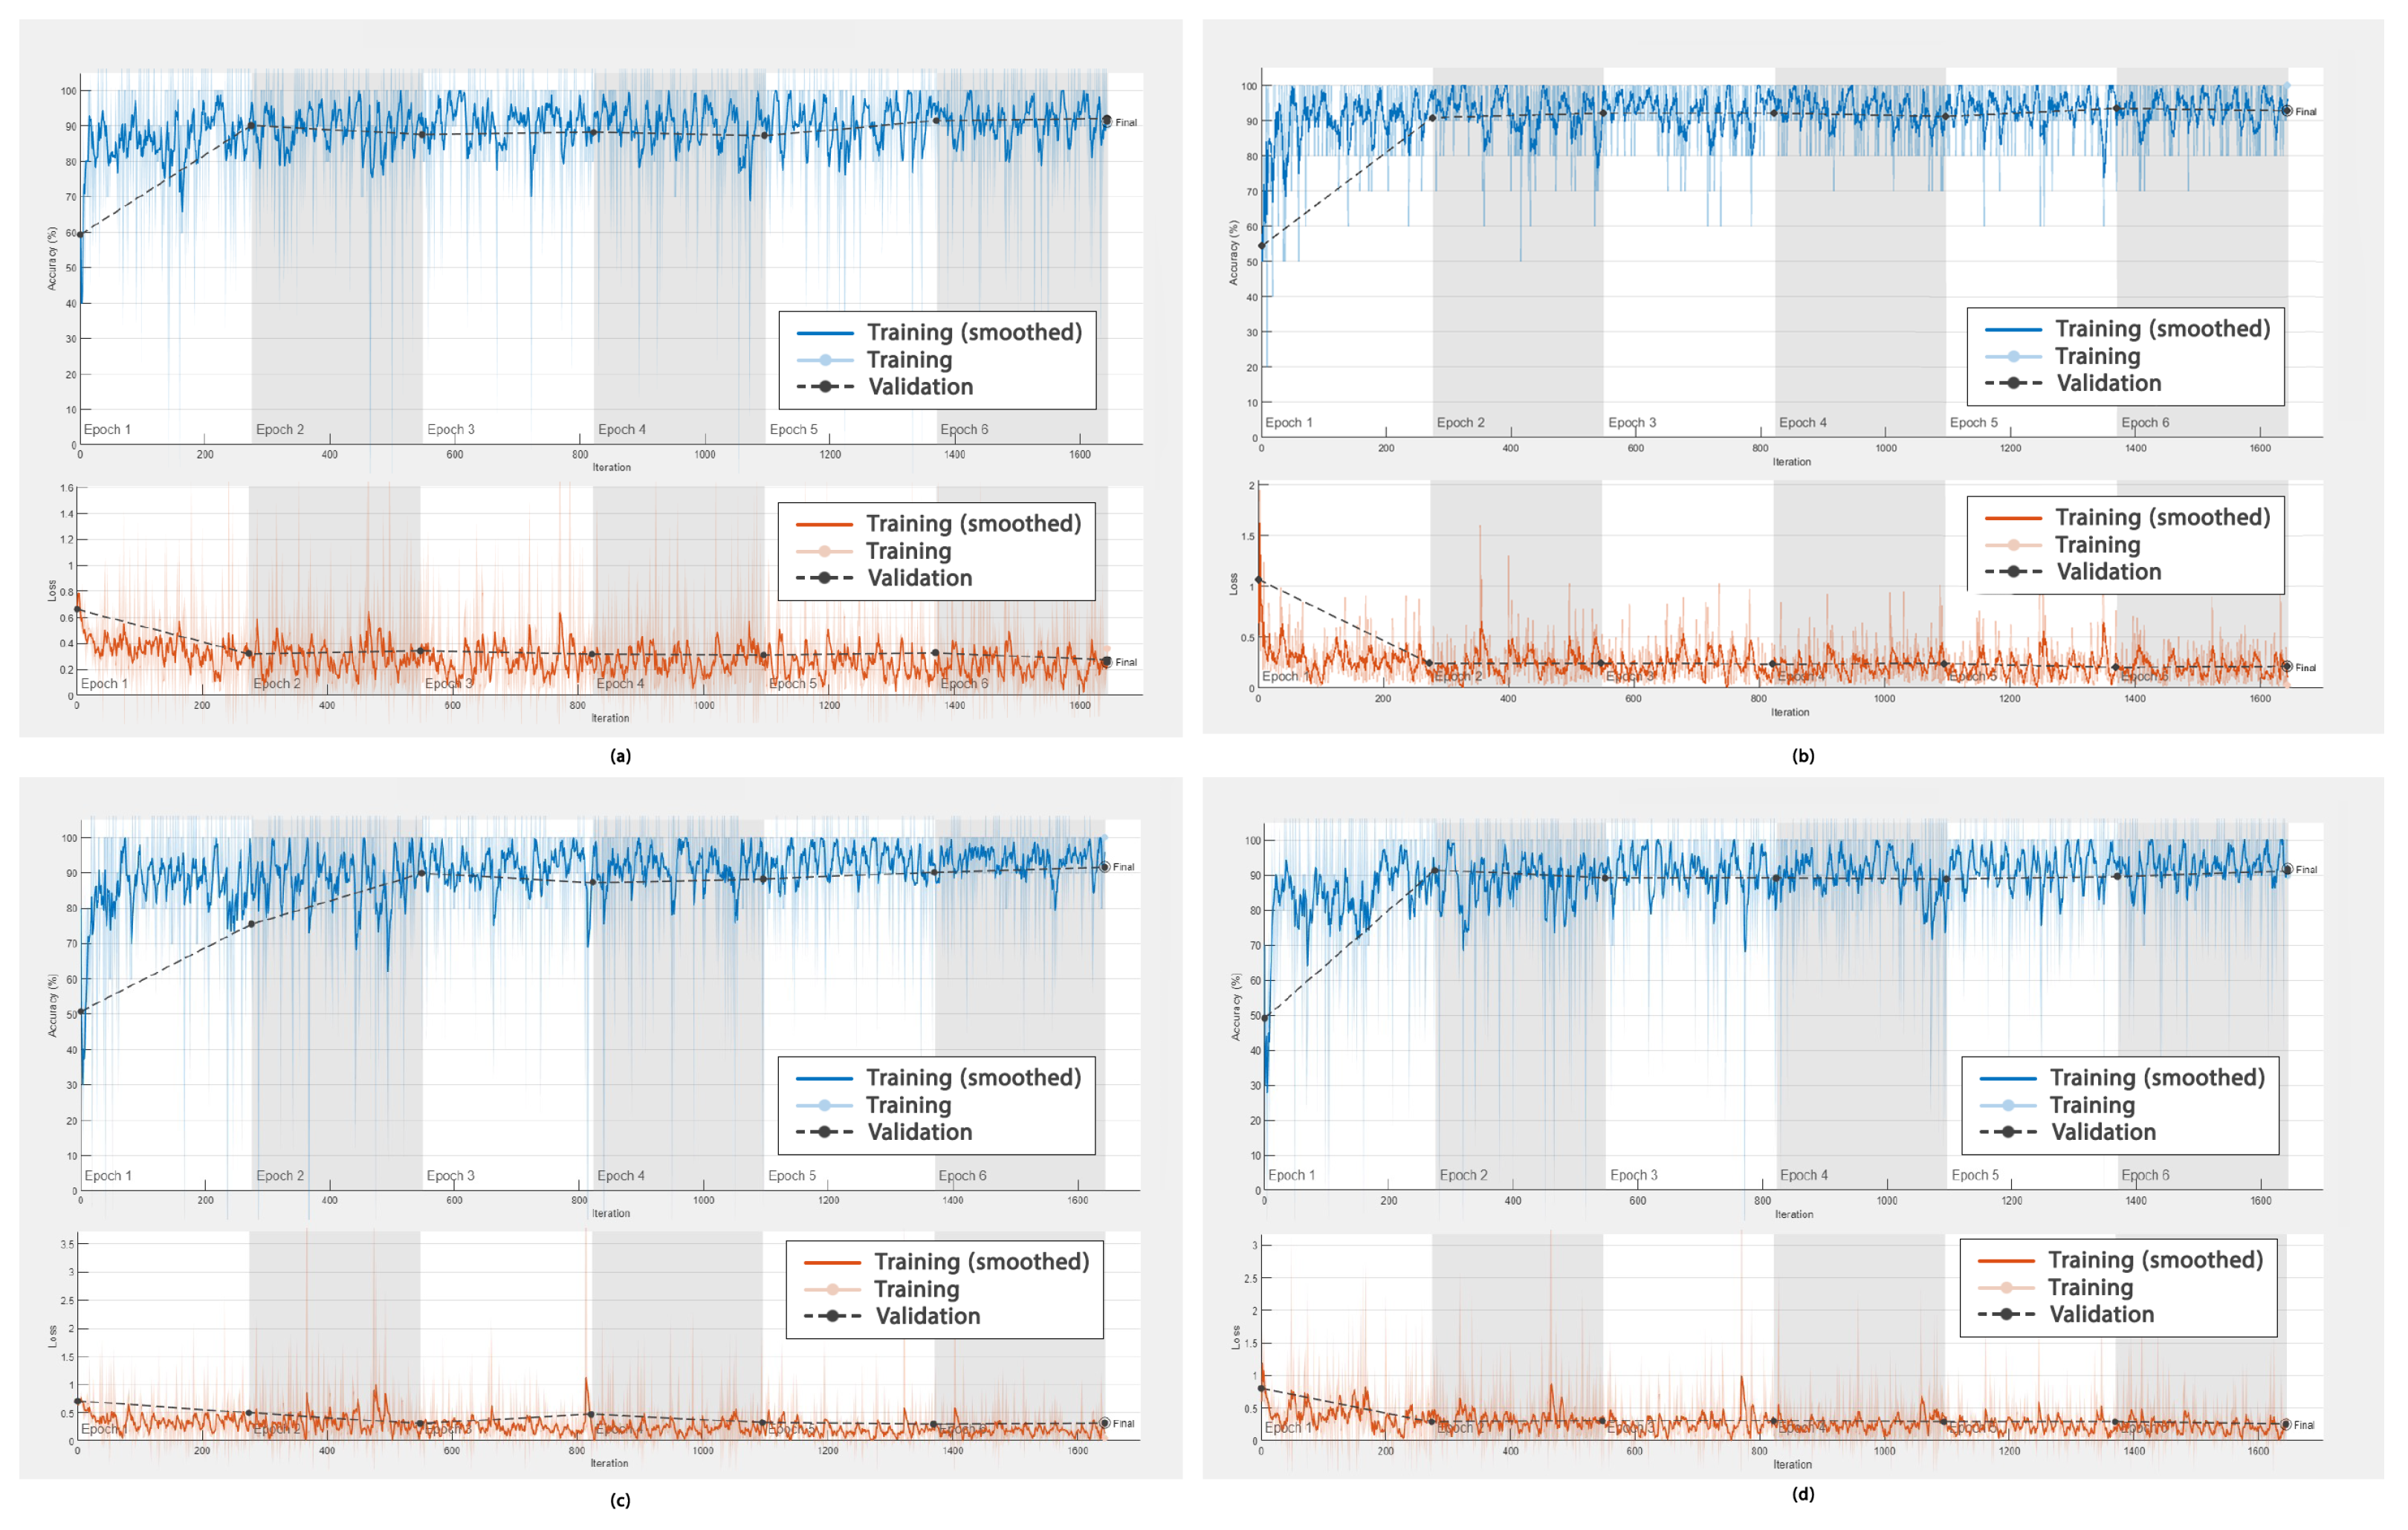
In addition to the ROC curves obtained to demonstrate the performance of the DL frameworks in DR detection, graphs showing the accuracy versus the number of epochs, as well as the error rate versus the epochs during training (smoothed) and validation, were obtained. These are shown in
Figure 9 and
Figure 10, respectively.
The accuracy of AlexNet, GoogleNet, ResNet-50, and DarkNet-53 is shown in
Figure 9a–d. Their values were high and fluctuated within an approximate range of 92% to 94%. The values for these four networks converged after epoch 3; however, more fluctuations were observed for ResNet after epoch 3 compared to AlexNet, GoogleNet, and DarkNet.
Furthermore, the accuracy of EfficientNet-60, SqueezeNet, Inception-v3, and MobileNet-v2, as shown in
Figure 10a–d, was high and fluctuated within an approximate range of 92% to 93.5%. These values converged after epoch 2 for the networks EfficientNet-60, SqueezeNet, and MobileNet-v2; however, for Inception-v3, they converged after epoch 3. Moreover, more fluctuations were observed for EfficientNet-60, Inception-v3, and MobileNet-v2 between the training and validation data as compared to SqueezeNet.
The error rates in DR detection using AlexNet, GoogleNet, ResNet-50, and DarkNet-53 were low, as shown in
Figure 9a–d, (ranging between 0 and 0.5%) and fluctuating at around 0%. These values converged after 250 iterations for these four networks.
Similarly, regarding the errors in DR detection, as shown in
Figure 10a–d, the rate was less than or equal to 0.5%. These values converged after 250 iterations for these four networks.
4. Discussion
In this study, we examined and compared the performance of eight pre-trained DNNs in DR detection. The best networks in this context were GoogleNet and ResNet-50, as they both achieved promising results across the selected criteria. Both the qualitative and quantitative results obtained in our research were in agreement, and all networks showed performance scores above 87% in detecting DR, with the highest being 100%.
Although the studies of Ratanapakorn et al. and Gharaibeh et al. dealt with the classification of retinal images, they used different databases, namely the KKU Eye Center database [
11] and the DIARETDB1 database [
12]. Our research focused on the APTOS 2019 dataset, which presents challenges due to the limited number of images included. Ratanapakorn et al. [
11] and Gharaibeh et al. [
12] focused on the detection and classification of DR with a single algorithm, which was beneficial in some aspects but also resulted in lower overall accuracy, which was not the case for the algorithms used in our framework—specifically, for GoogleNet and ResNet-50. Moreover, according to Gharaibeh et al., the sensitivity of the PNN, SVM, and SVMG models was 90, 98, and 99%, respectively, [
12]. However, in our study, the sensitivity of GoogleNet was almost 100%, and that of the other networks was above 97%. This indicates the significant contributions of our framework, which mainly relies on DNNs for the automatic detection of DR.
Furthermore, a thorough review of the previous research and the statistical results achieved was employed to enable the comparison with our findings. The proposed algorithm was compared to 11 methods reported in the literature, as shown in
Table 7. These 11 methods were (CNN, SVM) from 2021 [
28], the feedforward backpropagation NN [
28], the SVM from 2021 [
28], the SVM modified in 2021 for OCTA images [
28], (CNN, SVM) for OCT images [
36], the SVM from 2018 [
12], SVMGA from 2018 [
12], a PNN for fundus images [
12], K-Nearest Neighbors (KNN) for OCT images, random forest for OCT images [
36], and a random tree method from 2020 [
36].
According to the results shown in
Table 7, state-of-the-art algorithms that have been presented in the literature showed superior results compared to our framework using the eight different DL networks. Although the SVM, SVMGA, and PNN models used by Ghazal et al. showed robust results, indicated in bold, they could not be used for a rigorous comparison, as they only made use of 64 DR images. However, in our framework, we utilized a large database of 3662 images, with 1857 DR images. An additional advantage of this framework is that, regardless of the type of input image, the algorithm can identify it as a healthy or DR case automatically, with high percentages of sensitivity, accuracy, and specificity compared to the techniques available in the literature.
Some evaluation measures were lacking, denoted by ’-’ in
Table 7, due to the lack of data in [
13,
28]. It is noteworthy that other recent studies, such as one published in 2022, employed UNETs, which are advanced algorithms applied to biomedical images. However, these UNETs showed a prediction score of 88% for the disease [
38], and they were used for the detection of blood diseases rather than eye diseases. Although UNETs exhibit powerful prediction capabilities, our framework demonstrates stronger performance, both quantitatively and qualitatively, as reported in
Table 7.
Concerning the accuracy in DR detection relative to the number of epochs, among the employed DL networks, the accuracy ranged from 92% to 94% after epoch 2. This indicates remarkable performance as compared to the values obtained in the literature, such as in the work of Gharaibeh et al. [
12]. In addition, our results were based on a larger database of fundus images.
With regard to the error/loss in DR detection, the new framework employing the eight DL networks exhibited a negligible error rate of less than or equal to 0.5%. The eight networks—AlexNet, GoogleNet, ResNet-50, DarkNet-53, EfficientNet-60, SqueezeNet, Inception-v3, and MobileNet-v2—converged after 250 iterations and after epoch 2. The error rates during diagnosis were calculated and reported for the first time for these DNNs; these are shown in
Table 7 and were used to link the findings obtained with the new framework to the clinical findings.
An additional comparison was carried out using the methods for the diagnosis of retinal diseases. Traditional DL models, such as ResNet and GoogleNet, are often preferred over newer classification networks, such as Vision Transformer (ViT) [
39], Swin Transformer (ST) [
40], ConvNeXt, and Vision Mamba.
This comparison is shown in
Table 8, and it is based on different criteria—namely, the computational efficiency, training data requirements, feature extraction, generalization to small datasets, interpretability, availability of pre-trained medical models, localization of retinal features, stability and robustness, and adoption in medical AI applications considering CNN models [
41] and ViT and ST [
39,
40]. Alexey Dosovitskiy introduced ViT and discussed its high data dependency, as reported in
Table 8. Liu et al. demonstrated the performance of ST but also revealed its computational complexity [
40]. On the other hand, the advantages and criteria of the CNNs were provided, for instance, their capability in detecting small abnormalities in retinal images, and their ability to be fine-tuned on medical data.
Moreover, the images were clinically verified in the lab before processing, and the output of the new AI-based process was in accordance with the clinical outcomes—this was confirmed by the calculation of the error rate per epoch. It is noteworthy that most studies in the literature do not provide diagnosis errors. The decision to calculate the error rate in the current work was motivated by the fact that, without such algorithms, doctors would need to perform diagnosis based on either their experience or anatomical or functional images. This type of medical diagnosis is subject to errors. Therefore, we sought to demonstrate the significance of calculating the error rate in automatic diagnosis in comparison to the errors encountered in clinical diagnosis. It is noteworthy that the error rate obtained with the new framework was significantly lower.
This work also sought to illustrate the importance of carrying out such research and the significance of DR detection. It was found that most cases are due to “functional problems”, i.e., related to the flow of blood or the presence of blood in other regions. Hence, it was crucial to use optical images and not only classical images. Meanwhile, given that the prevalence of DR varies according to the region, diet, stress levels, etc., our attempts to cover a larger population are significant. As the APTOS data were collected in India, it is crucial to consider a broader international dataset to explore all possible variables in this field.
In addition to the use of a larger database, the broader implementation of retinal imaging in various settings, such as primary care clinics, remote areas without ophthalmologists, and areas with underserved populations, is likely to enhance DR detection and improve access to care. A standardized, reliable method to analyze retinal images is of great interest, and early AI methods seem to hold promise. These technological solutions reduce the need for trained specialists in the primary care setting and enable more efficient screening. Moreover, the promising results derived in the current work support the fact that AI reduces the burden associated with the manual review of fundus images [
42] through the use of technology to automatically screen such images for the presence of pathologies, especially for DR detection.
5. Conclusions and Future Work
This work involved the exploration of different types of DL algorithms in order to automatically detect DR from fundus images. We utilized eight networks and assessed their sensitivity, specificity, accuracy, and precision in detecting DR. The results indicated that DL-based approaches are effective in detecting DR.
The highest sensitivity was obtained using GoogleNet, which exhibited 99.44% sensitivity in DR detection, i.e., almost 100%, while ResNet-50 exhibited the highest specificity and precision at 89.74% and 90.7%, respectively. Moreover, both GoogleNet and ResNet were 93.56% accurate in detecting DR, while the other networks exhibited similar scores.
Although there are numerous classification networks available in the literature, the studied algorithms were selected based on previous research focusing on disease detection from images. The current work focused on exploring the significance of the different types of images and datasets. Significant results were obtained due to the use of a combination of medical, clinical, computational, and statistical evaluations, aiming to contribute to improving healthcare services. Moreover, we determined the optimal network by taking into consideration the demographics and types of images.
We summarize the main outcomes and achievements as follows:
We provided a new process and a new level of diagnosis for patients with DR, thus paving the way for enhanced healthcare services;
We explored the most powerful DL algorithms in the detection of this particular disease and in a specific population for preventative purposes;
At the clinical level, we developed an “augmented diagnosis”;
At the medical level, we highlighted the significance of using specific types of images, mainly fundus images with DNNs and functional images with ML or combined ML, where the DNNs showed significant accuracy;
At the computer level, we developed an autonomous and automatic evaluation;
At the AI level, we combined algorithms presented in earlier research with the currently used DL algorithms, as well as exploring existing DL networks and optimizing their parameters;
At the statistical and evaluation level, we achieved the highest accuracy in diagnosis and calculated the error rate in DR diagnosis for the first time;
We devised a framework that resulted in the minimum error in automatic diagnosis and early detection, with results that were in accordance with the clinical findings.
Lastly, the results obtained through the new framework’s application to medical images show that it is a promising tool for the diagnosis of DR, surpassing those found in the literature. As DR is the leading cause of avoidable vision impairment worldwide, the automatic early detection and diagnosis of DR, enabled by our framework, plays a vital role in preventing blindness or other types of visual impairment. The automatic detection of DR could enable doctors to quickly diagnose the disease, assist specialists in saving time and money, and benefit patients in terms of preventing the onset of blindness.
As a future direction, the development of a grading algorithm to further improve the application of this framework should be considered. Certain networks, such as Vision Transformer, Swin Transformer, ConvNeXt, and Vision Mamba, could also be considered in future research.
Moreover, while the construction of a new network is an important innovation, it must exhibit promising outcomes. Our framework can also be applied to different types of eye images and different population demographics.
Regarding the aspects of DR that were not explored, additional work linking the diagnosis to the factors behind the disease must be carried out. Moreover, additional metrics and scores, such as the AUC and boxplots to demonstrate the standard deviation, could be considered for the evaluation of DR diagnoses, thus paving the way for enhanced healthcare services. Furthermore, the consideration of different demographics and datasets is crucial, e.g., the Middle Eastern population, where there is a high rate of diabetes and DR, and international databases, such as those containing European, American, and other data.


