Article

Investigation of Aluminium White Dross for Hydrogen Generation Hydrolysis in Low-Concentration Alkali

1
Institute of Solid State Physics, University of Latvia, LV-1063 Riga, Latvia
2
Faculty of Industrial Engineering, Mechanical Engineering and Computer Science, University of Iceland, 107 Reykjavik, Iceland
3
Center for Hydrogen Energy Technologies, Lithuanian Energy Institute, 3 Breslaujos, 44403 Kaunas, Lithuania
4
IceTec, Árleynir 8, 112 Reykjavik, Iceland
*
Author to whom correspondence should be addressed.
Appl. Sci. 2025, 15(5), 2640; https://doi.org/10.3390/app15052640
Submission received: 20 December 2024 / Revised: 12 February 2025 / Accepted: 13 February 2025 / Published: 28 February 2025

Abstract

:
In this work, three samples of primary aluminium dross were investigated and compared to construction aluminium waste. The composition was determined, and an evaluation of hydrogen generation via hydrolysis in a low-concentration alkali solution was performed. The composition revealed low to moderate aluminium content and the presence of various crystalline phases; hydrolysis reactions showed hydrogen generation’s direct dependence on the amount of aluminium present, which translated into variation in the volume per sample mass. It was found that the composition played a substantial role in the evolution of hydrogen and its purity, simultaneously indicating a possible opportunity for dross use in hydrogen generation and power production. It was revealed that, in addition to the expected hydrogen, methane was released from some dross samples during the hydrolysis reaction. To compare the reaction kinetics, the reaction rate was obtained using the spherical solid particle shrinking core model and compared with that of construction aluminium waste. Hydrogen generation was compared to that in the known literature, and the dependence on the sample composition was determined.

1. Introduction

In today’s world, one crucial problem is the recycling of various types of waste in tandem with energy production. In general, aluminium (Al) recycling is a well-established industry with somewhat known parameters, such as packaging and beverage can recycling. The classification of aluminium scraps has been established and is currently dictated by the standards EN12258 and ISO/IEC 80079-34 [1,2,3]. Moreover, aluminium-rich solid waste materials are not suitable for disposal in non-hazardous waste landfills, as defined by the EU criteria. In fact, the EU regulations classify aluminium-rich by-products as a type of hazardous waste capable of creating flammable gases and forming explosive mixtures with the ambient air (hazard class codes: HP10; HP11; HP12; HP13; European Waste Code, EWC: 100323*). Aluminium recycling is not only an energy-intensive endeavour, but there is also a limitation to the recycling extent. There are Al wastes that have high recyclability, such as cans (containing ca. 94 wt.% Al, 1 wt.% oxides, and 5 wt.% other inclusions), and there are also large amounts of unrecyclable or hard-to-recycle waste, e.g., dross. Nowadays, recycled aluminium amounts to ca. 35% of the total primary Al production and requires 10–15 times less energy consumption [4,5,6]. In industrial production, the first step in aluminium recycling is the separation of the metallic components from non-metallic ones [4,7,8] by applying various screening techniques or even their combination, such as magnetic separation, eddy current separation, density separation and others [7,8,9,10,11,12,13]. It is well known that the aluminium–water reaction can produce hydrogen, leading to the hazardous nature of Al waste in landfills; it can be used for electricity production, where a by-product is aluminium hydroxide. As the amount of aluminium products increases, the dross will also increase; thus, there is a need to understand its applicability in renewable fuels. One of the crucial components of the use of the Al–H2O reaction and the utilisation of waste Al is the mitigation of CO2 emissions, as proven by Hiraki et al. in a life cycle analysis, where this reaction decreased the energy requirement to only 2% of that of the conventional method, leading to 4% of CO2 emissions [14]. The literature has concluded that impurities largely influence the production yield as well as the amount of by-products created in the Al–water reaction.
The Al–water reaction is distinguished by the absence or presence of a catalyst. It is known that aluminium reacts with ambient oxygen to create a protective surface layer. A piece of aluminium, placed into water, already has a surface layer of aluminium oxide or alumina, Al2O3, which reacts with water even at moderate temperatures to produce a boehmite AlOOH layer. This is the so-called induction step:
Al2O3 + H2O → 2AlOOH,
At the induction step, the boehmite film grows; in the meantime, the diffusion of OH- ions through the AlOOH layer occurs. As a result, hydrogen bubbles appear at the Al–Al2O3 interface:
6AlOOH + 2Al → 4Al2O3 + 3H2 (g),
The aim of catalyst usage is to eliminate the protective layer of aluminium oxide that hinders the reaction with water. In large-scale hydrogen production, the most common are alkaline catalysts, namely, sodium or potassium hydroxide. In the case of sodium hydroxide as the catalyst, aluminium oxide is dissolved:
Al2O3 + 2NaOH + 3H2O → 2Na+ + 2[Al(OH)4]-,
Furthermore, the exposed aluminium surface is able to react with water to form hydrogen:
2Al + 6H2O → 2Al(OH)3 + 3H2 (g),
The surface layer of aluminium hydroxide is dissolved by sodium:
Al(OH)3 + NaOH → Na+ + [Al(OH)4]-,
Excluding all dissociated ions, Equations (4) and (5) can be expressed as
2Al (s) + 6H2O + 2NaOH (aq) → 2NaAl(OH)4 (aq) + 3H2 (g),
Meanwhile, the regeneration of sodium hydroxide takes place via the decomposition of aqueous NaAl(OH)4, which results in aluminium hydroxide residues:
NaAl(OH)4 (aq) → NaOH (aq) + Al(OH)3 (s),
It is necessary to note that several parameters affect the above reaction chain: the purity of aluminium material, as well as its morphology, temperature, alkaline concentration, and alkaline stirring rate. Thus, it is expected to have variations in hydrogen production depending on the sample content.
The goal of this study is to investigate a set of industrial samples (white dross), identify the composition and elemental content, and estimate its use in Al-water reaction with alkali catalysts for hydrogen production, taking into account the produced gas purity and estimate its potential for power production.
Industrial samples were provided by Alcoa; they were investigated using XRD, EDS, SEM, reaction kinetics, and analysis of gases; reaction efficiency analysis was performed to estimate the potential use.

2. Materials and Methods

The materials used and tested in this study are industrial aluminium production by-products from various smelting stages. The expected composition of these samples is as follows:
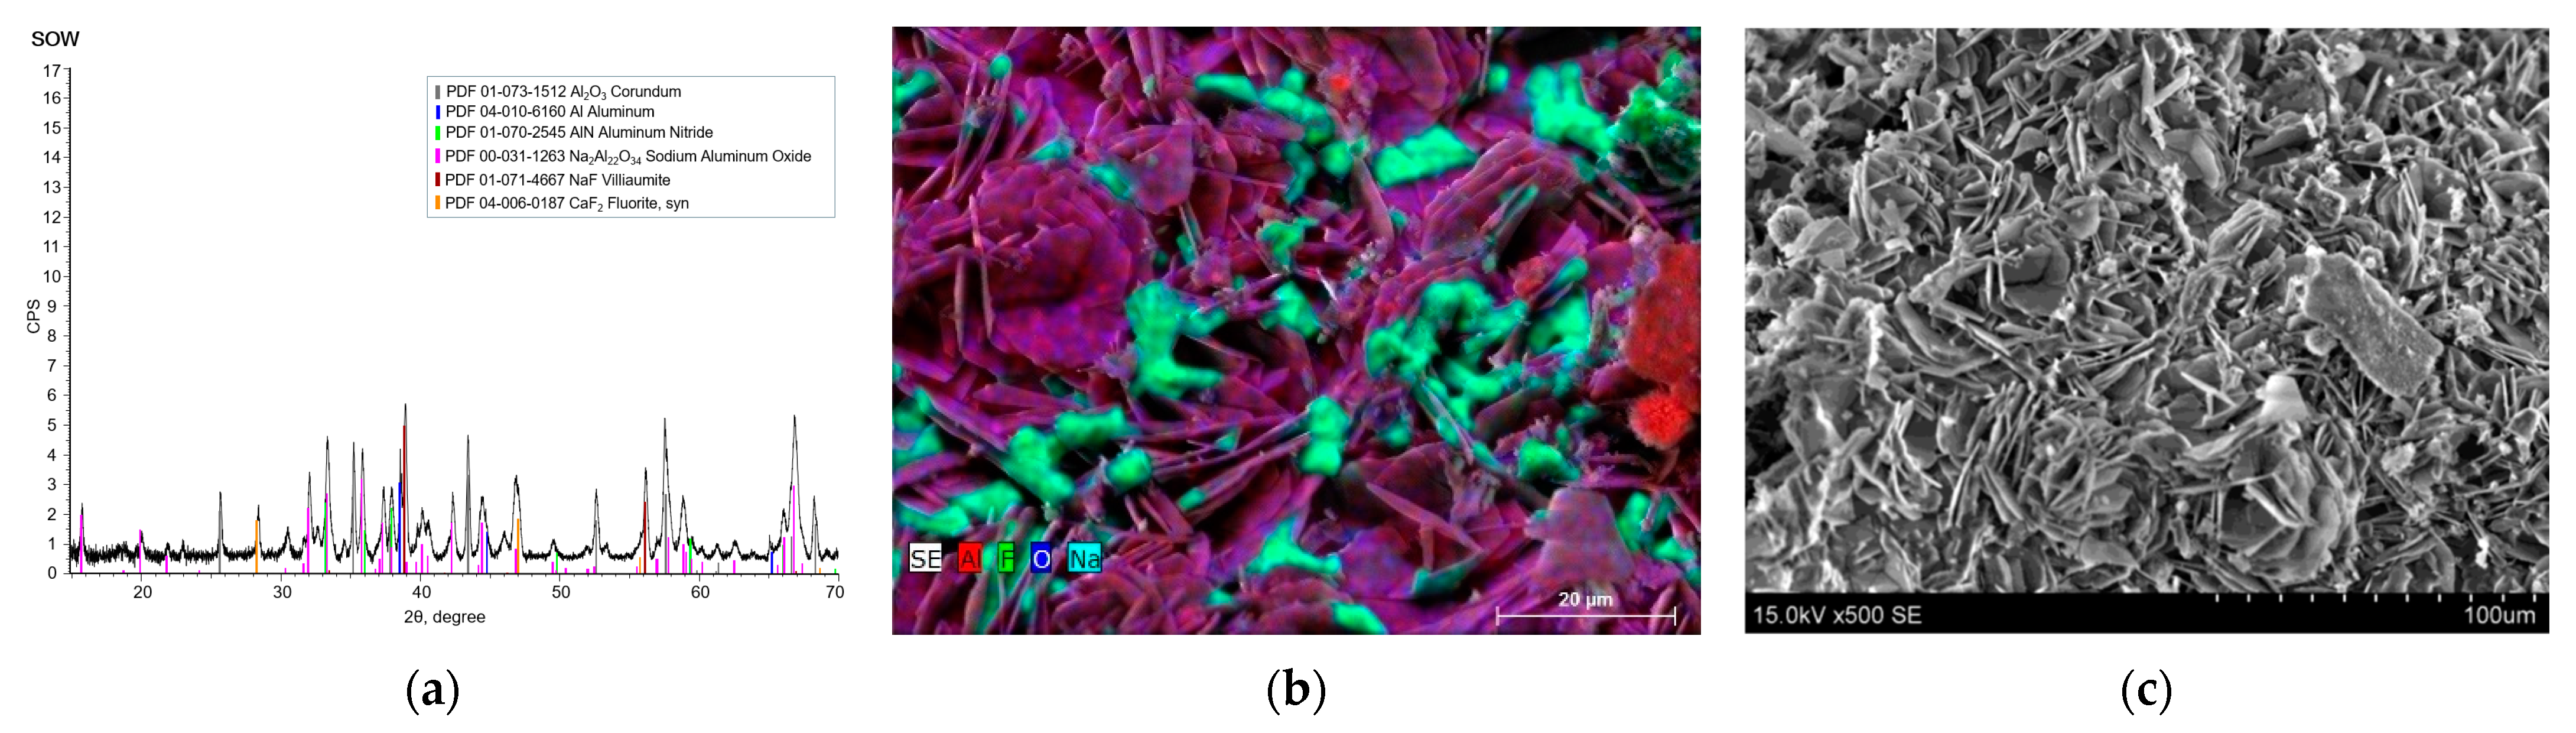
  • SOW: dross from pure aluminium (expected approx. 80% aluminium);
  • HDC: dross from 7% aluminium alloys (expected approx. 40% aluminium and approx. impurity content: 7% Si, 2% Mg, 0.5% Ti, and 1% Sr);
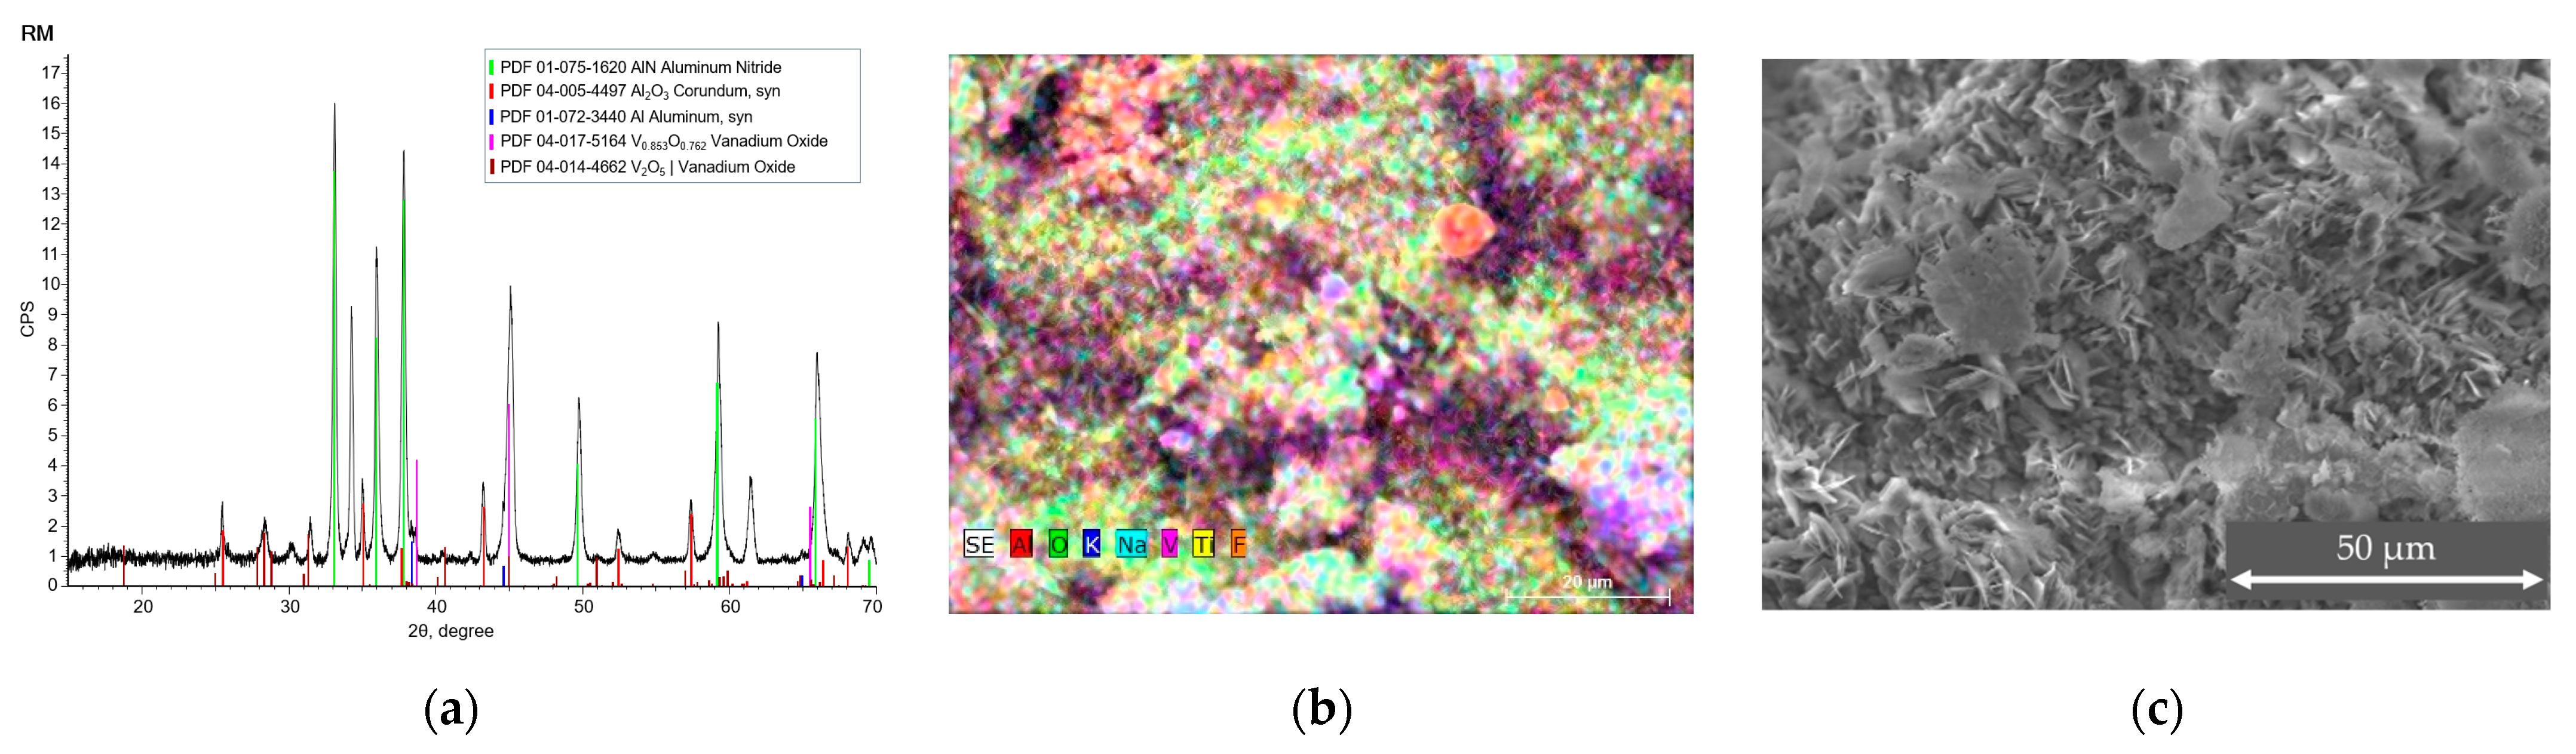
  • RM: dross from 1xxx series aluminium (approx. 40% aluminium) (approx. other impurity content: 1% B, 2% Ti, and 5% V).
Samples were analysed using various methods to determine the elemental and crystalline composition; hydrogen production potential was estimated via water–sample reaction together with kinetics evaluation via reaction rate determination. Decomposition with increased temperature was analysed using thermogravimetric analysis (Shimadzu Labsys Evo TGA, Kyoto, Japan) with a heating rate of 20 K·min−1 in the first section of analysis and then 10 K·min−1.
Morphological and structural analysis was carried out using a scanning electron microscope (SEM, Hitachi S3400 N, Tokyo, Japan), with elemental composition and elemental mapping carried out using energy-dispersive X-ray spectroscopy (EDS, Bruker Quad 5040, Hamburg, Germany). Crystalline structure was analysed using an X-ray diffractometer (XRD, Brucker D8, Hamburg, Germany) using a Cu Kα radiation and Lynx Eye linear position sensitive detector at two theta angles in range of 20–70°.
Hydrogen production from the water–dross reaction was carried out in a reactor, as reported in our previous work, and produced gasses analysed in a mass spectrometer (RGA100 MS, Stanford Research Systems, Sunnyvale, CA, USA) [15]. Shortly, 0.3 g of each sample was immersed in 100 mL of NaOH solution in deionised water at 1 M concentration; electrolyte temperature was kept at 40 °C. Experiments were performed without stirring. As the sample size is small, the hydrogen volume is relatively low. This is used to evaluate the composition of produced gases. The mass spectrometer is regularly calibrated using a dedicated calibration gas composition; containers are ordered from Linde-gas with present content depending on the intended experimental gas content. Measurements are made by taking at least three gas samples from each reaction and average values are reported. Dross samples are compared to construction Al waste, indicated as Alw1; composition and elemental analysis have been previously reported in [16].
O/N gas analysis was carried out (EGMA Horiba Ltd., Kyoto, Japan), where samples were heated via the impulse furnace to extract the gas enclosed within the samples and directly analysed by the detectors.
Samples without impurities in generated gas were tested for power production in direct use in the PEM hydrogen fuel cell, where power was estimated at a constant load. The experimental setup is analogous to our previously reported setup [17].

3. Results

To identify the decomposition of samples with increased temperature, the heating rate was set to 10 K·min−1. The thermogravimetric investigation, as seen in Figure S1, shows that a couple of decomposition processes occurred in all investigated samples, which was expected as the dross is a complex sample with many components. Most likely, these points arose from hydroxide, carbonate, and possibly from metallic Al melting. SOW has five points, RM also has five points, whereas HDC has only three points. The initial mass loss (starting from point 1) is related to the evaporation of moisture from the samples. This shows that dross utilisation via hydrolysis might pose problems with produced gas content due to the complexity of samples.

3.1. Elemental and Structural Analysis

As seen in Figure 1, the SOW sample consists of a majority of aluminium and alumina with a substantial number of impurities, mainly fluoride, as well as sodium that comes from the material processing reactants, in addition to Ca and Fe, regular additives to aluminium alloys, though nitrogen was not explicitly identified in the measured sample. The average elemental analysis is visible in Table S1. XRD analysis shows that the present samples were crystalline structures composed of corundum, calcium fluoride, and other components, such as sodium fluoride and aluminate. The nitride content changes a material’s thermal properties substantially and makes it difficult to physically process. Even in our processing experience, the preparation of samples was complicated, as the separation and grinding of samples took a lot of tools and time, thus proving yet again that recycling this material in a conventional way is time and energy-consuming. Figure S2 shows additional SEM-EDS measurement points and the elemental distribution of the said sample. In addition, we see a variation in morphology, which affirms the XRD results, as multiple types of crystalline structures are visible. The estimated content of Al in SOW is a little below 50%.
Sample RM consists of Al, O, K, Mg, Ca, Na, F, V, Fe, and Ti. The impurities are not evenly distributed, and we can see a variation of morphology, as shown in Figure 2a,b. Although the impurities are a small part of the total concentration, some parts show a higher amount of fluorine. The Al content varies from 30% to 45%, and oxygen varies from 43 to 59%; other trace elements also change substantially. The composition is shown in Table S2. It is known that the composition of samples will have a substantial effect on hydrogen production. Thus, it is expected to have lower reactivity and hydrogen production rates for the RM sample. On the other hand, crystalline structure shows a lower number of components, such as Al nitride, oxide, and vanadium oxide. In comparison to the SOW sample, the number of crystalline components is lower, and it is mostly composed of oxides, as seen in Figure 2a.
Using EDS and SEM, as seen in Figure 3a,b, we see that the HDC sample is somewhat homogeneous, without visible crystalline structures, which is corroborated by the XRD results, as the crystalline forms provide Bragg peaks of metallic Al. Moreover, Si, CaF2, and MgO are visible in the diffractogram pattern; see Figure 3c. Metallic Al, calcium fluoride, and magnesium oxide were detected. Notably, no nitrides or alumina were detected in the HDC sample. Thus, it consists of the following elements: Al, Mg, F, Si, Ca, and O, with a relatively even distribution across the sample area. Despite a seemingly even distribution and morphology, the elemental content was determined to be between 53 and 58% Al, with significant Si content, as seen in Table S3.
In addition, in the O/N gas analysis, we see similar results, where the composition of samples is widely dispersed, and the results can be seen in Table S4. Elemental analysis shows that depending on the processing stage of aluminium, dross has variations of compositions and structures, complicating the recycling and reusing of these materials. The simplified estimated energy consumption of 1t of dross is 454 kWh·t−1 in oil and 72 kWh·t−1 in electricity, with a yield of 0.45 t of metallic Al [18]. It is noteworthy that often the exact composition of used dross is not revealed or even not known. Nonetheless, it is not very easy to compare any results on composition as it will depend on the stage of sample collection.

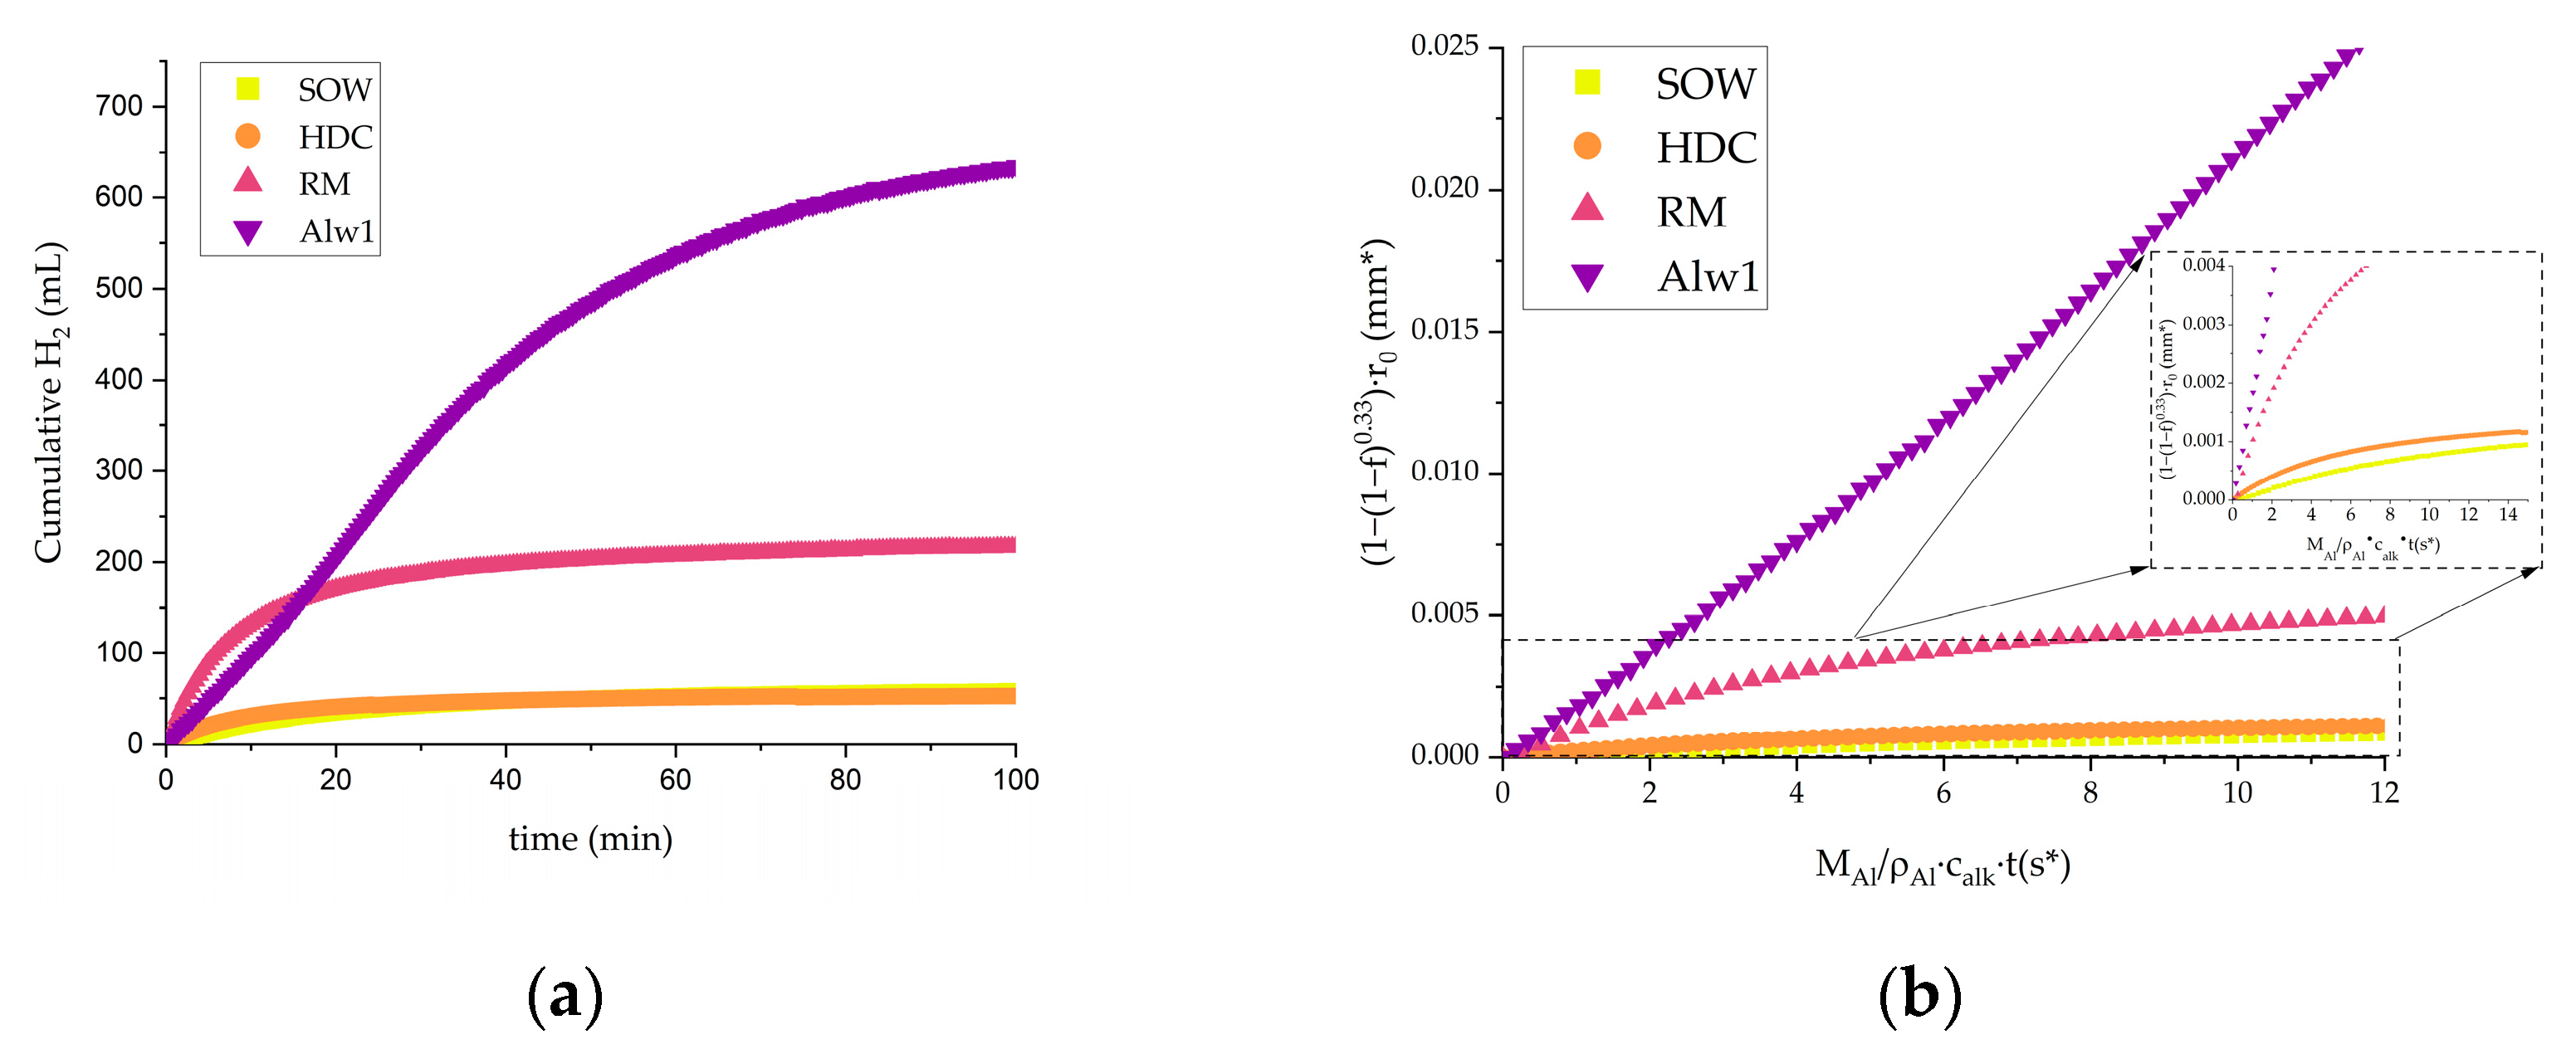
3.2. Hydrogen Production via Hydrolysis

The water–aluminium reaction produces gases at various rates depending on the composition, structure and electrolyte content. Considering the sample content, gas analysis is rather essential. Thus, we have to see what gases are produced during the reaction with the selected electrolyte.
For the SOW sample, we measured the gas composition at the beginning of the reaction and at a later stage; the composition of the analysed gases is visible in Table 1. We can see that 0.2% of methane was detected at the beginning of the reaction, with 97.4% hydrogen, 0.3% O2, 1.2% N2, and 0.1% CO2. At the end of the reaction, methane was still present at 0.2%, with water vapour at 0.1% and 99.6% hydrogen.
On the other hand, for RM hydrolysis, at the beginning, 98.3% hydrogen was detected and 0.0% methane, in addition to 0.4% N2, 0.1% O2, and 1.9% water. Then, the reaction was left to run till full completion. Contrary to SOW, methane was not present; that is, it could be up to 0.09 wt.% of content, which functionally means there was no methane. Hydrogen composed most of the collected gas, as shown in Table 1.
Hydrolysis using the HDC sample shows a steady production of gas and heat during the reaction. It starts with the release of CO2 and H2, as can be seen in Table 1. Then, it was left in the reactor overnight to allow the reaction to fully run out and determine the totality of reaction products. Even at long durations, methane evolution was detected, as well as nitrogen, which decreases the gas ratio. Therefore, the amount of H2 decreases to 92.5%. Methane, ethane, and CO2 are the most prominent impurities in the reaction. It is noteworthy that some N2 might have been introduced via a leak in the reactor, as the increase is relatively large. Methane is the significant impurity of the gas, with a concentration of 0.4%.
For gas use in power production via a fuel cell, the reaction was run separately using a similar setup to that described in our previous work [17]. To test if the gas composition changed, each hydrolysis reaction was run multiple times, where the produced gas was collected into a RESTEK gas bag and tested, then, depending on the impurity composition, fed to the fuel cell. The gas bag collection system was not vacuumed. Thus, we expected a higher air/nitrogen content. The results are shown in Table 2. Contrary to the vacuumed system, only HDC shows methane content; other samples essentially have only air and water as impurities. In SOW, there is a large amount of air, as seen in the N2 content and lower concentration of hydrogen. Alw1 gas content from the hydrolysis reaction is summarised in Table 2.

3.3. Comparison of Hydrogen Generation and Reaction Efficiency

The reaction was not as fast as expected for initial experiments with 1M alkaline and elevated temperature (40 °C) for better comparison with our previous results. The slowest H2 generation reaction was recorded from the HDC sample, while RM showed the highest generation velocity/rate. However, we observed that some particles of SOW and RM samples did not react at all, which could potentially be solved with further grinding to smaller particle sizes, but this was not performed to maintain a relative comparison between dross and Alw1 samples.
In the investigation of sample reaction efficiency, it seems that RM shows the highest efficiency, even though the initial expectation is that this sample has roughly 40% Al; in the composition, we see that it is mostly aluminium oxide, and XRD does not show much hydroxide. Other samples have impurities such as Si or N, C, which are expected to hinder the reaction. To increase the reactivity of samples, a mechanical pre-treatment of samples to a comparable particle size, then gas generation and reaction kinetics are compared. The cumulative hydrogen production is shown in Figure 4a, and reaction efficiencies are depicted in Figure 4b.
As the samples were pre-treated with a file/crushing, the particles were more spherical than cylindrical, resembling plates or films. This means that in the first degree of monodisperse approximation, the geometry of particles is described only by the single radius. With respect to volumetric bodies, in the chemical reaction, the shrinking of the solid reactant occurs. Hence, the radius is time-dependent, r(t). The base of the shrinking core model for a spherical particle is the expression that links the molar aluminium reaction rate dnAl/dt on the surface with the diminishing size of a particular particle:
4 π r 2 ( t ) d n A l d t = d d t 4 π 3 ρ A l M A l r 3 ( t ) ,
where ρAl and MAl are the density and molar mass of the solid aluminium particles. Equation (8) is correct for the first and more intensive so-called surface reaction rate step analysed in the present work. This equation is widely solved in literature [14], where it is shown that at a sufficient stirring, the following applies:
r ( t ) r 0 = 1 f 1 3 ,
where r0 is the initial radius of the solid particle, and f is the normalised non-dimensional hydrogen yield (0 < f < 1), where f = 1 means the maximal theoretical yield calculated by the ideal (or real) gas equation of state. In the experimental case of gaining the pressure p of yielded hydrogen in a constant volume V, the following applies:
f = 2 3 V R T a ( p p 0 ) W A l M A l ,
Here, WAl is the reacted aluminium mass, and p0 and Ta are the reference pressure and temperature, respectively. The coefficient 2/3 comes from the stoichiometry in the reaction between the solid and liquid (Equation (6)). Summarising Hiraki et al. [14], the reaction rate constant at the surface reaction step, ks, has to be derived from the following equation:
1 1 f 1 3 r 0 = M A l ρ A l · c a l k · t · k s
The coordinates in Figure 4b are chosen so that the slope of each curve at each point refers to the reaction rate constant ks. Table 3 displays the best possible detected constant values of ks before the surface reaction step is affected by the second mass transfer step of the chemical reaction [15]. We prefer to sign units on the x and y axes as mm* and s* because of non-dimensional multipliers.
In Table 3, we compare the estimated efficiency of industrial white dross H2 generated compared to a pure Al reaction, in addition to the reaction rate constant. Previously, we reported efficiency close to 100% of aluminium waste from window frame scrap [16]. For calculations, we used an Al density of 2700 g·cm−3, an initial particle radius of 0.06 mm, an Al molar mass of 27 g·mol−1, and 1M NaOH electrolyte. As we can see in the investigated samples in Table 1, HDC barely reaches over 12%, which is consistent with the reaction rate and sample composition.

3.4. Power Production

In the sample–water reaction, it was identified that AlN (as detected by XRD)- containing samples (SOW and RM) would form ammonia. Thus, using PEM fuel cell would not be viable for these types of materials as ammonia would degrade and poison the fuel cell. Any contamination must be avoided if generated gas is used in a fuel cell. Ammonia (even at ppm level) is an actual contaminant to the PEM hydrogen fuel cell [19]. A 15 h exposure to 30 ppm NH3 in the anode fuel caused a rapid drop in cell performance. It was expected to detect ammonia in gas samples, but as we saw in Table 1 and Table 2, no NH3 was identified; on the other hand, methane was. Thus, the sample generated from HDC was not used; on the other hand, the samples that contained no methane were used for power production via a fuel cell, where a constant load was applied to measure the output.
In Figure 5, we see the power output of the FC from tested samples. In these tests, 4 g of sample was used to measure the power output in a small FC stack. We see that Alw1 power production was initiated very quickly, as expected from the reaction rate constant and previous experience. As the sample is relatively pure compared to the white dross samples, there is a rapid increase in power production with constant maximum output for a set period and an equally rapid fall of power due to the end of the reaction. In this case, a simple setup for power production can provide power in 1.5 s after the start of the reaction, reaching a maximum in 1 s. On the other hand, the SOW sample showed a very slow reaction, and functionally, no power production was below 0.05W. RM showed a slower onset of hydrogen generation and thus power production; on the other hand, the produced power was more significant than Alw1 or SOW.

4. Discussion

A comparison to previously investigated samples indicates that these samples (SOW, RM, and HDC) have much lower efficiency with respect to previously used aluminium scrap samples. There are some experimental results on the composition of dross, such as works by Hong et al. [20], where they reported the dross content.
Work by Hong et al. was focused on electrochemical and various heating methods to produce Al-Si alloy and Brown Fused alumina, where the electrolytic process seemed to be much more efficient than the conventional method. It is noteworthy that not only the elemental composition but also crystalline structures were reported, such as alumina, silica, titania, and other oxides [20]. On the other hand, David and Kopac’s work focused on milling dross before hydrogen production via the Al-water reaction, where they reported only the elemental composition of dross. They reported higher hydrogen generation values after ball milling pretreatment and ascribed the increase to elements such as Ni, Zn, and Mg, explaining that these elements can also release hydrogen via reaction with NaOH and water [21]. An in-depth summary of various hydrogen-producing materials such as Mg, MgCo, Ni50Al50, and others encompasses various use cases for an Al-water reaction [22]. Contrary to the results reported by Zhao et al., where Ca presence was correlated with a lower hydrogen yield [23], Kup Aylikci et al. investigated shredded cans and compared Al foam with impurities such as Mg, Ti, and other tramp elements, and they investigated 1N and 2N NaOH electrolytes with added voltage to promote hydrogen production. Contrary to our previous findings [16], they did not see an influence of temperature on the production rate. In addition, the maximum yield was reached at 5V and 2N NaOH, 750 mL from 2 g of aluminium. They noted that impurities such as Mg2+ and Ca2+ ions hinder hydrogen generation due to their affinity to OH- ions [24]. Thus, the influence of Mg and Ca impurities is still not evident. In the case of these dross samples, HDC contains both elements in crystalline compounds, i.e., MgO and CaF2, and SOW has one CaF2; on the other hand, RM does not contain any. The hydrogen yield is highest for the RM sample, as seen in Table 3. Even though it is tempting to ascribe lower activity to Mg and Ca presence, further investigation has to be performed. The considerable influence could be due to the morphology of samples, i.e., active surface area. Alviani et al. investigated hydrogen production in an acidic environment with pH ~1 and elevated temperature; the environment of a hot spring contains the majority of Cl ions. In this work, Al cutting chips (pure Al, size of 5–30 mm in length and 0.05–0.15 mm in thickness) and Al black dross (Al content up to 23.5 wt% with particle size around 63 μm) were used. Reaction times ranged from 6 to 144 h, respectively. They reported an efficiency of up to 100% of theoretical hydrogen generation within the experiment time [25]. Thus, it is clear that the generated amount of hydrogen depends on the type of dross, as was similarly shown by Elsarrag et al., where landfilled dross compared to secondary aluminium production dross, respectively, produced 30% and 40% of the theoretical possible value considering the Al content. They also compared it to other works, taking into consideration various primary aluminium scraps as cans. The by-product of the reaction included crystalline structures such as Na5Al3F14, Na3AlF6, Na2Ca3Al2F14, and Al2O3 for both materials at different ratios. After the Al-water reaction, this dross by-product produced α and γ aluminium hydroxide and some leftover Na3AlF6 and alumina [26]. A summary of the elemental composition of investigated dross is seen in Table 4 compared to other works. We see a variation in the dross content and a variation in the final hydrogen outcome, as discussed above.
The composition of dross is directly dependent on the production cycle step where dross is created, as shown by Raabe et al. in an extensive investigation of alloy recycling, pointing out there can be a decreasing Al content from 90% to under 20% depending on the position of dross collection. The authors also provided an extensive explanation regarding the sources of various elements [27]. It is important to reiterate that as the dross can be collected from various processes and industries—primary and secondary aluminium production—it will yield substantial differences in elemental and crystalline composition; thus, the potential of generated H2 will vary. Even though there is an alternative use for dross, such as shown by Dangtungee et al., who investigated dross as a plant fertiliser, it still involves treatment with acids [28]; thus, potentially, some material is taken out of the Al cycle.
We can see that the investigation of hydrogen generation from dross, as well as an in-depth analysis of dross, has not been performed as widely as pure aluminium investigation, even though there is a technical and economic incentive to pursue novel options of dross utilisation, especially as we proceed further with larger numbers and variations of aluminium products.
The activity of the reaction stems from the composition and content of the investigated samples in addition to the final use of generated gas; some dross produced pure hydrogen; on the other hand, this work identified other gasses such as methane, nitrogen, and CO2, which points to different end-uses. These additives not only decrease the energy density of the generated gas mixture, making it leaner—in the case of nitrogen lowering generated power—but in the case of methane or CO2, the potential of coking and deactivation of catalysts increases with the gas impurity content. This would poison and damage the PEM FC. Thus, such impurities should be avoided for use in PEM FC but are not limited in other cases, such as direct injection into burners or solid oxide fuel cells. During TG analysis, we see multiple melting peaks, indicating various components present in the sample; no methane was identified/detected during heating and TG analysis. On the other hand, samples produce methane at the beginning of the hydrolysis reaction. In addition, we expected to see some amount of ammonia released during the hydrolysis reaction, but no ammonia was detected. This hints towards either the creation of ammonium or the mitigation of reaction in the electrolyte, i.e., rather than the release of NH3, the solid AlN was not reactive and stayed in solid form.
The hydrogen produced is classified as green hydrogen, and depending on the dross type, it could be used for electricity production or other use cases. However, the reaction parameters have to be adjusted for the final goal, such as alkali concentration, as our previous investigation shows that the concentration plays a crucial role in the reaction rate [16]. The results in this work indicate that white dross yields a significant variation of Al content; even within the expected amounts, it varies, which corresponds to other findings. Still, even with such large differences in Al content, it can be utilised for power generation via hydrogen production. In hydrogen production and power generation, there should be a clear dependence on the composition of the sample. Our results show that samples with lower aluminium content can still be utilised for power production, as seen in the prolonged power generation of sample RM. Although the measured Al content for samples ranged from 30% to 58%, it does not explain the differences in power production, except HDC, where the consistent release of methane makes it unusable for PEM FC but increases the potential for admixtures to methane stock, which would lead to lower CO2 emissions [29]. This provides an alternative opportunity for this material’s utilisation and increased useful lifetime. The reaction rate clearly distinguishes the SOW from RM, which could be connected to the crystalline composition or specific impurities. While the measured content of Al is roughly the same, the fluoride content is substantially larger in SOW.

5. Conclusions

In this work, three dross samples from primary aluminium production were investigated and tested for hydrogen production via direct hydrolysis with a low-concentration alkali solution. An analysis of the produced gas was carried out, and the reaction kinetics were estimated. The results were compared to literature data and industry-expected sample contents. It was shown that most of the composition coincided with the literature. Still, it is noteworthy that the composition of dross strongly depends on the industry, process, and stage of production. It was identified that the hydrolysis reaction generated methane, thus dismissing the use of dross for electricity generation via PEM FC, but it could be used in other areas.
Even though the investigated dross samples have a lower reaction efficiency compared to high Al content waste from window frames—the option to produce green hydrogen shows promise for material wherein conventional utilisation is highly complex and energy-demanding to recycle. The use of dross for power production was clearly shown in a simple setup emphasising the alternative.
Further investigation of the use of aluminium dross for the water–dross reaction is necessary, including life cycle analysis and in-depth by-product investigation, as it is not fully clear as to the industrially available yields of such material utilisation or the impurities’ influence on the yields, as the literature provides contrary models and compositions.

Supplementary Materials

The following supporting information can be downloaded at: https://www.mdpi.com/article/10.3390/app15052640/s1. Figure S1: A thermogravimetric analysis of samples; Figure S2: SEM-EDS analysis of SOW sample; Figure S3. SEM, EDS, and XRD analyses of RM sample; Figure S4. SEM, EDS, and XRD analyses of the HDC sample; Table S1: An elemental analysis of the SOW sample; Table S2: An elemental analysis of the RM sample; Table S3: An elemental analysis of the HDC sample; Table S4: O/N gas analysis.

Author Contributions

Conceptualisation, J.K. and A.K.; methodology, S.V. and G.G.; validation, D.M., J.K., and C.R.; formal analysis, A.M. and A.K.; investigation, S.V., M.U., R.S., and D.J.; resources, R.M.; writing—original draft preparation, A.K.; writing—review and editing, A.M. and S.V.; visualisation, A.K.; supervision, J.K.; project administration, A.K.; funding acquisition, A.K., J.K., S.V., G.G., and C.R. All authors have read and agreed to the published version of the manuscript.

Funding

The authors acknowledge financial support from the Baltic Research Programme project No. EEA-RESEARCH-92 “Aluminium in circle economy—from waste through hydrogen energy to alumina”—AliCE-Why under the EEA Grant of Iceland, Liechtenstein and Norway (No. EEZ/BPP/VIAA/2021/5).

Institutional Review Board Statement

Not applicable.

Informed Consent Statement

Not applicable.

Data Availability Statement

The raw data supporting the conclusions of this article will be made available by the authors on request.Data reported in this article are available upon reasonable request.

Acknowledgments

The authors acknowledge the experimental involvement of students and technicians by Peteris Lesnicenoks, Roberts Palmbahs, and Laimonis Jekabsons.

Conflicts of Interest

Author Rauan Meirbekova and Gudmundur Gunnarsson were employed by the company IceTec. The remaining authors declare that the research was conducted in the absence of any commercial or financial relationships that could be construed as a potential conflict of interest.

References

  1. Supporting, S.; Resource, M.U.S. Geological Survey Mineral Resources Program—Program. 2007. Available online: https://www.usgs.gov/programs/mineral-resources-program (accessed on 15 November 2024).
  2. EN12258; Aluminium and aluminium alloys—Terms and definitions—Part 1: General terms. European Standard: Avenue Marnix 17, B-1000 Brussels, 2012.
  3. ISO/IEC 80079-34:2018; Potentially explosive atmospheres—Application of quality systems. European Standard: Avenue Marnix 17, B-1000 Brussels, 2018.
  4. Capuzzi, S.; Timelli, G. Preparation and melting of scrap in aluminum recycling: A review. Metals 2018, 8, 249. [Google Scholar] [CrossRef]
  5. Blomberg, J.; Söderholm, P. The economics of secondary aluminium supply: An econometric analysis based on European data. Resour. Conserv. Recycl. 2009, 53, 455–463. [Google Scholar] [CrossRef]
  6. Green John, A.S. Aluminum Recycling and Processing for Energy Conservation and Sustainability; ASM International: Materials Park, Ohio, USA, 2007. [Google Scholar]
  7. Padamata, S.K.; Yasinskiy, A.; Polyakov, P. A Review of Secondary Aluminum Production and Its Byproducts. JOM 2021, 73, 2603–2614. [Google Scholar] [CrossRef]
  8. Bell, S.; Davis, B.; Javaid, A.; Essadiqi, E. Final Report on Refining Technologies of Aluminum Enhanced Recycling, Action Plan 2000 on Climate Change, Minerals and Metals Program-The Government of Canada Action Plan 2000 on Climate Change Minerals and Metals Program, Managed by the Minerals and Meta. 2003. Available online: https://ressources-naturelles.canada.ca/sites/www.nrcan.gc.ca/files/mineralsmetals/pdf/mms-smm/busi-indu/rad-rad/pdf/2003-21(cf)cc-eng.pdf (accessed on 12 February 2025).
  9. Smith, Y.R.; Nagel, J.R.; Rajamani, R.K. Eddy current separation for recovery of non-ferrous metallic particles: A comprehensive review. Miner. Eng. 2019, 133, 149–159. [Google Scholar] [CrossRef]
  10. Schlesinger, M.E. Aluminum Recycling; CRC Press: Boca Raton, FL, USA, 2006. [Google Scholar]
  11. Mesina, M.B.; De Jong, T.P.R.; Dalmijn, W.L. Improvements in separation of non-ferrous scrap metals using an electromagnetic sensor. Phys. Sep. Sci. Eng. 2003, 12, 87–101. [Google Scholar] [CrossRef]
  12. Coates, G.; Rahimifard, S. Modelling of post-fragmentation waste stream processing within UK shredder facilities. Waste Manag. 2009, 29, 44–53. [Google Scholar] [CrossRef]
  13. Venkoba Rao, B.; Kapur, P.C.; Konnur, R. Modeling the size-density partition surface of dense-medium separators. Int. J. Miner. Process. 2003, 72, 443–453. [Google Scholar] [CrossRef]
  14. Hiraki, T.; Takeuchi, M.; Hisa, M.; Akiyama, T. Hydrogen production from waste aluminum at different temperatures, with LCA. Mater. Trans. 2005, 46, 1052–1057. [Google Scholar] [CrossRef]
  15. Mezulis, A.; Richter, C.; Lesnicenoks, P.; Knoks, A.; Varnagiris, S.; Urbonavicius, M.; Milcius, D.; Kleperis, J. Studies on Water–Aluminum Scrap Reaction Kinetics in Two Steps and the Efficiency of Green Hydrogen Production. Energies 2023, 16, 5554. [Google Scholar] [CrossRef]
  16. Urbonavicius, M.; Varnagiris, S.; Mezulis, A.; Lesnicenoks, P.; Knoks, A.; Richter, C.; Milcius, D.; Meirbekova, R.; Gunnarsson, G.; Kleperis, J. Hydrogen from industrial aluminium scraps: Hydrolysis under various conditions, modelling of pH behaviour and analysis of reaction by-product. Int. J. Hydrogen Energy 2024, 50, 431–446. [Google Scholar] [CrossRef]
  17. Urbonavicius, M.; Varnagiris, S.; Knoks, A.; Mezulis, A.; Kleperis, J.; Richter, C.; Meirbekova, R.; Gunnarsson, G.; Milcius, D. Enhanced Hydrogen Generation through Low-Temperature Plasma Treatment of Waste Aluminum for Hydrolysis Reaction. Materials 2024, 17, 2637. [Google Scholar] [CrossRef]
  18. Ingason, H.T.; Sigfusson, T.I. Processing of Aluminum Dross: The Birth of a Closed Industrial Process. JOM 2014, 66, 2235–2242. [Google Scholar] [CrossRef]
  19. Cheng, X.; Shi, Z.; Glass, N.; Zhang, L.; Zhang, J.; Song, D.; Liu, Z.S.; Wang, H.; Shen, J. A review of PEM hydrogen fuel cell contamination: Impacts, mechanisms, and mitigation. J. Power Sources 2007, 165, 739–756. [Google Scholar] [CrossRef]
  20. Hong, J.P.; Jun, W.; Chen, H.Y.; Sun, B.D.; Li, J.J.; Chong, C. Process of aluminum dross recycling and life cycle assessment for Al-Si alloys and brown fused alumina. Trans. Nonferrous Met. Soc. China (Engl. Ed.) 2010, 20, 2155–2161. [Google Scholar] [CrossRef]
  21. David, E.; Kopac, J. Hydrolysis of aluminum dross material to achieve zero hazardous waste. J. Hazard. Mater. 2012, 209–210, 501–509. [Google Scholar] [CrossRef]
  22. Olivares-Ramirez, J.M.; de Jesus, A.M.; Jimenez-Sandoval, O.; Pless, R.C. Hydrogen Generation by Treatment of Aluminium Metal with Aqueous Solutions: Procedures and Uses. In Hydrogen Energy-Challenges and Perspectives; IntechOpen: London, UK, 2012. [Google Scholar]
  23. Zhao, Z.; Chen, X.; Hao, M. Hydrogen generation by splitting water with Al-Ca alloy. Energy 2011, 36, 2782–2787. [Google Scholar] [CrossRef]
  24. Küp Aylikci, N.; Mert, S.O.; Aylikci, V.; Bahceci, E.; Depci, T.; Oruç, Ö. Microhydrogen production with water splitting from daily used waste aluminum. Int. J. Hydrogen Energy 2021, 46, 28912–28924. [Google Scholar] [CrossRef]
  25. Alviani, V.N.; Hirano, N.; Watanabe, N.; Oba, M.; Uno, M.; Tsuchiya, N. Local initiative hydrogen production by utilization of aluminum waste materials and natural acidic hot-spring water. Appl. Energy 2021, 293, 116909. [Google Scholar] [CrossRef]
  26. Elsarrag, E.; Elhoweris, A.; Alhorr, Y. The production of hydrogen as an alternative energy carrier from aluminium waste. Energy Sustain. Soc. 2017, 7, 1–14. [Google Scholar] [CrossRef]
  27. Raabe, D.; Ponge, D.; Uggowitzer, P.; Roscher, M.; Paolantonio, M.; Liu, C.; Antrekowitsch, H.; Kozeschnik, E.; Seidmann, D.; Gault, B.; et al. Making sustainable aluminum by recycling scrap: The science of “dirty” alloys. Prog. Mater. Sci. 2022, 128, 100947. [Google Scholar]
  28. Dangtungee, R.; Vatcharakajon, P.; Techawinyutham, L. Aluminium dross neutralization and its application as plant fertilizer In Materials Today: Proceedings; Elsevier: Amsterdam, The Netherlands, 2021; Volume 52, pp. 2420–2426. [Google Scholar]
  29. Kleperis, J.; Boss, D.; Mezulis, A.; Zemite, L.; Lesnicenoks, P.; Knoks, A.; Dimanta, I. Analysis of the Role of the Latvian Natural Gas Network for the use of Future Energy Systems: Hydrogen from Res. Latv. J. Phys. Tech. Sci. 2021, 58, 214–226. [Google Scholar] [CrossRef]
Figure 1. XRD and SEM-EDS analysis of sample SOW. (a) XRD diffractogram of the sample, where various crystalline phases are present; (b) EDS measurement, where atomic content corresponds to crystalline phases; (c) SEM micrograph of SOW sample, where flat flakes are visible, indicating relatively large surface area.
Applsci 15 02640 g001
Figure 2. SEM, EDS, and XRD analysis of RM sample. (a) XRD of the sample; (b) ESD analysis with all element mapping, with significant variation of impurities; (c) SEM micrograph of RM, where flake-type morphology is visible.
Applsci 15 02640 g002
Figure 3. SEM, EDS, and XRD analysis of the HDC sample. (a) ESD mapping; (b) SEM micrograph of HDC surface; (c) XRD diffractogram of the sample.
Applsci 15 02640 g003
Figure 4. (a) Cumulative hydrogen volume produced in hydrolysis dross sample with comparison to industrial waste Alw1; (b) reaction efficiency for uniform size samples, with comparison between samples.
Applsci 15 02640 g004
Figure 5. Produced power on constant load via hydrogen generation and utilisation in H2 FC.
Applsci 15 02640 g005
Table 1. Gas analysis, where methane presence is detected.
SOWRMHDC
ElementStartEndStartEndStartEnd
Argon0.00.00.00.00.00.0
Carbon Dioxide0.10.00.20.20.20.2
Hydrogen97.499.698.397.298.392.5
Methane0.20.20.00.00.00.4
Nitrogen1.20.00.40.50.45.2
Oxygen0.30.00.10.20.11.0
Water0.70.11.91.90.90.5
Table 2. Hydrolysis gas analysis in the FC setup.
ElementSOWRMHDCAlw1
Argon0.50.00.00.0
Carbon Dioxide0.10.10.00.1
Ethane0.00.00.00.0
Hydrogen68.394.499.398.2
Methane0.00.00.20.0
Nitrogen24.84.210.30.4
Oxygen6.10.10.10.1
Water0.20.20.11.1
Table 3. Reaction rate coefficient as calculated in the activity graphs.
SampleYield of the Theoretical Value (%)Reaction Rate Constant ks (mm·s−1)
RM65.70.001
SOW24.90.000107
HDC12.70.000229
Alw199.90.0125
Table 4. Dross and Al composition comparison, with quantitative and qualitative content analysis.
SourceAlCrFeCaSiNaKCuZnNiMgTiPbSnMnBCFO
[21]43.30.0884.320.4510.90.80.211.170.90.871.850.270.0530.2
[20]73.050.912.797.135.78 9.261.08
[25] 5612.70.000229
[26]11.65 0.181.510.0817.960.050.02
[26]40.02 0.080.340.070.480.020.86
Alw1 [16]94.3 0.6 5.0 0.1
RM29.19–32.46Trace–0.71Trace–0.1Trace–0.28Trace–5.70Trace–1.9813.19–57.76
SOW19.11–48.20Trace–0.29Trace–0.294.75–18.96 19.03–53.767.58–27.74
HDC58.81 trace0.2429.20 trace 1.66trace Trace–28.328.42–16.601.67–4.23
Disclaimer/Publisher’s Note: The statements, opinions and data contained in all publications are solely those of the individual author(s) and contributor(s) and not of MDPI and/or the editor(s). MDPI and/or the editor(s) disclaim responsibility for any injury to people or property resulting from any ideas, methods, instructions or products referred to in the content.

