Abstract
This study aimed to identify the critical ground motion parameters that lead to structural damage and assess their impact on the nonlinear responses of buildings. The analyses are carried out using a calibrated numerical model that was acquired within the ICONS experimental framework that represents reinforced concrete (RC) structures constructed before seismic design regulations were enforced. For the analysis, 30 seismic records were chosen based on magnitude (M), epicentral distance (R), and peak ground acceleration (PGA) for two high seismic activity areas that were observed. Eleven parameters are categorized, traditional metrics, energy-based, spectrum-based, duration-based, and fundamental metrics, and examined based on their main attributes. The results showed a strong relationship between certain seismic properties and the maximum interstory drifts of building as a damage prediction parameter. Peak ground velocity (PGV), specific energy density (SED), and Housner Intensity (HI) were found to be the most important variables in assessing the correlation with possible structural damage. Therefore, the assessment of structural damage based on nonlinear dynamic analysis should primarily incorporate PGV with the possible addition of energy- and spectrum-based metrics as the most reliable ground motion parameters for the selection of earthquake records for time history analysis.
1. Introduction
Seismic performance assessments are vital to understand and mitigate the risk of earthquake events on structures. In performance-based seismic evaluations, probabilistic seismic demand analysis is one important component that merges seismic hazard with the structural response to ground motions, thus helping with the prediction of possible damage and giving guidance for design decisions [1,2,3]. Ground motion intensity measures (IMs) are essential to this process of connecting seismic hazard and structural response [4]. The selection of an optimal intensity measure (IM) is critical, as it directly influences the accuracy of predictions for structural performance and the efficiency of seismic assessments. A good IM must minimize variability, be practical for real application, and capture key features of both ground motion and structural behavior [5,6].
Recent studies have concentrated on distinguishing between non-structure-specific IMs, which only consider the characteristics of ground motion such as PGA or peak ground displacement (PGD), and structure-specific IMs, which integrate both the characteristics of ground motion and structural properties, such as modal vibrations [3,4,5,7]. In [3], the authors concluded that there are no specific IMs that are appropriate for all structures regardless of the structure features (type of the structural system, construction material, number of stories, design details, etc.). Non-structure-specific IMs have been found to be less effective in predicting structural responses due to their weak correlation with actual damage indicators, particularly in complex or high-rise structures [4,7,8,9]. Based on the analysis from [9], with 320 frame models for each of the 4-, 8-, and 12-story building frames, in terms of efficiency and proficiency, PGV was the optimal IM. Consequently, research has increasingly shifted toward the development and optimization of structure-specific IMs that account for the nuanced interplay between structural dynamics and seismic excitations [4,5,8,10]. In [4], the authors stated that PGV can be efficient in representing the critical seismic intensities that cause the collapse of super-high-rise buildings. These enhancements in the selection of IMs and seismic modeling have been instrumental in improving the predictive capacity of seismic assessments. In parallel to such effectiveness, the selection of the proper appropriate ground motion records is also associated, reflecting both the seismicity of a region and some particular characteristics concerning the buildings themselves [3,5].
In addition to efforts in structural modeling, there has been considerable study correlating ground motion parameters (GMPs) with some structural damage indicator variables, such as interstory drift or input energy. Among the GMPs, PGA, PGV, and spectral acceleration (SA) are the most commonly adopted, while in recent years some evidence suggests that more advanced IMs, such as spectral-based parameters, would be better correlated with structural damage, especially in nonlinear systems [2,3,5,11,12]. The results from [8] revealed that spectrum intensity parameters, having the strongest correlation, are superior to other parameters, such as peak ground velocity, peak ground acceleration, and spectral acceleration. These conclusions represent an ongoing investigation that is very much necessary for re-finessing seismic vulnerability assessments and improving the prediction of damage, particularly for those structures in high-seismic zones [5,7].
Studies reveal varying correlations between IMs and damage measures (DMs), with advanced parameters like Housner Intensity (HI) and velocity spectrum intensity (VSI) outperforming traditional measures [13,14]. In particular, Housner spectrum intensity (HI), PGV, and cumulative absolute velocity (CAV) were the optimal IMs, according to the study presented in [12]. Conversely, Arias intensity (Ia) demonstrates very low correlations with the demand parameters [12].
In spite of these advancements, there are still substantial gaps in our comprehension of the specific characteristics of seismic records that regulate the responses of structures, particularly in the context of nonlinear effects. The majority of the studies conducted thus far have only utilized a restricted set of seismic parameters, such as PGA, without conducting a comprehensive analysis of the structural damage caused by energy-based and frequency-dependent parameters [15]. Additionally, there is a dearth of research on older buildings, particularly those that were constructed prior to the implementation of current seismic design codes, as these structures frequently exhibit distinct damage patterns in comparison to their more recent counterparts [16].
The majority of the current research is concentrated on newly constructed buildings, while older buildings continue to pose a substantial risk, particularly in areas with high-seismic activity. The objective of this research was to investigate the nonlinear response of existing structures in relation to seismic record attributes. Tise research concentrated on reinforced concrete structures that were constructed prior to the implementation of contemporary seismic regulations. The objective of this research was to determine the most critical seismic parameters that affect the damage to structures caused by earthquakes, quantified by the interstory drift ratio, a damage demand measure, and to evaluate their mutual correlation. By examining these relationships, this study evaluated the most effective IMs for predicting structural damage in seismic events in order to evaluate correlated input data for the appropriate selection of earthquake records for reliable nonlinear dynamic analysis results.
2. Ground Motion Parameters
Seismic records are intricate datasets essential for understanding earthquake impacts [17]. These records describe seismic excitation intensity and its connection to structural responses, enabling solutions to engineering problems. Key attributes of seismic records include magnitude, spectral composition, and duration. Multiple intensity measures capture these features, offering better ground motion characterization and improved predictions of structural vulnerability [18]. This study examines the key parameters presented in Table 1: peak ground acceleration (PGA), peak ground velocity (PGV), peak ground displacement (PGD), specific energy density (SED), acceleration spectrum intensity (ASI), Housner Intensity (HI), Arias intensity (Ia), Uniform Duration (UD), Significant Duration (SD), magnitude (M), and epicentral distance (R).

Table 1.
Ground motion parameters examined in study.
Traditional metrics, including peak ground acceleration (PGA), peak ground velocity (PGV), and peak ground displacement (PGD), are widely used in seismic engineering as they provide immediate insights into the amplitude of ground shaking. However, these parameters often fail to capture the complexity of seismic waves’ temporal and spatial characteristics, particularly for structures with varied dynamic properties. For instance, while PGA reflects the highest ground acceleration, it does not fully account for the energy or duration of shaking, both of which significantly influence structural damage.
Energy-based metrics, such as specific energy density (SED) and Arias intensity (Ia), bridge this gap by quantifying the total energy content of seismic waves. These metrics are particularly useful for assessing the cumulative damage potential of earthquakes, as they consider the integral effects of motion over time. SED, for instance, provides a measure of kinetic energy, offering a deeper understanding of seismic impacts beyond instantaneous peak values, while Ia correlates well with structural damage and is widely employed in landslide triggering assessments. The use of SED is less frequent compared to Arias intensity. To elucidate its significance in relation to peak ground acceleration (PGA), two earthquake records with similar PGA values were chosen and presented in Figure 1 [28].
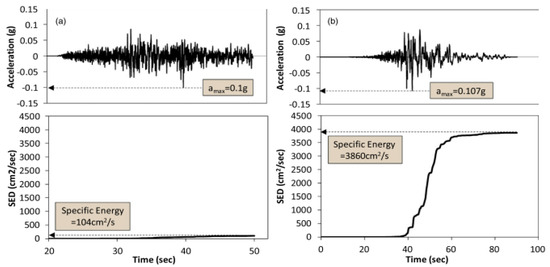
Figure 1.
Comparison of specific energy density for earthquakes (a) Denali, Alaska, 2002 and (b) Chi-Chi, Taiwan, 1999 [29].
Comparison between the earthquake records of Denali, Alaska in 2002, with a magnitude of M = 7.9 and PGA = 0.107 g, and Chi-Chi, Taiwan in 1999, with a magnitude of M = 7.62 and PGA = 0.1 g, illustrates the comparative relationship between acceleration over time and the corresponding calculated SED. It is evident that the earthquake records display distinct values for PGA (0.1 g), with the Denali, Alaska, 2002 earthquake record having a SED of 104 cm2/s and the Chi-Chi earthquake record, Taiwan, 1999 having a SED of 3860 cm2/s. Upon analyzing the relationships depicted in Figure 1, it is evident that PGA is inadequate in capturing the important attributes of the earthquake it originated from. On the other hand, SED accurately measures the kinetic energy generated throughout the duration of the earthquake.
Spectrum-based metrics, like acceleration spectrum intensity (ASI) and Housner Intensity (HI), offer additional sophistication by focusing on the frequency content of seismic records and their correlation with structural periods. ASI is crucial for short-period structures, emphasizing their sensitivity to high-frequency ground motions, while HI evaluates the integrated effects over a broader range of periods, making it highly effective for assessing nonlinear structural responses and damage correlations. The Housner Intensity is the most effective parameter for correlating the strength of seismic events with structural vulnerability. This conclusion has been supported by a series of nonlinear dynamic analyses conducted on various types of RC buildings [18,29,30]. In [29], the authors propose a relationship between the European Macroseismic Scale (EMS) and the Housner Intensity, indicating that for intensity levels up to V-VI on the EMS scale, there is little change in the Housner Intensity, as shown in Figure 2. At these lower intensity levels, significant structural damage does not occur, and the selection of intensity levels is primarily based on the effects of the earthquake on people and objects. For intensity levels greater than VI on the EMS scale, the distribution and extent of structural damage become critical for determining the value of the Housner Intensity.
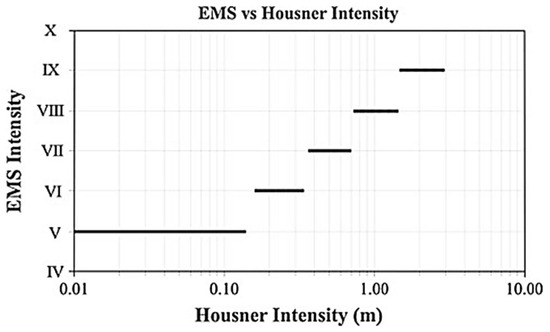
Figure 2.
Relationship between the European Macroseismic Scale (EMS) and the Housner Intensity [29].
Duration metrics, including Uniform Duration (UD) and Significant Duration (SD), provide insights into the prolonged effects of seismic activity. These metrics emphasize the importance of sustained shaking in contributing to cumulative damage, especially for structures with time-dependent vulnerabilities. By accounting for the duration of motion exceeding specific thresholds, they complement amplitude-based and energy-based parameters, delivering a more holistic view of seismic intensity.
Lastly, fundamental parameters like magnitude (M) and epicentral distance (R) remain indispensable in seismic hazard analysis. Magnitude provides a direct quantification of the earthquake’s total energy release, while epicentral distance informs the attenuation of seismic intensity as waves propagate. Together, these parameters are crucial for source characterization, intensity distribution modeling, and regional seismic risk assessments. Their integration with advanced metrics ensures a comprehensive understanding of seismic impacts across diverse structural and geological conditions.
3. Ground Motion Selection
The Republic of Croatia is located in the Mediterranean–Transasian seismic belt, characterized by high seismic activity. This has led to several major earthquakes throughout its history. It is estimated that 5.53% of Croatia’s total land area is exposed to the possibility of earthquakes with a peak ground acceleration (PGA) of 0.3 g or higher, encompassing approximately 21.02% of the country’s population. Furthermore, earthquakes with PGA values ranging between 0.2 g and 0.3 g could impact 30.89% of the territory, housing 41.66% of the population. For more than half of Croatia’s territory, earthquakes with PGA values between 0.1 g and 0.2 g are expected, affecting over a third (1,633,529) of the total population [31].
To illustrate seismic hazards for the most vulnerable cities, a predictive model was developed [31] to assess the vulnerability of buildings across 429 municipalities and 127 cities in Croatia. Building vulnerability levels were calculated from 0.5 to 1.0, with intervals of 0.1, correlating these values with peak ground acceleration (Figure 3). The study identified 32 Croatian cities ranging from the most to the least vulnerable to seismic events. Zagreb, the capital city, has an expected PGA value of 0.26 g. It is estimated that 90.2% of buildings in Zagreb would be affected by such seismic events. For Dubrovnik, where the expected PGA is 0.3 g, the situation is more critical, with approximately 95% of buildings projected to be affected.
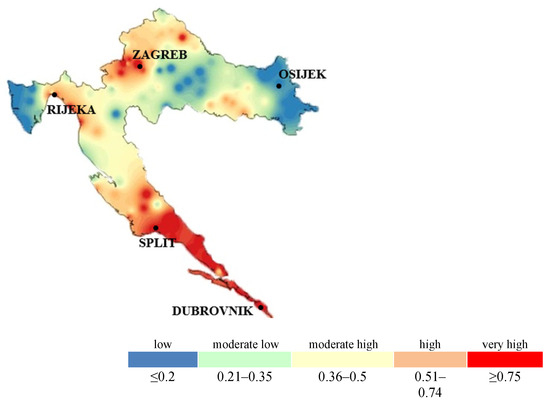
Figure 3.
Seismic hazard distribution in Croatia [31].
The selection of seismic records in this study was conducted using a uniform hazard spectrum (UHS) [32] and disaggregation for the observed cities: Zagreb and Dubrovnik (Figure 4 and Figure 5).
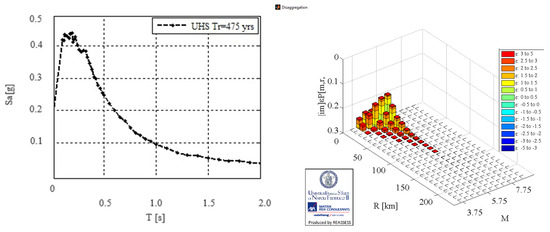
Figure 4.
UHS with return period of 475 years and magnitude range (M) and epicentral distance (R) for Zagreb [32].
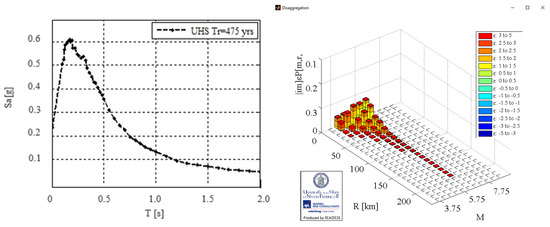
Figure 5.
UHS with return period of 475 years and magnitude range (M) and epicentral distance (R) for Dubrovnik [32].
The UHS represents acceleration spectra relative to oscillation periods for a given location, ensuring the equal probability of exceedance for a specified return period. The UHS is more reliable and precise than the generalized smoothed spectrum defined by EN 1998-1:2004 [33] as it accounts for all characteristics of a specific location. For the cities under analysis, disaggregation is defined based on the expected structural period of existing buildings and desired return period. Disaggregation separates the effects of various seismic activities affecting the area, producing graphical representations of magnitude (M) and epicentral distance (R) ranges. These values guide the selection of seismic records from [34].
Based on the defined ranges of magnitude (M) and epicentral distance (R) corresponding to the area of the cities of Zagreb and Dubrovnik, determined through disaggregation, 30 earthquake records were selected to simulate the potential seismic hazard of the area. The magnitude and epicentral distance values represent the boundaries, while for the selected earthquakes in the scenario for Zagreb, the magnitude and distance values are shown in Figure 6a. The figure indicates that most epicentral distances (Rs) are up to 25 km, while the majority of earthquake magnitudes fall between 4.5 and 6, with two outlier values. Figure 6b illustrates the mean ground acceleration for the 30 selected earthquake records, which is 2.60 m/s2, corresponding to the peak ground acceleration value of 0.26 g observed previously. This demonstrates the consistency between the initial and final selected parameters used to define the seismic scenario for Zagreb.
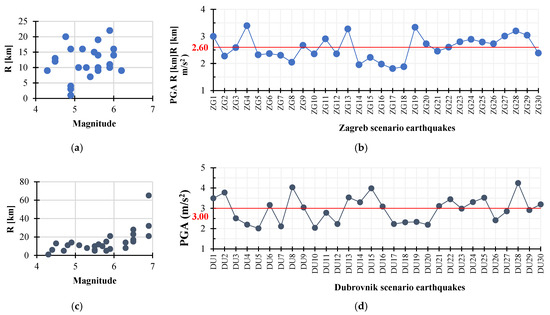
Figure 6.
(a) Relationship between magnitudes and epicentral distances for 30 selected earthquakes for Zagreb; (b) peak ground accelerations (PGA) for all earthquake records in scenario for Zagreb; (c) relationship between magnitudes and epicentral distances for 30 selected earthquakes for Dubrovnik; and (d) peak ground accelerations (PGA) for all earthquake records in scenario for Dubrovnik.
Figure 6c,d show that most of the R values are within 60 km, with one outlier, while the majority of earthquakes have magnitudes between 4.5 and 6, with an average ground acceleration value for the 30 selected earthquake records, which is 3.00, corresponding to the observed peak ground acceleration value of 0.30 g for Dubrovnik.
All selected earthquake records for both seismic scenarios, Zagreb and Dubrovnik, with all the earthquake characteristics needed for analysis are shown in Appendix A.1. In Table 2 and Table 3, along with the displayed peak ground acceleration values for further analysis, an additional 11 characteristics of earthquake records that impact the nonlinear response of the structure are highlighted, aiming to define those with the greatest influence. In the tables, an analysis of the range of the characteristics of selected earthquake records for both scenarios is performed, showing their minimum and maximum values to illustrate their deviations from the mean value and the coefficient of variation in order to give a wide range of inputs for detailed analysis.
Table 2.
Ranges of characteristic values for 30 selected earthquake records for the city of Zagreb.
Table 3.
Ranges of characteristic values for 30 selected earthquake records for the city of Dubrovnik.
4. Calibrated Experimental Model for the Evaluation of Ground Motion Parameters
Accordingly, since earthquake scenarios have been developed for the areas of Zagreb and Dubrovnik, where a large number of buildings were not constructed according to the standards requiring the mandatory application of seismic regulations for defining structural behavior during earthquakes, a structure representing the group of “existing buildings” was chosen. The ICONS experimental model shown in Figure 7 [35], is a four-story reinforced concrete frame representing a non-seismically designed structure dimensioned for vertical loads without the application of seismic regulations, which was the practice in construction about 40 years ago across Europe. The ICONS model was designed by the LNEC (National Laboratory for Civil Engineering) in Lisbon, Portugal, and then constructed at full scale and tested for medium-strength earthquakes at the ELSA (European Laboratory for Structural Assessment) in Ispra, Italy, with the aim of assessing the seismic vulnerability of the frame. The model was subjected to an earthquake with a peak ground acceleration of 0.22 g with a return period of 475 years. All in-depth data about the model are available in [35]. The numerical model for analysis is made in Seismostruct [36]. The elements of the RC frame were modeled as force-based (FB) elements with plastic hinges at the ends of the elements, whose lengths amounted to 12.5% of the column and 16.4% of the beam length of the element. Longitudinal reinforcement was specified for each of the elements according to the experimental description [36]. For the material characteristics of the concrete, Mander’s model [37] was applied, which took into account the confinement of the concrete with a confinement factor of 1.2; the Menegotto–Pinto model [38] was utilized for the nonlinear model of reinforcing steel with values according to [35].
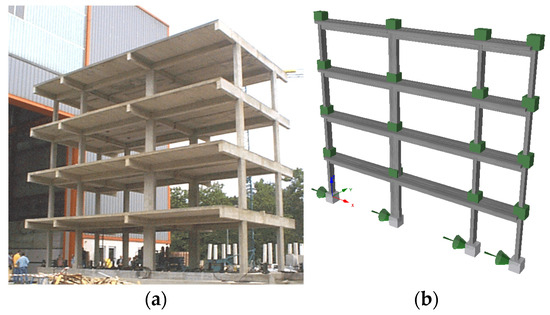
Figure 7.
(a) ICONS experimental model [38] and (b) numerical model of ICONS frame [39].
By comparing the fundamental dynamic characteristics of the experiment and the numerical model after the modal analysis, the first match between the models was confirmed (Table 4). The results obtained from the numerical analysis correlate excellently with the experimental results. By comparing the floor displacements, it can be concluded that the numerical model fully replicates the behavior of the model during the experiment (Figure 8), which reflects the stiffness and load-bearing capacity of the structure.
Table 4.
Comparison of natural periods for numerical model evaluation.
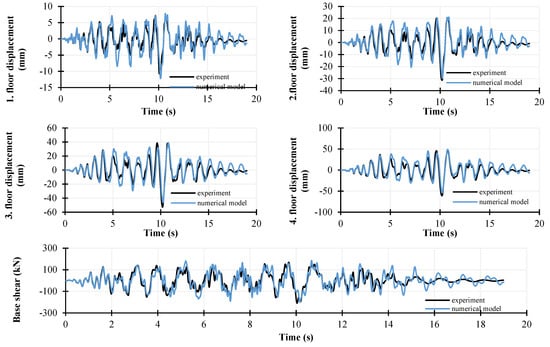
Figure 8.
Comparison of displacements at all floors and base shear between the experimental and numerical model.
The nonlinear model achieves excellent results with minimal deviations from the experimental test results. The maximum average relative error and deviation from full correlation are 12% for displacements (Table 5). Based on this, it can be concluded that the model can reliably predict the system’s behavior, and it can directly be applied to analyze the impact of earthquake record characteristics on the system’s response.
Table 5.
Comparison between experimental and numerical model with relative errors.
5. Analysis of the Impact of Ground Motion Parameters on Seismic Response
The previously calibrated numerical model, ICONS, was used to analyze the structure under time history earthquake records. The analysis involves applying the selected earthquake records to the model and calculating the structural response by defining maximum interstory drift ratios (IDR). According to [39], it is possible to define structural performance levels for different structural systems, which describe the state of the structure after an earthquake, as shown in Table 6. In Table 7 and Table 8, the maximum values of interstory displacements are marked, and based on Table 6, the behavior areas are defined to draw conclusions about the performance of such types of buildings in the observed seismic area.
Table 6.
Comparison of IDR (%) according to performance levels and structural type [39].
Table 7.
Values of IDR for Zagreb scenario.
Table 8.
Values of IDR for Dubrovnik scenario.
The model’s condition is most critical under the action of earthquakes ZG9 and ZG11, with the maximum interstory drifts occurring on the second and third floors of the structure. This indicates that the building experiences significant displacement on the higher floors under seismic loading, which may imply potential structural concerns. For the Dubrovnik scenario, the maximum interstory drift values are indicated in Table 8 based on Table 6, along with the corresponding behavioral zones in order to draw conclusions regarding the performance of this type of building in the observed seismic area.
The building model is in its most critical condition when subjected to the earthquake DU6, with the highest interstory displacements occurring on the second and third floors of the structure. However, exceptions are observed in earthquakes DU4, DU6, and DU30, where the interstory displacement values are also significantly high on the first floor of the building. This suggests that while higher floors generally experience the largest displacements, certain earthquake records exhibit a more uniform distribution of displacements across the different floors, indicating a more complex structural response under specific seismic conditions.
In analyzing the graphs comparing the curves of earthquake record characteristics and maximum interstory displacements, the objective is to find a curve trajectory that is as similar as possible. More specifically, the goal is for the trajectory of the earthquake record characteristic curve to closely follow the trajectory of the maximum interstory displacement curve. Additionally, the jumps and dips in both curves should occur at the same points, indicating a strong correlation between certain characteristics of the earthquake records and the resulting structural displacements.
Traditional metrics, including peak ground acceleration (PGA), peak ground velocity (PGV), and peak ground displacement (PGD) (Figure 9) were evaluated. Accordingly, the conclusions of the comparisons are as follows:
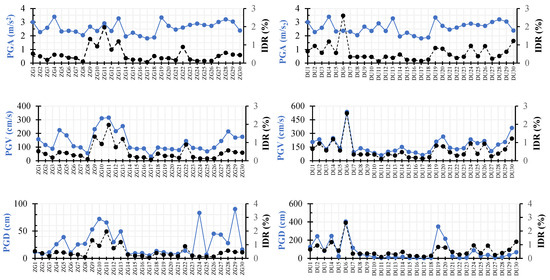
Figure 9.
Comparison of traditional ground motion metrics with IDRs for both scenarios.
- PGA vs. IDR: notable peaks in PGA (e.g., ZG11 and DU6) coincide with spikes in IDR, though some locations exhibit high PGA with moderate IDR values.
- PGV vs. IDR: A stronger relationship is visible, as locations with high PGV values show significant IDR spikes. PGV trends align well with IDR trends, confirming the medium-strong correlation.
- PGD vs. IDR: DU locations exhibit higher PGD values, especially at DU6, correlating with substantial IDR increases. ZG locations have more non-uniform PGD values with occasional peaks influencing the IDR.
As it is shown, PGA has a limited correlation with the IDR, as it does not account for the duration of shaking and longer-term structural deformations, where peak PGA values alone do not provide a complete picture of structural response, as the IDR is influenced by frequency content and structural properties (damping and stiffness). PGV is considered a better indicator of structural damage compared to PGA, as it reflects the energy transmitted to the structure and its ability to absorb deformations. High PGV values (>50 cm/s) are obviously frequently associated with significant interstory drifts, even when PGA values are not exceptionally high. The IDR has a stronger correlation with PGV than with PGA, as PGV accounts for the duration and frequency content of the earthquake ground motion. PGD values often correlated with higher IDR values, suggesting that displacement plays a crucial role in structural performance assessment; however, for the Zagreb scenario results showed low correlation.
Figure 10 presents the relationship between SED (specific energy density) and Ia (Arias intensity) with the IDRs for two different scenarios (ZG and DU locations):
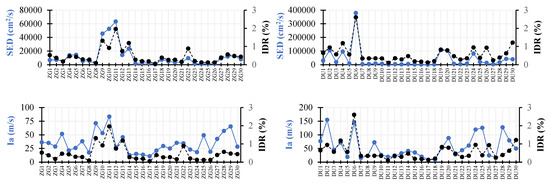
Figure 10.
Comparison of energy-based ground motion metrics with IDRs for both scenarios.
- SED vs. IDR: Significant peaks in SED values are observed (e.g., ZG11 and DU6), which coincide with increased IDR values. Higher SED values tend to result in a higher IDR, reinforcing the relationship between the energy absorbed by the structure and its deformation.
- Ia vs. IDR: Higher Ia values, particularly in ZG10 and DU6, align well with increased IDR values, the trend of Ia vs. IDR indicates that areas with more intense ground shaking correlate with greater structural deformations.
Higher SED values are typically associated with greater structural damage, with an indication that SED has a strong correlation (0.7–0.9) with the IDR, making it a critical parameter for damage assessment. Ia values have also shown a strong correlation with the IDR, and are particularly useful for predicting long-duration shaking effects.
Spectrum-based metrics (Figure 11): ASI (Arias spectral intensity) and HI (Housner Intensity) with IDRs showed the following relations:
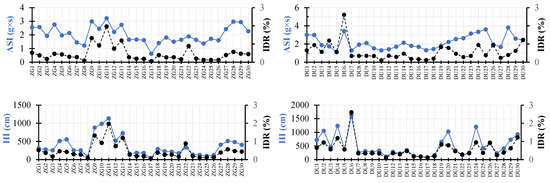
Figure 11.
Comparison of spectrum-based ground motion metrics with IDRs for both scenarios.
- ASI vs. IDR: ASI values generally increase with IDR, showing that higher spectral intensity levels are associated with greater structural deformations. In some cases, relatively low ASI values generated a moderate IDR, suggesting that correlation is moderate.
- HI vs. IDR: a high HI tends to exhibit substantial interstory drift, indicating its relevance in structural performance assessment.
ASI represents the cumulative energy transmitted to a structure based on spectral content, accounting for acceleration over time. Higher ASI values correlate strongly with the IDR, indicating that structures subjected to high spectral intensities are prone to larger drifts. HI measures spectral velocity over a broad frequency range and is useful for assessing the potential for structural damage. HI values show a strong correlation with the IDR, particularly for mid-rise and high-rise buildings with longer fundamental periods. Studies indicate that HI values above 1000 cm are typically associated with significant interstory drifts exceeding 2%, which can lead to structural compromise.
The analysis of duration-based ground motion metrics with IDRs (Figure 12) presents the relationship between UD (Uniform Duration) and SD (Significant Duration) with the following observations:
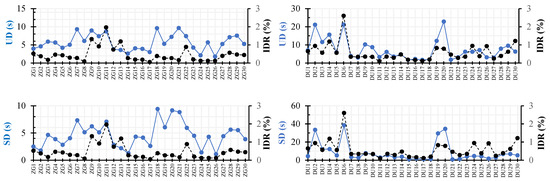
Figure 12.
Comparison of duration ground motion metrics with IDRs for both scenarios.
- UD vs. IDR: higher UD values tend to indicate longer shaking durations, which can lead to cumulative structural drift, correlating with an increased IDR.
- SD vs. IDR: SD, which measures the duration during which significant seismic energy is transmitted to the structure, exhibits noticeable peaks, especially in the DU scenario.
UD provides an indication of the overall time during which the shaking intensity remains above a predefined threshold. Higher UD values correlate with greater cumulative damage, as prolonged shaking leads to fatigue and progressive structural deformations. Research indicates that UD values exceeding 10 s are associated with significant structural demands. However, SD is considered a more refined measure of the duration of strong shaking that contributes most to structural response.
Figure 13 presents the relationship between M (magnitude) and R (distance,) with the IDR (interstory drift ratio) with the following conclusions:
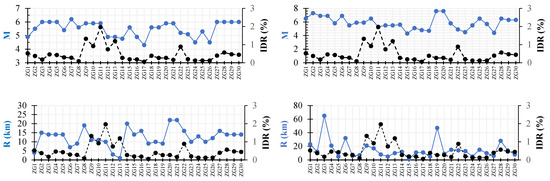
Figure 13.
Comparison of fundamental ground motion metrics with IDRs for both scenarios.
- M vs. IDR: M values show relatively stable trends across both scenarios, with most values ranging between four and six. There is no strong fluctuation in magnitude that directly aligns with high IDR values, indicating that magnitude alone may not be a primary predictor of structural response.
- R vs. IDR: R varies significantly across different locations, with larger distances generally corresponding to lower IDR values. Some fluctuations in distance do not directly correlate with IDR increases, implying the influence of other factors, like local soil conditions and structural characteristics.
Magnitude alone is not a sufficient predictor of the IDR, as it represents the total energy released but does not account for local site conditions or shaking duration. Distance to the epicenter does not significantly affect the IDR.
6. Selection of the Critical Ground Motion Parameters on Seismic Response
Based on the results of the comparison from the previous section, it can be concluded that there is a significant correlation between certain characteristics of earthquake records and the maximum interstory drift as a measure of damage. However, to make the comparison measurable, given the different units of measurement, all earthquake record characteristics, as well as interstory drift values, were normalized to a value range of 0–1. Correlation analysis was then conducted to determine the strength of influence and the degree of alignment in response to changes in the respective parameters. The correlation results for both observed seismic regions are presented in Table 9, which demonstrates that the PGV, SED, and HI characteristics have the greatest impact on the nonlinear response of the structure. This conclusion is supported by the fact that the correlations of the normalized values of these three characteristics reach approximately 90%, distinguishing them from other earthquake record characteristics.
Table 9.
Correlation of normalized values for two earthquake scenarios.
Based on the literature review, as it is stated in [4,9], PGV was an efficient parameter for both low-rise and high-rise buildings designed according to seismic regulations. Also, results from [8,12] confirmed that HI and SED exhibit the strongest correlation, which confirms their influence obtained in this analysis on non-seismic designed buildings behavior.
Finally, Table 10 compares various ground motion parameters and their correlation with the interstory drift ratio (IDR), which is a key measure of structural damage. It highlights that peak ground velocity (PGV) exhibits a high correlation (0.7–0.9) with the IDR, making it a crucial indicator for traditional metrics of structural performance during seismic events. In contrast, peak ground acceleration (PGA), commonly used in seismic design codes, shows only a low correlation (<0.3), suggesting it may not fully capture the structural response. Energy-based metrics such as specific energy density (SED) and Arias intensity (Ia) have high-to-significant correlations with the IDR, indicating their effectiveness in predicting structural damage due to accumulated seismic energy. Housner Intensity (HI), another important spectral velocity measure, is highly correlated with the IDR, making it particularly useful for evaluating mid-rise and high-rise buildings. Duration-based metrics like Uniform Duration (UD) and Significant Duration (SD) also influence structural response, with SD showing a moderate relationship with the IDR compared to UD. The table also reveals that fundamental seismic parameters, such as magnitude (M), have a relatively low correlation with IDR, indicating that energy-based and duration-based metrics are more reliable for assessing damage. The observed trends suggest that using a combination of these metrics provides a more comprehensive understanding of seismic impacts on structures. Overall, the table emphasizes the need to prioritize velocity and energy-based metrics over traditional measures like PGA when assessing seismic vulnerability and selecting suitable earthquake records for nonlinear dynamic time history analyses.
Table 10.
Comparison between fundamental metrics and other ground motion parameters.
7. Conclusions
The objective of this analysis was to investigate the impact of specific seismic record characteristics on the nonlinear response of buildings and to define the characteristics with the most significant influence on structural damage in order to be able to select proper earthquake records for reliable time history analysis. The analysis was carried out using a previously calibrated nonlinear model based on the experimental ICONS model, representing “existing buildings” designed without earthquake regulations approximately 40 years ago. The analysis involved the process of selecting seismic records based on magnitude (M) and epicentral distance (R), which are the results of disaggregation, as well as peak ground acceleration (PGA). For each of the observed areas, 30 seismic records were chosen.
The comparison of the maximum interstory drifts, a critical damage demand parameter of building structures under earthquake loads, and individual seismic characteristics determined that there is a substantial correlation with specific seismic record characteristics. Peak ground velocity (PGV), specific energy density (SED), and Housner Intensity (HI) were the seismic characteristics that proved to be the most influential on the damage to the structures and, therefore, these characteristics are the most reliable for assessing structural damage. The correlation between the IDR and various groups of ground motion metrics are as follows:
- Traditional metrics, PGV and PGD, show a high-to-significant correlation with the IDR, making them crucial for structural damage assessment.
- Energy-based and spectrum-based metrics (SED, Ia, ASI, and HI) provide strong predictive capabilities for the IDR, highlighting the importance of energy effects.
- Duration-based and fundamental metrics (UD, SD, M, and R) contribute moderately, especially in assessing long-duration shaking impacts.
Combining multiple ground motion parameters could provide the most reliable assessment of potential structural damage. Therefore, the traditional metric of PGV should be used as the main one, instead of PGA, and then energy- and spectrum-based metrics can be used as additional ones for comprehensive seismic performance evaluation and finally selecting suitable earthquake records for time history analyses.
Author Contributions
Conceptualization, T.K.Š. and A.B.; methodology, T.K.Š.; software, T.K.Š., U.B. and U.R.; validation, T.K.Š. and A.B.; formal analysis, T.K.Š. and A.B.; investigation, U.B. and U.R.; resources, U.B. and U.R.; data curation, T.K.Š. and A.B.; writing—original draft preparation, T.K.Š. and A.B.; writing—review and editing, T.K.Š., A.B., U.B. and U.R.; visualization, T.K.Š., A.B., U.B. and U.R.; supervision, T.K.Š. All authors have read and agreed to the published version of the manuscript.
Funding
This research received no external funding.
Institutional Review Board Statement
Not applicable.
Informed Consent Statement
Not applicable.
Data Availability Statement
The original contributions presented in this study are included in the article. Further inquiries can be directed to the corresponding author.
Conflicts of Interest
The authors declare no conflicts of interest.
Appendix A
Appendix A.1. Detailed Ground Motion Data for Earthquake Scenarios in Zagreb and Dubrovnik
This appendix provides comprehensive details of the selected ground motion records utilized in the earthquake scenarios for Zagreb and Dubrovnik. Each scenario is detailed with all necessary earthquake characteristics essential for the analysis. Both tables list the 30 selected seismic records for two selected scenarios. It includes peak ground acceleration values and ten additional seismic record characteristics that influence the nonlinear response of the structure. These characteristics are identified to determine which have the most significant impact on structural response.
Table A1.
Seismic records for Zagreb scenario.
Table A1.
Seismic records for Zagreb scenario.
| Earthquake | PGA | PGV | PGD | SED | ASI | HI | Ia | UD | SD | M | R |
|---|---|---|---|---|---|---|---|---|---|---|---|
| (m/s2) | (cm/s) | (cm) | (cm2/s) | (g·s) | (cm) | (m/s) | (s) | (s) | [km] | ||
| ZG1. Forgaria-Cornio (M = 4.9) | 3 | 157.03 | 11.78 | 6693.17 | 2.56 | 311.14 | 36.29 | 3.96 | 2.5 | 4.9 | 4 |
| ZG2. Forgaria-Cornio (M = 5.5) | 2.27 | 115.59 | 8.02 | 7110.4 | 2.57 | 276.38 | 35.21 | 4.6 | 1.77 | 5.5 | 15 |
| ZG3. Forgaria-Cornio (M = 6.0) | 2.59 | 87.95 | 11.03 | 4903.53 | 1.93 | 254.12 | 28.57 | 5.89 | 4.64 | 6 | 14 |
| ZG4. Forgaria-Cornio (M = 6.0) | 3.4 | 223.81 | 25.89 | 13,950.35 | 2.76 | 511.34 | 51.8 | 5.66 | 3.87 | 6 | 14 |
| ZG5. San Rocco (M = 6.0) | 2.32 | 185.66 | 38.76 | 14,488.11 | 1.97 | 556.09 | 21.43 | 4.2 | 2.83 | 6 | 14 |
| ZG6. Forgaria-Cornio (M = 5.4) | 2.37 | 106.1 | 10.65 | 5297.4 | 2.14 | 252.21 | 25.98 | 5.03 | 4.04 | 5.4 | 7 |
| ZG7. Argostoli—OTE Building (M = 6.2) | 2.3 | 97.4 | 25.55 | 5659.9 | 1.45 | 255.56 | 38.17 | 9.32 | 7.33 | 6.2 | 9 |
| ZG8. Nocera Umbra (M = 5.6) | 2.05 | 54.63 | 26.66 | 1031.15 | 1.22 | 81.05 | 17.67 | 6.08 | 5.13 | 5.6 | 19 |
| ZG9. Kalamata-OTE Building (M = 5.9) | 2.67 | 230.83 | 52.84 | 45,493.44 | 2.99 | 879.2 | 71.31 | 8.97 | 6.23 | 5.9 | 11 |
| ZG10. Kalamata-OTE Building (M = 5.9) | 2.35 | 310.78 | 72.16 | 52,542.36 | 2.45 | 987.09 | 53.17 | 7.4 | 5.12 | 5.9 | 11 |
| ZG11. Kalamata-Prefecture (M = 5.9) | 2.91 | 315.94 | 65.69 | 63,314.56 | 3.22 | 1132.4 | 83.48 | 8.72 | 7.08 | 5.9 | 10 |
| ZG12. Kalamata-OTE Building (M = 4.9) | 2.36 | 216.21 | 29.89 | 14,254.26 | 2.22 | 519.64 | 27.11 | 3.8 | 2.81 | 4.9 | 3 |
| ZG13. Kalamata-Prefecture (M = 4.9) | 3.28 | 253.72 | 49.21 | 23,416.97 | 2.74 | 725.25 | 45.58 | 3.6 | 2.2 | 4.9 | 1 |
| ZG14. Aigio-OTE Building (M = 4.77) | 1.95 | 95.79 | 7.82 | 1674.13 | 1.65 | 163.06 | 12.78 | 2.6 | 1.28 | 4.77 | 20 |
| ZG15. Argostoli-OTE Building (M = 5.6) | 2.22 | 87.44 | 9.39 | 2572.16 | 1.66 | 186.07 | 15.03 | 4.05 | 4.32 | 5.6 | 14 |
| ZG16. Argostoli-OTE Building (M = 4.9) | 1.98 | 89.27 | 9.57 | 2514.59 | 1.61 | 180.72 | 13.55 | 3.91 | 4.14 | 4.9 | 16 |
| ZG17. Nocera Umbra (M = 4.3) | 1.81 | 30.7 | 5.28 | 285.59 | 0.62 | 41.59 | 10.72 | 3.01 | 2.61 | 4.3 | 9 |
| ZG18. Patra-National Bank (M = 5.6) | 1.88 | 96.47 | 13.47 | 7360.28 | 1.4 | 291.4 | 21.11 | 9.61 | 9.41 | 5.6 | 10 |
| ZG19. Patra-San Dimitrios Church (5.6) | 3.34 | 87.44 | 11.16 | 4890.37 | 1.81 | 229.09 | 29.62 | 5.3 | 6.05 | 5.6 | 9 |
| ZG20. Firoozabad (M = 5.9) | 2.73 | 84.29 | 8.28 | 3478.13 | 1.5 | 215.06 | 24.98 | 7.21 | 9.16 | 5.9 | 22 |
| ZG21. Firoozabad (M = 5.9) | 2.45 | 78.14 | 8.27 | 3651.67 | 1.64 | 175.71 | 35.39 | 9.65 | 8.84 | 5.9 | 22 |
| ZG22. Karpero-Town Hall (M = 5.0) | 2.6 | 143.99 | 13.91 | 9549.97 | 1.89 | 335.62 | 34.46 | 7.41 | 5.94 | 5.2 | 16 |
| ZG23. Nocera Umbra (M = 5.1) | 2.8 | 93.47 | 5.35 | 1437.53 | 1.64 | 135.94 | 23.1 | 4.26 | 4.48 | 5.1 | 10 |
| ZG24. Nocera Umbra (M = 4.5) | 2.89 | 89.81 | 83.15 | 1279.45 | 1.37 | 127.23 | 18.31 | 2.11 | 1.42 | 4.5 | 13 |
| ZG25. Nocera Umbra (M = 5.3) | 2.79 | 68.29 | 6.82 | 1736.89 | 1.72 | 103.02 | 49.27 | 5.69 | 4.29 | 5.3 | 10 |
| ZG26. Nocera Umbra 2 (M = 4.5) | 2.73 | 95.3 | 45.1 | 1143.27 | 1.6 | 122.27 | 19.03 | 1.78 | 1.1 | 4.5 | 12 |
| ZG27. Athens 3 (Kallithea District) (M = 6.0) | 3.01 | 143.94 | 43.46 | 9064.07 | 2.43 | 410.12 | 42.42 | 5.23 | 4.41 | 6 | 16 |
| ZG28. Athens-Sepolia (Garage) (M = 6.0) | 3.2 | 214.3 | 27.92 | 11,941.2 | 2.97 | 512.02 | 57.13 | 7.12 | 5.61 | 6 | 14 |
| ZG29. Athens-Sepolia (Garage) (M = 6.0) | 3.04 | 169.16 | 90.16 | 13,142.89 | 2.94 | 481.86 | 65.42 | 7.56 | 5.52 | 6 | 14 |
| ZG30. Athens-Sepolia (Metro Station) (M = 6.0) | 2.38 | 175.47 | 16.08 | 7858.39 | 2.27 | 405.32 | 28.3 | 5.25 | 3.86 | 6 | 14 |
Table A2.
Seismic records for Dubrovnik scenario.
Table A2.
Seismic records for Dubrovnik scenario.
| Earthquake | PGA | PGV | PGD | SED | ASI | HI | Ia | UD | SD | M | R |
|---|---|---|---|---|---|---|---|---|---|---|---|
| (m/s2) | (cm/s) | (cm) | (cm2/s) | (g·s) | (cm) | (m/s) | (s) | (s) | [km] | ||
| DU1. Tolmezzo-Diga Ambiesta (M = 6.5) | 3.5 | 205.6 | 124.4 | 29,493.85 | 3.01 | 720.29 | 76.85 | 7.02 | 4.36 | 6.5 | 23 |
| DU2. Dayhook (M = 7.3) | 3.78 | 234.73 | 242.9 | 104,990.4 | 2.99 | 1054.7 | 155.01 | 21.12 | 33.44 | 7.3 | 12 |
| DU3. Hercegnovi Novi (M = 6.9) | 2.51 | 126.32 | 83.03 | 18,500.39 | 1.88 | 464.31 | 45.07 | 11.56 | 12.13 | 6.9 | 65 |
| DU4. Ulcinj-Hotel Albatros (M = 6.9) | 2.2 | 248 | 245.4 | 96,264.51 | 1.74 | 1236.9 | 71.6 | 15.64 | 12.25 | 6.9 | 21 |
| DU5. Cascia (M = 5.8) | 2.01 | 136.66 | 22.18 | 7484.74 | 1.11 | 376.23 | 18.85 | 5.96 | 5.2 | 5.8 | 5 |
| DU6. Sturno (M = 6.9) | 3.17 | 535.92 | 404.6 | 378,857.5 | 3.41 | 1624.5 | 144.93 | 21.19 | 38.53 | 6.9 | 32 |
| DU7. Villetta-Barrea (M = 5.5) | 2.11 | 92.92 | 115.1 | 3157.02 | 1.29 | 267.39 | 15.56 | 3.86 | 3.4 | 5.5 | 6 |
| DU8. Seismological Observatory (M = 5.9) | 4.04 | 137.08 | 42 | 4812.32 | 1.94 | 310.08 | 22.84 | 2.97 | 2.73 | 5.9 | 7 |
| DU9. Zarrat (M = 5.9) | 3.04 | 111.62 | 33.75 | 8801.32 | 2.1 | 281.3 | 72.49 | 10.24 | 7.68 | 5.9 | 21 |
| DU10. Kozani-Prefecture (M = 6.5) | 2.04 | 84.21 | 14.35 | 6347.34 | 1.52 | 327.72 | 26.43 | 8.75 | 6.46 | 6.5 | 17 |
| DU11. Nocera Umbra-Biscontini (M = 5.3) | 2.78 | 60.52 | 5.83 | 1046.77 | 1.3 | 110.47 | 19.57 | 3.3 | 3 | 5.3 | 8 |
| DU12. Colfiorito-Casermette (M = 5.5) | 2.23 | 98.76 | 11.61 | 3706.22 | 1.42 | 285.91 | 20.8 | 6.1 | 5.53 | 5.5 | 5 |
| DU13. Nocera Umbra-Biscontini (M = 5.5 | 3.54 | 110.39 | 12.21 | 2607.36 | 1.7 | 227.5 | 32.29 | 3.54 | 3.17 | 5.5 | 10 |
| DU14. Borgo-Cerreto Torre (M = 5.6) | 3.3 | 151.45 | 16.68 | 5234.14 | 2.14 | 343.95 | 40.7 | 4.78 | 3.79 | 5.6 | 12 |
| DU15. Colfiorito-Casermette (M = 4.3) | 3.99 | 96.4 | 4.27 | 1451 | 1.79 | 128.93 | 35.18 | 1.73 | 1.04 | 4.3 | 1 |
| DU16. Nocera Umbra-Biscontini (M = 5.1) | 3.09 | 89.01 | 6.93 | 1189.85 | 1.69 | 112.63 | 20.02 | 2.22 | 1.87 | 5.1 | 11 |
| DU17. Nocera Umbra-Biscontini (M = 4.8) | 2.23 | 62.43 | 2.32 | 568.08 | 1.31 | 75.39 | 8.74 | 1.72 | 1.15 | 4.8 | 11 |
| DU18. Hveragerdi-Church (M = 4.7) | 2.31 | 93.51 | 7.64 | 1411.77 | 1.45 | 170.21 | 9.38 | 1.94 | 1.23 | 4.7 | 5 |
| DU19. Gebze (M = 7.6) | 2.33 | 209.4 | 349.7 | 106,879.6 | 1.8 | 650.86 | 51.69 | 12.21 | 29.52 | 7.6 | 47 |
| DU20. Izmit-Meteoroloji Istasyonu (M = 7.6) | 2.19 | 265.44 | 214.7 | 102,787.3 | 2.22 | 1025.7 | 88.26 | 22.86 | 34.56 | 7.6 | 9 |
| DU21. Izmit-Meteoroloji Istasyonu (M = 5.8) | 3.11 | 141.39 | 23.32 | 6137.43 | 2.54 | 333.93 | 27.97 | 1.77 | 0.89 | 5.8 | 15 |
| DU22. LDEO Station No.C0375VO (M = 4.9) | 3.45 | 126.21 | 5.46 | 3919.64 | 2.64 | 159.13 | 43.52 | 3.15 | 1.4 | 4.9 | 14 |
| DU23. LDEO Station No.C0375VO (M = 4.5) | 2.98 | 137.5 | 7.8 | 8122.64 | 3.14 | 251.63 | 60.66 | 6.21 | 4.01 | 4.5 | 13 |
| DU24. Flagbjarnarholt (M = 5.5) | 3.31 | 234.21 | 89.27 | 81,497.95 | 3.34 | 1202.6 | 119.41 | 6.24 | 4.55 | 5.5 | 5 |
| DU25. Thjorsarbru (M = 6.5) | 3.53 | 192.64 | 27.57 | 19,353.27 | 3.6 | 422.5 | 125.8 | 7.14 | 4.31 | 6.5 | 15 |
| DU26. Thjorsarbru (M = 5.7) | 2.41 | 216.15 | 37.52 | 13,343.99 | 1.95 | 601.87 | 24.56 | 3.14 | 1.69 | 5.7 | 10 |
| DU27. Thjorsarbru (M = 4.4) | 2.85 | 105.96 | 9.54 | 2871.96 | 1.68 | 232.86 | 17.07 | 3 | 2.85 | 4.4 | 6 |
| DU28. Avaj (Bakhshdari) (M = 6.5) | 4.25 | 178.17 | 16.3 | 17,175.48 | 3.81 | 406.63 | 127.65 | 7.92 | 6.8 | 6.5 | 28 |
| DU29. Bingol-Bayindirlik Murlugu (M = 6.3) | 2.92 | 205.71 | 36.66 | 42,584.47 | 2.59 | 731.15 | 79.45 | 9.54 | 6.8 | 6.3 | 14 |
| DU30. Selfoss-City Hall (M = 6.3) | 3.2 | 360.13 | 67.25 | 39,604.61 | 2.46 | 923.9 | 49.57 | 6.31 | 5.3 | 6.3 | 8 |
References
- Alavi, B.; Krawinkler, H. Effects of Near-Fault Ground Motions on Frame Structures; Report No. 138; Blume Earthquake Engineering Center: Stanford, CA, USA, 2001. [Google Scholar]
- FEMA. Seismic Performance Assessment of Buildings, FEMA P-58–1; Applied Technology Council for the Federal Emergency Management Agency: Washington, DC, USA, 2012. [Google Scholar]
- Kostinakis, K.; Fontara, I.K.; Athanatopoulou, A.M. Scalar Structure-Specific Ground Motion Intensity Measures for Assessing the Seismic Performance of Structures: A Review. J. Earthq. Eng. 2017, 22, 630–665. [Google Scholar] [CrossRef]
- Lu, X.; Lu, X.; Ye, L.; Li, M. Development of an improved ground motion intensity measure for super high-rise buildings. J. Build. Struct. 2014, 35, 15–21. [Google Scholar]
- Bianchini, M.; Diotallevi, P.P.; Baker, J.W. Prediction of inelastic structural response using an average of spectral accelerations. In Proceedings of the 10th International Conference on Structural Safety and Reliability, Osaka, Japan, 13–17 September 2009; pp. 13–17. [Google Scholar]
- Adam, C.; Kampenhuber, D.; Ibarra, L.F.; Tsantaki, S. Optimal Spectral Acceleration-based Intensity Measure for Seismic Collapse Assessment of P-Delta Vulnerable Frame Structures. J. Earthq. Eng. 2016, 21, 1189–1195. [Google Scholar] [CrossRef]
- Shome, N.; Cornell, C.A.; Bazzurro, P.; Carballo, J.E. Earthquakes, Records, and Nonlinear Responses. Earthq. Spectra 1998, 14, 469–500. [Google Scholar] [CrossRef]
- Yakut, A.; Yilmaz, H. Correlation of deformation demands with ground motion intensity. J. Struct. Eng. 2008, 134, 1818–1828. [Google Scholar] [CrossRef]
- Jeon, J.S.; DesRoches, R.; Lowes, L.N.; Brilakis, I. Framework of aftershock fragility assessment–case studies: Older California reinforced concrete building frames. Earthq. Eng. Struct. Dyn. 2015, 44, 2617–2636. [Google Scholar] [CrossRef]
- D’Ayala, D.; Meslem, A.; Vamvatsikos, D.; Vamvatsikos, D.; Porter, K.; Rossetto, T.; Crowley, H.; Silva, V. Guidelines for Analytical Vulnerability Assessment of Low- to Mid-Rise Buildings; Vulnerability Global Component Project; Global Earthquake Model: Pavia, Italy, 2015. [Google Scholar]
- Wang, X.; Shafieezadeh, A.; Ye, A. Optimal intensity measures for probabilistic seismic demand modeling of extended pile-shaft-supported bridges in liquefied and laterally spreading ground. Bull. Earthq. Eng. 2018, 16, 229–257. [Google Scholar] [CrossRef]
- Van Cao, V.; Ronagh, H. Correlation between seismic parameters of far-fault motions and damage indices of low-rise reinforced concrete frames. Soil Dyn. Earthq. Eng. 2014, 66, 102–112. [Google Scholar] [CrossRef]
- Papasotiriou, A.; Athanatopoulou, A. Seismic intensity measures optimized for low-rise reinforced concrete frame structures. J. Earthq. Eng. 2022, 26, 7587–7625. [Google Scholar] [CrossRef]
- Elenas, A. Correlation between seismic acceleration parameters and overall structural damage indices of buildings. Soil Dyn. Earthq. Eng. 2000, 20, 93–100. [Google Scholar] [CrossRef]
- Baker, J.; Cornell, C.A. Vector-Valued Ground Motion Intensity Measures for Probabilistic Seismic Demand Analysis; PEER Report 2006-08; Pacific Earthquake Engineering Research Center, University of California: Berkeley, CA, USA, 2006. [Google Scholar]
- Iervolino, I.; Galasso, C.; Cosenza, E. REXEL: Computer aided record selection for code-based seismic structural analysis. Bull. Earthq. Eng. 2010, 8, 339–362. [Google Scholar] [CrossRef]
- Kramer, S.L. Geotechnical Earthquake Engineering; Prentice-Hall: Upper Saddle River, NJ, USA, 1996. [Google Scholar]
- Grubišić, M. Models for Strengthening Assessment of Reinforced Concrete Frames by Adding the Infills for Earthquake Action. Ph.D. Thesis, Faculty of Civil Engineering Osijek, University of Osijek, Osijek, Croatia, 2016. [Google Scholar]
- Elenas, A. Interdependency between seismic acceleration parameters and the behaviour of structures. Soil Dyn. Earthq. Eng. 1997, 16, 317–322. [Google Scholar] [CrossRef]
- Akkar, S.; Özen, Ö. Effect of peak ground velocity on deformation demands for SDOF systems. Earthq. Eng. Struct. Dyn. 2005, 34, 1551–1571. [Google Scholar] [CrossRef]
- Elenas, A.; Meskouris, K. Correlation study between seismic acceleration parameters and damage indices of structures. Eng. Struct. 2001, 23, 698–704. [Google Scholar] [CrossRef]
- Sarma, S.K.; Yang, K.S. An evaluation of strong motion records and a new parameter A95. Earthq. Eng. Struct. Dyn. 1987, 15, 119–132. [Google Scholar] [CrossRef]
- Arias, A. Measure of Earthquake Intensity; Massachusetts Institute of Technology, Cambridge University of Chile: Santiago, Chile, 1970; pp. 438–483. [Google Scholar]
- Von Thun, J.L.; Roehm, L.H.; Scott, G.A.; Wilson, J.A. Earthquake ground motions for design and analysis of dams. In Earthquake Engineering and Soil Dynamics II-Recent Advances in Ground-Motion Evaluation; Geotechnical Special Publications; Amer Society of Civil Engineers: Reston, VA, USA, 1988; Volume 20, pp. 463–481. [Google Scholar]
- Housner, G.W. Spectrum intensities of strong-motion earthquakes. In Proceedings of the Symposium on Earthquake and Blast Effects on Structures, Los Angeles, CA, USA, June 1952; pp. 20–36. [Google Scholar]
- Bommer, J.J.; Martínez-Pereira, A. The effective duration of earthquake strong motion. J. Earthq. Eng. 1999, 3, 127–172. [Google Scholar] [CrossRef]
- Richter, C.F. An Instrumental Earthquake Magnitude Scale. Bull. Seismol. Soc. Am. 1935, 25, 1–32. [Google Scholar] [CrossRef]
- Jafarian, Y.; Vakili, R.; Abdollahi, A.S.; Baziar, M.H. Simplified soil liquefaction assessment based on cumulative kinetic energy density: Attenuation law and probabilistic analysis. Int. J. Geomech. 2014, 14, 267–281. [Google Scholar] [CrossRef]
- Chiauzzi, L.; Masi, A.; Mucciarelli, M.; Vona, M.; Pacor, F.; Cultrera, G.; Gallovič, F.; Emolo, A. Building damage scenarios based on exploitation of Housner intensity derived from finite faults ground motion simulations. Bull. Earthq. Eng. 2012, 10, 517–545. [Google Scholar] [CrossRef]
- Masi, A.; Chiauzzi, L.; Braga, F.; Mucciarelli, M.; Vona, M.; Ditommaso, R. Peak and integral seismic parameters of L’Aquila 2009 ground motions: Observed versus code provision values. Bull. Earthq. Eng. 2011, 9, 139–156. [Google Scholar] [CrossRef]
- Kalman Šipoš, T.; Hadzima-Nyarko, M. Seismic risk of Croatian cities based on building’s vulnerability. Teh. Vjesn. 2018, 25, 1088–1094. [Google Scholar]
- Chioccarelli, E.; Cito, P.; Iervolino, I.; Giorgio, M. REASSESS V2.0: Software for single- and multi-site probabilistic seismic hazard analysis. Bull. Earthq. Eng. 2019, 17, 1769–1793. [Google Scholar] [CrossRef]
- EN 1998-1:2004; Eurocode 8: Design of Structures for Earthquake Resistance—Part 1: General Rules, Seismic Actions and Rules for Buildings. EU: Brussels, Belgium, 2004.
- Luzi, L.; Lanzano, G.; Felicetta, C.; D’Amico, M.C.; Russo, E.; Sgobba, S.; Pacor, F.; ORFEUS Working Group 5. Engineering Strong Motion Database (ESM) (Version 2.0); Istituto Nazionale di Geofisica e Vulcanologia (INGV): Bologna, Italy, 2020. [Google Scholar] [CrossRef]
- Pinto, A.; Verzeletti, G.; Molina, J.; Varum, H.; Pinho, R.; Coelho, E. Pseudo-Dynamic Tests on Non-Seismic Resisting RC Frames (Bare and Selective Retrofit). EUR 20244 EN. 2002, JRC23144.
- SeismoStruct—A Computer Program for Static and Dynamic Nonlinear Analysis of Framed Structures. Available online: www.seismosoft.com (accessed on 20 September 2024).
- Mander, J.B.; Priestley, M.J.N.; Park, R. Theoretical stress-strain model for confined concrete. J. Struct. Eng. 1988, 114, 1804–1826. [Google Scholar] [CrossRef]
- Menegotto, M.; Pinto, P.E. Method of analysis of cyclically loaded RC plane frames including changes in geometry and non-elastic behavior of elements under normal force and bending. In Proceedings of the IABSE Symposium on Resistance and Ultimate Deformability of Structures Acted on by Well Defined Repeated Loads, Lisbon, Portugal, 1973. [Google Scholar]
- Ghobarah, A. On Drift Limits Associated with Different Damage Levels. In Proceedings of the International Workshop on Performance-Based Seismic Design, Bled, Slovenia, 28 June–1 July 2004; Department of Civil Engineering, McMaster University: Hamilton, ON, Canada, 2004. [Google Scholar]
Disclaimer/Publisher’s Note: The statements, opinions and data contained in all publications are solely those of the individual author(s) and contributor(s) and not of MDPI and/or the editor(s). MDPI and/or the editor(s) disclaim responsibility for any injury to people or property resulting from any ideas, methods, instructions or products referred to in the content. |
© 2025 by the authors. Licensee MDPI, Basel, Switzerland. This article is an open access article distributed under the terms and conditions of the Creative Commons Attribution (CC BY) license (https://creativecommons.org/licenses/by/4.0/).