Abstract
Existing seismic evaluations of electrical equipment in substations mainly focus on post-type equipment, with few studies addressing the suspended equipment that exhibits significant geometric nonlinearity. Most of the vulnerability analyses on substation equipment consider only ground motion uncertainty, not processing other uncertainties including material properties. Thus, this paper investigates the seismic responses of an ±800 kV suspended filter capacitor using a simulation model. A new approach for vulnerability assessment based on an adaptive boosting (AdaBoost) regressor is proposed considering the uncertainties of multiple material parameters of the suspension insulators. It is applied to the filter capacitor and validated by conventional incremental dynamic analysis (IDA). In addition, the influence of the pre-tension force of the bottommost suspension insulators is also discussed. The results indicate that increasing the pre-tension force can avoid pressure generation in the insulators and reduce the maximum displacements of the filter capacitor. The failure probability will significantly increase when the pre-tension force increases from 20 kN, although the growth rate continues to fall. The established AdaBoost regressors substantially lower the calculational cost while maintaining an accurate vulnerability prediction, compared to IDA. The proposed method is endorsed due to its high accuracy and low calculation cost, although its feasibility is validated by only one suspended filter capacitor in this paper.
1. Introduction
Power transmission is one of the significant activities in human communities, delivering electrical energy from power generators to the user. Substations are the key nodes in the power network. However, previous post-earthquake investigations have shown that the electrical equipment in substations is vulnerable to seismic occurrences [1,2,3].
In view of this, scholars have undertaken seismic studies on various kinds of electrical equipment from different aspects to mitigate earthquake-induced damage. As shown in Figure 1, seismic studies on power systems develop continually from performance evaluation to system resilience. At the earliest, some researchers analyzed and evaluated the seismic performance of much equipment, such as power transformers [4,5], bushings [6,7], surge arresters [8], and other post equipment [9,10,11,12,13]. Based on the seismic response analysis, some effective seismic mitigation measures were proposed for electrical equipment to improve their seismic performance, e.g., a double friction pendulum [14], wire ropes [15,16], multiple tuned mass dampers [17], friction dampers, and prestressed tendons [18]. Nonetheless, the majority of the prior seismic investigations have been on transformer and post-type apparatus. Indeed, suspension equipment requires both design and protection. While Yang et al. assessed the seismic performance of a suspended 800 kV converter valve and proposed a restraint method for its protection [19], there is a deficiency of seismic studies concerning suspended filter capacitors, which possess a markedly different structure from the converter valve.
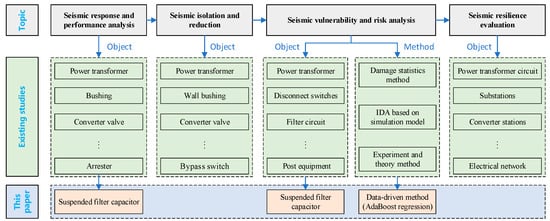
Figure 1.
Seismic studies on power systems and the location of the study of this paper.
On top of response analysis and seismic mitigation analysis, recent years have seen the increase in seismic vulnerability and failure risk assessments on electrical equipment. Since Anagnos developed the empirical seismic fragility database of electrical equipment by damage statistics in 1999 [20], many scholars started the evaluations for substation equipment by simulation or tests. Zareei et al., Paolacci et al., and Bai et al., respectively, assessed the failure probability of power transformers and disconnect switches in succession [21,22,23]. He et al. assessed the seismic failure risk of the post electrical equipment on supporting structures in 2023 [24,25]. Baghmisheh et al. also completed the seismic risk analysis for substation equipment using a reliability-based approach [26]. In addition, some detection measures were implemented to electrical equipment to complete the real assessment [27,28]. Further, some circuit and system analysis approaches were applied to the entire substations and the system vulnerability simulation model was proposed [29,30]. However, the assessment work at substation system levels always concentrates on the global situation, which ignores the detailed response laws of standalone equipment [31,32]. The oversimplification of the equipment brings a large error. In current seismic studies, the seismic performance and vulnerability of some single equipment such as the suspended filter capacitor are still unclear and worth looking into.
Seismic vulnerability analysis plays a critical role in the performance assessment on engineering structures [33,34,35,36]. Incremental dynamic analysis (IDA) is the most commonly used vulnerability analysis approach for assessing different types of structures. The general vulnerability analysis reflects the whole structural dynamic performance whereas it lacks the consideration of some sorts of uncertainty factors and influence. Research in recent decades have revealed that material uncertainty is one of the critical factors that influences the structural seismic vulnerability [37,38,39,40], in addition to other uncertainties such as the structural parameter uncertainty [41]. For instance, Zhu et al. found that material strength uncertainty would increase the seismic fragility and failure risk of structures [7,29]. For electrical equipment, the commonly employed porcelain and composite insulators are susceptive to earthquakes, so their material properties are closely related to the structural safety. It was reported that the material strength of brittle insulation materials generally obeys the normal or Weibull distribution [42] that shows the research necessity. Although some studies investigated the influence of material uncertainty on the seismic fragility of electrical equipment [29], only the material strength was considered, and other material properties such as elastic modulus, Poisson’s ratio, and density were still not taken account into. A more comprehensive seismic vulnerability study for electrical equipment is urgently needed.
On the other hand, the seismic vulnerability analysis considering a series of parameter uncertainties requires a large amount of computation time, and the analysis results are so complex that they are difficult to be applied in the subsequent engineering evaluations. For example, Monte Carlo simulations can also be used to derive the structural fragility curves; however, the computational cost would significantly increase once the parameter uncertainties are considered. Bayesian updating is effective in incorporating prior knowledge and observational data to refine fragility estimates. However, it relies on well-defined prior distributions and requires iterative updating as new data becomes available. In many practical cases, defining appropriate priors can be challenging, particularly when data is limited. Fortunately, artificial intelligence techniques including machine learning and deep learning provide the solution by establishing the mathematical model that can replace the map between the different physical quantities in engineering [43,44,45]. For example, Sediek et al. used machine learning techniques to predict the seismic collapse behavior of deep steel columns [46]. Liu and Macedo estimated seismically induced slope displacements through machine learning [47]. Furthermore, many scholars conducted computer vision for structural damage detection using deep learning [48]. The use of artificial intelligence solves these engineering problems and simplifies the data results, and also provides a way to obtain the results out of the calculation range.
To address the above-mentioned issues, this paper studies the seismic performance of a typical ±800 kV suspended filter capacitor by developing a complex and detailed simulation model aimed at accurately predicting the seismic response. Then, a seismic vulnerability analysis approach based on the adaptive boosting (AdaBoost) regressor was proposed and applied to the filter capacitor. In the analysis method, various material property parameters and earthquake uncertainty were considered at the same time. At last, the accuracy and efficiency of the proposed vulnerability analysis approach was discussed. In addition, the impact of the pretension force of the bottommost suspension insulators was also investigated. Therefore, the main contributions can be summarized as follows:
(1) This paper fills the gap of seismic performance and the vulnerability evaluations of electrical equipment in substations on the topic of suspended filter capacitors.
(2) This work first investigates the influence of the pre-tension force of the suspension insulators on seismic responses and vulnerability.
(3) This paper proposes a novel AdaBoost regressor-based approach for assessing the seismic vulnerability of substation equipment, which could consider the uncertainties of multiple material parameters. Single-variable-input and multi-variable-input regressors are proposed and compared, respectively.
(4) This work validates the effectiveness of the proposed approach from the views of computational efficiency and prediction accuracy.
2. Structural Parameters and Simulation Model
2.1. Physical Structures and Structural Parameters
The analyzed filter capacitor functions in an ±800 kV ultra-high-voltage (UHV) direct current power transmission system. The transmission grid system comprises a series of converter stations, serving as nodes, interconnected by a number of transmission lines. In an ±800 kV converter station, a suite of equipment interconnected by conductors or wires constitutes the whole substation system. In the station, two identical suspended filter capacitors are in operation, one of which is the focus in this paper. The filter capacitor is a suspended structure that is installed on a door-like steel gantry. The materials of the gantry adopt Q345 steel. The overall structure and sizes are depicted in Figure 2. The overall structure mainly consists of the steel gantry, the filter capacitor, the interlayer glass-fiber reinforced polymer (GFRP) insulators, and the top and the bottom tension insulators. The steel gantry is a single-span lattice frame with a span of 24 m. The total height of the steel gantry is 45 m, and the height of the suspension point of the filter capacitor is 42.5 m. The components of the beam and columns of the steel gantry are provided in Table 1, including the cross-section information and sizes. The filter capacitor is fixed to the gantry by the top tension insulators and to the ground by the bottom tension insulators. The top insulators have a length of 10.560 m while the bottom insulators have a height of 4.053 m.

Figure 2.
Structures and sizes of the ±800 kV suspended filter capacitor.

Table 1.
The cross-section information of the overall filter capacitor.
The filter capacitor has a total of 32 layers arranged in two rows per layer. Each layer has eight capacitor modules, organized in double rows, with four modules per row, as shown in Figure 2b. Each layer, accounting for the grading ring and other attachments, has a mass ranging from 1000 to 1500 kg. The upper layer has a mass of 1500 kg, whilst the lower layer has a mass of 1400 kg. The layers of the filter capacitor are interconnected by four vertically suspended GFRP insulators with hinge joints, so such a suspension structure with hinge connections has an obvious geometric nonlinearity. Figure 2c shows the details of the top suspended insulators. They are connected to the gantry and the top layer of the capacitor with hinge joints. The four top insulators and the interlayered insulators are perpendicular to the ground and separated by 2.40 m and 2.07 m along the two horizontal orientations. With an inclined degree of 63, the bottom tension insulators are installed as the connection of the filter capacitor and the ground. The two ends of the inclined insulators are both hinge joints.
All insulators in the suspended filter are made of GFRP composite materials whose specified tension load (STL) is 300 kN and elastic modulus is 60 GPa. The lengths of the top insulators and the bottom insulators are 10.50 m and 4.05 m, respectively. The height between the capacitor layers is 0.85 m. The diameters of the top and bottom insulators are 30 mm whereas the diameter of the interlayer insulators is 45 mm. For reducing the dynamic response of the filter capacitor, a pre-tension force is applied to the bottom insulators. As shown in Figure 2d, there is a regulating instrument on each bottom insulator so that the pre-tension forces of the four insulators can be adjusted artificially. The pre-tension force of the bottom insulators of the suspended filter capacitor is set to 20 kN during the initial design to reduce the oscillation and seismic responses.
2.2. Simulation Model
A simulation model of the suspended filter capacitor was established by ABAQUS software v6.14.3, as shown in Figure 3. The structures which include the door-type gantry and the support frame used for the capacitors are simulated by B31 beam elements because they have obviously larger lengths than the cross-sectional dimensions. The simulation details of only the filter capacitor are shown in Figure 4. For the suspended insulators, they have less cross-sectional sizes, and only the three translational degrees of freedom of their two ends are restricted. Their ends can freely rotate which exhibits the significant axial stiffness, so truss elements are suitable for the simulation. In each layer of the filter capacitor, the capacitor modules that are installed on the support frame have a large stiffness with a high natural frequency. This research considers only their mass effect, since they exert weights to the suspension insulators through the frame, and this study focuses on the seismic responses of the suspension insulators instead of the capacitor modules. The stiffness influence of the capacitor modules is thus ignored. Hence, the capacitor modules are simplified as the lumped masses that are uniformly attached to the support frames, as shown by the green points in Figure 4.
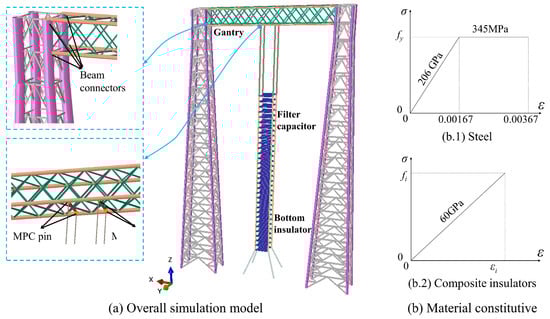
Figure 3.
A simulation model of the ±800 kV suspended filter capacitor.
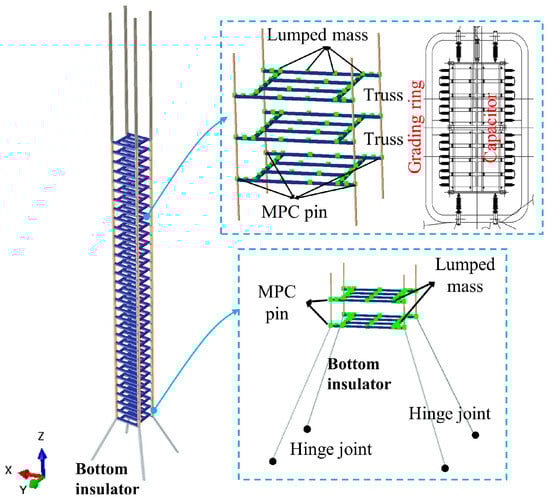
Figure 4.
Simulation details of the filter capacitor.
The steel gantry is composed of Q345 steel with a density of 7850 kg/m3, an elastic modulus of 206 GPa, and a Poisson’s ratio of 0.30. Its constitutive adopts a bilinear model with a yield platform, as shown in Figure 3b. It should be mentioned that the stress of the gantry induced by earthquakes generally would not exceed the yield strength because the possible local instability will occur prior to the yielding. Typically, there is no local instability for the components of the steel gantry unless the extreme strong earthquakes occur. Moreover, the composite insulator rods have a significantly lower safety factor than the steel members. Therefore, this study considers only the failure of the insulators. For the steel materials, a bilinear constitutive model was employed for simplifying the computations, which also can accelerate the computation process. For the GFRP composite insulators, the density is 2160 kg/m3, the elastic modulus is 60 GPa, and the Poisson’s is also 0.30. Its constitutive adopts a linear-elastic model due to its brittle performance, as shown in Figure 3b, which has been approved in relevant literature about substation equipment modelling [3,7,14,43,44]. The overall damping ratio of the model is set to 0.02 according to the relevant literature [4,7,14] and codes [49,50].
Some interactions should be provided to make the parts a whole. The horizontal parts and the vertical parts of the gantry are connected using Beam connectors because of the restriction for all degrees of freedom. Nevertheless, the suspension points of the filter capacitor on the gantry are set to MPC pin connections that only restrain the translational displacements. Furthermore, this type of connection is also employed for simulating the nodes between interlayered insulators. The four bottommost tension insulators are connected to the ground through the hinges that allow all rotational displacements, but the bottom of the gantry is fixed on the ground with all-degree-of-freedom restrictions. The filter capacitor would show significant horizontal deformation under seismic events, so the entire structure exhibits a distinct geometry nonlinearity that influences the seismic responses a lot. Therefore, this simulation model has the same mass distributions, sizes, and connection situations with the real equipment. Figure 3 also shows the three-dimensional coordinate system. The X axis is set as the horizontal direction in the gantry plane while the Z axis is set as the vertical direction. The Y axis is the horizontal direction that is perpendicular to the gantry plane.
2.3. Model Analysis and Accuracy Illustration
It is necessary to understand the structural dynamical characteristics before conducting the seismic performance analysis. As expected, due to its suspension structure, the filter capacitor exhibits an obvious geometric nonlinearity. The main reason is the hinge joints between the suspended insulators of the layers. Because of such a flexible structure, it shows dramatically lower vibration frequencies than the steel door-type gantry. The earliest mode related to the steel gantry is the 23rd mode that displays a coupling vibration of the filter capacitor and the gantry. The corresponding frequency is 1.78 Hz. The first three vibration modes of the structure with a pre-tension force of 20 kN are shown in Figure 5. The vibration mode information and effective mass are summarized in Table 2.
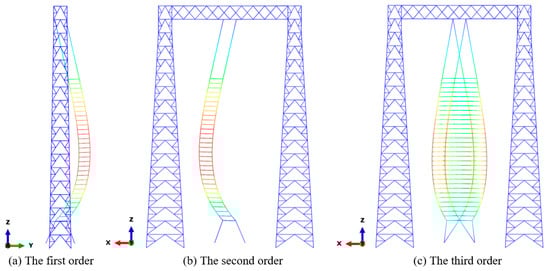
Figure 5.
The first three mode shapes of the suspended filter capacitor.
Table 2.
Vibration mode information and the effective mass of the filter capacitor.
The first two mode shapes are the horizontal bending of the capacitor and they have the same frequency of 0.181 Hz, showing the low vibration frequency and bending stiffness. Furthermore, the structural deformation nonlinearity also can be found in Figure 5. Reference [29] investigated an ±800 kV coupling filter circuit and the fundamental period of the suspended filter is 5.556 s, that reflects a natural frequency of 0.180 Hz. The simulation model of this type of suspended filter was also validated by on-site hammer tests in the authors’ other publication [44]; thus, the frequency results could be regarded reliable. The electrical equipment with the same voltage has a similar size and structure, so we can refer to the results in References [29,44]. It can be found that the two 1st mode frequencies of the simulation models are extremely close, which indicates the accuracy of the simulation model in this study.
3. The Seismic Performance of an ±800 kV Suspended Filter Capacitor
3.1. Selection of Ground Motions
The ground motions used for the seismic response analysis should meet the requirements of the required response spectrum in the relevant standard. The site of this filter capacitor is Class II, and the seismic fortification intensity is eight degrees. According to the seismic requirement of Chinese code [49], the seismic fortification of important electrical equipment should be increased by one degree, so the filter capacitor should be evaluated based on a nine-degree seismic fortification with the peak ground acceleration (PGA) of 0.4 g.
According to Chinese code GB 50260-2013 [49], the seismic qualification of electrical installations requires three or seven sets of ground motions. If selecting three sets of ground motions, there must be at least one artificial wave. Therefore, in this study, two sets of three-directional natural ground motions, El Centro wave and Taft wave, as well as one artificial wave (AW), were selected as the input earthquake waves. Their acceleration history with a PGA of 0.4 g in the main-vibration direction is shown in Figure 6a while the response spectra (RS) shown in Figure 6b. The required response spectrum in the Chinese code GB 50260-2013 [49] is also plotted. It can be found that the average RS can nearly envelope the RRS, which meets the requirements of the selection of ground motions. Thus, these three sets of ground motions are employed to calculate the seismic response of the filter capacitor. Because the vibration frequency in Y direction (0.18118 Hz) is slightly less than that in X direction (0.18133 Hz), the main-vibration direction of the filter capacitor is set to the Y direction. The PGA ratio of the three directions is determined as Y:X:Z = 1:0.85:0.65 per the relevant code [49]. The PGA in the main-vibration direction is set to 0.4 g according to seismic fortification requirement.
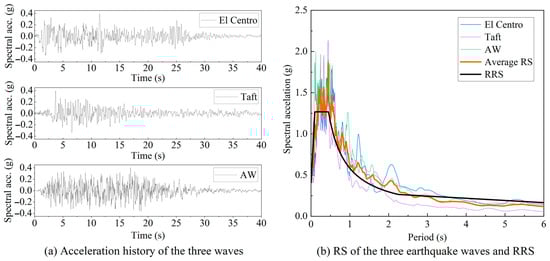
Figure 6.
Acceleration histories. RSs of the selected earthquake waves and the RRS.
3.2. The Displacement Response of the Filter Capacitor
As mentioned before, the filter capacitor will produce a large horizontal displacement under earthquakes. The filter capacitor has a type of LBQ-800-68M and its connections are shown in Figure 7a. There are three main connections to other equipment at the top, middle, and bottom layers with tube busbars or flexible wires. Once the connecting terminal of the filter capacitor produces a large displacement, the connection busbars or wires would be tensioned, further bringing in damage to the filter capacitor and the interconnected equipment. The excessive stretching of insulators can easily cause explosions, and severe wire pulling can cause structural damage or fires to adjacent post-type equipment. Those failures have been observed in previous post-disaster investigations for strong earthquakes, which would bring in power outage [51,52]. In addition, the large horizontal displacement will result in the distance decreasing between the filter capacitor and the gantry, which may induce an electrical insulation accident. Therefore, the horizontal displacement is a significant factor when considering the seismic performance of the suspended filter capacitor.
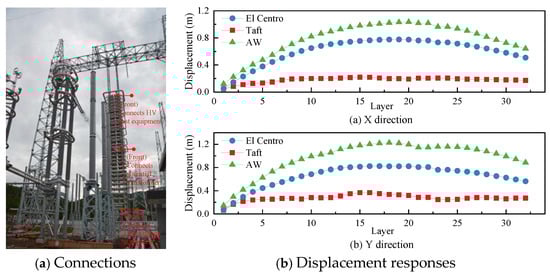
Figure 7.
The connections and displacement responses of the filter capacitor.
With the input of the ground motions with a PGA of 0.4 g, the maximum horizontal displacements of the filter capacitor are shown in Figure 7b, in which the 1st layer represents the bottommost layer and the 32nd layer represents the top layer. This figure shows that the maximum displacements in the X and Y directions of the filter capacitor are 1.04 m and 1.23 m, respectively, which appear in the 20th and 18th layers, respectively. At the top and bottommost layers, there are connection terminals that connect to the busbars. It can be found that the maximum displacements in the X and Y directions of the top layer are 0.64 m and 0.89 m, respectively. They are 0.12 m and 0.15 m for the bottommost layer. Hence, the top layer produces the maximum displacement of 0.89 m, which indicates that enough redundancy should be ensured in the design to prevent the traction failure due to the large maximum displacements.
3.3. The Force Response of the Suspended Insulators
Due to hinge joints at both ends, suspended insulators primarily experience axial forces. Seismic computations reveal that the top layer experiences the highest axial forces from gravity, with peak values of 181.26 kN, 154.06 kN, and 266.11 kN under El Centro, Taft, and AW waves, respectively. The average peak axial force is 200.48 kN. According to the aforementioned specified tension load 300 kN, all insulators will not be damaged by the earthquakes with a PGA of 0.4 g, and the safety factor is 1.50. While all insulators remain safe up to 0.4 g PGA earthquakes (average safety factor 1.50), they fall short of the 1.67 code requirement (GB 50260-2013 [49]) for composite insulators. This highlights the significant seismic vulnerability of these suspended insulators.
Reference [53] reveals that the member bars of suspended equipment may be pressed under vertical earthquake action, and it even may bring in an instability of the insulators. Upon the failure of the insulators due to buckling, the filter capacitor modules would generate significant accelerations that affect electrical function. The minimum axial forces of the bottom and the first-layer insulators are shown in Table 3. From Table 3, we can see that the bottom and the first-layer insulators will produce negative axial forces under Taft wave, and it is also a negative force for the bottom insulators under artificial wave. IEEE 693 standard recommends that the insulators of the suspended equipment should not be pressed under earthquakes because they have the failure risk that threatens the safety of the whole suspension equipment [50]. For the suspended filter capacitor, it is necessary to adjust the pre-tension force to avoid the pressure condition of the suspended insulators.
Table 3.
Characteristics of the selected earthquake.
3.4. The Influence of Pre-Tension Force on Seismic Response
To avoid the negative axial force of suspended insulators, the influence of pre-tension force on the seismic response of the filter capacitor was investigated in this section. Because the artificial wave was generated according to the site condition that can better reflect the real situation and induce the real responses, this analysis only focuses on the structural responses under the artificial wave.
The studied suspended filter capacitor in this paper adopts the pre-tension force of 20 kN. Thus, a tension amplification coefficient (TAC) is defined based on the maximum axial force of the suspended insulators under the pre-tension force of 20 kN, as shown in Equation (1):
where maxN(F) represents the maximum axial force of the suspended insulators under an earthquake when the pre-tension force is F. TAC(F) illustrates the increase percent of the maximum axial force of the suspended insulators with the increase of the pre-tension force. When TAC(F) is less than 0, it indicates that the maximum axial force of the suspended insulators is less than that under the pre-tension force of 20 kN. Then, this study investigates the influence of PGA on the axial force and TAC. Under PGAs of 0.2 g, 0.3 g, and 0.4 g, the maximum axial force of the suspended insulators and the TAC are shown in Figure 8.
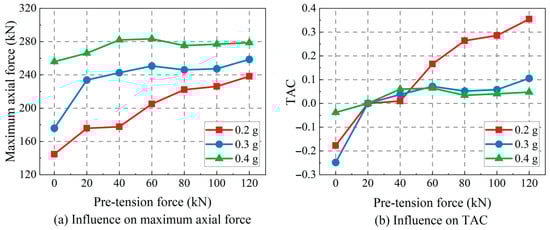
Figure 8.
The influence of the pre-tension force on the maximum axial force and TAC.
It can be found from Figure 8a that the maximum axial force of the suspended insulators increases dramatically as the PGA increases. Furthermore, when the pre-tension force increases, the maximum axial force shows a growth trend overall. The filter capacitor is a suspension structure that exhibits an obvious geometry nonlinearity. One of the main features is the structural stiffness that will change with the deformation of the filter capacitor. Therefore, there are two main factors that influence the horizontal stiffness of the suspended filter capacitor. The first one is that the pre-tension force gives an initial structural stiffness, and the second one is that the axial force in the suspended insulators caused by earthquakes would bring in some stiffness contributions. When the PGA is relatively small, such as 0.2 g, the influence of earthquakes on the structural stiffness is relatively small so the influence of the pre-tension force dominates. That is why the axial force increases continually as the pre-tension increases, and the TAC also significantly increases in Figure 8b. However, when the PGA is relatively large, such as 0.4 g, the impact of the pre-tension force on the stiffness increase is less than the strong seismic action. Therefore, Figure 8b shows a slight change of TAC with the increase in the pre-tension force under the 0.4 g artificial wave, and the TAC is in the range of 0~0.1 when the pre-tension force is enhanced.
The influence of the pre-tension force on the minimum axial force and the maximum displacement is shown in Figure 9, in which the negative axial force represents the pressure. From Figure 9a, we can understand that the minimum axial force gradually reduces as the PGA increases, and the minimum axial force increases with the increase in the pre-tension force. When the pre-tension force is larger than 40 kN, the insulators will not produce pressure, which meets the requirements of IEEE 693 std [50]. Therefore, the pre-tension force is recommended to be adjusted so that the pressure generating can be avoided in the suspended insulators.
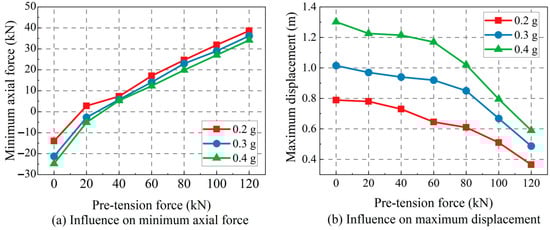
Figure 9.
The influence of the pre-tension force on the minimum axial force and maximum displacement.
Figure 9b has plotted curves of the maximum displacement of the filter capacitor versus the pre-tension force under various PGAs. When the PGA increases, the maximum displacement of the filter capacitor rises whereas it decreases with the increase in the pre-tension force. The main reason is that the pre-tension force enhances the stiffness of the entire filter capacitor; therefore, the displacement can be reduced. From this figure, it also can be found that the decrease trend is more drastic when the pre-tension force is large than 60 kN. Moreover, the maximum displacement of the filter capacitor under 0.4 g earthquakes can be significantly reduced from about 1.23 m to 0.59 m with a decrease percent of 50% by increasing the pre-tension force, which indicates the effectiveness of controlling the displacement of the filter capacitor by adjusting the pre-tension force.
The above investigations have found that the safety factor of the insulators is 1.5, which is a little lower than the 1.67 that is stipulated by Chinese code GB50260-2013 [49]. We can see that the maximum axial force will reduce as the pre-tension force decreases. Figure 9 indicates that it will also reduce the minimum axial force, and increase the maximum displacement. However, the change amplitude is not large. Therefore, a potential improvement can be suggested, i.e., reducing the pre-tension slightly while ensuring the minimum axial force is larger than 0. In this way, the safety factor can be increased, and can also avoid the compression stress in these insulators.
4. AdaBoost Regressor-Based Seismic Vulnerability Analysis Method
4.1. The Basic Theory of the Seismic Vulnerability Analysis of Electrical Equipment
Seismic vulnerability and risk analysis have been constantly developed in the area of engineering structures including substation equipment [22,23,24,25,26]. The seismic vulnerability of a structure is commonly expressed by a probability-based failure index. This failure index represents the probability that the structural response exceeds the material strength, which brings in structural damage. Generally, it can be expressed as Equation (2) [54,55].
in which P represents the failure probability, S represents the structural responses under an earthquake citation, and R represents the performance level. IM is the intensity measure. For electrical equipment in substations, S usually adopts the peak stress responses of porcelain or composite insulators due to the low material strength, so R is determined as the material strength. IM is generally specified as the PGA or spectral acceleration at the fundamental period. Nowadays, the related investigations indicate that the seismic failure probability P of electrical equipment can statistically obey the log-normal distribution, as shown in Equation (3) [54,55]:
in which μ and σ are the logarithmic mean and logarithmic standard deviation, respectively, and x is the intensity measure. Obviously, they are the two critical parameters that can determine the overall function. For electrical equipment, the use of PGA as the IM of the fragility curves is based on the following reasons: (1) PGA is a straightforward and commonly utilized index for quantifying ground motion intensity in seismic evaluations of substation equipment, as its value is readily accessible. (2) The Chinese seismic design regulations for structures and electrical installations utilize PGA as the vital intensity measure for delineating ground motion intensity and seismic hazard correlations. (3) Extensive literature about the seismic fragility of substation equipment primarily uses PGA as the IM, hence encouraging its selection in this work for the fragility analysis of power transformers. Therefore, this study adopts PGA as the IM in the fragility analysis [7,20,21,55]. Given a PGA range, a fitted vulnerability curve can be obtained via Equation (3) and then is used to estimate the structural failure risk based on the PGA.
4.2. The Material Uncertainty of the GFRP Composite Insulator
Material parameters are always precisely employed for the seismic design and assessment of engineering structures whereas the composite insulators show the uncertain material parameters according to the recent investigations [56,57,58]. In other words, the material parameters are not absolutely accurate values in actual engineering because the manufacturing process is not a completely stable process, so there are deviations between the actual parameters and design parameters. Such deviations will result in the inaccuracy of the seismic assessment and damage to electrical equipment in high-voltage substations, further influencing the decision and judgement of a practitioner.
To fully consider the influence of material parameters and comprehensively assess the seismic vulnerability of the electrical equipment in high-voltage substations, the typical material parameters, such as the elastic modulus, density, etc., are focused in this method. Furthermore, structural damping is an important variable that influences the seismic responses. However, deviations in damping ratios still occur despite recommendations from various seismic standards for common structures (0.02 for substation equipment [49,50] and 0.05 for reinforced concrete structures [49]). Thus, the deviations of various parameters should be considered as key variables, which is helpful to the comprehensive seismic assessment of electrical equipment consisting of insulators.
4.3. A Selection and Brief Introduction of the AdaBoost Regressor
For a given engineering structure, its seismic response depends on the ground motion and the material parameters. A proper regressor is supposed to be determined such that the relationship between seismic vulnerability parameters and the PGA or other material parameters can be represented. Nowadays, there are lots of widely used machine learning models, which can meet the requirements of this work. AdaBoost is an ensemble learning method that improves prediction accuracy by iteratively adjusting weights so that multiple weak learners (such as decision trees) are combined into a single strong learner. Compared with single models (e.g., linear regression, support vector machines, etc.), it is better adapted to complex seismic response patterns. Concerning some commonly used ML models, Gaussian processes (GPs) perform well on small data sets and can provide uncertainty estimates. However, the computational complexity of GPs is higher, especially in the case of multiple predictions, and the computational overhead is significantly higher than that of AdaBoost. GPs depend on the selection of kernel functions, so different kernel functions have a great influence on the model, which increases the difficulty of model optimization. In contrast, AdaBoost adaptively adjusts the weight of the weak learners, which can ensure accuracy while maintaining a high computational efficiency. Neural networks (NNs) can learn complex nonlinear maps, but its model training process requires a large amount of data, and the complexity of hyperparameter tuning is high. At our data size, NNs do not show significant performance advantages in computational cost. Since AdaBoost achieves a better balance between model stability and computational efficiency, this study uses the AdaBoost regressor as the surrogate model.
The AdaBoost regressor is one of the commonly used regressors that are of a satisfactory predictive value. It is a meta-estimator that begins by fitting a regressor on the original dataset and then fits additional copies of the regressor on the same dataset but where the weights of instances are adjusted according to the error of the current prediction. As such, subsequent regressors focus more on difficult cases and provide a more accurate prediction [59]. The AdaBoost regressor is a typical learning model with boosting. The core principle of the boosting method is depicted in Figure 10. Specifically, the key hyperparameters, including the number of estimators, the learning rate, and the base regressor are carefully tuned to optimize performance. The training process follows an iterative approach: Firstly, an individual estimator is trained from the initial training set, and then the distribution (weight) of the training samples is adjusted according to the performance of the individual estimator, so that the training samples that the previous individual estimators that made mistakes or produced large errors receive more attention in the following period. Then, the next individual estimator is trained based on the adjusted sample distribution (weight). Repeat this until the number of individual estimators reaches a predetermined value, and finally a strong estimator is built by combining the base estimators. Compared to alternative methods such as GPs and NNs, AdaBoost offers notable computational advantages. Unlike GP, which has a cubic complexity (O(n3)), making it less scalable, AdaBoost scales linearly (O(nT), where T is the number of estimators), allowing for efficient training even on large datasets. Additionally, while NNs require extensive hyperparameter tuning and GPU acceleration, AdaBoost can be effectively trained on a standard CPU, making it a computationally efficient alternative. Empirical results demonstrate that AdaBoost achieves a favorable trade-off between prediction accuracy and computational cost, making it well suited for seismic vulnerability analysis.

Figure 10.
The core principle of the boosting algorithm.
4.4. AdaBoost Regressor-Based Seismic Vulnerability Analytical Procedures
On the basis of the aforementioned basic theory, the seismic vulnerability analysis method based on the AdaBoost regressor was proposed and the steps are summarized in Figure 11. There are three main stages for the overall vulnerability assessment:
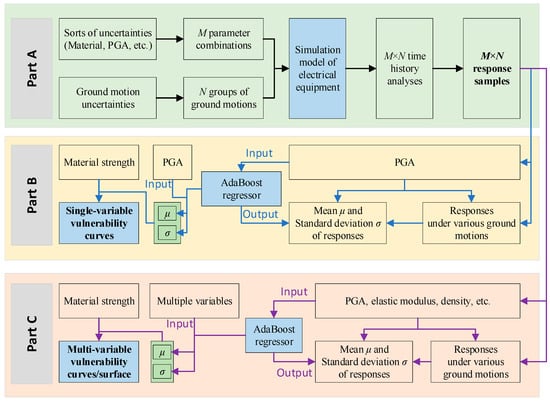
Figure 11.
The seismic vulnerability analysis method based on AdaBoost regressors.
(1) The structural seismic responses with various uncertainties are obtained by the time history calculations for the simulation model;
(2) The mappings from the PGA to the mean μ and standard deviation σ of various responses are formed. Then, AdaBoost regressors with a single variable as an input are used to replace the mappings. Considering the material strength, the seismic vulnerability curves can be obtained according to the mapping of predicted responses and PGA;
(3) Further, the mappings from uncertain parameters (PGA, elastic modulus, etc.) to the mean μ and standard deviation σ of various responses with other uncertain parameters are formed. AdaBoost regressors with multiple variables as inputs are also employed to replace the mappings. Considering the material strength, the seismic vulnerability curves can be obtained according to the mapping from uncertain parameters to predicted responses.
These three steps combine into the vulnerability analysis method, and a more detailed illustration is introduced in the following parts.
4.4.1. Part A: Sample Collecting Based on Simulation Part B: Seismic Vulnerability Based on the Single-Variable-Input AdaBoost Regressor
As mentioned before, the obtained seismic vulnerability curve quantifies a structural failure probability and considers the uncertainties related to material parameters and ground motions. It should be mentioned that other types of uncertainties, including geometric size, construction quality, and simulation precision, are not considered in this work. They can be accounted for in the future in the same way as indicated in this paper. Those parameters considered generally obey the distributions such as normal distributions and logarithmic normal distributions, so they can be obtained by random sampling. Firstly, the material parameters and PGA can be sampled from the distributions by Latin hypercube sampling (LHS), then M groups of parameter combinations can be obtained. Each group of parameter combinations includes the parameters with the determined number. Secondly, to consider the ground motion uncertainty, N sets of ground motions that meet the requirements of site condition and design are selected. Specifically, a design spectrum provided by relevant codes or standards [49,50] should be first selected according to the site condition (i.e., soil type and characteristic period) and the seismic fortification intensity (i.e., PGA). Then, N sets of ground motions can be selected by spectral matching using the mean spectrum after scaling them. For each parameter combination and each ground motion, the simulation model can generate one seismic response; hence, there are M × N time history computations that need to be conducted, after which M × N samples can be acquired along with the computations.
4.4.2. Part B: Seismic Vulnerability Based on the Single-Variable-Input AdaBoost Regressor
Seismic vulnerability curves generally represent the relationship between probability and the PGA. In the M × N parameter combinations, one PGA is in various combinations due to the uncertainty of other parameters, which brings in various response values for one PGA. These responses can produce one mean and one standard deviation. Thereby, one PGA would correspond to one group of mean and standard deviation. AdaBoost regressors can be employed to replace the relationships between the PGA and mean and standard deviation of seismic responses. Based on them, the mean and standard deviation values can be predicted for each PGA, which actually represents a distribution that can estimate the probability that the response exceeds the material strength. Once a PGA is input to an AdaBoost regressor, we can obtain a mean and a standard deviation of the responses. Such a mean and a standard deviation constitute a normal distribution of responses, and then the probability that the responses exceed a given material strength can also be obtained. Thus, this probability corresponds to the inputted PGA. Because the seismic vulnerability of substation equipment is usually represented by log-normal distributions of PGA [21,22,23,24,25,29,30], the seismic vulnerability curve of equipment can be obtained by fitting using the log-normal distribution as shown in Equation (3). This fitting can better assess the seismic fragility of the equipment and predict the failure probability under a given PGA. Furthermore, the vulnerability curves could be further used for calculating the seismic risk of the equipment.
4.4.3. Part C: Seismic Vulnerability Based on the Multi-Variable-Input AdaBoost Regressor
Section 4.4.2 demonstrates the single-variable-input seismic vulnerability curve that predicts the failure probability based on the PGA. Other parameters are considered in the statistical calculation. Nevertheless, the input would be multi-variable once the failure probability is estimated not only by PGA but also by other parameters. Therefore, this part establishes the AdaBoost regressor based on multiple parameters as inputs and the responses as outputs. For the given PGA and material parameters, ground motions would change, which results in various responses, so there are also a mean μ and a standard deviation σ. AdaBoost regressors will be used to replace the mappings from the given PGA and material parameters to the mean μ and standard deviation σ, respectively. Then, the AdaBoost regressors can be utilized to predict more μ and σ values when inputting more parameter combinations. The μ and σ values, which represent a distribution, can output the failure probability by inputting one PGA. Then, the data points of failure probability can be obtained as PGA changes, so a seismic vulnerability curve also can be obtained by fitting using log-normal distribution as shown in Equation (3).
If we would like to investigate the combined effects of PGA and other material parameters, the seismic vulnerability surface also can be acquired. Using the multi-variable-input AdaBoost regressor, the data points of failure probability versus PGA and other material parameters are plotted or clustered, then fitted by a multi-dimensional surface. Then, the features of the vulnerability surface can be accordingly synthetically analyzed.
5. The Seismic Vulnerability of an ±800 kV Suspended Filter Capacitor
5.1. Material Parameter Combination and Ground Motion Sampling
As a case study, the suspended filter capacitor was utilized as the object to illustrate the proposed method. Section 2 exhibits the structures and parameters of the filter capacitor whereas they are certain values that cannot reflect the actual situation. To consider the uncertainty of material parameters, the distributions of some key parameters of the filter capacitor are given in Table 4. At first, the pre-tension force is set as 20 kN, as is true. The parameters include the elastic modulus Ein, density ρin, and damping ratio ηin of the insulators, and the elastic modulus Eg of the steel gantry. In this study, these parameters are regarded as independent of each other. Table 4 also exhibits the distribution of PGA to represent the uncertainty of ground motion intensity. To get the calculation samples, LHS was utilized to randomly select parameter combinations from the distributions given in Table 4, thereby 50 groups of samples (M = 50) were obtained. In each samples group, there are five parameters that represent one engineering situation.
Table 4.
Distributions of material parameters and PGA.
On the other hand, the uncertainty of ground motions should be considered. Twenty (N = 20) natural ground motion recordings were selected as the input of the simulation model during the time history computations. The selection of the ground motions is based on the recommendation of the FEMA/SAC project [60]. The response spectra of the twenty ground motions are shown in Figure 12. This type of uncertainty also includes the variety of PGA while it has been considered in Table 4.

Figure 12.
Response spectra of the selected ground motions and average spectrum.
The 50 groups of parameter combinations and 20 ground motions would be combined one to one, thereby 50 × 20 = 1000 time history computations should be completed, with which 50 × 20 = 1000 responses can be obtained. Here, the response is the maximum axial stress response of the top insulators of the filter capacitor, since the maximum stress of the filter appears on the top insulators, as mentioned before. For each parameter combination, there are 20 response values that respond to the 20 ground motions, so their mean μ and standard deviation σ can be calculated, as listed in Figure 13. It can be seen that the mean values of the responses vary from near 0 to 150 MPa, which indicates the effect of LHS. In addition, each parameter combination provides one certain PGA for the different ground motions, therefore the responses can be plotted on the basis of PGA as an independent variable, as shown in Figure 14. In Figure 14, the mean μ, μ−σ, and μ + σ of the responses under each PGA are also given. Overall, the responses increase with the growth of the PGA whereas the amplitude of fluctuation is also gradually increasing.
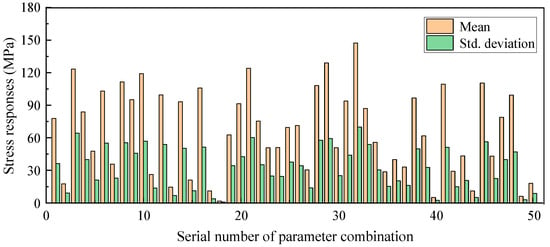
Figure 13.
The mean and standard deviation values of responses under each parameter combination.
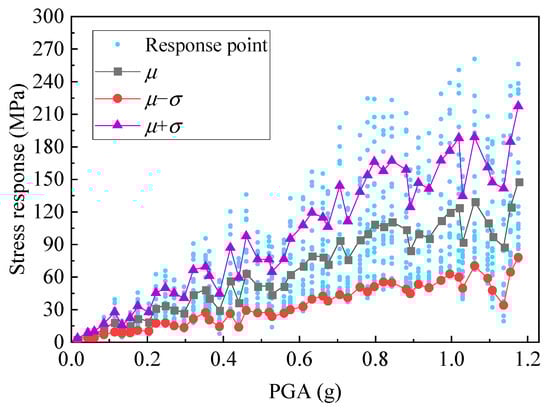
Figure 14.
The statistic results (the mean and standard deviation) of responses versus PGA.
5.2. The Single-Variable-Input AdaBoost Regressor and Vulnerability Curve
To build the AdaBoost regressors, the data of mean and standard deviation values of the responses and PGA are used as the output and input data, respectively, and then the relationships can be replaced by the regressors after training. From Figure 14, we can see that the relationship between the mean value of the responses and PGA exhibits a nearly linear line. Therefore, linear model-based regressors are more reasonable for such substitutes. The AdaBoost regressor, that has been introduced in Section 4.3, requires a series of individual estimators, such as a logistic regression model, ridge regression model, support vector machines, decision tree regression model, etc. Since the nearly linear line is shown in Figure 14 and there is only one input of PGA, a logistic regression model is determined as the individual estimator in the AdaBoost regressors.
Using the data of mean and standard deviation as training samples, two AdaBoost regressors were obtained, where the hyperparameters include the number of individual estimators, the penalty function, the inverse of regularization strength, the maximum number of iterations, etc. In this work, the penalty function was set to the widely used L2 penalty term, and the maximum number of iterations was set to 100. Given the tuning range of 5~30 for the number of individual estimators, and the tuning range 0.001~1 for the inverse of the regularization strength, the final number of individual estimators is 10, and the final inverse of the regularization strength is 0.015. The optimal values are obtained through multiple calculations in terms of grid search. The subsequent prediction results will illustrate the accuracy. Then, a series of discrete PGA points were given from 0 to 1.2 g with a step of 0.01 g. Based on these PGA points, the regressors can output the mean values and standard deviation values of the responses, respectively. The predicted results are shown in Figure 15, in which the data points represent the original results.
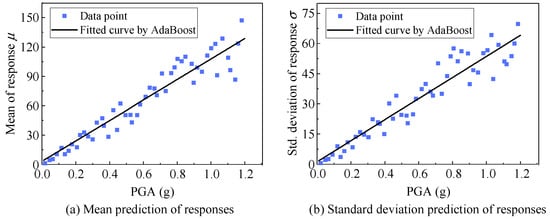
Figure 15.
A comparison of the actual and predicted mean and standard deviation of the responses.
After getting the regressors mapping the PGA to the mean and standard deviation of the responses, the mean and standard deviation can be directly obtained at any PGA. Then, a Gaussian distribution can be determined based on the mean μi and standard deviation σi, whose cumulative distribution function (CDF) under a given limit state MS is as shown in Equation (4):
where CDF represents the probability of the response prediction value less than the material strength MS. Therefore, the probability that the response prediction value exceeds the material strength MS can be expressed as Equation (5):
where p represents the failure probability, μi and σi represent the mean and standard deviation of the responses at the i-th point, and MS represents the material strength. The failure strength of the suspension insulators is 70 MPa according to the manufacturer. Going through every PGA point, the data points about failure probability and PGA can be obtained, as shown in Figure 16. According to the seismic vulnerability theory for electrical equipment mentioned in Section 4.1, these points can be substituted by a log-normal distribution function. Therefore, a log-normal distribution curve was fitted using the scatters as seen in Figure 16.

Figure 16.
Failure probabilities predicted by single-variable-input AdaBoost regressors, as well as the fitted seismic vulnerability curve.
It can be seen from Figure 16 that the failure probability is close to 0 when the PGA < 0.2 g, which keeps the structural safety from the standpoint of statistics. As the PGA increases, the failure probability shows a rapid increase until the PGA = 0.8 g, which corresponds to the probability of 71.3%. When the PGA > 0.8 g, the failure probability will gradually increase and maintain a high condition. It indicates that there is a high failure risk under ground motions with large PGAs. A practitioner can make some decisions and retrofitting measures according to such a type of vulnerability results.
5.3. The Multi-Variable-Input AdaBoost Regressor and Response Prediction
The single-variable-input regressor only considers the relationship between the failure probability and PGA. The influence of other uncertain parameters is exhibited in the statistics. Such a processing could not highlight and investigate the effect of each parameter. A multi-variable-input regressor is recommended as the substitution model that maps various parameters to the failure probability. Due to the various uncertain parameters, it is better for the individual estimators used in the AdaBoost regressors to select nonlinear models. A decision tree is a commonly used nonlinear model in the field of machine learning so it was employed as the individual estimator. Since a decision tree is not the main topic in this paper, its basic principle was neglected but can be found in relevant publications [61].
There are five parameters in Table 4 and each group of parameters was input into the simulation model for time history calculations under 20 ground motions, so 20 stress responses were obtained for each one parameter combination. Hence, their mean and standard deviation values were then computed and each parameter combination provided one mean of responses and standard deviation of responses. In terms of the mean value, 50 samples that include five parameters and one mean value can obtained. Then, an AdaBoost regressor was trained using these samples, which enables the regressor prediction ability. Then, another regressor for standard deviation was also formed in the same way. Similar to the processing in Section 5.2, the failure probability can be acquired according to Equation (4) at any given parameter combination. The scatters predicted by the AdaBoost regressor are shown in Figure 17, and the vulnerability curve based on the log-normal distribution is also shown.
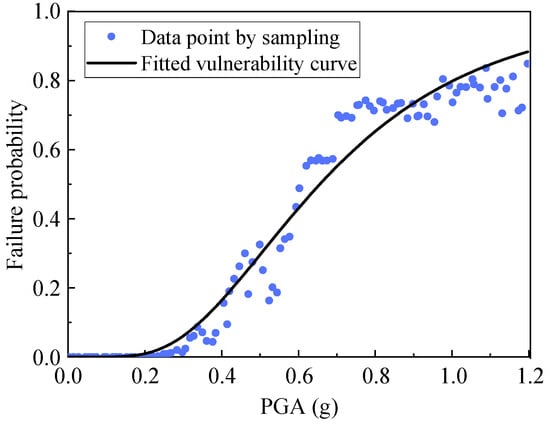
Figure 17.
Failure probabilities predicted by multi-variable-input AdaBoost regressors, as well as the fitted seismic vulnerability curve.
The main features and tendency of the vulnerability curve in Figure 17 are the same with those predicted by single-variable-input AdaBoost regressors. The scatters are not continuous like Figure 16 because the AdaBoost regressors with a decision tree as individual estimators are nonlinear. Nevertheless, the predicted vulnerability curve exhibits similar laws to that of Figure 16, which indicates the accuracy of the nonlinear regressors.
One of the advantages of using a multi-variable-input AdaBoost regressor is the availability of analyzing the influence of various uncertain parameters at the same time. We obtained the 50 samples before; thus, the surfaces that take PGA and other parameters as inputs and take the failure probability as outputs can be plotted, as shown in Figure 18. Overall, the surfaces are slanted because the effect of the PGA dominates. Therefore, compared with the other uncertain material parameters, the PGA always exhibits the highest influence on the fragility. The fluctuant surfaces also indicate the influence of various uncertain material parameters. In Figure 18a,b,d, Ein, ρin, and Eg exhibit unstable impacts on the fragility. However, we can see from Figure 18c that ηin nearly does not reflect the influence on the failure probability. This means that the Poisson’s ratio does not have a large impact on the structural fragility, which may be ignored in a seismic fragility analysis of substation equipment. Thus, the multi-variable-input AdaBoost regressors have the ability of identifying the joint influence of multiple variables, as well as the importance of these uncertainty parameters. In addition, in some local positions such as Figure 18b, the fluctuant amplitude is relatively larger, suggesting that it is necessary to consider the influence of uncertain material parameters, although it is relatively weaker than the influence of PGA.
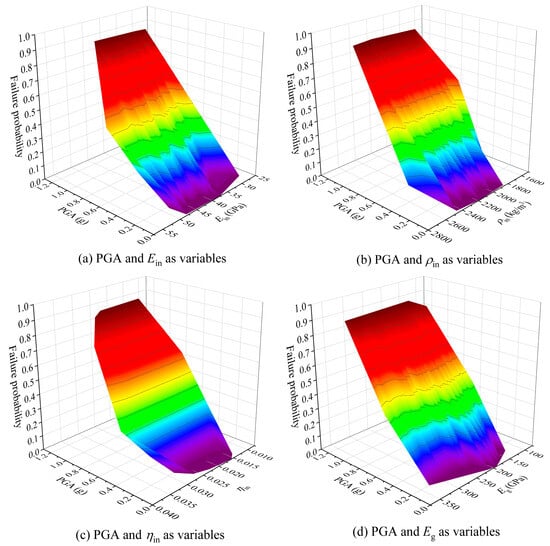
Figure 18.
The seismic vulnerability surface predicted by multi-variable-input AdaBoost regressors considering PGA and multiple uncertain parameters.
5.4. A Comparison of Vulnerability Curves Based on AdaBoost Regressors and IDA
To validate the accuracy of the established AdaBoost regressors, the results are compared with the vulnerability curve generated by the traditional IDA method. For obtaining the IDA-based fragility curves, some procedures were implemented as follows:
- (1)
- The material parameters except PGA were sampled by LHS and 15 groups of samples were obtained. The PGA was modulated from 0.2 g to 1.2 g at a step of 0.2 g, inducing six PGA values.
- (2)
- At each PGA, there were 20 × 15 = 300 responses and their mean value and standard deviation were computed as shown in Figure 19a.
- (3)
- Then, we got the response number that exceeds the material strength at each PGA so that the failure probability could be computed. Thus, there will be six PGA–failure probability pairings.
- (4)
- Using log-normal distribution, an IDA-based fragility curve can be obtained by fitting the relationship of the PGA–failure probability pairings, as shown in Figure 19b.
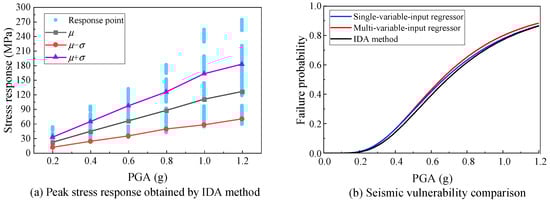
Figure 19.
Stress response data obtained by the IDA method and the vulnerability curve comparison.
Furthermore, also based on log-normal distribution, the vulnerability curves predicted by AdaBoost regressors can be fitted as shown in Figure 19b. They will be compared with the IDA-based fragility curves.
It is evident that the three vulnerability curves in Figure 19b exhibit approximately the same tendency. The multi-variable-input curve has a larger offset from the IDA-based curve, compared to the single-variable-input curve. The probability errors of the fragilities from AdaBoost regressors relative to the IDA-based fragility are computed as Figure 20 to quantify the errors. The maximal probability errors of the single-variable-regressor and the multi-variable-regressor are 2.55% and 3.82%, respectively, which shows the accuracy of the proposed method. The AdaBoost regressors should be regarded as accurate enough for predicting the vulnerability of the filter capacitor. From the details, the curve predicted by single-variable-input regressor is closer to that from the IDA, comparing with the multi-variable-input regressor. It slightly overestimates the failure probability when the PGA < 1.0 g and predicts the same probability when the PGA > 1.0 g. Nevertheless, the curve predicted by the multi-variable-input regressor always overestimates the failure probability when the PGA > 0.4 g. Therefore, the single-variable-input AdaBoost regressor is more suitable than the multi-variable-input regressor when considering the uncertainty of material parameters of the filter capacitor, whereas the multi-variable-input regressor is more desirable once it is needed to investigate the influence of various parameters at the same time.
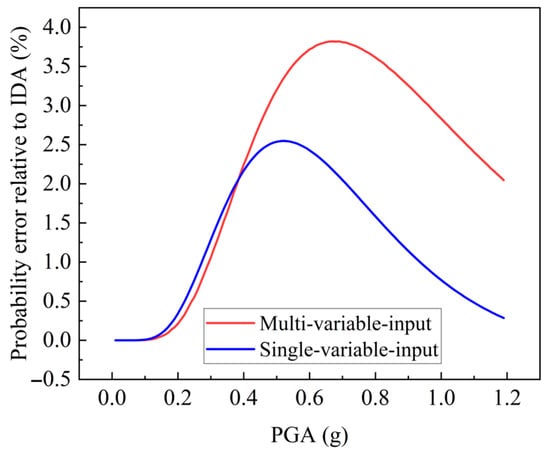
Figure 20.
The probability error of seismic vulnerability curves relative to that from the IDA method.
5.5. Computational Efficiency
One of the advantages of the AdaBoost-based fragility assessment relative to the IDA method is the calculation efficiency. In this work, for the IDA method, the repeated calculation quantity for the simulation model is 15 × 6 × 20 = 1800 whereas it is just 50 × 20 = 1000 calculations using the proposed vulnerability method based on AdaBoost regressors. In the finite element computations, two computers were used, with CPUs of Core i5-14600K and GPUs of GeForce RTX 4060. In this case, the former took a total of 603.42 h while the latter took a total of 337.66 h. The computation efficiency gets a remarkable improvement (around a 44.04% improvement in computation efficiency) while the material parameter combinations are also substantially increased using the AdaBoost regressors. Thereby, the proposed method can envelope more uncertain samples that make the results more accurate and also exhibits a high computation efficiency.
5.6. Influence of the Sample Group
To investigate the influence of the sample groups (i.e., the number of the training samples) on the prediction errors, and validate the effectiveness of the use of 50 samples in this study, a sensitivity analysis was conducted. Using the same method and procedure described in this paper, given M = 10~70 groups of parameter combinations, which will be used for training the AdaBoost regressors, the maximum errors between the predicted single-variable-input fragility curves and the IDA-based fragility curve are shown in Figure 21. As the number of the sample groups increases, the maximum probability error is reduced overall. However, the increase in the samples requires larger computational quantity, thus an excessive computational cost would reduce the advantages of the proposed AdaBoost-based approach, because the use of IDA could also achieve the goal. Therefore, this work selects the number of 50 as the final number of sample groups, considering the efficiency and the accuracy at the same time.
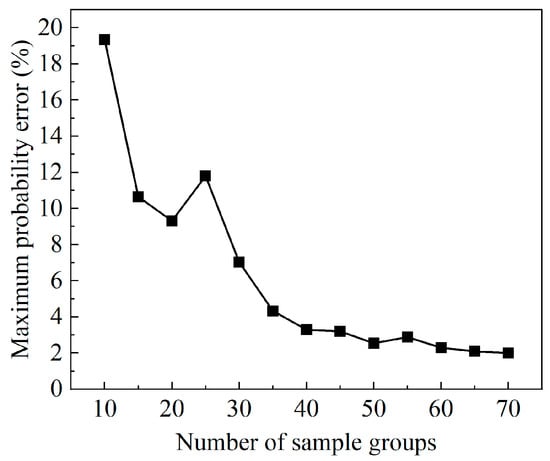
Figure 21.
The maximum probability error of seismic vulnerability curves versus the number of sample groups.
5.7. The Influence of Pre-Tension Force on Seismic Vulnerability
Results from the seismic performance analysis for the suspended filter capacitor have shown the noticeable influence of the pre-tension force of the bottommost suspension insulators on the seismic responses. In view of this, its influence on seismic vulnerability should be further investigated on the basis of the AdaBoost regressors. Therefore, the influence on the mean and standard deviation of responses, and on the vulnerability curves, is studied in the following parts.
5.7.1. The Influence on the Mean and Standard Deviation of Responses
In the previous research, fifty parameter combinations were determined by LHS, and each one was combined with the twenty ground motions. Therefore, the relationship between the mean values and the PGA was obtained, as well as the standard deviation, and that has been expressed in Figure 22. After that, change the pre-tension force from 20 kN to 80 kN at a step of 20 kN and the curves can be also obtained, as shown in Figure 22.
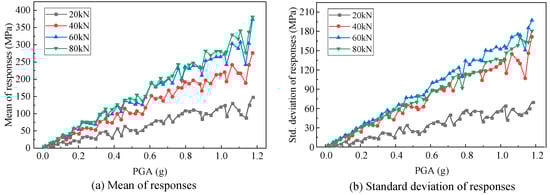
Figure 22.
The influence of the pre-tension force on the mean and standard deviation of responses.
At present, the data have not been predicted by AdaBoost regressors since the responses derive from the time history calculations, thereby the results represent the actual situation. In Figure 22, it is distinct that the mean value will increase as the PGA increases. When the pre-tension force increases from 20 kN to 40 kN, the mean and standard deviation values significantly increase at one PGA point, whereas there is a relatively small or zero increase when the pre-tension force is larger than 40 kN. The main reason is that the pre-tension force can increase the stiffness of the filter capacitor but its reinforcement influence would be weakened with increasing. In other words, the relationship between the stiffness and pre-tension is a nonlinear one with a gradually decreasing slope. When the pre-tension force is relatively small, its increase would significantly enhance the structural stiffness, however, once it meets the saturation, the structural stiffness would not nearly increase. The influence on standard deviation is also in the same way. This law is consistent with Figure 8 that exhibits the influence of the pre-tension force on responses.
5.7.2. The Influence on Seismic Vulnerability Curves Produced by the AdaBoost Regressor
Using the AdaBoost regressors obtained before, the seismic vulnerability curves with various pre-tension forces were acquired as shown in Figure 23. The scattered points derived from the AdaBoost regressors and the curves were fitted by log-normal distributions.
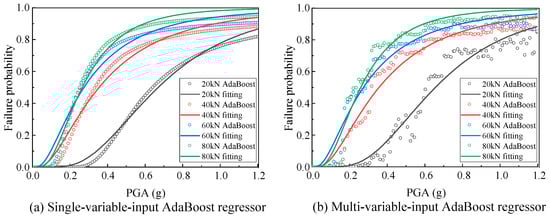
Figure 23.
The influence of the pre-tension force on the seismic vulnerability produced by the AdaBoost regressor.
It can be seen from Figure 23 that the results from single-variable-input regressors are close to those from multi-variable-input regressors. When the pre-tension force increases from 20 kN to 40 kN, the failure probability has a noticeable increase, especially in the PGA range from 0.1 g to 1.0 g. In particular, the failure probability increases by 39.7% and 39.6% (around 40%) at a PGA of 0.4 g using single- and multi-variable-input AdaBoost regressors, respectively. However, when the pre-tension force changes from 40 kN to 80 kN, the probability increase is relatively slow, and that reason is the same with the influence on the mean and standard deviation of responses. In addition, the large probability change with the variety of pre-tension forces occurs in the PGA range from 0.1 g to 1.0 g. The change in amplitude is relatively small at the small PGA and large PGA since the small PGA (<0.1 g) would not bring in damage to the filter capacitor and the large PGA (>1.0 g) would always result in a high seismic failure risk. Thereby, the prominent influence range of the pre-tension force on the seismic vulnerability is the PGA range from 0.1 g to 1.0 g. Therefore, from the fragility analysis results, increasing the pre-tension would significantly rise the seismic failure probability and failure risk. However, the previous investigations indicate that increasing the pre-tension can avoid the pressure generation in the suspended insulators and reduce the maximum displacement in earthquakes. This means that the design goal of the pre-tension is twofold, one is for reducing the horizontal displacement and another is for decreasing the seismic failure risk of the suspended insulators, but the effects are opposite. Therefore, an in-depth study on the balance of these two aspects should be carried out to identify an optimal scheme in the future.
6. Conclusions and Future Work
6.1. Conclusions
This paper fills the research gap in analyzing seismic responses of suspended substation equipment by considering an ±800 kV filter capacitor. It also proposes a vulnerability analysis method based on an adaptive boosting (AdaBoost) regressor for the filter capacitor. The AdaBoost regressors can consider the uncertainties of ground motions and multiple material parameters at the same time when deriving vulnerability curves. The efficiency and accuracy, compared with the traditional IDA, are validated by a case study on the filter capacitor. Specifically, the research conclusions are as follows:
- (1)
- The suspended insulators of the filter capacitor do not meet the seismic design requirement due to the safety factor slightly less than 1.67 recommended by Chinese code. It is recommended to reduce the pre-tension force for increasing the safety factor while ensuring the minimum axial force is larger than 0, which will also avoid the pressure stress in the insulators.
- (2)
- The effects of increasing the pre-tension force is twofold: one is avoiding the pressure generation in the suspended insulators and reducing the maximum displacement of the filter capacitor, another is increasing the seismic failure risk, so increasing pre-tension force should be carefully considered and studied by a balance analysis of the multifaceted influence.
- (3)
- The established AdaBoost regressors accurately predict the vulnerability curves as IDA does, and also reduce the computation cost. The single-variable-input regressor has a lower maximum probability prediction error of 2.55% compared to the multi-variable-input regressor’s error of 3.82%.
- (4)
- The failure risk of the filter capacitor will significantly increase as the pre-tension force increases from 20 kN, but the growth rate continues to fall. The increase in pre-tension force will increase the initial tension in the insulators so that the pressure could be reduced under a given earthquake. However, the tension increase in the insulators would make their stresses closer to the material strength, resulting in a higher failure risk. Due to the increased structural stiffness, the structural responses under a given earthquake will reduce, so the growth rate is gradually decreased.
6.2. Future Work
Although the proposed AdaBoost-based fragility analysis method is validated and compared by the traditional IDA method, some limitations remain as follows:
- (1)
- The selection of the AdaBoost regressor in this paper is based on its nonlinear fitting ability and advantages on small samples. In the future, some advanced machine learning algorithms can be employed to conduct comparative studies.
- (2)
- The simulation model developed in this case is validated only by the vibration frequencies of the similar structure. In the future, on-site tests can be performed to validate the simulation model.
- (3)
- This study considers only one failure mode, i.e., the failure of insulators. However, the steel members of the gantry may locally buckle or yield under extreme earthquakes. Therefore, the seismic fragility could be updated by considering multiple failure modes in the future.
- (4)
- This paper implements the proposed method using a suspended filter capacitor. In fact, its practicability can be further validated on other failure modes of other substation equipment, or general engineering structures.
Author Contributions
Software, Z.Y. and T.Y.; Investigation, C.H.; Writing—original draft, Q.Z.; Writing—review & editing, Y.M. All authors have read and agreed to the published version of the manuscript.
Funding
This study was supported by the Scientific Research Fund of Institute of Engineering Mechanics, China Earthquake Administration (2021D06) and Natural Science Foundation of Hunan Province (2025JJ90154).
Data Availability Statement
The data presented in this study are available on request from the corresponding author.
Conflicts of Interest
Author Quan Zhou was employed by the company China Construction Fifth Engineering Bureau Co., Ltd. Author Zhongkai Yin was employed by the company Shanghai Baoye Group Corp., Ltd. The remaining authors declare that the research was conducted in the absence of any commercial or financial relationships that could be construed as a potential conflict of interest.
References
- Shen, Y.; Gu, C.; Yang, X.; Zhao, P. Impact analysis of seismic events on integrated electricity and natural gas systems. IEEE Trans. Power Deliv. 2021, 36, 1923–1931. [Google Scholar] [CrossRef]
- Eidinger, J.; Davis, C.; Tang, A.; Kempner, L. M 9.0 Tohoku Earthquake March 11 2011 Performance of Water and Power Systems; G & E Engineering Systems Inc.: Oakland, CA, USA, 2012. [Google Scholar]
- Zhu, W.; Xie, Q.; Liu, X.; Mao, B.; Xue, Z. Towards 500 kV power transformers damaged in the 2022 Luding earthquake: Field investigation, failure analysis and seismic retrofitting. Nat. Hazards 2024, 120, 6275–6305. [Google Scholar] [CrossRef]
- Ersoy, S.; Saadeghvaziri, M.A. Seismic response of transformer-bushing systems. IEEE Trans. Power Deliv. 2004, 19, 131–137. [Google Scholar] [CrossRef]
- Wang, M.; He, J. Shake table test and finite element model for evaluating seismic performance of 220 kV transformer-bushing systems. Earthq. Spectra 2023, 39, 1755–1778. [Google Scholar] [CrossRef]
- Chun, N.; Jeon, B.; Kim, S.; Chang, S.; Son, S. Seismic response evaluation of 154 kV transformer porcelain bushing by shaking table tests. Struct. Eng. Mech. 2022, 84, 155–165. [Google Scholar]
- Zhu, W.; Xie, Q.; Lu, J. Seismic testing and fragility analysis considering material strength uncertainty of 1100 kV GFRP composite power transformer bushing. Case Stud. Constr. Mater. 2024, 21, e03564. [Google Scholar] [CrossRef]
- Li, S.; Cheng, Y.; Lu, Z.; Lam, N.; Xue, Y.; Wang, H. Full-scale testing on seismic performance of surge arrester with retrofitted composite insulators. Buildings 2022, 12, 1720. [Google Scholar] [CrossRef]
- Li, S.; Tsang, H.H.; Cheng, Y.; Lu, Z. Seismic testing and modeling of cylindrical electrical equipment with GFRP composite insulators. Compos. Struct. 2018, 194, 454–467. [Google Scholar] [CrossRef]
- He, C.; Xie, Q.; Jiang, L.; Jiang, L. Seismic terminal displacement of UHV post electrical equipment considering flange rotational stiffness. J. Constr. Steel Res. 2021, 183, 106701. [Google Scholar] [CrossRef]
- Bai, W.; Moustafa, M.A.; Dai, J. Seismic response of potential transformers and mitigation using innovative multiple tuned mass dampers. Eng. Struct. 2018, 174, 67–80. [Google Scholar]
- He, C.; He, Z.; Zhu, W. Seismic interconnecting effects of multi-span flexible conductor-post electrical equipment coupling system. J. Constr. Steel Res. 2024, 212, 108209. [Google Scholar] [CrossRef]
- Zhu, W.; Wu, M.; Xie, Q.; Xu, J. Floor response spectra and seismic design method of electrical equipment installed on floor in indoor substation. Soil Dyn. Earthq. Eng. 2023, 173, 108138. [Google Scholar] [CrossRef]
- Li, X.; Xie, Q.; Wen, J. Double friction pendulum-based isolation optimization for transformer-bushing systems. Eng. Struct. 2024, 320, 118909. [Google Scholar] [CrossRef]
- Alessandri, S.; Giannini, R.; Paolacci, F.; Malena, M. Seismic retrofitting of an HV circuit breaker using base isolation with wire ropes. Part 1, Preliminary tests and analyses. Eng. Struct. 2015, 98, 251–262. [Google Scholar] [CrossRef]
- Yang, Z.; Xie, Q.; He, C.; Xue, S. Numerical investigation of the seismic response of a UHV composite bypass switch retrofitted with wire rope isolators. Earthq. Eng. Eng. Vib. 2021, 20, 275–290. [Google Scholar] [CrossRef]
- Bai, W.; Dai, J.; Zhou, H.; Yang, Y.; Ning, X. Experimental and analytical studies on multiple tuned mass dampers for seismic protection of porcelain electrical equipment. Earthq. Eng. Eng. Vib. 2017, 16, 803–813. [Google Scholar] [CrossRef]
- Naeem, A.; Kim, J. Seismic retrofit of 3000 kVA power transformer using friction dampers and prestressed tendons. Structures 2021, 32, 641–650. [Google Scholar] [CrossRef]
- Yang, Z.; Xie, Q.; Zhou, Y.; Mosalam, K.M. Seismic performance and restraint system of suspended 800 kV thyristor valve. Eng. Struct. 2018, 169, 179–187. [Google Scholar] [CrossRef]
- Anagnos, T. Development of an Electrical Substation Equipment Performance Database for Evaluation of Equipment Fragilities; Report; Pacific Earthquake Engineering Center: Berkeley, CA, USA, 1999. [Google Scholar]
- Zareei, S.A.; Hosseini, M.; Ghafory-Ashtiany, M. Seismic failure probability of a 400 kV power transformer using analytical fragility curves. Eng. Fail. Anal. 2016, 70, 273–289. [Google Scholar] [CrossRef]
- Paolacci, F.; Giannini, R.; Alessandri, S.; De Felice, G. Seismic vulnerability assessment of a high voltage disconnect switch. Soil Dyn. Earthq. Eng. 2014, 67, 198–207. [Google Scholar] [CrossRef]
- Bai, W.; Moustafa, M.A.; Dai, J. Seismic fragilities of high-voltage substation disconnect switches. Earthq. Spectra 2019, 35, 1559–1582. [Google Scholar]
- He, C.; Jiang, L.Z.; Jiang, L.Q. Seismic failure risk assessment of post electrical equipment on supporting structures. IEEE Trans. Power Deliv. 2023, 38, 2757–2766. [Google Scholar] [CrossRef]
- He, C.; Liu, R.; He, Z. Seismic vulnerability assessment on porcelain electrical equipment based on Kriging model. Structures 2023, 55, 1692–1703. [Google Scholar] [CrossRef]
- Baghmisheh, A.G.; Khodaei, M.; Abadi, A.Z.F.; Estekanchi, H.E. Detailed seismic risk analysis of electrical substation equipment using a reliability based approach. Earthq. Eng. Eng. Vib. 2023, 22, 495–511. [Google Scholar] [CrossRef]
- Zhu, L.; Du, Y.; Gao, L.; Zhuang, Z.; Ji, S. Vibration distribution detection method for turn-to-turn short-circuit fault of dry-type air-core filter reactors. IEEE Trans. Power Deliv. 2022, 37, 4474–4476. [Google Scholar] [CrossRef]
- Zhang, Z.; Li, J.; Song, Y.; Sun, Y.; Zhang, X.; Hu, Y.; Guo, R.; Han, X.T. A novel ultrasound-vibration composite sensor for defects detection of electrical equipment. IEEE Trans. Power Deliv. 2022, 37, 4477–4480. [Google Scholar] [CrossRef]
- Zhu, W.; Xie, Q.; Liu, X. Seismic failure risk analysis of ± 800 kV coupling filter circuit considering material strength deviation. Structures 2023, 47, 1566–1578. [Google Scholar] [CrossRef]
- Liang, H.; Xie, Q. System vulnerability analysis simulation model for substation subjected to earthquakes. IEEE Trans. Power Deliv. 2022, 37, 2684–2692. [Google Scholar] [CrossRef]
- Liu, X.; Xie, Q. A probabilistic framework to evaluate seismic resilience of substations based on three-stage uncertainty. Reliab. Eng. Syst. Saf. 2024, 249, 110219. [Google Scholar] [CrossRef]
- Liu, X.; Xie, Q. A multi-model probabilistic framework to evaluate seismic resilience of UHV converter stations. Eng. Struct. 2024, 300, 117153. [Google Scholar] [CrossRef]
- Ibrahim, Y.E. Seismic risk analysis of multistory reinforced concrete structures in Saudi Arabia. Case Stud. Constr. Mater. 2018, 9, e00192. [Google Scholar] [CrossRef]
- Rong, X.L.; Yang, J.; Jun, L.; Zhang, Y.-X.; Zheng, S.-S.; Dong, L. Optimal ground motion intensity measure for seismic assessment of high-rise reinforced concrete structures. Case Stud. Constr. Mater. 2023, 18, e01678. [Google Scholar] [CrossRef]
- Wen, J.; Li, X.; Xue, J. Feasibility evaluation of Copula theory for substation equipment with multiple nonlinear-related seismic response indexes. Reliab. Eng. Syst. Saf. 2024, 247, 110132. [Google Scholar] [CrossRef]
- Valente, M. Seismic vulnerability assessment and earthquake response of slender historical masonry bell towers in South-East Lombardia. Eng. Fail. Anal. 2021, 129, 105656. [Google Scholar] [CrossRef]
- da Silva, L.C.M.; Milani, G.; Lourenço, P.B. Lourenço, Probabilistic-based discrete model for the seismic fragility assessment of masonry structures. Structures 2023, 52, 506–523. [Google Scholar] [CrossRef]
- Mohamed, H.; Skoulidou, D.; Romão, X. Quantification of the effects of different uncertainty sources on the seismic fragility functions of masonry-infilled RC frames. Structures 2023, 50, 1069–1088. [Google Scholar] [CrossRef]
- Yan, Y.; Xia, Y.; Sun, L. Hierarchical and mixed uncertainty quantification for simulation-based structural seismic fragility analysis. Eng. Struct. 2024, 316, 118579. [Google Scholar] [CrossRef]
- Valente, M. Earthquake response and damage patterns assessment of two historical masonry churches with bell tower. Eng. Fail. Anal. 2023, 151, 107418. [Google Scholar] [CrossRef]
- Zhao, Y.G.; Qin, M.J.; Lu, Z.H.; Zhang, L.W. Seismic fragility analysis of nuclear power plants considering structural parameter uncertainty. Reliab. Eng. Syst. Saf. 2021, 216, 107970. [Google Scholar] [CrossRef]
- Aktaş, A. Statistical analysis of bearing strength of glass-fiber composite materials. J. Reinf. Plast. Compos. 2007, 26, 555–564. [Google Scholar] [CrossRef]
- Zhu, W.; Xie, Q. Machine learning chain models for multi-response prediction of electrical equipment in substation subjected to earthquakes. Eng. Struct. 2024, 319, 118815. [Google Scholar] [CrossRef]
- Zhu, W.; Xie, Q. Post-earthquake rapid assessment for loop system in substation using ground motion signals. Mech. Syst. Signal Process. 2024, 208, 111058. [Google Scholar] [CrossRef]
- Quinci, G.; Paolacci, F.; Phan, H.N. Artificial neural network technique for seismic fragility analysis of a storage tank supported by multi-storey frame. J. Press. Vessel Technol. 2023, 145, 061901. [Google Scholar] [CrossRef]
- Sediek, O.A.; Wu, T.Y.; McCormick, J.; El-Tawil, S. Prediction of seismic collapse behavior of deep steel columns using machine learning. Structures 2022, 40, 163–175. [Google Scholar] [CrossRef]
- Liu, C.; Macedo, J. Machine learning-based models for estimating seismically-induced slope displacements in subduction earthquake zones. Soil Dyn. Earthq. Eng. 2022, 160, 107323. [Google Scholar] [CrossRef]
- Zhang, L.; Shen, J.; Zhu, B. A review of the research and application of deep learning-based computer vision in structural damage detection. Earthq. Eng. Eng. Vib. 2022, 21, 1–21. [Google Scholar]
- GB 50260-2013; Code for Seismic Design of Electrical Installation. China Planning Publishing House: Beijing, China, 2013.
- IEEE 693 Standard; Recommended Practice for Seismic Design of Substations. Institute of Electrical and Electronics Engineers: New York, NY, USA, 2018.
- Xie, Q.; Wang, Y.F.; Wei, S.H. Seismic failure analysis on substation equipment interconnected by flexible conductor. In Proceedings of the 2009 International Conference on Sustainable Power Generation and Supply, Nanjing, China, 6–7 April 2009; IEEE: Piscataway, NJ, USA, 2009; pp. 1–6. [Google Scholar]
- Xie, Q.; Zhu, R. Earth, wind, and ice. IEEE Power Energy Mag. 2011, 9, 28–36. [Google Scholar] [CrossRef]
- Yang, Z.; Xie, Q.; He, C.; Ma, G. Seismic response analysis of ±800 kV UHVDC converter valves. Proc. CSEE 2016, 36, 1836–1841. [Google Scholar]
- Quinci, G.; Paolacci, F.; Fragiadakis, M.; Bursi, O.S. A machine learning framework for seismic risk assessment of industrial equipment. Reliab. Eng. Syst. Saf. 2025, 254, 110606. [Google Scholar] [CrossRef]
- Zhu, W.; Bian, X.; Xie, Q. Refined seismic fragility curves of substation equipment considering ground motion classifications. Soil Dyn. Earthq. Eng. 2024, 187, 108995. [Google Scholar] [CrossRef]
- Gohil, P.P.; Shaikh, A.A. Strength characterization of fibers and fibrous materials: Experimental-reliability based novel approach. Mater. Des. 2013, 51, 105–112. [Google Scholar] [CrossRef]
- Lu, C.; Danzer, R.; Fischer, F.D. Fracture statistics of brittle materials: Weibull or normal distribution. Phys. Rev. E 2002, 65, 067102. [Google Scholar] [CrossRef] [PubMed]
- Bermejo, R.; Supancic, P.; Danzer, R. Influence of measurement uncertainties on the determination of the Weibull distribution. J. Eur. Ceram. Soc. 2012, 32, 251–255. [Google Scholar] [CrossRef]
- Freund, Y.; Schapire, R.E. A decision-theoretic generalization of on-line learning and an application to boosting. J. Comput. Syst. Sci. 1997, 55, 119–139. [Google Scholar] [CrossRef]
- Somerville, P.G. Development of Ground Motion Time Histories for Phase 2 of the FEMA/SAC Steel Project; SAC Joint Venture: Richmond, CA, USA, 1997. [Google Scholar]
- Myles, A.J.; Feudale, R.N.; Liu, Y.; Woody, N.A.; Brown, S.D. An introduction to decision tree modeling. J. Chemom. A J. Chemom. Soc. 2004, 18, 275–285. [Google Scholar] [CrossRef]
Disclaimer/Publisher’s Note: The statements, opinions and data contained in all publications are solely those of the individual author(s) and contributor(s) and not of MDPI and/or the editor(s). MDPI and/or the editor(s) disclaim responsibility for any injury to people or property resulting from any ideas, methods, instructions or products referred to in the content. |
© 2025 by the authors. Licensee MDPI, Basel, Switzerland. This article is an open access article distributed under the terms and conditions of the Creative Commons Attribution (CC BY) license (https://creativecommons.org/licenses/by/4.0/).