Abstract
As industrial systems grow larger and more interconnected, timely fault detection is essential to minimize downtime, enhance reliability, and reduce costs. However, conventional methods focus on reactive maintenance, limiting their ability to detect faults before escalation. Additionally, fault propagation in large-scale systems can degrade detection performance. To address these challenges, we propose an auto-associative shared nearest neighbor kernel regression method for fault detection in complex industrial processes. Inspired by attention mechanisms, the proposed approach assigns higher weights to relevant training data. Shared nearest neighbor is used to assess similarity between faults and training data, rescaling distances accordingly. These adjusted distances are then utilized in auto-associative kernel regression for fault detection. The performance of the proposed method is evaluated by applying it to benchmark data from the Tennessee Eastman Process and a real-world, unplanned shutdown case concerning a circulating fluidized bed boiler. The experimental results show that the proposed method can detect anomalies up to 2 h earlier than conventional fault detection methods.
1. Introduction
As industrial systems expand, the interdependence between facilities is increasing [1]. The interconnectivity of these systems enhances productivity and efficiency by enabling real-time information sharing for process operation. However, this integration also introduces vulnerabilities. The tightly coupled nature of modern industrial systems increases the risk of fault propagation, where an issue in one component can spread across interconnected systems, amplifying its impact and potentially causing large-scale failures. Even minor faults can disrupt operations and, if not addressed, propagate through interconnected systems. Therefore, effective fault detection techniques are essential to mitigating risks and ensuring stable operation. For example, a power generation system consisting of various equipment such as turbines, compressors, and generators may fail due to equipment wear, failure in particle size control devices, or lack of lubrication. A malfunction in a turbine can cause a drop in power generation, which, in turn, may trigger an overload in connected compressors and generators. This can result in a reduction in overall system efficiency, increased wear on equipment, and potentially, a system-wide shutdown if not addressed promptly. In particular, circulating fluidized bed combustion (CFBC) boilers are prone to failure risks such as fouling, corrosion, erosion, scaling, and tube leakage due to erosive action in the circulating bed. Typically, faults develop gradually until they become catastrophic, making them difficult for operators to identify [2,3,4]. Furthermore, depending on the source of the fault, the rate of propagation of the fault variable can vary, with the fault variable rising rapidly before the power generation system shuts down. As a result, early fault detection technologies are essential to maintaining the reliability of industrial systems and minimizing potential losses. Timely fault detection plays a crucial role in ensuring reliability and cost-effectiveness across industries. Consequently, industries are placing significant emphasis on fault detection and diagnosis (FDD) [5,6,7,8,9].
As shown in Figure 1, a fault is defined as a state in which at least one characteristic of the target system deviates from its normal operating condition [10]. The types of faults are divided into driftwise, stepwise, malfunction, and failure [11]. Driftwise and stepwise faults occur in the form of a sudden or gradual increase in fault magnitude. These faults can develop into a malfunction or failure over time. In the case of a malfunction, specific variables exhibit intermittent failure characteristics, whereas failure means that the target system is completely offline. Therefore, FDD techniques capable of identifying early warning signs before the target system enters a state of failure are required. The main objective of FDD is to analyze sensor data patterns to assist field operators in taking appropriate actions. Fault detection methods are categorized into physical and data-driven approaches. Physical methods build models that describe the physical nature of failures based on hardware information such as design criteria, thresholds, and fault mechanisms. Widely used physical methods include parity equations [12], diagnostic observers [13], structural graphs, parameter estimation [14], and correlation coefficient method [15]. These methods can provide accurate results if they precisely capture the system’s dynamics. However, their application in real industrial environments faces several challenges; first, industrial systems are often highly complex, incorporating numerous interconnected components with nonlinear and time-varying behavior. Accurately modeling such systems requires extensive knowledge of physical properties, material behaviors, and operational conditions, making the formulation of an accurate model challenging. Additionally, unexpected environmental changes, sensor noise, and manufacturing variations can cause discrepancies between the theoretical model and the actual system, reducing the model’s reliability. Second, real-world industrial processes are influenced by numerous external factors, such as aging components, human intervention, and varying operational conditions, which cannot always be incorporated into a predefined physical model. As a result, physical methods struggle to generalize across different operating scenarios and may fail to detect unforeseen faults that deviate from predefined fault patterns. In contrast to physical methods, data-driven methods do not require expert knowledge of system design and have the potential to yield superior performance when large amounts of data are available. Recently, with high-quality data readily available through distributed control systems, fault detection research has gained significant attention. In general, methods such as principal component analysis (PCA), independent component analysis (ICA), and partial least squares (PLS) have been proposed for application to industrial processes. Over the past decades, these methods have been successfully applied to a variety of industrial processes [16,17,18,19]. Recently, improved methods have been proposed for application to complex processes. Guo [20] proposed WDPCA, which adds a weighted difference normalization method to the conventional PCA. Zhu [21] introduced the k-ICA-PCA method, which combines ICA and PCA to classify the operating modes of a process. Other improvements to traditional methods, such as overlapping PCA, sub-PCA, and multiple PCA, have been proposed [22,23,24,25,26,27,28]. However, statistical methods require assumptions about data distribution. In addition, it is difficult to perform accurate fault detection due to the smearing effect of the fault variable.
Figure 1.
Development of the events (driftwise, stepwise, malfunction, and failure) from a fault [10].
Compared to statistical methods, distance-based methods offer several advantages: (1) the model is simple and intuitive, making it easy to interpret; (2) they do not require prior assumptions about the data; (3) they require fewer computational resources, enabling real-time processing. Due to these advantages, the use of distance-based methods for fault detection is steadily increasing. Tang [29] proposed a connectivity-based factor to solve the problem of performance degradation when faulty data have the density of healthy data. Tong [30] introduced a method to detect faults using k-means clustering. Chiu [31] applied the grid method to conventional local outlier factor (LOF) to provide intuitive information about outliers. Yu [32] applied auto-associative kernel regression (AAKR) for fault detection in thermal power plants. These methods use training data to set thresholds for fault detection. However, when faulty data are adjacent to healthy data, they may be misclassified as normal. Therefore, there is a need for a method that can assign appropriate weights to fault data based on their similarity to training data.
In the field of natural language processing, the attention technique has gained significant focus; this technique increases the weight of the training data that are the most relevant to the given sample [33]. Attention is a method that gives higher weights to important words to dynamically reflect the relationships between words in a sentence. In this paper, inspired by the weighting scheme of attention, we aimed to assign higher weights to training data similar to the fault data when applying distance-based weighting in the data-driven method AAKR. To this end, we used shared nearest neighbor (SNN), which compares the similarity between fault and training data, and rescaled the distance metric based on the number of shared neighbors. The rescaled distances are applied in assigning weights within AAKR to calculate the estimated vector and detection index for fault detection. The advantages of the proposed method are as follows.
- By weighting the training data according to their shared neighbors, the significance of fault data is enhanced.
- The method is robust to outliers, including faulty data.
- By weighting neighbors based on their distances, the method can effectively detect faults in data that are close to healthy data.
- It can improve the limitations of conventional AAKR and distance-based methods that rely on simple distance measurements.
- Effective fault detection can be performed even when healthy and faulty data are close together.
The performance of the proposed method is evaluated by applying it to the Tennessee Eastman Process (TEP), a benchmark dataset widely used in the field of fault detection, and a real-world fault case in a circulating fluidized bed. The false alarm rate and fault detection rate are compared for normal data in both cases.
The remainder of this paper is organized as follows. Section 2 describes the conventional AAKR, and Section 3 provides a fault threshold for fault detection. Section 4 explains the proposed method, and Section 5 analyzes the experimental results comparing the conventional methods and proposed method on benchmark data and actual failure data. Finally, Section 6 discusses conclusions and future work.
2. AAKR-Based Method for Fault Detection
AAKR is a lazy learning method that uses training data stored in memory to calculate the similarity of query vectors and then assigns higher weights to the training data with the highest similarity. In contrast to eager learning algorithms, such as artificial neural networks (ANNs), support vector machines (SVMs), and group method of data handling, AAKR can compute predictions by building different local models based on query vectors that are input in real-time.
Owing to these advantages, AAKR can also be applied to complex processes such as time-varying processes and multimodal processes. The fault detection procedure using AAKR is shown in Figure 2.
Figure 2.
Fault detection procedure using AAKR.
AAKR uses training data stored in memory. The training data consist of process data under normal operation. They are used to calculate the similarity of query vectors input in real-time. Several types of distance functions are available, including Euclidean, Mahalanobis, and Chebychev. Equation (1), for calculating the distance, is presented as follows.
where is the distance between the i-th training data () and query vector (). The smaller the distance, the more similar the training data. For example, a large indicates a low similarity. The similarity obtained from the distance function is used to assign weights, as shown in Equation (2) [34]. Common weighting functions include Gaussian, exponential, and uniform. If the query vector is far from the training data, a low weight is assigned.
where h is the bandwidth parameter that controls the width of the weighting function. When h is large, a high weight is assigned to numerous training data, which can reduce the accuracy of fault detection. Therefore, the performance of AAKR depends on h, making it critical to determine an appropriate value. In this study, h was optimized by minimizing the error using k-fold cross validation, a widely used technique. Using the similarities and weights obtained from Equations (1) and (2), the estimated vector of query vectors is derived from Equation (3).
where indicates the query vector and the corresponding estimated vector derived from the training data. The estimated vector refers to the difference between the actual measured value and the value predicted by AAKR, which is defined as the residual error. A smaller residual error indicates that the query vector closely matches the training data, allowing it to be classified as normal. Finally, the residual vector is obtained using Equation (4). In this paper, leave-one-out cross validation, which is a specific form of k-fold cross validation, is employed to generate residuals from the training data.
where is the residual vector calculated as the difference between the query vector and the estimated vector. It is used in the squared prediction error (SPE), which serves as a detection index for fault detection.
3. Detection Index Using Kernel Density Estimation
In this section, we describe KDE, a confidence limit value for fault detection. KDE was introduced by Rosenblatt [35] and Parzen [36] to estimate the probability distribution function across the entire sample. KDE offers several advantages, such as the ability to estimate probability distributions smoothly without making strong assumptions about the raw data. By using KDE, the distribution of the training data can be estimated, making it applicable for setting fault detection thresholds. As a result, KDE has been widely applied in fault detection to establish fault thresholds [37]. The probability density function (PDF) and cumulative distribution function (CDF) estimates using KDE are provided by Equations (5) and (6).
where is the kernel function, and h and n are the smoothing parameter and the number of samples, respectively. In this paper, we used the “ksdensity” function built into the MATLAB statistical and machine learning toolbox to estimate the distribution of the data. The significance level (α) for the threshold was set to 0.01.
5. Experimental Results and Discussion
In this paper, we compare the performance of PCA, kNN, LOF, AASKR without penalty (AASKR–NP), and AASKR on the TEP simulation data, a benchmark dataset widely used in fault detection research to evaluate the proposed method. Fault detection performance is assessed by comparing type I (false alarm) and type II (miss detection) errors through hypothesis testing. Type I error refers to instances where normal operating conditions are incorrectly classified as faults, indicating the model’s tendency to generate false alarms. A low type I error suggests that the model is stable in normal regions and does not frequently trigger unnecessary fault warnings, ensuring operational stability and trustworthiness. Conversely, a type II error occurs when actual faults go undetected, reflecting the model’s ability to identify abnormal conditions. A low type II error is essential for ensuring that faults are reliably detected before they cause significant damage or system failures. Type I and type II errors have a trade-off relationship; we averaged these two metrics to evaluate the overall fault detection performance. The second experiment compares the early fault detection times between the conventional and proposed methods for an unplanned shutdown case in a fluidized bed boiler. The fault detection performance for artificially generated faults in TEP was compared. In this experiment, we assessed how much earlier the proposed method can detect fault signs compared to the actual boiler shutdown time. Both experiments were conducted using MATLAB R2021a.
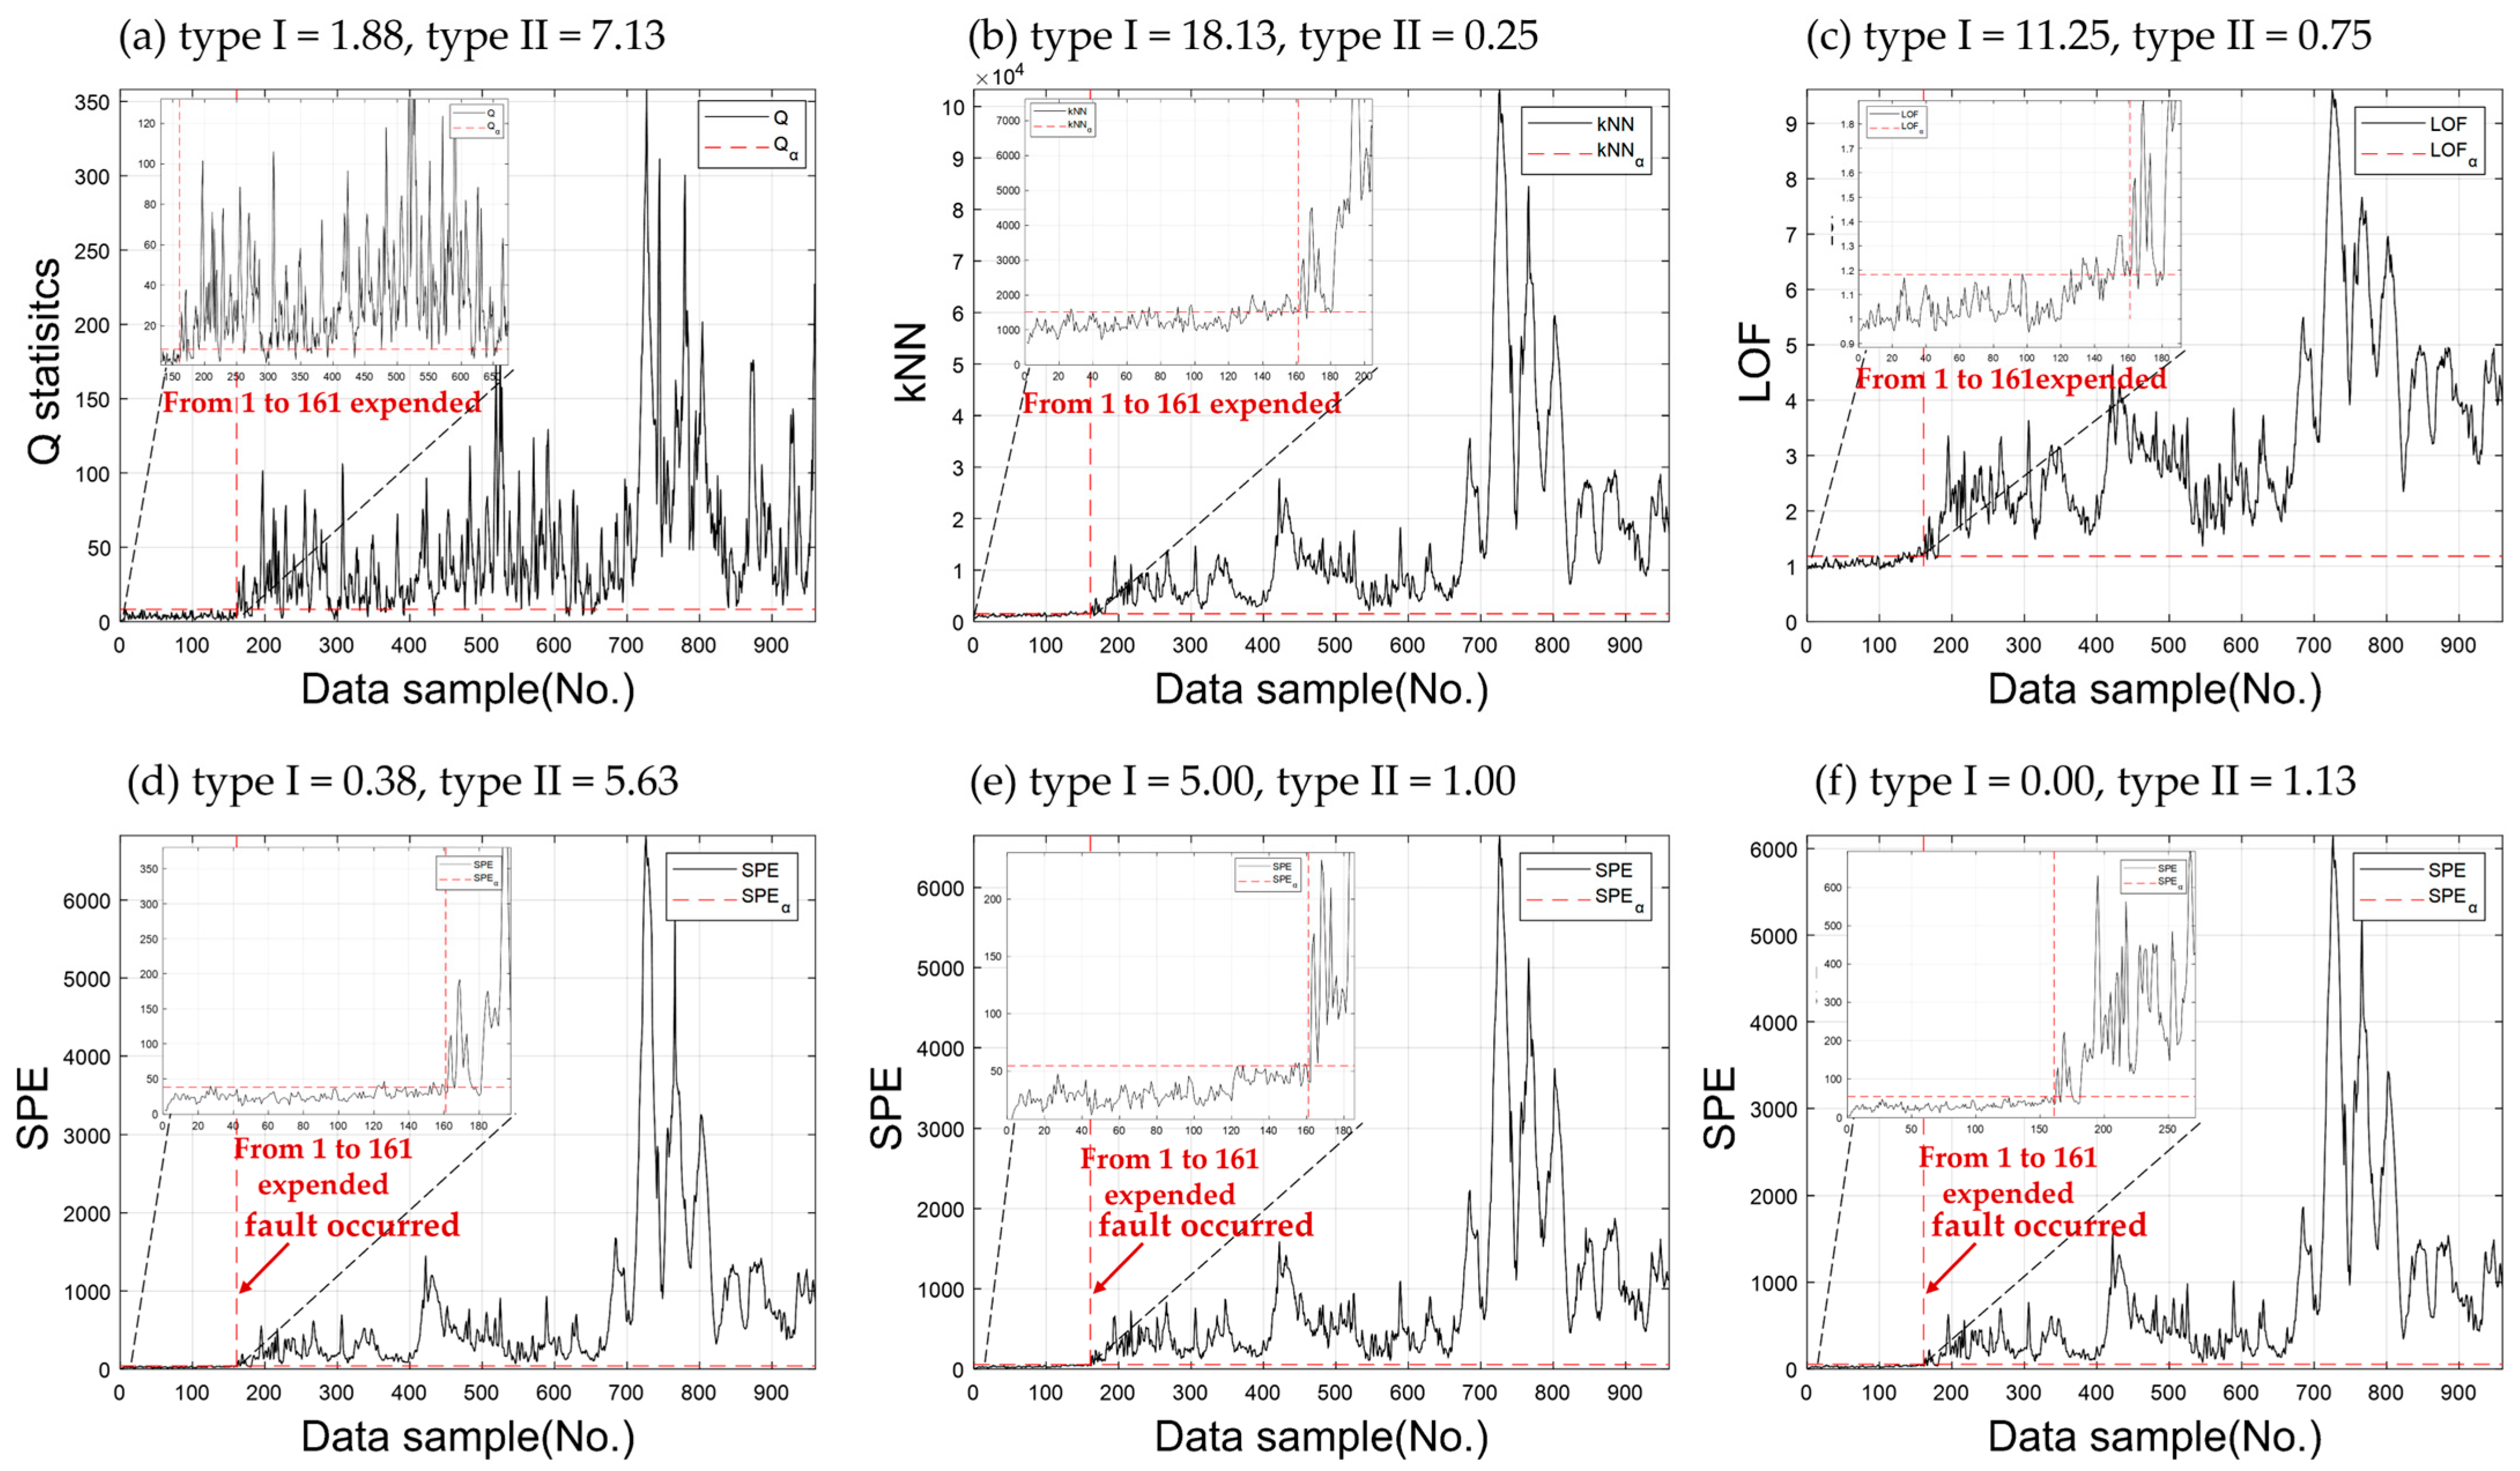
5.1. Benchmark Simulation Data: Tennessee Eastman Process
TEP is an industrial process simulation dataset that is widely used in the field of fault detection [38]. These benchmark data are essential because obtaining fault cases from real large-scale processes is challenging. Developed by Eastman Chemical Company, TEP simulates data collected at specific times of failure, closely resembling those of real industrial processes. For patent-related reasons, TEP data are based on simulations of real industrial processes, including their components, dynamics, and operating conditions. The primary equipment of process includes reactors, coolers, and compressors, and the TEP control structure is illustrated in Figure 6.
Figure 6.
Control structures of TEP [38].
The TEP comprises 52 process variables, all of which are contaminated with Gaussian noise. The dataset includes 21 types of predefined faults, of which 16 have known causes, while the remaining 5 are of unknown origin. For instance, faults from 8 to 12 result from increased variability in process variables, and fault 13 is attributed to an issue in the reactor. As described above, TEP simulations represent cases where a fault arises from an individual process or a combination of multiple processes. For each fault scenario, the TEP simulation confirms whether the fault detection method can effectively identify the fault. The training and validation data for TEP are available at https://doi.org/10.7910/DVN/6C3JR1 (accessed on 16 December 2024).
The stepwise faults (TEP faults 1–6) involve staircase function faults in specific variables, making them easier to detect compared to other cases. These faults alter the distribution of related variables such as material balance, levels, and pressures. In Figure 7c, the distance-based method, LOF, showed a higher type I error in the normal section than other models. Despite the simplicity of this case, such false alarms can confuse operators, reducing model reliability. As shown in Figure 7, all fault detection models successfully detect faults, as indicated by a type II error of zero in all six models. Among them, AASKR demonstrates lower false alarms and no miss detections, outperforming the conventional AAKR. When comparing the average type I and II errors for faults 1 to 6, kNN (type I = 8.75, type II = 18.44) and LOF (type I = 5.73, type II = 28.08) need improvement in both false alarm and miss detection rates. The performance of AAKR (type I = 2.09, type II = 26.63) and AASKR–NP (type I = 1.57, type II = 26.75) is similar to that of the proposed method. However, the proposed method outperforms the others, with an average type I error of 0.84 and type II error of 26.48, which are the lowest among the models.
Figure 7.
Comparison of fault detection performance between conventional and proposed methods for the TEP Fault 6 case: (a) PCA; (b) kNN; (c) LOF; (d) AAKR; (e) AASKR–NP; (f) AASKR.
The TEP fault cases from 1 to 6 involve irregularly shaped faults with random variation. These faults result from changes in flow rate, reactor, and condenser cooler temperatures. Accordingly, Figure 8 shows greater variability in the faults compared to Figure 7. In Figure 8a, PCA calculates the largest type II error among all models. Although kNN and LOF calculate low type II errors, their high type I errors make them unsuitable as reliable fault detection models. On the other hand, AASKR, as shown in Figure 8f, calculates both lower type II errors and fewer false alarms compared to the other models. Discussing the average type I and II errors for faults 8 to 12, PCA calculates a high miss detection rate, with an average type II error of 38.23, the largest among all models. This performance degradation is primarily due to the smearing effect in complex industrial processes, where fault signatures are distributed across multiple principal components. As a result, determining fault conditions becomes challenging, leading to an increased type II error. As shown in the results of Figure 8b,c, kNN and LOF show type I errors of 23.75 and 22.88, respectively, indicating they do not demonstrate sufficient reliability on the training data, making it difficult to consider them reliable fault detection models. This performance limitation arises because kNN and LOF select neighbors strictly based on a predefined k value, without considering the relative position of fault data. As a result, they utilize the distances of all selected neighbors, leading to reduced accuracy in fault detection. AAKR calculates type I and II errors of 3.63 and 32.25, respectively, similar to AASKR–NP (type I = 3.00, type II = 32.55). As shown in Figure 8f, these results indicate that AASKR does not provide significant improvement without applying a penalty to the distance value.
Figure 8.
Comparison of fault detection performance between conventional and proposed methods for the TEP Fault 12 case: (a) PCA; (b) kNN; (c) LOF; (d) AAKR; (e) AASKR–NP; (f) AASKR.
The proposed method calculates a type I error that is 1.5%p higher than AASKR–NP but a type II error of 29.48%p, which is 2.07%p lower than AAKR and 3.07%p lower than AASKR–NP. This demonstrates that the proposed method improves the fault detection performance of AAKR. Table 1 compares the type I and II errors of the proposed method with conventional methods across 21 fault cases in TEP. For a comparison of fault detection performance, the fault thresholds for each model were set at a 99% confidence limit value (α = 0.01). In TEP, fault cases 3, 9, and 15 show high type II errors for all detection models, as shown in Table 1, due to the difficulty in identifying fault-related signs from the data. When comparing the type I and II errors for each model across 18 fault cases, excluding cases 3, 9, and 15, the proposed method outperforms all others, except LOF and kNN, which have high type I and II errors.
Table 1.
(TEP) Performance indices of the conventional and proposed methods (lower is better).
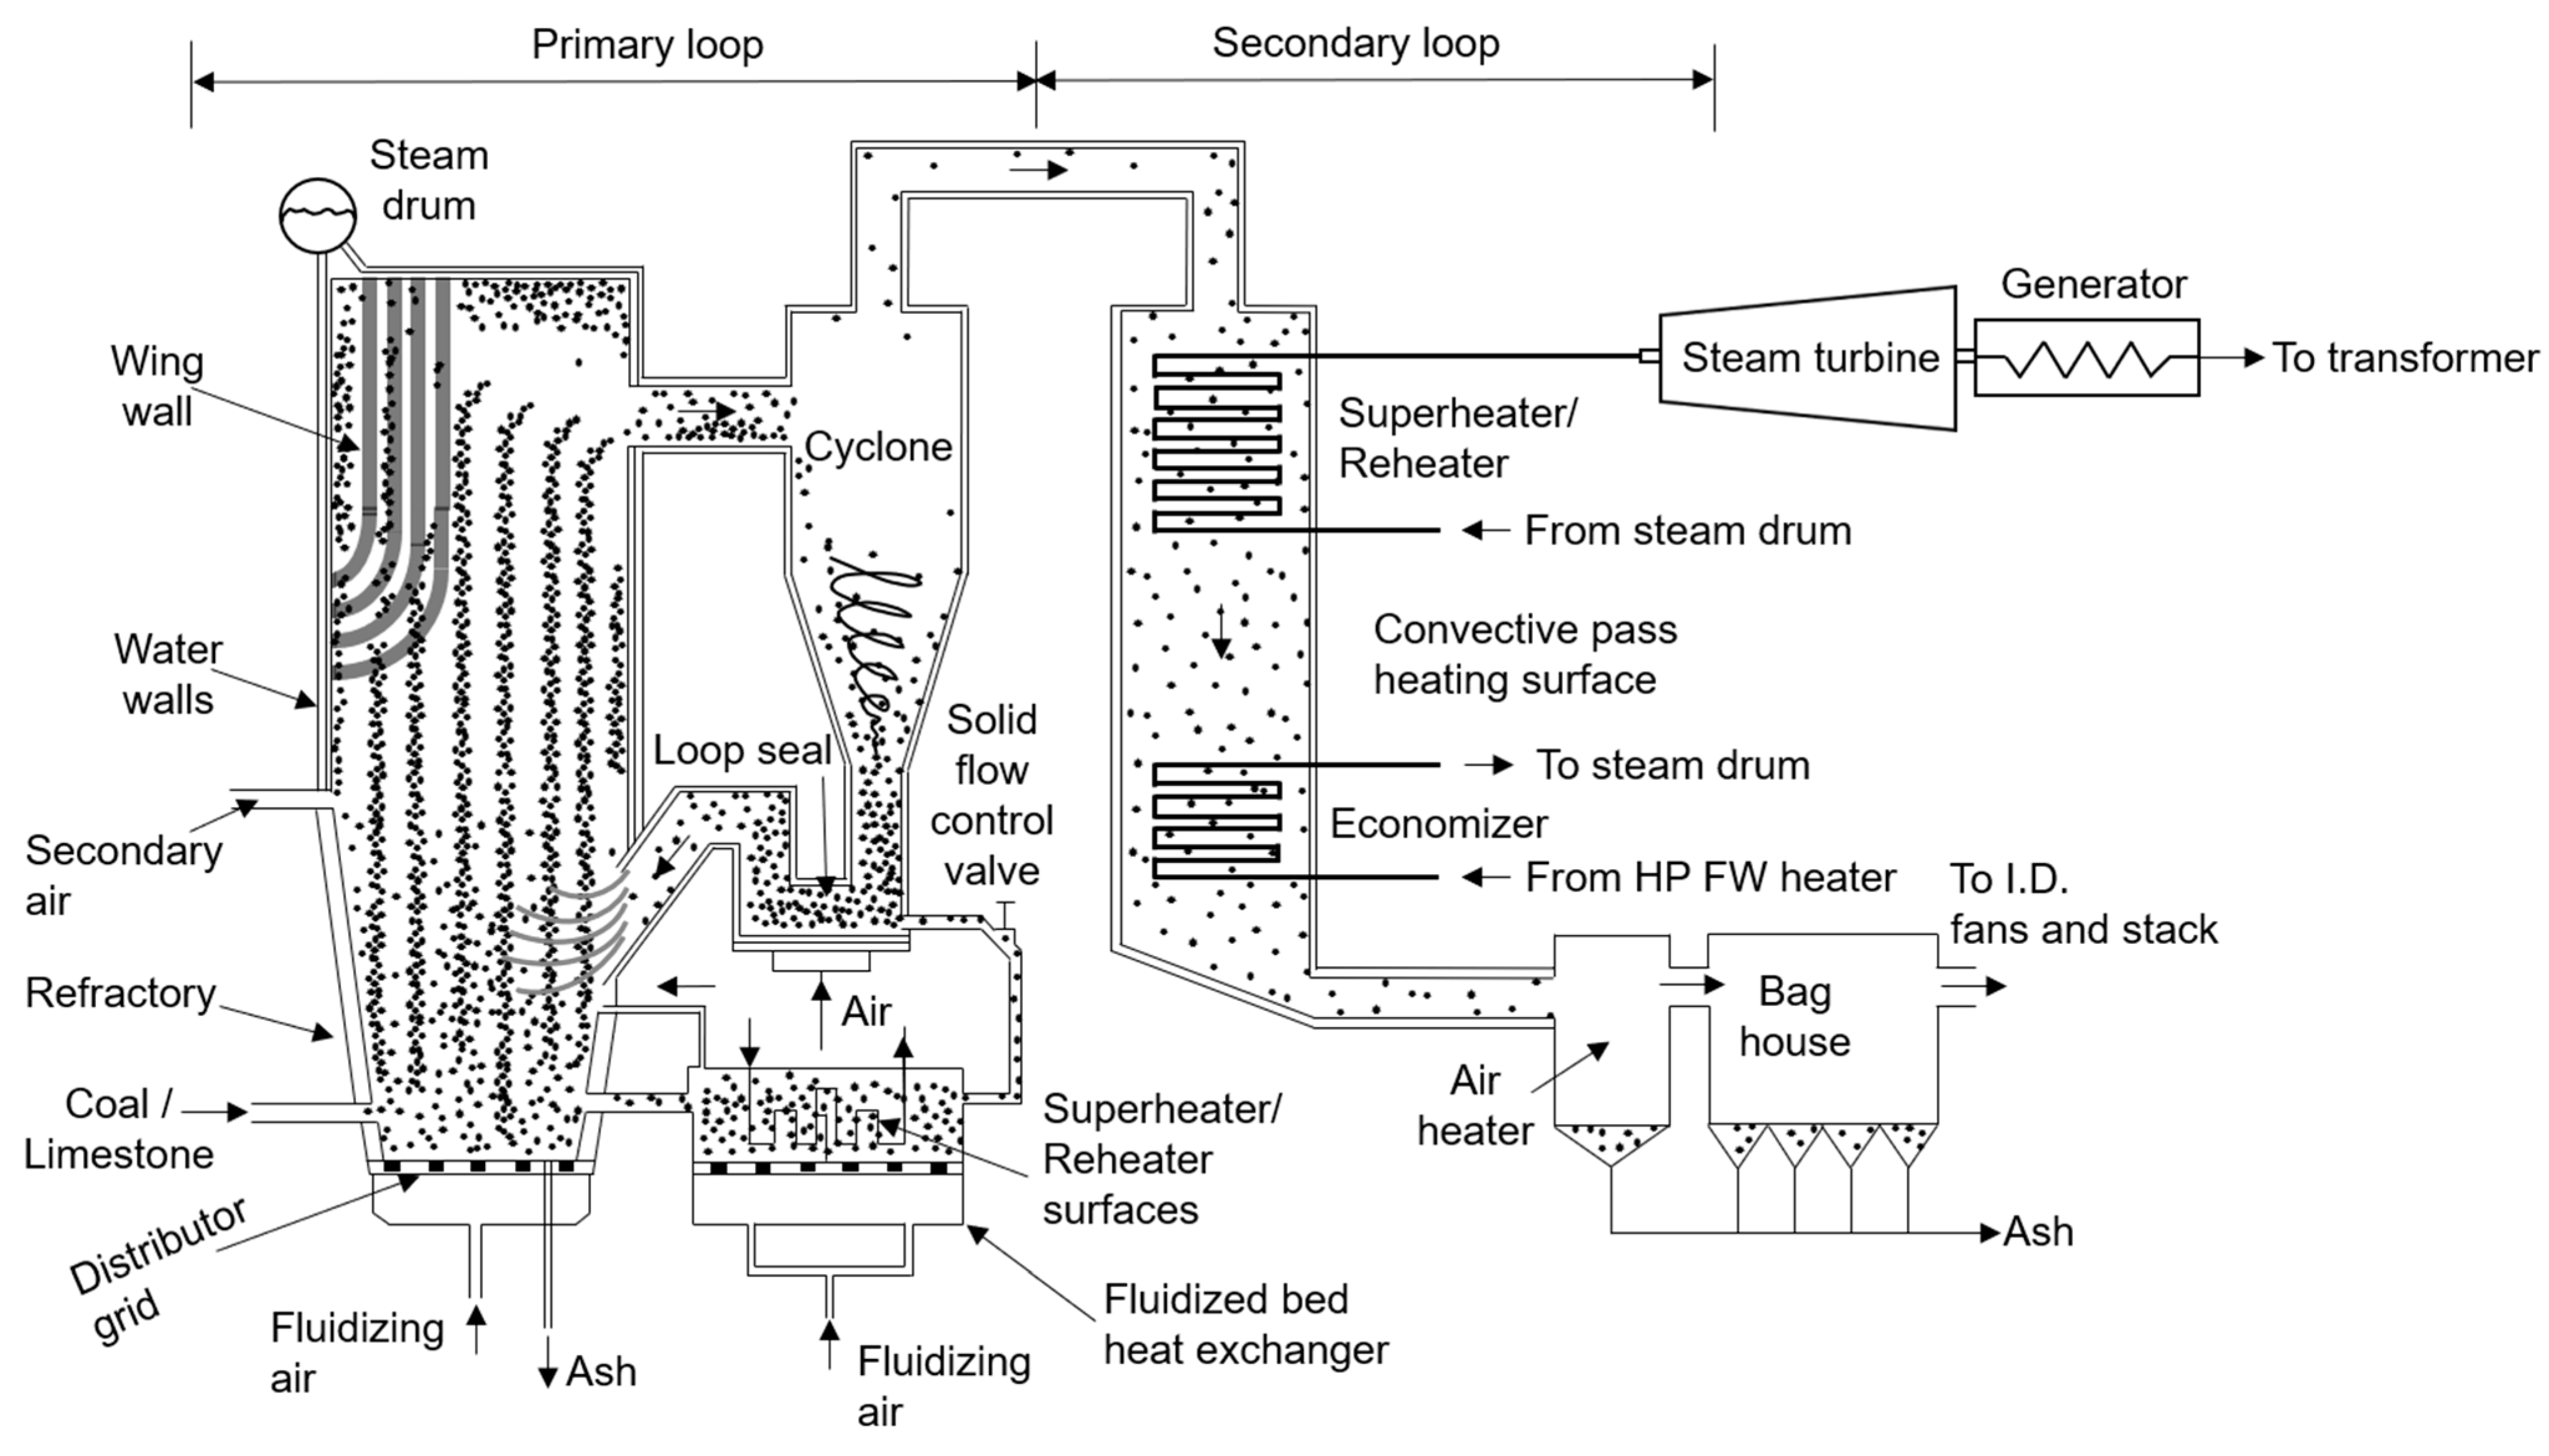
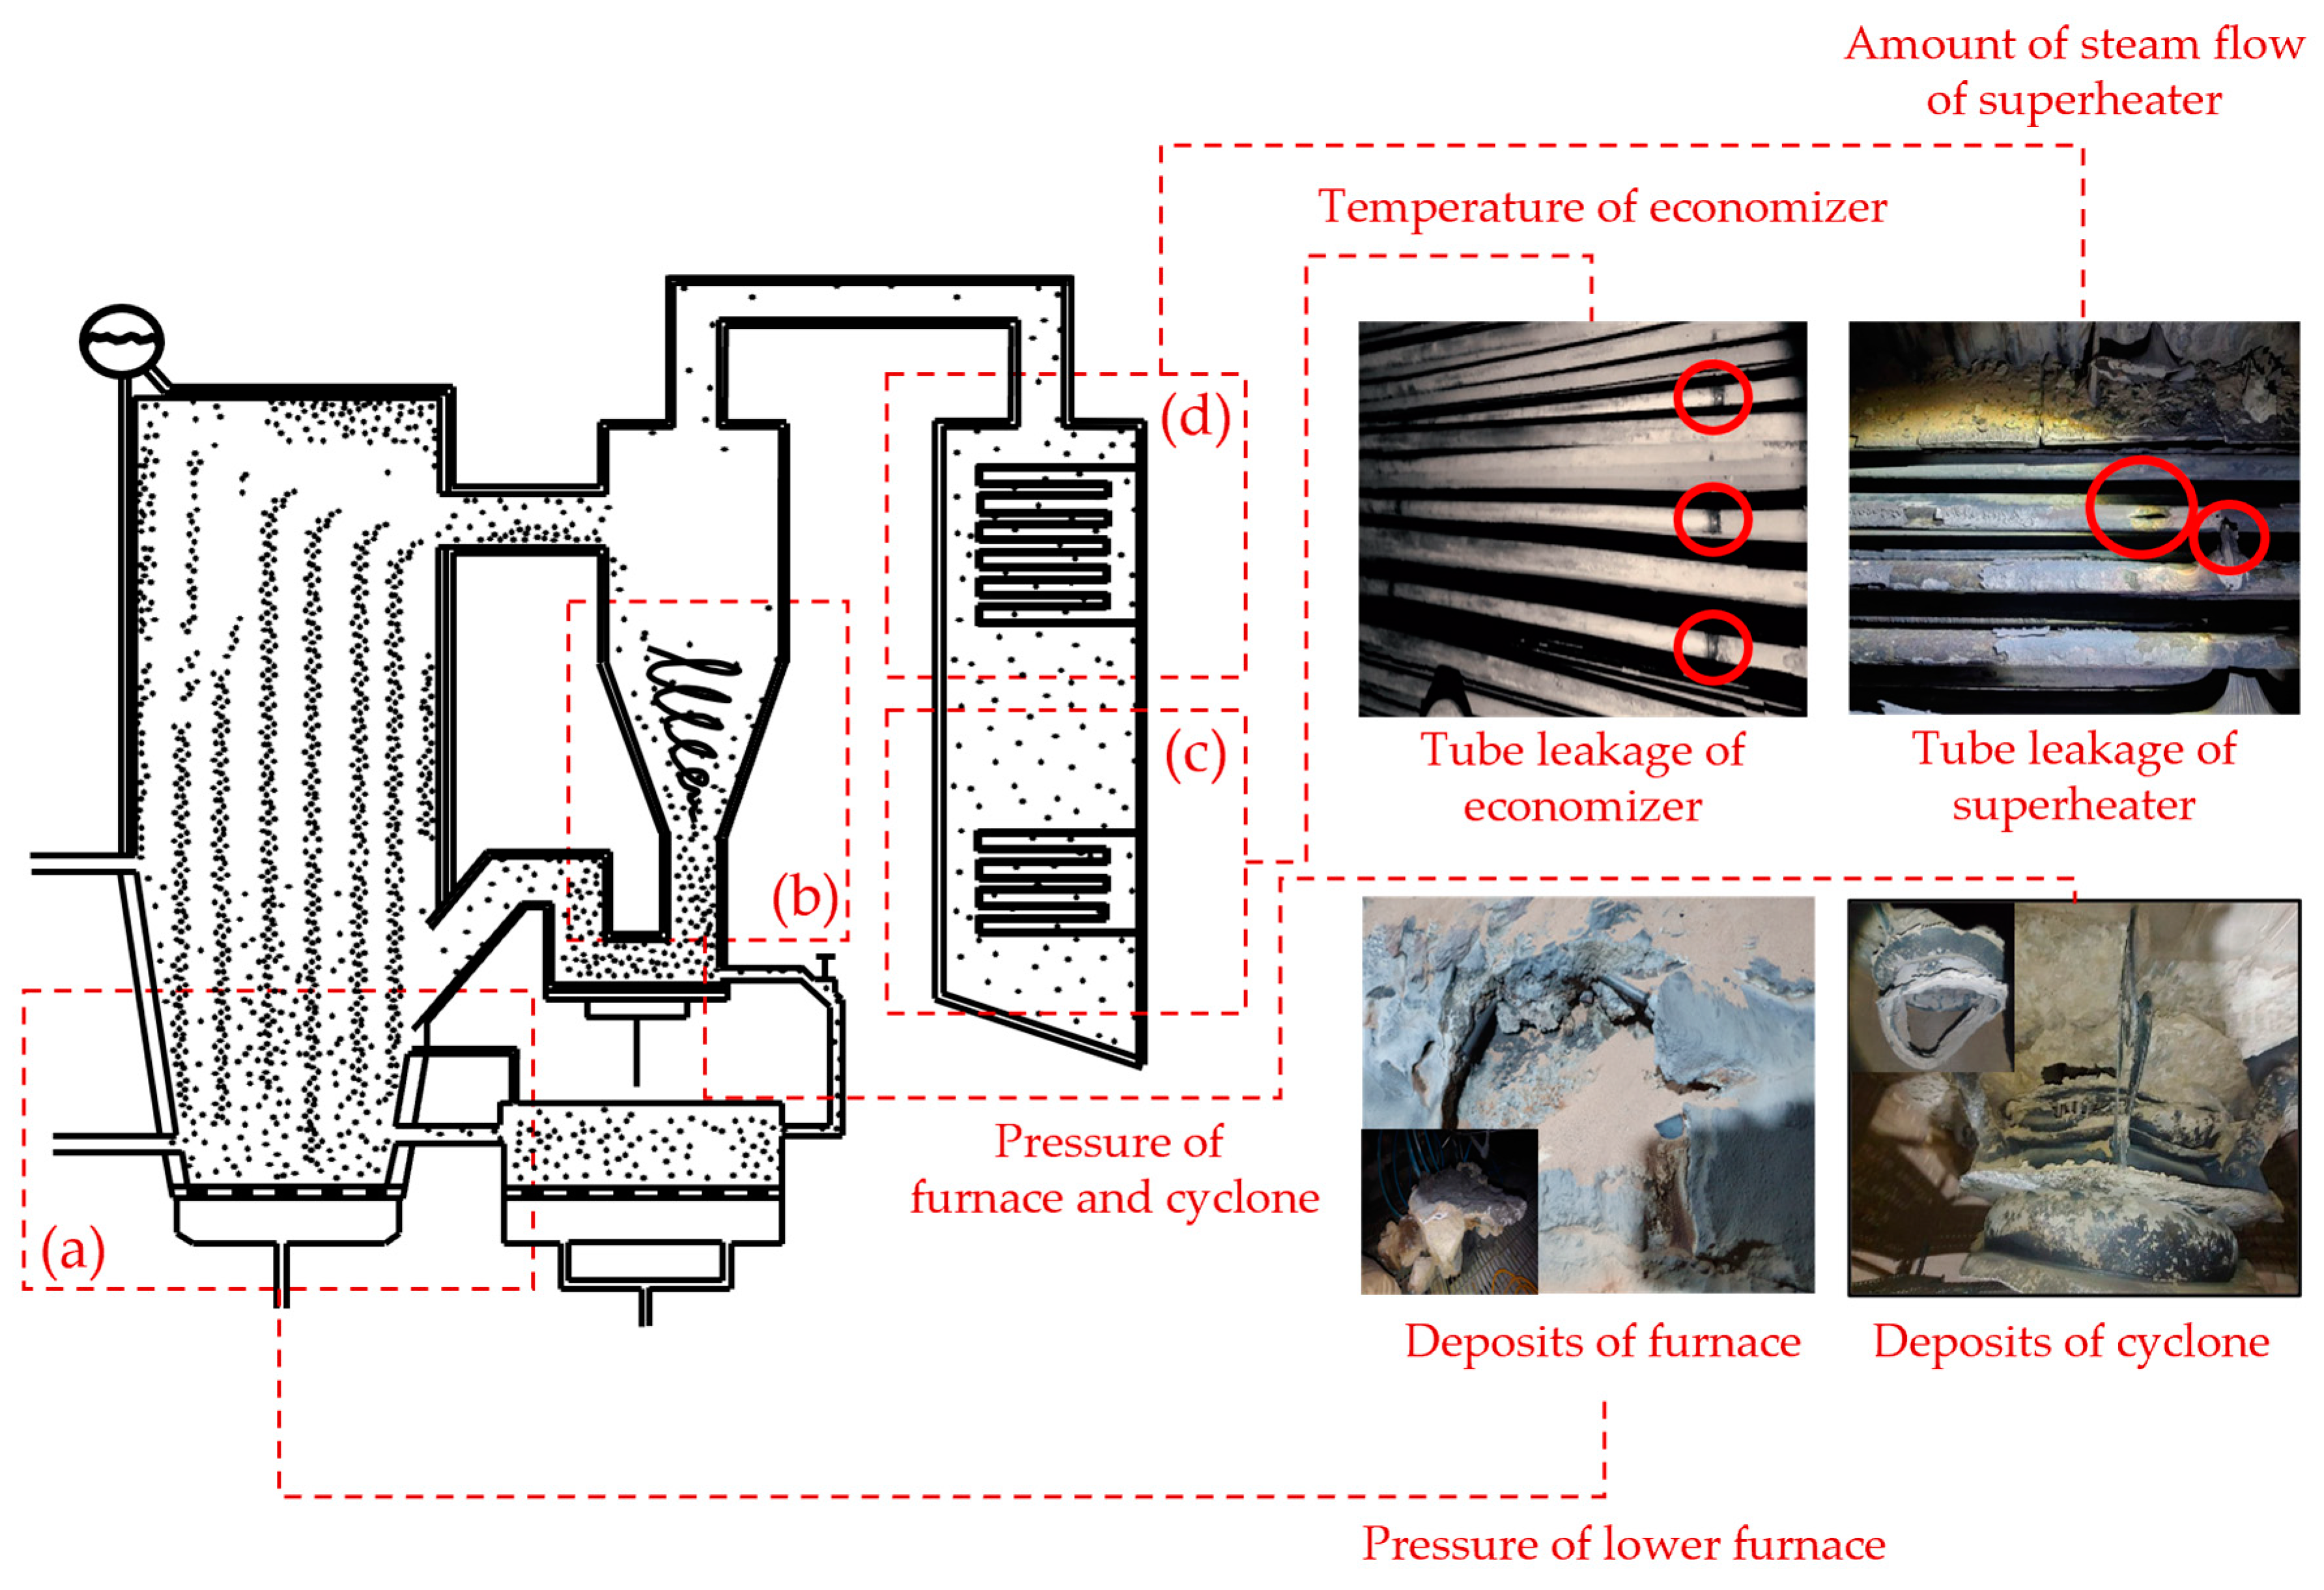
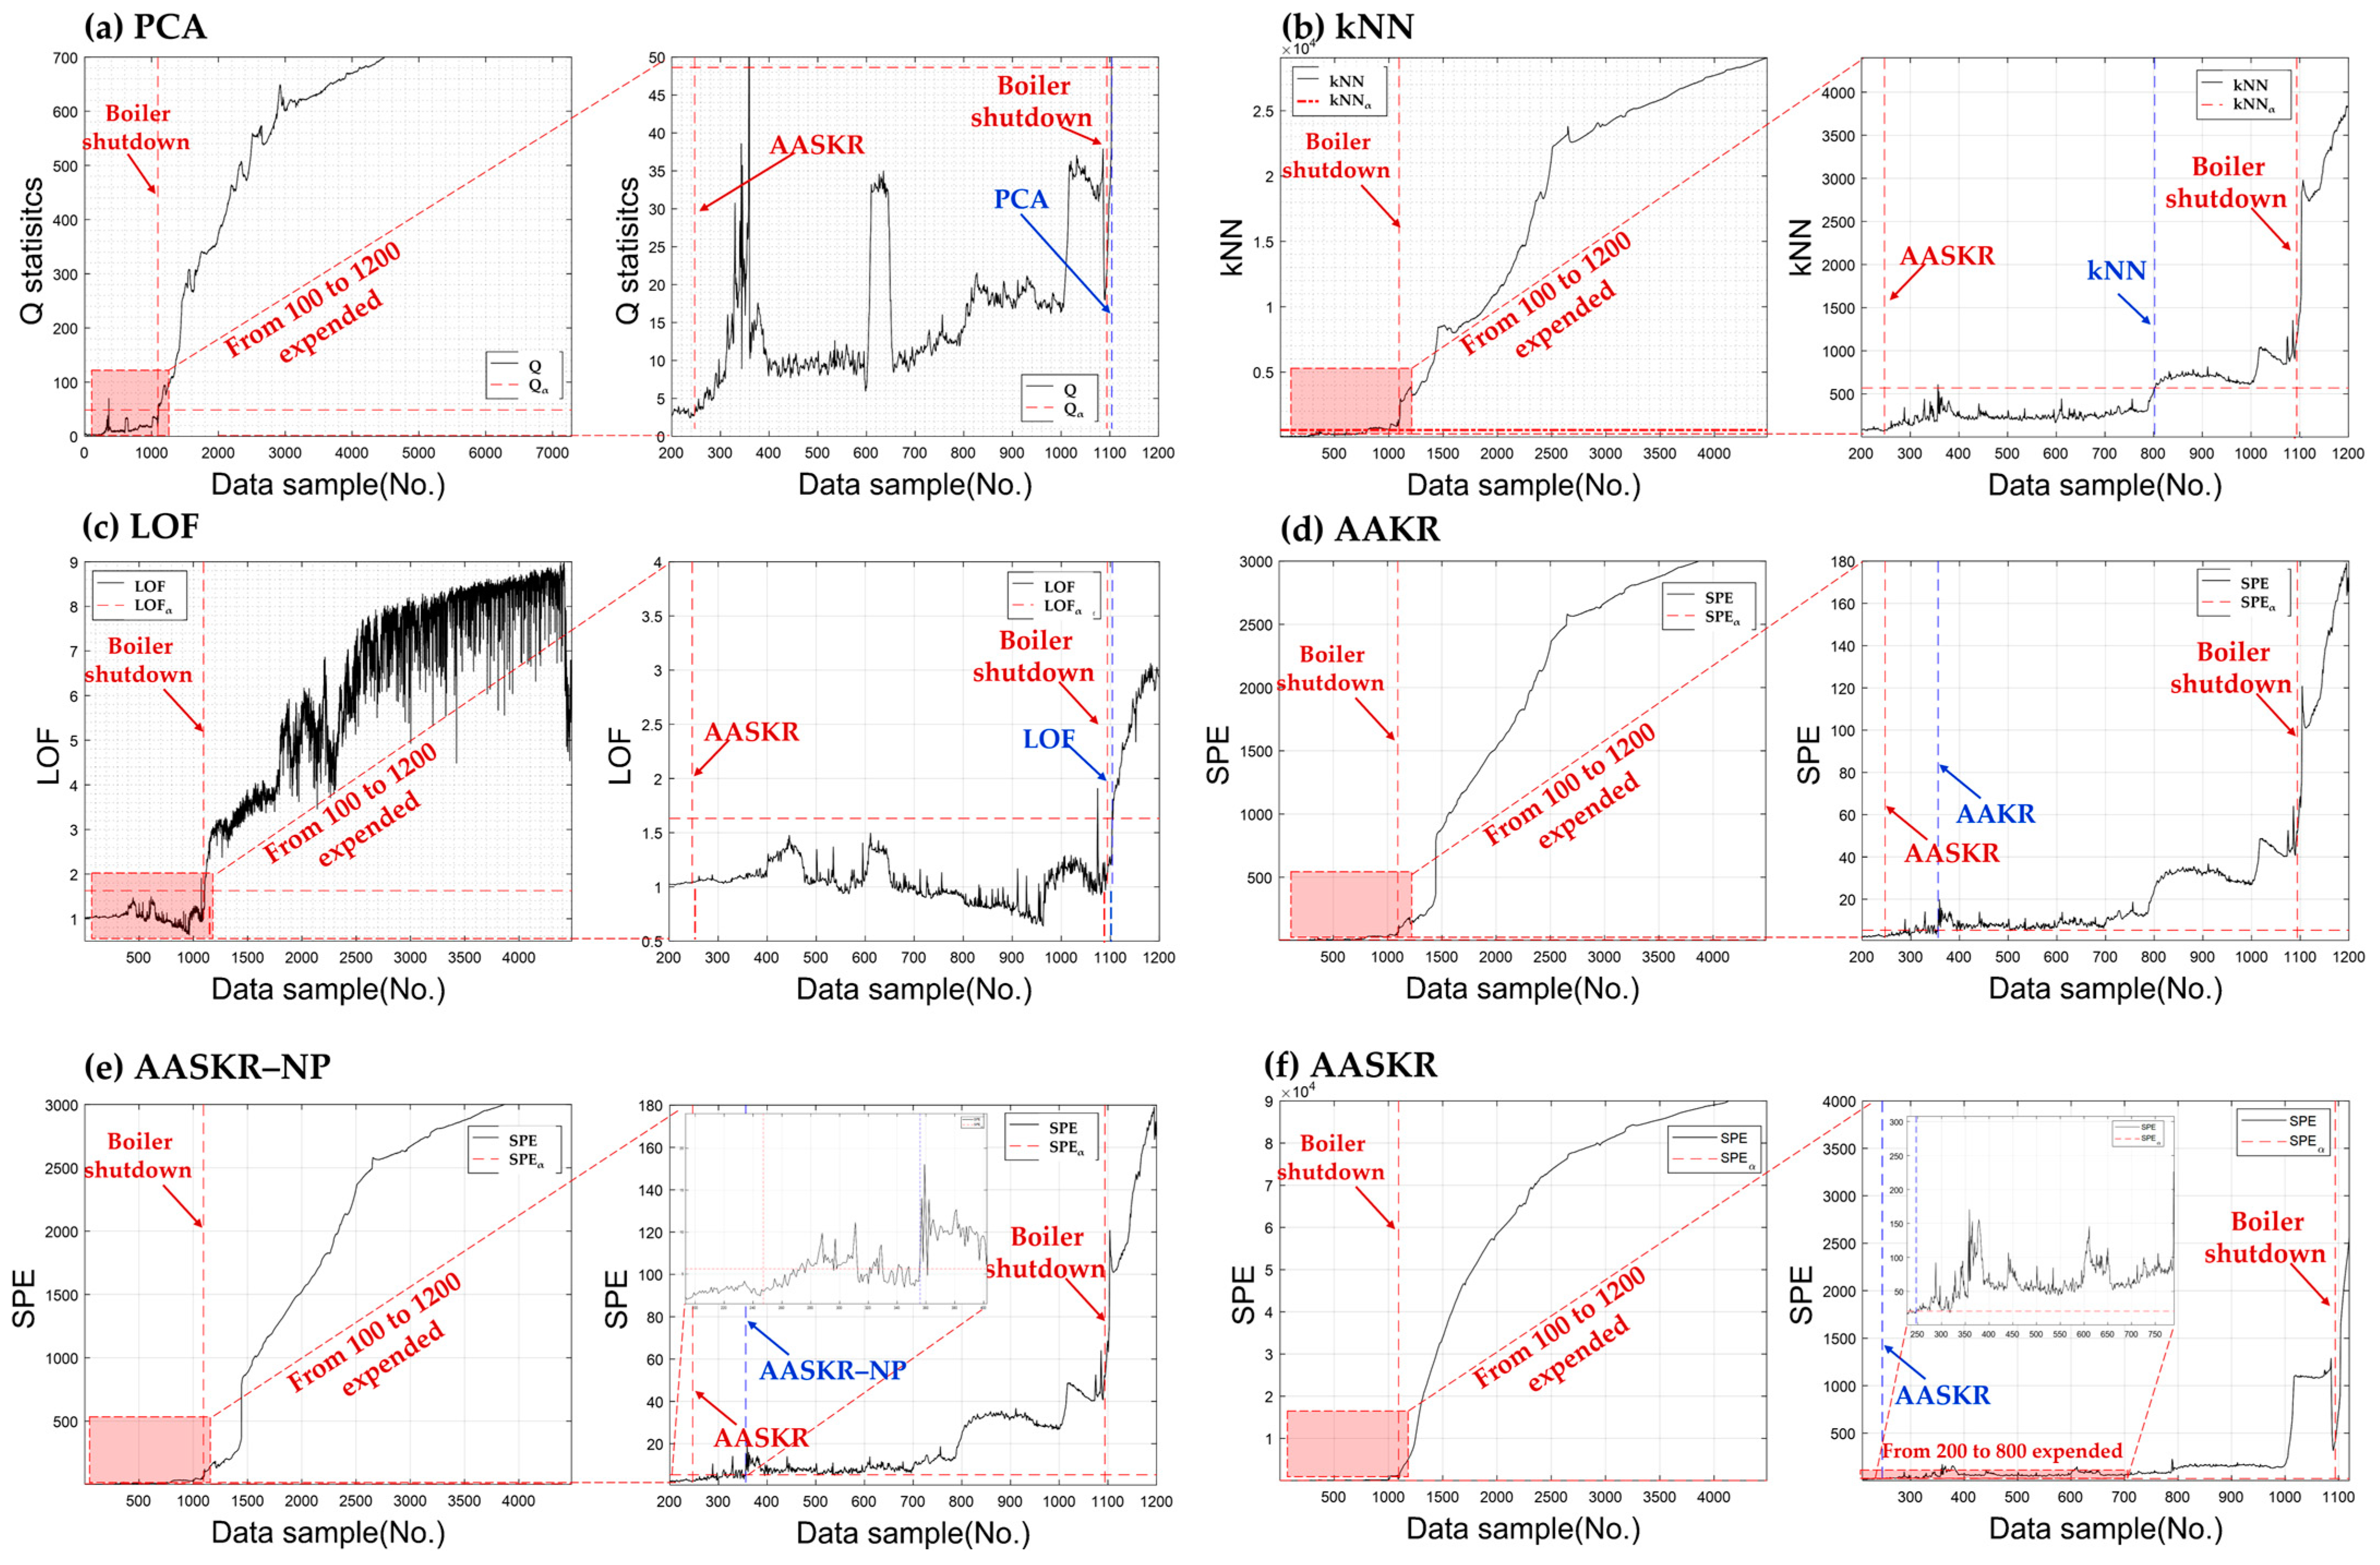
5.2. Real-World Application: Circulating Fluidized Bed Boiler
In this section, early abnormal detection times are compared to evaluating the applicability of the proposed method to a shutdown case of a CFBC boiler. CFBC is a power generation system that utilizes biomass, including methane, ethanol, and hydrogen, along with low-quality fuels like solid refuse fuel. As shown in the CFBC power generation schematic in Figure 9, the use of fluidized media and limestone improves combustion efficiency, reduces fossil fuel consumption, and lowers pollutant emissions [39]. However, the use of fluidized media, such as sand, results in the attachment of alkali salts from exhaust gases to the media and heat pipes, leading to erosion, corrosion, and agglomeration. As the flow medium passes through the rough areas of the inner surface of the pipe, faults such as deposit formation, recirculation blockage, and tube leakage may occur [40]. In the event of an actual fault, the process of identifying the cause, repairing the fault, verifying operational status, and restarting the plant takes at least one week. Therefore, a fault detection technique for CFBC based on data from the distributed control system (DCS) is essential. The generator capacity, voltage, and rotational speed of the CFBC are 9.1 MW, 6.6 kV, and 1800 RPM, respectively. Additionally, the steam turbine’s maximum capacity, maximum inlet steam pressure, and steam temperature are 72 t/h, 41 ata, and 420 °C.
Figure 9.
Diagram of power generation system in CFBC boiler [41].
The CFBC shutdown occurred on 9 September 2020, at 14:35, when the operator responded to an emergency alarm, unexpectedly shutdown the boiler for inspection, and confirmed the failure. As shown in Figure 10, the failure was caused by tube rupture in the superheater and desuperheater, as well as by deposit formation in the furnace and cyclone. Notably, the failure was characterized by a gradual increase in size after the tubes ruptured, affecting other equipment. Additionally, deposits in the furnace and cyclone were dislodged, leading to nozzle blockages. Data for fault detection were collected from the DCS from 2 September 2020, until the boiler shutdown, with 10,000 training and 7284 validation data samples used.
Figure 10.
The main cause of the unplanned shutdown of the CFBC boiler.
The input variables for fault detection consisted of 109 boiler- and steam-related variables, as shown in Table 2. The parameter settings for each detection method were as follows: PCA reduced the 109 input variables to 13 dimensions, with a cumulative percentage variance of 90%. The number of nearest neighbors was set to 20 for LOF and 35 for kNN. The bandwidth parameters for AAKR, AASKR–NP, and AASKR were set to 0.37, 0.37, and 1, respectively. Fault detection thresholds were set using KDE (α = 0.01).
Table 2.
Input variables of CFBC boiler for fault detection.
Figure 11 compares the bandwidth parameter selection results for AAKR, AASKR–NP, and AASKR. AAKR and AASKR–NP were set to 0.37 as the proper bandwidth for fault detection in CFBC. AASKR–NP is the same as AAKR due to the absence of distance readjustment based on shared neighbors. In contrast, AASKR set the bandwidth parameter (h) to 1 as distance values were readjusted. This shows that variations in distance values can influence the selection of the bandwidth parameter.
Figure 11.
Comparison of the bandwidth parameters AAKR, AASKR–NP, and AASKR: (a) AAKR/AASKR–NP; (b) AASKR.
Figure 12 illustrates the fault detection times of conventional and proposed methods for an unplanned boiler shutdown. The shutdown occurred on September 9 at 14:25, corresponding to the 1094th sample in the dataset. As shown in Figure 12a, PCA detected the fault at 14:53:25, 18 min and 20 s after the shutdown. This indicates that PCA failed to detect the fault in a timely manner, as the detection occurred post-shutdown. As demonstrated in previous studies, PCA performance tends to degrade in complex processes. In Figure 12b,c, the distance-based method kNN detected the fault 59 min prior to the boiler shutdown. In contrast, LOF detected the fault at 14:36, 28 s after the shutdown, showing a delay comparable to that of PCA. LOF’s reliance on neighbor density necessitates a method for identifying reliable neighbors. Consequently, LOF is highly sensitive to outliers and noise, not only in TEPs but also in real-world processes, highlighting the need for structural improvements. Although kNN detects faults later than the proposed method, it demonstrates the capability to identify anomalies before boiler shutdown, suggesting its potential applicability in real-world processes. In Figure 12d, AAKR detected the anomaly earlier than PCA, kNN, and LOF. The detection time of AAKR was 12:32 (356th data sample), identifying a problem with the CFBC boiler 2 h and 3 min before shutdown. In Figure 12e, AASKR–NP also detected the fault at 12:32 (356th data sample), matching AAKR’s detection time and confirming the anomaly 2 h and 3 min prior to shutdown. The similarity in detection times is due to the identical structure of AASKR–NP and AAKR. In Figure 12f, the proposed method showed improved performance in early fault detection compared to conventional methods. The anomaly was detected at the 247th data sample, 2 h and 21 min prior to the boiler shutdown, which was 28 min earlier than both AAKR and AASKR–NP. Additionally, when compared to kNN, a distance-based method, the proposed approach detected the fault 1 h and 23 min earlier. This improvement can be attributed to the proposed method’s ability to rescale distance values using training data, much like attention mechanisms prioritize important features by weighting query vectors. Therefore, the proposed method can efficiently detect faults before the boiler shutdown by identifying anomalies early, which aids in establishing a maintenance plan.
Figure 12.
Comparison of fault detection results of conventional and proposed methods: (a–f).
Table 3 compares the early fault detection times of the conventional and proposed methods for an unplanned CFBC boiler shutdown. The boiler was urgently shut down by the operator at 14:35. PCA and LOF detected the fault after the shutdown, with PCA showing the latest detection time among all models, highlighting its limitations in real-world applications. In contrast, kNN detected anomalies before the boiler shutdown. AAKR, AASKR–NP, and AASKR detected anomalies before the failure significantly impacted the system. Notably, the proposed method improved upon the traditional AAKR by rescaling the distance value based on the query vector. This enhancement allows the proposed method to detect early faults in real-world processes and address them before unplanned shutdowns occur. Moreover, the proposed method detected fault symptoms 13 min earlier than the experimental results of Kim [41]. Consequently, the proposed method not only improves fault detection performance compared to conventional FDD methods and SNN but also enhances early fault detection capabilities. This improvement suggests its potential applicability across various industrial domains beyond thermal power plants.
Table 3.
Comparison of the detection time of the proposed and conventional methods (faster is better).
6. Conclusions
Recently, with the emergence of technologies like attention mechanisms, the capabilities of natural language processing have improved. These methods dynamically adjust the emphasis on relationships between words in a sentence. Motivated by these developments, we propose a fault detection method that calculates the distance between the query vector and training data. The distance value is then readjusted once the shared neighbors are selected through SNN. AAKR is utilized as the fault detection method, with the rescaled distance employed to calculate the weights and estimation values before computing the estimation vector. The performance of the proposed method is validated using both simulation data from the TEP benchmark and a real CFBC boiler shutdown case. The TEP experiment results show that the proposed method calculates lower type I and type II errors. Additionally, in the real CFBC shutdown case, the proposed method detects anomalies more than 2 h earlier than conventional methods, prior to the unplanned shutdown caused by fault propagation from tube leakage. Thus, by readjusting the distance between the query vector and training data, the proposed method enhances fault detection performance and shows potential for application in real-world complex processes.
In future research, we will consider the following three topics. First, since the performance of AAKR depends on the bandwidth parameter h, we used k-fold cross validation to determine an appropriate value. In the future, we aim to find a method for assigning the parameter dynamically. Second, when rescaling the distance in the proposed method, we divided the distance by k, the number of neighbors, to rescale. However, when k becomes large, the value becomes small even with a penalty. We will research how to assign weights to solve this problem. Third, noisy data in the training set can lead to unreliable neighbor selection in the SNN-based process and degrade fault detection performance. To mitigate this issue, future research will focus on applying adaptive filtering techniques or noise-robust similarity measures to improve the reliability of neighbor selection.
Author Contributions
S.J. and B.K. conceived and designed the simulations; J.K. analyzed the data; E.K. advised on the whole process of manuscript preparation; M.K. analyzed the data and wrote the paper. The analysis results and the paper were supervised by S.K. All authors have read and agreed to the published version of the manuscript.
Funding
This work was supported by BK21FOUR, Creative Human Resource Education and Research Programs for ICT Convergence in the 4th Industrial Revolution.
Institutional Review Board Statement
Not applicable.
Informed Consent Statement
Not applicable.
Data Availability Statement
The data presented in this study are available on request from the corresponding author. The data are not publicly available due to privacy concerns.
Conflicts of Interest
The authors declare no conflicts of interest.
References
- Wang, G.; Liu, J.; Zhang, Y.; Li, Y. A novel multi-mode data processing method and its application in industrial process monitoring. J. Chemom. 2015, 29, 126–138. [Google Scholar] [CrossRef]
- Barszcz, T.; Czop, P. A feedwater heater model intended for model-based diagnostics of power plant installations. Appl. Therm. Eng. 2011, 31, 1357–1367. [Google Scholar] [CrossRef]
- Lang, F.D.; Rodgers, D.A.; Mayer, L.E. Detection of tube leaks and their location using input/loss methods. In Proceedings of the ASME Power Conference, Baltimore, MD, USA, 30 March–1 April 2004; Volume 41626, pp. 143–150. [Google Scholar]
- Sun, X.; Chen, T.; Marquez, H.J. Efficient model-based leak detection in boiler steam-water systems. Comput. Chem. Eng. 2002, 26, 1643–1647. [Google Scholar] [CrossRef]
- Guo, J.; Yuan, T.; Li, Y. Fault detection of multimode process based on local neighbor normalized matrix. Chemom. Intell. Lab. Syst. 2016, 154, 162–175. [Google Scholar] [CrossRef]
- Ge, Z.; Gao, F.; Song, Z. Two-dimensional Bayesian monitoring method for nonlinear multimode processes. Chem. Eng. Sci. 2011, 66, 5173–5183. [Google Scholar] [CrossRef]
- Yu, J. A nonlinear kernel Gaussian mixture model based inferential monitoring approach for fault detection and diagnosis of chemical processes. Chem. Eng. Sci. 2012, 68, 506–519. [Google Scholar] [CrossRef]
- Wang, H.; Zhou, H.; Chen, Y.; Yang, L.; Bi, W. Deep learning GAN-based fault detection and diagnosis method for building air-conditioning systems. Sustain. Cities Soc. 2025, 118, 106068. [Google Scholar] [CrossRef]
- Ahmed, I.; Maaruf, M.; Khalid, M. Detection of Cracks in the Industrial System Using Adaptive Principal Component Analysis and Wavelet Denoising. In Proceedings of the 2024 IEEE International Conference on Industrial Technology (ICIT), Bristol, UK, 25–27 March 2024; pp. 1–6. [Google Scholar]
- Ma, H.; Hu, Y.; Shi, H. A novel local neighborhood standardization strategy and its application in fault detection of multimode processes. Chemom. Intell. Lab. Syst. 2012, 118, 287–300. [Google Scholar] [CrossRef]
- Isermann, R. Fault-Diagnosis Applications: Model-Based Condition Monitoring: Actuators, Drives, Machinery, Plants, Sensors, and Fault-Tolerant Systems; Springer Science and Business Media: Berlin/Heidelberg, Germany, 2011. [Google Scholar]
- Hines, J.W.; Dustin, G. Process and equipment monitoring methodologies applied to sensor calibration monitoring. Qual. Reliab. Eng. Int. 2007, 23, 123–135. [Google Scholar] [CrossRef]
- Lee, J.M.; Yoo, C.; Choi, S.W.; Vanrolleghem, P.A.; Lee, I.B. Nonlinear process monitoring using kernel principal component analysis. Chem. Eng. Sci. 2004, 59, 223–234. [Google Scholar] [CrossRef]
- Chiang, L.H.; Russell, E.L.; Braatz, R.D. Fault Detection and Diagnosis in Industrial Systems; Springer Science and Business Media: Berlin/Heidelberg, Germany, 2000. [Google Scholar]
- Zhang, D.; Zhao, W.; Wang, L.; Chang, X.; Li, X.; Wu, P. Evaluation of the state of health of lithium-ion battery based on the temporal convolution network. Front. Energy Res. 2022, 10, 929235. [Google Scholar] [CrossRef]
- Shams, M.B.; Budman, H.M.; Duever, T.A. Fault detection, identification and diagnosis using CUSUM based PCA. Chem. Eng. Sci. 2011, 66, 4488–4498. [Google Scholar] [CrossRef]
- Garcia-Alvares, D.; Fuente, M.J.; Sainz, G.I. Fault detection and isolation in transient states using principal component analysis. J. Process Control 2012, 22, 551–563. [Google Scholar] [CrossRef]
- Zhao, C.; Gao, F. Fault-relevant principal component analysis (FPCA) method for multivariate statistical modeling and process monitoring. Chemom. Intell. Lab. Syst. 2014, 133, 1–16. [Google Scholar] [CrossRef]
- Gajjar, S.; Palazoglu, A. A data-driven multidimensional visualization technique for process fault detection and diagnosis. Chemom. Intell. Lab. Syst. 2016, 154, 122–136. [Google Scholar] [CrossRef]
- Guo, J.; Wang, X.; Li, Y.; Wang, G. Fault detection based on weighted difference principal component analysis. J. Chemom. 2017, 31, e2926. [Google Scholar] [CrossRef]
- Zhu, Z.; Song, Z.; Palazoglu, A. Process pattern construction and multi-mode monitoring. J. Process Control 2012, 22, 247–262. [Google Scholar] [CrossRef]
- Ng, Y.S.; Srinivasan, R. An adjoined multi-model approach for monitoring batch and transient operations. Comput. Chem. Eng. 2009, 33, 887–902. [Google Scholar] [CrossRef]
- Lu, N.; Gao, F.; Wang, F. Sub-PCA modeling and on-line monitoring strategy for batch processes. AIChE J. 2004, 50, 255–259. [Google Scholar] [CrossRef]
- Hwang, D.H.; Han, C. Real-time monitoring for a process with multiple operating modes. Control Eng. Pract. 1999, 7, 891–902. [Google Scholar] [CrossRef]
- Zhao, C.; Wang, F.; Lu, N.; Jia, M. Stage-based soft-transition multiple PCA modeling and on-line monitoring strategy for batch processes. J. Process Control 2007, 17, 728–741. [Google Scholar] [CrossRef]
- Kazemi, P.; Masoumian, A.; Martin, P. Fault Detection and Isolation for Time-Varying Processes Using Neural-Based Principal Component Analysis. Processes 2024, 12, 1218. [Google Scholar] [CrossRef]
- Feng, X.; Kong, X.; Du, B.; Luo, J. Adaptive LII-RMPLS based data-driven process monitoring scheme for quality-relevant fault detection. J. Control Decis. 2022, 9, 477–488. [Google Scholar] [CrossRef]
- Ali, H.; Zhang, Z.; Safdar, R.; Rasool, M.H.; Yao, Y.; Yao, L.; Gao, F. Fault detection using machine learning based dynamic ICA-distributed CCA: Application to industrial chemical process. Digit. Chem. Eng. 2024, 11, 100156. [Google Scholar] [CrossRef]
- Tang, J.; Chen, Z.; Fu, A.W.-c.; Cheung, D.W. Enhancing effectiveness of outlier detections for low density patterns. In Proceedings of the Advances in Knowledge Discovery and Data Mining: 6th Pacific-Asia Conference, Taiwan, 6–8 May 2002. [Google Scholar]
- Tong, C.; Palazoglu, A.; Yan, X. An adaptive multimode process monitoring strategy based on mode clustering and mode unfolding. J. Process Control 2013, 23, 1497–1507. [Google Scholar] [CrossRef]
- Chiu, A.L.M.; Fu, A.W.C. Enhancements on local outlier detection. In Proceedings of the Seventh International Database Engineering and Applications Symposium, Hong Kong, China, 18 July 2003. [Google Scholar]
- Yu, J.; Jang, J.; Yoo, J.; Park, J.H.; Kim, S. Bagged auto-associative kernel regression-based fault detection and identification approach for steam boilers in thermal power plants. J. Electr. Eng. Technol. 2017, 12, 1406–1416. [Google Scholar]
- Bahdanau, D. Neural machine translation by jointly learning to align and translate. arXiv 2014, arXiv:1409.0473. [Google Scholar]
- Yu, J.; Yoo, J.; Jang, J.; Park, J.H.; Kim, S. A novel hybrid of auto-associative kernel regression and dynamic independent component analysis for fault detection in nonlinear multimode processes. J. Process Control 2018, 68, 124–144. [Google Scholar] [CrossRef]
- Rosenblatt, M. Curve estimates. Ann. Math. Stat. 1971, 42, 1815–1842. [Google Scholar] [CrossRef]
- Parzen, E. On estimation of a probability density function and mode. Ann. Math. Stat. 1962, 33, 1065–1076. [Google Scholar] [CrossRef]
- Odiowei, P.E.P.; Cao, Y. Nonlinear dynamic process monitoring using canonical variate analysis and kernel density estimations. IEEE Trans. Ind. Inform. 2009, 6, 36–45. [Google Scholar] [CrossRef]
- Zhao, S.; Duan, Y.; Roy, N.; Zhang, B. A novel fault diagnosis framework empowered by LSTM and attention: A case study on the Tennessee Eastman process. Can. J. Chem. Eng. 2024. [Google Scholar]
- Van Caneghem, J.; Brems, A.; Lievens, P.; Block, C.; Billen, P.; Vermeulen, I.; Vandecasteele, C. Fluidized bed waste incinerators: Design, operational and environmental issues. Prog. Energy Combust. Sci. 2012, 38, 551–582. [Google Scholar] [CrossRef]
- Luo, X.; Zhang, Z. Leakage Failure Analysis in a Power Plant Boiler. IERI Procedia 2013, 5, 107–111. [Google Scholar] [CrossRef]
- Kim, M.; Jung, S.; Kim, E.; Kim, B.; Kim, J.; Kim, S. A Fault Detection and Isolation Method via Shared Nearest Neighbor for Circulating Fluidized Bed Boiler. Processes 2023, 11, 3433. [Google Scholar] [CrossRef]
Disclaimer/Publisher’s Note: The statements, opinions and data contained in all publications are solely those of the individual author(s) and contributor(s) and not of MDPI and/or the editor(s). MDPI and/or the editor(s) disclaim responsibility for any injury to people or property resulting from any ideas, methods, instructions or products referred to in the content. |
© 2025 by the authors. Licensee MDPI, Basel, Switzerland. This article is an open access article distributed under the terms and conditions of the Creative Commons Attribution (CC BY) license (https://creativecommons.org/licenses/by/4.0/).