Abstract
The aim of the present research is to validate the combined use, through data fusion, of a Laser Induced Fluorescence (LIF) scanning system and a radar scanner (RGB-ITR, Red Green Blue Imaging Topological Radar system), as a unique tool to address the need for non-invasive, rapid, and low-cost techniques for both diagnostic and operational needs. The integrated system has been applied to the House of Diana complex in Ostia Antica. The main diagnostic objective of this research was to trace the materials used in different phases of restoration, from antiquity to modernity, on both masonry and pictorial surfaces, to reconstruct the history of the building. Due to the significant interest in this insula, other studies have been recently carried out on the House of Diana, but they once again highlighted the necessity of multiple approaches and non-invasive methods capable of providing quasi-real-time answers, delivering point-by-point information on very large surfaces to overcome the limits related to representativeness of sampling. The data acquired by the RGB-ITR system are quantitative, allowing for morphological and 3-colour analysis of the investigated artwork. In this work, the sensor has been used to create coloured 3D models useful for structural assessments and for locating different classes of materials. In fact, the LIF maps, which integrate knowledge about the original constituent materials and previous conservation interventions, have been used as additional layers of the tridimensional models. Therefore, the method can direct possible new investigations and restoration actions, piecing together the history of the House of Diana to build for it a safer future.
1. Introduction
In the era of digitalisation, there is a need not only to document artworks and heritage sites in detail as they currently exist, but also to develop innovative methods for studying the modifications and interventions that these sites have undergone over the centuries. This type of study is essential not only for art historians, who, for example, seek to trace the evolution of a building’s function or evaluate an artist’s technique, but also for conservators, who need to understand the past, predict future degradation, and intervene in the most effective way. For this purpose, the combination of multiple non-destructive and non-invasive techniques is fundamental, particularly those capable of providing both high-resolution three-dimensional digital reconstructions and insights into features not visible to the naked eye. In an increasingly connected world, one that has also experienced isolation, with the related risks of exclusion and alienation, the importance of digital accessibility to sites that are distant in both time and space has now been widely recognised. This accessibility benefits not only professionals but also, and above all, audiences and tourists. Furthermore, the problem of over-tourism requires, on the one hand, diverting public interest toward underutilised sites, locations, and artefacts, and on the other, providing high-quality informational content that enhances cultural awareness among visitors. In this context, advanced digital technologies such as 3D modelling, artificial intelligence, and then virtual reality (VR) and augmented reality (AR) represent key tools for modernising the documentation, use, and management of archaeological and cultural heritage [1,2,3]. This evolution goes, and must go, hand in hand with advances in diagnostic and monitoring methods, among which non-destructive technologies (NDTs) play a particularly important role. Non-destructive techniques provide insights into the material composition and structural integrity of cultural heritage objects without causing any damage. Together, these technologies facilitate a deeper understanding of historical artefacts and contribute to their preservation by enabling precise, well-informed interventions, without compromising their integrity [4]. Then, NDTs are crucial for the analysis and conservation of cultural heritage artefacts. Among the primary NDTs, those mostly used in this field, also thanks to the existence of portable equipment, are X-ray Fluorescence (XRF) for elemental analysis of materials without sampling need [5], infrared reflectography, useful for the individuation of underlying layers in paintings [6], thermography and ultrasound testing for the detection of structural anomalies [6,7], Magnetic Resonance Imaging (MRI) for in-depth analysis of organic materials like textiles and wood [8], Ultraviolet (UV) photography to reveal details not visible under normal lighting conditions [9] and multispectral imaging employed to capture images across different reflectance wavelengths [10].
Many of these techniques are imaging-based, meaning that their results can be compared with photographic images and with what is visible to the naked eye. However, sometimes the features revealed by these methods are difficult to precisely locate, due to the large dissimilarity between visible aspects and hidden features collected, making comparisons challenging. This issue makes the ability to accurately overlay diagnostic data onto an accurate 3D model of the studied artwork, building, or object, particularly valuable. In this context, laser-induced fluorescence (LIF) has proven to be a very powerful NDT. LIF, employing a UV laser (over 250 nm) as a light source to excite specific molecules within a sample, is highly sensitive and allows for the precise detection of different classes of materials, both organic and inorganic.
Compared to UV photography, LIF offers higher specificity and sensitivity across a much wider range of substances. Initially developed as a point-based method for chemical analysis, LIF has since been integrated with scanning systems, leading to the development of LIF imaging instruments. In recent years, LIF has yielded promising results in the field of cultural heritage, such as detecting materials not visible to the naked eye due to restoration actions [11] or identifying microorganisms in areas where biodegradation is not evident, suggesting the potential for early detection [12]. In fact, several molecules are active in the fluorescence, in particular organic cyclic, polycyclic, heterocyclic and with conjugated double bonds compounds, and some smaller inorganic molecules, such as CaSO4, CaCO3, TiO2, ZnO, and CaC2O4. Thus, LIF is particularly suitable, in the field of CH characterisation, to study dyes, natural and synthetic polymers, such as paper, wood, binders, modern consolidant and protective materials, biological pigments (such as chlorophylls and carotenoids), some stones (mainly calcareous ones), and only a few inorganic pigments (mostly white ones) [11]. It is then clear that comprehensive results can be joined when LIF data are complemented with those from other NDTs, such as Raman spectroscopy, colourimetry, and infrared reflectography, able to identify non-fluorescent materials. Moreover, the interpretation of the fluorescence maps can be challenging without a correlation with visible and structural information. The fusion of LIF data with 3D point clouds introduces a new way to analyse artworks, correlating invisible with visible information. It is well established that the combination of different NDT methods is essential to enhance the understanding and accessibility to CH objects and sites, their health state, and potential risks.
3D modelling technologies, such as photogrammetry and laser scanning, enable detailed and accurate digital replicas of artefacts and structures, allowing for in-depth analysis and virtual restoration without physically altering the original items. Photogrammetry has advanced significantly with high-resolution cameras and sophisticated software, allowing for the creation of highly detailed and accurate 3D models from photographs [13], even if the data collection is influenced by atmospheric and ambient lighting conditions. Concurrently, in the last years, laser scanning technology has seen substantial improvements in speed and precision. Usually, these systems use an infrared (IR) laser source, assuring a higher spatial resolution and precision and a much lower influence by lighting conditions, and the Time-of-flight (TOF) method or the Amplitude Modulated Continuous Wave (AMCW) method [14].
Moreover, recently multi-wavelength laser scanner systems, using more than one laser beam with varying wavelengths, have been implemented to measure not only distances but also reflectance intensities at specified wavelengths for different applicative goals [15,16,17]. These systems are particularly useful in applications such as those of cultural heritage documentation and study, where information on colour properties and underlayer materials and treatments are of very large interest.
In such a complex frame, in the present work, we present the results obtained by the fusion of data coming from two different prototypal laser systems, an imaging LIF instrument called FORLAB, and a three-wavelength laser scanner based on phase method called RGB-ITR, in the context of the ESA co-founded VADUS project [18].
The VADUS (Virtual Access and Digitization for Unreachable Sites) Project aimed at providing tourists and researchers with the opportunity to explore cultural and archaeological sites that are not (easily) accessible. The main goal was to propose a modern use and knowledge tool that could be able to go beyond human visual perception, offering virtual and augmented reality experiences through accurate and highly defined 3D models enriched with multimedia information. These models reveal hidden aspects of artefacts through the integration of advanced techniques, such as LIF combined with 3D models [18]. One of the sites selected to demonstrate the VADUS concept has been the Casa di Diana (House of Diana) in the Archaeological Park of Ostia Antica (PAOA), close to Rome (Italy).
The complex of House of Diana, located in the central sector of the Ancient Ostia excavations, has been chosen because, even if it has easy access for professionals, it is not accessible to the public. Moreover, it provided an ideal case study for testing the effectiveness of these technologies on archaeological contexts characterised by particular complexity. The building, named after a terracotta relief depicting Diana was built in the first half of the 2nd century AD and over time underwent significant alterations to both the internal walls and the floors, until its final abandonment in the 2nd half of the 4th century AD [19,20]. Discovered and brought to light between 1915 and 1916, it underwent numerous conservation works over time, both to consolidate the walls and to restore the frescoes and mosaics that decorated it. Since many of these interventions are not or poorly documented, the first goal of the diagnostic investigations has been to reconstruct the building’s conservation history by identifying and distinguishing the materials and techniques used in the various phases of restoration, also documenting the evolution of restoration philosophies. The second, important, objective was to identify elements of the decoration that were no longer visible due to the progression of the state of decay over time, particularly on frescoes.
2. Materials and Methods
2.1. The House of Diana
As already said in previous sections, the House of Diana (Figure 1), perhaps originally four storeys tall with shops facing onto the street, was built as an apartment block in the first half of the 2nd century AD [19,20]. Over time, it underwent significant alterations to both the internal walls and the floors. In particular, during the 3rd century AD, the floors were raised and new mosaics were laid and, at a later period, a mithreum was installed in the innermost rooms [21,22].
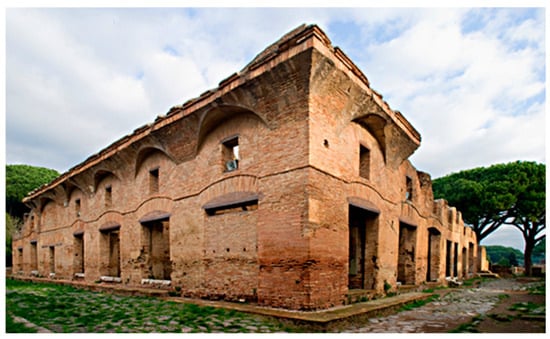
Figure 1.
External view of the insula of the House of Diana in Ostia Antica from the South-West.
The activities of the VADUS project have been focused on two specific rooms: the tablinum (living room), on the south side, and the room adjacent to the triclinium (dining room), later transformed into an anti-mithreum, on the north side of the courtyard. From here on, we will refer to them as Room A and Room B, respectively. In both the rooms, attention was paid to both the masonry and the decorative apparatus to point out information on the historic phases of the building, to try to extract lost details of the frescoes, and to piece together the restoration actions not documented.
Due to the large interest in this insula, other studies have been recently carried out on the House of Diana, but they highlighted once again the necessity of multiple approaches and of non-invasive methods able to produce answers in quasi-real time giving information point-by-point on very large surfaces to overcome the limits related to representativeness of sampling [23,24,25].
2.1.1. Tablinum (Room A)
Built together with the rest of the dwelling in the first half of the 2nd century AD, Room A maintained its original configuration over time. Only at a later stage was it transformed into a stable, as indicated by the manger leaning against the south wall and the basalt floor. The pictorial decoration that is still preserved in the upper part of the walls and on the ceiling was carried out during the last quarter of the 2nd century AD [20].
Since its discovery, the paintings on the walls of Room A have undergone several conservative interventions. The PAOA archives house pictures and reports that only partially document the restorations, in particular, those of the late 1980s and 1990s. The first action, probably in the 1960s, involved the frescoes’ detachment from the masonry and their repositioning in their original location using supporting panels.
Due to conservation problems in the specific Ostia environment and to the evolution of the type of supports over time, a new important restoration action was carried out at the end of the 1980s. Then, the supports of the detached frescoes were replaced with some considered more functional and in materials more compatible with the original substrates, restoring also a greater readability to the pictorial composition.
The ceiling decorations, from a later period with respect to the walls’ decorations, were recovered from collapses during the excavation phase. During the reconstruction intervention, in the 1970s, they were placed on concrete panels, but the weight of such structure led one of the ceiling panels to collapse, making it necessary, in the early 1990s, to transfer the paintings on to the most innovative and lightweight honeycomb panels.
The conservative actions described, as subsequent maintenance interventions, have stratified organic fixatives (particularly on the pictorial layer of the wall paintings), that over time have altered (yellowing and darkening) the legibility and the appearance of the paintings.
2.1.2. Anti-Mithreum (Room B)
Room B has undergone extremely significant changes over time, which can be read mainly thanks to the wall stratigraphies of the north and west walls.
In the first two phases, dating from the Hadrianic and Antonine periods (2nd century AD), Room B was divided into two different rooms, a triclinium and a reception hall. The latter, accessible by a door with a marble threshold, was paved with a simple white mosaic.
In the third phase, which can be dated back to the last quarter of the 2nd century, Room B was enlarged to the west, plugging the door on the back wall with the “cuci e scuci” (sew and unsew) technique, in order to make it better anchored to the jambs. The pictorial decoration, of which only a fragment is preserved, dates back to this period. At this stage, Room B probably assumed the function of a cubiculum (bedroom or sitting room).
The following building phase (dating from the 2nd quarter of the 3rd century) follows the occurrence of static instabilities and collapses and involved the reinforcement of the foundations and the consequent raising of the floor levels. During the 2nd half of the 3rd century, the room was finally transformed into an anti-mithreum (the room in front of the mithreum, which was installed in the backroom).
Some of these transformations appear evident, for example in the succession of floors, others, however, are difficult to perceive, partly because of the “mimetic” character of the restorations conducted in the first half of the 20th century [26].
Tentative maps of the House of Diana during the different building phases are reported in Figure 2.
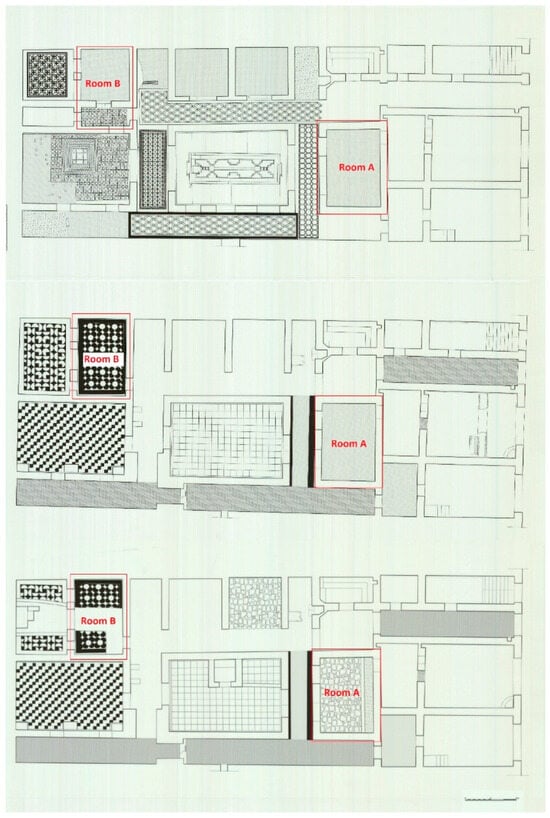
Figure 2.
Plan of the House of Diana during the different building phases, from the earliest phase, first half of the 2nd century AD (top), to the intermediate phase, last quarter of the 2nd century AD (center), to the latest phase, 2nd half of the 3rd century AD (bottom) (Studio 3R, PA-OANT Photo Archive inv. 11,560–11,562).
2.2. RGB-ITR
The RGB-ITR (Red Green Blue Imaging Topological Radar) scanner (Figure 3 left) is a prototype developed at the Diagnostic and Metrology Laboratory of the ENEA Research Centre in Frascati (Rome, Italy). The system uses three laser sources with wavelengths in the visible range corresponding to red, green, and blue (660 nm, 517 nm, and 440 nm, respectively). It is able to digitise in 3D and in RGB colour works of art even of large dimensions. It works remotely, up to 35 m distance from the target, with sub-millimetric spatial resolution and with a maximum image resolution of the order of Giga Pixels. The system enables the simultaneous recording of range and colour information by the phase shift between the back-reflected signal and the reference modulating wave, and the elaboration of back-reflected RGB triplets from the scanned object, respectively. More detailed information can be found in [27].
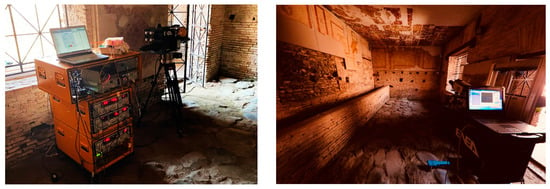
Figure 3.
RGB-ITR system (on the left) and LIF scanning system (on the right) during the measurement campaign in House of Diana.
The ITR system is based on a double amplitude modulation (AM) range-finding technique, where the laser beam is exploited as the carrier wave of a radiofrequency signal, which modulates the beam intensity [28,29]. Structural digitalisation of the surfaces is elaborated from the distance measurements, determined indirectly from the phase delay of the collected back-reflected signal with respect to the reference modulating wave. The colour information is estimated by normalising the back-reflected signals with the intensities, acquired directly on-site, obtained by illuminating a calibrated white target at several distances: this procedure creates a lookup table used for extracting the corrected intensity normalisation value and balancing the scene signals collected at the different distances, as expressed by the equation:
where:
- are respectively the normalised, collected-on-the-scene, and the white-calibrated intensity values,
- wl is the corresponding wavelength (660, 517, or 440 nm),
- the distances at each single pixel expressed by the coordinates (i,j).
A further colour correction is performed considering the back reflected intensity dispersion determined by the incident angle of the laser beam over the surface. This compensation is regulated by the equation:
where:
- are respectively the angle-corrected and normalised (as described above) intensity values,
- is obtained by the scalar product between the laser incident and surface normal vectors.
The final resulting colours are not complete in terms of spectral components due to the use of only three wavelengths. However, they are metrically correct, and the lock-in technique can reveal small intensity signals even in a light-noisy environment. This results in a final coloured texture of the investigated scene that is white-balanced at each distance and free of shadows, even at large distances (up to 35 m). Developed to operate in hostile environments, such as in the presence of ionising radiation, it has also been successfully used in other fields, such as the Cultural Heritage domain, helping to evaluate both the state of conservation from a structural point of view and colour alterations.
2.3. LIF Sensor
The second technology applied is based on the phenomenon of fluorescence induced by an ultraviolet laser and it is used to characterise the surface from a chemical point of view. Due to the large dimensions of the areas to be investigated, for the present work, among the available LIF prototypes available at the Diagnostic and Metrology Laboratory of the ENEA research centre of Frascati (Rome, Italy), a portable scanning system for rapid stand-off analyses has been used; it is based on technical solutions that can assure the ability to scan about 100 square meters in about 30 min with a spatial resolution of about 1 cm (Figure 3 right).
The main components of the prototype are a laser source at 248 nm with high pulse repetition rate up to 500 Hz, spot size of 6 mm × 3 mm and pulse energy of 16 mJ, an optical system, including a beam expander 8× and a motorised mirror, driving the laser beam to the target, lenses to collect the signal from the target and finally an ICCD (Intensified CCD) detector, with a fixed position and a large field of view, providing 2D fluorescence images. A filter wheel is mounted in front of the ICCD to detect fluorescence images at 8 preselected spectral bands identified by a previous study on materials of interest [30]. A LabView custom-made software allows the user to set experimental parameters, to define the scene to be scanned, to control the different components of the system, to acquire data and to perform preliminary fast data processing. Fluorescence images can be reconstructed in false colours by using the three most intense or interesting detected spectral features, associated respectively with red, green, and blue channels (RGB) or they can be processed to highlight only specific surface features. More details on the LIF sensor used are presented in [31]. Since the targets run no risk during the measurements, which take place from large distances (up to 10 m), without physical contact and without the need for scaffolding, the technique is particularly suitable for studying works of art, obtaining fluorescence maps and, therefore, compositional maps, for identifying the different materials present on the surface and highlighting features not visible by the naked eye, such as restorations, integrations, damages, and biological attacks.
The data fusion between RGB-ITR and LIF maps was performed by operating a manual detection of common points visible in both datasets. Applying affine matrix transformations, it was possible to spread the LIF maps over the RGB-ITR textures. This step is fundamental not only for overimposing information coming out from different diagnostic devices but also for processing algorithms that can correlate this information together for segmenting the scenes and classifying materials, biological attacks and structural defects.
The data fusion between RGB-ITR and LIF maps was obtained by using an ad hoc software called ITR-Analyzer (version 0.9). This software is a GUI based on MATLAB (version R2022B), and it is composed of several scripts, able to import and manipulate the data collected by the laser scanner RGB-ITR. This software is also able to import external data and superimpose them on the 3D laser-coloured point cloud collected by the ITR scanner. The script opens an interaction dialogue where the user can load the ITR coloured matrix and the external data, in this case, the LIF maps. After the user selects the common points between the two matrices, the algorithms process the best affine matrix that allows the LIF maps to spread over the ITR coloured matrix. If the result is correct, the multispectral matrices can be saved in an image file format and can be used as texture to load on the 3D model obtained by triangulating the point cloud collected by the ITR scanner. This result leads to the inspection of the digitalised scene with localised visible and invisible information, useful for segmenting and classifying materials, biological attacks and structural defects.
3. Results
As already highlighted, the measurements aimed to obtain information on both the masonry and the frescoes to provide updated data on the history of the building, both in antiquity and in the modern era, in order to study the changes in the use of spaces and the restoration phases and techniques used over the centuries. Below, the results obtained by LIF and RGB-ITR are presented for Room A and Room B. In both rooms, RGB-ITR has produced 3D models of the most interesting sectors. The collected data have been processed to enhance colour inhomogeneity, revealing details not clearly visible to the naked eye. LIF images have been collected at eight different wavelengths: 290, 315, 340, 380, 415, 445, 480, and 532 nm. These wavelengths have been chosen based on several considerations. In fact, polymeric materials, when excited by a source in the 245–270 nm range, exhibit fluorescence bands in the UV range [11]: sharp emissions of about 350 nm can be assigned to the presence of carbonyl groups. These groups are typical of vinylic and methylene chain-based polymers (such as polyethylene and polypropylene) [32]. Cellulose and carbonate-based materials, instead, show intense fluorescence bands in the range of 470–520 nm [33]. Moreover, previous data acquired in the laboratory on a selection of polymeric materials have allowed us to collect their fluorescence fingerprints, highlighting that aqueous polyurethane dispersions have a very intense peak centred at 320 nm, typical of the amide bond, and ethyl silicate presents a composed band in the range 290–370 nm due to the ethoxy groups [34]. These materials are of interest because they can be related to restoration actions carried out in the 20th century. Then, thanks to the use of the listed filters and to the already available reference fluorescence spectra, the data collected in Room A and Room B have been processed to obtain distribution maps of different compounds, such as acrylic and vinylic polymers, and to highlight masonry inhomogeneity.
3.1. Room A
In this room, measurements have been carried out on different walls and areas of ceiling and masonry.
Although the 8 fluorescence images collected by the LIF sensor from the walls and ceiling are not easy to read individually (Figure 4), their reprocessing allows us to highlight only the areas characterised by the presence of specific materials. In the first stage, an already developed and tested processing method based on K-means has been used to individuate different polymers and distinguish between them. With reference to [30], the ratios I376/I445, I340/I445, and I315/I445 have been used as variables in the K-means algorithm to gather the data in 7 clusters. In the present case, the normalisation has been set at I445 instead of I500, since the filter at 500 nm was not available. The results evidence the ability of the method to individuate different classes of materials on the studied surface (Figure 5). At first, it is possible to notice the ability to correctly individuate the areas without any analytical value (brown areas) and the ones related to non-treated plaster (in dark blue). The yellow, blue, and cyan areas refer to the presence of consolidant and protective agents, constituted mainly by synthetic polymers. Red pixels probably refer to the honeycomb panels, although the proximity of these areas to the upper physical border of the optical filters makes their evaluation not completely reliable.
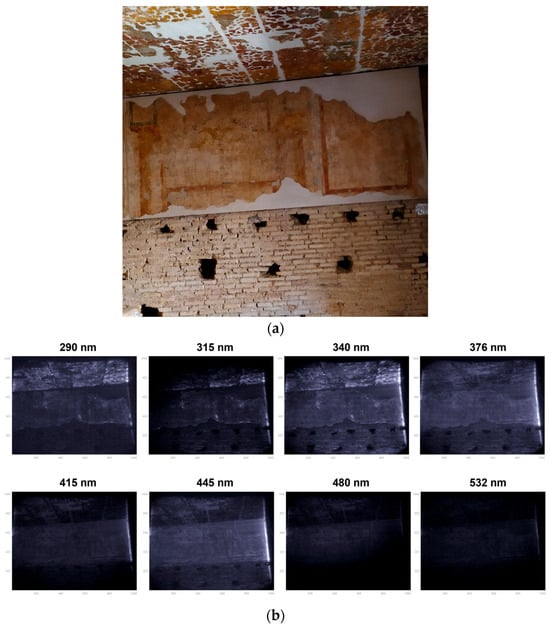
Figure 4.
(a) a picture of the west wall compared to (b) the raw fluorescence images collected at the eight wavelengths selected.
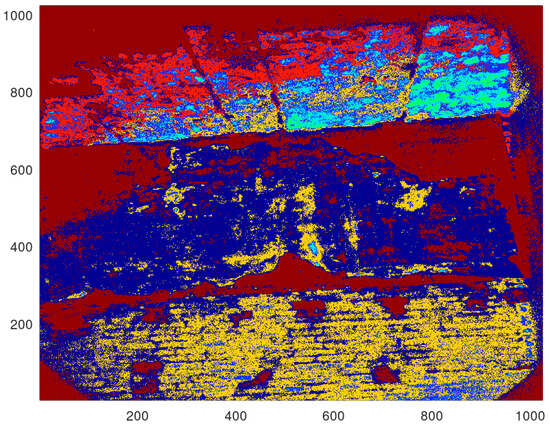
Figure 5.
K-means clustering in 7 groups performed on the LIF data collected on the west wall of Room A.
Subsequently, an attempt was made to highlight only acrylic consolidant materials. Based on the data previously collected from reference samples, the ratio 340/290 was selected for this purpose. Furthermore, the complementarity with the RGB-ITR technique allows these areas to be integrated into a 3D model as an additional layer. Figure 6 and Figure 7 present examples of the west wall and the ceiling. A short movie with LIF results as an additional texture of the 3D model produced by the RGB-ITR system is presented as Supplementary Materials attached to the present paper.
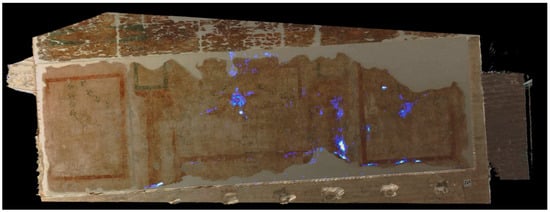
Figure 6.
Spatial distribution of polymeric acrylic protective on the west wall of Room A detected by LIF and overlapped with the 3D model produced by the RGB-ITR. A short movie can be found in the Supplementary Materials attached to the paper.
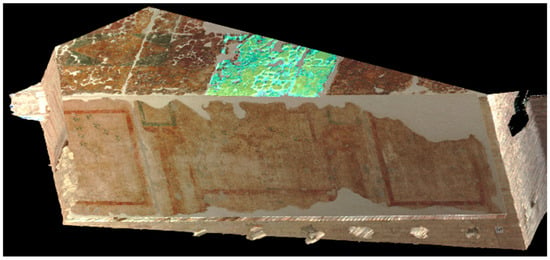
Figure 7.
Spatial distribution of polymeric consolidating on the ceiling of Room A detected by LIF and overlapped with the 3D model produced by the RGB-ITR. A short movie can be found in the Supplementary Materials attached to the paper.
The PAOA archaeologists hypothesise, based on considerations of the graphic composition of other mural paintings present in the same house of Diana and in other buildings in Ostia, that, on the west wall, the most significant presence of the protective layer is in correspondence with the areas that must have contained the central figurative animal and vegetal elements of the fresco. Probably during the restoration works, some areas considered more interesting, and in any case with colours no longer bright, were treated with protective agents which also had the function of polishing. Then, over time, however, these polymeric materials worsened the readability of the fresco, probably due to the waterproofing of the film, which favours salt sub-efflorescence phenomena and a more rapid accumulation of dust [35]. In addition, the processing of RGB-ITR data allowed for the recovery of these details of the decoration (Figure 8). Three curves for the calibration of the colours were built up during the in-field campaign as a function of distance, using repeated measurements of a white target, Spectralon STR-99-020, placed at different distances and illuminated by the three lasers of the RGB-ITR system. After the application of such correction, the colours of the entire 3D models were enhanced with recursive processing in order to show what the original appearance of the decorations might have been.
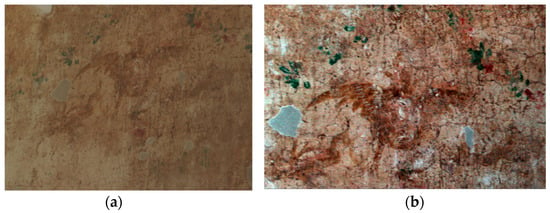
Figure 8.
Result of the RGB-ITR data processing. (a) raw data acquired by the RGB-ITR scanner; (b) and image enhancement after the calibration procedure.
After using data processing useful for the identification of areas with acrylic polymers, irregularities in the masonry have been put in evidence with the use of false colour images. In these images, a triplet of fluorescence intensity data, at selected wavelengths, have been used as RGB input. In particular, R = I340, G = I376, B = I290. The use of false colours allows for obtaining LIF images that can mark simultaneously the presence of more than one substance on the studied surface. In this kind of image (Figure 9), for Room A, both consolidating polymeric material (in light pink) and masonry discontinuity (green/yellow and brown) are mapped.
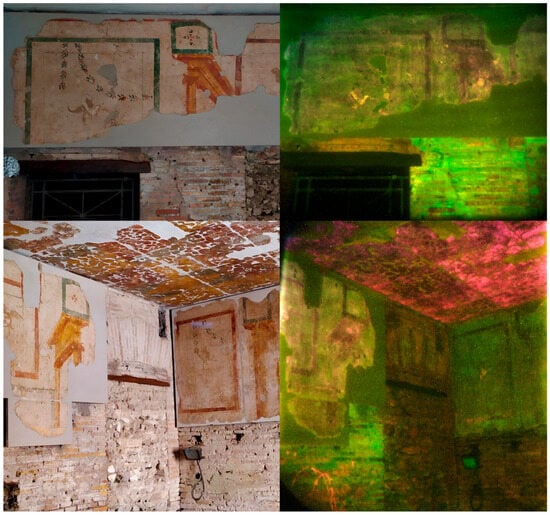
Figure 9.
West wall (top) and south wall (bottom) of Room A. Comparison between picture (on the left) and false colour LIF image (on the right).
The discontinuities detected on the masonry highlight the differences between the original masonry, which has greater fluorescence, and the walls affected by restoration work, which appear darker because they were made with mortars whose binders have different chemical characteristics.
The images clearly highlight the presence of two different building phases in masonry.
3.2. Room B
In Room B LIF measurements have been carried out and the 3D model has been created for the north-west area. In Figure 10, LIF images at the 8 wavelengths corresponding to the filters used are presented.
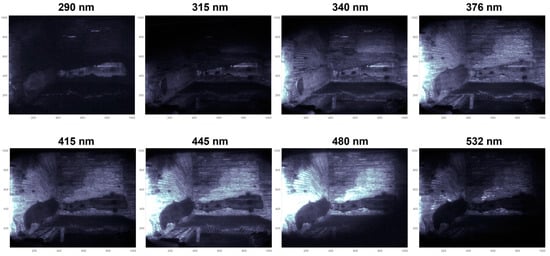
Figure 10.
Fluorescence images at 8 different wavelengths collected by the LIF sensor. The lighter the areas are the more intense the fluorescence signal is (corresponding to a higher concentration of fluorescent material in that area).
Once the raw data are processed, it is possible to obtain the maps reported in Figure 11, that highlight the presence of different substances on the surface.
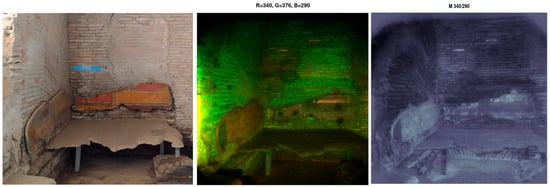
Figure 11.
Results of the processing of LIF data of the north-west corner of Room B, compared with a picture (on the left). In false colours (in the center), deriving from the same procedure used for Figure 9 right, and in greyscale (on the right) to put in evidence consolidating treatment on the decorations.
As for Room A, the LIF data processing highlights different characteristics regarding both the masonry and the fresco decorations. As regards the masonry, it makes the areas subjected to reconstruction, already in ancient times, clearly visible. The boundaries of the reconstructed area are identified, although probably made with reused original bricks (Figure 11 left). The reconstructed area on the north wall would seem to correspond to that of a bricked-up door at the time of the architectural and functional transformation of the building (4th century). The rest of the wall (darker area) must be recognised as a “mimetic” restoration carried out between the 1930s and 1940s. This is part of the restoration works carried out on a large scale in Ostia in that period with additions done using the same building materials used in Roman times and found in large quantities in the collapses. In many cases, therefore, the portions of restored masonry are completely indistinguishable from the original ones, unless they turn into expensive and invasive operations such as the sampling and chemical-physical analysis of the mortars. For this reason, the LIF results, which demonstrate its ability to distinguish between the original masonry and the restored one, are all the more interesting.
As regards the fresco decoration, the LIF measurements, in Room B too, document a modern restoration intervention, with the presence of synthetic polymeric material probably used as a protective agent only on some parts of the decorations (light orange/pink areas in Figure 11 centre and light grey areas in the Figure 11 right). In Figure 11 centre, since an RGB representation is used, different hues correspond to different surface compositions. In Figure 11 right, only the value of the intensity ratio I340/I290 is shown using greyscale, so that, comparing the results of the LIF investigation with the historical documentation relating to the restoration interventions, it is possible to hypothesise that the different values of this ratio are linked to a different concentration of the material detected, most likely identifiable with the Paraloid® (acrylic resin). This synthetic polymer has been widely used since the end of the 1960s to consolidate the paint film, to allow the detachment of the paints, and to revive the colours by saturating their tone [36]. Furthermore, two other areas are highlighted by LIF on the fresco of Room B (Figure 11 centre): the one on the far left, which shows a complete discontinuity with the rest, and areas of approximately circular shape (4) on the decoration on the north wall. The latter do not present any fluorescence band, thus suggesting the presence of materials that absorb radiation, but are not active in fluorescence, as happens for example in the case of historical earth pigments.
Then, the LIF results allow, on one hand, the integration of knowledge related to previous conservation interventions, helping to reconstruct specific actions that were otherwise undocumented, and, on the other hand, they help guide possible new investigations.
Data fusion with 3D created with RGB-ITR enables the rapid spatial positioning of these details, which a not visible to the naked eye (a short video has been produced and is available as Supplementary Materials) (Figure 12).
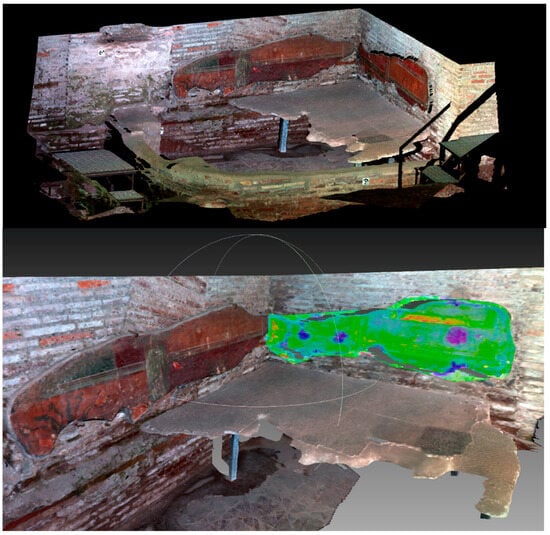
Figure 12.
(Top): a screenshot of the HR 3D with native colours produced by RGB-ITR. (Bottom): after the data fusion processing, using a LIF map as additional texture layer.
4. Conclusions
The investigations conducted using two laser technologies developed by the Diagnostic and Metrology Laboratory (DIM) of the ENEA research centre in Frascati, inside the House of Diana in Ostia Antica, have provided complementary results and information: the RGB-ITR scanner created 3D-coloured models of two rooms of the House and the LIF systems produced 2D compositional maps of the surfaces, which were used as an additional texture of the 3D models. This combination allowed the creation of easily readable and visually engaging virtual objects of the House: 3D models with real and/or enhanced colours that help extract details of the decoration, which are almost completely lost. These models were enriched with additional textures providing chemical information on the substances constituting walls, ceilings, and decorations, thereby offering insights into the historical phases of the building. In particular, the method used was able to document the masonry structure of Room A and of the north and west walls of Room B, which resulted in showing the various transformations that have affected the building over the centuries. The analyses highlighted the presence of different materials relating to two distinct phases. Regarding the masonry in both Room A and Room B, the different fluorescence responses of the binder used in the mortars made it possible to distinguish the portions of the original masonry from those that were reconstructed or remodelled later. These transformations, which are hardly legible to the naked eye, are clearly revealed in the fluorescence images and can be precisely located thanks to the ability to use the LIF maps as textures of the 3D model created by RGB-ITR. As for the paintings, moreover, LIF revealed materials not visible to the naked eye, in particular traces of consolidating and protective agents. On the surfaces, these must be related to the conservation interventions carried out between 1989 and 1990, which involved the counter-detachment of the paintings, their repositioning on panels in materials that were innovative at the time, and the treatment with organic fixatives. The latter, however, have over time altered the legibility of the paintings. It is probably no coincidence that the protective and consolidating agents have been identified in particular in correspondence with the most valuable figurative elements, which, nevertheless, are today scarcely legible. The results of the analyses carried out on the ceiling of Room A highlighted the presence of synthetic polymeric resins different from those detected on the wall paintings, and in much higher concentrations. These results appear to be consistent with the complex conservative history of the building, whose fragments, found in collapse, were painstakingly reconstructed on concrete supports in the 1970s and later replaced in the 1990s by more innovative honeycomb panels. In conjunction with the ability of LIF to discriminate between different classes of materials, however, the limitations of this technique in identifying individual materials within the same class with precision are to be noted. For the future, therefore, measurements on some interesting spots of masonry and decoration with more selective analytical methods are desirable; they could provide complementary data of greater detail from the chemical point of view, that could be useful as reference data with further LIF imaging measurements in Ostia context.
The work has, in this way, on one hand, demonstrated the capability of the combined use of LIF and RGB-ITR scanners, on the other hand, it has provided valuable historical information about an important complex without requiring any sampling, scaffolding or long processing time, ensuring a reduction in analysis and monitoring times and costs. Furthermore, thanks to the fact that they are not influenced by ambient lighting conditions, the presented sensors can also be used on masonry and painted surfaces stored in different contexts, for example outdoors.
Supplementary Materials
The following supporting information can be downloaded at: https://www.mdpi.com/article/10.3390/app15042172/s1, Video S1: 3D model with LIF additional layer of the west wall of Room A; Video S2: 3D model with LIF additional layer of Room B.
Author Contributions
Conceptualization, all authors; in field investigation, L.C., M.F., M.G. and V.S.; data curation, V.S. and M.G.; writing—original draft preparation, V.S.; writing—review and editing, L.C., A.D., M.F., M.G., D.T. and C.T. All authors have read and agreed to the published version of the manuscript.
Funding
This research has been co-funded by ESA (European Spatial Agency) in the frame of the project VADUS (Virtual Access and Digitalization for Unreachable Sites) with the contract n. 4000132720/20/NL/AF.
Data Availability Statement
The authors own the data supporting reported data. They can be contacted by email to provided addresses. There are not privacy or ethical restrictions.
Acknowledgments
The authors would like to thank the partners of the VADUS project and in particular the coordinator Alessandro Rossi (NEXT—Ingegneria dei Sistemi). Moreover, the authors gratefully acknowledge Massimiliano Ciaffi and Marco Pistilli, from ENEA Diagnostic and Metrology Laboratory, for their assistance during the external field campaign.
Conflicts of Interest
The authors declare no conflicts of interest. The funder had no role in the design of the study; in the collection, analyses, or interpretation of data; in the writing of the manuscript; or in the decision to publish the results.
Abbreviations
The following abbreviations are used in this manuscript:
| AR | Augmented Reality |
| CCD | Charge-Coupled Device |
| CH | Cultural Heritage |
| ESA | European Spatial Agency |
| HR | High Resolution |
| LIF | Laser Induced Fluorescence |
| MRI | Magnetic Resonance Imaging |
| NDT | Non-Destructive Technologies |
| RGB-ITR | Red Green Blue Imaging Topological Radar |
| UV | Ultraviolet |
| VR | Virtual Reality |
| XRF | X-ray Fluorescence |
References
- Crisan, A.; Pepe, M.; Costantino, D.; Herban, S. From 3D Point Cloud to an Intelligent Model Set for Cultural Heritage Conservation. Heritage 2024, 7, 1419–1437. [Google Scholar] [CrossRef]
- Yastikli, N. Documentation of cultural heritage using digital photogrammetry and laser scanning. J. Cult. Herit. 2007, 8, 423–427. [Google Scholar] [CrossRef]
- Adamopoulos, E.; Rinaudo, F. Close-Range Sensing and Data Fusion for Built Heritage Inspection and Monitoring—A Review. Remote Sens. 2021, 13, 3936. [Google Scholar] [CrossRef]
- Hofer, K.E. Nondestructive Testing, in Materials Testing. Encyclopedia Britannica. Available online: https://www.britannica.com/technology/materials-testing (accessed on 19 December 2024).
- Galli, A.; Bonizzoni, L. Contribution of X-ray Fluorescence Techniques in Cultural Heritage Materials Characterization. Appl. Sci. 2022, 12, 6309. [Google Scholar] [CrossRef]
- Dritsa, V.; Orazi, N.; Yao, Y.; Paoloni, S.; Koui, M.; Sfarra, S. Thermographic Imaging in Cultural Heritage: A Short Review. Sensors 2022, 22, 9076. [Google Scholar] [CrossRef] [PubMed]
- Santos, S.D.; Poirot, N.; Brochard, N. Ultrasound-based multimodal imaging for cultural heritage: Aging of the weathered Tuffeau stone. In Proceedings of the 15th Biennial Baltic Electronics Conference (BEC), Tallinn, Estonia, 3–5 October 2016; pp. 147–150. [Google Scholar] [CrossRef]
- Reis, A.; Vehlken, S. Understanding the Entire Object: Magnetic Resonance Techniques in Cultural Heritage Research; Propylaeum-DOK—Digital Repository Classical Studies; Heidelberg University Library: Heidelberg, Germany, 2024. [Google Scholar]
- Lanteri, L.; Agresti, G.; Pelosi, C. A New Practical Approach for 3D Documentation in Ultraviolet Fluorescence and Infrared Reflectography of Polychromatic Sculptures as Fundamental Step in Restoration. Heritage 2019, 2, 207–215. [Google Scholar] [CrossRef]
- Jones, C.; Duffy, C.; Gibson, A.; Terras, M. Understanding multispectral imaging of cultural heritage: Determining best practice in MSI analysis of historical artefacts. J. Cult. Herit. 2020, 45, 339–350. [Google Scholar] [CrossRef]
- Ghervase, L.; Cortea, I.M. Lighting Up the Heritage Sciences: The Past and Future of Laser-Induced Fluorescence Spectroscopy in the Field of Cultural Good. Chemosensors 2023, 11, 100. [Google Scholar] [CrossRef]
- Caneve, L.; Guarneri, M.; Lai, A.; Spizzichino, V.; Ceccarelli, V.; Mazzei, B. Non-destructive laser-based techniques for biodegradation analysis in cultural heritage. NDT E Int. 2019, 104, 108–113. [Google Scholar] [CrossRef]
- De Fino, M.; Galantucci, R.A.; Fatiguso, F.C. Condition Assessment of Heritage Buildings via Photogrammetry: A Scoping Review from the Perspective of Decision Makers. Heritage 2023, 6, 7031–7066. [Google Scholar] [CrossRef]
- Payne, A.D.; Dorrington, A.A.; Cree, M.J.; Carnegie, D.A. Improved measurement linearity and precision for AMCW time-of-flight range imaging cameras. Appl. Opt. 2010, 49, 4392–4403. [Google Scholar] [CrossRef] [PubMed][Green Version]
- Junttila, S.; Hölttä, T.; Puttonen, V.; Katoh, M.; Vastaranta, V.; Kaartinen, H.; Holopainen, M.; Hyyppä, H. Terrestrial laser scanning intensity captures diurnal variation in leaf water potential. Remote Sens. Environ. 2021, 255, 112274. [Google Scholar] [CrossRef]
- Axelsson, C.R.; Lindberg, E.; Persson, H.J.; Holmgren, J. The use of dual-wavelength airborne laser scanning for estimating tree species composition and species-specific stem volumes in a boreal forest. Int. J. Appl. Earth Obs. Geoinf. 2023, 118, 103251. [Google Scholar] [CrossRef]
- Guarneri, M.; Ceccarelli, S.; Ferri De Collibus, M.; Francucci, M.; Ciaffi, M. Multi-wavelengths 3D laser scanning for pigment and structural studies on the frescoed ceiling the Triumph of Divine Providence. ISPRS Archives 2019, 42, 549–554. [Google Scholar] [CrossRef]
- Vadus Project. Available online: https://business.esa.int/projects/vadus (accessed on 10 February 2024).
- Marinucci, A.; Falzone, S. La Maison de Diane (I iii 3-4), in Ostie. Port et Porte de la Rome Antique. Catalogue Exposition (Genève, 22-01/22-07-2001); Musée d’art et d’histoire de Genève: Geneva, Switzerland, 2001; pp. 230–244. [Google Scholar]
- Marinucci, A. L’insula Ostiense di Diana (R. I, III, 3-4); Arbor Sapientiae: Rome, Italy, 2013. [Google Scholar]
- Becatti, G. Scavi di Ostia II. I Mitrei; Arbor Sapientiae: Rome, Italy, 1954. [Google Scholar]
- Melega, A. I Mitrei di Ostia Antica; Arbor Sapientiae: Rome, Italy, 2022. [Google Scholar]
- Scatigno, C.; Prieto-Taboada, N.; García-Florentino, C.; Fdez-Ortiz de Vallejuelo, S.; Maguregui, M.; Madariaga, J.M. Combination of in situ spectroscopy and chemometric techniques to discriminate different types of Roman bricks and the influence of microclimate environment. Environ. Sci. Pollut. Res. 2018, 25, 6285–6299. [Google Scholar] [CrossRef]
- Cardarelli, E.; De Donno, G.; Oliveti, I.; Scatigno, C. Three-dimensional reconstruction of a masonry building through electrical and seismic tomography validated by biological analyses. Near Surf. Geophys. 2018, 16, 53–65. [Google Scholar] [CrossRef]
- Scatigno, C.; Preite Martinez, M.; Prieto-Taboada, N.; Madariaga, J.M.; Conte, A.M. Petrographic-Mineralogical Characterization of Archaeological Materials from “Casa di Diana” Mithraeum Sited in the Open Museum of Ostia Antica. Crystals 2021, 11, 839. [Google Scholar] [CrossRef]
- Rinaldi, E. Restauro e Conservazione a Ostia Nella Prima Metà del Novecento. Ph.D. Thesis, Roma Tre University, Rome, Italy, 2012. [Google Scholar]
- Ceccarelli, S.; Guarneri, M.; Ferri de Collibus, M.; Francucci, M.; Ciaffi, M.; Danielis, A. Laser Scanners for High-Quality 3D and IR Imaging in Cultural Heritage Monitoring and Documentation. J. Imaging 2018, 4, 130. [Google Scholar] [CrossRef]
- Nitzan, D.B. The Measurement and Use of Registered Reflectance and Range Data in Scene Analysis. Proc. IEEE 1977, 65, 206–220. [Google Scholar] [CrossRef]
- Poujouly, S.J. A twofold modulation frequency laser range finder. J. Opt. A Pure Appl. Opt. 2002, 4, S356–S363. [Google Scholar] [CrossRef]
- Spizzichino, V.; Caneve, L.; Colao, F.; Ruggiero, L. Characterization and Discrimination of Plastic Materials Using Laser-Induced Fluorescence. Appl. Spectrosc. 2016, 70, 1001–1008. [Google Scholar] [CrossRef]
- Spizzichino, V.; Caneve, L.; Colao, F. Stand-Off Device for Plastic Debris Recognition in Post-Blast Scenarios. Challenges 2016, 7, 23. [Google Scholar] [CrossRef]
- Htun, M. Characterization of High Density Polyethylene Using Laser-Induced Fluorescence (LIF). J. Polym. Res. 2012, 19, 9823. [Google Scholar] [CrossRef]
- Toffolo, M.B.; Ricci, G.; Caneve, L.; Kaplan-Ashiri, I. Luminescence reveals variations in local structural order of calcium carbonate polymorphs formed by different mechanisms. Sci. Rep. 2019, 9, 16170. [Google Scholar] [CrossRef]
- Spizzichino, V.; Bertani, L.; Caneve, L.; Caso, M.F. Rapid analysis of marble treatments by laser induced fluorescence. Opt. Quantum Electron. 2020, 52, 117. [Google Scholar] [CrossRef]
- Gittins, M. Riflessioni Sulle Problematiche Operative di un Restauro Complesso: Gli Affreschi di Filippo Lippi nel Duomo di Pratok; C.B.C. Conservazione Beni Culturali: Rome, Italy, 2017. [Google Scholar]
- Molina, M.T.; Salvadori, B.; Cano, E. Exploration of coating alternatives for the protection of bare steel and brass in scientific-technical artefacts. Herit. Sci. 2023, 11, 208. [Google Scholar] [CrossRef]
Disclaimer/Publisher’s Note: The statements, opinions and data contained in all publications are solely those of the individual author(s) and contributor(s) and not of MDPI and/or the editor(s). MDPI and/or the editor(s) disclaim responsibility for any injury to people or property resulting from any ideas, methods, instructions or products referred to in the content. |
© 2025 by the authors. Licensee MDPI, Basel, Switzerland. This article is an open access article distributed under the terms and conditions of the Creative Commons Attribution (CC BY) license (https://creativecommons.org/licenses/by/4.0/).