
Fourier Transform Infrared (FTIR) Database of Historical Pigments: A Comparison Between ATR-FTIR and DRIFT Modalities


Abstract
1. Introduction
- i.
- When the IR light can pass through the sample, transmission, which usually provides high spectral resolution, is the most suitable modality. However, it is considered destructive as a pelleting procedure is usually required; the sample must be grinded and mixed with another solid, typically potassium bromide (KBr). Samples can also be examined in a diamond anvil cell by previously compressing the sample (ergo, also destructive).
- ii.
- When the IR light cannot pass completely through the sample, ATR-FTIR is the most suitable since the light only interacts with the first few microns (µm) of the sample. However, in order to apply ATR (with benchtop or portable equipment), it is necessary to exert pressure with the equipment plunger against the FTIR crystal (made up of diamond, germanium or zinc selenide), and is therefore destructive.
- iii.
- Lastly, reflectance modality can also be used and is recommended when samples cannot be taken from the artwork and in situ measurements are needed. Here, measurements can be performed in three different manners as follows: (1) reflection-absorption where the IR light passes through a very thin sample and reflects on a reflective substrate, which is useful for analysing thin tissues or coatings; (2) specular reflection, where the IR light is bounced off a reflective surface, which is useful for examining samples like polymers, gemstones, metals, thin films, glass, etc.; and (3) diffuse reflection, where the light is scattered off a sample surface (Diffuse Reflectance Infrared Fourier Transform spectroscopy, DRIFT), which is commonly applied to characterise rough and matte surfaces such as stones and paintings.
2. Materials and Methods
3. Results
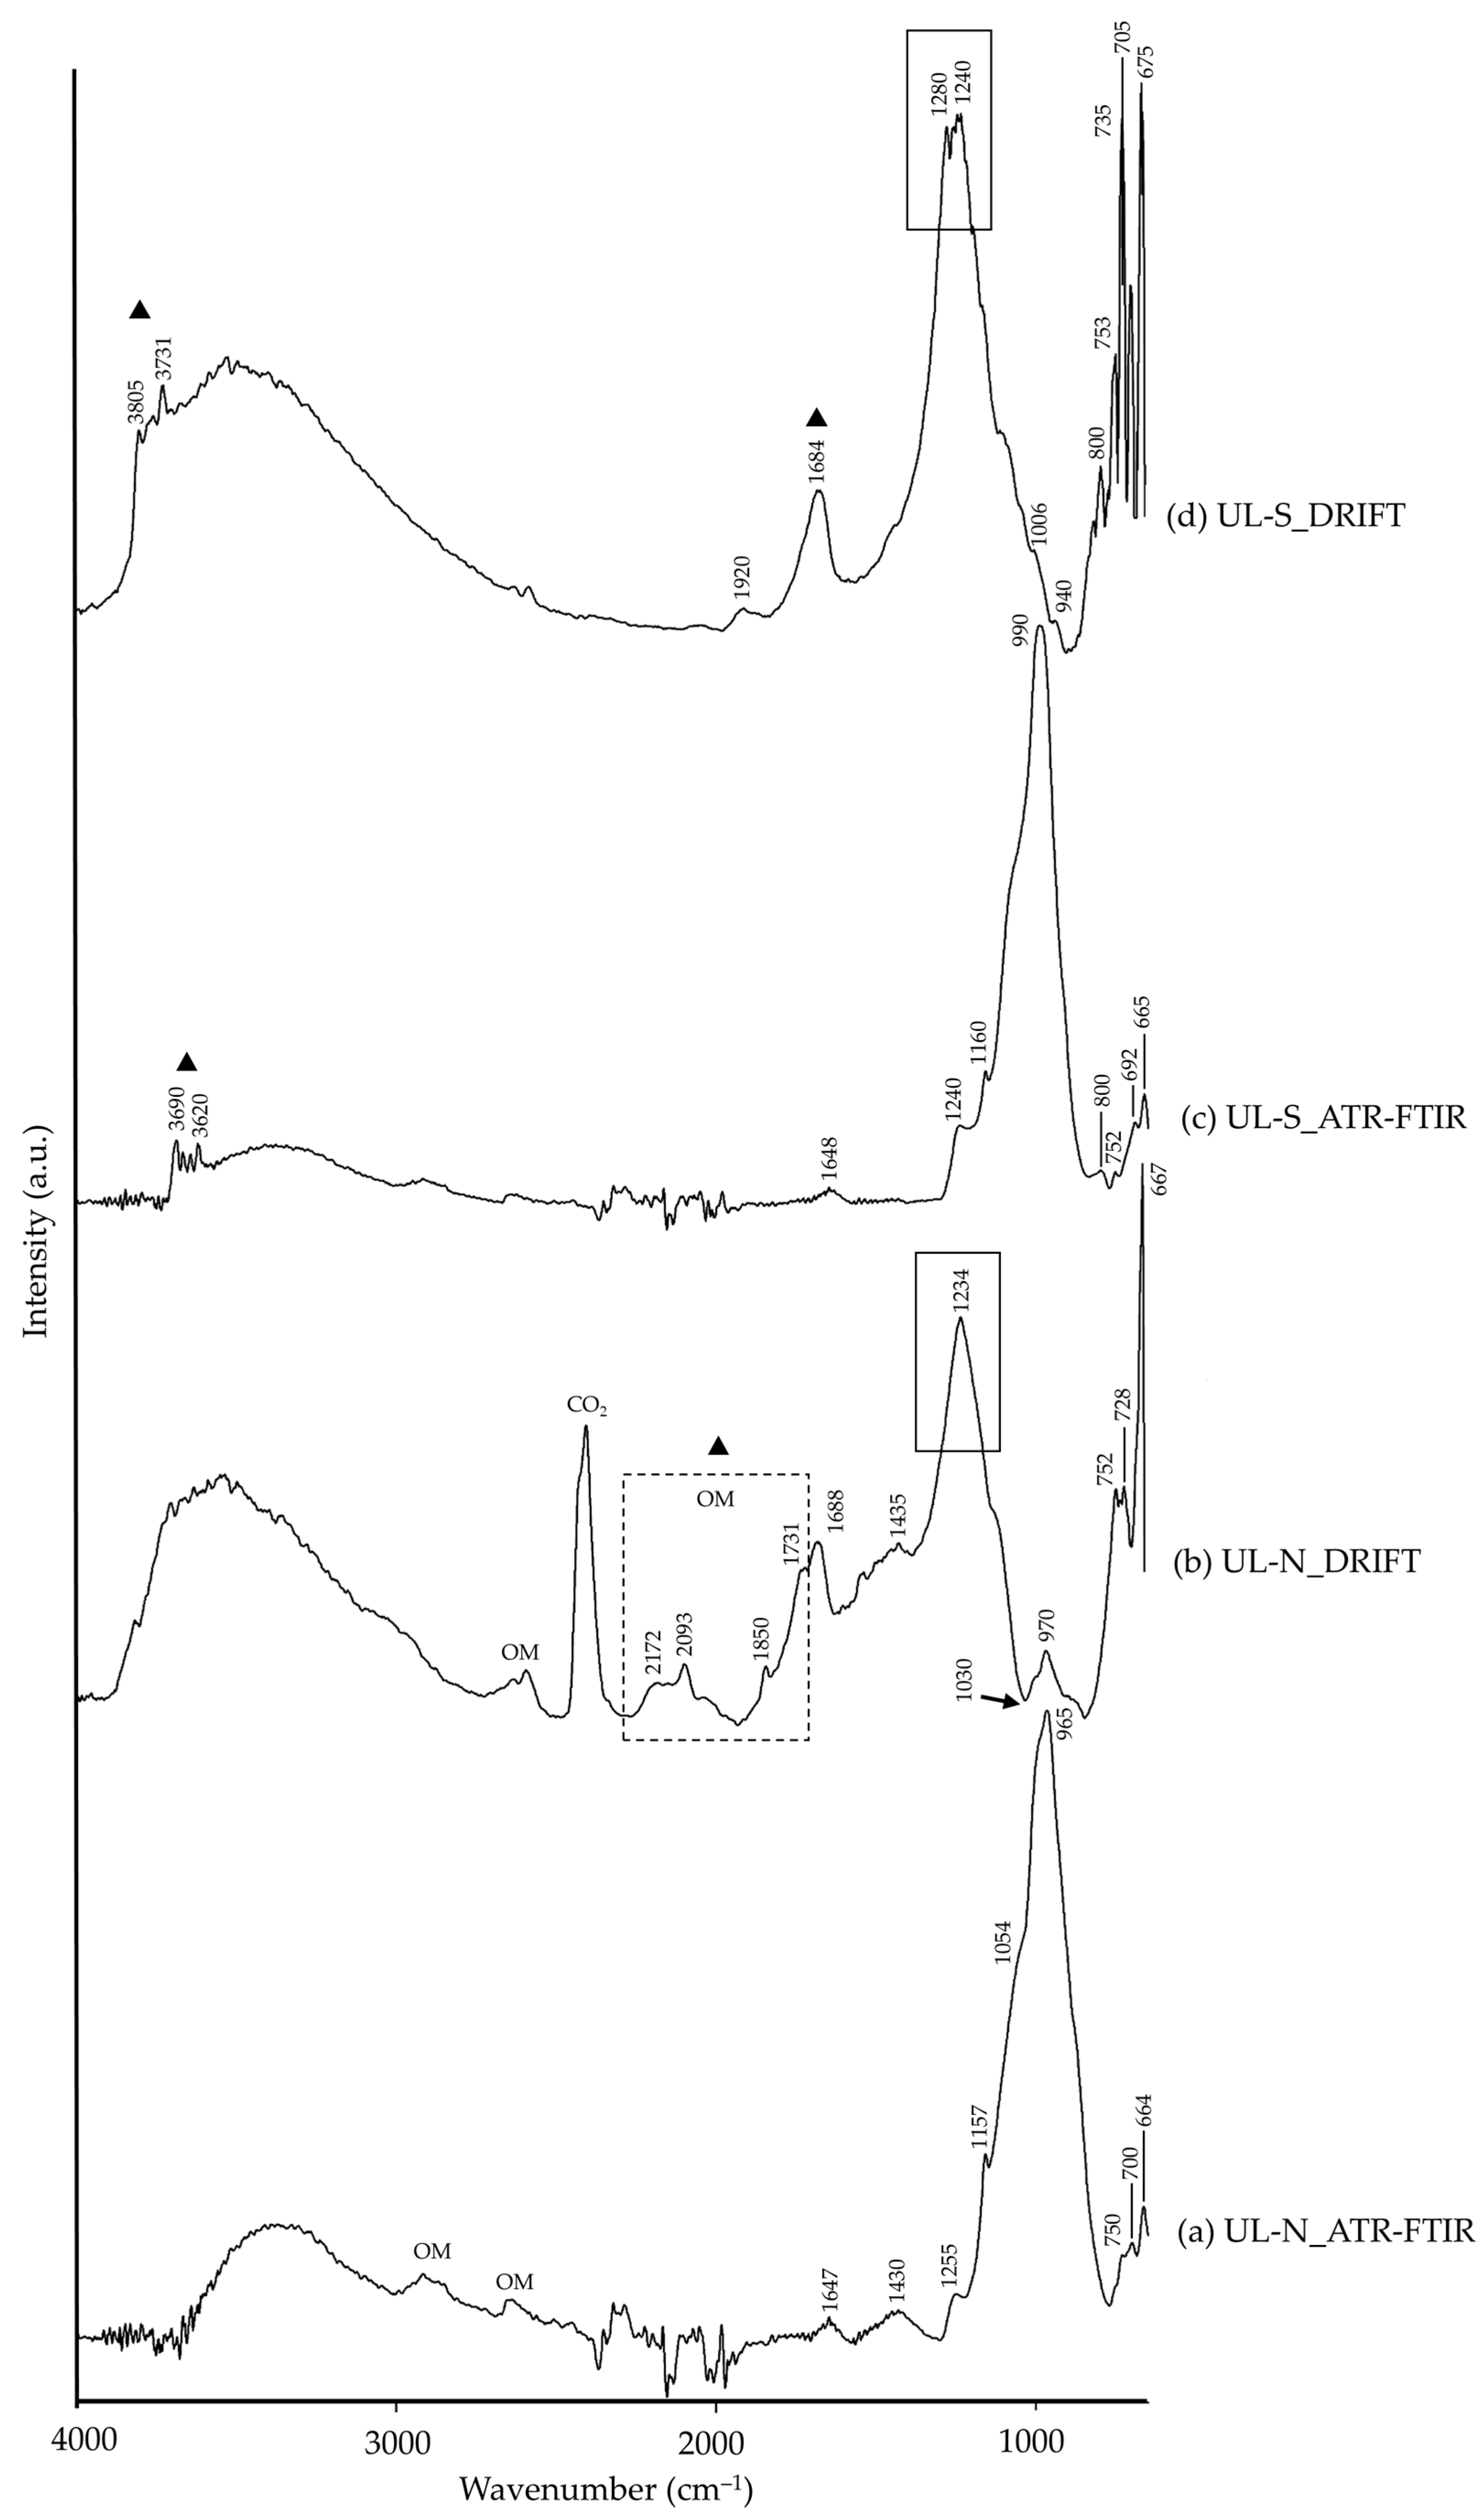
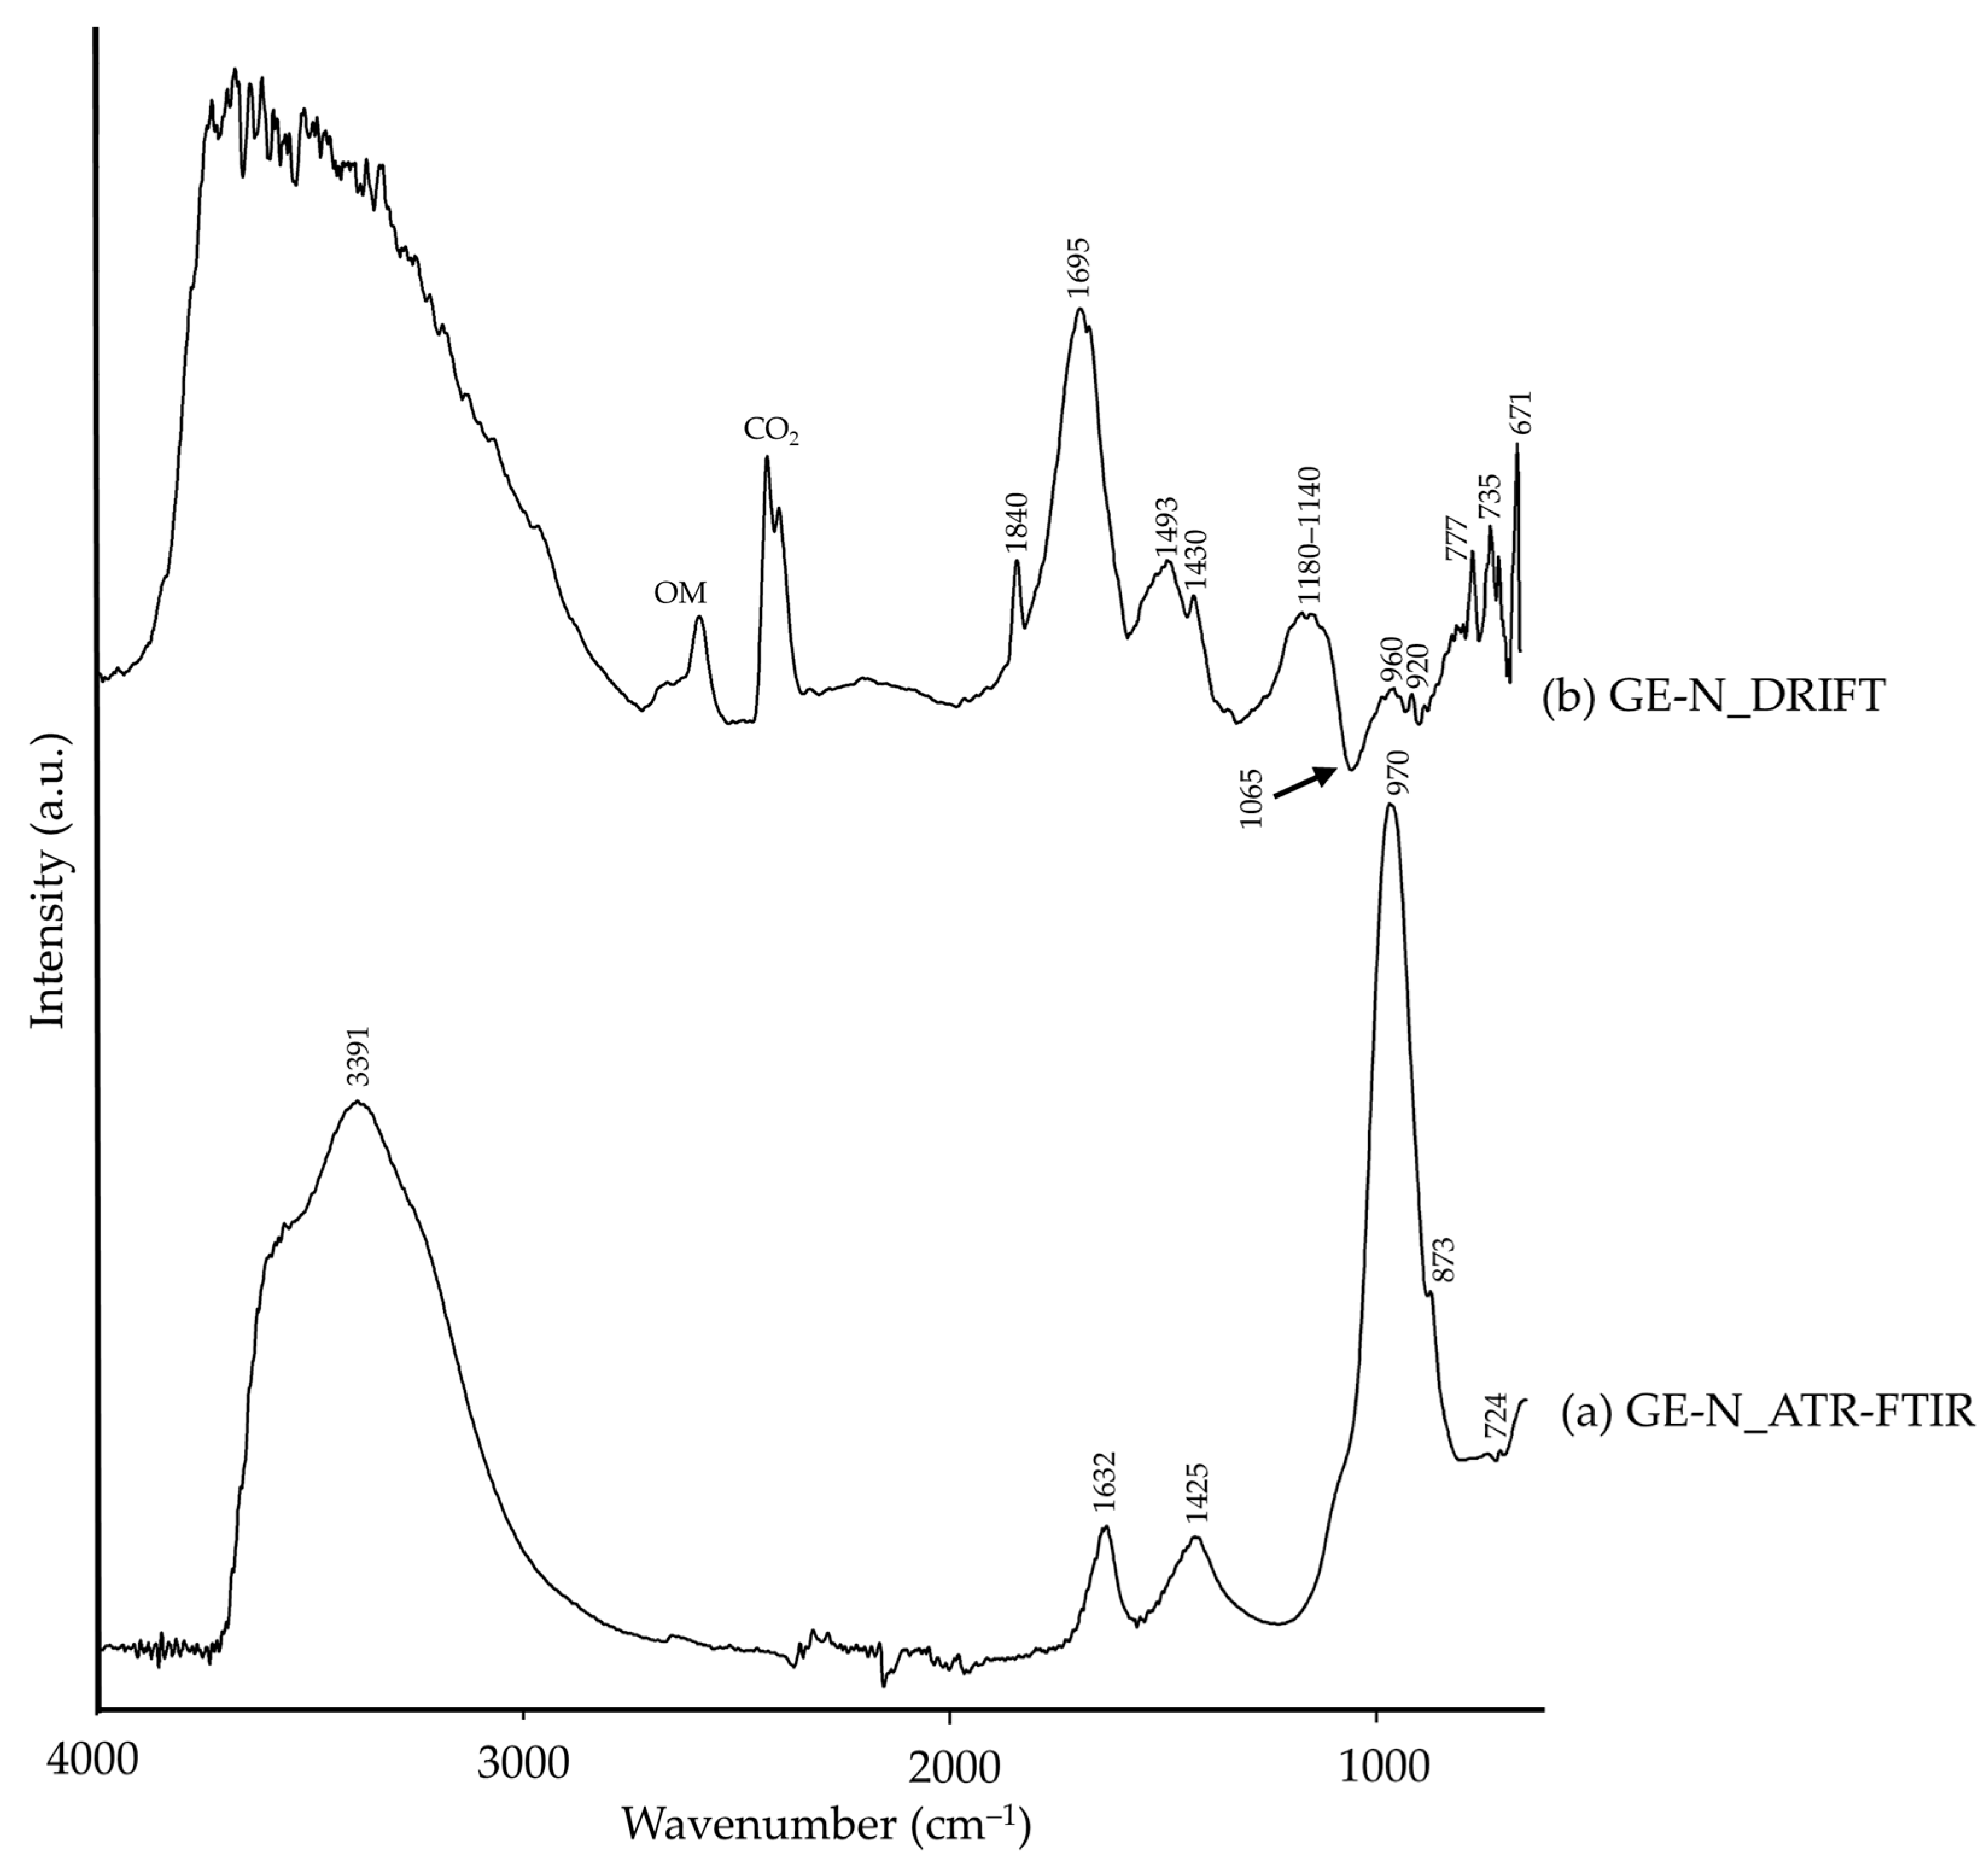
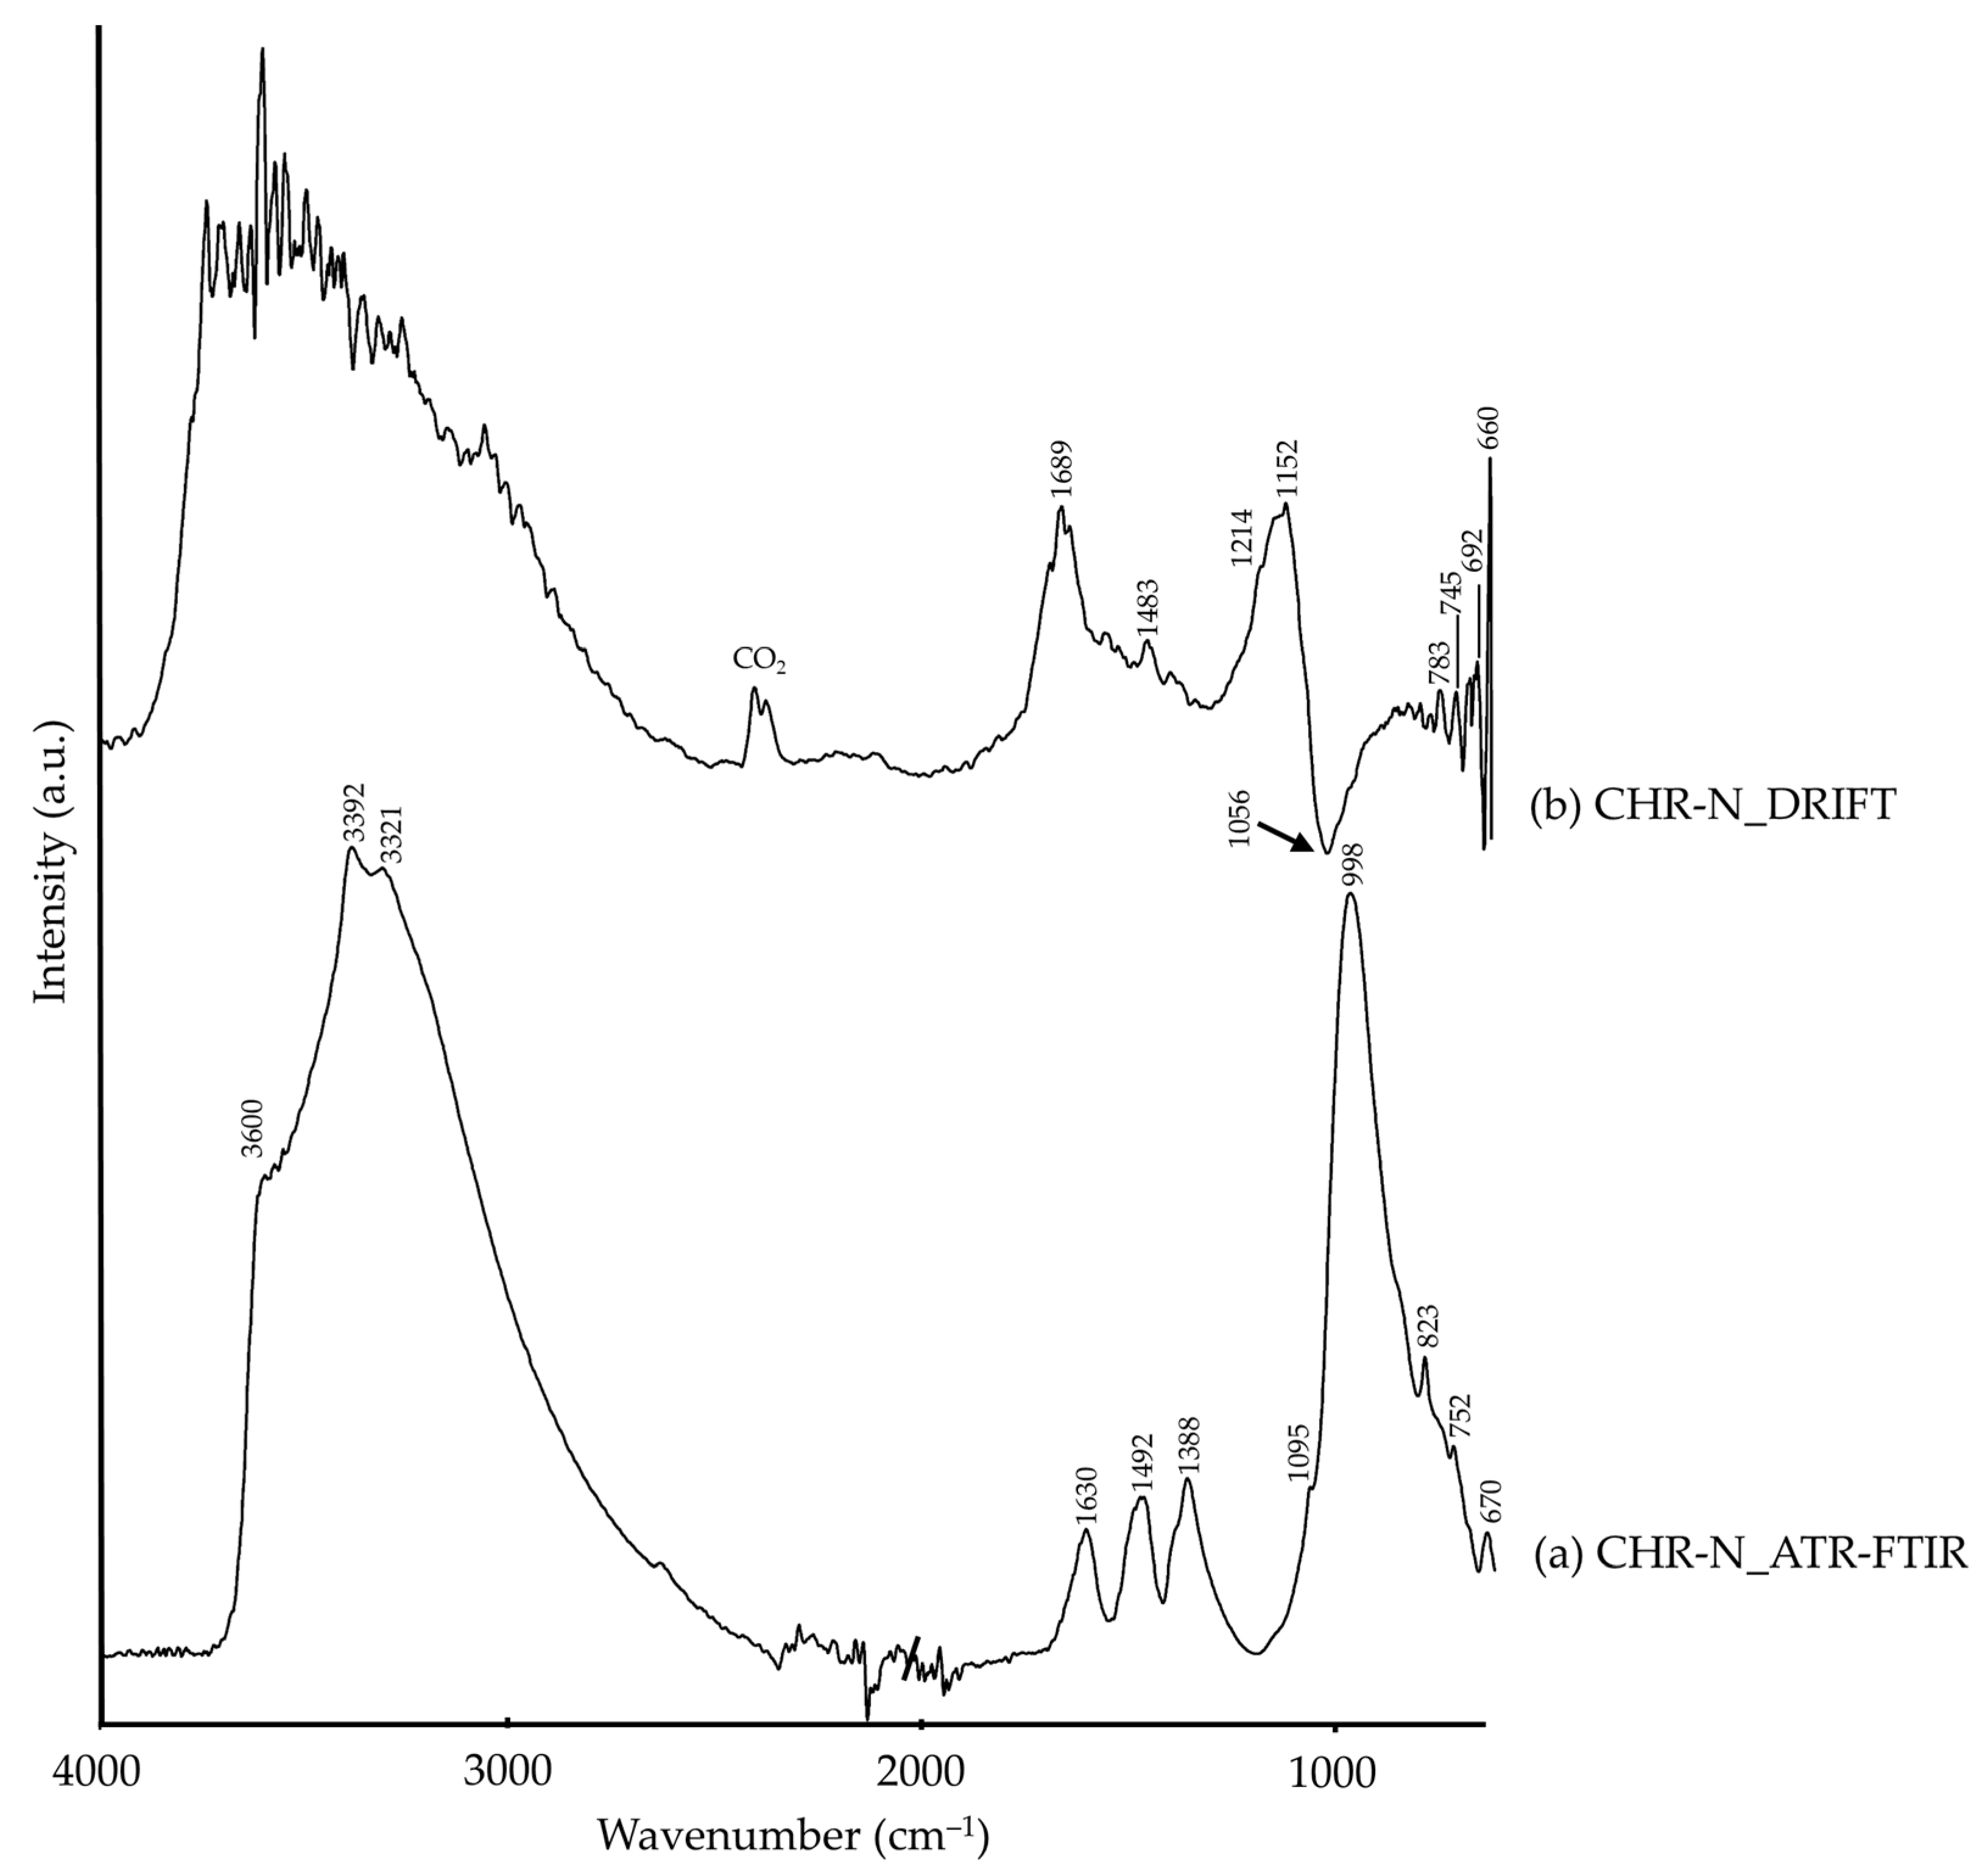
3.1. Silicate Pigments

| Pigment | ATR-FTIR | DRIFT | ||
|---|---|---|---|---|
| Wavenumber (cm−1) | Assignment 1 | Wavenumber (cm−1) | Assignment 1 | |
| EGB-S | 2042, 1930, 1820 | ν+δ(Si–O), cuprorivaite [14] | ||
| 1735 | νs+δ(CO32−), calcite [26] | |||
| 1647 | –OH [26] | |||
| 1490 | CO32−, calcite [26] | 1353 | νas(CO32−), calcite [26] | |
| 1227, 1158, 1049, 997 | νas(Si–O), cuprorivaite [30,31] | 1264, 1175, 1057, 662 | νs(Si–O), cuprorivaite [32,33] | |
| 802 | νs(Si–O), quartz [8,34] | 775, 711, 684 (Reststrahlen) | Si–O, quartz [29,35] | |
| 756, 665 | νs(Si–O), cuprorivaite [30,31] | |||
| UL-N | 3600–3000 | –OH [26], muscovite (?) | 3800–3000 | –OH [26], muscovite (?) |
| 2911, 2859, 2639 | ν(–CH), organic matter [26] | 2607, 2172, 2093, 1850, 1731 | ν(–CH), organic matter [26] | |
| 1647 | –OH [26] | 1688 | –OH [26] | |
| 1430 | CO32− [26], calcite (?) | 1435 | CO32− [26], calcite (?) | |
| 1255 | ν(C–O–C), calcite [26] | |||
| 1157, 1054 | SiO32−, silicate [26] | 1234, 1030 (Reststrahlen) | νas(Si–O or Si,Al–O), lazurite [15,36,37] | |
| 965 | Si,Al–O, sodalite [38,39] | 970 | νas(Si–O), sodalite [10] | |
| 750 | Al–O–Si, muscovite [40] | 752, 728 | Al–O–Si, muscovite (?) | |
| 700 | νas(Si,Al–O), lazurite [9,41] | |||
| 664 | –SO42−, lazurite [41] | 667 | –SO42−, lazurite [15] | |
| UL-S | 3690, 3621 | δ(–OH), kaolinite [42] | 3805–3700 | –OH, kaolinite [35] |
| 1920 | CO32−, carbonate [26] | |||
| 1648 | –OH [26] | 1684 | –OH [26] | |
| 1240, 1160 | SiO32−, silicate [26] | 1280, 1240 | νas(Si–O) or νas(Si,Al–O), lazurite [36,37] | |
| 990 | Si,Al–O, sodalite [38,39] | 1006, 940, 800 | Al–OH, kaolinite [35] | |
| 800, 752, 692 | Al,Si–O, kaolinite [43] | 753, 735, 705 | Si–O, silicate [26] | |
| 665 | –SO42−, lazurite [41] | 675 | –SO42−, lazurite [15] | |
| GE-N | 3500–3100 | ν(–OH), aluminosilicates [44] | 3800–2900 | –OH, aluminosilicates [26] |
| 1840 | νs+δ(CO32−), calcite [14] | |||
| 1632 | –OH [26] | 1695 | –OH [26] | |
| 1175–1150 | Si–O [26], silicates | |||
| 1425, 873 | νas(CO32−), calcite [8,45] | 1493, 1430 | CO32−, calcite [11,35] | |
| 1065(Reststrahlen) | ν(Si–O), glauconite [15] | |||
| 970, 724 | Si–O, glauconite/celadonite [43,46,47] | 960, 920 | Si,Al–O, kaolinite [26] | |
| 777, 735 | Si–O [26], silicates | |||
| 671 | δ(Si–O), glauconite [48] | |||
| CHR-N | 3600, 3321 | –OH [26,49], malachite (?) | 3800–3000 | ν(–OH), malachite [50,51] |
| 3392 | δ(–OH), malachite [18] | |||
| 1630 | δ(–OH), chrysocolla [18] | 1689 | –OH [26] | |
| 1492, 1388, 1095, 823 | CO32−, malachite [18] | 1483 | CO32−, malachite (?) | |
| 998 | Si–O, chrysocolla [49] | 1214, 1152 | SiO32−, silicate [26] | |
| 752 | Si–O [26], chrysocolla (?) β(CO32−), malachite [52] | 1056 (Reststrahlen) | ν(Si–O), chrysocolla (?) | |
| 670 | Si–O, quartz [8,34] | 790–690, 660 | Si–O, quartz [26] | |
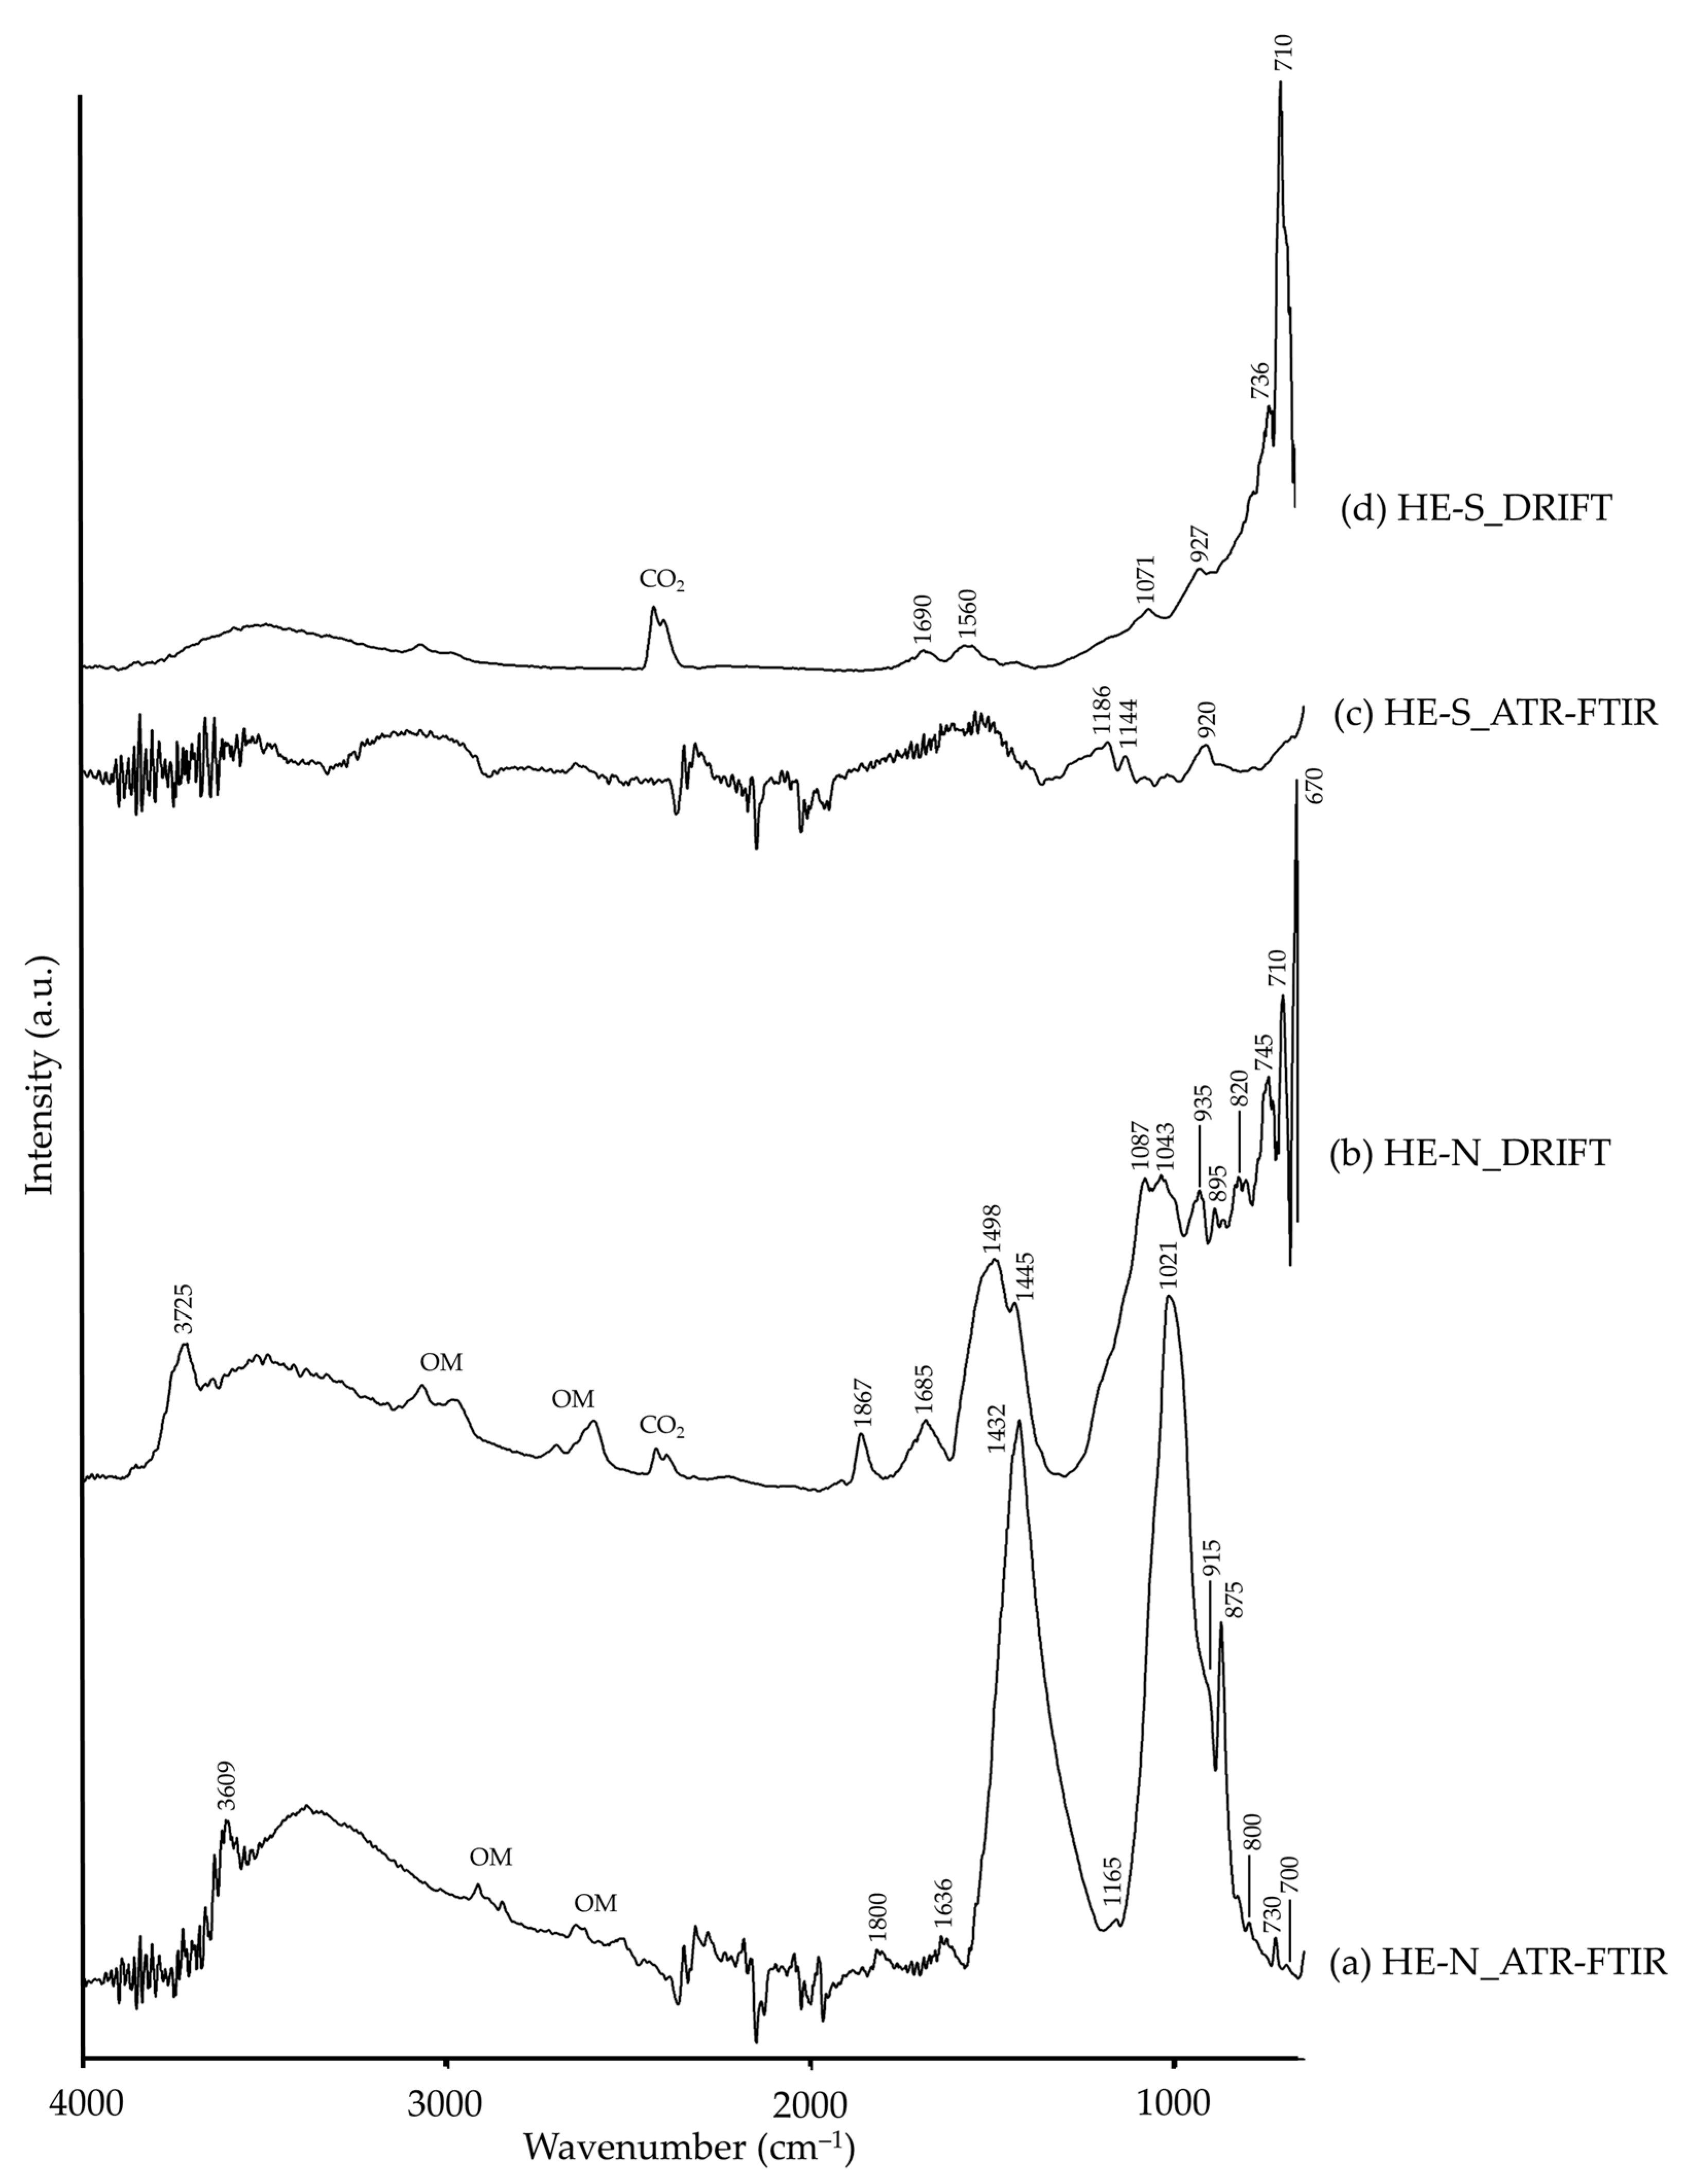
3.2. Oxide Pigments
| Pigment | ATR-FTIR | DRIFT | ||
|---|---|---|---|---|
| Wavenumber (cm−1) | Assignment 1 | Wavenumber (cm−1) | Assignment 1 | |
| HE-N | ~3609 | ν(–OH), aluminosilicate [42] | 3725 | ν(–OH), aluminosilicate [35] |
| 3540–3045 | –OH [26], aluminosilicate (?) | 3650–3150 | –OH [26], aluminosilicate (?) | |
| 1800 | νs+δ(CO32−), dolomite (?) | 1867 | νs+δ(CO32−) [14], dolomite | |
| 1636 | –OH [26] | 1685 | –OH [26] | |
| 1432, 875, 730 | CO32−, dolomite [63] | 1498, 1445 | CO32− [26], dolomite (?) | |
| 1165 | Si–O, quartz [44] | 1087, 1043, 745, 710 | Si–O, quartz [26] | |
| 1021 | Si–O, kaolinite [44] | 935, 895, 820 | Al–OH, kaolinite [35] | |
| 915 | Al–OH, kaolinite [44] | |||
| 800 | Al,Si–O, kaolinite [43] | |||
| 700 | Al–O [26], kaolinite (?) | 670 | Si–O, quartz [35] | |
| HE-S | 1690, 1560 | –OH [26] | ||
| 1186, 1144, 920 | Si–O, quartz [26] | 1071, 927, 736, 710 | Si–O, quartz [26,35] | |
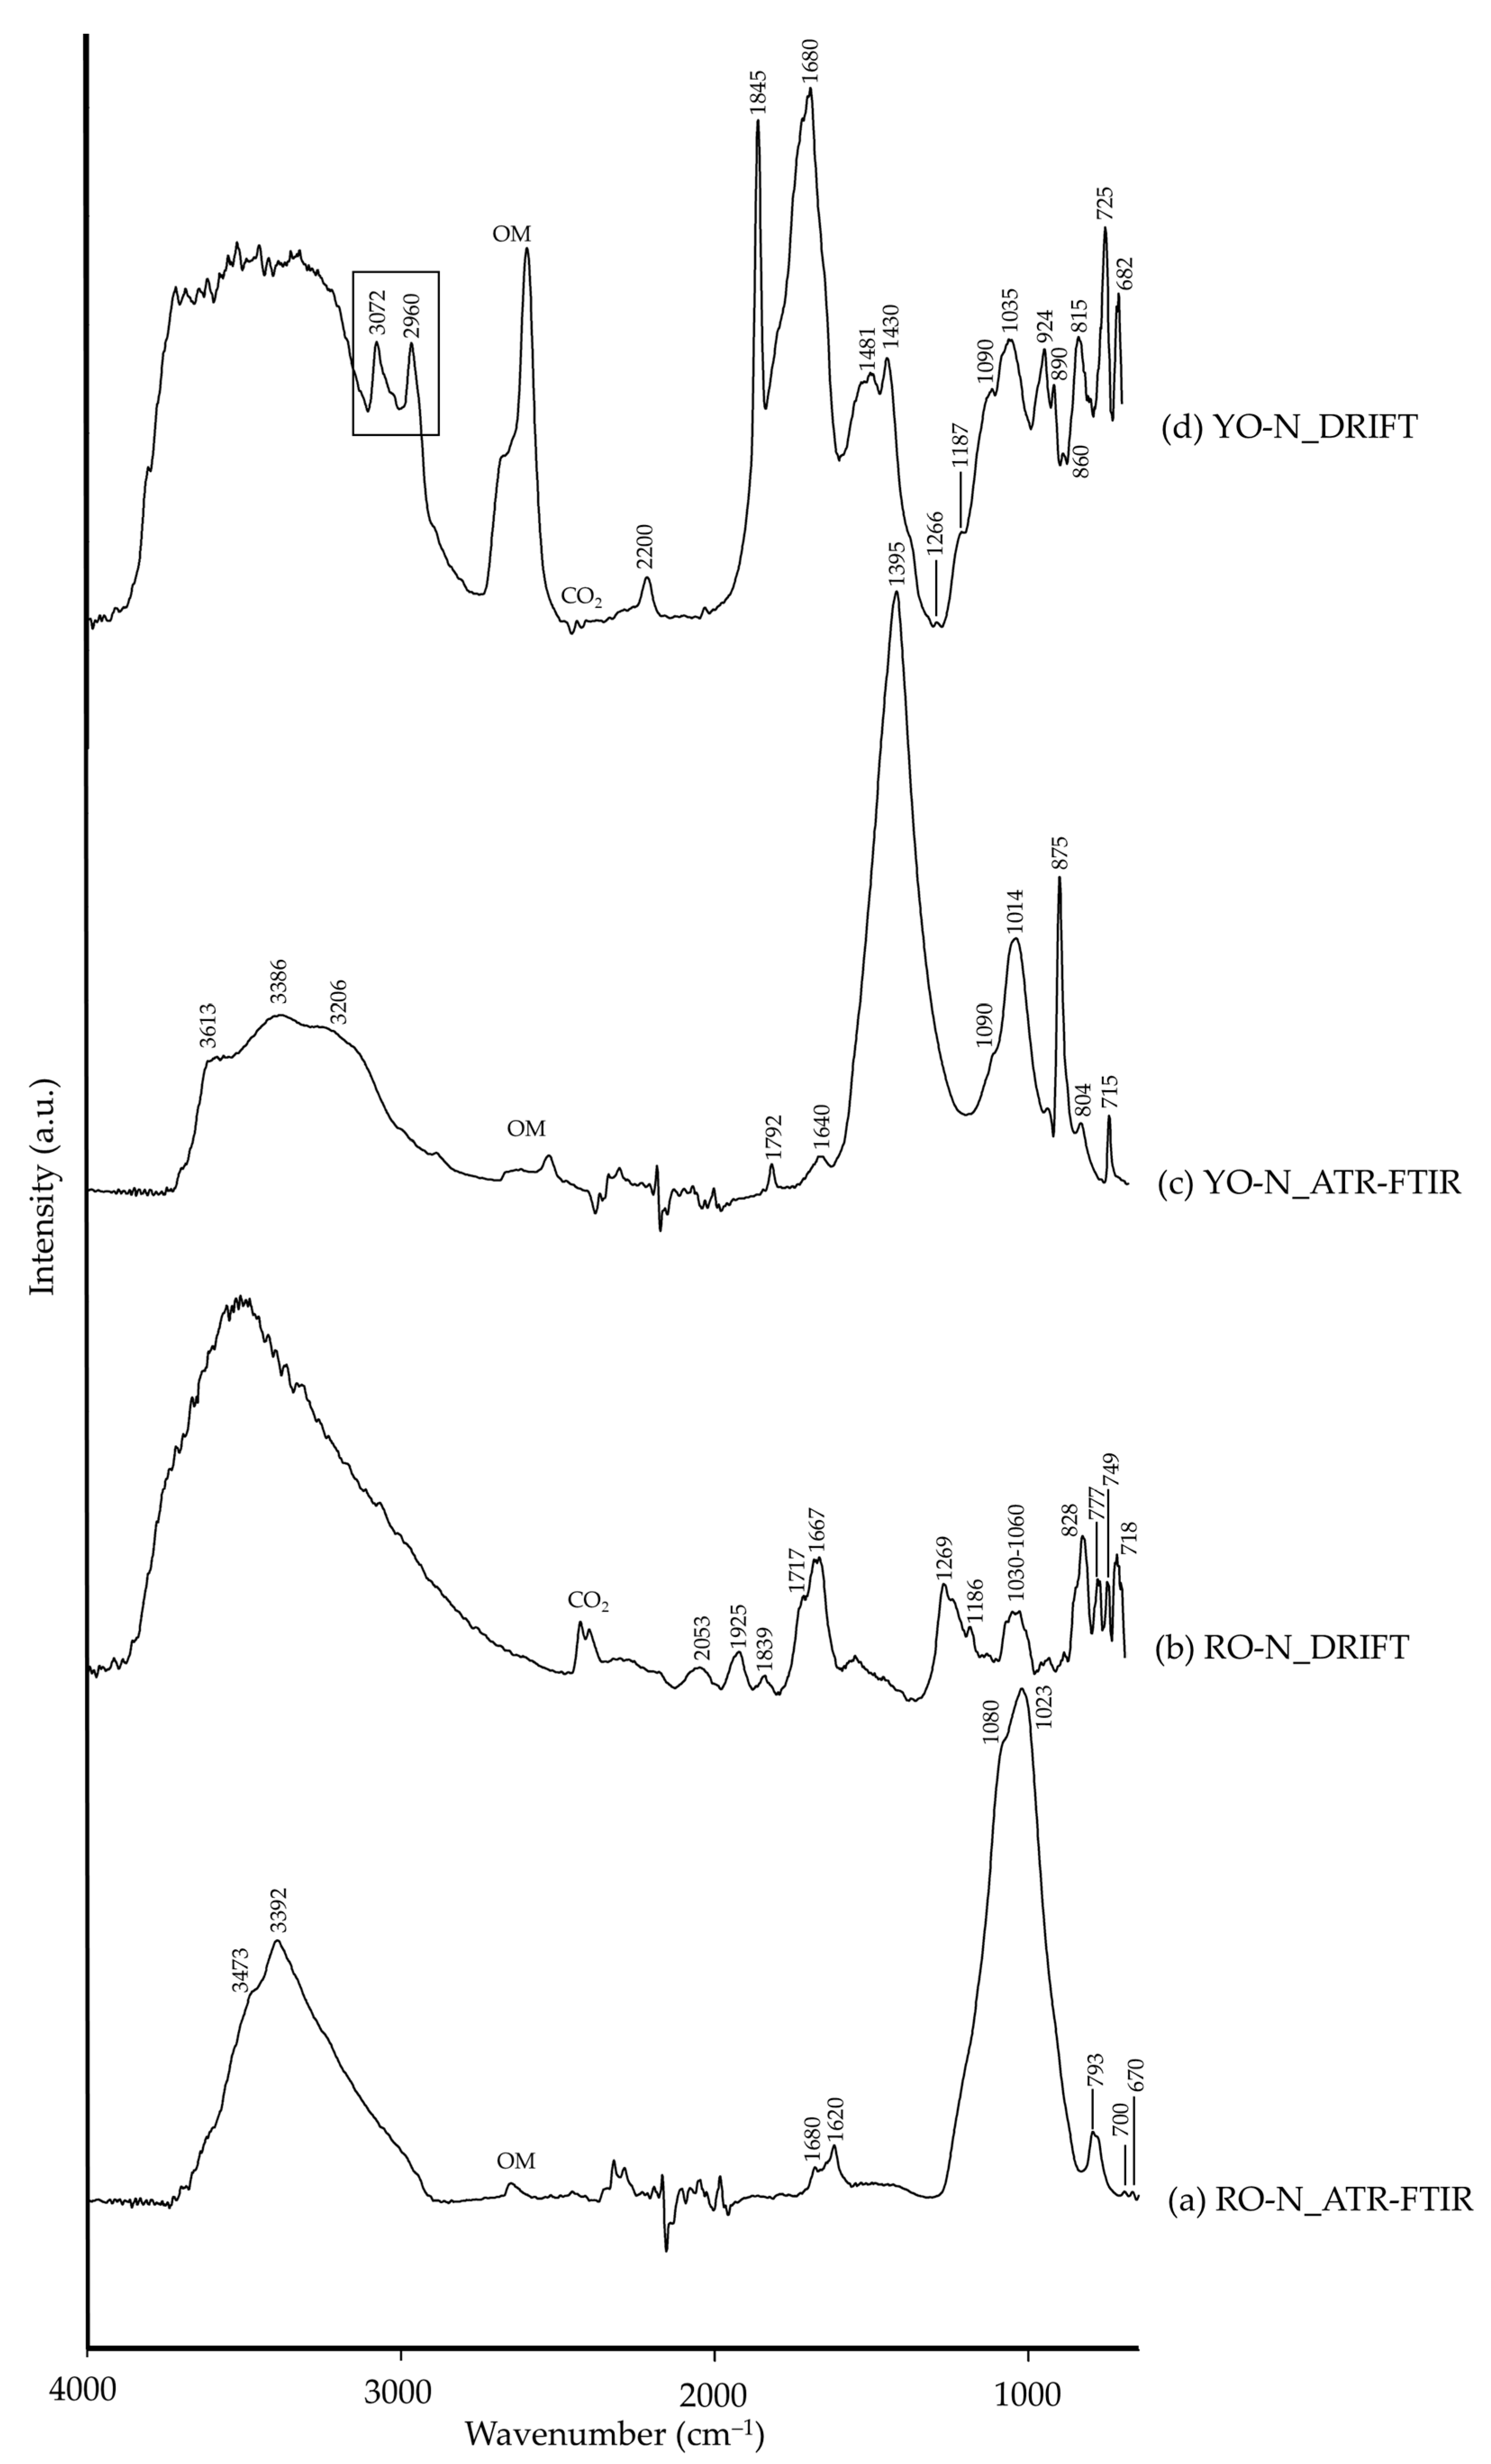
| RO-N | 3700–3000 | ν(–OH), aluminosilicate [26], illite (?) | 3800–2900 | ν(–OH), aluminosilicate [35,64], illite (?) |
| 2053 | ν+δ(Si–O) [14,35], quartz (?) | |||
| 1925, 1839 | νs+δ(CO32−), calcite [26] | |||
| 1680, 1620 | –OH [26], gypsum (?) | 1720–1660 | –OH [26], gypsum (?) | |
| 1269, 1186 | C–O [26], calcite (?) | |||
| 1080, 1023, 793 | Si–O, quartz [8,34] | 1030–1060 | Si–O, silicate [26] | |
| 828, 777, 749, 718 | Si–O, quartz [35] | |||
| 700, 670 | ν(S–O) [26], gypsum (?) | |||
| YO-N | 3650–3100 | –OH [26], goethite (?) | 3700–3150, 3072, 2960 | ν(–OH), goethite [26,65] |
| 1792 | C=O, calcite [8,45] | 1845 | δ(CO32−), calcite [26] | |
| 1640 | –OH [26], goethite (?) | 1680 | –OH [26], goethite (?) | |
| 1395 | CO32−, calcite [8,45] | 1481, 1430, 725 | CO32−, calcite [35] | |
| 1266, 1187 | C–O [26], calcite (?) | |||
| 1090, 1014, 804 | Si–O, silicate [26] | 1090, 1035, 924 | Si–O, silicate [26] | |
| 875 | νas(CO32−), calcite [8,45] | 890, 860, 815, 682 | δ(CO32−), calcite [26] | |
| 715 | νs(CO32−), calcite [8,45] | |||
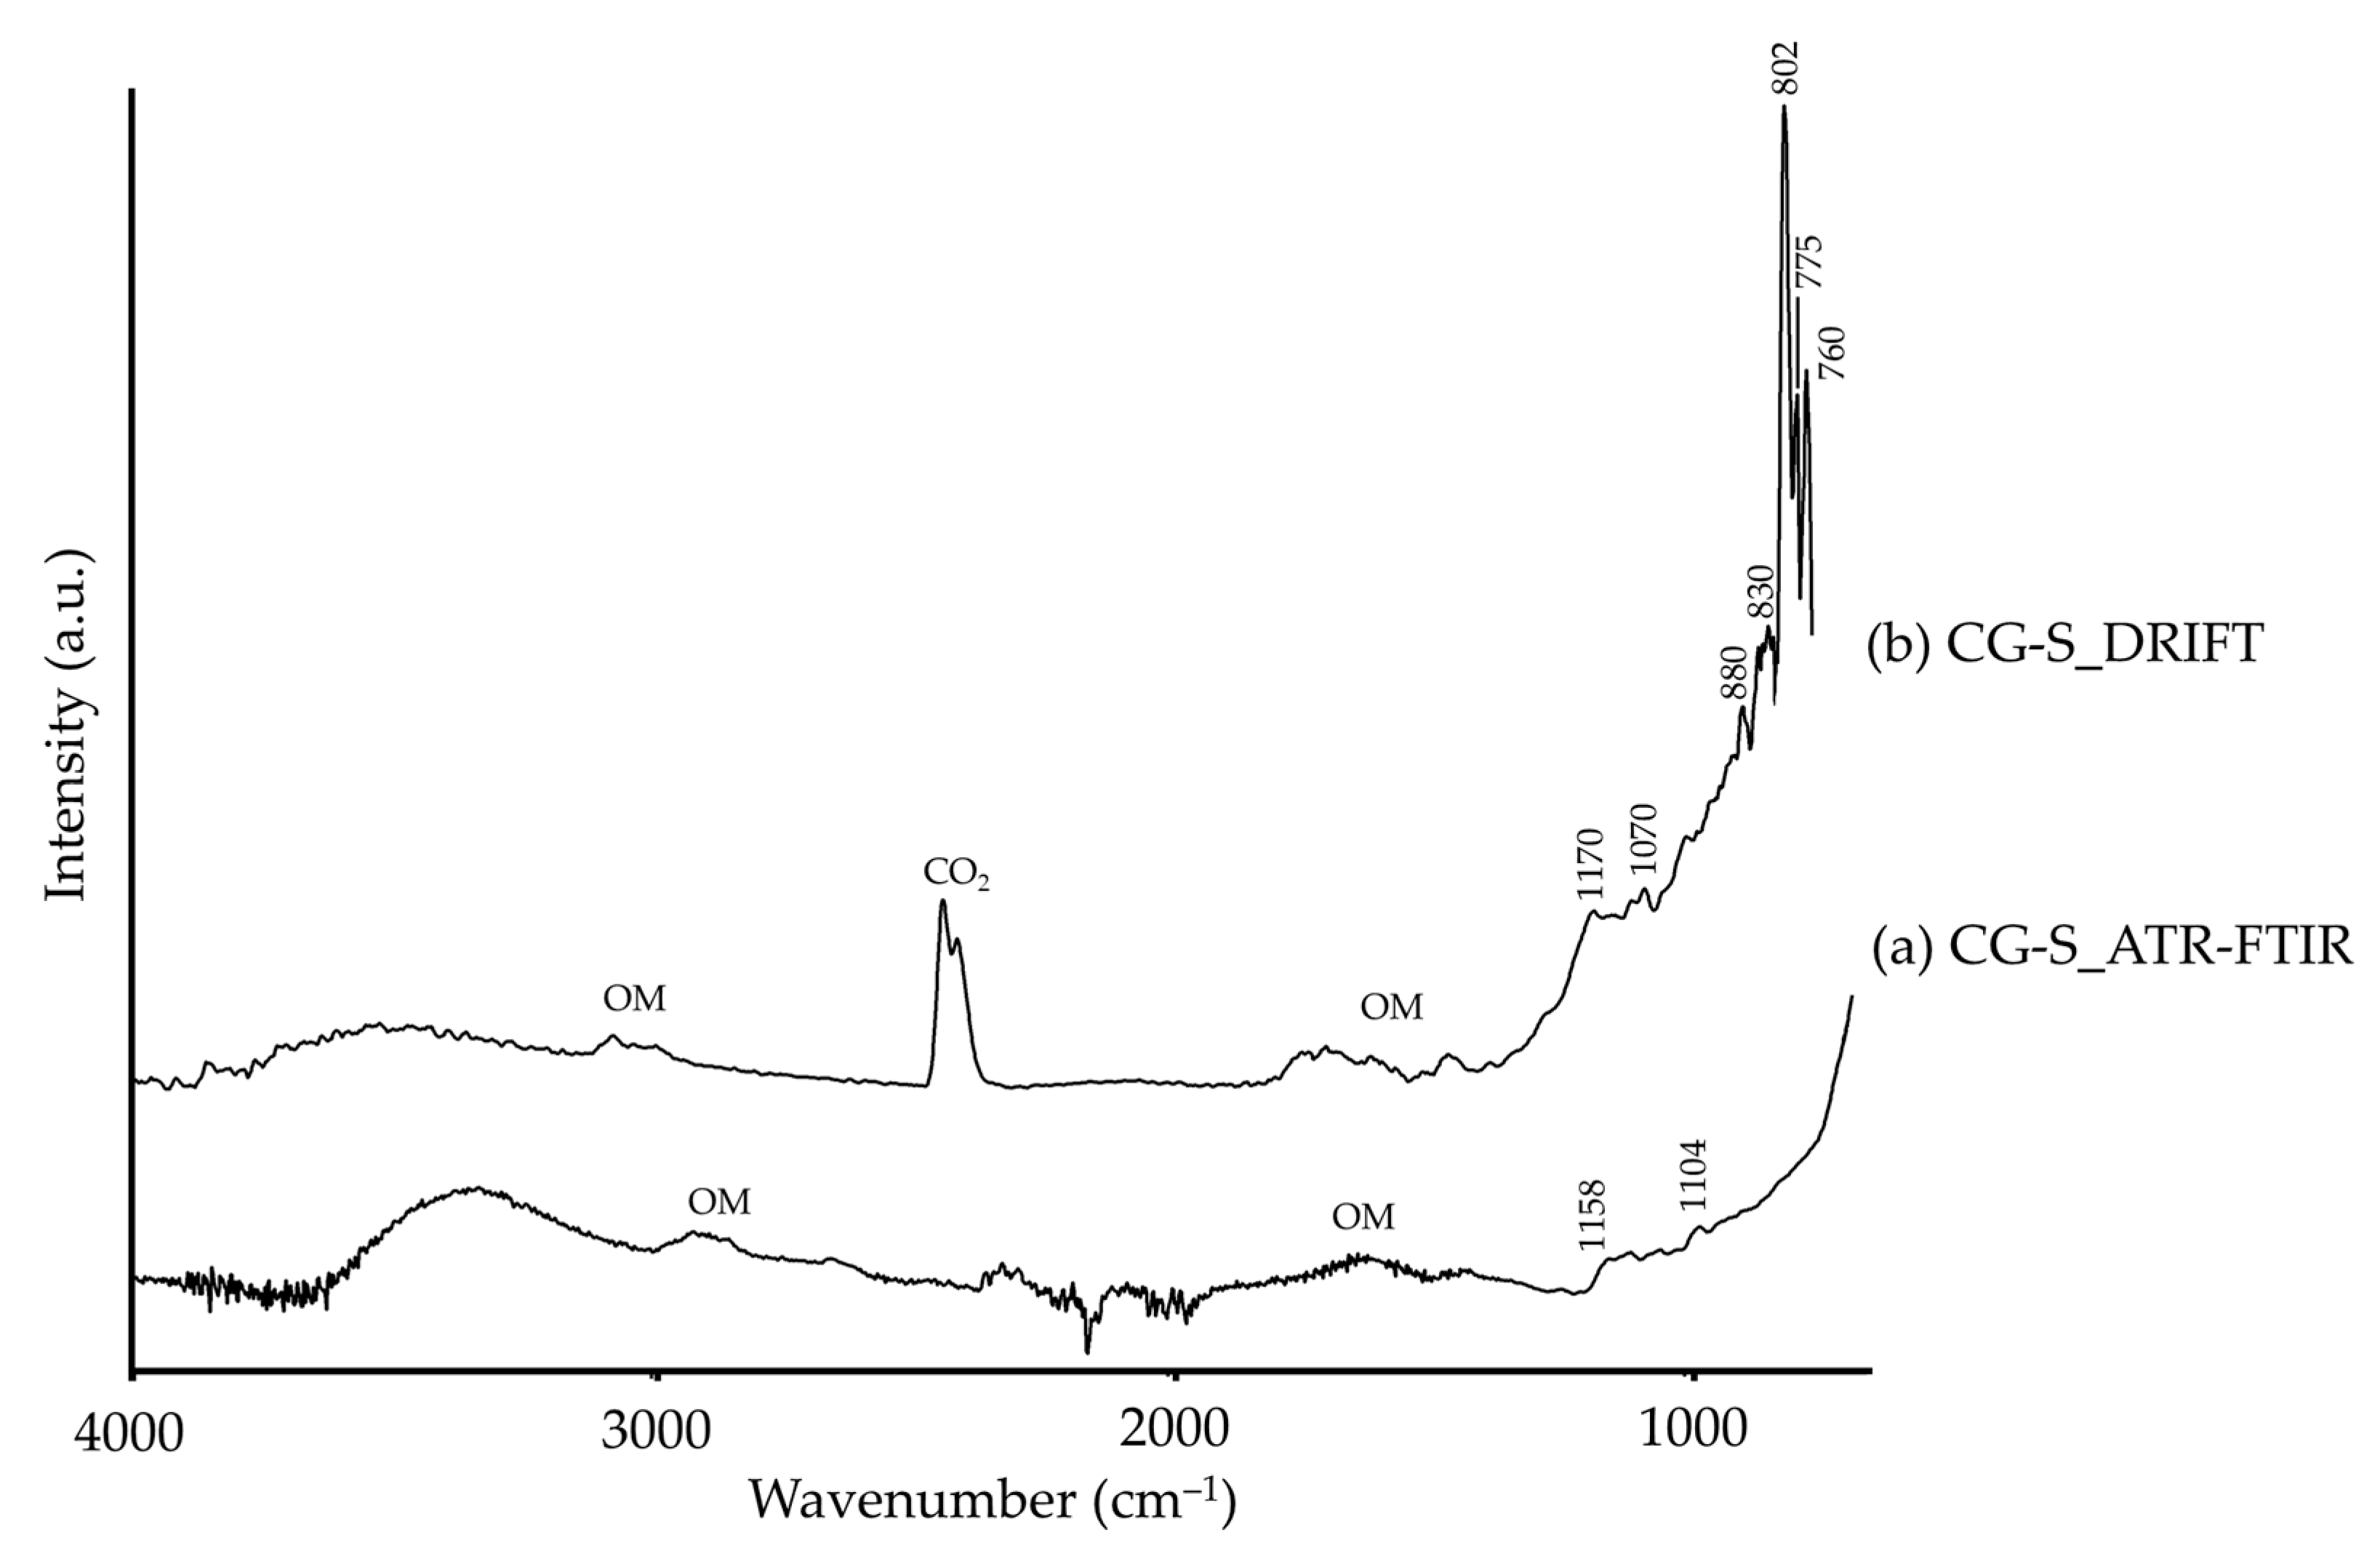
| CG-S | 3570–3050 | –OH [26] | ||
| 1158, 1104 | Si–O, quartz [35] | 1170, 1070, 880, 830, 802, 775, 760 | Si–O, quartz [35] | |
3.3. Carbonate Pigments
| Pigment | ATR-FTIR | DRIFT | ||
|---|---|---|---|---|
| Wavenumber (cm−1) | Assignment 1 | Wavenumber (cm−1) | Assignment 1 | |
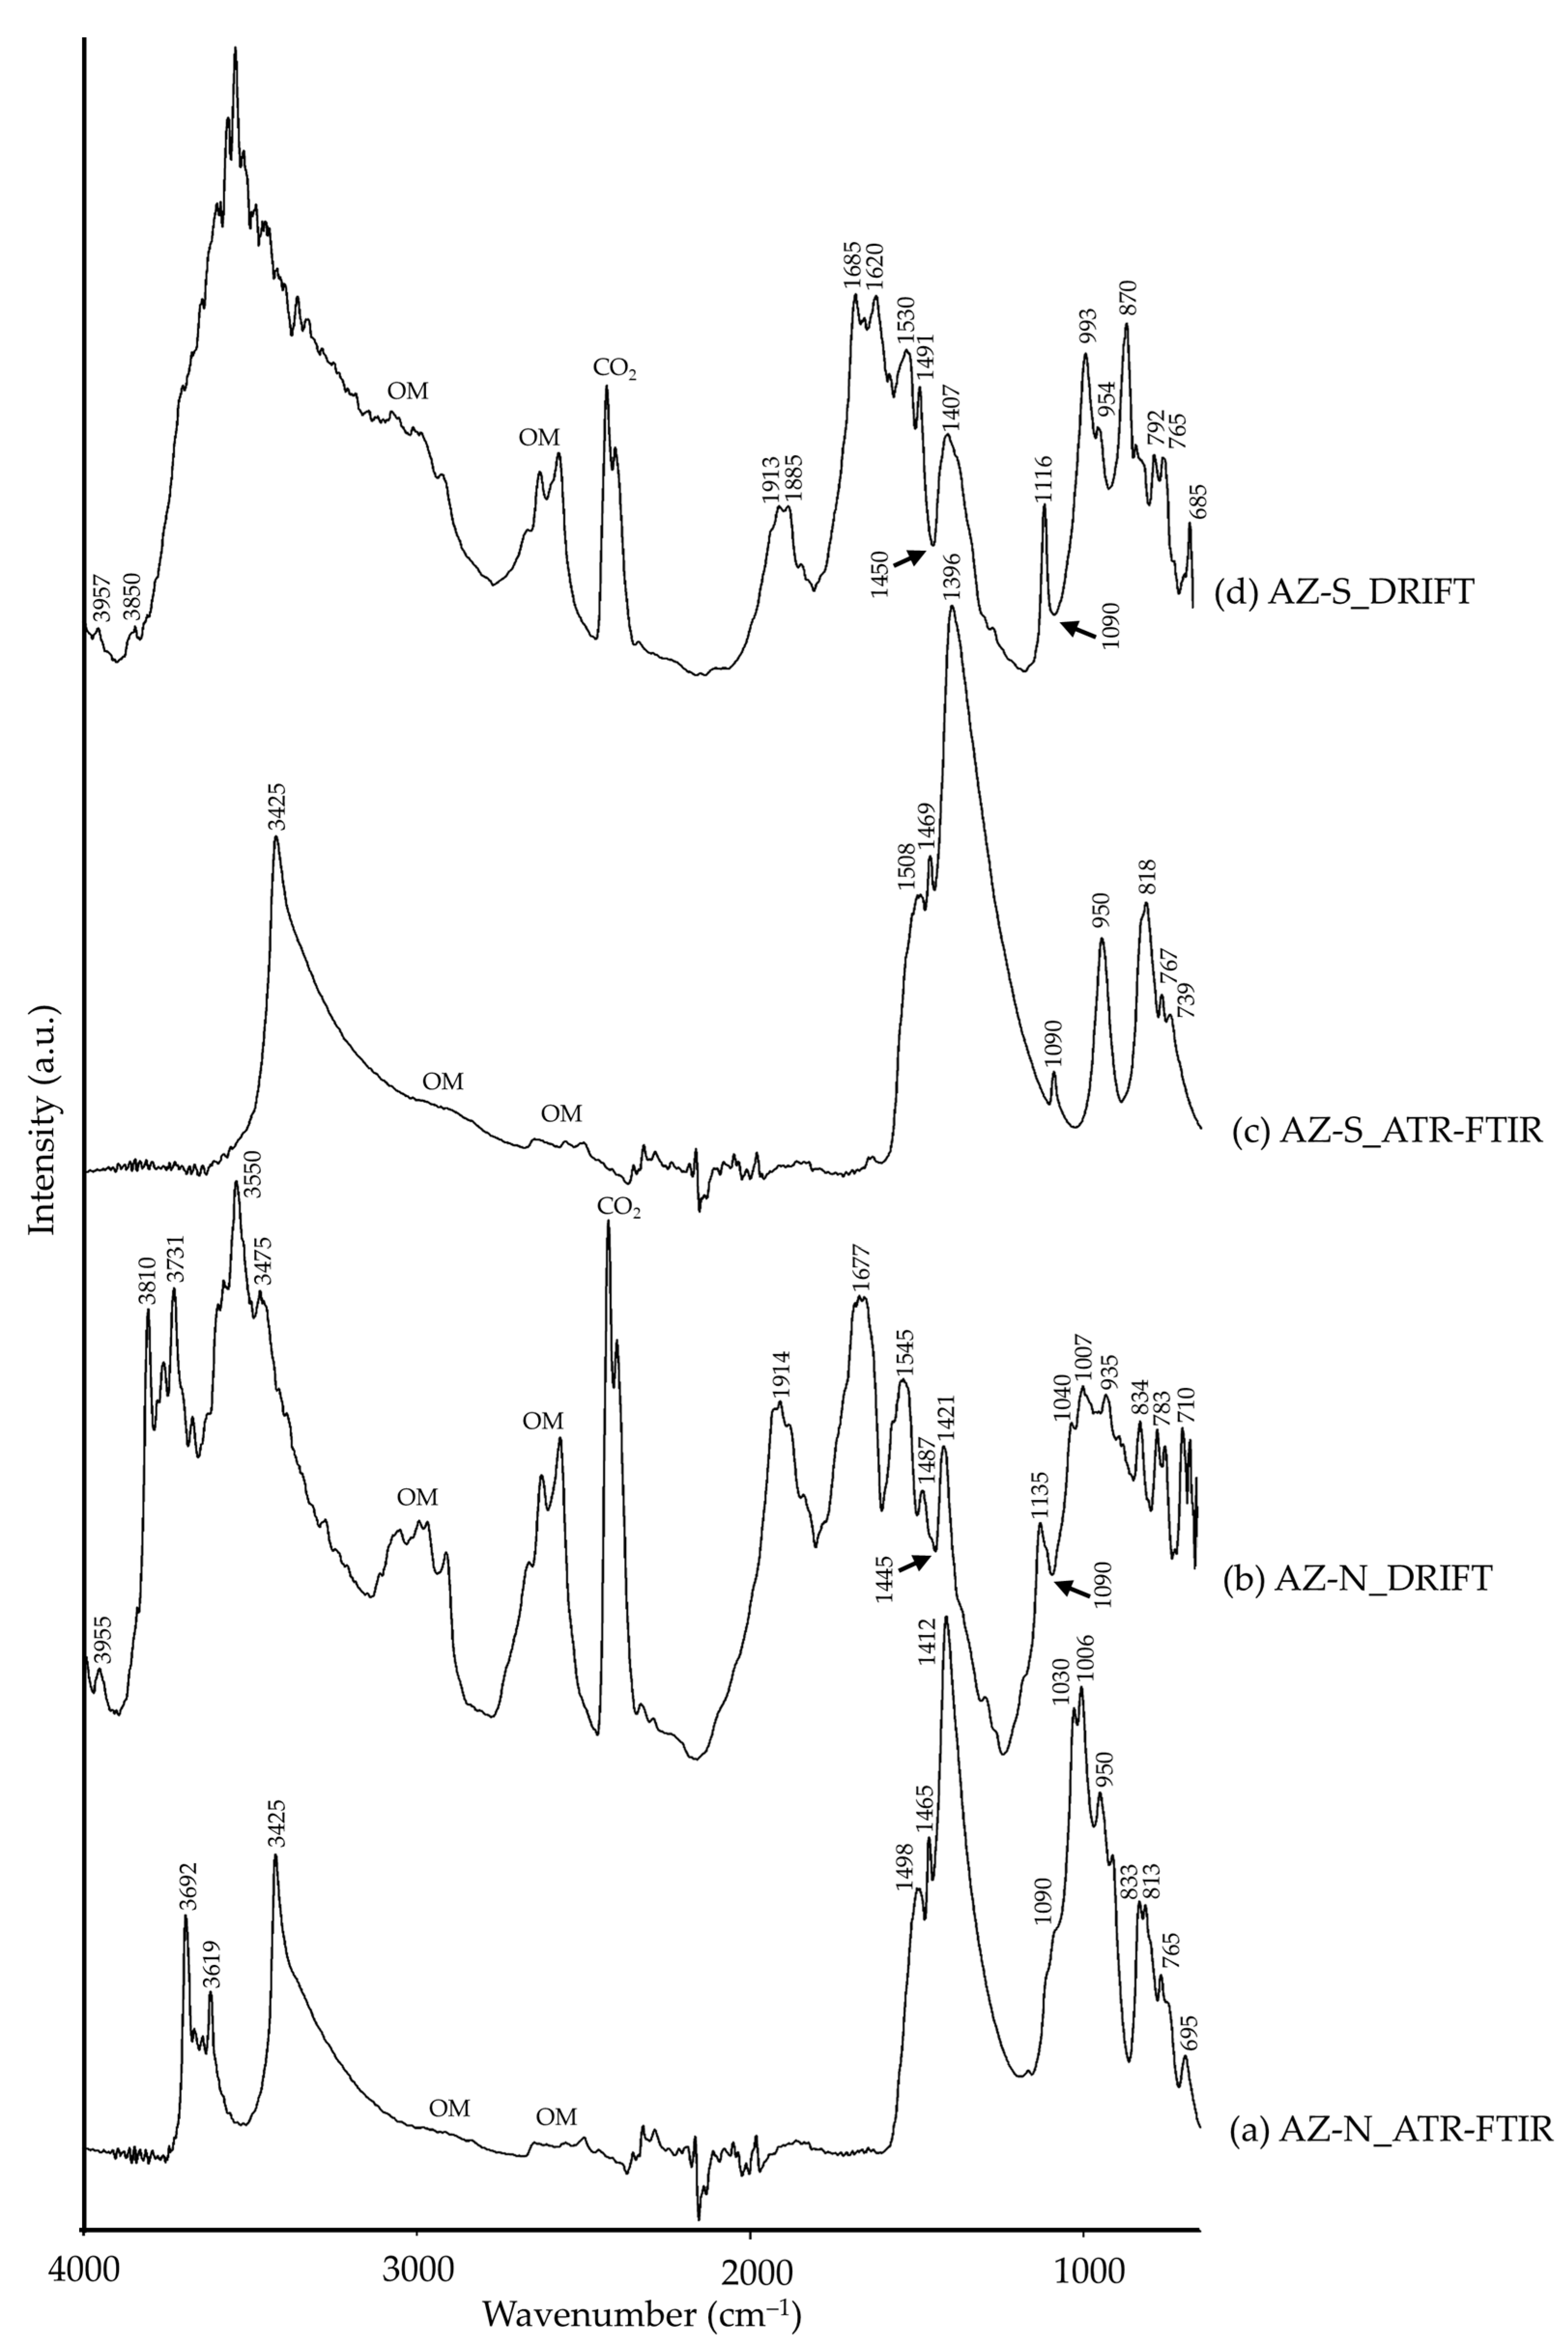
| AZ-N | 3955 | –OH [26] | ||
| 3692, 3619 | δ(–OH), kaolinite [42] | 3810, 3731 | –OH, kaolinite [35] | |
| 3425 | ν(–OH), azurite [52] | 3550, 3475 | ν(–OH), azurite [14,15] | |
| 1498, 1412 | νas(CO32−), azurite [52] | 1914, 1677, 1545 | CO32−, carbonate [26], azurite (?) | |
| 1465 | ν(C–O), azurite [69] | 1487, 1445 (Reststrahlen), 1421 | νas(CO32−), azurite [14,15] | |
| 1090, 1006 | νs(CO32−), azurite [52] | 1135, 1090 (Reststrahlen), 1007 | νs(CO32−), azurite [14] | |
| 1030, 950 | β(–OH), azurite [52] | 1040, 935 | Al–OH, kaolinite [35] | |
| 833, 813 | δ(CO32−), azurite [52] | 834 | δ(CO32−), azurite [10,14,15] | |
| 765, 695 | β(CO32−), azurite [52] | 783, 710 | β(CO32−), azurite [14] | |
| AZ-S | 3957, 3850 | –OH [26] | ||
| 3425 | ν(–OH), azurite [52] | 3750–2900 | ν(–OH), azurite [14,15] | |
| 1508, 1396 | νas(CO32−), azurite [52] | 1913, 1885, 1685, 1620, 1530 | CO32−, carbonate [26], azurite (?) | |
| 1469 | ν(C–O), azurite [69] | 1491, 1450 (Reststrahlen), 1407 | νas(CO32−), azurite [14,15] | |
| 1090 | νs(CO32−), azurite [52] | 1116, 1090 (Reststrahlen), 993 | νs(CO32−), azurite [14] | |
| 950 | β(–OH), azurite [52] | 954 | δ(–OH), azurite [15] | |
| 870 | CO32−, calcite [35] | |||
| 818 | δ(CO32−), azurite [52] | |||
| 767, 739 | β(CO32−), azurite [52] | 792, 765, 685 | β(CO32−), azurite [14] | |
| MA-N | 3395, 3308 | δ(–OH), malachite [18] | 3700–3000 | ν(–OH), malachite [9] |
| 1970 | CO32− [26], malachite (?) | |||
| 1852, 1605 | CO32− [26], malachite (?) | |||
| 1490, 1379 | νas(CO32−), malachite [18,52] | 1484, 1400 | νas(CO32−), malachite [9] | |
| 1095 | νs(CO32−), malachite [52] | 1128, 1095, 1040, 935 | νs(CO32−), malachite [9] | |
| 1042, 865 | β(–OH), malachite [52] | |||
| 815 | δ(CO32−), malachite [52] | 867 | CO32− [35], malachite (?) | |
| 770 | CO32−, malachite (?) | |||
| 776, 745, 705 | β(CO32−), malachite [52] | 680 | Si–O, quartz [35] | |
| MA-S | 3403, 3320 | δ(–OH), malachite [18] | 3700–3000 | ν(–OH), malachite [9] |
| 1850, 1594 | CO32− [26], malachite (?) | |||
| 1490, 1382 | νas(CO32−), malachite [18,52] | 1478 | CO32−, malachite (?) | |
| 1105 | νs(CO32−), malachite [52] | 1129, 1090 | νs(CO32−), malachite [9] | |
| 1047, 873 | β(–OH), malachite [52] | 940–910 | Si–O, quartz [25] | |
| 815 | δ(CO32−), malachite [52] | 845 | δ(CO32−), malachite (?) | |
| 750, 712 | β(CO32−), malachite [52] | 769, 695, 675 | Si–O, quartz [26] | |
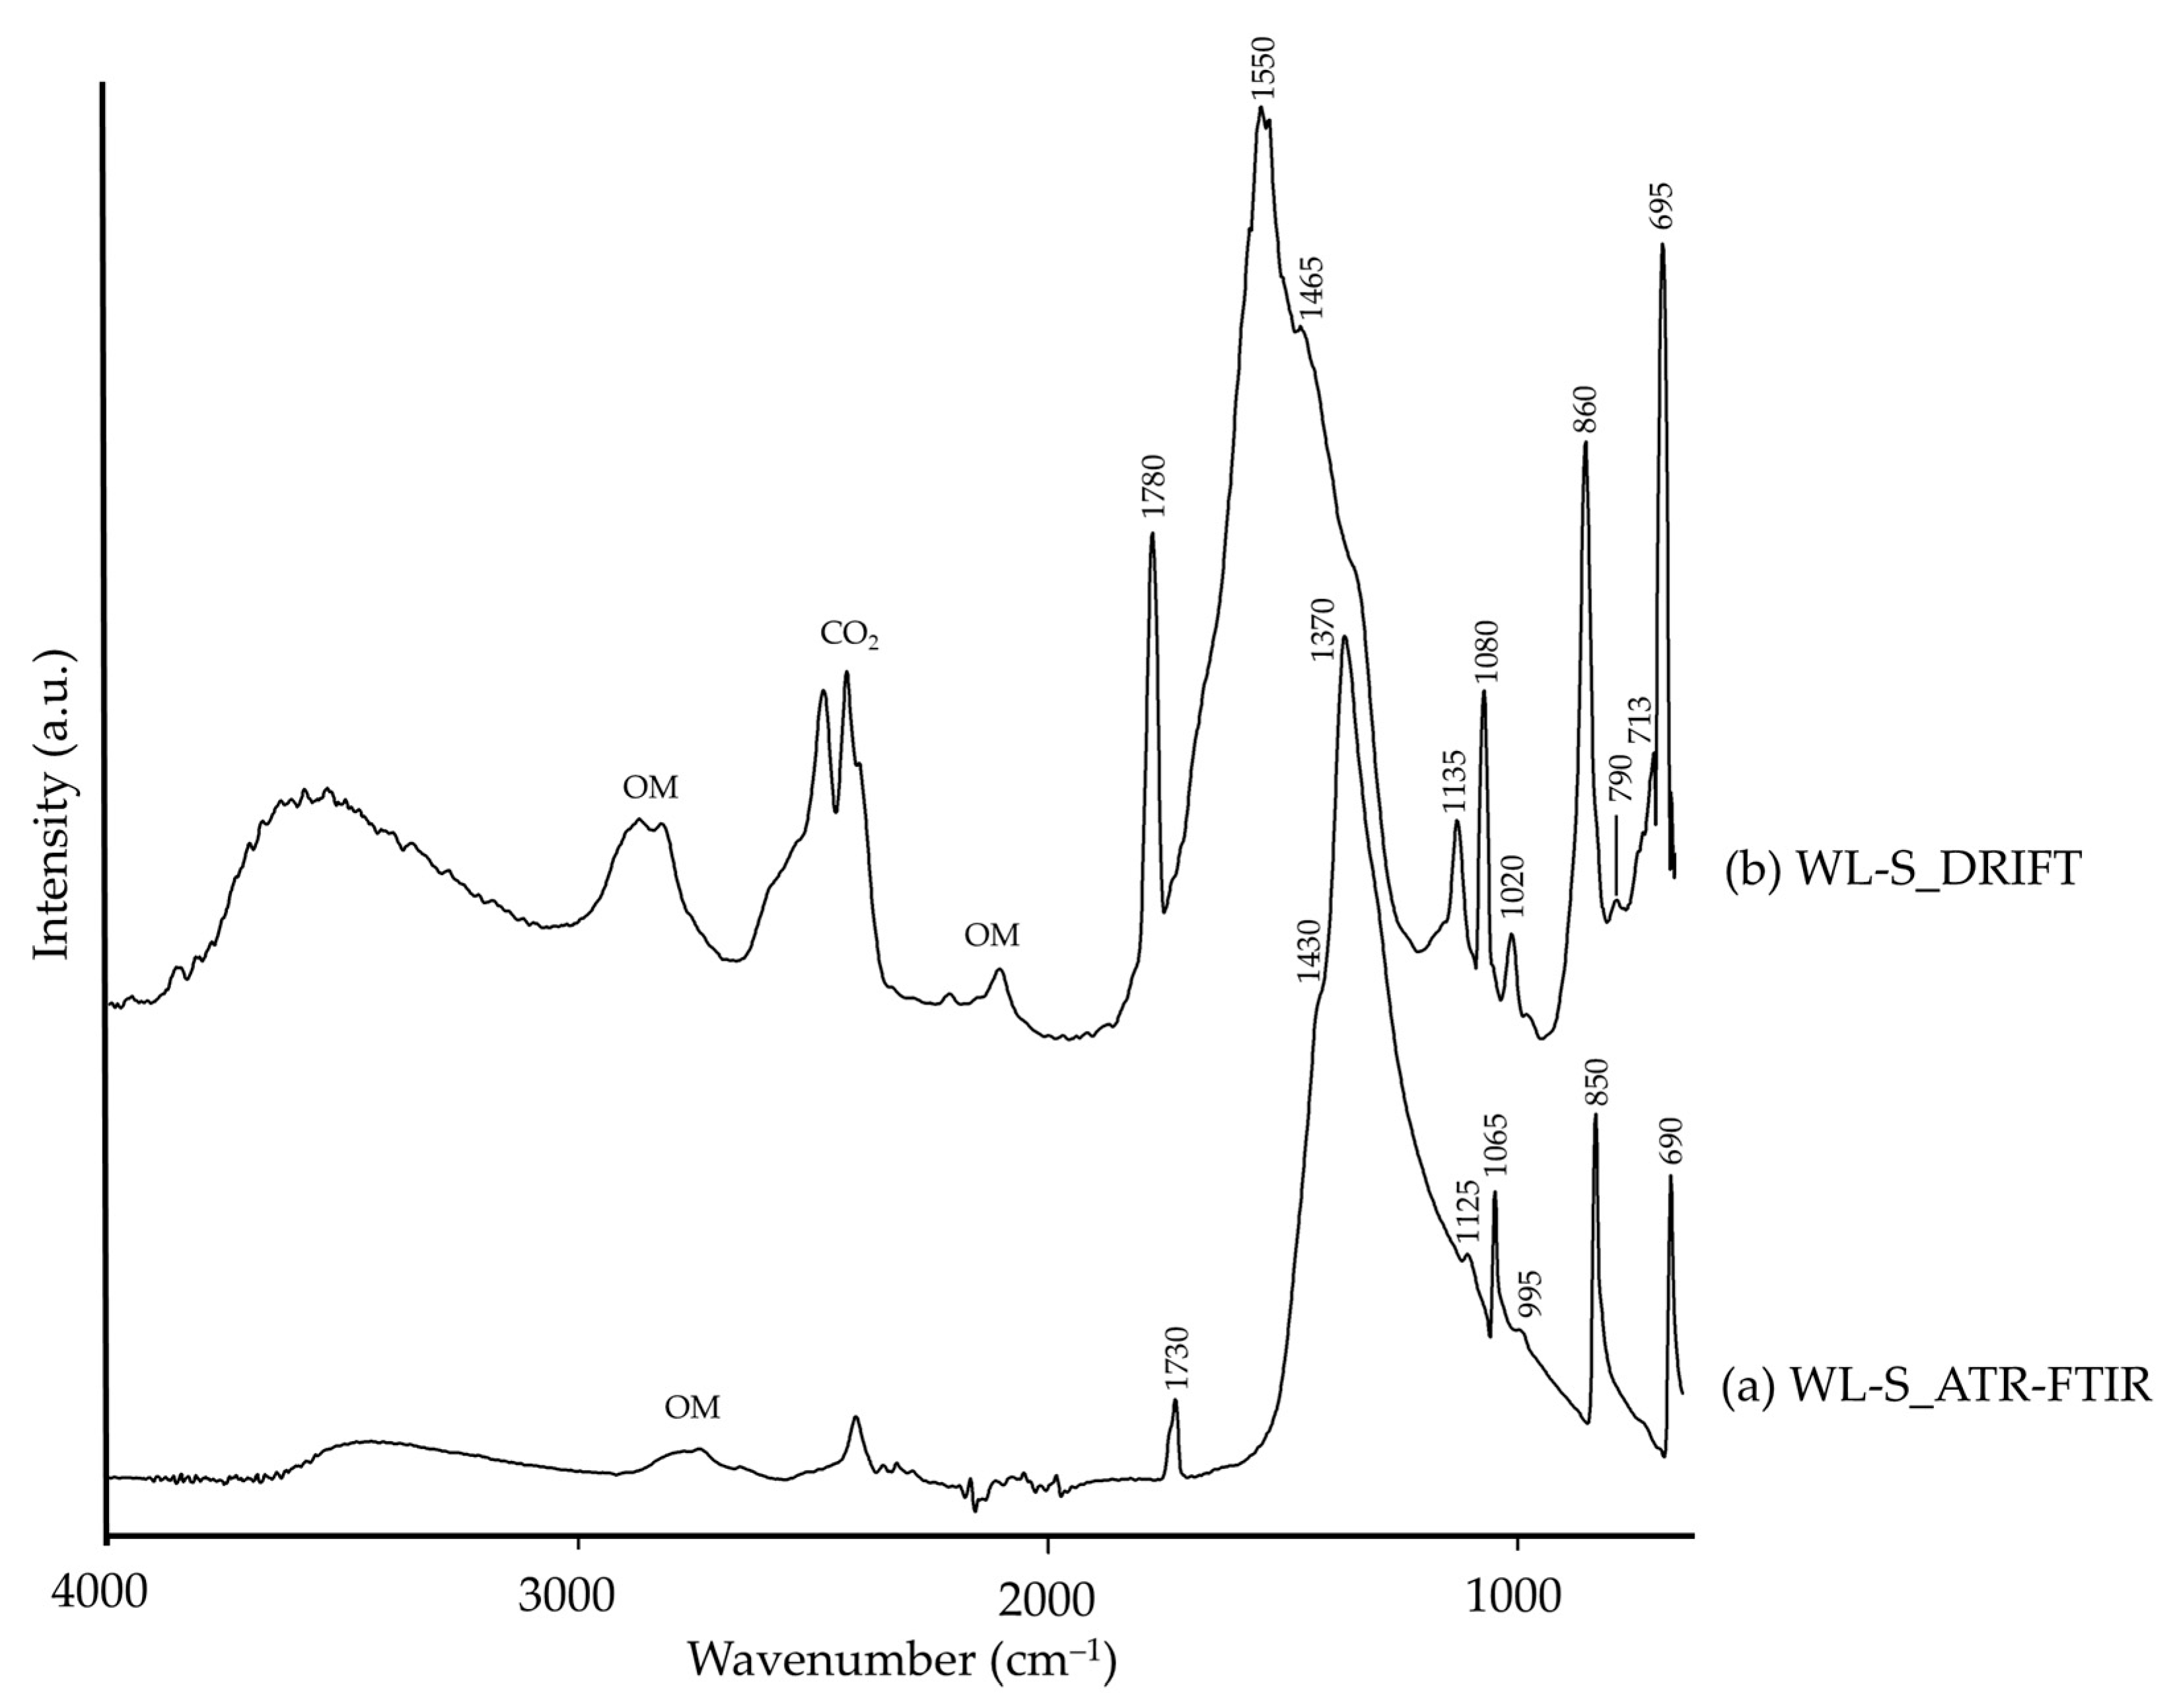
| WL-S | 3560–3100 | –OH [26], hydrocerussite (?) | 3800–3200 | ν(–OH), hydrocerussite [14,70] |
| 1730, 1065 | νs(CO32−), cerussite [14,71] | 1780, 1135, 1080, 1020 | νs(CO32−), cerussite [14,15] | |
| 1430, 1370 | νas(CO32−), cerussite [15] | 1550 | ν(CO32−), carbonate [14,70] | |
| 1125 | SO42−, lead carbonate [72] | 1465 | νas(CO32−), cerussite [13,15] | |
| 995 | Pb–OH [72], hydrocerussite (?) | |||
| 850 | β(CO32−), cerussite [72] | 860 | β(CO32−), cerussite [13,15] | |
| 790 | β(Pb–OH) [73], hydrocerussite (?) | |||
| 690 | δ(CO32−), cerussite [72] | 713, 695 | δ(CO32−), cerussite [72] | |
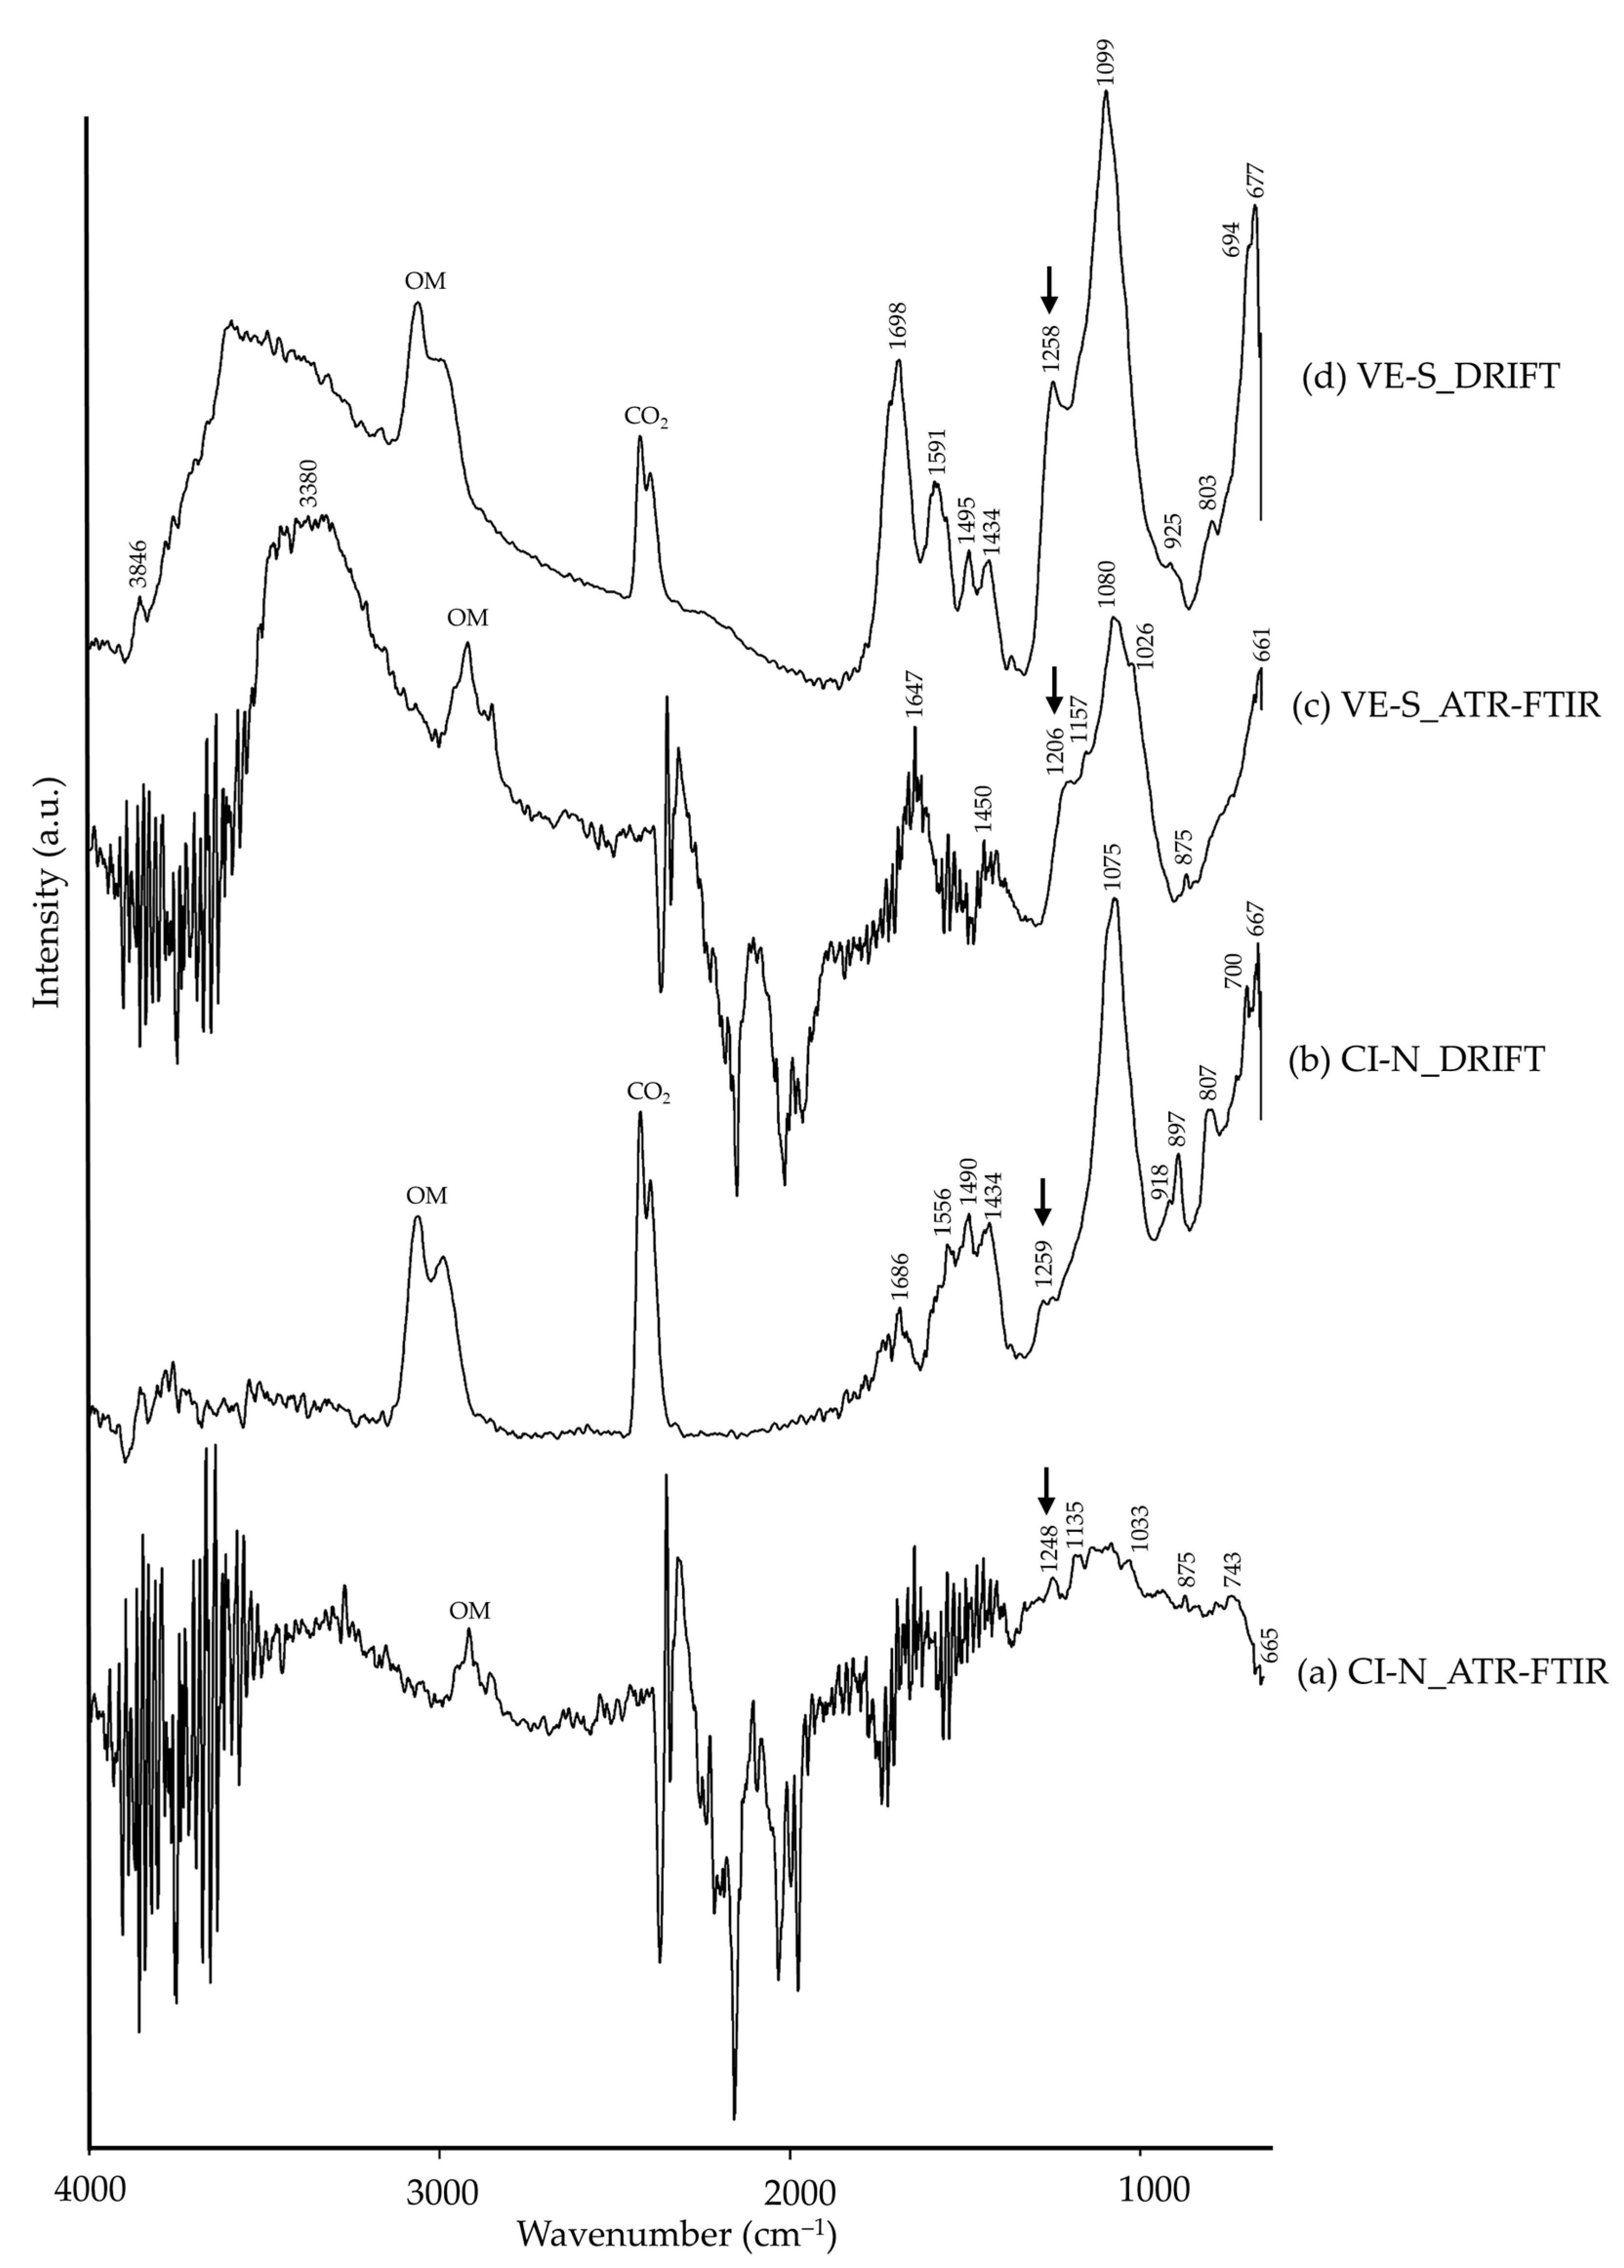
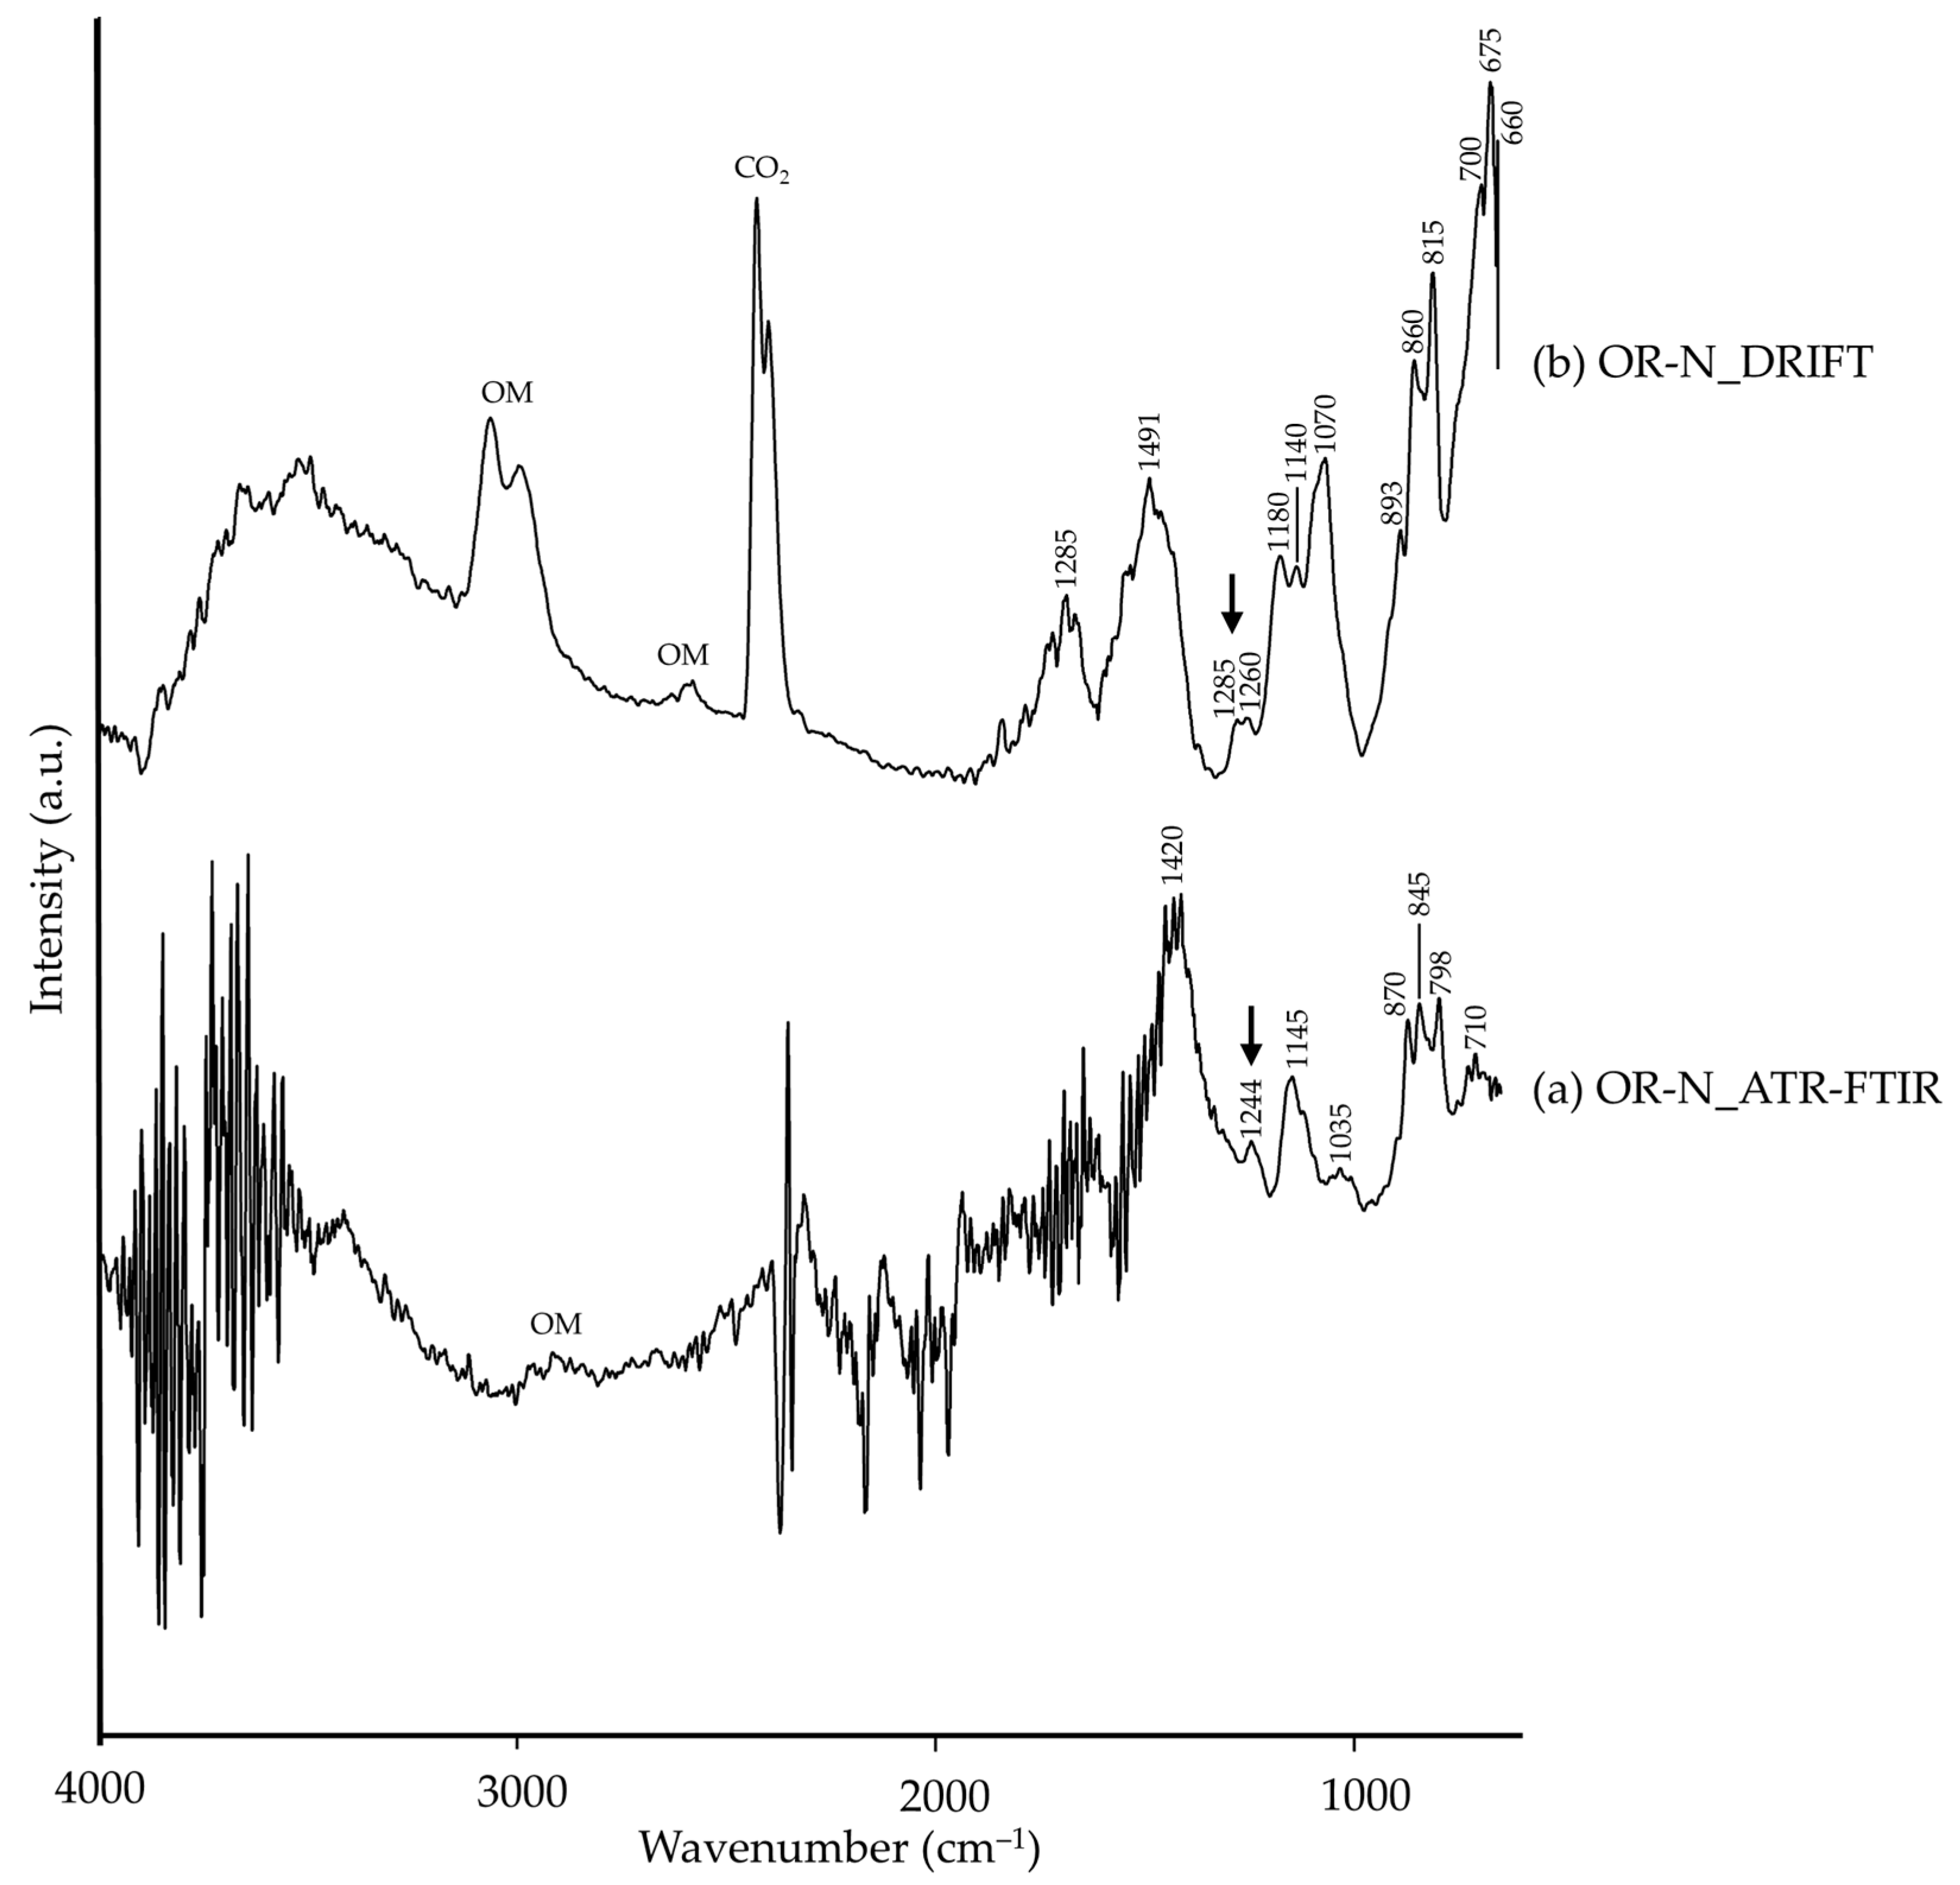
3.4. Sulphide Pigments
| Pigment | ATR-FTIR | DRIFT | ||
|---|---|---|---|---|
| Wavenumber (cm−1) | Assignment 1 | Wavenumber (cm−1) | Assignment 1 | |
| CI-N | 1686, 1556, 1490, 1434 | CO32−, carbonate [26], calcite (?) | ||
| 1248 | νas(SO2) [26], cinnabar (?) | 1259 | νas(SO2) [26], cinnabar (?) | |
| 1135, 1033 | ν(Si–O), quartz [8,34] | 1075, 918, 897, 807, 700 | ν(Si–O), quartz [35] | |
| 875 | νas(CO32−), calcite [8,45] | |||
| 743, 665 | ν(Si–O), quartz [8,34] | 667 | Si–O, quartz [35] | |
| VE-S | 3500–3000 | –OH [26] | 3846, 3700–3200 | –OH [26] |
| ~1647, ~1450 | CO32−, carbonate [26], calcite (?) | 1698, 1591, 1495, 1434 | CO32−, carbonate [26], calcite (?) | |
| 1258 | νas(SO2) [26], vermilion (?) | |||
| 1206 | νas(SO2) [26], vermilion (?) | |||
| 1157, 1080, 1026, 661 | ν(Si–O), quartz [8,34] | 1099, 925, 803, 694, 677 | ν(Si–O), quartz [35] | |
| 875 | νas(CO32−), calcite [8,45] | |||
| OR-N | ~1420 | CO32−, carbonate [26], calcite (?) | 1690, 1491 | CO32−, carbonate [26], calcite (?) |
| 1244 | νas(SO2) [26], orpiment/realgar (?) | 1285, 1260 | νas(SO2) [26], orpiment/realgar (?) | |
| 1145, 1035, 845, 798, 710 | ν(Si–O), quartz [8,34] | 1180, 1140, 1070, 893, 860, 815, 700, 675, 660 | ν(Si–O), quartz [35] | |
| 870 | νas(CO32−), calcite [8,45] | |||
3.5. Acetate Pigment
| Pigment | ATR-FTIR | DRIFT | ||
|---|---|---|---|---|
| Wavenumber (cm−1) | Assignment 1 | Wavenumber (cm−1) | Assignment 1 | |
| VER-S | 3447, 3362, 3268 | ν(–OH), acetate ion [80,81,82] | 3800–3200 | ν(–OH) [26], acetate ion (?) |
| 2990, 2942 | ν(C–H), acetate [83] | 3080, 3027 | ν(C–H) [26], acetate (?) | |
| 2863 | νs(CH3) [26], acetate (?) | |||
| 2778–1935 | Not assigned | |||
| 1652 | C=O [26] | |||
| 1595 | νs(COO−), acetate [80,81,82] | 1710, 1690 | νs(COO−) [26], acetate (?) | |
| 1441, 1417 | νas(COO−), acetate [80,81,82] | 1577,1508 | νas(COO−) [26], acetate (?) | |
| 1468 | (COO−) [26], acetate (?) | |||
| 1260 | νs(C=O) [80,81,82] | 1289 | νs(C=O) [26] | |
| 1155 | -CH3 [80,81,82] | 1171 | -CH3 (?) | |
| 1355, 1056, 1036 | C–H from the CH3 in the acetate group [80,81,82] | 1392, 1060 | C–H from the CH3 in the acetate group (?) | |
| 690 | δ(O–C–O), acetate ion [80,81,82,83] | 725, 662 | O–C–O [26] | |
4. Conclusions
Author Contributions
Funding
Institutional Review Board Statement
Informed Consent Statement
Data Availability Statement
Acknowledgments
Conflicts of Interest
References
- Harth, A. The Study of Pigments in Cultural Heritage: A Review Using Machine Learning. Heritage 2024, 7, 3664–3695. [Google Scholar] [CrossRef]
- Mayer, R. Materiales y Técnicas del Arte; Hermann Blume Ediciones: Madrid, Spain, 2005. [Google Scholar]
- Artioli, G. Scientific Methods and Cultural Heritage: An Introduction to the Application of Materials Science to Archaeometry and Conservation Science; Oxford University Press Inc.: New York, NY, USA, 2010. [Google Scholar]
- Aucouturier, M.; Darque-Ceretti, E. Materials Surface Science Applied to the Investigation of Cultural Heritage Artefacts. Procedia Mater. Sci. 2015, 9, 31–47. [Google Scholar] [CrossRef]
- Low, M.J.D.; Baer, N.S. Application of Infrared Fourier Transform Spectroscopy to problems in Conservation. Stud. Conserv. 1977, 22, 116–128. [Google Scholar] [CrossRef]
- Prati, S.; Sciutto, G.; Bonacini, I.; Mazzeo, R. New Frontiers in Application of FTIR Microscopy for Characterization of Cultural Heritage Materials. In Analytical Chemistry for Cultural Heritage. Topics in Current Chemistry Collections; Mazzeo, R., Ed.; Springer: Cham, Switzerland, 2017; Volume 374. [Google Scholar] [CrossRef]
- Poliszuk, A.; Ybarra, G. Analysis of Cultural Heritage materials by infrared spectroscopy. In Infrared Spectroscopy: Theory, Developments and Applications; Cozzolino, D., Ed.; Nova Science Publishers: New York, NY, USA, 2014; pp. 519–536. [Google Scholar]
- Derrick, M.R.; Stulik, D.; Landry, J.M. Scientific Tools for Conservation. Infrared Spectroscopy in Conservation Science; The Getty Conservation Institute: Los Angeles, CA, USA, 1999. [Google Scholar]
- Silva, C.E.; Silva, L.P.; Edwards, H.G.M.; De Oliveira, L.F.C. Diffuse reflection FTIR spectral database of dyes and pigments. Anal. Bioanal. Chem. 2006, 386, 2183–2191. [Google Scholar] [CrossRef]
- Navas, N.; Romero-Pastor, J.; Manzano, E.; Cardell, C. Benefits of applying combined diffuse reflectance FTIR spectroscopy and principal component analysis for the study of blue tempera historical painting. Anal. Chim. Acta 2008, 630, 141–149. [Google Scholar] [CrossRef]
- Arrizabalaga, I.; Gómez-Laserna, O.; Carrero, J.A.; Bustamante, J.; Rodríguez, A.; Arana, G.; Madariaga, J.M. Diffuse reflectance FTIR database for the interpretation of the spectra obtained with a handheld device on built heritage materials. Anal. Methods 2015, 7, 1061–1070. [Google Scholar] [CrossRef]
- Arrizabalaga, I.; Gómez-Laserna, O.; Aramendia, J.; Arana, G.; Madariaga, J.M. Applicability of a Diffuse Reflectance Infrared Fourier Transform handheld spectrometer to perform in situ analyses on Cultural Heritage materials. Spectrochim. Acta A Mol. Biomol. Spectrosc. 2014, 129, 259–267. [Google Scholar] [CrossRef]
- Steger, S.; Stege, H.; Bretz, S.; Hahn, O. Capabilities and limitations of handheld Diffuse Reflectance Infrared Fourier Transform Spectroscopy (DRIFTS) for the analysis of colourants and binders in 20th-century reverse paintings on glass. Spectrochim. Acta A Mol. Biomol. Spectrosc. 2018, 195, 103–112. [Google Scholar] [CrossRef]
- Miliani, C.; Rosi, F.; Daveri, A.; Brunetti, B.G. Reflection infrared spectroscopy for the non-invasive in situ study of artists’ pigments. Appl. Phys. A Mater. Sci. Process. 2012, 106, 295–307. [Google Scholar] [CrossRef]
- Zaffino, C.; Guglielmi, V.; Faraone, S.; Vinaccia, A.; Bruni, S. Exploiting external reflection FTIR spectroscopy for the in-situ identification of pigments and binders in illuminated manuscripts. Brochantite and posnjakite as a case study. Spectrochim. Acta A Mol. Biomol. Spectrosc. 2015, 136, 1076–1085. [Google Scholar] [CrossRef]
- Zhang, F.; Tang, X.; Li, L. Origins of baseline drift and distortion in Fourier transform spectra. Molecules 2022, 27, 4287. [Google Scholar] [CrossRef] [PubMed]
- Armaroli, T.; Bécue, T.; Gautier, S. Diffuse Reflection Infrared Spectroscopy (DRIFTS): Application to the in situ Analysis of Catalysts. Oil Gas Sci. Tech. 2004, 59, 215–237. [Google Scholar] [CrossRef]
- Buti, D.; Rosi, F.; Brunetti, B.G.; Miliani, C. In-situ identification of copper-based green pigments on paintings and manuscripts by reflection FTIR. Anal. Bioanal. Chem. 2013, 405, 2699–2711. [Google Scholar] [CrossRef]
- Monico, L.; Rosi, F.; Miliani, C.; Daveri, A.; Brunetti, B.G. Non-invasive identification of metal-oxalate complexes on polychrome artwork surfaces by reflection mid-infrared spectroscopy. Spectrochim. Acta A Mol. Biomol. Spectrosc. 2013, 116, 270–280. [Google Scholar] [CrossRef]
- Bevilacqua, N.; Borgioli, L.; Adrover Gracia, I. Pigmenti Nell’arte Dalla Preistoria Alla Rivoluzione Industriale; II Prato: Saonara, Italy, 2010. [Google Scholar]
- Borgioli, L. I Pigmenti dell’800; II Prato: Saonara, Italy, 2022. [Google Scholar]
- Pedrola, A. Materiales, Procedimientos y Técnicas Pictóricas; Editorial Ariel: Barcelona, Spain, 2019. [Google Scholar]
- Matteini, M.; Moles, A. La Química en la Restauración: Los Materiales del Arte Pictórico; Editorial Nerea: Basque Country, Spain, 2001. [Google Scholar]
- Doerner, M. The Materials of the Artist and Their Use in Painting, with Notes on the Techniques of the Old Masters, 1998th ed.; Houghton Mifflin Harcourt: Boston, MA, USA, 1921. [Google Scholar]
- Volkov, D.S.; Rogova, O.B.; Proskurnin, M.A. Temperature dependences of IR spectra of humic substances of brown coal. Agronomy 2021, 11, 1822. [Google Scholar] [CrossRef]
- Socrates, G. Infrared and Raman Characteristic Group Frequencies: Tables and Charts, 3rd ed.; John Wiley & Sons Ltd.: New York, NY, USA, 2004. [Google Scholar]
- Price, M. A Renaissance of Color: Particle Separation and Preparation of Azurite for Use in Oil Painting. Leonardo 2000, 33, 281–288. [Google Scholar] [CrossRef]
- Riederer, J. Egyptian Blue. In Artists Pigments. A Handbook of Their History and Characteristics; FitzHugh, E.W., Ed.; Archetype Publications: London, UK, 1997; Volume 3, pp. 23–46. [Google Scholar]
- Wiseman, G.; Barnes, S.; Helwig, K. Investigation of Egyptian Blue on a Fragmentary Egyptian Head Using ER-FTIR Spectroscopy and VIL Imaging. Heritage 2023, 6, 993–1006. [Google Scholar] [CrossRef]
- Mirtit, P.; Appolonia, L.; Casoli, A.; Ferrari, R.P.; Laurent, E.; Amisano Canesi, A.; Chiari, G. Spectrochemical and structural studies on a Roman sample of Egyptian blue. Spectrochim. Acta A Mol. Biomol. Spectrosc. 1995, 51, 437–446. [Google Scholar] [CrossRef]
- Coimbra, M.M.; Martins, I.; Bruno, S.M.; Vaz, P.D.; Ribeiro-Claro, P.J.A.; Rudić, S.; Nolasco, M.M. Shedding Light on Cuprorivaite, the Egyptian Blue Pigment: Joining Neutrons and Photons for a Computational Spectroscopy Study. Cryst. Growth Des. 2023, 23, 4961–4969. [Google Scholar] [CrossRef]
- Manfredi, M.; Barberis, E.; Aceto, M.; Marengo, E. Non-invasive characterization of colorants by portable diffuse reflectance infrared Fourier transform (DRIFT) spectroscopy and chemometrics. Spectrochim. Acta A Mol. Biomol. Spectrosc. 2017, 181, 171–179. [Google Scholar] [CrossRef]
- Edreira, M.C.; Feliu, M.J.; Fernández-Lorenzo, C.; Martín, J. Spectroscopic study of Egyptian blue mixed with other pigments. Helv. Chim. Acta 2003, 86, 29–49. [Google Scholar] [CrossRef]
- Anbalagan, G.; Prabakaran, A.R.; Gunasekaran, S. Spectroscopic characterization of Indian standard sand. J. Appl. Spectrosc. 2010, 77, 86–94. [Google Scholar] [CrossRef]
- Nguyen, T.T.; Janik, L.J.; Raupach, M. Diffuse reflectance infrared fourier transform (DRIFT) spectroscopy in soil studies. Aust. J. Soil Res. 1991, 29, 49–67. [Google Scholar] [CrossRef]
- Climent-Pascual, E.; De Paz, J.R.; Rodríguez-Carvajal, J.; Suard, E.; Sáez-Puche, R. Synthesis and characterization of the ultramarine-type analog Na 8-X[Si6Al6O24]·(S2,S3,CO3)1-2. Inorg. Chem. 2009, 48, 6526–6533. [Google Scholar] [CrossRef]
- Byrappa, K.; Devaraju, M.K.; Madhusudan, P.; Dayananda, A.S.; Kumar, B.V.S.; Girish, H.N.; Ananda, S.; Lokanatha Rai, K.M.; Javeri, P. Synthesis and characterization of calcium aluminum silicate hydroxide (CASH) mineral. J. Mater. Sci. 2006, 41, 1395–1398. [Google Scholar] [CrossRef]
- Zilio, S.C.; Bagnato, V.S. Infrared Spectra of Natural Sodalite. J. Phys. Chem. 1984, 88, 1373–1376. [Google Scholar] [CrossRef]
- Mofrad, A.M.; Peixoto, C.; Blumeyer, J.; Liu, J.; Hunt, H.K.; Hammond, K.D. Vibrational Spectroscopy of Sodalite: Theory and Experiments. J. Phys. Chem. C 2018, 122, 24765–24779. [Google Scholar] [CrossRef]
- Friedrich, F.; Heissler, S.; Faubel, W.; Nüesch, R.; Weidler, P.G. Cu(II)-intercalated muscovite: An infrared spectroscopic study. Vib. Spectrosc. 2007, 43, 427–434. [Google Scholar] [CrossRef]
- Chukanov, N.V.; Chervonnyi, A.D. Infrared Spectroscopy of Minerals and Related Compounds; Springer International Publishing: New York, NY, USA, 2016. [Google Scholar] [CrossRef]
- Helwig, K. The characterisation of iron earth pigments using infrared spectroscopy. In Postprints of IRUG2; Pretzel, B., Ed.; Victoria & Albert Museum (V&A): London, UK, 1998; pp. 83–91. [Google Scholar]
- Bishop, J.L.; Lane, M.D.; Dyar, M.D.; Brown, A.J. Reflectance and emission spectroscopy study of four groups of phyllosilicates: Smectites, kaolinite-serpentines, chlorites and micas. Clay Miner. 2008, 43, 35–54. [Google Scholar] [CrossRef]
- Genestar, C.; Pons, C. Earth pigments in painting: Characterisation and differentiation by means of FTIR spectroscopy and SEM-EDS microanalysis. Anal. Bioanal. Chem. 2005, 382, 269–274. [Google Scholar] [CrossRef]
- Fernández-Carrasco, L.; Torrens-Martín, D.; Morales, L.M.; Martínez-Ramírez, S. Infrared spectroscopy in the analysis of building and construction materials. In Infrared Spectroscopy: Materials Science, Engineering and Technology; Theophanides, T., Ed.; InTech: Rijeka, Croatia, 2012; pp. 369–381. [Google Scholar]
- Moretto, L.M.; Orsega, E.F.; Mazzocchin, G.A. Spectroscopic methods for the analysis of celadonite and glauconite in Roman green wall paintings. J. Cult. Herit. 2011, 12, 384–391. [Google Scholar] [CrossRef]
- Fanost, A.; Gimat, A.; de Viguerie, L.; Martinetto, P.; Giot, A.C.; Clémancey, M.; Blondin, G.; Gaslain, F.; Glanville, H.; Walter, P.; et al. Revisiting the identification of commercial and historical green earth pigments. Colloids Surf. A Physicochem. Eng. Asp. 2020, 584, 124035. [Google Scholar] [CrossRef]
- Buckley, H.A.; Bevan, J.C.; Brown, K.M.; Johnson, L.R.; Farmer, V.C. Glauconite and celadonite: Two separate mineral species. Miner. Mag. 1978, 42, 373–382. [Google Scholar] [CrossRef]
- Gettens, R.J.; FitzHugh, E.W. Malachite and Green Verditer. In Artists Pigments. A Handbook of Their History and Characteristics; Roy, A., Ed.; Archetype Publications: London, UK, 1993; Volume 2, pp. 183–202. [Google Scholar]
- Van Der Grift, C.J.G.; Geus, J.W.; Kappers, M.J.; Van Der Maas, J.H. Characterization of copper-silica catalysts by means of in situ Diffuse Reflectance Infrared Fourier Transform Spectroscopy. Catal. Lett. 1989, 3, 159–168. [Google Scholar] [CrossRef]
- Van Der Grift, C.J.G.; Wielers, A.F.H.; Mulder, A.; Geus, J.W. The reduction behaviour of silica-supported copper catalysts prepared by deposition-precipitation. Thermochim. Acta 1990, 171, 95–113. [Google Scholar] [CrossRef]
- Plesters, J. Ultramarine Blue, Natural and Artificial. In Artists Pigments. A Handbook of Their History and Characteristics; Roy, A., Ed.; Archetype Publications: London, UK, 1993; Volume 2, pp. 37–66. [Google Scholar]
- Cennini, C. Libro Dell’arte, 1998th ed.; Akal: Madrid, Spain, 1437. [Google Scholar]
- Grissom, C.A. Green Earth. In Artists Pigments. A Handbook of Their History and Characteristics; Feller, R.L., Ed.; Archetype Publications: London, UK, 1986; Volume 1, pp. 141–168. [Google Scholar]
- Rafalska-Lasocha, A.; Kaszowska, Z.; Lasocha, W.; Dziembaj, R. X-ray powder diffraction investigation of green earth pigments. Powder Diffr. 2010, 25, 38–45. [Google Scholar] [CrossRef]
- Cloutis, E.; MacKay, A.; Norman, L.; Goltz, D. Identification of Historic Artists’ Pigments Using Spectral Reflectance and X-Ray Diffraction Properties I. Iron Oxide and Oxy-Hydroxide-Rich Pigments. J. Near Infrared Spectrosc. 2016, 24, 27–45. [Google Scholar] [CrossRef]
- Wang, F.; Qin, X.F.; Meng, Y.F.; Guo, Z.L.; Yang, L.X.; Ming, Y.F. Hydrothermal synthesis and characterization of α-Fe2O3 nanoparticles. Mater. Sci. Semicond. Process 2013, 16, 802–806. [Google Scholar] [CrossRef]
- Xiao, W.; Jones, A.M.; Collins, R.N.; Bligh, M.W.; David Waite, T. Use of fourier transform infrared spectroscopy to examine the Fe(II)-Catalyzed transformation of ferrihydrite. Talanta 2017, 175, 30–37. [Google Scholar] [CrossRef]
- Salama, W.; El Aref, M.; Gaupp, R. Spectroscopic characterization of iron ores formed in different geological environments using FTIR, XPS, Mössbauer spectroscopy and thermoanalyses. Spectrochim. Acta A Mol. Biomol. Spectrosc. 2015, 136, 1816–1826. [Google Scholar] [CrossRef]
- Wang, Y.; Muramatsu, A.; Sugimoto, T. FTIR analysis of well-defined α-Fe203 particles. Colloids Surf. A Physicochem. Eng. Asp. 1998, 134, 281–297. [Google Scholar] [CrossRef]
- Ruan, H.D.; Frost, R.L.; Kloprogge, J.T. The behavior of hydroxyl units of synthetic goethite and its dehydroxylated product hematite. Spectrochim. Acta Part A 2001, 57, 2575–2586. [Google Scholar] [CrossRef]
- Subramaniyan, S.; Ramasamy, V.; Ponnusamy, V.; Sabari, S.; Anishia, S.R.; Gomathi, S.S. Effect of grinding on the crystal structure of recently excavated dolomite. Indian J. Pure Appl. Phys. 2009, 47, 586–591. [Google Scholar]
- Ritz, M.; Vaculíková, L.; Plevová, E. Identification of Clay Minerals by Infrared Spectroscopy and Discriminant Analysis. Appl. Spectrosc. 2010, 64, 1379–1387. [Google Scholar]
- Rosi, F.; Miliani, C.; Clementi, C.; Kahrim, K.; Presciutti, F.; Vagnini, M.; Manuali, V.; Daveri, A.; Cartechini, L.; Brunetti, B.G.; et al. An integrated spectroscopic approach for the non-invasive study of modern art materials and techniques. Appl. Phys. A Mater. Sci. Process 2010, 100, 613–624. [Google Scholar] [CrossRef]
- Mastrotheodoros, G.P.; Beltsios, K.G. Pigments—Iron-based red, yellow, and brown ochres. Archaeol. Anthropol. Sci. 2022, 14, 35. [Google Scholar] [CrossRef]
- Wiesinger, R.; Pagnin, L.; Anghelone, M.; Moretto, L.M.; Orsega, E.F.; Schreiner, M. Pigment and Binder Concentrations in Modern Paint Samples Determined by IR and Raman Spectroscopy. Angew. Chem. 2018, 57, 7401–7407. [Google Scholar] [CrossRef]
- Bai, Y.L.; Xu, H.; Zhang, Y.; Li, Z.H. Reductive conversion of hexavalent chromium in the preparation of ultra-fine chromia powder. J. Phys. Chem. Sol. 2006, 67, 2589–2595. [Google Scholar] [CrossRef]
- Goldsmith, J.A.; Ross, S.D. The infrared spectra of azurite and malachite. Spectrochim. Acta A 1968, 24, 2131–2137. [Google Scholar] [CrossRef]
- Lluveras, A.; Boularand, S.; Andreotti, A.; Vendrell-Saz, M. Degradation of azurite in mural paintings: Distribution of copper carbonate, chlorides and oxalates by SRFTIR. Appl. Phys. A 2010, 99, 363–375. [Google Scholar] [CrossRef]
- Farmer, V.C. The infrared spectra of mineral. Mineral. Soc. Monogr. 1974, 4, 331–363. [Google Scholar]
- Rosi, F.; Daveri, A.; Miliani, C.; Verri, G.; Benedetti, P.; Piqué, F.; Brunetti, B.G.; Sgamellotti, A. Non-invasive identification of organic materials in wall paintings by fiber optic reflectance infrared spectroscopy: A statistical multivariate approach. Anal. Bioanal. Chem. 2009, 395, 2097–2106. [Google Scholar] [CrossRef] [PubMed]
- Siidra, O.; Nekrasova, D.; Depmeier, W.; Chukanov, N.; Zaitsev, A.; Turner, R. Hydrocerussite-related minerals and materials: Structural principles, chemical variations and infrared spectroscopy. Acta Crystallogr. B Struct. Sci. Cryst. Eng. Mater. 2018, 74, 182–195. [Google Scholar] [CrossRef] [PubMed]
- Mendoza-Flores, A.; Villalobos, M.; Pi-Puig, T.; Martínez-Villegas, N.V. Revised aqueous solubility product constants and a simple laboratory synthesis of the Pb(II) hydroxycarbonates: Plumbonacrite and hydrocerussite. Geochem. J. 2017, 51, 315–328. [Google Scholar] [CrossRef]
- Gettens, R.J.; FitzHugh, E.W. Azurite and Blue Verditer. In Artists Pigments. A Handbook of Their History and Characteristics; Roy, A., Ed.; Archetype Publications: London, UK, 1993; Volume 2, pp. 23–36. [Google Scholar]
- Gettens, R.; Kühn, H.W.T.C. Lead White. In Artists Pigments. A Handbook of Their History and Characteristics; FitzHugh, E.W., Ed.; Archetype Publications: London, UK, 1997; Volume 3, pp. 67–82. [Google Scholar]
- Franquelo, M.L.; Duran, A.; Herrera, L.K.; Jimenez de Haro, M.C.; Perez-Rodriguez, J.L. Comparison between micro-Raman and micro-FTIR spectroscopy techniques for the characterization of pigments from Southern Spain Cultural Heritage. J. Mol. Struct. 2009, 924–926, 404–412. [Google Scholar] [CrossRef]
- Vahur, S.; Knuutinen, U.; Leito, I. ATR-FT-IR spectroscopy in the region of 500–230 cm−1 for identification of inorganic red pigments. Spectrochim. Acta A Mol. Biomol. Spectrosc. 2009, 73, 764–771. [Google Scholar] [CrossRef]
- Gettens, R.J.; Feller, R.L.; Chase, W.T. Vermilion and Cinnabar. In Artists Pigments. A Handbook of Their History and Characteristics; Roy, A., Ed.; Archetype Publications: London, UK, 1993; Volume 2, pp. 159–182. [Google Scholar]
- Scott, D.A. Copper and Bronze in Art. Corrosion, Colorants, Conservation; Getty Publications: Los Angeles, CA, UAS, 2002. [Google Scholar]
- Salvadó, N.; Butí, S.; Cotte, M.; Cinque, G.; Pradell, T. Shades of green in 15th century paintings: Combined microanalysis of the materials using synchrotron radiation XRD, FTIR and XRF. Appl. Phys. A Mater. Sci. Process. 2013, 111, 47–57. [Google Scholar] [CrossRef]
- Prati, S.; Bonacini, I.; Sciutto, G.; Genty-Vincent, A.; Cotte, M.; Eveno, M.; Menu, M.; Mazzeo, R. ATR-FTIR microscopy in mapping mode for the study of verdigris and its secondary products. Appl. Phys. A Mater. Sci. Process. 2016, 122, 10. [Google Scholar] [CrossRef]
- San Andrés, M.; De La Roja, J.M.; Baonza, V.G.; Sancho, N. Verdigris pigment: A mixture of compounds. Input from Raman spectroscopy. J. Raman Spectros. 2010, 41, 1468–1476. [Google Scholar] [CrossRef]
- Nakamoto, K. Infrared Spectra of Inorganic and Coordination Compounds; John Wiley & Sons: New York, NY, USA, 1963. [Google Scholar]


| Chemical Nature | Suppliers Code | Authors Code * | Supplier’s Composition | Authors’ Mineralogical Composition by XRD |
|---|---|---|---|---|
| Silicates | #100601 Egyptian blue | EGB-S | Cuprorivaite | Cuprorivaite, CaCuSi4O10 Quartz, SiO2 |
| #10510 Lapis lazuli | UL-N | Sodium calcium aluminium silicate | Lazurite, Na3Ca(Al3Si3O12)S Sodalite, Na8Al6Si6O24Cl2 Calcite, CaCO3 Diopside, CaMgSi2O6 Pyrite, FeS2 Albite, (Na,Ca)(Si,Al)4O8 Muscovite, KAl2Si3AlO10(OH)2 Wollastonite, CaSiO3 | |
| #45010 Blue ultramarine | UL-S | Sodium aluminium sulphosilicate + kaolinite | Lazurite, Na3Ca(Al3Si3O12)S Sodalite, Na8Al6Si6O24Cl2) Nepheline, Na,K(Al4Si4O16) Kaolinite, Al2Si2O5(OH)4 | |
| #11010 Green Verona earth | GE-N | Celadonite | Glauconite, (K,Na)(Fe3+,Al,Mg)2(Si,Al)4O10(OH)2 Celadonite, K(Mg,Fe)Fe3+Si4O10(OH)2 Muscovite, KAl2(AlSi3O10)(OH)2 Calcite, CaCO3 Clinochlore, (Mg,Fe2+)5Al(Si3Al)O10(OH)8 Albite, NaAlSi3O8 Montmorillonite, (Na,Ca)0,3(Al,Mg)2Si4O10(OH)2·nH2O Kaolinite, Al2Si2O5(OH)4 | |
| #10350 Chrysocolla | CHR-N | Natural copper silicate | Chrysocolla, CuSiO3 Malachite, CuCO3Cu(OH)2 Quartz, SiO2 | |
| Oxides | #48651 Hematite | HE-N | Natural iron oxide + SiO2 + Al2O3 + CaO + MgO + K2O + TiO2 + P2O5 + MnO + Na2O | Hematite, Fe2O3 Kaolinite, Al2Si2O5(OH)4 Muscovite, KAl2(AlSi3O10)(OH)2 Dolomite, CaMg(CO3)2 |
| #48289 Iron oxide red | HE-S | Synthetic iron (III) oxide | Hematite, Fe2O3 | |
| #11273 Red natural ochre | RO-N | Iron (III) oxide | Hematite, Fe2O3 Quartz, SiO2 Gypsum, CaSO4·2H2O Diopside, CaMgSi2O6 Illite, (K,H3O)(Al,Mg,Fe)2(Si,Al)4O10[(OH)2,(H2O)] | |
| #40301 Yellow iron oxide ochre | YO-N | Goethite + Al2O3 + SiO4 + calcite | Goethite, FeO(OH) Calcite, CaCO3 | |
| #44200 Chromium oxide green | CG-S | Chrome (III) oxide | Eskolaite, Cr2O3 | |
| Carbonates | #10200 Natural Azurite | AZ-N | Copper hydroxide carbonate | Azurite, CuCO3Cu(OH)2 Quartz, SiO2 Kaolinite, Al2Si2O5(OH)4 Phlogopite, KMg3AlSi3O10(F,OH)2 |
| #10180 Synthetic azurite | AZ-S | Basic copper carbonate | Azurite, CuCO3Cu(OH)2 Calcite, CaCO3 | |
| #10300 Natural malachite | MA-N | Copper hydroxide carbonate | Malachite, CuCO3Cu(OH)2 Cuprite, Cu2O Hematite, Fe2O3 | |
| #44400 Synthetic malachite | MA-S | Copper hydroxide carbonate | Malachite, CuCO3Cu(OH)2 Quartz, SiO2 | |
| #46000 White lead | WL-S | Lead carbonate, cerussite | Cerussite, PbCO3 | |
| Sulphides | #10624 Cinnabar | CI-N | Cinnabar | Cinnabar, HgS |
| #42000 Vermilion | VE-S | Mercuric sulphide | Cinnabar, HgS | |
| #10700 Orpiment | OR-N | Yellow arsenic sulphide | Orpiment, As2S3 Realgar, AsS | |
| Acetate | #44450 Verdigris | VER-S | Copper (II)-acetate-1-hydrate | Hoganite, Cu(CH3COO)2·H2O |
Disclaimer/Publisher’s Note: The statements, opinions and data contained in all publications are solely those of the individual author(s) and contributor(s) and not of MDPI and/or the editor(s). MDPI and/or the editor(s) disclaim responsibility for any injury to people or property resulting from any ideas, methods, instructions or products referred to in the content. |
© 2025 by the authors. Licensee MDPI, Basel, Switzerland. This article is an open access article distributed under the terms and conditions of the Creative Commons Attribution (CC BY) license (https://creativecommons.org/licenses/by/4.0/).
Share and Cite
Jiménez-Desmond, D.; Pozo-Antonio, J.S. Fourier Transform Infrared (FTIR) Database of Historical Pigments: A Comparison Between ATR-FTIR and DRIFT Modalities. Appl. Sci. 2025, 15, 3941. https://doi.org/10.3390/app15073941
Jiménez-Desmond D, Pozo-Antonio JS. Fourier Transform Infrared (FTIR) Database of Historical Pigments: A Comparison Between ATR-FTIR and DRIFT Modalities. Applied Sciences. 2025; 15(7):3941. https://doi.org/10.3390/app15073941
Chicago/Turabian StyleJiménez-Desmond, Daniel, and José Santiago Pozo-Antonio. 2025. "Fourier Transform Infrared (FTIR) Database of Historical Pigments: A Comparison Between ATR-FTIR and DRIFT Modalities" Applied Sciences 15, no. 7: 3941. https://doi.org/10.3390/app15073941
APA StyleJiménez-Desmond, D., & Pozo-Antonio, J. S. (2025). Fourier Transform Infrared (FTIR) Database of Historical Pigments: A Comparison Between ATR-FTIR and DRIFT Modalities. Applied Sciences, 15(7), 3941. https://doi.org/10.3390/app15073941