Abstract
Adjustments to the anatomy of the facial region, such as maxillary expansion, may impact the geometry of the nasal airway and may increase nasal airway volume. The purpose of this study was to investigate the possible effect of maxillary dentoalveolar expansion using clear aligners on the nasal airway’s volume and intermolar distance in pediatric patients. Before and after maxillary expansion treatment using clear aligners, cone-beam computed tomography (CBCT) radiographs were taken as part of the diagnostic and progress records of 11 children (6–13 years) with constricted maxilla (the experimental group). The CBCT scans of 7 children (7–12 years) who had no treatment were considered to be the control group. The changes in nasal airway volume and intermolar distance between the experimental and control groups were compared and analyzed. Correlation analysis between nasal airway volume and intermolar distance changes was also performed. Compared with the control group, the nasal airway volume of the patients in the experimental group showed a significant increase (1595.6 ± 804.1 mm3; p < 0.001), and the intermolar distance also increased significantly (2.4 ± 0.4 mm; p < 0.001). However, there was little correlation between the change in intermolar distance and the change in nasal airway volume in the experimental group (r = −0.029) and a negative correlation in the control group (r = −0.768). This study showed increased maxillary intermolar width and increased nasal airway volume in children with constricted maxilla who underwent orthodontic maxillary expansion using clear aligners. Further studies with larger sample sizes and long follow-ups are needed. Due to the study design and small sample size, the results should be interpreted with caution and no causal relationship can be drawn between maxillary expansion using clear aligners and obstructive sleep apnea.
1. Introduction
One of the significant health challenges in children is maxillofacial abnormalities, such as a narrow maxilla and hypoplastic or posteriorly positioned mandibles [1], which can lead to airway obstruction at various levels. These structural deficiencies not only affect oral function and facial esthetics but also have implications for overall health, including respiratory and sleep quality [1,2]. Airway obstruction in children may contribute to conditions such as obstructive sleep apnea (OSA) [3], which is associated with cognitive, behavioral, stroke-related, hypertension-based, and cardiovascular complications [4,5,6].
Maxillary expansion has been a widely used intervention for addressing these abnormalities. Traditional methods such as rapid maxillary expansion (RME), slow maxillary expansion (SME) using traditional orthodontic appliances, and surgically assisted rapid maxillary expansion (SARME) have shown varying degrees of success [7,8]. Previous research has demonstrated that RME can improve nasal airway volume by widening the nasal cavity and reducing resistance to airflow [9,10]. However, recurrence after RME and adverse effects such as edema, pain, and mucosal irritation remain serious concerns [11]. Additionally, while SARME is effective for severe cases, its invasiveness limits its use in pediatric populations.
SME offers an alternative by applying gentler forces, promoting more stable outcomes and allowing sufficient time for bone formation in the intermaxillary suture [8,12,13]. This physiological approach is often favored by both clinicians and patients [14]. However, SME has traditionally been implemented using fixed appliances, which may cause discomfort and are less esthetically appealing, particularly for younger patients [15].
Recently, clear aligners have emerged as a potential alternative option in orthodontics, including maxillary expansion [15,16,17]. These devices are not only more comfortable and hygienic but also provide superior esthetics, making them particularly attractive for children and their parents [16,17]. Despite their growing adoption, the effect of clear aligners on maxillary intermolar distance and nasal airway volume in children has not been investigated.
The objectives of this study were to:
- (1)
- Determine the possible changes in the nasal airway volume after maxillary arch expansion with clear aligners using cone-beam computed tomography (CBCT) and compare the experimental group’s results to a control group without treatment.
- (2)
- Assess the maxillary intermolar distance changes associated with maxillary expansion using clear aligners in children.
- (3)
- Investigate possible correlations between intermolar distance changes and changes in nasal airway volume after maxillary expansion using clear aligners.
2. Materials and Methods
2.1. Study Design
This is a retrospective cohort-controlled study. Participants’ data were collected randomly by blinded investigators to minimize the potential impact of inherent bias on the study. Similarly, model segmentation, measurements, and data analysis were conducted by blinded investigators to ensure objectivity and consistency as well as to eliminate potential bias.
2.2. Participants
The inclusion criteria were as follows: individuals under 18 years of age; head in the same position during both CBCT scans; high-quality CBCT scans; appropriate total length of treatment time; full field of view of the maxillofacial region; no cold, allergies, or inflammation in the upper airway during the CBCT scan; no previous history of orthodontic treatment; and no history of craniofacial surgical procedures. Based on the pilot study, the sample size for the paired t-test for the experimental group was calculated to require a minimum of 7 patients. The sample size calculation was based on a Significance Level (alpha) of 0.05 and a power of 0.95. In the experimental group, a total of 23 initial patient records were evaluated, and 12 of them were excluded for not meeting the study’s inclusion criteria. The final experimental group was composed of n = 11 pediatric patients (4 males, 7 females) with a mean age of (9.13 ± 0.51 years [mean ± SE]). All participants underwent maxillary expansion using Invisalign® clear aligners (Align Technology, San Jose, CA, USA) as part of their orthodontic treatment plan with a mean treatment time of (13.43 ± 0.74 months). All participants had a CBCT at the start of the treatment (T1) and another CBCT at the end of the treatment (T2) as part of their clinical treatment protocol. Another 12 patients had two CBCT scans as part of their proposed treatment but did not start the treatment at T1 due to financial or personal reasons. They came back for treatment at a similar T2 to the experimental group and were considered the control group. In total, 5 out of 12 initial patients in the control group were excluded for the same reasons that are mentioned above in the exclusion criteria. The final control group consisted of n = 7 patients (5 males, 2 females) with a mean age of (10.20 ± 0.54 years). The mean time between the CBCT scans of the control group was 12.34 ± 1.01 months. The CBCT scans for both groups were performed for clinical diagnosis and treatment planning using the i-CAT FLX V-Series (the model number is 1.009 9472) scanner (Dexis, Arlington, VA, USA). The pixel size of these CBCT scan images was 0.3 mm with a resolution of 536 × 536 pixels per slice. The number of slices for the CT scan data sets was 440 and the slice thickness was 0.3 mm. To ensure the precision and consistency of CBCT imaging, participants were instructed to maintain the same steady head position, breathe naturally, and avoid exaggerated respiratory movements or swallowing, thereby maintaining uniform airway conditions. Approval was granted by the University of Alberta Health Ethics Review Board (protocol number: Pro 00047506). All patients signed a consent form for their records to be used for research purposes. All participants were recruited between September 2020 and February 2022 at the local clinic.
2.3. Nasal Airway Volume
The method utilized in this research project is similar to the previously published protocol [18]. In summary, to create 3D nasal airway models from the CBCT scan images, the scans were imported into Materialise Mimics (Materialise®, Leuven, Belgium) (Figure 1a). A color mask was created by thresholding (Min: −1024 Hounsfield unit (HU), Max: −600 HU) in Mimics® (Figure 1b). Then, manual segmentation was used to remove unnecessary features slice by slice, such as the frontal sinus, maxillary sinus, pharynx, etc., to isolate the nasal airway model (Figure 1c). Additionally, to standardize the study methods, we removed the indeterminate apical parts of the nasal airway, which could be part of both the sinus and the nasal airway. The starting point of the anterior nasal airway boundary was defined as the most anterior slice where the boundary was closed (Figure 1d—upper ones). As shown in (Figure 1d—lower ones), the posterior boundary of the nasal airway was identified as the most posterior slice where the two parts are connected. The upper part belongs to the nasopharynx region, while the lower part belongs to the laryngopharynx region. Finally, the 3D nasal airway model was exported as an STL file.
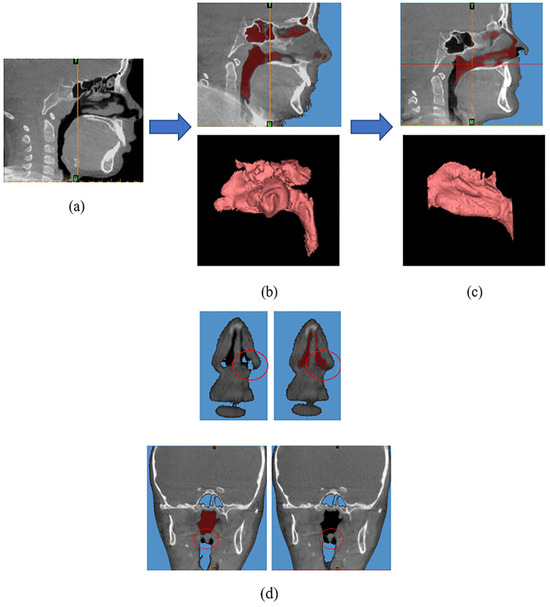
Figure 1.
(a) Importing cone-beam computed tomography (CBCT) scan images into Mimics®. (b) Creating a red color mask. (c) The nasal airway model. (d) The definition of the anterior and posterior nasal airway boundaries.
The T1 and T2 nasal airway 3D models were imported into Geomagic® Control™ 2015 (3D Systems, Rock Hill, SC, USA). The models were cleaned to remove spikes using the tool available in the software, and the process was standardized to minimize investigator bias (smoothness level set to 70). The two models (T1 and T2) were aligned using the best-fit alignment function with T1 as the reference model and T2 as the floating (test) model. The best-fit alignment is a built-in function that minimizes the distance between reference and test models by means of an iterative closest point algorithm. After aligning the models, there was imperfect alignment at the anterior and posterior boundary parts so the edges were trimmed with planes to ensure perfectly aligned boundaries. Under the trim with the plane tool, the position and the angle of the plane can be set to cut off the model to ensure that there is no excess at the anterior and posterior boundary parts of the T1 and T2 models.
The geometrical differences between the T1 and T2 models were determined by conducting a 3D deviation analysis in Geomagic®. This provides a deviation map that can give a visual and quantitative representation of the degree of difference between the surfaces of the models (Figure 2).
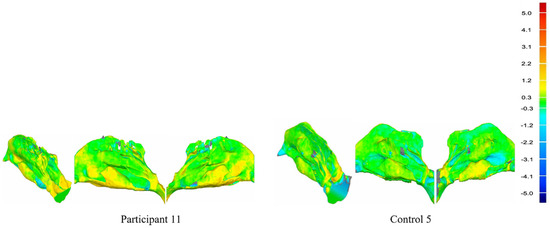
Figure 2.
Deviation maps of Participant 11 and Control 5 (the isometric view, left view, and right view of the nasal airway) and the deviation map scale in millimeters.
The deviation map shows both positive and negative deviation areas. This indicates that the surface of the test model (T2 model) is above or below the reference model (T1 model). The lower threshold value for the deviation color map was set to ±0.3 mm indicating that any areas with deviations within these limits would be considered negligible and colored green. The upper threshold value for the deviation color map was set to ±5.0 mm, which captured the larger deviations between the models where there were corresponding points. The root mean square (RMS) error, the maximum upper deviation, and the maximum lower deviation were also output as outcome metrics from the 3D deviation analysis. In addition, the volume and surface area of the nasal airway models can be measured in Geomagic®.
2.4. Intermolar Distance
Measuring the amount of expansion of the actual maxillary intermolar distance. The age of our pediatric patients was mainly distributed between 7 and 12 years old, and the first permanent molar in the maxillary usually completed its eruption before that [19]. Therefore, we evaluated the distance between the first permanent molars as the target of our study.
To create 3D models from these CBCT scan images, the scans were imported into Materialise Mimics (Figure 3a). A color mask was created in Mimics® to represent the skull and cervical bone (Figure 3b). Then, segmentation was performed in Mimics® to remove unnecessary parts, like the cervical bone and lower jaw bone to isolate the maxillary teeth (Figure 3c). The maxillary teeth model needed to be smoothed in MIMICS to remove some noise. Finally, the 3D maxillary teeth model was exported as an STL file.
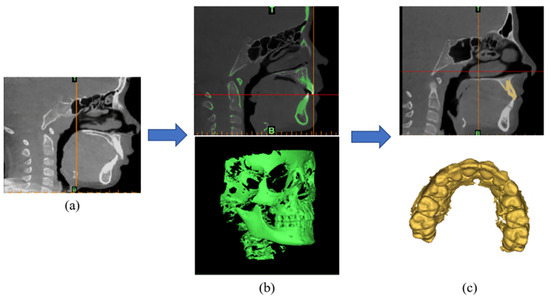
Figure 3.
(a) Importing CBCT scan images into Mimics®. (b) Creating a color mask. (c) The maxillary teeth model.
To study the difference between the T1 intermolar distance and the T2 intermolar distance, both T1 and T2 maxillary teeth models were imported into Geomagic® Control™ 2015. In order to continue to remove some noise around the maxillary teeth model, the tool in Geomagic® was used to remove spikes with larger angle deficiency to smooth the model. Then, the distance between the central fossae of the first permanent molars of the upper arch was measured as the intermolar distance in Geomagic®.
2.5. Statistical Analysis
Statistical analyses were performed using JASP (Version 0.19.2) and Microsoft Excel (Version Professional Plus 2019).
Nasal airway volume:
The T1 and T2 nasal airway volumes of patients in the experimental group or control group were compared using a paired-samples t-test to assess differences, respectively. The nasal airway volume changes in all participants in the experimental group and control group were compared using an independent t-test to assess differences. p < 0.05 was considered significant. The average nasal airway volume changes in the experimental group and control group were compared.
To test the reliability of this study, inter-reliability research and intra-reliability research were added to this study. For inter-reliability, three investigators conducted the segmentations and measured the nasal airway volumes before and after treatment for two patients’ records. The nasal airway volumes measured by these 3 investigators were analyzed by intraclass correlation coefficient (ICC) statistical test. For intra-reliability research, the primary investigator repeated the T1 nasal airway segmentation of one patient’s records 3 times (each time at 2-week intervals to minimize the effect of recency bias). The measurements were then analyzed using the Dahlberg error method.
Intermolar distance:
The T1 and T2 intermolar distances of patients in the experimental group or control group were compared using a paired-samples t-test to assess differences, respectively. The intermolar distance changes in all participants in the experimental group and control group were compared using an independent t-test to assess differences. p < 0.05 was considered significant.
To test the reliability of the distance measurement results, intra-reliability research and inter-reliability research were added. The methodological details were the same as the reliability study of the nasal airway volume.
Correlation analysis:
To evaluate the possible relationship between the change in intermolar distance and the change in nasal airway volume, a correlation coefficient statistical analysis was performed for both the experimental and control groups. Within the group, nasal airway volume change values and intermolar distance change values for each patient were used as analysis values.
3. Results
3.1. Nasal Airway Volume
Table 1 displays the nasal airway volume changes in the experimental group and control group. The results show that the average volume change was 15.13% and −3.73% in the experimental and control groups. The results of the paired-samples t-test between the T1 and T2 of the experimental group show a significant increase (p < 0.001). However, the results of the paired-samples t-test between the T1 and T2 of the control group show no significant change (p = 0.274). The results of the independent t-test show that there was a significant difference between the experimental group and the control group (p < 0.0001).

Table 1.
Nasal airway volume changes in the experimental group and control group.
The deviation maps for Participant 11 and Control 5 were chosen and are shown in Figure 2 as they can represent the averages of the experimental and control groups, respectively. The green areas of the deviation map represent regions where the difference between the T1 nasal airway model and T2 nasal airway model surfaces are small (<0.3 mm), whereas the dark red/blue areas represent regions with larger differences (>5.0 mm). The positive change values indicate that the T2 nasal airway model is above the T1 nasal airway model (outward deviation/increase), and negative change values indicate that the T2 nasal airway model is beneath the T1 nasal airway model (inward deviation/decrease). As Figure 2 shows the difference between the two patient deviation maps, the experimental group maps have more yellow and red areas and fewer blue areas than the control group.
The ICC of the inter-reliability test was 0.960. For intra-reliability, the mean difference in measured nasal airway volume after each segmentation was 0.99%, and the mean difference in nasal airway surface area was even smaller at 0.12%. The Dahlberg error was calculated to be 68.7 mm3, which is minimal compared to the actual volume of the model (8731.1 mm3). Based on the inter-reliability and intra-reliability research, the results show that the nasal airway volume results obtained in this study are reliable.
3.2. Intermolar Distance
Table 2 displays the intermolar distance changes in the experimental group and control group.
Table 2.
Intermolar (the maxillary first permanent molars) distance changes in the experimental group and control group.
The results of the paired-samples t-test between the T1 and T2 groups show a significant increase in intermolar distance with the clear aligners treatment (p < 0.001). The results of the paired-samples t-test between the T1 and T2 groups show a significant increase in molar spacing in the untreated control group (p = 0.037). The results of the independent t-test show that there is a significant difference between the experimental group and the control group (p = 0.0004).
The ICCs of the inter-reliability and the intra-reliability research results are 0.888 and 0.992, respectively. The Dahlberg error was calculated to be 0.0067 mm, which is minimal compared to the average distance. Based on the inter-reliability and intra-reliability research, the results show that the intermolar distance results obtained in this study are reliable.
3.3. Correlation Analysis
In the experimental group, no correlation (r (correlation coefficient) = −0.029) was found between the change in intermolar distance and the change in nasal airway volume. In the control group, there was a negative correlation (r = −0.768) between the change in intermolar distance and the change in nasal airway volume. As the intermolar distance increases, the nasal airway volume decreases.
4. Discussion
In this study, we evaluated the effect of maxillary expansion using clear aligners on the nasal airway in children. Studying the effect of clear aligners on the intermolar distance and nasal airway volume will help orthodontists develop better treatment plans. In some previous reports [9,10,20], the effects of RME on nasal volume have been studied. De Felippe et al. used three-dimensional morphometric analysis and acoustic rhinometry to evaluate the maxillary dental arches and nasal cavities and concluded that RME resulted in a significant expansion of the palate and a significant increase in nasal airway volume [20]. Cordasco et al. reported that RME increased the nasal airway cavity size in children [9]. Moreover, Moreira et al. found the effect of two RME methods of Hyrax and Haas appliances on the nasal airway [10]. Both appliances can significantly increase nasal cavity dimensions in children. Our study is the first to use clear aligners as a study to evaluate their effects on the nasal airway and upper dental arch expansion in children.
Regarding the segmentation of the nasal airway model, some apical regions of the nasal airway are often connected to the maxillary sinus parts, which causes a lot of noise for the segmentation of the model. Since the lower part of the nasal airway is more affected by maxillary expansion compared to the upper part [9,21,22,23]. Therefore, we removed the indeterminate apical parts of the nasal airway which could be both the sinus and the nasal airway as much as possible to control for study methods standardization.
In a previous study, Cordasco et al. reported that RME can increase by about 8% in nasal airway volume in children [9]. However, our research shows an average increase of 15.13% in the nasal airway volume in the experimental group. The data in their study include a mean age of 9.70 ± 1.41 years, similar to our data (which include a mean age of 9.13 ± 0.51 years). However, their treatment time was 7 months, which is less than our study’s treatment time which was an average of 13.43 months. This may be one of the reasons why their volume increase is smaller than ours.
The nasal airway volume in the control group showed a reduction of 3.73%. This may be attributed to the lack of timely treatment following the initial visit, leading to further deterioration of the patient’s condition. However, future studies should include a larger sample size to further investigate and strengthen these conclusions.
Although our study revealed important new findings, there are also limitations. Correlation analysis showed almost no relationship between nasal airway volume and intermolar distance in the experimental group, while a strong inverse correlation was observed between these two variables in the control group. There are a number of possible reasons for this, such as the fact that the craniomaxillofacial system in children is in a developmental stage [24], and the rate of growth and morphological changes in the skeleton may make it less likely that the localized effects of maxillary expansion treatments will show up as a direct correlation. Nasal airway volume is also affected by soft tissue (e.g., nasal mucosa, adenoid size, etc.) [25]. During puberty, children’s adenoids and tonsils may fluctuate considerably due to hormonal changes, and their development has not yet reached a stable state [26]. The effect of these soft-tissue factors on nasal airway volume may mask the effect of molar expansion. Also, maxillary dentoalveolar expansion using clear aligners is not expected to perform skeletal expansion, so a positive correlation between the dentoalveolar expansion and the nasal airway may not be expected. In addition, due to the difficulty of collecting data on untreated patients in the control group, there were 7 patients in the control group in this study. Also, the mean nasal airway volume at T1 in the control group was slightly larger than the mean nasal airway volume at T1 in the experimental group. This could be because the experimental group had initially narrower palates that required to be expanded and the mean age of the control group (10.20 years) was slightly greater than that of the experimental group (9.13 years) [27]. In addition, it may also be that the control group had a larger percentage of males than the experimental group since males generally have larger nasal cavities than females [28,29]. Therefore, the results of this preliminary study should be interpreted with caution and the database of the control group needs to be expanded in future larger studies. The experimental group will also need to be further expanded to validate and strengthen the conclusions. Also, it is recommended that long-term follow-up assessments be performed to determine the stability and permanence of nasal airway improvements and intermolar distance changes. Because of the aforementioned limitations, a causal relationship between the results of this study and obstructive sleep apnea (OSA), which was not evaluated in this study, may not be considered.
5. Conclusions
Within the limitations of this study, it can be concluded that the experimental group, which underwent maxillary expansion using clear aligners, showed a significant increase in both maxillary intermolar distance and nasal airway volume compared to the control group. However, there was no correlation between the intermolar width changes and the nasal airway volume changes in the experimental group. There was a negative correlation between the change in intermolar distance and the change in nasal airway volume in the control group.
Author Contributions
Conceptualization, B.P., L.W. and T.E.-B.; methodology, B.P., D.M., R.N., L.W. and T.E.-B.; software, B.P. and D.M.; validation, B.P. and L.W.; formal analysis, B.P.; investigation, B.P., D.M., L.W. and T.E.-B.; resources, B.P., A.L., L.W. and T.E.-B.; data curation, B.P.; writing—original draft preparation, B.P.; writing—review and editing, B.P., L.W., T.E.-B., D.M., R.N. and A.L.; visualization, B.P., L.W. and T.E.-B.; supervision, L.W. and T.E.-B.; project administration, B.P., L.W. and T.E.-B.; funding acquisition, T.E.-B. All authors have read and agreed to the published version of the manuscript.
Funding
This research was funded by the North American Align Research Award Program of Align Technology Inc. (Align technology: CW2276473).
Institutional Review Board Statement
The study was approved by the University of Alberta Health Ethics Review Board (protocol number: Pro 00047506).
Informed Consent Statement
Informed consent was obtained from all subjects involved in the study.
Data Availability Statement
The authors can provide details of the research upon request by letter outlining the purpose of the request.
Conflicts of Interest
The authors declare that they work in North American Align Research Award Program of Align Technology Inc. The funders participated in the design of the study, as well as in the analyses and interpretation of data, the writing of this article or the decision to submit it for publication. The authors declare no conflicts of interest.
References
- Schwengel, D.A.; Dalesio, N.M.; Stierer, T.L. Pediatric obstructive sleep apnea. Anesthesiol. Clin. 2014, 32, 237–261. [Google Scholar] [CrossRef] [PubMed]
- American Academy of Sleep Medicine. International Classification of Sleep Disorders: Diagnostic and Coding Manual; American Academy of Sleep Medicine: Darien, IL, USA, 2005. [Google Scholar]
- Bitners, A.C.; Arens, R. Evaluation and Management of Children with Obstructive Sleep Apnea Syndrome. Lung 2020, 198, 257–270. [Google Scholar] [CrossRef] [PubMed]
- Yaggi, H.K.; Concato, J.; Kernan, W.N.; Lichtman, J.H.; Brass, L.M.; Mohsenin, V. Obstructive sleep apnea as a risk factor for stroke and death. N. Engl. J. Med. 2005, 353, 2034–2041. [Google Scholar] [CrossRef]
- Peppard, P.E.; Young, T.; Palta, M.; Skatrud, J. Prospective study of the association between sleep-disordered breathing and hypertension. N. Engl. J. Med. 2000, 342, 1378–1384. [Google Scholar] [CrossRef]
- Epstein, L.J.; Kristo, D.; Strollo, P.J., Jr.; Friedman, N.; Malhotra, A.; Patil, S.P.; Ramar, K.; Rogers, R.; Schwab, R.J.; Weaver, E.M.; et al. Clinical guideline for the evaluation, management and long-term care of obstructive sleep apnea in adults. J. Clin. Sleep Med. 2009, 5, 263–276. [Google Scholar] [CrossRef]
- Ficarelli, J.P. A brief review of maxillary expansion. J. Periodontol. 1978, 3, 29–35. [Google Scholar]
- Bell, R.A. A review of maxillary expansion in relation to rate of expansion and patient’s age. Am. J. Orthod. 1982, 81, 32–37. [Google Scholar] [CrossRef]
- Cordasco, G.; Nucera, R.; Fastuca, R.; Matarese, G.; Lindauer, S.J.; Leone, P.; Manzo, P.; Martina, R. Effects of orthopedic maxillary expansion on nasal cavity size in growing subjects: A low dose computer tomography clinical trial. Int. J. Pediatr. Otorhinolaryngol. 2012, 76, 1547–1551. [Google Scholar] [CrossRef]
- Weissheimer, A.; de Menezes, L.M.; Mezomo, M.; Dias, D.M.; de Lima, E.M.; Rizzatto, S.M. Immediate effects of rapid maxillary expansion with Haas-type and hyrax-type expanders: A randomized clinical trial. Am. J. Orthod. Dentofac. Orthop. 2011, 140, 366–376. [Google Scholar] [CrossRef]
- Gurel, H.G.; Memili, B.; Erkan, M.; Sukurica, Y. Long-term effects of rapid maxillary expansion followed by fixed appliances. Angle Orthod. 2010, 80, 5–9. [Google Scholar] [CrossRef]
- Hicks, E.P. Slow maxillary expansion. A clinical study of the skeletal versus dental response to low-magnitude force. Am. J. Orthod. 1978, 73, 121–141. [Google Scholar] [CrossRef] [PubMed]
- Mew, J. Relapse following maxillary expansion: A study of twenty-five consecutive cases. Am. J. Orthod. 1983, 83, 56–61. [Google Scholar] [CrossRef] [PubMed]
- Martina, R.; Cioffi, I.; Farella, M.; Leone, P.; Manzo, P.; Matarese, G.; Portelli, M.; Nucera, R.; Cordasco, G. Transverse changes determined by rapid and slow maxillary expansion—A low-dose CT-based randomized controlled trial. Orthod. Craniofac. Res. 2012, 15, 159–168. [Google Scholar] [CrossRef]
- Lin, E.; Julien, K.; Kesterke, M.; Buschang, P.H. Differences in finished case quality between Invisalign and traditional fixed appliances: A randomized controlled trial. Angle Orthod. 2022, 92, 173–179. [Google Scholar] [CrossRef]
- Sharma, R.; Drummond, R.; Wiltshire, W.; Schroth, R.; Lekic, M.; Bertone, M.; Tate, R. Quality of life in an adolescent orthodontic population. Angle Orthod. 2021, 91, 718–724. [Google Scholar] [CrossRef]
- White, D.W.; Julien, K.C.; Jacob, H.; Campbell, P.M.; Buschang, P.H. Discomfort associated with Invisalign and traditional brackets: A randomized, prospective trial. Angle Orthod. 2017, 87, 801–808. [Google Scholar] [CrossRef]
- Alsufyani, N.A.; Hess, A.; Noga, M.; Ray, N.; Al-Saleh, M.A.; Lagravère, M.O.; Major, P.W. New algorithm for semiautomatic segmentation of nasal cavity and pharyngeal airway in comparison with manual segmentation using cone-beam computed tomography. Am. J. Orthod. Dentofac. Orthop. 2016, 150, 703–712. [Google Scholar] [CrossRef]
- Ekstrand, K.R.; Christiansen, J.; Christiansen, M.E. Time and duration of eruption of first and second permanent molars: A longitudinal investigation. Community Dent. Oral Epidemiol. 2003, 31, 344–350. [Google Scholar] [CrossRef]
- De Felippe, N.L.; Bhushan, N.; Da Silveira, A.C.; Viana, G.; Smith, B. Long-term effects of orthodontic therapy on the maxillary dental arch and nasal cavity. Am. J. Orthod. Dentofacial Orthop. 2009, 136, 490.e1–491.e8. [Google Scholar] [CrossRef]
- Kim, S.Y.; Park, Y.C.; Lee, K.J.; Lintermann, A.; Han, S.S.; Yu, H.S.; Choi, Y.J. Assessment of changes in the nasal airway after nonsurgical miniscrew-assisted rapid maxillary expansion in young adults. Angle Orthod. 2018, 88, 435–441. [Google Scholar] [CrossRef]
- El, H.; Palomo, J.M. Three-dimensional evaluation of upper airway following rapid maxillary expansion: A CBCT study. Angle Orthod. 2014, 84, 265–273. [Google Scholar] [CrossRef]
- Deeb, W.; Hansen, L.; Hotan, T.; Hietschold, V.; Harzer, W.; Tausche, E. Changes in nasal volume after surgically assisted bone-borne rapid maxillary expansion. Am. J. Orthod. Dentofac. Orthop. 2010, 137, 782–789. [Google Scholar] [CrossRef] [PubMed]
- Costello, B.J.; Rivera, R.D.; Shand, J.; Mooney, M. Growth and development considerations for craniomaxillofacial surgery. Oral. Maxillofac. Surg. Clin. N. Am. 2012, 24, 377–396. [Google Scholar] [CrossRef] [PubMed]
- Oh, K.M.; Kim, M.A.; Youn, J.K.; Cho, H.J.; Park, Y.H. Three-dimensional evaluation of the relationship between nasopharyngeal airway shape and adenoid size in children. Korean J. Orthod. 2013, 43, 160–167. [Google Scholar] [CrossRef] [PubMed]
- Niedzielski, A.; Chmielik, L.P.; Mielnik-Niedzielska, G.; Kasprzyk, A.; Bogusławska, J. Adenoid hypertrophy in children: A narrative review of pathogenesis and clinical relevance. BMJ Paediatr. Open 2023, 7, e001710. [Google Scholar] [CrossRef]
- Warren, D.W.; Hairfield, W.M.; Dalston, E.T. Effect of age on nasal cross-sectional area and respiratory mode in children. Laryngoscope 1990, 100, 89–93. [Google Scholar] [CrossRef]
- García-Martínez, D.; Torres-Tamayo, N.; Torres-Sanchez, I.; García-Río, F.; Bastir, M. Morphological and functional implications of sexual dimorphism in the human skeletal thorax. Am. J. Phys. Anthropol. 2016, 161, 467–477. [Google Scholar] [CrossRef]
- Bastir, M.; Godoy, P.; Rosas, A. Common features of sexual dimorphism in the cranial airways of different human populations. Am. J. Phys. Anthropol. 2011, 146, 414–422. [Google Scholar] [CrossRef]
Disclaimer/Publisher’s Note: The statements, opinions and data contained in all publications are solely those of the individual author(s) and contributor(s) and not of MDPI and/or the editor(s). MDPI and/or the editor(s) disclaim responsibility for any injury to people or property resulting from any ideas, methods, instructions or products referred to in the content. |
© 2025 by the authors. Licensee MDPI, Basel, Switzerland. This article is an open access article distributed under the terms and conditions of the Creative Commons Attribution (CC BY) license (https://creativecommons.org/licenses/by/4.0/).