Featured Application
The results can be used by the pasta industry to develop products that respond to consumer wishes and demands, e.g., healthy pasta or pasta with special dietary requirements.
Abstract
Market opportunities for microalgae pasta increase if an added health value can be declared. This work aimed to develop organic, vegan, protein- and/or fiber-rich microalgae pasta. Chlorella vulgaris (CV) at 3% and 5%, denatured wheat gluten (dG) and/or apple fibers (AF) were added to the dough and processing, cooking behavior, color, firmness, and sensory properties were investigated to test the influence of increasing protein and fiber contents and the impact of combined ingredients in comparison with the individual ingredients. For dG, the lowest impact on color and sensory changes (unaltered acceptance) was observed, but in combination with CV and AF, the overall effects were higher than with CV or AF alone. In addition, all dG-containing samples showed reduced water absorption and increased firmness, most likely due to a condensed protein network. CV and AF alone had no effect on firmness, but combinations did. AF slightly and 3% CV strongly affected odor, taste, and acceptance (27%) of the pasta. Combinations of CV with dG or AF increased the acceptability (45% and 36%, respectively), combinations of all ingredients worsened it (18%). We conclude that high protein and/or fiber Chlorella pasta is technically feasible, but that CV’s taste must be improved for greater acceptance.
1. Introduction
Pasta stands out as one of the most widely consumed staple foods globally, valued for its sensory appeal, nutritional benefits, convenience, and versatility [1]. The global production of pasta for 2022 is estimated at approximately 16.9 million tons, with the European Union, including Italy, leading as the top producer, followed by other European countries, Central and South America, North America, and Africa. In terms of consumption, Italians rank highest with an average intake of 23.2 kg per capita annually, followed by Tunisians (17 kg), Venezuelans (13.6 kg), and Greeks (12.2 kg) [2]. According to Italian regulations, “dried pasta” must be exclusively produced using water and durum wheat, such as semolina, coarse semolina, or wholemeal semolina. In contrast, many other countries permit the use of common wheat in pasta production [1].
Besides conventional arable crops such as cereals and legumes, researchers and the food industry have become increasingly interested in the use of microalgae, as these are rich in micro- and macronutrients, have a high productivity and the lowest carbon, water, and arable land footprints compared with arable crops [3,4]. The green microalgae Chlorella vulgaris (CV) is 2 to 10 µm in diameter and can be grown autotrophic, heterotrophic or mixotrophic. In contrast to autotrophic cultivation, heterotrophic growth occurs without light on an organic carbon source in fermenters, to achieve higher growth rates and lower harvesting costs [5]. The protein content of CV dry matter (DM) can reach 20–65%, depending on the growth conditions [6]. Lipid and carbohydrate contents can make up 5–40% and 12–55% of DM, respectively [5,7,8].
To guarantee the microbiological as well as the micro- and macronutrient stability of microalgal ingredients, the usual way of incorporating microalgae into food is in the form of dry powders [9,10,11]. However, several studies have shown that the use of microalgae powders is limited to a maximum of 2–3% in many foods, as the effects on sensory properties and acceptance were serious [4,9,12,13,14,15,16,17,18,19]. Moreover, recent studies have shown that European consumers from the Netherlands, Germany, Hungary, Spain, and Italy show a higher willingness to try (WTT) and a more favorable perception to microalgal food if they can expect health and environmental benefits [20]. In particular, the perception of products as being rich in vitamins, minerals, and protein increased the WTT of microalgal food, while a positive impact on the WTT of microalgal products that were perceived high in fiber still was given, though much lower [21]. The low concentration limit of microalgae in food, however, makes it difficult to claim nutritional benefits. Nevertheless, for microalgal pasta, the willingness to buy was shown to also be higher if the pasta has organic labeling, followed by a Nutri-Score label and a vegan label [22]. Therefore, added health value (high in protein and/or fiber claims) and the correct labels on the packaging (organic, vegan) could increase the market success of microalgae pasta.
As part of the EU funded project ProFuture, the aim of this work was to develop vegan, organic, microalgal-containing pasta (3 and 5% CV). In addition, the pasta should allow for claims of being high in protein and/or high in fiber in order to meet consumers’ expectations. For this reason, denatured wheat gluten (dG), which according to the manufacturer is also available as an organic quality variety, and organic apple fibers (AFs) were added to the pasta. Both additives were chosen because their effects on taste and texture were the best in preliminary tests when compared with vital organic gluten and potato and sugar beet fibers, which are also available in high amounts in their organic quality varieties. Studies by Bazarnova et al. [23], who added 2.5–7.5% Chlorella sorokiniana in tagliatelle; Fradique et al. [17], who added 0.5–2.0% CV in spaghetti; and Baune et al. [4], who added 3 and 5% CV in fusilli, have shown that the addition of Chlorella has only a slight effect on the pasta quality parameters, such as optimal cooking time, water adsorption, cooking losses, and pasta firmness, that are related to the starch composition and protein/gluten content of the ingredients [24]. However, sensory acceptance decreased with increasing Chlorella concentration, especially if the pasta showed an altered typical odor [4] and fishy taste [17,23]. In contrast, the addition of gluten to wheat flour pasta has been shown to result in increased optimal cooking time and hardness and reduced starch digestion at 13% [25] and beyond 14% gluten content [26], due to a denser inner structure. Changes in taste have not been investigated. However, isolated wheat gluten is specified by the manufacturer as having a typical wheat flavor, so that no major changes in taste are to be expected. Additionally, the addition of dietary fibers has been shown to reduce the palatability of pasta and to have a severe impact on water absorption, optimal cooking time, cooking losses, and dough elasticity [24,27]. The changes in the quality parameters of fiber-enriched pasta are explained by protein–fiber interactions and the competition of protein, starch and fibers for the available water [24,28]. Potential sensory changes depend on the dietary fibers used (soluble, insoluble, inherent taste) [29,30]. This also applies to the texture. According to Bustos et al. [29], different fibers had different effects on strength and chewiness (reduced compared with the control), elasticity (comparable to the control or reduced), and surface stickiness (increased).
With the above knowledge, the following working hypotheses were formulated: (1) the pasta quality parameters (cooking time, water absorption, cooking losses and texture) are mainly influenced by increasing protein and fiber contents; (2) the impact of the ingredients in combination is different from the impact of the individual ingredients; and (3) CV and AF have a stronger influence on the sensory properties and acceptance than dG. The objective of this work was to demonstrate the feasibility of producing vegan, organic algae pasta with a high protein and/or fiber content and to test the working hypotheses. Therefore, the effects of the ingredients alone and in combination on the processing (net power consumption of the machine, drying behavior), cooking behavior (optimal cooking time and cooking losses), water absorption, color, firmness, and sensory properties of the pasta were investigated.
2. Materials and Methods
2.1. Material
Heterotrophically grown smooth C. vulgaris (CV; LOT No. L201950311) was kindly provided by Allmicroalgae Natural Products, S.A, Pataias, Portugal. As CV was not available in organic quality, CV concentrations of 3 and 5% were chosen to add a significant amount of CV while guaranteeing an organic declaration in accordance with Regulation (EU) 2018/848—wherein at least 95% of the agricultural ingredients of the product by weight are organic [31]. Organic durum wheat semolina (DWS; LOT No. S-1712200000-003), GLUSTAR 100 (dG; LOT No. 1409220435), and organic apple fibers (AF; LOT No. 35535IU) were purchased from Antersdorfer Mühle GmbH & Co Vertriebs KG, Simbach/Inn, Germany; Kröner Stärke GmbH, Ibbenbüren, Germany; and Bioservice Zach GmbH, Schrems, Austria, respectively. Composition of the ingredients is given in the Supplementary Data, Table S1.
2.2. Pasta Production
2.2.1. Small-Scale Production for Trials
Fresh pasta was prepared in three main stages: initial ingredient mixing, dough formation, and extrusion, as outlined in a previous study [4]. A Pasta V 300 tabletop pasta machine (Karl-Heinz Häussler GmbH, Heiligkreuztal, Germany) was used for this process, paired with brass-coated matrices for lasagna sheets (flat matrix no. 99 V, gap set to 1.6 mm) and fusilli (matrix no. 49 c). Ingredient quantities were chosen to achieve the desired nutritional properties, including high protein and/or high fiber content, with minimal additional components. Specifically, different formulations were created, such as 100% DWS (control), 3% CV and 5% CV, 9% dG, 3% CV + 9% dG, 5% CV + 9% dG, 5.5% AF, 3% CV + 5.2% AF, 5% CV + 4.6% AF, 3% CV + 9% dG + 5% AF, and 5% CV + 8.3% dG + 4% AF, ensuring the pasta dough’s final moisture content (combining bulk and material moisture) was maintained at 34.00 ± 0.06% (Supplementary Data, Table S2). The final drying process reduced the pasta’s moisture content to below 13%, in compliance with the German Food Codex guidelines for pasta products [32], following the method described earlier [4]. Three separate production runs (triplicates) were carried out for each pasta sample. The calculated dry pasta composition, based on ingredient analysis (Supplementary Data, Table S1), is presented in Table 1.

Table 1.
Calculated composition of dry pasta based on the ingredients’ composition.
2.2.2. Industrial Scale-Up Using Bronze Wire Drawing
A large-scale pasta production process was conducted to assess the feasibility of producing high-fiber pasta (AF, 3% CV + AF) and to evaluate its effect on the sensory properties of the final product. The production took place at Tradizioni Padane LLC (Gottolengo, Italy). In brief, the ingredients, including DWS, AF, and CV (as described in Section 2.2.1), were combined using a mixer with sieves. The resulting mixture was then transferred to a mixing tank, where tap water (25–35 °C) was gradually added automatically. Following this step, the pasta was formed into fusilli shapes using a bronze wire-drawing process, and the final product was dried at 45 °C with 78% humidity for 20 h. The total batch size was 130 kg of dry pasta per sample.
2.3. Physical Analyses
2.3.1. Net Power Consumption
During the dough preparation and extrusion phases (Section 2.2.1.), the power usage of the pasta machine was monitored every 10 s for 14 min with a power meter (VOLTCRAFT SEM6000SE, Conrad Electronic SE, Hirschau, Germany). Net power consumption was determined by subtracting the idle power consumption (with the extruder and cutter running).
2.3.2. Residual Moisture Content After Drying
The residual moisture content of dry pasta was measured in quintuple for each of the three replicates (n = 15 per sample), following the method described in a previous study [4], using an OHAUS MB23 infrared dryer (OHAUS Europe GmbH, Nänikon, Switzerland). A 200 g sample of fusilli was ground at 1500 rpm in a cutting mill (Robot Coupe R2, Robot Coupe SNC, Vincennes, France). A 10.00 ± 0.20 g portion of the ground pasta was then placed in an aluminum dish (Ø 80 mm), evenly spread, and dried at 140 °C until a constant weight was achieved. The moisture content was reported as a percentage, as determined by the dryer.
2.3.3. Color Analysis
The color of dry lasagna sheets was evaluated using a CM-600d colorimeter (Konica Minolta, Tokyo, Japan) under D65 standardized light. The L*a*b* values and Euclidean color distance (ΔE) were calculated as described previously [11]. For each of the three pasta replicates 10 measurements were made from the top side and 10 from the bottom side (n = 60 per sample).
2.3.4. Appearance
The appearance of the pasta samples was monitored by taking pictures of the top and bottom side of each sample from above. For this purpose, the top and bottom sides of the dry lasagna sheets were placed next to each other on a cream-colored wooden panel which was placed on a countertop and photographed with a digital SLR camera (Nikon D5600, Nikon Europe B.V., Amstelveen, Netherlands). The following settings were used: mode, manual; aperture, F5.6; film speed, ISO 640 (ISO 12232:2019 [34], 2019); exposure time, 1/200; mode, picture size, 2000 × 2992 (Basic S). The camera was placed on a fully extended tripod (Velbon DV-40, Hakuba Photo Industry Co., Ltd., Tokyo, Japan) so that the same distance was always maintained.
2.3.5. Optimal Cooking Time
The cooking time to reach the optimal “al dente” texture was determined in triplicates for each of the three replicates (n = 9 per sample) by measuring the time it took for the pasta to reach the desired bite consistency, following the method outlined by Baune et al. [4] and according to the AACC method AACC 66-50.01 [29]. In each replicate, 25.0 ± 2.0 g of fusilli was added to boiling distilled water and the timer was started. Starting from the second minute, one fusilli was removed every 30 s, placed between two layers of cling film, and mashed. The optimal cooking point was reached when the pasta, including the core, could be fully mashed. If the pasta was overcooked, additional 10 s intervals were used.
2.3.6. Water Absorption
Water absorption was assessed in triplicate for each pasta replicate (n = 9 per sample), based on the method described by Baune et al. [4]. A 25.0 ± 0.1 g sample of dry fusilli (w0) was boiled in distilled water until it reached the “al dente” state. After cooking, the pasta was drained in a sieve for 30 s, transferred to a pre-weighed 600 mL sample vessel (including lid; originality BD 002-600 O, Pöppelmann GmbH & Co. KG, Lohne, Germany), and sealed. The weight of the cooked pasta (wc) was recorded, and the water absorption (WA) percentage was calculated as the difference, according to Equation (1).
WA [%] = (wc − w0)/w0 × 100
2.3.7. Cooking Losses
Cooking losses were measured in triplicate for each of the three pasta replicates (n = 9 per sample) by assessing the dry matter (DM) content of the cooking water, as described by Baune et al. [4]. A 100 g sample of broken lasagna sheets was cooked in 1000 mL of tap water for exactly 10 min. After discarding the pasta, the cooking water was transferred to 1 L glass bottles (DU-RAN®, GL45, 1 L, Schott AG, Mainz, Germany), filled up to 1000 mL with tap water, and allowed to cool. The dry matter (DM) was then determined by weighing 5 g of cooking water (w0) into a dried weighing bottle, mixing it with 10 g of dried sea sand using a dry glass rod (w1 = weighing bottle + sea sand + glass rod), and drying the mixture for at least 8 h at 103 ± 2 °C (UF110, Memmert, Schwabach, Germany). The cooled mixture was weighed again (w2) after drying. The dry matter content was calculated using Equation (2).
DM [%] = 100 − (w0 − (w2 − w1))/w0 × 100
2.3.8. Bite Resistance/Firmness
For measuring bite resistance, lasagna sheets were cooked in tap water for exactly 10 min, chilled in ice water for 30 s, dried, and cut to a width of 6 cm. The pasta’s firmness was then evaluated using a TA XT2 texture analyzer (Stable Micro Systems Ltd., Godalming, UK) with a 25 kg loadcell and a blunt blade (8 cm width), as previously described by Baune et al. [4]. Each of the three pasta replicates was measured ten times (n = 30 per sample).
2.4. Sensory Evaluation
2.4.1. Evaluation by German Panelists
Quantitative descriptive analysis (QDA) of the pasta samples was approved by the Ethical Commission for Sensorial tests of ILVO and conducted in a standardized tasting laboratory (ISO 8589:2007 [35], 2007), as described by Baune et al. [4]. The evaluation was carried out by a trained 16-member panel (panel information in Supplementary Data, Table S3). After a free-choice profiling session, attributes such as typical odor, fishy/off odor, after/off taste, saltiness, bite resistance (after five chews), stickiness, and color were evaluated using a 10-point linear scale (0–10) across five independent QDA sessions. Each attribute was trained at least three times and anchor points were established for better classification on the scale using reference samples (Barilla Fusilli No. 98, pasta containing 3% Tetraselmis chui) provided in each QDA session [4]. Panelists were also asked to provide feedback on the overall acceptance of the product as a newly developed commercial product (yes/no). Color scales used for evaluation can be found in the Supplementary Data (Figure S1). Each session included the two reference samples, the control (DWS only), and four to five samples containing varying amounts of CV, dG, and/or AF. The samples were randomized and served at 50–55 °C to a panel of 11 trained assessors. Water was served to rinse the mouth between samples.
2.4.2. Evaluation of Up-Scaled Samples by Spanish Panelists
The sensory properties of up-scaled fusilli (AF and 3% CV + AF) were evaluated by trained Spanish panelists, comparing them with a commercial product (Pastas Gallo/Nature Integral Fusilli, Productos Alimenticios Gallo S.l., El Carpio, Spain) to assess the impact of industrial production. Ethical approval for this study was granted by the Institute of Agrifood Research and Technology’s Sensory Sciences and Consumers Committee (application number CCSC 31/2023). Two initial open discussion sessions were held to establish the sensory descriptors for the pasta. Three categories were evaluated: appearance, odor, taste, and mouthfeel. Appearance descriptors included green and brown color intensities (ranging from light to dark) and the presence of black dots. Smell descriptors included intensity, cardboard, fresh and ripe apple, wet flour, algae, vegetal, and lactic notes. For taste, descriptors such as intensity, sweetness, wet flour, cardboard, cooked apple, algae/vegetal, bitterness, and candies were used, while mouthfeel was characterized by crumbliness and pastiness. Six trained assessors (ISO 8586:2012 [36], 2012) rated the samples in three sessions using a linear scale from 0 to 10, where 0 indicated absence and 10 indicated high intensity. The pasta was boiled in 1 L of tap water per 100 g of product for 9 min (as per the producer’s recommended cooking time), cooled quickly under cold running water, and stored for no longer than 30 min before evaluation. The samples were served to each panelist in random order following a Williams Latin square design to avoid order or sequence bias [37]. The analysis was conducted in a standardized tasting room under green lighting to mask color differences between samples (ISO 8589:2007 [35], 2007). Panelists were provided with mineral water and golden apple slices to cleanse their palates between samples. Panel performance was validated using standard methods (ISO 11132:2021 [38], 2021) to ensure reliability and clarity of the sensory terms.
2.5. Data Analysis
2.5.1. Statistical Evaluation
Statistical analysis was conducted using Sigma Plot 15.0 software (Systat Software Inc., San Jose, CA, USA). Statistical comparisons were made using one-way analysis of variance (ANOVA) followed by Tukey’s post hoc test (95% confidence interval, p-value = 0.05) for most data. If the normality (Shapiro–Wilk) or equal variance (Brown–Forsythe) tests failed, the Kruskal–Wallis one-way ANOVA on ranks followed by Tukey’s post hoc test (95% confidence interval) was applied. This applied to all data sets except for net power consumption (where means ± SD were used for Gaussian error propagation) and the sensory attributes of fishy/off odor and bite resistance. For L*a*b* values, a Kruskal–Wallis one-way ANOVA on ranks followed by Dunn’s post hoc test (95% confidence interval) was applied using the program’s default settings.
2.5.2. Principal Component Analysis
Principal component analysis (PCA) was conducted using Sigma Plot 15.0 software (Systat Software Inc., San Jose, CA, USA) according to the program’s specifications. The sensory attributes were selected as variables, and sample names were selected as labels, with eigenvalues ≥ 0.500 used to define the in-model principal components.
2.5.3. Multiple Logistic Regression Analysis
Multiple logistic regression analysis of the sensory data was performed using Sigma Plot 15.0 software (Systat Software Inc., San Jose, CA, USA) according to the program’s specifications. Sensory attributes were used as independent variables and acceptance (0 for unacceptable, 1 for acceptable) was used as the dependent variable.
3. Results
3.1. Processing, Drying and Appearance
Net power consumption (NPC) of the pasta machine was monitored to determine changes in the processability of the pasta dough. When looking at NPC as a function of time (Supplementary Data Figure S2), it was highest during the first dough production step when the addition of water started. After all water was added (~8 min), NPC stayed nearly constant. The measurement error was very large at the individual time points (between repetitions) and as a mean value over the entire process (Table 2). Therefore, only the 5% CV + dG and the 5% CV + dG + AF samples differed significantly from the control, showing a reduced NPC. If the data sets are viewed as a boxplot (Supplementary Data, Figure S3), it is noticeable that the median of the samples with dG and AF is somewhat higher than the median of the control, whereas it is lower for all samples with CV addition, especially for the samples with 5% CV. This indicates that the dough offered less resistance to the machine with increasing CV amounts, that this was independent of whether dG or AF had been added, and that the dough therefore had lower elasticity and/or viscosity. It was also observed that the pasta machine had increasing difficulty with the addition of AF (volume increase), indicating a reduced dough fluidity and altered pressure during extrusion.
Table 2.
Net power consumption of the pasta machine in W (means ± SD), residual moisture content of dry pasta in percent (means ± SD), and L*a*b* values of dry pasta (means ± SD) as well as Euclidian color difference (ΔE).
The sample 5% CV + dG + AF was the only sample with a 1% increase in moisture content after drying (Table 2), indicating stronger water binding. The appearance of the dried lasagna sheets is shown in Figure 1. The color changes that could be observed with the eye are also reflected in the measured L*a*b* values (Table 2). While the control and the dG sample did not differ visibly in their appearance and L*a*b* values (ΔE = 0.62), the samples with CV and CV + dG became significantly darker (decreased L* value), greener (decreased a* value), and yellower (increased b* value). Samples with AF, CV + AF and CV + dG + AF became darker (decreased L* value) and redder (increased a* value). In addition, samples with AF and CV + dG + AF were less yellow (decreased b* value). Due to the formation of mixed colors through the combination of ingredients, and with higher CV concentrations, ΔE increased.
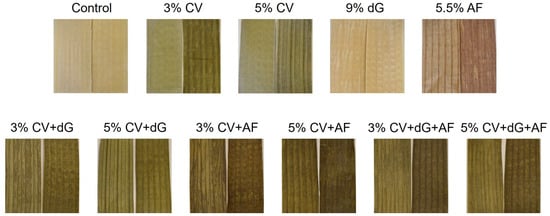
Figure 1.
Appearance of bottom and top of the dry lasagna sheets. AF, apple fiber; CV, C. vulgaris; dG, denatured gluten.
3.2. Pasta Quality Parameters and Bite Resistance
The optimal cooking time of the pasta samples was not affected by the addition of CV, dG and/or AF. Although the cooking time and the standard deviation of some samples increased, as in this case one of the three replicates deviated in its cooking time, the median of these samples remained at 180 s, which emphasizes that the change is not significant. The water absorption for all samples containing dG (dG, CV + dG, and CV + dG + AF) decreased by approximately 10% (Table 3). The cooking loss was also reduced for samples containing dG and CV + dG, but only significantly for the sample 3% CV + dG. Together with the reduced water absorption, this indicated that the addition of gluten resulted in a more compact protein network. The addition of CV and/or AF did not significantly impact water absorption or cooking losses.
Table 3.
Optimal cooking time in seconds, water absorption in percent, and cooking losses in percent (means ± SD).
Further, all samples containing dG (dG, CV + dG, and CV + dG + AF) showed a significant increase in bite resistance/firmness of 10 min cooked lasagna sheets (Figure 2). Samples containing CV + AF also achieved a similar bite resistance to the samples containing dG, while CV and AF alone did not cause any significant change in bite resistance compared with the control. With a higher CV concentration, the bite resistance also tended to be higher.
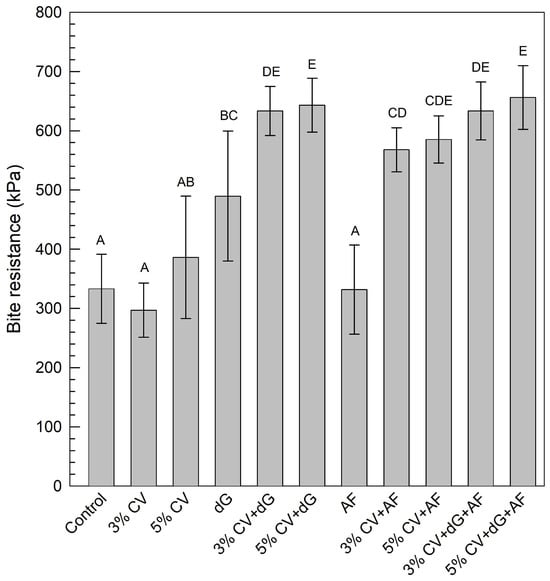
Figure 2.
Bite resistance of the pasta in kPa (means ± SD). AF, apple fiber; CV, C. vulgaris; dG, denatured gluten; SD, standard deviation. Different superscript letters indicate groups with significant differences (confidence interval 95%).
3.3. Changes in Sensory Pasta Properties
Sensory evaluation of the pasta samples by German panelists revealed a significant decrease in the typical pasta odor for all samples except samples dG, AF and 3% CV + dG, in comparison with the control (Table 4). In contrast, the fishy/off odor and the after/off taste increased for all samples except dG (odor and taste), AF (taste) and 3% CV + dG (taste). The sample 5% CV + AF was perceived as significantly saltier and all samples were perceived to have a higher bite resistance whereby the difference was only significant for samples 3% CV, 5% CV + dG, 3% CV + AF, 5% CV + AF, and 3% CV + dG + AF due to large SDs. The stickiness of all samples was perceived as comparable and only the dG sample did not differ in color from the control. A PCA, describing 88.97% of the variance in the first two principal components, shows a similar result (Figure 3). Typical odor is in the opposite direction to all taste and smell attributes, as well as bite resistance, and the control, dG, and AF samples are closest to it. With regard to the question of acceptance as a newly developed commercial product, the addition of 3 and 5% CV alone led to a decrease in acceptance from 91% to 27 and 36%, respectively, whereas the addition of dG and AF caused no or only slight change in acceptance, respectively. Simple mixtures of CV + dG or CV + AF increased the acceptance compared with CV samples. Mixtures of all the ingredients were the least acceptable. A multiple logistic regression analysis (MLRA, Supplementary Data, Table S4) showed no correlation between acceptance and any attribute. According to the PCA (Figure 3), reduced stickiness (although not significant) seems to be the main reason for the low acceptance of 3%CV + dG + AF besides the changes in taste, odor, and bite resistance.
Table 4.
Sensory evaluation of all pasta samples by trained German panelists (means ± SD).
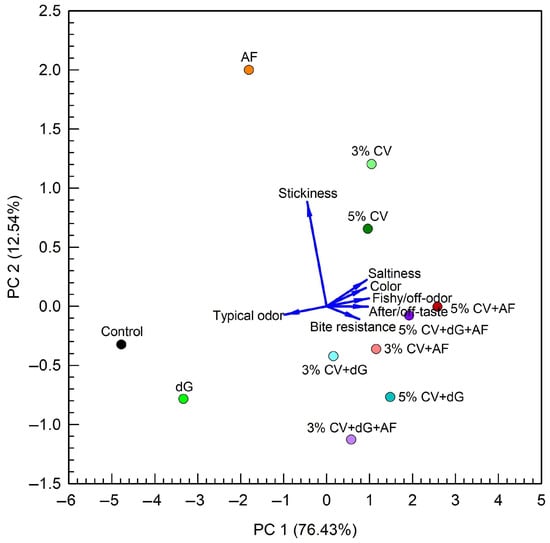
Figure 3.
Principal component analysis of the sensory results of trained German panelists. The first two principal components explain 88.97% of the variance. AF, apple fiber; CV, C. vulgaris; dG, denatured gluten.
Although the German panelists evaluated the acceptance of the pasta with 3% CV + dG higher (45%) than the acceptance of the pasta with 3% CV + AF (36%), it was assumed that the sensorial changes in the 3% CV + dG pasta were primarily due to the addition of CV as no significant sensory changes were found for the dG pasta. In addition, an increase in volume and thus a possible change in the dough properties was only observed in pasta with added fiber. Therefore, the pasta claiming to be high in fiber (AF, 3% CV + AF) was selected for production on an industrial scale. Subsequently, the sensory descriptive attributes of the samples were identified and described in more detail by trained Spanish panelists and evaluated in comparison with commercial fusilli on a 10-point scale (Figure 4). A detailed descriptive analysis was not possible after the small-scale production due to the large number of samples. While the commercial pasta again had the highest typical odor of wet flour, the odor of the AF pasta was described by a stronger odor of ripe apples, and the 3% CV + AF pasta by a stronger odor of algae and fresh apples (Figure 4A). The commercial pasta also had the highest typical taste (wet flour) while the 3% CV + AF sample showed the highest taste intensity and algae taste, and the lowest typical taste (Figure 4B). In terms of color and appearance, 3% CV + AF was described as high-medium green (7.36/10), AF as medium brown (6.67/10), and the commercial pasta as crumblier (Figure 4C). A PCA, describing 100% of the variance in the first two principal components, shows a similar result (Figure 4D). The commercial pasta is located in the direction of wet flour odor and taste, sweet taste, and crumbliness. While the AF sample is located in the direction of brown color, cardboard, and apple odor and taste descriptors, 3% CV + AF is located in the direction of green color, and algae as well as vegetal odor and taste descriptors. The main differences between the results of the sensory studies on industrial-scale production and small-scale production are related to the texture/mouthfeel of the pasta.
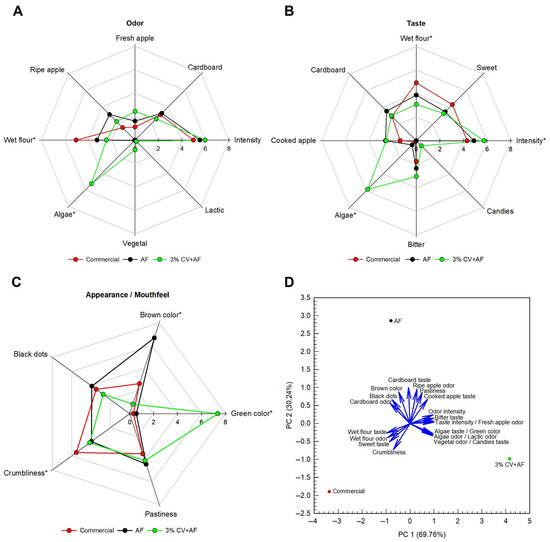
Figure 4.
Sensory descriptive attributes of the fusilli claiming to be high fiber (AF) and the microalgae fusilli claiming to be high fiber (3% CV + AF) in comparison with commercial fusilli. (A) Odor profile, (B) taste profile, and (C) appearance and mouthfeel descriptors of cooked pasta evaluated by trained Spanish panelists on a 10-point linear scale. (D) Principal component analysis of the sensory results given by the trained Spanish panelists. The first two principal components explain 100% of the variance. AF, apple fiber; CV, C. vulgaris. Asterisks denote the descriptors for which significant differences were observed.
4. Discussion
The observation made during production that the pasta machine increasingly struggles when AF was added to the formulations was not reflected in the net power consumption. However, the boxplot data indicated that samples with dG and AF may well have a higher energy consumption, whereas samples with added CV may have a lower energy consumption and therefore viscosity (Supplementary Data, Figure S3). According to Sissons [39], gluten and starch both behave as glassy materials at room temperature (~25 °C) and low moisture (<12%). Through the addition of water, gluten undergoes glass transition and at moisture contents of approximately 33% the gluten will flow under applied stress (mixing), with the moisture being evenly distributed. In the further course of the process, the application of mechanical work during extrusion causes the gluten protein to fuse and form the gluten network so that a crumbly dough becomes stable pasta. Temperatures above 55 °C are avoided in order to prevent irreversible gel formation of the protein [39]. Insoluble dietary fibers have a high water-holding capacity, which results in water competition between fibers, gluten and starch, making the dough less elastic and compact and hence reducing fluidity, which may explain the volume increase and shifted median (Supplementary Data, Figure S3). Moreover, fibers can interact with the vital gluten protein of the durum wheat semolina, impacting the network formation [24,28,29]. Higher CV concentrations also appear to affect the gluten network and seem to reduce the dough viscosity. This could be explained by a high water binding ability and a worse gel formation ability of whole, spray dried CV cells [11]. In addition to a potential effect of the ingredients on energy consumption and thus price, the samples 5% CV + AF and 5% CV + dG + AF showed a moisture content above 11% after drying, indicating a higher water-binding capacity of AF. This can be explained by the high water-binding capacity of dietary fibers in general, which is why the consumption of dietary fibers has a positive effect on the digestive tract [40].
The color changes that could be measured by adding AF (reddish), CV (greenish) or both (green-brownish) correspond to the natural color of the raw materials. Various studies have already shown that a green or red color for pasta has no effect on acceptance, including spinach, red cabbage, tomato, carrot, red beet, microalgae and lentils as colorants [4,17,41,42]. Moreover, colored pasta, e.g., “pasta tricolore” (yellow, red, green) or pasta with cephalopod ink (black), is already available on the market and accepted by consumers.
Cooking quality and textural characteristics of pasta are determined by physical competition between protein coagulation and starch swelling [24,43]. If protein coagulation wins, starch particles are trapped, enhancing the firmness of cooked pasta and reducing cooking losses, while successful starch swelling causes protein coagulation in discrete masses, resulting in non-abrasiveness and typically stickiness of the pasta [24,44]. Therefore, it can be concluded that none of the samples showed an increase in starch swelling due to a loosening of the gluten network structure as neither cooking time, cooking losses nor the stickiness, evaluated by the trained panelists, changed significantly. However, the water absorption for samples with the addition of dG decreased significantly and the firmness increased, which can be explained by the increased protein content (~17% compared with 11%) resulting in a more compact protein network. This is in accordance with the findings from Laleg et al. [25] and Yao et al. [26], who reported increased firmness and a denser inner structure above gluten concentrations of 13 and 14%, respectively. However, they also reported an increase in optimal cooking time, indicating reduced starch swelling due to the higher density [25,26]. Similar findings have been made by Balasooriya and Wickramasinghe [45] when substituting 40% wheat semolina with mixtures of soy and mung flour, resulting in protein concentrations above 18% and enhanced cooking time [45]. In contrast, substituting durum wheat semolina with lupin flour shortened the cooking time from substitution concentrations above 40%, which corresponded to protein and fiber contents above 25% and 12%, respectively [46]. Biernacka et al. [30] reported that the addition of 3–5% carob fiber significantly shortened the cooking time of wheat flour pasta. The addition of both components (dG and AF) could therefore cancel out the effect of a more condensed protein network on starch swelling due to interaction. Further analyses, e.g., observation of the structure using scanning electron microscopy, would be necessary to better understand the changes.
Mixtures of CV + dG and CV + dG + AF show an even higher firmness than pasta with dG alone, which might be explained by a slight increase in protein content and a more pronounced increase in the fiber content. A fiber type and concentration-dependent increase in hardness of pasta has already been described by Bustos et al. [27]. Interestingly, samples containing CV or AF only did not differ in firmness from the control, while the CV + AF samples resulted in a firmness comparable to the CV + dG and CV + dG + AF samples, though the protein content was much lower (11%). Therefore, in this case too, the interaction of the individual components appears to have a decisive influence on firmness due to the altered composition and the associated effects on the protein network density and starch swelling as well as the addition of fibrous structures that mediate additional bite resistance.
The regression analysis of sensory acceptance showed no dependence on specific sensory parameters. However, the samples with the highest typical odor and the lowest fishy/off odor and after/off taste had the highest acceptance (control = dG > AF). Only by adding 3 and 5% CV does acceptance decrease dramatically. This is consistent with previous studies showing that the addition of 5% C. sorokiniana and 2% CV already leads to a significant reduction in acceptance due to the fishy odor and taste [17,23]. The fishy/algae odor and taste, as well as an increased taste intensity, have also been identified as the main differences from commercial pasta by the Spanish panelists. Mixtures of CV + dG and CV + AF showed higher acceptance levels than the CV samples alone, which could be explained by the results of Baune et al. [4], showing that the preservation of the typical pasta odor was more significant for the acceptance of algae pasta than the presence of a fishy/off odor or after/off taste.
Nevertheless, besides the taste, CV samples contain chlorophyll and carotenoids, important macro- and microelements (e.g., iron, manganese, copper and zinc), and high contents in B vitamins [5,8,47,48]. Based on former analyses [48], pasta with 3% CV may contains 0.6 µg vitamin B12. This is particularly interesting for a vegan diet, as there are no other plant-based sources of vitamin B12. However, 700 g of 3% CV pasta would have to be consumed to cover the daily requirement of 4 µg [49]. Moreover, in contrast to products containing soybeans and peas, the market for microalgal food is still in its early stages in Europe, which might be explained by higher prices as well as dietary preferences, habits and attitudes [20,22]. In particular, pasta with CV added is 1.3 to 1.6 times more expensive than the control pasta. Prices for pasta with CV + dG or CV + AF addition are even higher (1.5- to 1.8-fold) and pasta with CV + dG + AF is twice as high (Supplementary Data, Table S5). This price increase only takes into account the ingredient costs and not the energy costs arising from the altered dough properties and the effects on the pasta production process. The real price increases can therefore be even higher due to changed device settings that could result in increased energy consumption and would have to be determined in several upscaling tests. In eastern countries, the acceptance of products containing (micro)algae is significantly higher and more traditional than in Europe [4,50]. To what extent consumers would really buy the pasta with the given claims and prices would have to be determined in a quantitative consumer survey.
In summary, it can therefore be stated that, contrary to expectations, an increasing protein or fiber content, mediated by dG and AF, did not impact cooking time or cooking losses. However, it was in line with expectations that an increase in the protein content resulted in reduced water absorption and higher firmness due to the formation of a more condensed protein network, but an increase in the fiber content alone did not affect these parameters. Only in combination with CV or dG will an increase in fiber also affect firmness, which confirms that the impact of the ingredients in combination is different from the impact of the ingredients individually, most likely due to interactions. CV was also shown to have the strongest effect on sensory acceptance.
5. Conclusions
In principle, the production of organic, vegan, algae pasta that is high in protein and/or fiber is not only feasible, but feasible on industry-typical equipment. The ingredients did not affect the cooking time but, due to a condensed structure as a result of higher protein contents, the water absorption was significantly reduced and therefore the firmness significantly increased. However, the changes in smell and taste, particularly those caused by CV, severely limit the acceptance of the pasta. Consequently, CV’s odor and taste must be improved for greater acceptance. To what extent this also applies to consumers who would accept sensory deviations due to their strong conviction that the algae pasta brings added health value would have to be tested in further studies.
Supplementary Materials
The following supporting information can be downloaded at https://www.mdpi.com/article/10.3390/app15031639/s1, Figure S1: Color scales used for the evaluation of the attribute “color” in the QDA sessions; Figure S2: Net power consumption of the different pasta samples in W as function of time in min (means ± SD); Figure S3: Net powder consumption of the different pasta samples in W as box plots; Table S1: Ingredients composition as specified by manufacturers; Table S2: Relative quantities of ingredients used for the pasta formulations in percent; Table S3: Sensory panel information; Table S4: Multiple logistic regression analysis of the sensory data; Table S5: Price changes of pasta based on raw material prices and quantities.
Author Contributions
Conceptualization, M.-C.B., F.F., T.L, F.S. and L.G.; methodology, M.-C.B., F.F., T.L., F.S., A.C. and U.B.; software, M.-C.B.; validation, M.-C.B., F.F., T.L., F.S., L.G. and U.B; formal analysis, M.-C.B., T.L., L.G. and U.B; investigation, M.-C.B., F.F., T.L. and F.S.; resources, F.F., U.B., V.H. and N.T.; data curation, M.-C.B. and F.F.; writing—original draft preparation, M.-C.B. and F.F.; writing—review and editing, M.-C.B., F.F., T.L., F.S., A.C., L.G., U.B., V.H. and N.T.; visualization, M.-C.B. and F.F.; supervision, M.-C.B., F.F. and N.T.; project administration, M.-C.B., F.F. and V.H.; funding acquisition, M.-C.B., L.G., V.H. and N.T. All authors have read and agreed to the published version of the manuscript.
Funding
This research was funded by the European Union’s Horizon 2020 research and innovation programme [grant agreement No 862980].
Institutional Review Board Statement
The study was conducted in accordance with the Declaration of Helsinki, and approved by the Ethics Committee of Flanders Research Institute for Agriculture, Fisheries and Food (ECGS-ILVO) (Project ProFuture, on 04/10/2021) and the Institute of Agrifood Research and Technology Committee of Sensory Sciences and Consumers (application number CCSC 31/2023).
Informed Consent Statement
Informed consent was obtained from all subjects involved in the study. Written informed consent has been obtained from the patient(s) to publish this paper.
Data Availability Statement
The data presented in this study are available on request from the corresponding author due to privacy reasons.
Acknowledgments
The authors thank Florian Singer and Claudia Pelters for analytical support, Allmicroalgae Natural Products, S.A for the supply of microalgae, Tradizioni Padane LLC for large scale production on industry-standard equipment, and the entire ProFuture consortium for their good cooperation.
Conflicts of Interest
The authors declare no conflicts of interest.
References
- Bresciani, A.; Pagani, M.A.; Marti, A. Pasta-Making Process: A Narrative Review on the Relation between Process Variables and Pasta Quality. Foods 2022, 11, 256. [Google Scholar] [CrossRef] [PubMed]
- I.P.O. International Pasta Organisation—Annual Report. Available online: https://internationalpasta.org/annual-report/ (accessed on 21 January 2025).
- Wang, Y.; Tibbetts, S.M.; McGinn, P.J. Microalgae as Sources of High-Quality Protein for Human Food and Protein Supplements. Foods 2021, 10, 3002. [Google Scholar] [CrossRef] [PubMed]
- Baune, M.-C.; Lickert, T.; Schilling, F.; Bindrich, U.; Tomasevic, I.; Heinz, V.; Smetana, S.; Terjung, N. Impact of Four Different Chlorella vulgaris Strains on the Properties of Durum Wheat Semolina Pasta. Appl. Sci. 2024, 14, 8760. [Google Scholar] [CrossRef]
- Safi, C.; Zebib, B.; Merah, O.; Pontalier, P.-Y.; Vaca-Garcia, C. Morphology, composition, production, processing and applications of Chlorella vulgaris: A review. Renew. Sustain. Energy Rev. 2014, 35, 265–278. [Google Scholar] [CrossRef]
- Canelli, G.; Tarnutzer, C.; Carpine, R.; Neutsch, L.; Bolten, C.J.; Dionisi, F.; Mathys, A. Biochemical and Nutritional Evaluation of Chlorella and Auxenochlorella Biomasses Relevant for Food Application. Front. Nutr. 2020, 7, 565996. [Google Scholar] [CrossRef]
- Brányiková, I.; Maršálková, B.; Doucha, J.; Brányik, T.; Bišová, K.; Zachleder, V.; Vítová, M. Microalgae—Novel highly efficient starch producers. Biotechnol. Bioeng. 2011, 108, 766–776. [Google Scholar] [CrossRef]
- Ru, I.T.K.; Sung, Y.Y.; Jusoh, M.; Wahid, M.E.A.; Nagappan, T. Chlorella vulgaris: A perspective on its potential for combining high biomass with high value bioproducts. Appl. Phycol. 2020, 1, 2–11. [Google Scholar] [CrossRef]
- Lafarga, T. Effect of microalgal biomass incorporation into foods: Nutritional and sensorial attributes of the end products. Algal Res. 2019, 41, 101566. [Google Scholar] [CrossRef]
- Schmid, B.; Navalho, S.; Schulze, P.S.C.; Van De Walle, S.; Van Royen, G.; Schüler, L.M.; Maia, I.B.; Bastos, C.R.V.; Baune, M.-C.; Januschewski, E.; et al. Drying Microalgae Using an Industrial Solar Dryer: A Biomass Quality Assessment. Foods 2022, 11, 1873. [Google Scholar] [CrossRef]
- Van De Walle, S.; Gifuni, I.; Coleman, B.; Baune, M.-C.; Rodrigues, A.; Cardoso, H.; Fanari, F.; Muylaert, K.; Van Royen, G. Innovative vs classical methods for drying heterotrophic Chlorella vulgaris: Impact on protein quality and sensory properties. Food Res. Int. 2024, 182, 114142. [Google Scholar] [CrossRef]
- Graça, C.; Fradinho, P.; Sousa, I.; Raymundo, A. Impact of Chlorella vulgaris on the rheology of wheat flour dough and bread texture. LWT 2018, 89, 466–474. [Google Scholar] [CrossRef]
- Elkot, W.F.; Elmahdy, A.; El-Sawah, T.H.; Alghamdia, O.A.; Alhag, S.K.; Al-Shahari, E.A.; Al-Farga, A.; Ismail, H.A. Development and characterization of a novel flavored functional fermented whey-based sports beverage fortified with Spirulina platensis. Int. J. Biol. Macromol. 2024, 258, 128999. [Google Scholar] [CrossRef]
- Barkallah, M.; Dammak, M.; Louati, I.; Hentati, F.; Hadrich, B.; Mechichi, T.; Ayadi, M.A.; Fendri, I.; Attia, H.; Abdelkafi, S. Effect of Spirulina platensis fortification on physicochemical, textural, antioxidant and sensory properties of yogurt during fermentation and storage. LWT 2017, 84, 323–330. [Google Scholar] [CrossRef]
- Lafarga, T.; Mayre, E.; Echeverria, G.; Viñas, I.; Villaró, S.; Acién-Fernández, F.G.; Castellari, M.; Aguiló-Aguayo, I. Potential of the microalgae Nannochloropsis and Tetraselmis for being used as innovative ingredients in baked goods. LWT 2019, 115, 108439. [Google Scholar] [CrossRef]
- Rodríguez De Marco, E.; Steffolani, M.E.; Martínez, M.; León, A.E. The use of Nannochloropsis sp. as a source of omega-3 fatty acids in dry pasta: Chemical, technological and sensory evaluation. Int. J. Food Sci. Technol. 2018, 53, 499–507. [Google Scholar] [CrossRef]
- Fradique, M.; Batista, A.P.; Nunes, M.C.; Gouveia, L.; Bandarra, N.M.; Raymundo, A. Incorporation of Chlorella vulgaris and Spirulina maxima biomass in pasta products. Part 1: Preparation and evaluation. J. Sci. Food Agric. 2010, 90, 1656–1664. [Google Scholar] [CrossRef]
- Fradique, M.; Batista, A.P.; Nunes, M.C.; Gouveia, L.; Bandarra, N.M.; Raymundo, A. Isochrysis galbana and Diacronema vlkianum biomass incorporation in pasta products as PUFA’s source. LWT-Food Sci. Technol. 2013, 50, 312–319. [Google Scholar] [CrossRef]
- Lafarga, T.; Acién-Fernández, F.G.; Castellari, M.; Villaró, S.; Bobo, G.; Aguiló-Aguayo, I. Effect of microalgae incorporation on the physicochemical, nutritional, and sensorial properties of an innovative broccoli soup. LWT 2019, 111, 167–174. [Google Scholar] [CrossRef]
- Van der Stricht, H.; Hung, Y.; Fischer, A.R.H.; Verbeke, W. Consumer segments less or more willing to adopt foods with microalgae proteins. Food Qual. Prefer. 2024, 113, 105047. [Google Scholar] [CrossRef]
- Hung, Y.; Van der Stricht, H.; Verbeke, W. Consumer Acceptance and Nutritional Expectations of Microalgae Protein Products: Insights from a Cross-European Study. Proceedings 2023, 91, 87. [Google Scholar] [CrossRef]
- Van der Stricht, H.; Profeta, A.; Hung, Y.; Verbeke, W. Consumers’ willingness-to-buy pasta with microalgae proteins—Which label can promote sales? Food Qual. Prefer. 2023, 110, 104948. [Google Scholar] [CrossRef]
- Bazarnova, J.; Nilova, L.; Trukhina, E.; Bernavskaya, M.; Smyatskaya, Y.; Aktar, T. Use of Microalgae Biomass for Fortification of Food Products from Grain. Foods 2021, 10, 3018. [Google Scholar] [CrossRef] [PubMed]
- Nilusha, R.A.T.; Jayasinghe, J.M.J.K.; Perera, O.D.A.N.; Perera, P.I.P. Development of Pasta Products with Nonconventional Ingredients and Their Effect on Selected Quality Characteristics: A Brief Overview. Int. J. Food Sci. 2019, 2019, 750726. [Google Scholar] [CrossRef] [PubMed]
- Laleg, K.; Barron, C.; Santé-Lhoutellier, V.; Walrand, S.; Micard, V. Protein enriched pasta: Structure and digestibility of its protein network. Food Funct. 2016, 7, 1196–1207. [Google Scholar] [CrossRef]
- Yao, M.; Li, M.; Dhital, S.; Tian, Y.; Guo, B. Texture and digestion of noodles with varied gluten contents and cooking time: The view from protein matrix and inner structure. Food Chem. 2020, 315, 126230. [Google Scholar] [CrossRef]
- Bustos, M.C.; Pérez, G.T.; León, A.E. Effect of Four Types of Dietary Fiber on the Technological Quality of Pasta. Food Sci. Technol. Int. 2011, 17, 213–221. [Google Scholar] [CrossRef] [PubMed]
- Fogliano, V.; Vitaglione, P. Functional foods: Planning and development. Mol. Nutr. Food Res. 2005, 49, 256–262. [Google Scholar] [CrossRef]
- Bustos, M.C.; Perez, G.T.; León, A.E. Sensory and nutritional attributes of fibre-enriched pasta. LWT-Food Sci. Technol. 2011, 44, 1429–1434. [Google Scholar] [CrossRef]
- Biernacka, B.; Dziki, D.; Gawlik-Dziki, U.; Różyło, R.; Siastała, M. Physical, sensorial, and antioxidant properties of common wheat pasta enriched with carob fiber. LWT-Food Sci. Technol. 2017, 77, 186–192. [Google Scholar] [CrossRef]
- European Commission. Regulation (EU) 2018/848 of the European Parliament and of the Council of 30 May 2018 on Organic Production and Labelling of Organic Products and Repealing Council Regulation (EC) No 834/2007; European Commission: Brussels, Belgium, 2018. [Google Scholar]
- BMEL. Leitsätze des Deutschen Lebensmittelbuchs für Teigwaren. Available online: https://www.bmel.de/SharedDocs/Downloads/DE/_Ernaehrung/Lebensmittel-Kennzeichnung/LeitsaetzeTeigwaren.pdf?__blob=publicationFile&v=5 (accessed on 6 August 2024).
- European Commission. Regulation (EC) No 1924/2006 of the European Parliament and of the Council of 20 December 2006 on Nutrition and Health Claims Made on Foods; European Commission: Brussels, Belgium, 2006. [Google Scholar]
- ISO 12232:2019; Photography—Digital Still Cameras—Determination of Exposure Index, ISO Speed Ratings, Standard Output Sensitivity, and Recommended Exposure Index. ISO: Geneva, Switzerland, 2019.
- ISO 8589:2007; Sensory Analysis—General Guidance for the Design of Test Rooms. ISO: Geneva, Switzerland, 2007.
- ISO 8586:2012; Sensory Analysis—General Guidelines for the Selection, Training and Monitoring of Selected Assessors and Expert Sensory Assessors. ISO: Geneva, Switzerland, 2012.
- Macfie, H.J.; Bratchell, N.; Greenhoff, K.; Vallis, L.V. Designs to balance the effect of order of presentation and first-order carry-over effects in hall tests. J. Sens. Stud. 1989, 4, 129–148. [Google Scholar] [CrossRef]
- ISO 11132:2021; Sensory Analysis—Methodology—Guidelines for the Measurement of the Performance of a Quantitative Descriptive Sensory Panel. ISO: Geneva, Switzerland, 2021.
- Sissons, M. Role of durum wheat composition on the quality of pasta and bread. Food 2008, 2, 75–90. [Google Scholar]
- Tan, C.; Wei, H.; Zhao, X.; Xu, C.; Peng, J. Effects of dietary fibers with high water-binding capacity and swelling capacity on gastrointestinal functions, food intake and body weight in male rats. Food Nutr. Res. 2017, 61, 1308118. [Google Scholar] [CrossRef] [PubMed]
- Teterycz, D.; Sobota, A.; Zarzycki, P.; Latoch, A. Legume flour as a natural colouring component in pasta production. J. Food Sci. Technol. 2020, 57, 301–309. [Google Scholar] [CrossRef] [PubMed]
- Wang, J.; Brennan, M.A.; Brennan, C.S.; Serventi, L. Effect of Vegetable Juice, Puree, and Pomace on Chemical and Technological Quality of Fresh Pasta. Foods 2021, 10, 1931. [Google Scholar] [CrossRef]
- Cunin, C.; Handschin, S.; Walther, P.; Escher, F. Structural changes of starch during cooking of durum wheat pasta. LWT Food Sci. Technol. 1995, 28, 323–328. [Google Scholar] [CrossRef]
- Foschia, M.; Peressini, D.; Sensidoni, A.; Brennan, M.A.; Brennan, C.S. How combinations of dietary fibres can affect physicochemical characteristics of pasta. LWT-Food Sci. Technol. 2015, 61, 41–46. [Google Scholar] [CrossRef]
- Balasooriya, R.N.; Wickramasinghe, I. Development and Evaluation of Physicochemical Properties of Pulse Added Protein Rich Pasta. Eur. J. Eng. Technol. Res. 2018, 3, 56–59. [Google Scholar] [CrossRef]
- Jayasena, V.; Nasar-Abbas, S.M. Development and quality evaluation of high-protein and high-dietary-fiber pasta using lupin flour. J. Texture Stud. 2012, 43, 153–163. [Google Scholar] [CrossRef]
- Panahi, Y.; Pishgoo, B.; Jalalian, H.R.; Mohammadi, E.; Taghipour, H.R.; Sahebkar, A.; Abolhasani, E. Investigation of the effects of Chlorella vulgaris as an adjunctive therapy for dyslipidemia: Results of a randomised open-label clinical trial. Nutr. Diet. 2012, 69, 13–19. [Google Scholar] [CrossRef]
- Baune, M.-C.; Januschewski, E.; Bussa, M.; Van De Walle, S.; Gifuni, I.; Rodrigues, A.M.C.; Cardoso, M.H.; Van Royen, G.; Juadjur, A.; Jungbluth, N.; et al. Innovative vs. classical methods for drying heterotrophic Chlorella vulgaris: Impact on the nutritional properties, safety, sustainability and costs. Algal Res. 2025, 86, 103913. [Google Scholar] [CrossRef]
- EFSA Panel on Dietetic Products, Nutrition, and Allergies. Scientific Opinion on Dietary Reference Values for cobalamin (vitamin B12). EFSA J. 2015, 13, 4150. [Google Scholar] [CrossRef]
- Chacón-Lee, T.L.; González-Mariño, G.E. Microalgae for “Healthy” Foods—Possibilities and Challenges. Compr. Rev. Food Sci. Food Saf. 2010, 9, 655–675. [Google Scholar] [CrossRef]
Disclaimer/Publisher’s Note: The statements, opinions and data contained in all publications are solely those of the individual author(s) and contributor(s) and not of MDPI and/or the editor(s). MDPI and/or the editor(s) disclaim responsibility for any injury to people or property resulting from any ideas, methods, instructions or products referred to in the content. |
© 2025 by the authors. Licensee MDPI, Basel, Switzerland. This article is an open access article distributed under the terms and conditions of the Creative Commons Attribution (CC BY) license (https://creativecommons.org/licenses/by/4.0/).