Article

Numerical Evaluation of Ultrasonic Detection of Solid Occlusions in CSP Molten Salt Piping

by
Raffaele Dragonetti
,
Rosario Aniello Romano
and
Elio Di Giulio
*,†
Department of Industrial Engineering, University of Naples “Federico II”, 80125 Naples, Italy
*
Author to whom correspondence should be addressed.
These authors contributed equally to this work.
Appl. Sci. 2025, 15(3), 1373; https://doi.org/10.3390/app15031373
Submission received: 30 December 2024 / Revised: 21 January 2025 / Accepted: 27 January 2025 / Published: 29 January 2025
(This article belongs to the Special Issue Application of Ultrasonic Non-destructive Testing)

Abstract

:
This work presents a numerical evaluation of the applicability of non-invasive ultrasonic techniques for detecting solid inclusions in concentrated solar power (CSP) systems using molten salts. Under stagnant conditions, molten salts, such as the NaNO3–KNO3 mixture, solidify when the temperature drops below approximately 240 °C at ambient pressure. The study was conducted using finite element method (FEM) simulations in the time domain to model ultrasonic wave propagation and interaction with the solidified inclusions. Numerical analyses revealed that the energy of ultrasonic signals transmitted from the source and captured by the receiver can be used to quantify the energy reflected and scattered by solid inclusions and to statistically determine their spatial distribution within the piping. The study highlights the potential of detecting solid occlusions through statistical analysis of ultrasonic signals. Such an approach would enable decision making for trigger heating strategies to re-melt the solidified inclusions by raising the system’s temperature. This approach contrasts with traditional temperature-based control, which fails to quantify the degree of solidification and may result in frequent, energy-intensive heating whenever the temperature drops below the threshold. The proposed ultrasonic-based detection method thus offers a more energy-efficient and precise solution for managing solidification in CSP molten salt piping.

1. Introduction

In recent decades, ultrasonic technology has emerged as a cornerstone in various fields, ranging from medical diagnostics [1,2] to materials science and industrial process monitoring [3,4]. This is primarily due to its unique ability to probe materials and solutions non-invasively, providing precise detection of inclusions, defects, and phase changes. By leveraging the propagation of high-frequency acoustic waves, ultrasound enables detailed characterization of a medium’s internal properties, making it a versatile and effective tool across diverse applications. In medicine, for instance, ultrasound has revolutionized diagnostics and monitoring by allowing the identification of tissue anomalies, such as calcification, cysts, or tumors, with remarkable precision [5]. The technique is non-invasive and safe, relying on the differential reflection of sound waves by structures of varying densities and compositions to create high-resolution images. This capability has made ultrasound an indispensable tool in sensitive clinical scenarios. Similarly, in materials science and industrial applications, ultrasound plays a critical role in ensuring the integrity and reliability of components. Ultrasonic inspection is widely used to detect internal defects like cracks, voids, or impurities in metals, composites, and ceramics [6,7]. These applications are particularly important in industries such as aerospace, nuclear energy, and heavy manufacturing, where the structural integrity of materials is paramount. Ultrasonic waves interact with inhomogeneities within these materials, producing echoes and refraction that can be analyzed to accurately map internal anomalies [8].
Recently, the application of ultrasonic technology to fluid systems has garnered increasing attention, especially in challenging scenarios like the use of molten salts in concentrated solar power (CSP) plants [9,10,11,12]. Molten salts, such as the widely used NaNO3–KNO3 mixture, play a critical role as heat storage and transfer media in these systems [13]. However, under stagnant conditions, the salts are prone to solidification when temperatures drop below approximately 240 °C at ambient pressure. This solidification can result in the formation of inclusions within piping and storage sections, posing operational risks and potentially compromising efficiency [14,15,16].
For instance, a study by Mazue et al. [17] utilized a 20 kHz ultrasonic system to clean contaminants from the bottoms of ships. The research characterized the cleaning process and optimized parameters such as distance, amplitude, and duration to determine the most effective cleaning efficiency. This approach highlighted the potential of ultrasonic technology in industrial cleaning applications, which could be adapted for monitoring and detecting inclusions in molten salts [18]. Another relevant study discussed the development of an apparatus and method for ultrasonically detecting inclusions in molten bodies, including metals and glasses. The apparatus features a probe comprising an inert refractory shell, a window for carrying ultrasonic waves, and a coupling medium for transmitting ultrasonic waves between a transducer and the window. This design is suitable for detecting particulate inclusions in molten aluminum and aluminum alloys, demonstrating the versatility of ultrasonic methods in various molten materials [19]. Additionally, research on in situ sensors for liquid metal quality has led to the development of ultrasonic online systems capable of registering larger inclusion clusters in rolled steel sheets during production. These systems facilitate real-time monitoring, which is crucial for maintaining the quality of materials in industrial processes [20]. Furthermore, a study on non-invasive, in situ acoustic diagnosis and monitoring of corrosion in a model molten-salt vessel operating at 550 °C demonstrated the effectiveness of ultrasonic techniques in assessing the integrity of materials exposed to harsh conditions. This research underscores the potential of ultrasonic methods in monitoring the health of materials in CSP systems [21].
Detecting and managing solid inclusions in real time within CSP systems presents a significant challenge. Traditional temperature-based control mechanisms, while effective in monitoring bulk thermal conditions, cannot provide precise information on the extent or location of solidification [16]. This limitation often leads to excessive and energy-intensive activation of heating systems, which reduces overall efficiency. Ultrasound offers a promising alternative, due to its ability to detect phase changes, density shifts, and variations in viscosity within fluid mixtures [22]. By analyzing the interaction between ultrasonic waves and solid inclusions, it is possible to gather detailed information about the inclusions’ spatial distribution and their impact on the system.
This work focused on the numerical evaluation of ultrasonic techniques for detecting solid inclusions in CSP molten salt systems, a critical challenge for maintaining optimal operation in concentrated solar power (CSP) plants. This study employed finite element method (FEM) simulations in the time domain, to investigate the interaction of ultrasonic signals with solidified inclusions, enabling a detailed understanding of wave propagation and attenuation in the presence of these inclusions. Unlike previous studies, which primarily focused on basic detection techniques or limited material systems, this work integrated a more advanced approach by incorporating statistical analysis to interpret the ultrasonic signals. This allows for real-time detection and assessment of the internal state of the molten salt, offering significant advantages, in terms of operational monitoring and efficiency. The key innovation of this study lies in its ability to combine numerical simulations with probabilistic modeling, providing a more accurate and reliable framework for assessing the degree of solidification and the spatial distribution of inclusions. In contrast to traditional methods, which are often limited to temperature-based controls or qualitative visual inspections, the proposed ultrasonic-based monitoring approach offers a non-invasive, continuous, and high-resolution alternative for detecting and characterizing solid inclusions. The implications of this research extend beyond CSP plants, showcasing the versatility and transformative potential of ultrasonic technology in industrial fluids management [10,23].

2. Theoretical Background

Ultrasound refers to sound waves with frequencies higher than the upper audible limit of human hearing, typically above 20 kHz. These high-frequency waves propagate through a medium via mechanical vibrations of particles, transferring energy without net transport of the medium itself [24]. Ultrasound is extensively used for non-destructive testing (NDT) and imaging because of its ability to penetrate materials and reflect from interfaces where properties such as density or acoustic impedance change [8]. The fundamental parameters influencing ultrasound behavior include the following:
  • Frequency f and Wavelength λ : Higher frequencies provide better resolution but suffer from greater attenuation. These quantities are linked by the relation
    λ = c f ,
    where c is the sound speed in the considered medium.
  • Acoustic Impedance (Z): Defined as Z = ρ c , where ρ is the medium density. It determines the reflection and transmission of ultrasound at material boundaries.
  • Attenuation: Loss of wave energy due to absorption, scattering, and other mechanisms.

2.1. Propagation of Ultrasound in Materials

When ultrasound propagates through a medium, its behavior is governed by the following acoustic wave equation:
1 c 2 2 p t 2 2 p = S ,
where p is the acoustic pressure, c is the speed of sound, and S represents a source term. Reflection, refraction, and diffraction occur when ultrasound encounters material interfaces or inhomogeneities [25]. In solid materials, two primary types of waves propagate:
  • Longitudinal Waves: Particle motion is parallel to the wave direction.
  • Shear Waves: Particle motion is perpendicular to the wave direction, typically slower than longitudinal waves.
The behavior of ultrasound depends on the angle of incidence relative to the material’s surface, which determines whether the wave is reflected, transmitted, refracted, or converted into other wave types. These interactions are governed by the acoustic properties of the materials involved and the geometry of the interaction. At normal (zero-degree) incidence, the reflection coefficient (r) and transmission coefficient ( τ ) for an interface between two materials can be expressed as
r = Z 2 Z 1 Z 2 + Z 1 , τ = 1 r ,
where Z 1 and Z 2 are the acoustic impedances of the first and second medium, respectively [24]. This interaction allows for the detection of inclusions or voids, which create distinct acoustic impedance contrasts. For oblique incidence, Snell’s law governs the relationship between the angles of incidence ( θ i ), reflection ( θ r ), and refraction ( θ t ):
sin θ i c 1 = sin θ t c 2
where c 1 and c 2 are the sound velocities in the two materials. Mode conversion may occur at the interface, leading to the generation of shear waves in addition to reflected and refracted longitudinal waves.

2.2. Ultrasonic Attenuation and Absorption

When ultrasonic waves propagate through a material, their intensity decreases due to attenuation and absorption. This energy reduction is expressed mathematically as [8]
E x = E 0 e α x
where E x is the energy of the wave after traversing a material of thickness x, E 0 is the energy of the incident wave, and α is the linear absorption coefficient, commonly referred to as the attenuation coefficient expressed in dB/m. Attenuation refers to the reduction in wave intensity as ultrasound propagates through a medium. This phenomenon is due to the conversion of acoustic energy into heat through viscous and relaxation processes, known as absorption, and the deflection of waves by inhomogeneities such as grain boundaries, porosity, and material heterogeneities, referred to as scattering. The total attenuation coefficient α combines contributions from absorption ( α a ) and scattering ( α s ):
α = α a + α s
In homogeneous materials, absorption dominates, due to viscoelastic damping. In heterogeneous materials, scattering contributes significantly. Frequency-dependent attenuation, typically proportional to f n (where n ranges from 1 to 2), is a critical parameter in material characterization [7,8]. From Equation (5), the attenuation coefficient can be explicitly expressed, leading to an operational formula for determining it experimentally (or with the aid of numerical simulations). In particular, for a global assessment, the energies of the signals emitted, E 1 , and received, E 2 , by the two transducers are considered. The attenuation coefficient can be calculated as [8]
α = 10 d log 10 E 1 E 2 ,
where d is the distance between the transducers. The energy of a signal is evaluated from the waveform of the detected acoustic pressure:
E = Δ T | p | 2 d t .
In this expression, p represents the acoustic pressure, and the integral is taken over the time interval Δ T , corresponding to the duration during which the signal is detected. This method allows for the calculation of energy lost due to attenuation as the ultrasonic wave propagates through the medium. The formula can be applied to both experimental measurements and numerical simulations to evaluate the attenuation properties of the medium. The concept of signal energy and attenuation played a crucial role in this analysis, as the study focused on the energy characteristics of the ultrasonic signals generated and received by the emitter and receiver, respectively. By evaluating the energy loss due to attenuation, it was possible to assess how the presence of solid inclusions influenced the propagation of the ultrasonic wave through the medium. As will be demonstrated in the subsequent sections, this energy-based approach allowed for the identification of solid inclusions within the molten salt by comparing the attenuation patterns of waves traveling through a homogeneous medium versus those interacting with heterogeneous regions. This distinction in signal attenuation served as a key indicator of the presence, location, and characteristics of solid occlusions, providing valuable insights into the internal structure of the molten salt system.

3. Materials and Methods

The methodologies employed in this study combined the characterization of solar salt properties with advanced numerical simulations, to evaluate ultrasonic wave propagation and its interaction with solid inclusions. The study specifically addressed the dual-phase nature of solar salt—liquid and solid—due to its critical role in thermal energy storage and transfer within concentrating solar power (CSP) systems. By leveraging numerical techniques, the investigation provided insights into the behavior of ultrasonic signals under different thermal conditions, enabling the assessment of solidification processes and the potential for non-invasive detection of solid inclusions. The following sections detail the material properties and the numerical framework adopted for this analysis.

3.1. Solar Salt

In this analysis, the working fluid was fixed to the solar salt, made by a binary eutectic mixture composed of 60% sodium nitrate (NaNO3) and 40% potassium nitrate (KNO3). It is extensively used in concentrating solar power (CSP) plants, due to its characteristic thermal and chemical properties [26,27]. It serves as both a heat transfer fluid (HTF) and a thermal energy storage (TES) medium, playing a critical role in enabling efficient and sustainable power generation. Solar salt circulates within CSP systems, to transfer heat from solar receivers to steam turbines, facilitating electricity generation, and it is also stored in molten salt tanks to retain excess thermal energy, allowing continuous power production during low solar radiation periods [9,14]. This material is particularly valued for its thermal stability and operational flexibility. It remains stable across a broad temperature range of 290 °C to 565 °C, with a melting point of approximately 240 °C, which ensures it remains in the liquid phase under typical CSP conditions. The specific heat capacity of solar salt in the liquid phase is approximately 1.5 J/(g·K), enabling efficient thermal energy storage. Its thermal conductivity, ranging from 0.5 to 0.6 W/(m·K), supports heat transfer when paired with optimized system design. Additionally, the density of solar salt decreases linearly with temperature, from about 1900 kg/m3 at 300 °C to 1700 kg/m3 at 565 °C. Its low corrosivity towards common construction materials, such as stainless steel and nickel-based alloys, further enhances its suitability for CSP applications. For the numerical simulations conducted in this study, two critical properties were required: the density and the speed of sound. It is essential to distinguish these properties between the liquid and solid phases of solar salt, as they significantly influence the propagation of ultrasonic waves. The following relationships were used to represent these properties [26,27,28]:
  • Liquid phase:
    ρ = 2090 0.636 T ,
    c = 2478 1.150 T ,
    where T is the temperature expressed in K.
  • Solid phase:
          ρ = 2100 kg / m 3 ,
    c = 3000 m / s .
This distinction allowed the simulations to accurately capture the acoustic behavior of solar salt under different thermal and phase conditions, enabling the assessment of ultrasonic detection methods for identifying solid inclusions.

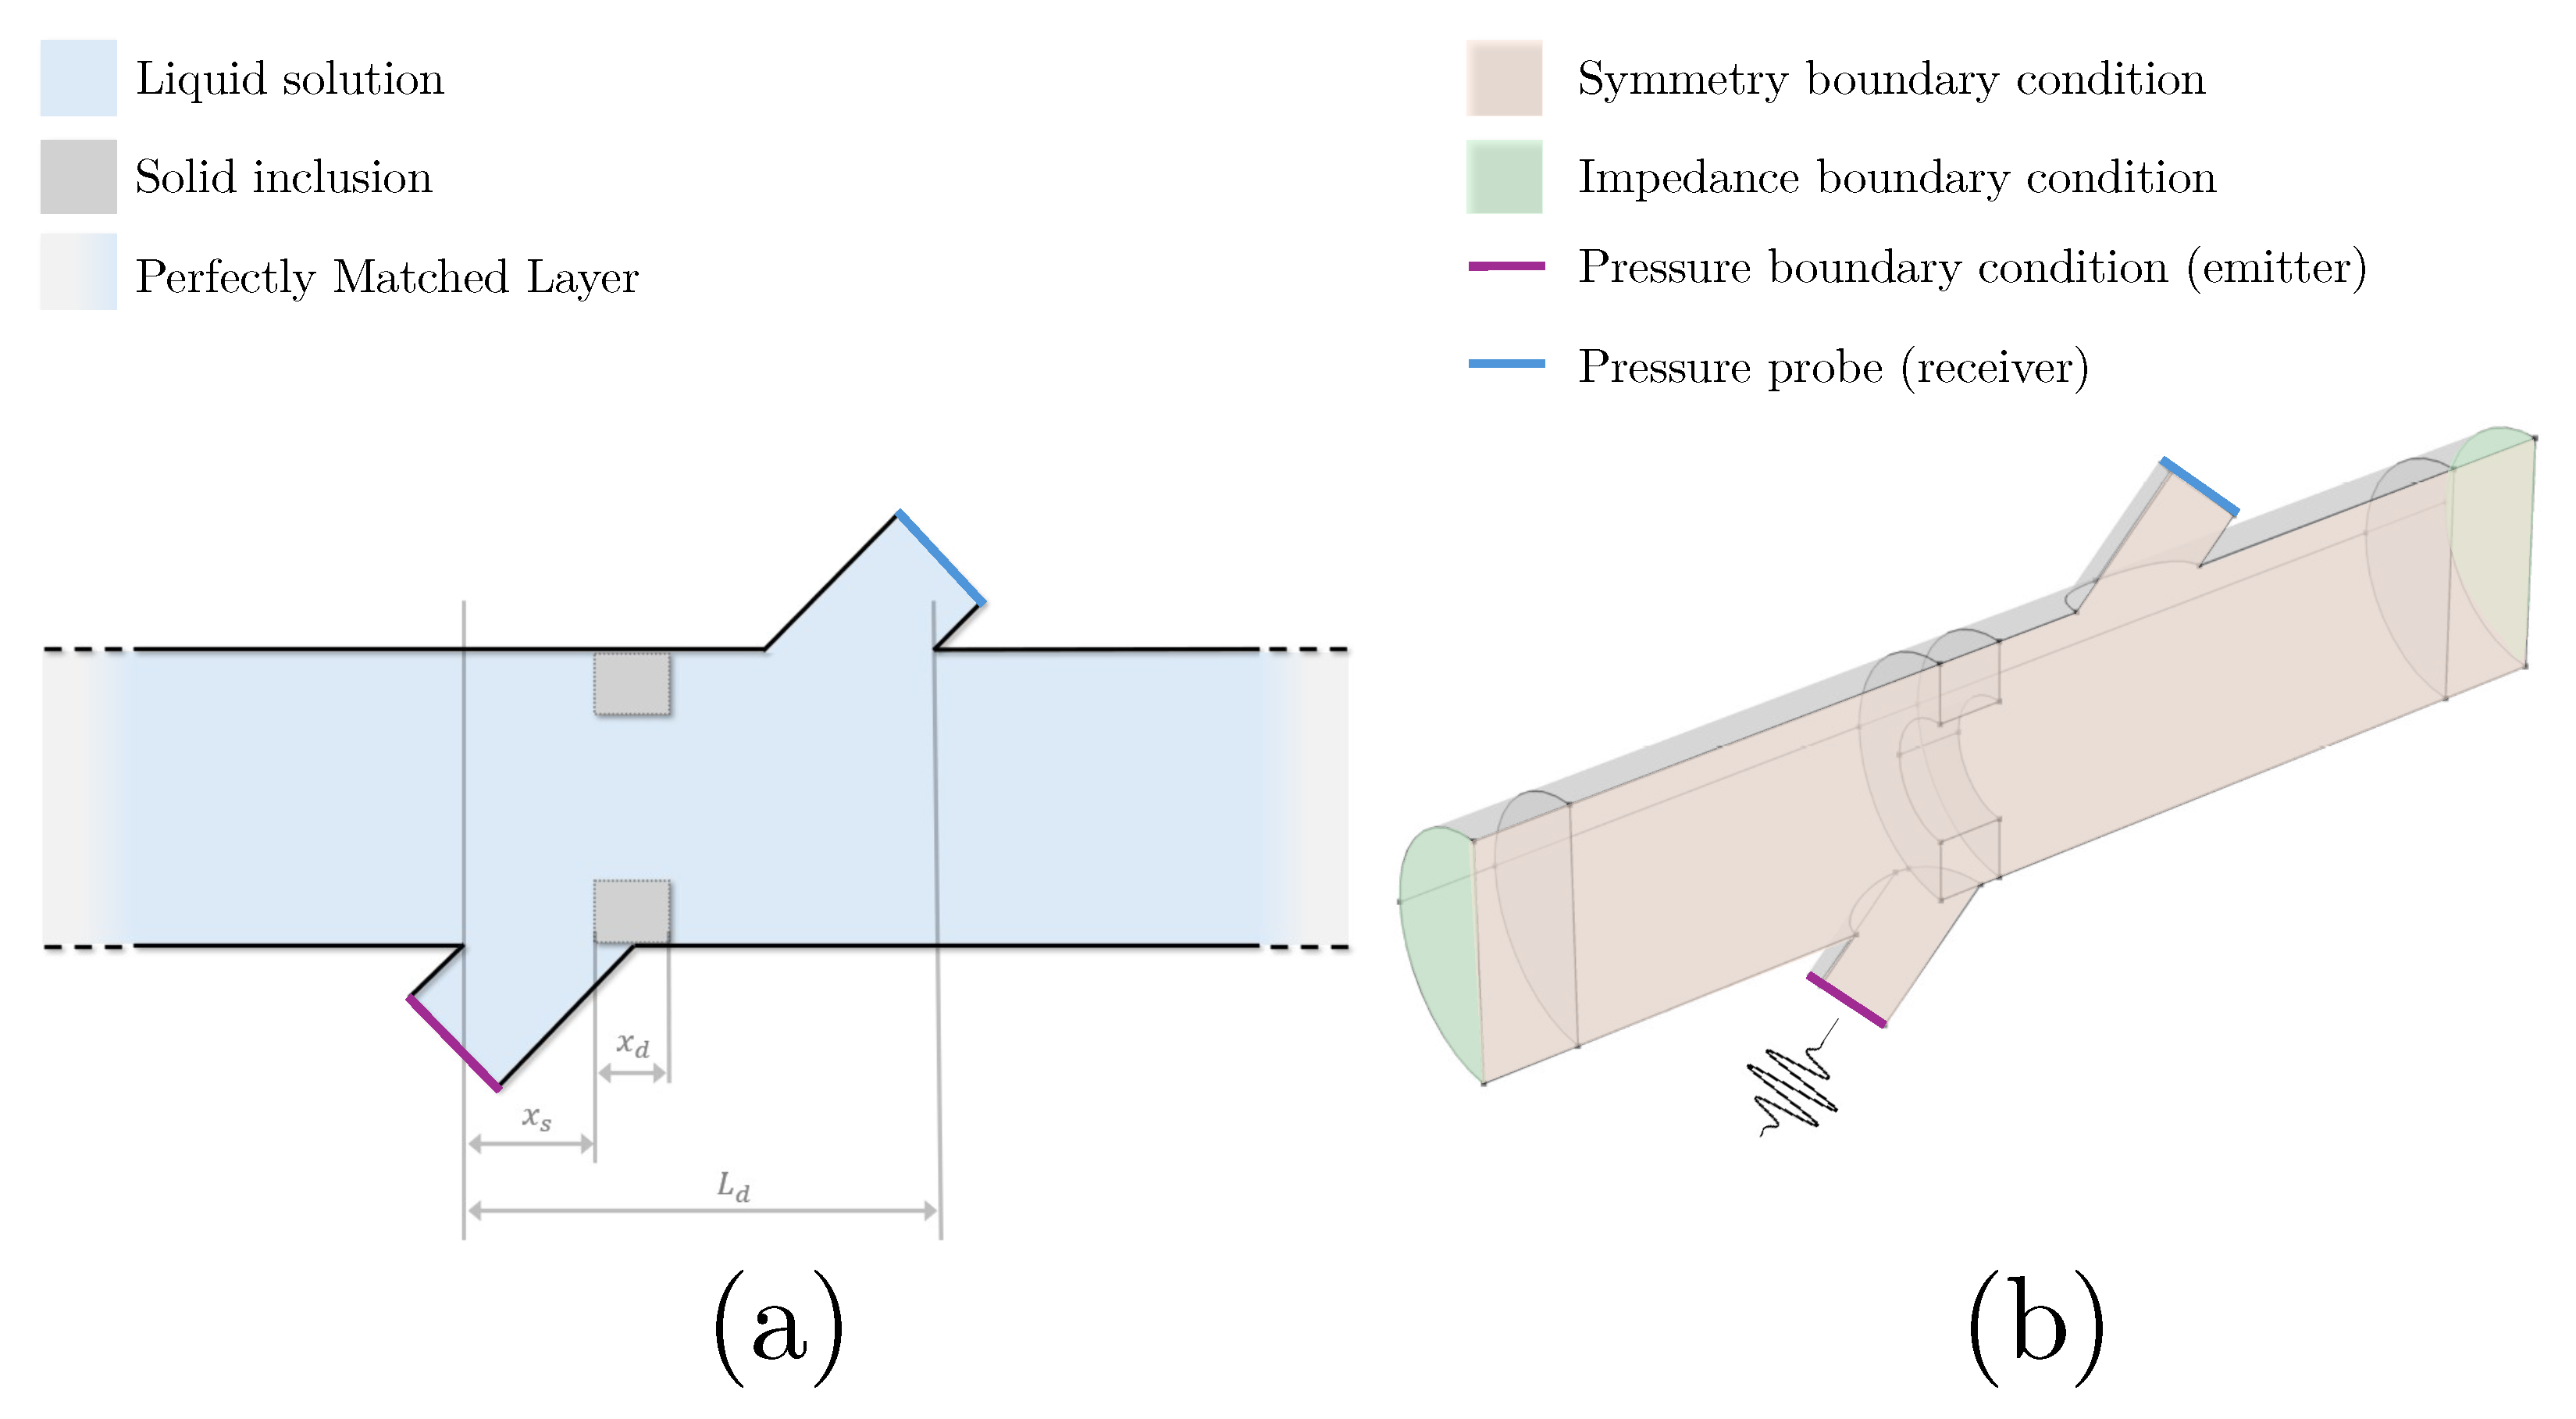
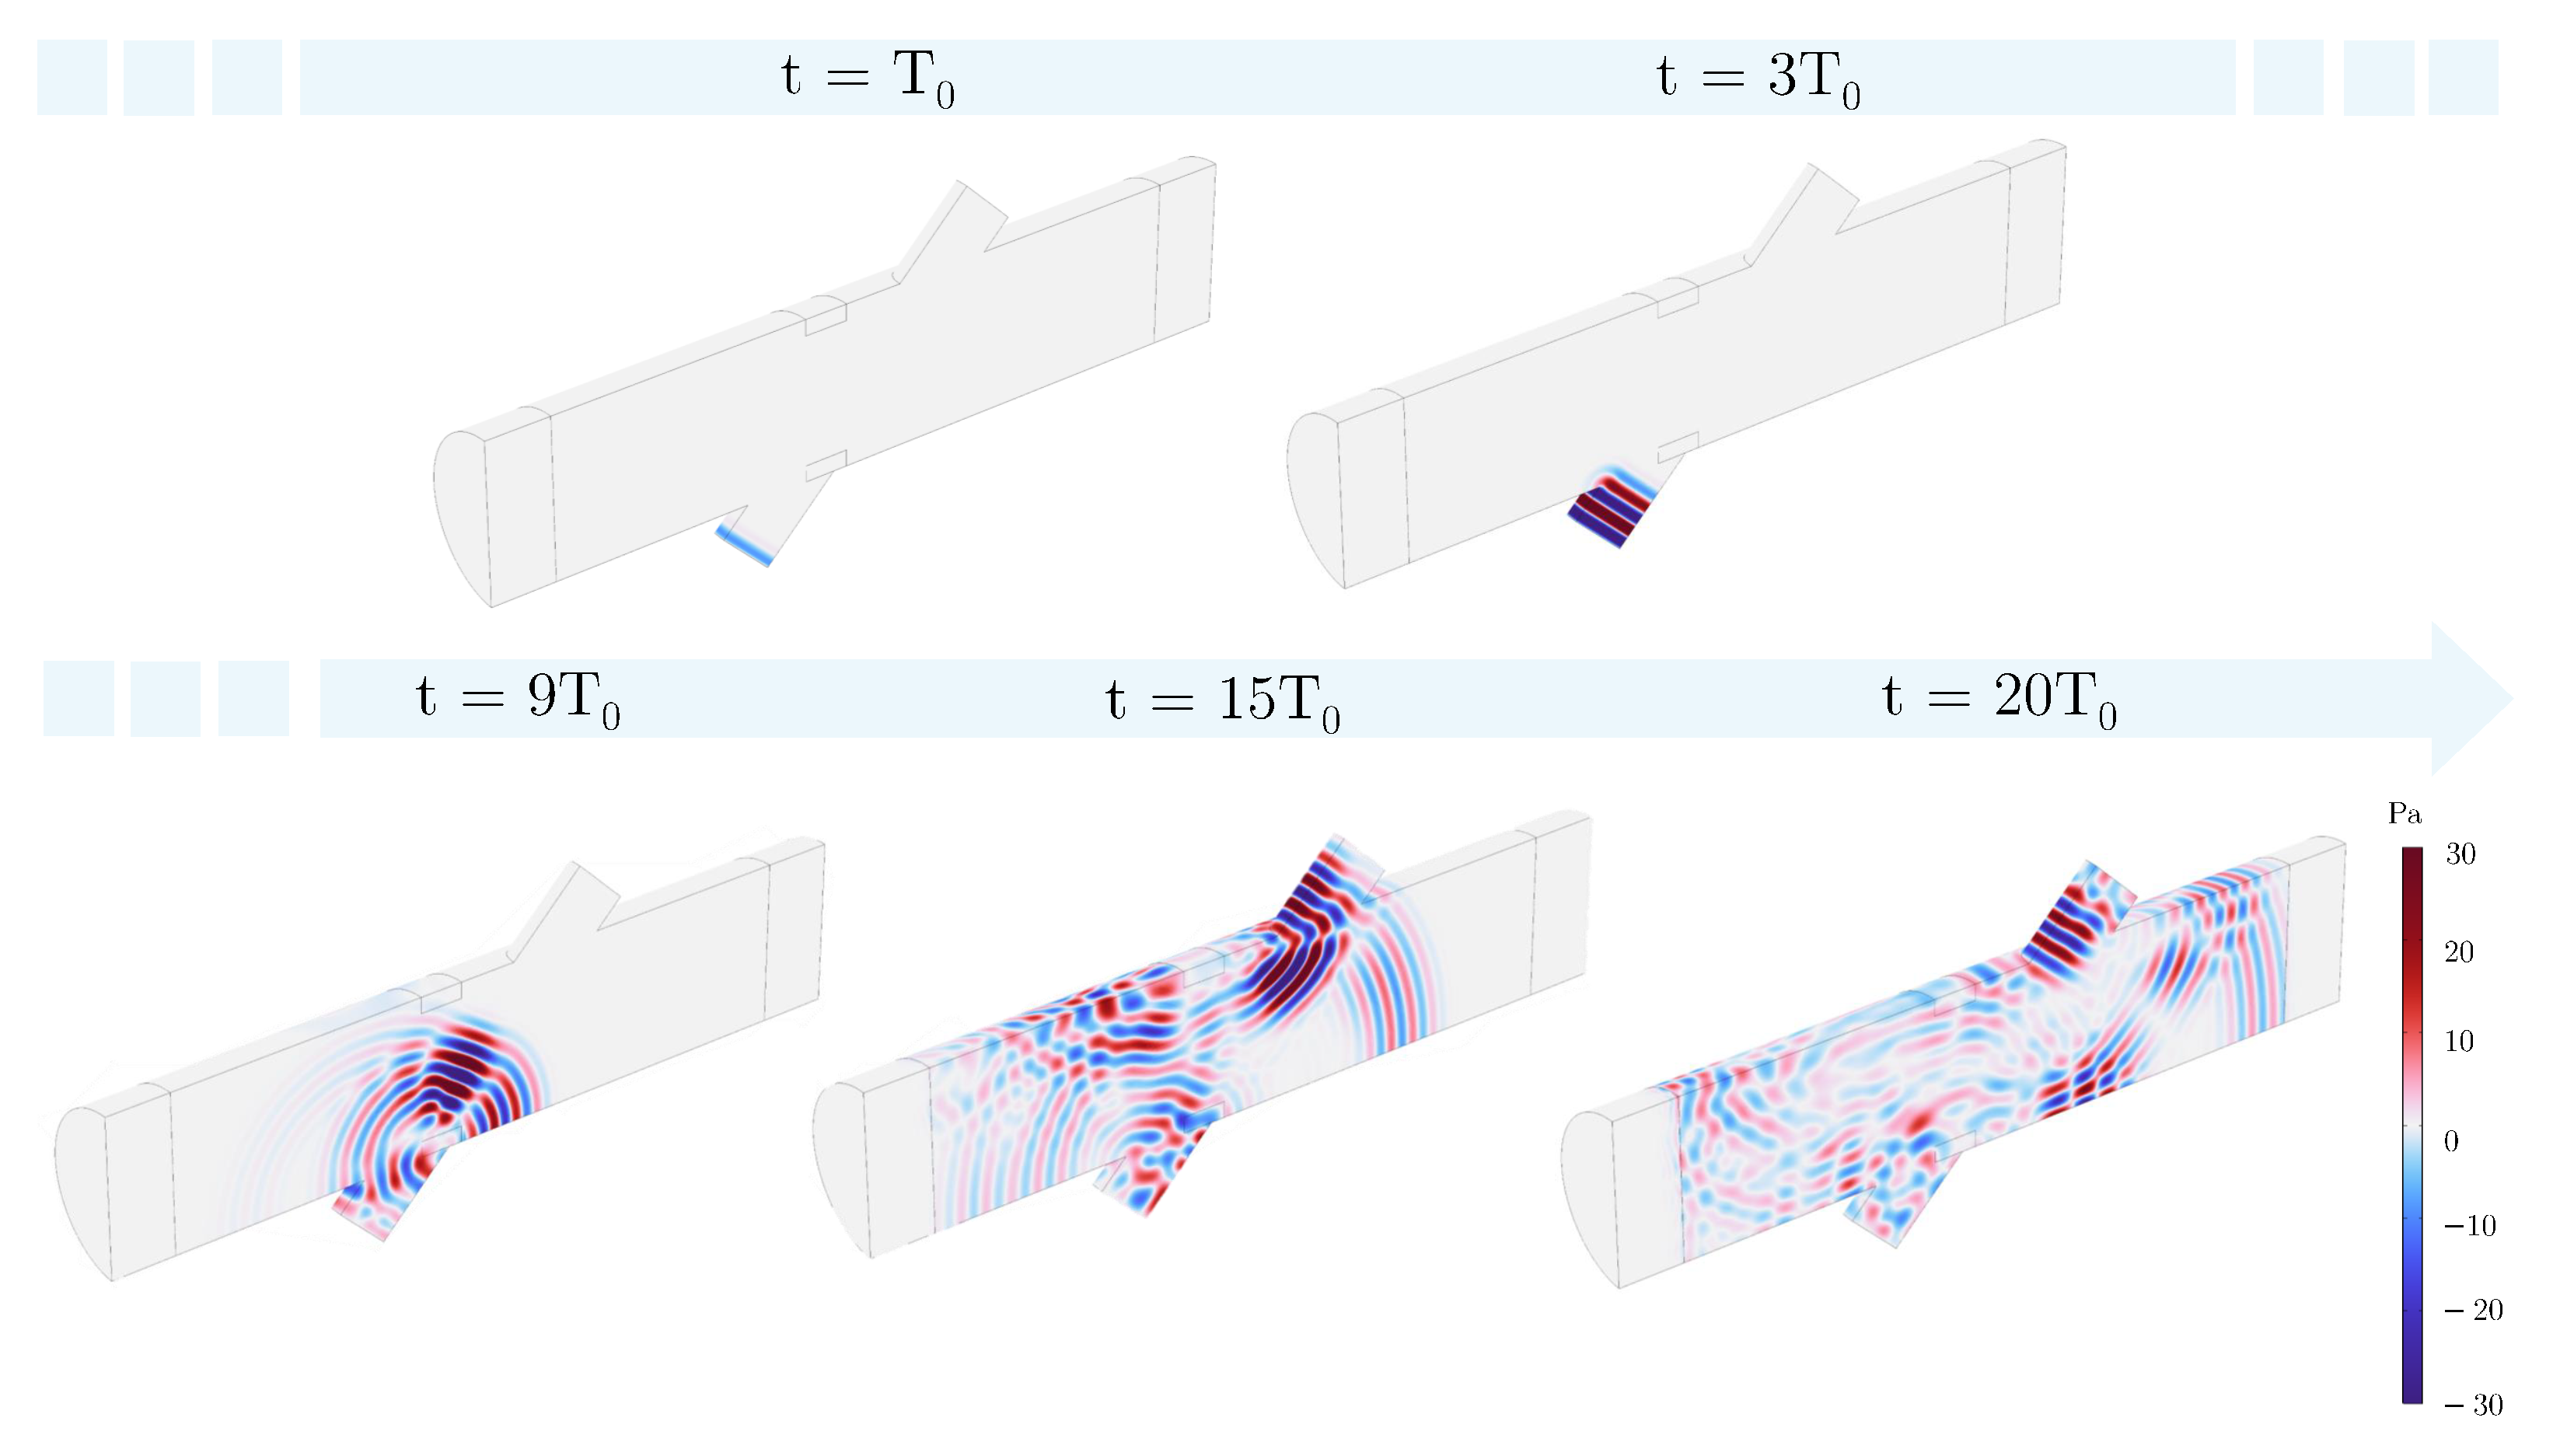
3.2. Numerical Simulations

The numerical study aimed to evaluate the degree of solidification of the molten salts within the storage sections of the CSP system, where the fluid remains stagnant. When the temperature drops below the liquefaction point (approximately 240 °C at ambient pressure), solidification begins in the NaNO3–KNO3 mixture, leading to the formation of solid inclusions within the piping sections. The pipes are typically insulated with either rock wool or Pyrogel, to slow the thermal transient. However, the inner surfaces of the pipes are the first to reach temperatures near the solidification point of the salts, initiating the formation of solid inclusions along the walls. The numerical setup consisted of a segment of pipe equipped with a through-transmission ultrasonic device (emitter–receiver); see Figure 1a. At the ends of the fluid domain, two perfectly matched layer (PML) domains were placed, to simulate free-field propagation within the pipe, preventing reflections at the numerical domain boundaries. The spatial and temporal distribution of the acoustic field generated by the ultrasonic emitter was obtained by solving the wave equation in the time domain:
1 ρ c 2 p t + · u = Q m ,
ρ u t + · ( p I ) = q d ,
where p is the acoustic pressure, u is the acoustic velocity vector, and ρ and c are the fluid density and the speed of sound, respectively. Q m and q d are the monopole domain source and the dipole domain source terms, respectively. An impulse boundary condition was applied at the interface between the pulse emitter and the fluid domain (the purple surface in Figure 1b) and is mathematically expressed as
p ( t ) = sin ( 2 π f 0 t ) rect ( t ) .
To reduce the computational domain size and the system’s degrees of freedom, only half of the domain was considered, by applying a symmetry condition on the light orange surface in Figure 1b. Furthermore, to facilitate the convergence of the free-field condition at the extreme boundaries of the PML domain, an impedance condition equal to the fluid medium impedance ( Z = ρ c ) was imposed. It is worth noting that without the use of PML, the signal would be reflected by the rigid walls of the numerical domain, distorting the received signal. These unwanted reflections would scatter the signal, leading to inaccurate attenuation results that do not correspond to the physical scenario being studied. The PML boundary condition effectively absorbed the outgoing waves, preventing reflections and ensuring that the simulation results reflected a realistic physical system. The interface relied on the discontinuous Galerkin method (dG-FEM) with a fourth-order Runge–Kutta explicit time solver. Fourth-order elements were employed for discretizing both the acoustic pressure and velocity fields. Two sensitivity analyses were performed, to ensure the numerical results’ convergence: a spatial resolution analysis (mesh refinement) and a temporal resolution analysis (time-step adjustment).

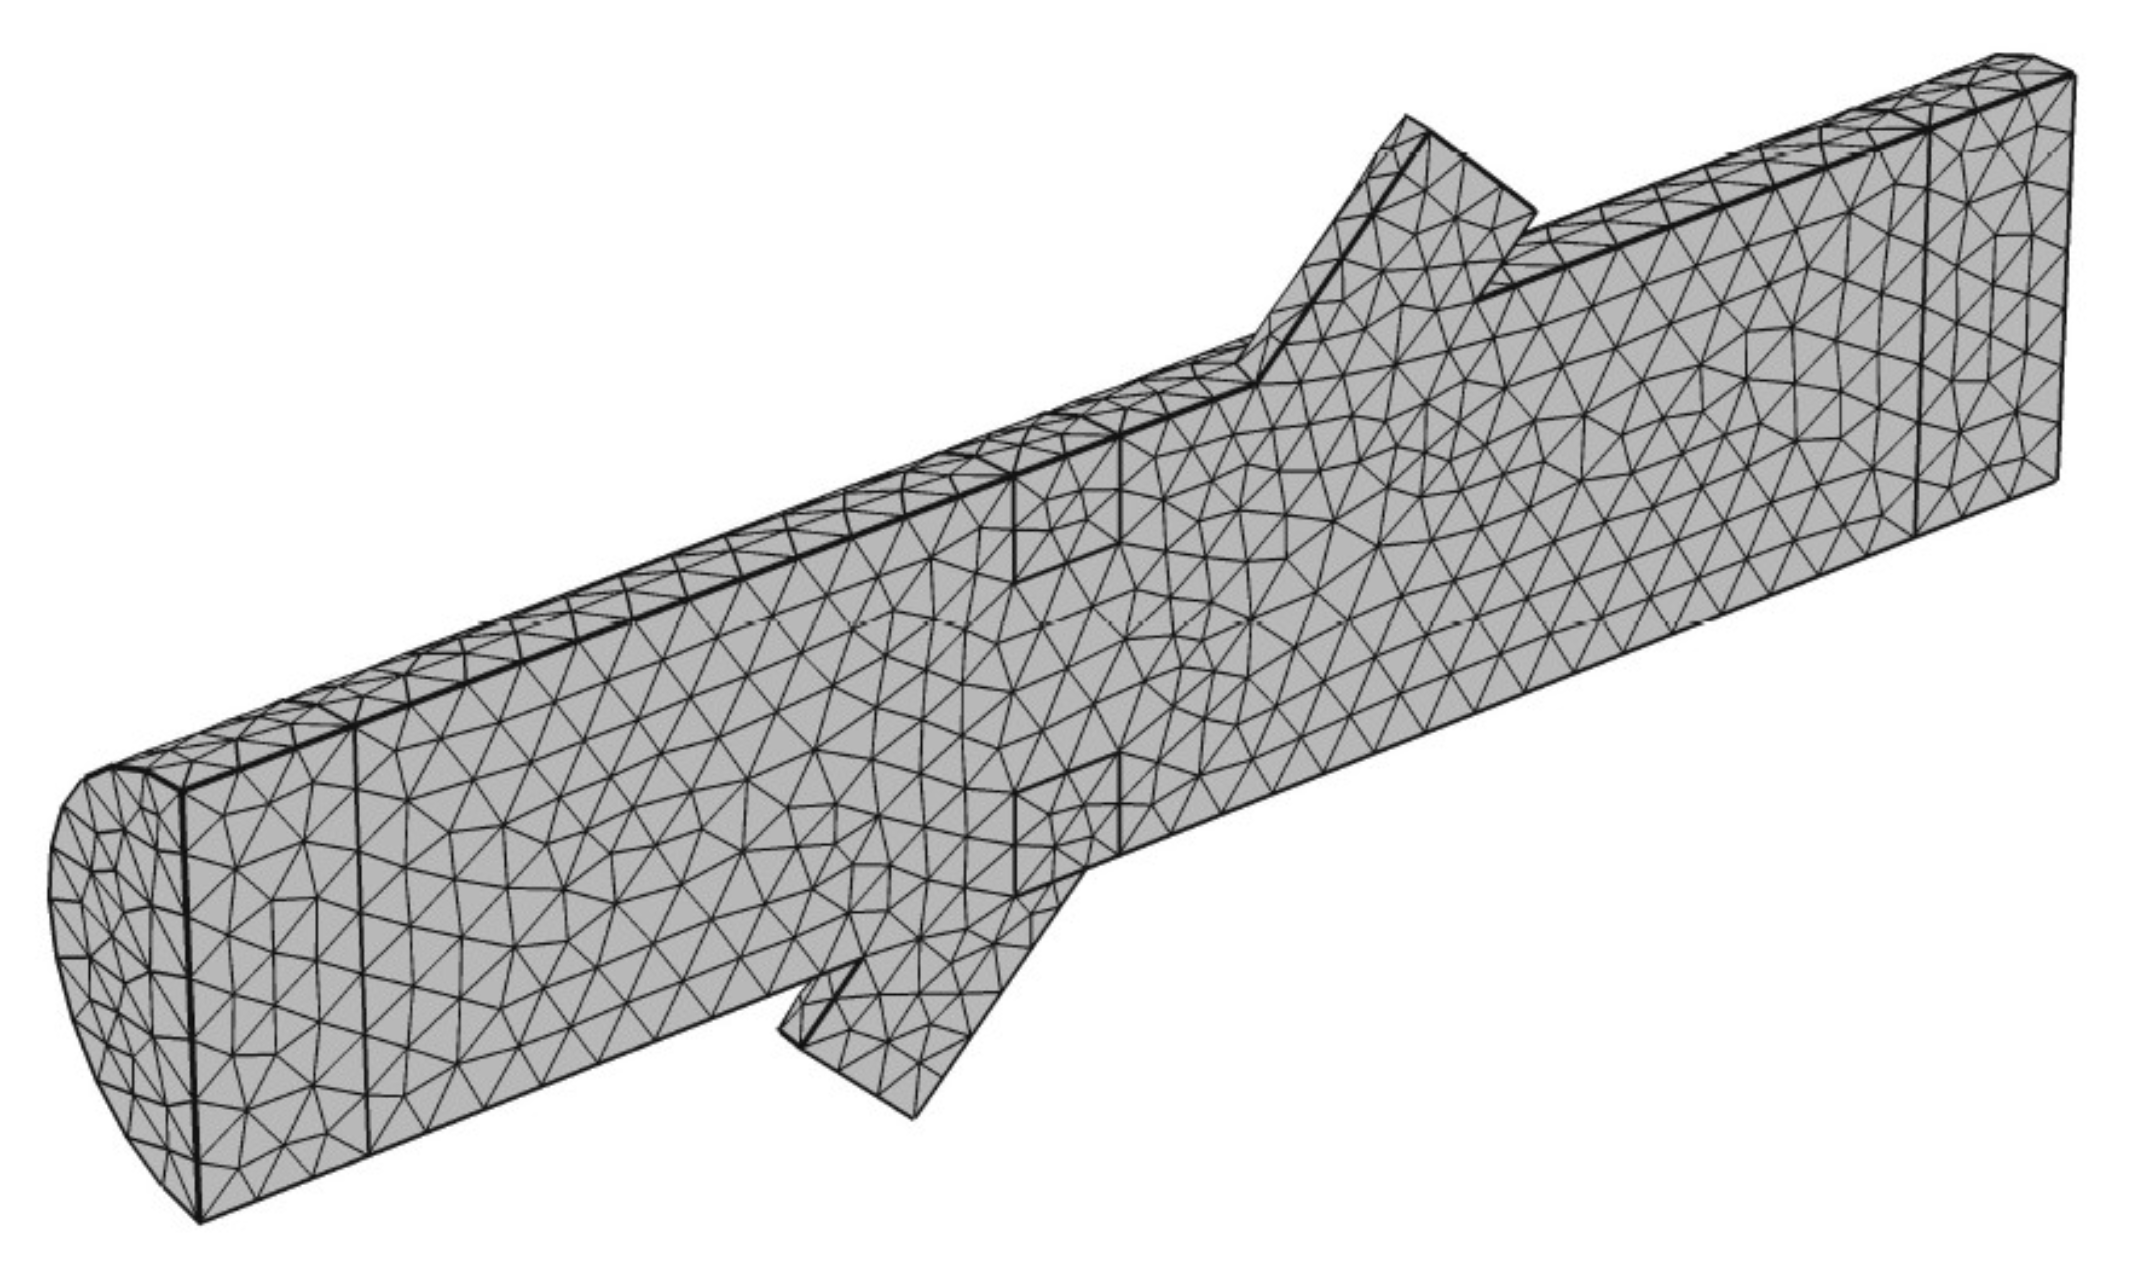
3.3. Mesh Refinement

The computational grid employed for solving the numerical scheme within the fluid domain is shown in Figure 2. It consisted of tetrahedral elements, which, as previously mentioned, utilized fourth-order shape functions for the resolution of acoustic pressure and velocity fields. The mesh was predominantly structured in a uniform manner throughout the domain. The element size was chosen based on the wavelength associated with the liquid domain. A sensitivity analysis of the computational grid was conducted, to optimize the element size by considering the dimensionless attenuation,
α ¯ = α d = 10 log 10 E 1 E 2 ,
which reflected the attenuation of the signal through the emitter–receiver path. Here, E 1 and E 2 represent the energy of the signal detected at the surface corresponding to the emitter (where the boundary condition for the pulse was applied: purple in Figure 1b) and the receiver (light blue in Figure 1b), respectively. Surface pressure probes recorded the temporal evolution of acoustic pressure, and the energy was computed using Equation (8). In the mesh sensitivity analysis, the parameter Δ α ¯ was considered to assess the convergence of the numerical scheme and was calculated as
Δ α ¯ = 1 α ¯ fine α ¯ coarse × 100 ,
where α fine refers to the attenuation value for a finer mesh and α coarse is the attenuation value for a coarser mesh. In Figure 3, the trends of the degrees of freedom (DOFs) and the parameter Δ α ¯ , which accounted for the percentage variation of attenuation with respect to mesh element size, are shown on a dual y-axis plot. It is evident that the variation of Δ α ¯ remained below 5% up to an element size equal to λ . This value was ultimately selected as the reference size for subsequent analyses, as it minimized the number of DOFs from 2,078,160 for a λ / 2 size to 111,580 for λ , thereby significantly reducing the computational cost of the entire simulation.

3.4. Time Step Analysis

This analysis enabled the selection of the optimal time step to ensure the numerical scheme’s stability. The results are presented in terms of the percentage variation of the attenuation parameter. The reference time step chosen was based on the oscillating period T 0 = 1 / f 0 . The time step at which the percentage variation in attenuation Δ α ¯ remained below the acceptable threshold of 5% was T 0 / 5 . Consequently, this time step was adopted for the analysis, as it minimized the number of intervals required for the simulation while maintaining accuracy.

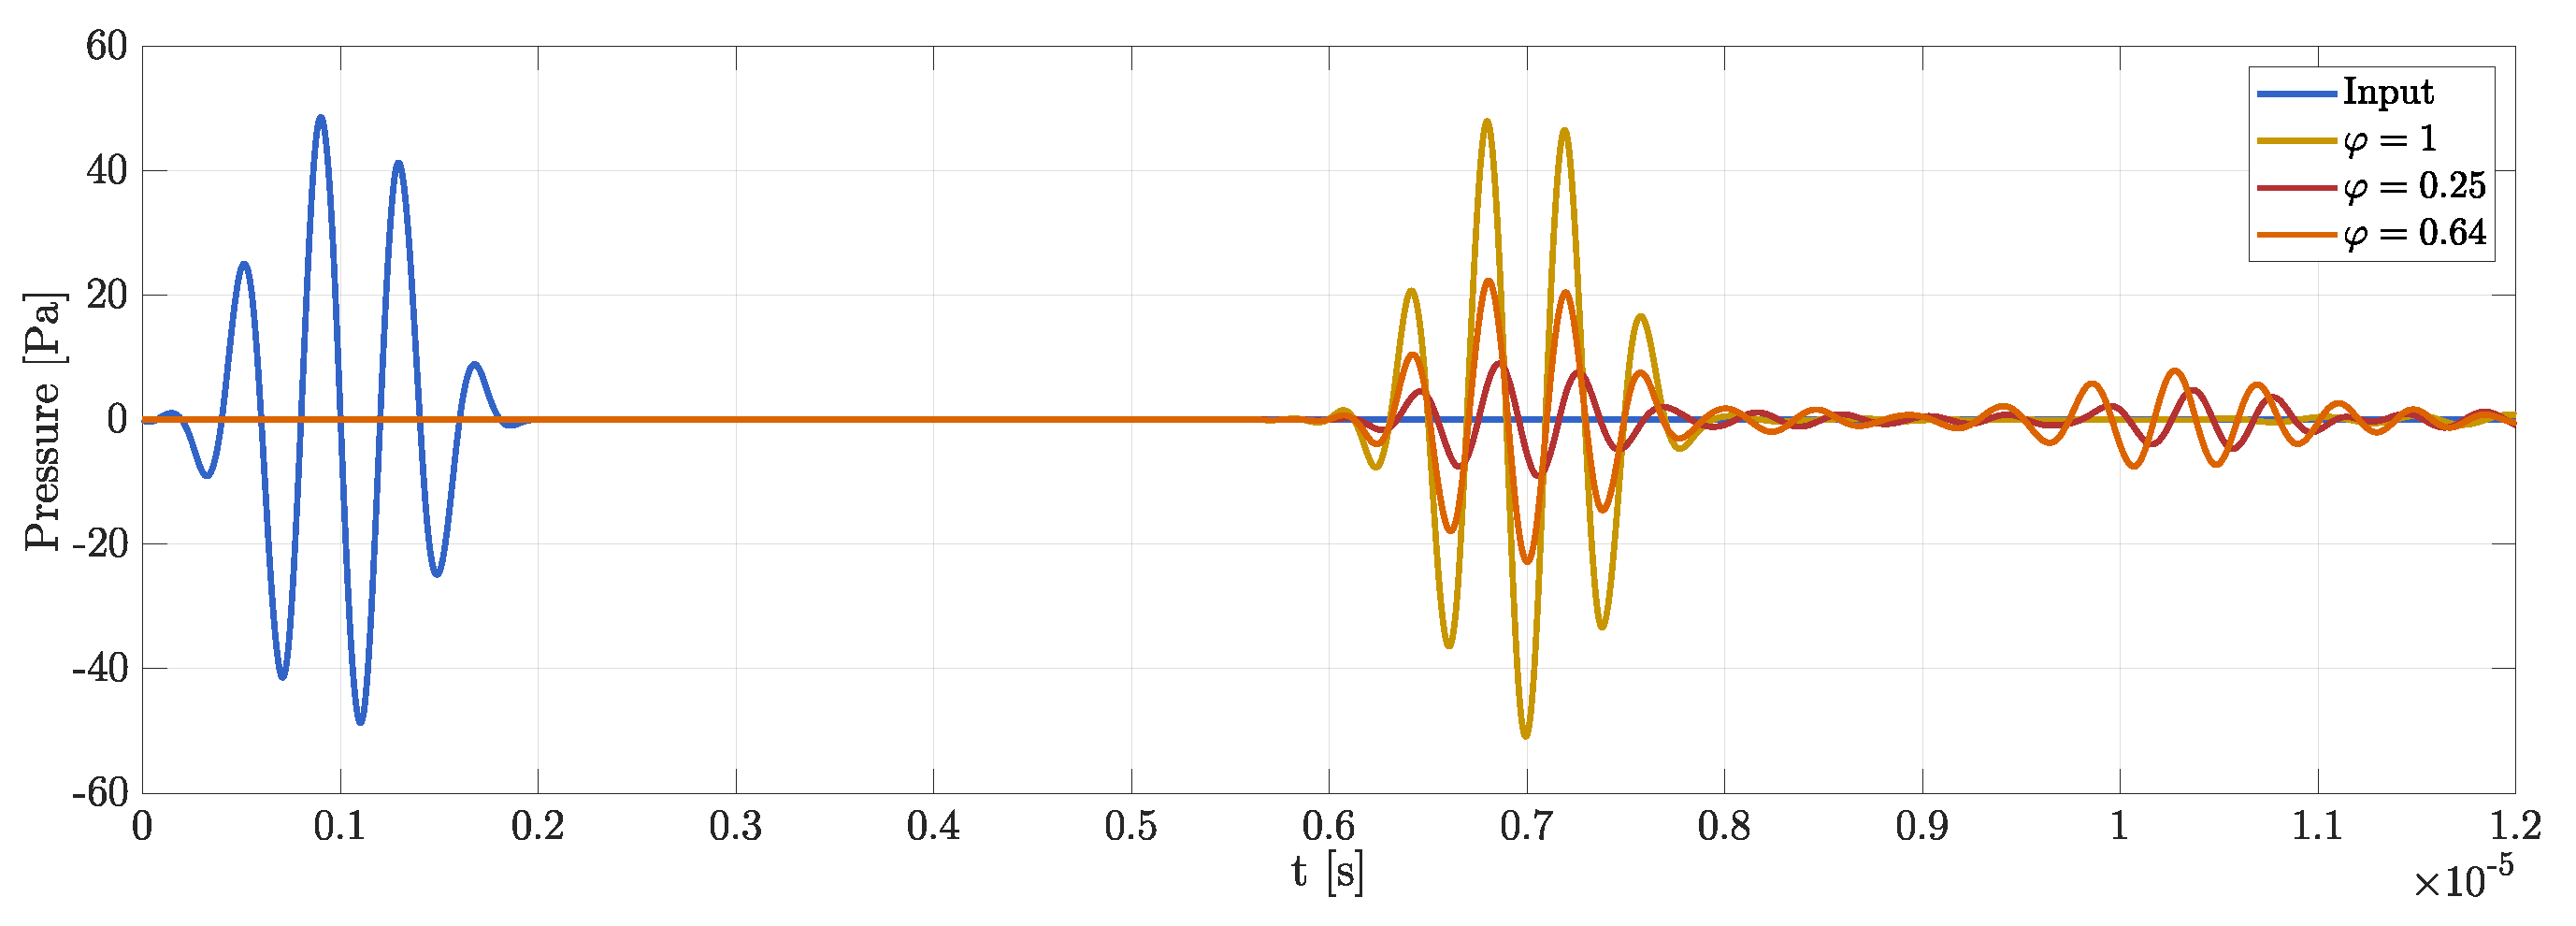
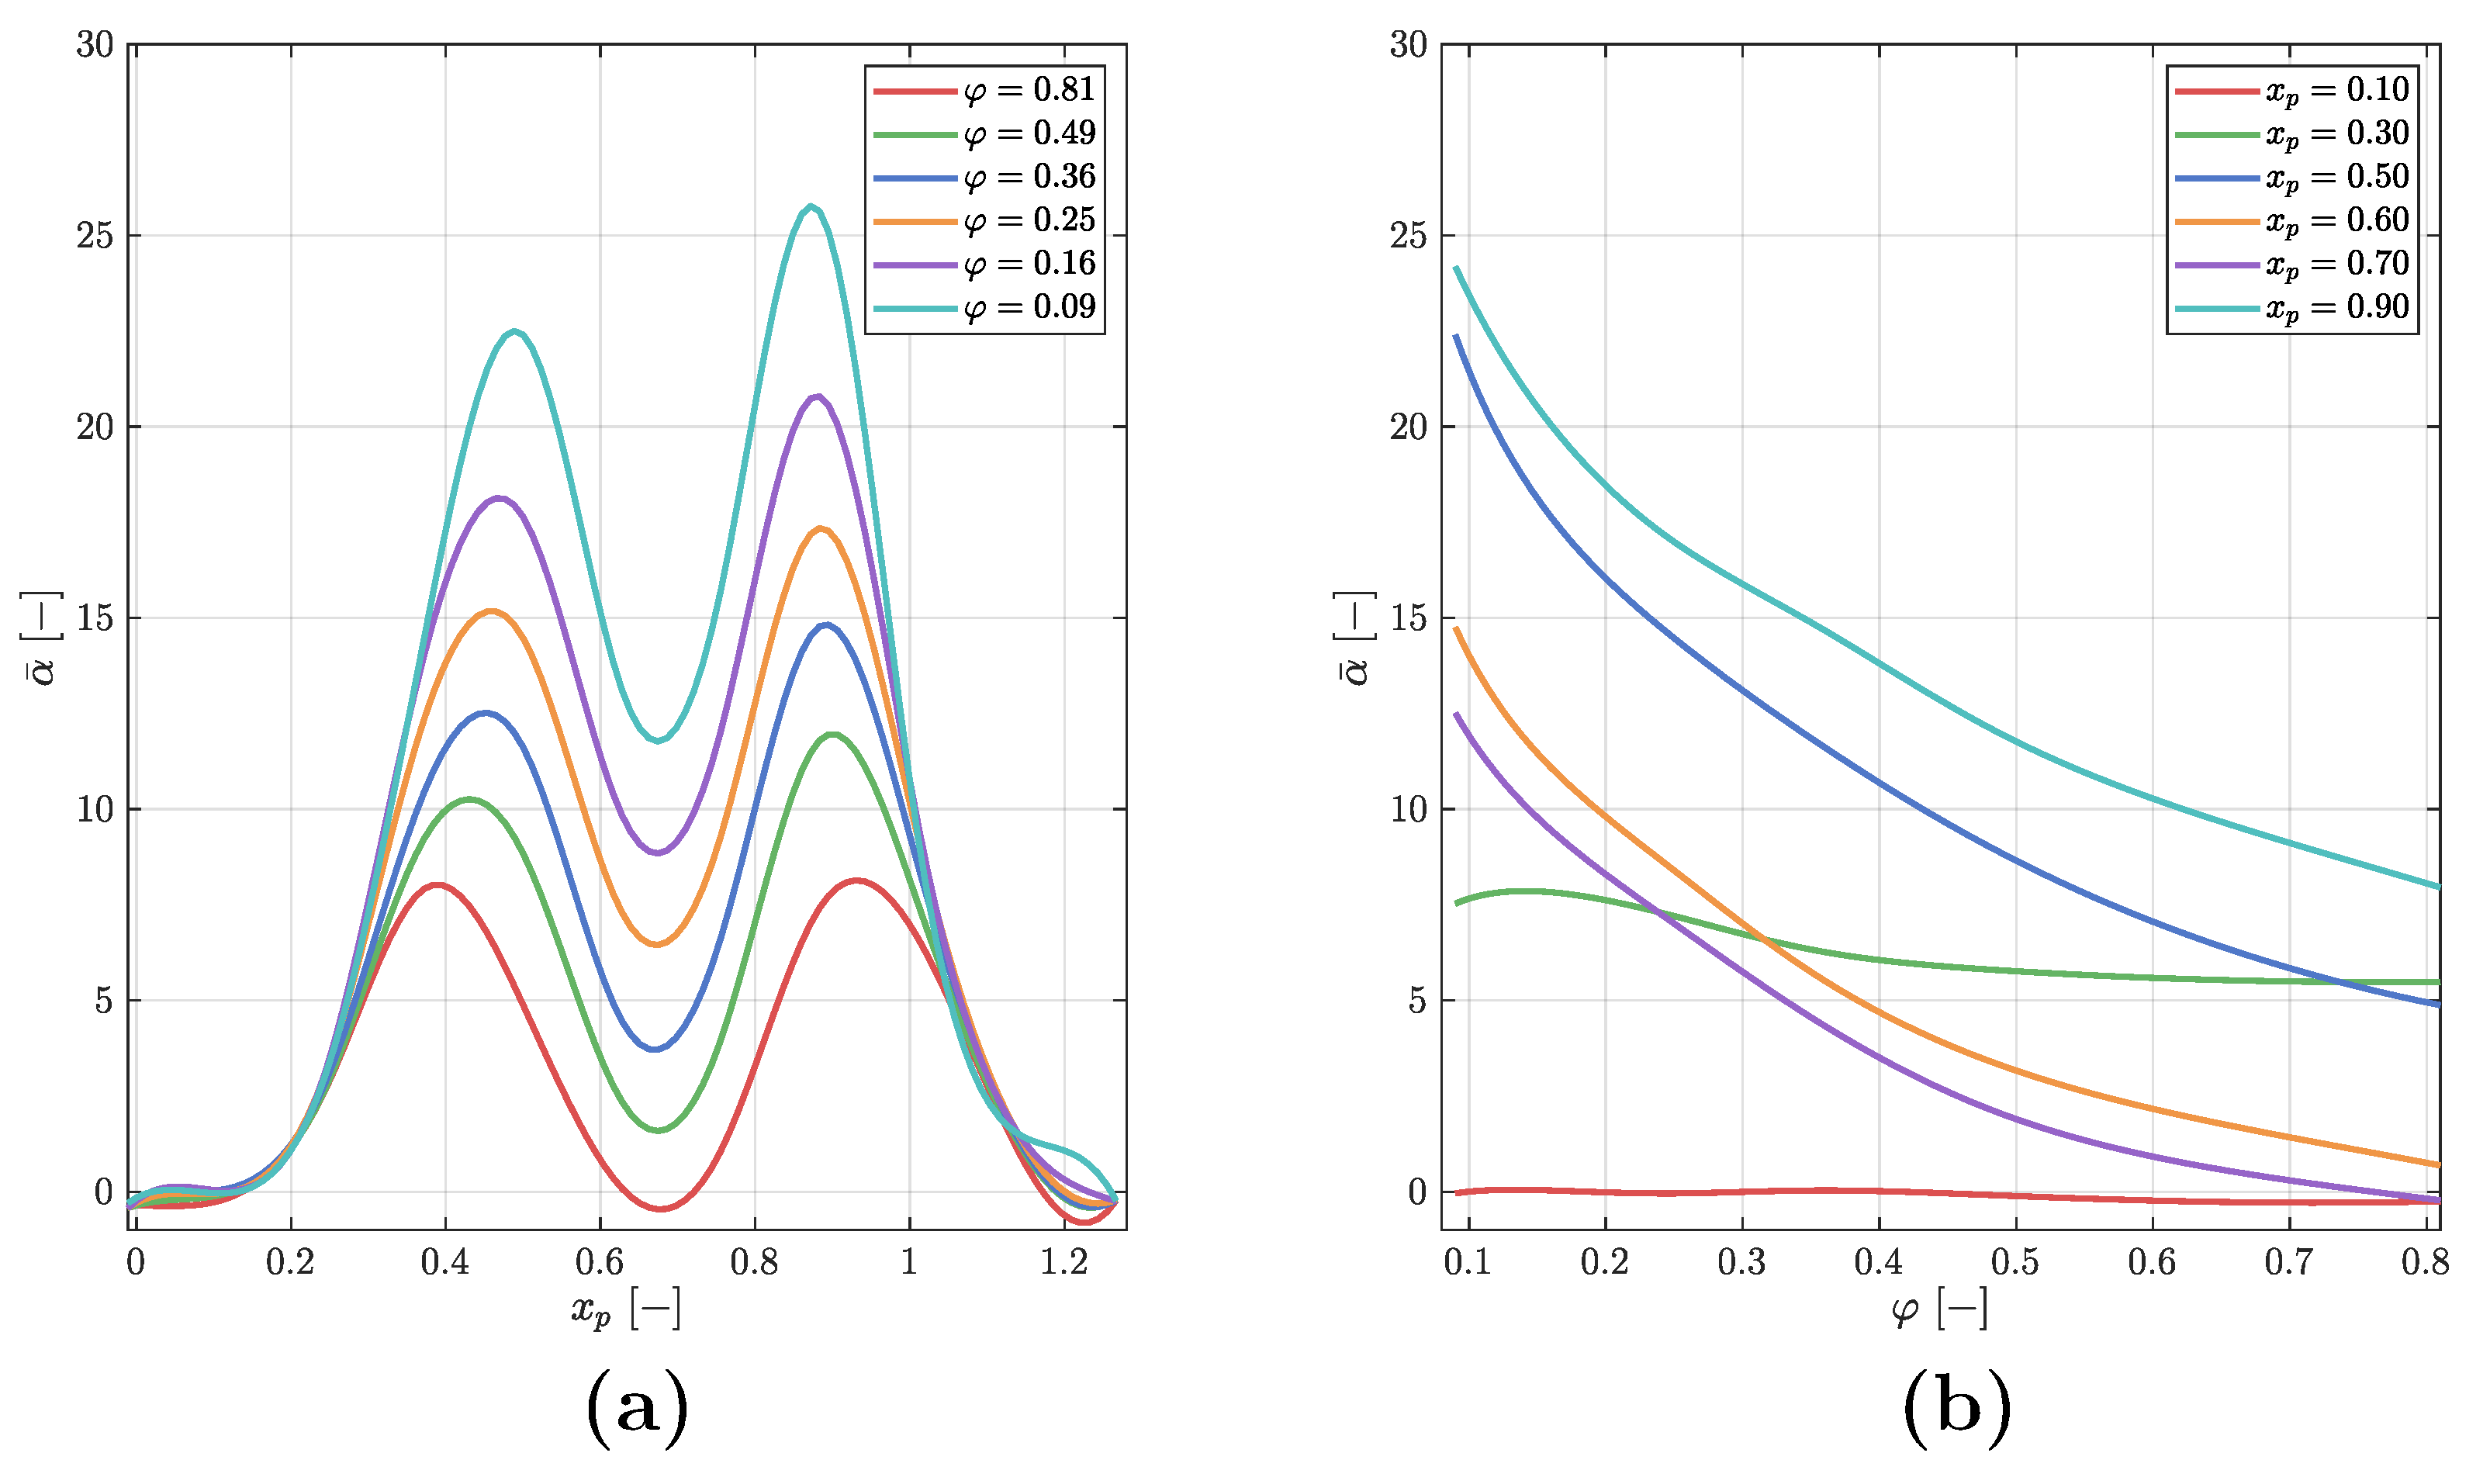
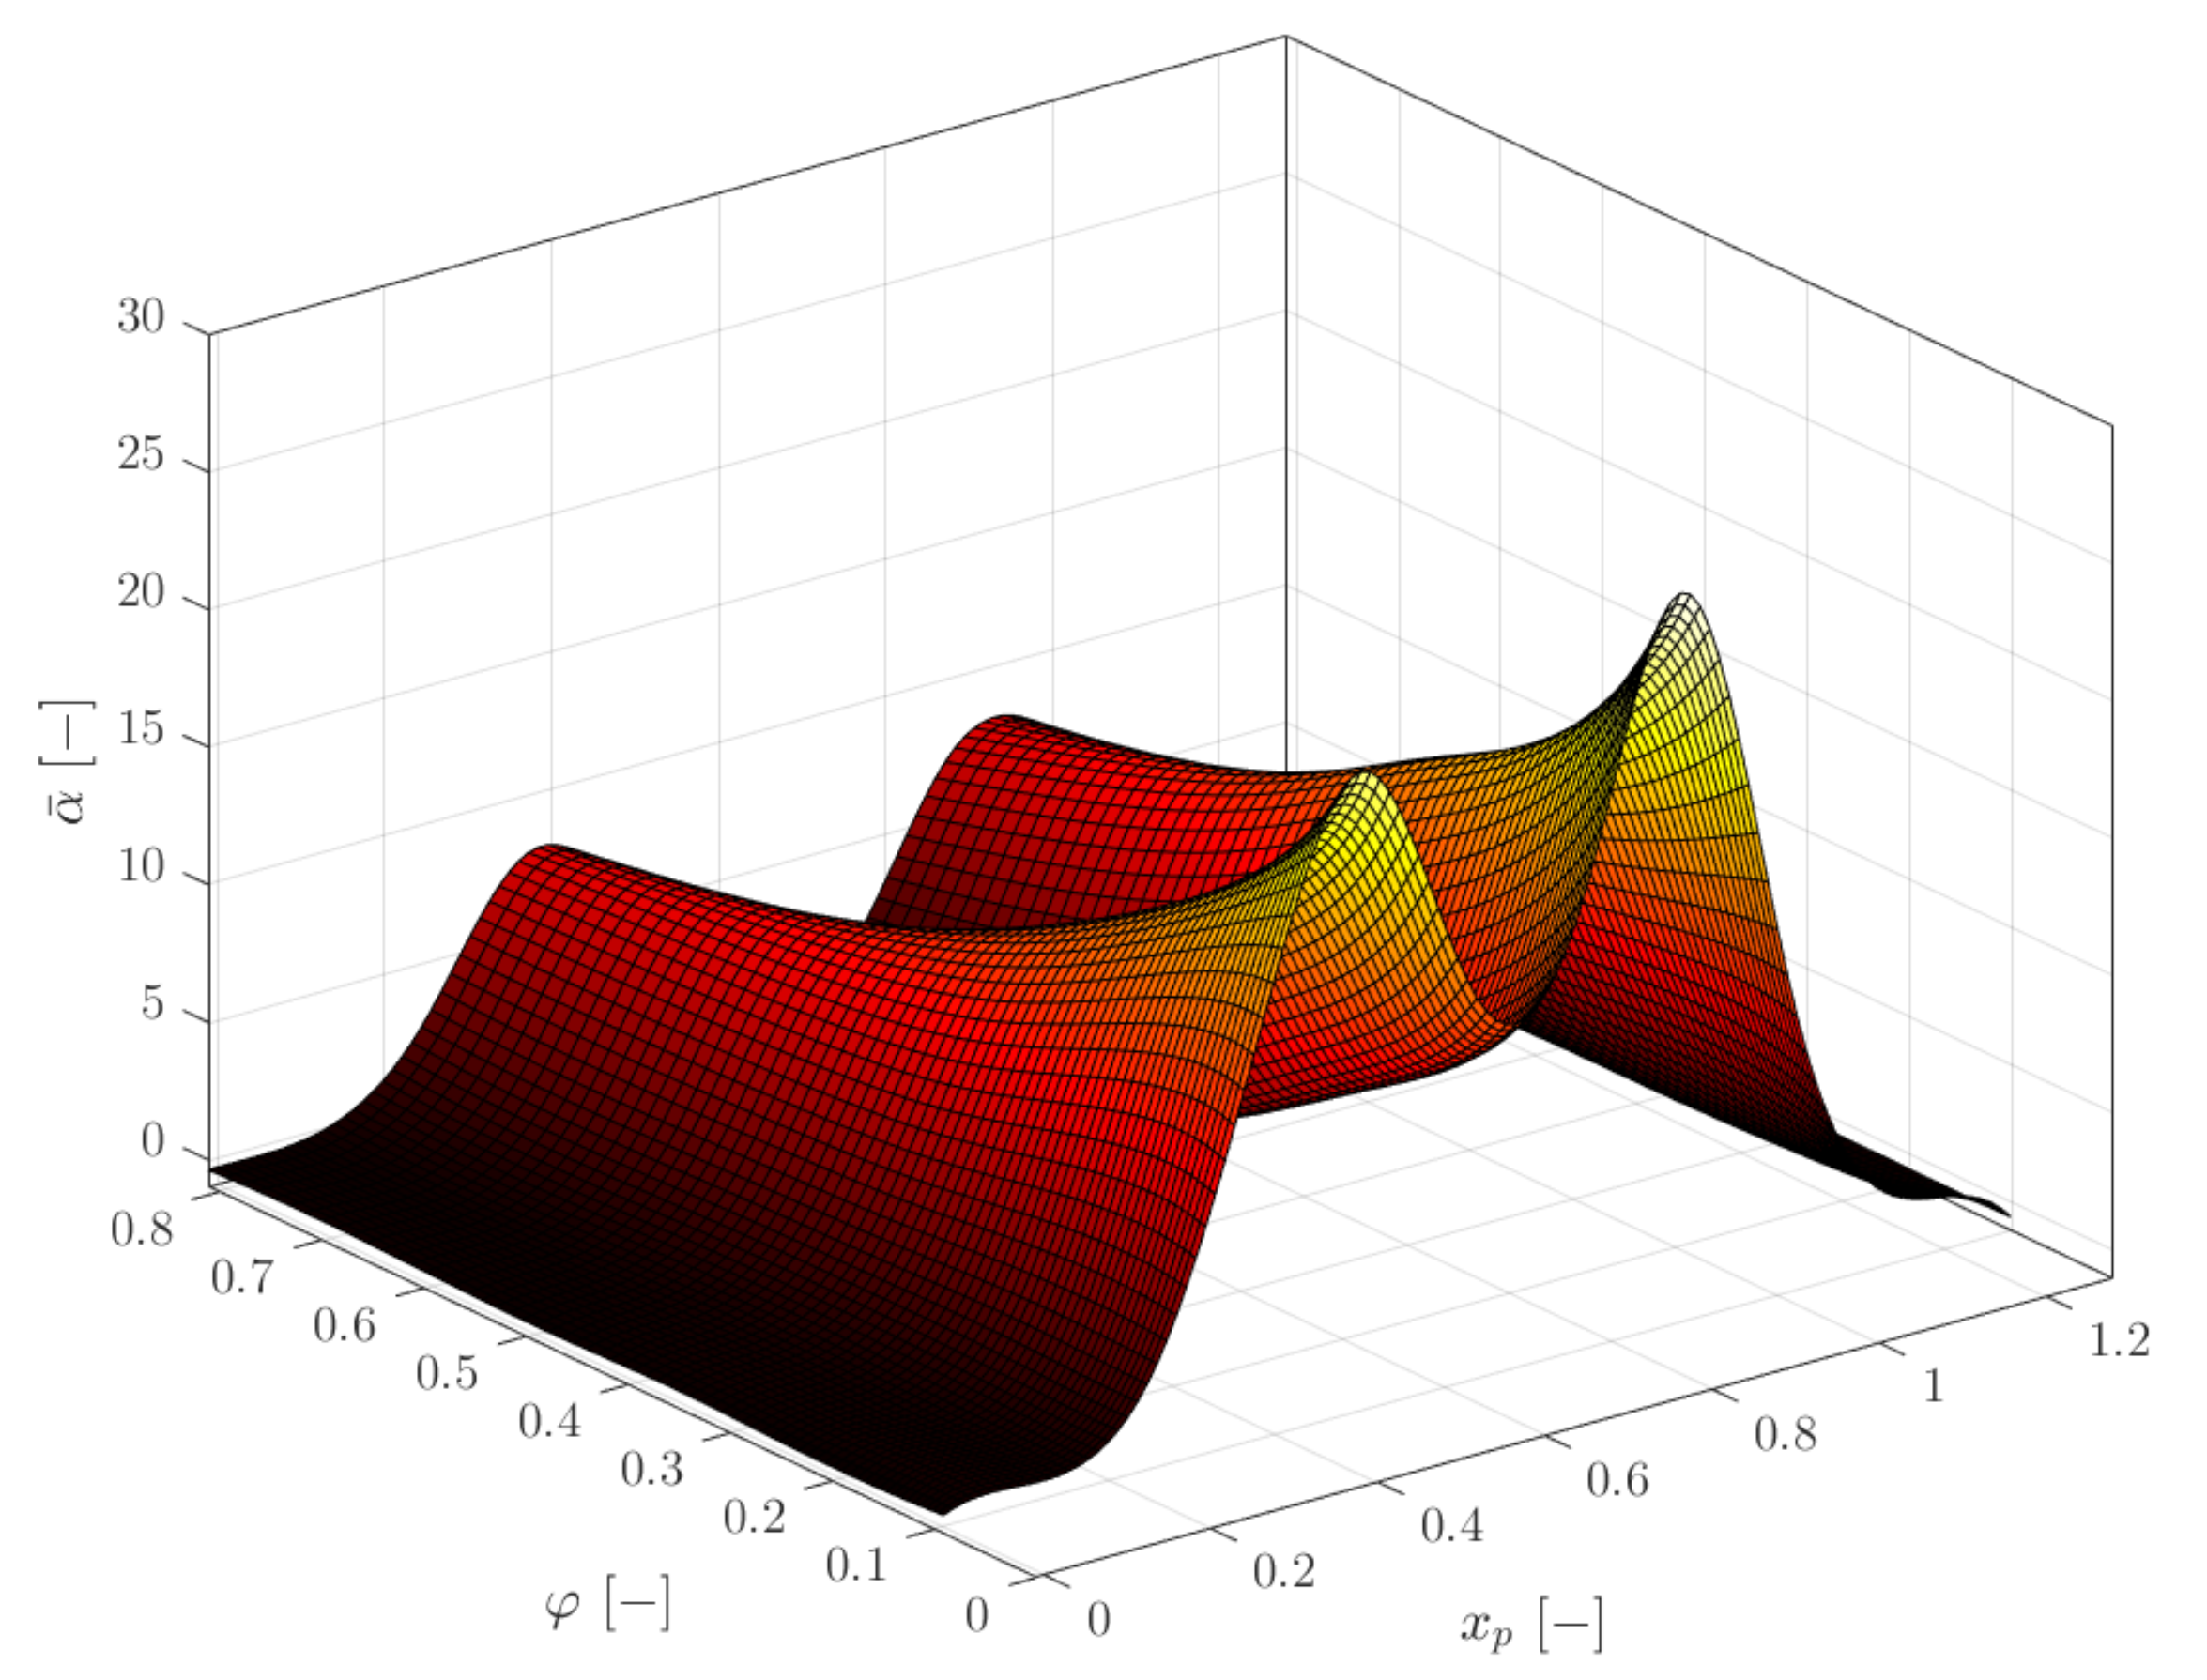
4. Results and Discussion

Simulations were conducted to evaluate the capability of ultrasound technology to detect solid inclusions within the piping section under investigation. The pulse frequency f 0 was fixed to 2.5 MHz. In line with existing ultrasonic monitoring technologies for molten salt systems, as demonstrated by Ionix Advanced Technologies [29], the frequency of ultrasonic waves in this study was chosen based on the optimal balance between penetration depth and resolution. Frequencies in the range of 1–5 MHz have been shown to effectively penetrate molten salts, while providing the necessary resolution to detect solid inclusions. The chosen frequency range ensured that the waves could traverse the molten salt effectively while maintaining sensitivity to variations in the internal structure, such as inclusions and porosity. Previous studies on ultrasonic inspection of liquid metals and molten salts support this choice, as these frequencies allow for precise monitoring of material characteristics without excessive attenuation or distortion of the signals. The temperature of the system was fixed at 240 °C for all the simulations. This choice was based on the observation that the thermodynamic properties of the medium, including both the fluid and the solid phases, exhibit negligible sensitivity to temperature variations, particularly within the phase transition range. As such, the analysis focused on evaluating the dimensionless attenuation, which depends on the input and output signals, allowing for a simplified and consistent approach to assessing the behavior of the system. The analyses presented below were based on 7437 simulations, where the position of the solid inclusion was systematically varied within the reference system, as illustrated in Figure 1a. The position is described using the dimensionless coordinate
x p = x s L d ,
where x s is the leftmost coordinate of the solid inclusion and L d is the axial distance between the ultrasonic source and receiver. Another parameter that was varied was the percentage of the solid inclusion within the pipe cross-section, referred to here as the section porosity:
φ = 1 S s S t ,
where S s is the area of the solid inclusion and S t is the total cross-sectional area of the pipe. Note that the section porosity φ was complementary to the degree of solid inclusion, meaning that φ = 0 indicated a section completely obstructed by the solid. The signals analyzed to evaluate the dimensionless attenuation were the input signal, applied as a pressure boundary condition, Equation (15), at the surface corresponding to the emitter (marked in purple, Figure 1b), and the output signal recorded at the receiver surface (marked in light blue, Figure 1b).
To better understand the temporal evolution of the ultrasonic wave propagation, we present a series of snapshots of the acoustic wave at different time steps: T 0 , 3 T 0 , 9 T 0 , 15 T 0 , and 20 T 0 . These time steps were selected to highlight the different stages of the wave interaction, from the initial propagation to the scattering and reflection phenomena that occurred as the wave interacted with solid inclusions within the pipe. Figure 4 illustrates this temporal evolution. At T 0 , the impulse began its propagation from the emitter and started to travel through the medium. At this stage, the wavefront was still relatively coherent, and there was minimal scattering; see also 3 T 0 . As the time progressed to 9 T 0 , the wave started to interact more with the medium, and slight scattering effects could be observed. By 15 T 0 , the wave reached the receiver, and the initial scattering and reflections began to emerge as the wave interacted with the solid inclusions. At 20 T 0 , the wave field was fully developed, with complete scattering and reflection effects observable. Furthermore, it was evident that the interaction of the wave with the perfectly matched layer (PML) domain did not generate reflections, as expected. This was because the PML was specifically designed to recreate free-field conditions, preventing any artificial reflections that could distort the results. This sequence of images demonstrates the physical process at play as the ultrasonic waves interacted with the solid inclusions, providing insight into the dynamics of the signal attenuation and scattering that will be further analyzed in the following sections.
Figure 5 shows the temporal acoustic pressure profile of the input signal (identical across all the simulations) and the three output signals at the receiver corresponding to the cases where x p = 0.5 and φ = 1 (no occlusion present), φ = 0.64 , and φ = 0.25 . It is evident that in the case of φ = 1 , the receiver signal was free from scattering phenomena, resulting in the energy being concentrated within a rectangular window consistent with the input signal (blue curve). Conversely, for cases with solid inclusions of increasing size ( φ = 0.25 and φ = 0.64 ), the output signal became scattered, meaning it was more spread out over time, due to multiple successive reflections extending its temporal duration at the receiver. Additionally, the amplitudes of the signals in the presence of occlusions were not only scattered but also significantly attenuated, due to the energy reflected by the solid inclusions. This observation supports the conclusion of greater attenuation in these cases.
Figure 6a shows the attenuation of the signal as a function of the position of the occlusion formation (for varying degrees of porosity). Notably, the trend exhibits two peaks corresponding to the positions of the emitter and the receiver. When the solid occlusion formed at these sections, the detected attenuation was amplified compared to the cases where solidification occurred in the intermediate regions between the source and the receiver. A baseline attenuation level can be attributed to thermal relaxation and viscous stress effects in the liquid solution, as observed for x p < 0 and x p > 1 . Similarly, Figure 6b illustrates the attenuation as a function of porosity (for different positions of the solid inclusion). The identified trend (particularly pronounced when the inclusion was near the emitter and receiver sections) can be approximated by an exponential profile. Conversely, the trend flattened when the inclusion formed in regions outside the propagation path between the emitter and receiver.
By combining these two trends, a surface plot was obtained, as shown in Figure 7. This graph provides a comprehensive perspective on the attenuation behavior of the ultrasonic signal as a function of both the position and the degree of solid inclusion. From the results obtained, it is essential to derive statistical considerations to render this analysis operational. Once the signal attenuation is known, it will allow for the determination of the degree of solid occlusion and trigger the appropriate intervention strategies.

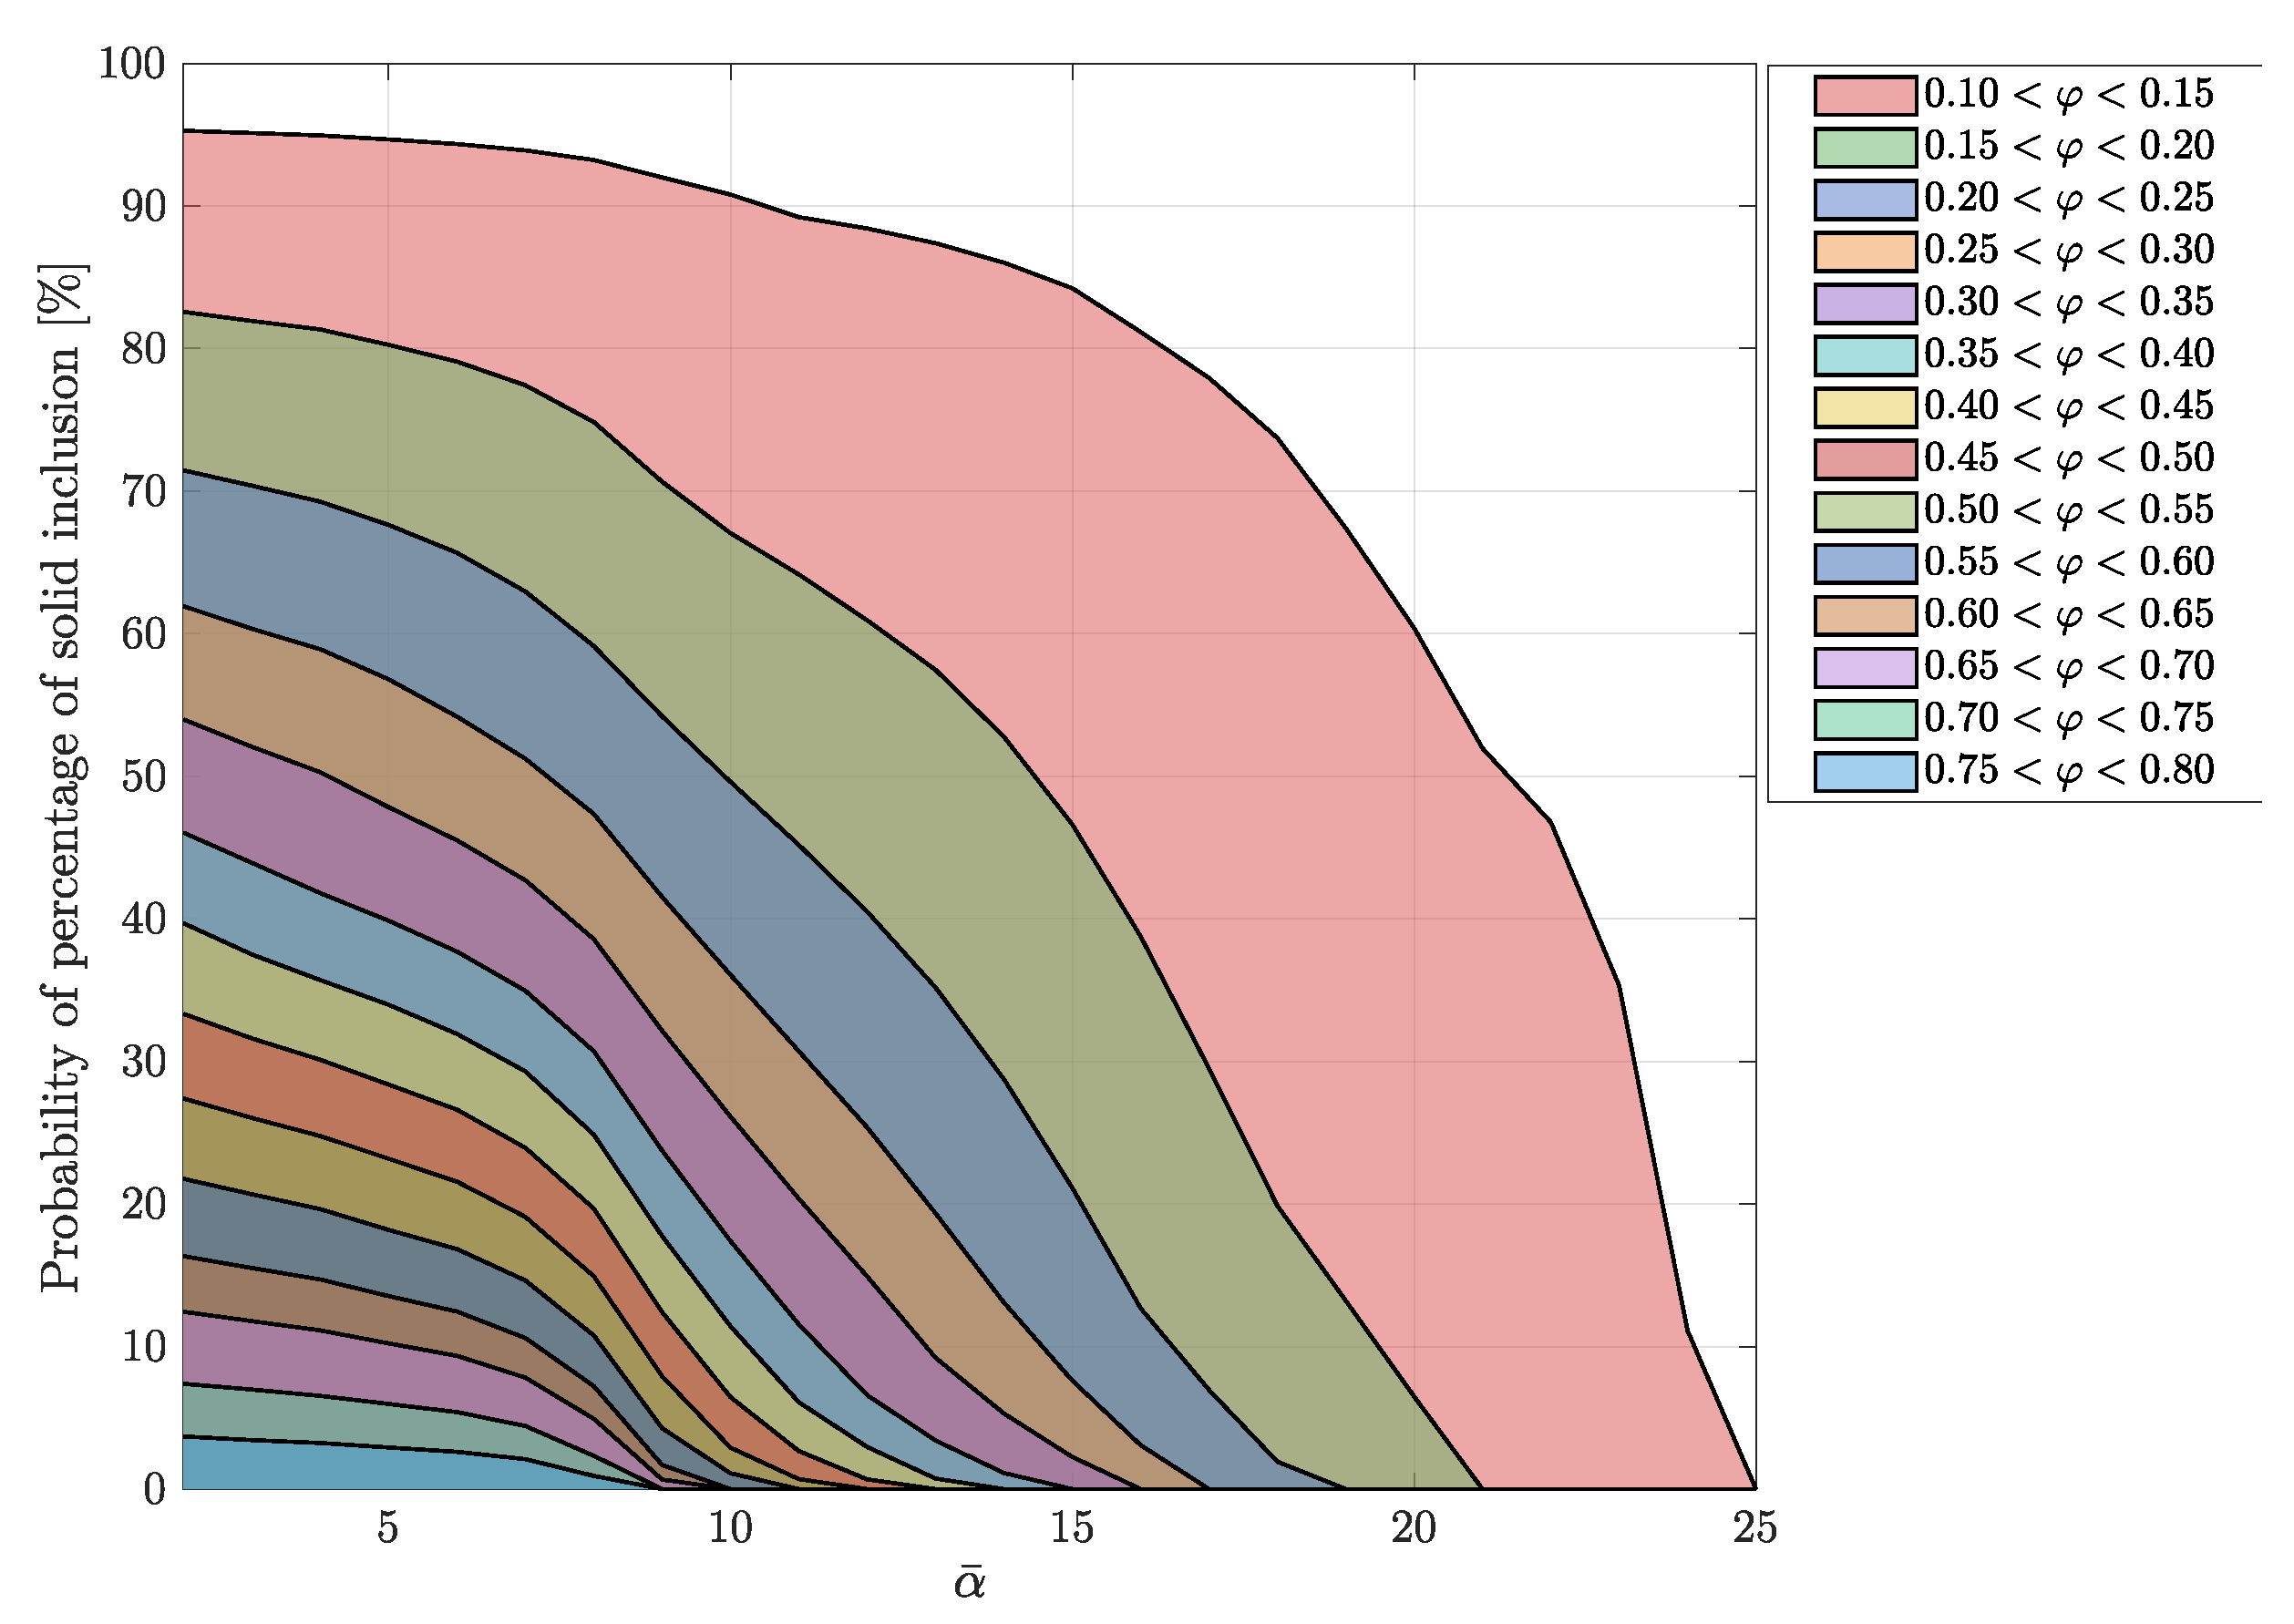
Statistical Analysis

After examining the various scenarios associated with the formation of solid occlusions within the piping system, the representative curve shown in Figure 7 was obtained. To make this result operationally useful, it must be noted that experimental analysis provides an attenuation value, while the position and degree of solid occlusion remain unknown. To prevent clogging of the system during restart and fluid initiation phases, an estimated percentage of solid occlusion is considered acceptable to mitigate the risk of clogging. Underestimating this percentage would lead to overly frequent activation of intervention mechanisms to transition the phase from solid to liquid, resulting in significant energy consumption. Using a probabilistic approach, it was possible to determine the probability of the section porosity φ (or, equivalently, the degree of solid inclusion), given the attenuation value. This analysis resulted in the probability map shown in Figure 8. For example, if an attenuation value of α ¯ = 10 dB is measured and a section porosity between 0.2 and 0.3 is considered acceptable, the graph in Figure 8 allows us to identify the probability range (between P min = 40% and P max = 50%) that this attenuation of 10 dB is caused by an inclusion corresponding to that acceptable φ range ( φ min , φ max ) . If the minimum probability P min of a solid inclusion within this range is deemed acceptable, the intervention mechanisms remain inactive; otherwise, they are triggered. The procedure is illustrated in Figure 9. As the measured attenuation value increases, it is evident that the probability range progressively narrows. This is because, conversely, the probability of more significant solid inclusions increases, which further reduces the section porosity below the acceptable threshold values. This graph serves as the decision-making framework for triggering intervention mechanisms. Once the attenuation level is measured via the ultrasonic signal at the emitter and receiver, the probability map allows determining the likelihood that a given section porosity corresponds to the observed attenuation. Consequently, to optimize the energy and timing of the intervention mechanisms and prevent clogging, it is necessary to define a range of section porosity values considered critical. A corresponding threshold probability of inclusion can then be established, below which the intervention mechanism is triggered.

5. Conclusions

This study demonstrates the potential of ultrasonic techniques for detecting solid inclusions in molten salt piping systems used in concentrated solar power (CSP) plants. Through extensive numerical simulations, we identified key relationships between the attenuation of ultrasonic signals, the position of solid occlusions, and the degree of section porosity. The results highlight that ultrasonic wave scattering and attenuation can provide information about the spatial distribution and size of solid inclusions, enabling real-time monitoring of system conditions. By integrating statistical analysis, we established a probabilistic framework that links measured attenuation levels to likely section porosity ranges, forming the basis for operational decision making. This approach addresses the limitations of traditional temperature-based controls by reducing energy consumption and minimizing unnecessary intervention activation. However, it is important to note that this preliminary study was conducted to assess the feasibility of using this technology for detecting solid inclusions, which were geometrically simplified for the purpose of the numerical analysis. It must be taken into account that the actual distribution and formation of solid inclusions remain uncertain, both in terms of their locations and shapes. Nevertheless, it is crucial to emphasize that this numerical study represents an early phase in the development of an experimental prototype, which will allow for the validation of the methodology developed in this work and facilitate the calibration of the probability map designed to estimate the solid inclusion percentage. Future work could focus on experimental validation of the proposed methods and the integration of supervised machine learning techniques to improve predictive capabilities. Such advancements would pave the way for more robust, efficient, and adaptive systems capable of autonomously managing the challenges of solidification in CSP piping networks. This research underscores the transformative potential of ultrasonic technology in improving the safety and energy efficiency of industrial processes reliant on molten salts.

Author Contributions

Conceptualization, E.D.G., R.A.R. and R.D.; methodology, E.D.G. and R.D.; software, R.D.; validation, E.D.G., R.A.R. and R.D.; formal analysis, E.D.G.; investigation, E.D.G., R.A.R. and R.D.; resources, R.D.; data curation, E.D.G.; writing—original draft preparation, E.D.G.; writing—review and editing, E.D.G., R.A.R. and R.D.; visualization, E.D.G., R.A.R. and R.D.; supervision, R.A.R. All authors have read and agreed to the published version of the manuscript.

Funding

This work was funded by the Italian Ministry of Environment and Energy Security through the “National Electric System Research” Programme–Project 1.9 “CSP/CST technology”, 2022–2024 implementation plan.

Institutional Review Board Statement

Not applicable.

Informed Consent Statement

Not applicable.

Data Availability Statement

The data are available on request.

Conflicts of Interest

The authors declare no conflicts of interest.

References

  1. Muñoz, M.; Rubio, A.; Cosarinsky, G.; Cruza, J.F.; Camacho, J. Deep Learning-Based Algorithms for Real-Time Lung Ultrasound Assisted Diagnosis. Appl. Sci. 2024, 14, 11930. [Google Scholar] [CrossRef]
  2. Nairuz, T.; Lee, D.; Lee, J.H. Breast Ultrasound Computer-Aided Diagnosis System Based on Mass Irregularity Features in Frequency Domain. Appl. Sci. 2024, 14, 8003. [Google Scholar] [CrossRef]
  3. Pirri, C.; Pirri, N.; Macchi, V.; Guidolin, D.; Porzionato, A.; Caro, R.D.; Stecco, C. The Value of Fractal Analysis in Ultrasound Imaging: Exploring Intricate Patterns. Appl. Sci. 2024, 14, 9750. [Google Scholar] [CrossRef]
  4. Smagulova, D.; Samaitis, V.; Jasiuniene, E. Convolutional Neural Network for Interface Defect Detection in Adhesively Bonded Dissimilar Structures. Appl. Sci. 2024, 14, 10351. [Google Scholar] [CrossRef]
  5. Hill, C.R.; Bamber, J.C.; Ter Haar, G.R. Physical Principles of Medical Ultrasonics; Wiley: Hoboken, NJ, USA, 2005; pp. 1–511. [Google Scholar] [CrossRef]
  6. ASNT. Nondestructive Testing Handbook, Vol. 7: Ultrasonic Testing (UT)— NÃO USEI; ASNT: Columbus, OH, USA, 2007; Volume 7, pp. 1–600. [Google Scholar]
  7. Andrei, S.; Dukhin, P.J.G. Characterisation of Fluids and Colloids Using Ultrasound, 1st ed.; Elsevier: Amsterdam, The Netherlands, 2010. [Google Scholar]
  8. Goetz, A.S.D.; Goetz, P.J. Characterization of Liquids, Nano- and Microparticulates, and Porous Bodies Using Ultrasound. Stud. Interface Sci. 2010, 24, 425–439. [Google Scholar]
  9. Peinado Gonzalo, A.; Pliego Marugán, A.; García Márquez, F.P. A review of the application performances of concentrated solar power systems. Appl. Energy 2019, 255, 113893. [Google Scholar] [CrossRef]
  10. Muñoz-Sánchez, B.; Nieto-Maestre, J.; Veca, E.; Liberatore, R.; Sau, S.; Navarro, H.; Ding, Y.; Navarrete, N.; Juliá, J.E.; Fernández, Á.G.; et al. Rheology of Solar-Salt based nanofluids for concentrated solar power. Influence of the salt purity, nanoparticle concentration, temperature and rheometer geometry. Sol. Energy Mater. Sol. Cells 2018, 176, 357–373. [Google Scholar] [CrossRef]
  11. Cimmino, L.; Barco Burgos, J.; Eicker, U. Exergy and thermoeconomic analysis of a novel polygeneration system based on gasification and power-to-x strategy. Renew. Energy 2024, 236, 121438. [Google Scholar] [CrossRef]
  12. Zhang, H.L.; Baeyens, J.; Degrève, J.; Cacères, G. Concentrated solar power plants: Review and design methodology. Renew. Sustain. Energy Rev. 2013, 22, 466–481. [Google Scholar] [CrossRef]
  13. Ejima, T.; Yamamura, T. Thermophysical properties of molten salts: Hypersonic velocities of molten alkali nitrates and their mixtures. Int. J. Thermophys. 1984, 5, 131–148. [Google Scholar] [CrossRef]
  14. Ding, W.; Bauer, T. Progress in Research and Development of Molten Chloride Salt Technology for Next Generation Concentrated Solar Power Plants. Engineering 2021, 7, 334–347. [Google Scholar] [CrossRef]
  15. Piemonte, V.; Falco, M.D.; Tarquini, P.; Giaconia, A. Life Cycle Assessment of a high temperature molten salt concentrated solar power plant. Sol. Energy 2011, 85, 1101–1108. [Google Scholar] [CrossRef]
  16. Boretti, A. Optimizing Concentrated Solar Power: High-Temperature Molten Salt Thermal Energy Storage for Enhanced Efficiency. Energy Storage 2024, 6, e70059. [Google Scholar] [CrossRef]
  17. Mazue, G.; Viennet, R.; Hihn, J.Y.; Carpentier, L.; Devidal, P.; Albaïna, I. Large-scale ultrasonic cleaning system: Design of a multi-transducer device for boat cleaning (20 kHz). Ultrason. Sonochem. 2011, 18, 895–900. [Google Scholar] [CrossRef] [PubMed]
  18. Zhang, B.C.; Jia, X.J.; Li, F.Y.; Sun, Y.H. Research on the Effect of Molten Salt Ultrasonic Composite Cleaning for Paint Removal. ACS Omega 2019, 4, 17072. [Google Scholar] [CrossRef] [PubMed]
  19. Eckert, C.E. Apparatus and method for ultrasonic detection of inclusions in a molten body. U.S. Patent 4,662,215, 5 May 1987. [Google Scholar]
  20. Guthrie, R.; Isac, M. In-Situ Sensors for Liquid Metal Quality. In Sensors, Sampling, and Simulation for Process Control; Wiley: Hoboken, NJ, USA, 2011; pp. 1–14. [Google Scholar] [CrossRef]
  21. Findikoglu, A.T.; Droessler, J.E.; Chlistunoff, J.; Goff, G.S. Noninvasive, In Situ Acoustic Diagnosis and Monitoring of Corrosion in Molten-Salt Systems. Corrosion 2019, 75, 1230–1236. [Google Scholar] [CrossRef] [PubMed]
  22. Higgs, R.W.; Litovitz, T.A. Ultrasonic Absorption and Velocity in Molten Salts. J. Acoust. Soc. Am. 1960, 32, 1108–1115. [Google Scholar] [CrossRef]
  23. Bell, S.; Steinberg, T.; Will, G. Corrosion mechanisms in molten salt thermal energy storage for concentrating solar power. Renew. Sustain. Energy Rev. 2019, 114, 109328. [Google Scholar] [CrossRef]
  24. Bhardwaj, M.C. Principles and Methods of Ultrasonic Characterization of Materials. Adv. Ceram. Mater. 1986, 1, 311–324. [Google Scholar] [CrossRef]
  25. Galicia, D.N.; Hernandez, A.V.; Salas, L.L. Experimental determination of the amplitude attenuation coefficient of ultrasound in pure water: A comparison between some pulse techniques. In Proceedings of the CCE 2012—2012 9th International Conference on Electrical Engineering, Computing Science and Automatic Control, Mexico City, Mexico, 26–28 September 2012. [Google Scholar] [CrossRef]
  26. Marcus, Y. The compressibility and surface tension product of molten salts. J. Chem. Phys. 2013, 139, 124509. [Google Scholar] [CrossRef] [PubMed]
  27. Marcus, Y. The compressibility of molten salts. J. Chem. Thermodyn. 2013, 61, 7–10. [Google Scholar] [CrossRef]
  28. Grindley, T.; Lind, J.E. Thermodynamics of Molten Salts. J. Chem. Phys. 1972, 56, 3602–3607. [Google Scholar] [CrossRef]
  29. NDT Testing Systems & Consultancy Services—Ionix Advanced Tecnologies. Available online: https://ionixadvancedtechnologies.co.uk/2023/07/06/case-study-i-ultrasonic-monitoring-of-molten-salt-for-energy (accessed on 20 January 2025).
Figure 1. Numerical setup: (a) fluid, solid, and PML domain; (b) boundary conditions.
Applsci 15 01373 g001
Figure 2. Uniform mesh in the domain with fourth-order tetrahedral elements.
Applsci 15 01373 g002
Figure 3. Convergence analysis of the numerical scheme. The right y-axis shows the parameter Δ α ¯ (dimensionless attenuation difference), while the left y-axis represents the number of degrees of freedom (DoFs). Both were plotted against the mesh element size, normalized with respect to the wavelength in the fluid volume. This analysis illustrates the balance between solution accuracy and computational cost as the mesh resolution varied.
Applsci 15 01373 g003
Figure 4. Temporal evolution of the acoustic wave at time steps T 0 , 3 T 0 , 9 T 0 , 15 T 0 , and 20 T 0 . The images show the beginning of propagation from the emitter at T 0 and 3 T 0 , the initial scattering effects at 9 T 0 , the wave reaching the receiver around 15 T 0 , and the fully developed scattering and reflection at 20 T 0 .
Applsci 15 01373 g004
Figure 5. The blue curve represents the input impulse generated by the emitter. The yellow, red, and orange curves correspond to output signals for the cases x p = 0.5 with φ = 1 (no occlusion present), φ = 0.25 , and φ = 0.64 , respectively.
Applsci 15 01373 g005
Figure 6. (a) Dimensionless attenuation α ¯ as a function of the dimensionless position of the solid inclusion x p for different values of section porosity φ . Peaks in attenuation are observable near the emitter and receiver positions. (b) Dimensionless attenuation α ¯ as a function of section porosity φ for different values of x p . An exponential decay trend is noticeable where the inclusions are near the emitter or receiver, while attenuation levels off for inclusions outside the propagation path.
Applsci 15 01373 g006
Figure 7. Surface plot illustrating the dimensionless attenuation α ¯ as a function of section porosity φ and the dimensionless position of the solid inclusion x p . The graph provides a comprehensive view of how both the location and size of the solid inclusion impacted signal attenuation. Peaks occurred near the emitter and receiver positions, with attenuation increasing as the section porosity decreased.
Applsci 15 01373 g007
Figure 8. Probability map illustrating the likelihood of section porosity φ values for a given measured dimensionless attenuation α ¯ . The map is designed as a decision-making tool, correlating attenuation levels with the probable extent of solid inclusions. Higher attenuation values correspond to lower porosity ranges, indicating more significant inclusions. This framework supports the definition of critical thresholds for triggering intervention mechanisms.
Applsci 15 01373 g008
Figure 9. Schematic representation of the intervention mechanism procedure based on the probability map.
Applsci 15 01373 g009
Disclaimer/Publisher’s Note: The statements, opinions and data contained in all publications are solely those of the individual author(s) and contributor(s) and not of MDPI and/or the editor(s). MDPI and/or the editor(s) disclaim responsibility for any injury to people or property resulting from any ideas, methods, instructions or products referred to in the content.

