Article

Optimal Design of Anti-Collision Spacer Ring for Power Transmission Lines

College of Electrical Engineering and Control Science, Nanjing Tech University, Nanjing 211816, China
*
Author to whom correspondence should be addressed.
Appl. Sci. 2025, 15(23), 12496; https://doi.org/10.3390/app152312496
Submission received: 29 October 2025 / Revised: 13 November 2025 / Accepted: 22 November 2025 / Published: 25 November 2025

Abstract

Electrical power transmission relies heavily on power transmission lines. The swinging of the lines during windy weather can cause conductor collision between adjacent lines, which can result in severe electrical accidents. To solve this problem, this paper proposes an anti-collision spacer ring and its structure optimization method. Topology optimization, as a structural optimization method, is used to design the spacer ring to achieve maximum stiffness and minimum mass. The model is redesigned based on the optimized results, and its performance is subsequently assessed through static analysis and electrostatic field analysis. The results before and after optimization show that the maximum equivalent stress on the spacer ring is reduced by 34.4% and the mass is decreased by 10.5%. It realizes the lightweight design of the spacer ring, and provides theoretical basis and technical support for the structural design of the spacer ring.

1. Introduction

Power transmission lines are crucial for ensuring a reliable electrical supply to urban areas. Their safe operation is essential to the normal development of the national economy and life [1]. The transmission lines are exposed to the natural environment and are affected by icing and wind, which cause them to swing [2,3]. These conditions can lead to conductor strand breakage, line disconnection and other accidents, resulting in circuit disconnection or outages and large-scale power failure, and substantial economic losses [4,5]. To prevent such accidents, power transmission lines are typically equipped with anti-collision devices. However, the installation of these devices often requires manual operation, which not only increases construction complexity but also raises maintenance costs. The spacer ring, as proposed in this paper, is installed at regular intervals along transmission lines. Its primary function is to maintain a safe separation between conductors, thereby effectively mitigating the risk of conductor collision.
To achieve a lightweight spacer ring design without compromising its structural strength, topology optimization is one of the main optimization methods for balancing strength and weight reduction. It allows to determine the optimal material distribution within a specified design domain, ensuring the best mechanical performance and response of the structure under static or dynamic loads [6,7]. In most cases, optimal structure configurations cannot be determined based on the previous experience. Topology optimization can explore innovative structural designs under given loads and constraints, such as stress and displacement [8]. It is adaptive, highly flexible, and potential cost savings in design and manufacturing, and has been widely applied in diverse fields, including structures [9], mechanics [10], thermal [11], and acoustics [12]. At present, common topology optimization methods include the phase field method [13,14], variable density method [15,16], level set method [17], bi-directional evolutionary structural optimization (BESO) method [18,19], and movable component method [20]. Among them, the variable density method is the most widely used because it is simpler and more efficient than other topology optimization methods and has good adaptability to complex design domains.
The variable density method transforms the initial discrete topology optimization problem into an optimization problem based on continuous design variables. It allows for the addition of effective materials to the structure while removing inefficient materials, resulting in an optimal structure [21]. By resorting to the density-based Solid Isotropic Material with Penalization (SIMP) method, the penalty factor p is introduced to increase the cost of intermediate-density elements and reduce the number of intermediate-density elements to make the density of elements as close as possible to 0 or 1 [22], which highlights the overall structure of the spacer ring. During the design process, the initial density distribution is not necessarily uniform. Therefore, some methods need to be used to achieve a uniform distribution of density. Common homogenization methods include volume fraction method, sensitivity analysis method and topological gradient method. These methods mainly use some rules to adjust the mass distribution of different units to achieve homogenization [23]. Although the homogenization methods are not directly employed in this study, the SIMP-based topology optimization inherits their core concepts of volume fraction control and sensitivity analysis. The SIMP method is chosen because it combines the theoretical foundation of homogenization with high computational efficiency and good convergence, making it suitable for engineering applications.
Topology optimization is typically performed for a single objective optimization [24,25]. However, the actual process is often dynamic with multiple working conditions and constraints, and the structural topology optimization results for a single optimization objective cannot meet the overall structural design requirements [26]. Zhao et al. [27] and Zhong et al. [28] transformed the multi-objective topology optimization model into a single-objective problem using a compromise programming approach, with fixed weights empirically assigned to each objective. Therefore, in this paper, a compromise programming approach is applied to the multi-objective optimization of the spacer ring.
The aim of this paper is to design a spacer ring for anti-collision on power transmission lines. The variable density method of topology optimization methods is used to derive the optimal layout of the spacer ring. Finite-element models are developed to investigate the structural performance of the topology-optimized spacer rings design [29]. The spacer ring designed in this paper is superior to the original design. The spacer ring maintains a similar geometry while reducing the maximum equivalent stress and mass. This paper explores new ways for spacer ring structures to realize low-cost and lightweight structural design, which is important for maintenance and performance under heavy environmental stresses.

2. Composition and Working Principle of the Spacer Ring System

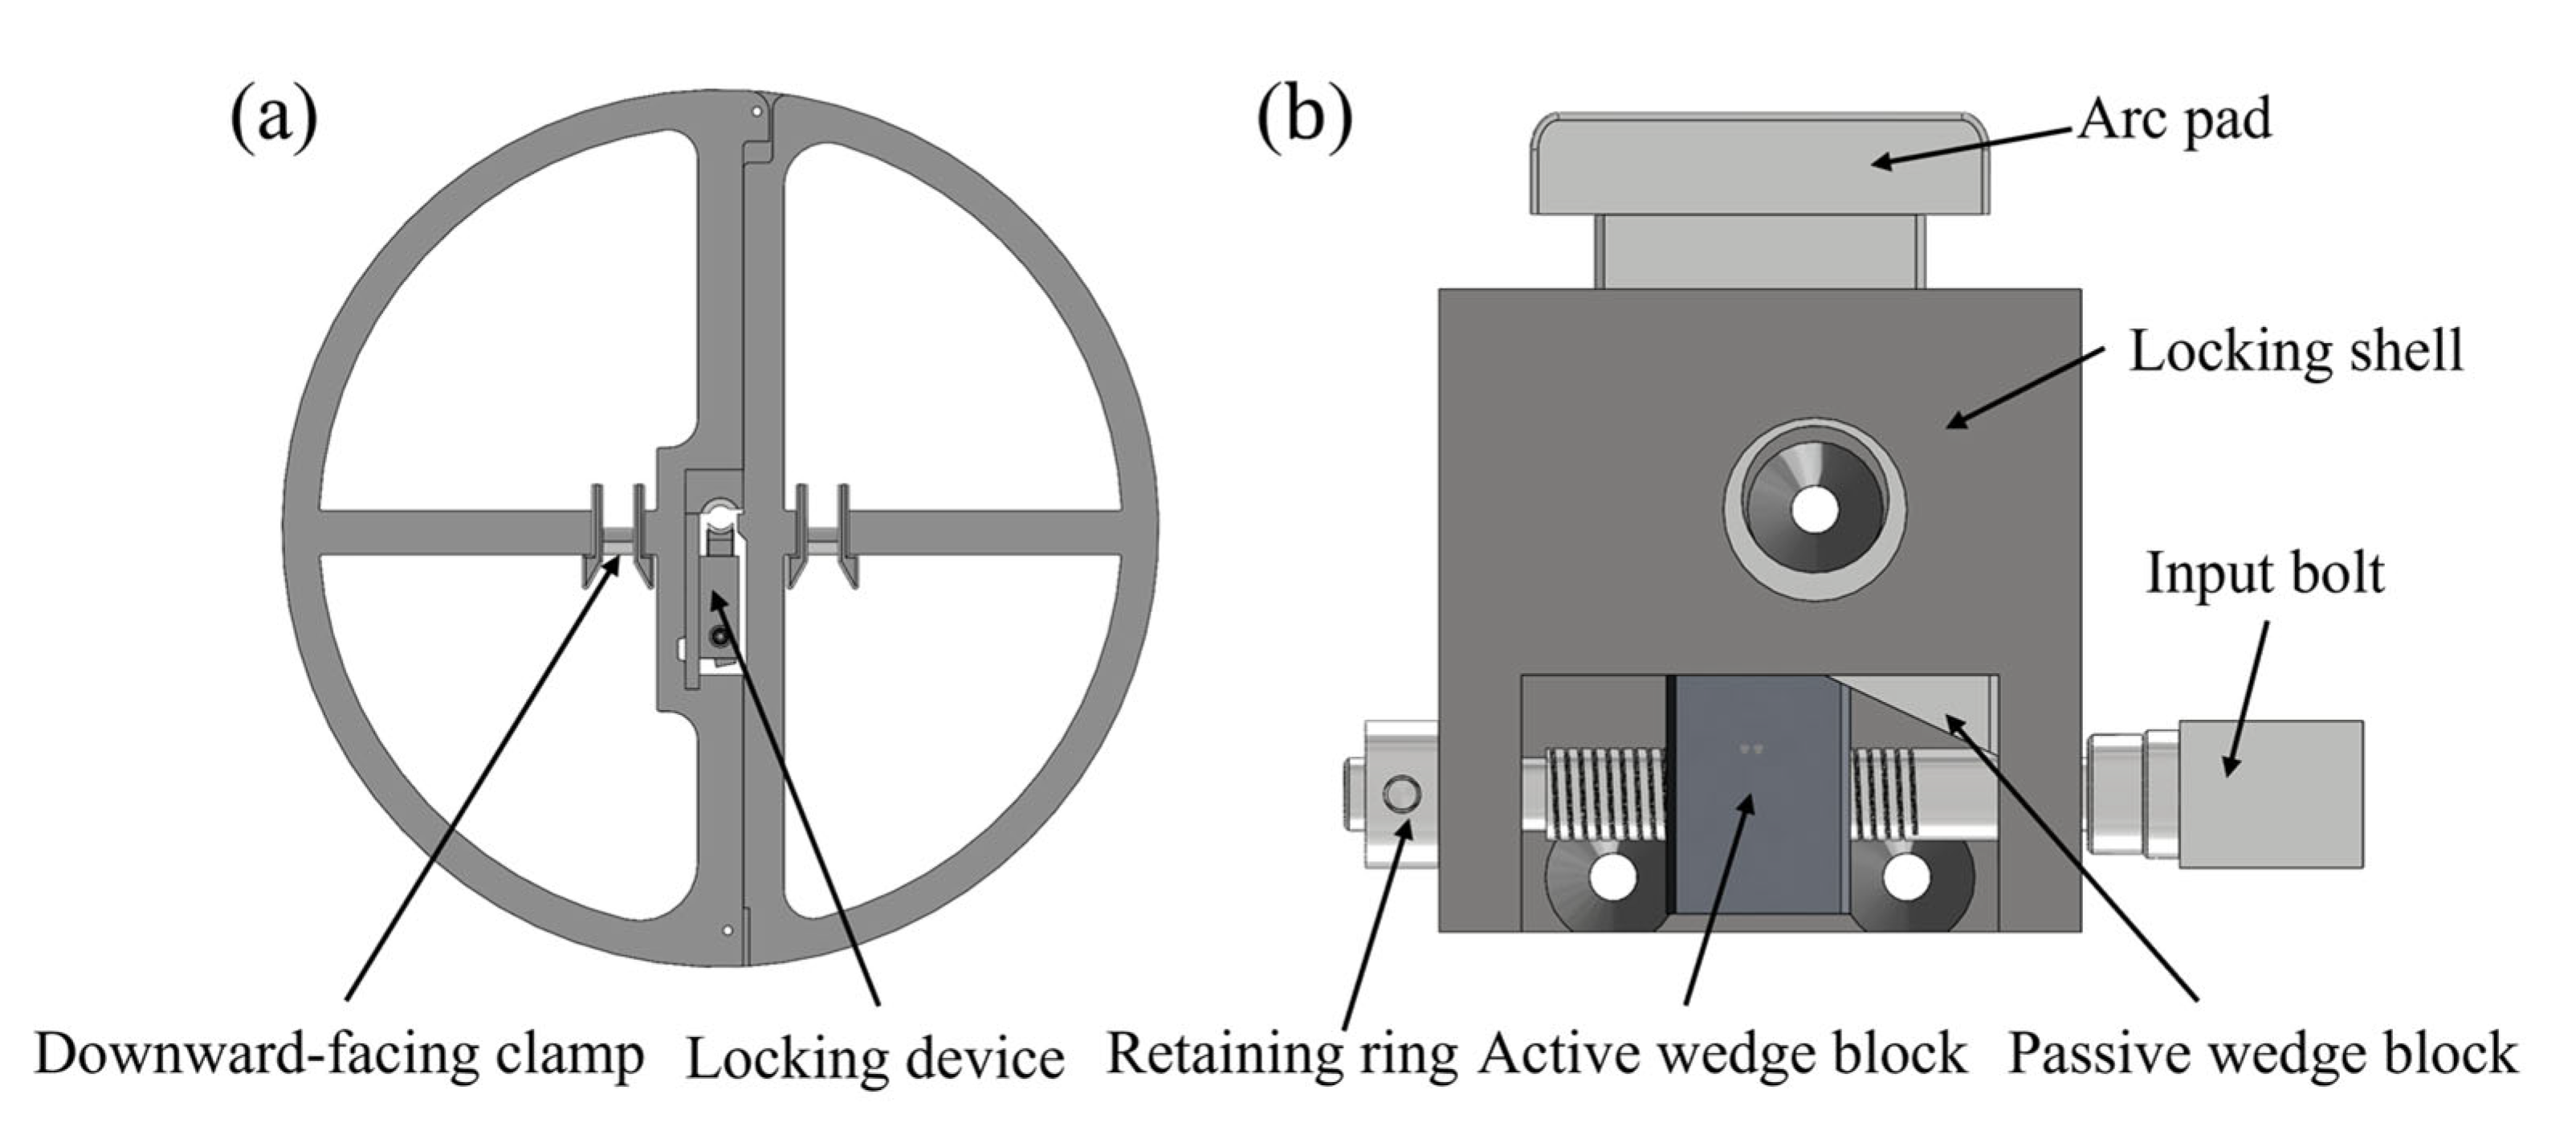
The design of the robot and the spacer ring has already been completed in our previous work, and the spacer ring system has also been manufactured. The system of the spacer ring is shown in Figure 1. As shown in Figure 1a, the spacer ring system consists of a robot, spacer ring and power transmission lines. The spacer ring locking process is illustrated in Figure 1b,c. As shown in Figure 1d, spacer rings prevent conductor collision in power transmission lines. The spacer ring, as shown in Figure 2a, is a circular structure with four supports. Two downward-facing clamps are installed on the horizontal supports. The vertical support is installed with a spacer ring locking device. As shown in Figure 2b, the locking device consists of an input bolt, an active wedge block, a passive wedge block, a retaining ring, an arc pad, a rotating handle, and a locking shell. When the rotating handle is turned, the input bolt also rotates, causing the active wedge to move left and right. Due to the contact between the wedge surfaces of the active and passive wedges, the passive wedge will fall or rise accordingly.
Outdoor testing of the spacer ring has been completed, and the tests demonstrated its successful installation on transmission lines. The installation process of the spacer ring is shown in Figure 3, firstly, the spacer ring is manually transported to the power transmission lines, then the robot lifts the spacer ring and moves it to the specified position on the line. It then lowers the spacer ring until the upper surface of its middle cavity makes contact with the line. At this point, the robot rotates the handle of the locking device, causing the passive wedge to rise and gradually press against the line, thereby securing the spacer ring in place. Finally, the robot’s gripper descends to the lowest point and then returns to its initial position. To further validate the feasibility of installing the spacer ring, previous work of this paper has also tested spacer ring installation and removal in simulated real scenarios. As shown in Figure 4, the robot can stably install and remove the spacer ring on transmission lines. Due to the significant load that multiple spacer rings impose on a single transmission line, and their need to withstand collisions between the lines, their structure needs to be optimized to reduce mass and increase strength.

3. The Optimization Model for Spacer Ring

3.1. Simulation Modeling of the Spacer Ring

In order to analyze the performance of the spacer ring in power transmission lines, this study simulated the electrical and mechanical conditions that may be encountered by the spacer ring on outdoor power transmission lines. A three-dimensional geometric model of conductors of the power transmission line and spacer ring is created in SolidWorks 2022 and subsequently imported into ANSYS Workbench 2023 R1 and COMSOL Multiphysics 6.3 for further simulation and analysis. In this study, the diameter of the line is 30 mm, the inner diameter of the spacer ring is 500 mm, the outer diameter of the spacer ring is 600 mm, and the height of the spacer ring is 10 mm. Table 1 summarizes the numerical parameters used for the simulation and optimization of the spacer ring.

3.2. Topology Optimization Method Based on Variable Density Method

Structural topology optimization is a mathematical technique whose goal is to provide an optimized structure fulfilling user-defined requirements. In the most general formulation, it consists of redistributing the material inside an initial design domain in order to satisfy mechanical performances combined with physical constraints [30]. The topology optimization in this paper is implemented in Ansys, and its theory is based on the variable density method. Among the various popular interpolation schemes of the variable density method, SIMP is a commonly used density-stiffness interpolation model. The interpolation model uses the element relative density as the design variable, and the material properties are simulated by the exponential function of the element relative density. The SIMP material interpolation model is formulated as follows [31,32]:
E ( x ) = x p E 0 ,
where E ( x ) is the elastic modulus after interpolation, x is the element relative density, p is penalization factor and E 0 is the elastic modulus of the material.

3.3. Mathematical Modeling for Topology Optimization

The variable density method assumes that material density is variable and uses the relative density of elements as the design variable [33]. The structural stiffness and mass are both considered in the topology optimization, since high stiffness ensures anti-collision reliability, while lightweight design reduces the burden on the transmission lines. A multi-objective optimization function is established using a normalization method [34], it can be formulated as:
F ( p ) = α c ( p ) c min c max c min + ( 1 α ) m ( p ) m min m max m min ,
where c ( p ) = u T K ( p ) u is the compliance of the structure, u is the displacement vector, and K(p) is the global stiffness matrix, m ( p ) = e = 1 n p e v e is the mass of the structure, p e is the relative density of the e-th element, and v e is the unit volume of the e-th element, c max and c min are the maximum and minimum structural compliance, respectively, m max and m min are the maximum and minimum structural mass, respectively, and α [ 0 , 1 ] is the weighting coefficient to adjust the relative importance of compliance and mass in the objective function.
The global stiffness matrix K can be formulated as:
K ( p ) = e = 1 n p e K e ,
where n is the total number of design variables, K e is the element stiffness matrix, p is the penalty factor, and p e is the relative density of the e-th element, which takes the range 0 < p e 1 ( p min is defined as 0.001 in this paper).
The multi-objective topology optimization model is built as follows:
find   p , min   F ( p ) , s . t . K ( p ) u = F μ 1 V 0 V ( p ) = e = 1 n p e v e μ 0 V 0   ( e   =   1 , 2 , , n ) 0 < p min p e 1   ( e   =   1 , 2 , , n ) σ max σ γ ,
where p is the unit relative density, u is the displacement matrix, K is the stiffness matrix, F is the external load, V is the optimized structure volume, n is the total number of design variables, V 0 is the volume of the initial structure, μ 0 and μ 1 are 0.99 and 0.3 respectively, σ max is the maximum von Mises stress, and σ γ is the yield strength of the material.
In each iteration of the topology optimization, sensitivity analysis guides material distribution by evaluating the effect of density changes on the objective function [35]. The sensitivity number is the gradient of the objective function (2) with respect to the design variable p e for each element and can be formulated as:
F p e = α 1 c max c min c p e + ( 1 α ) 1 m max m min m p e ,
where c p e = u T K p e u = p p e 1 u e T K e u e ,   m p e = v e .
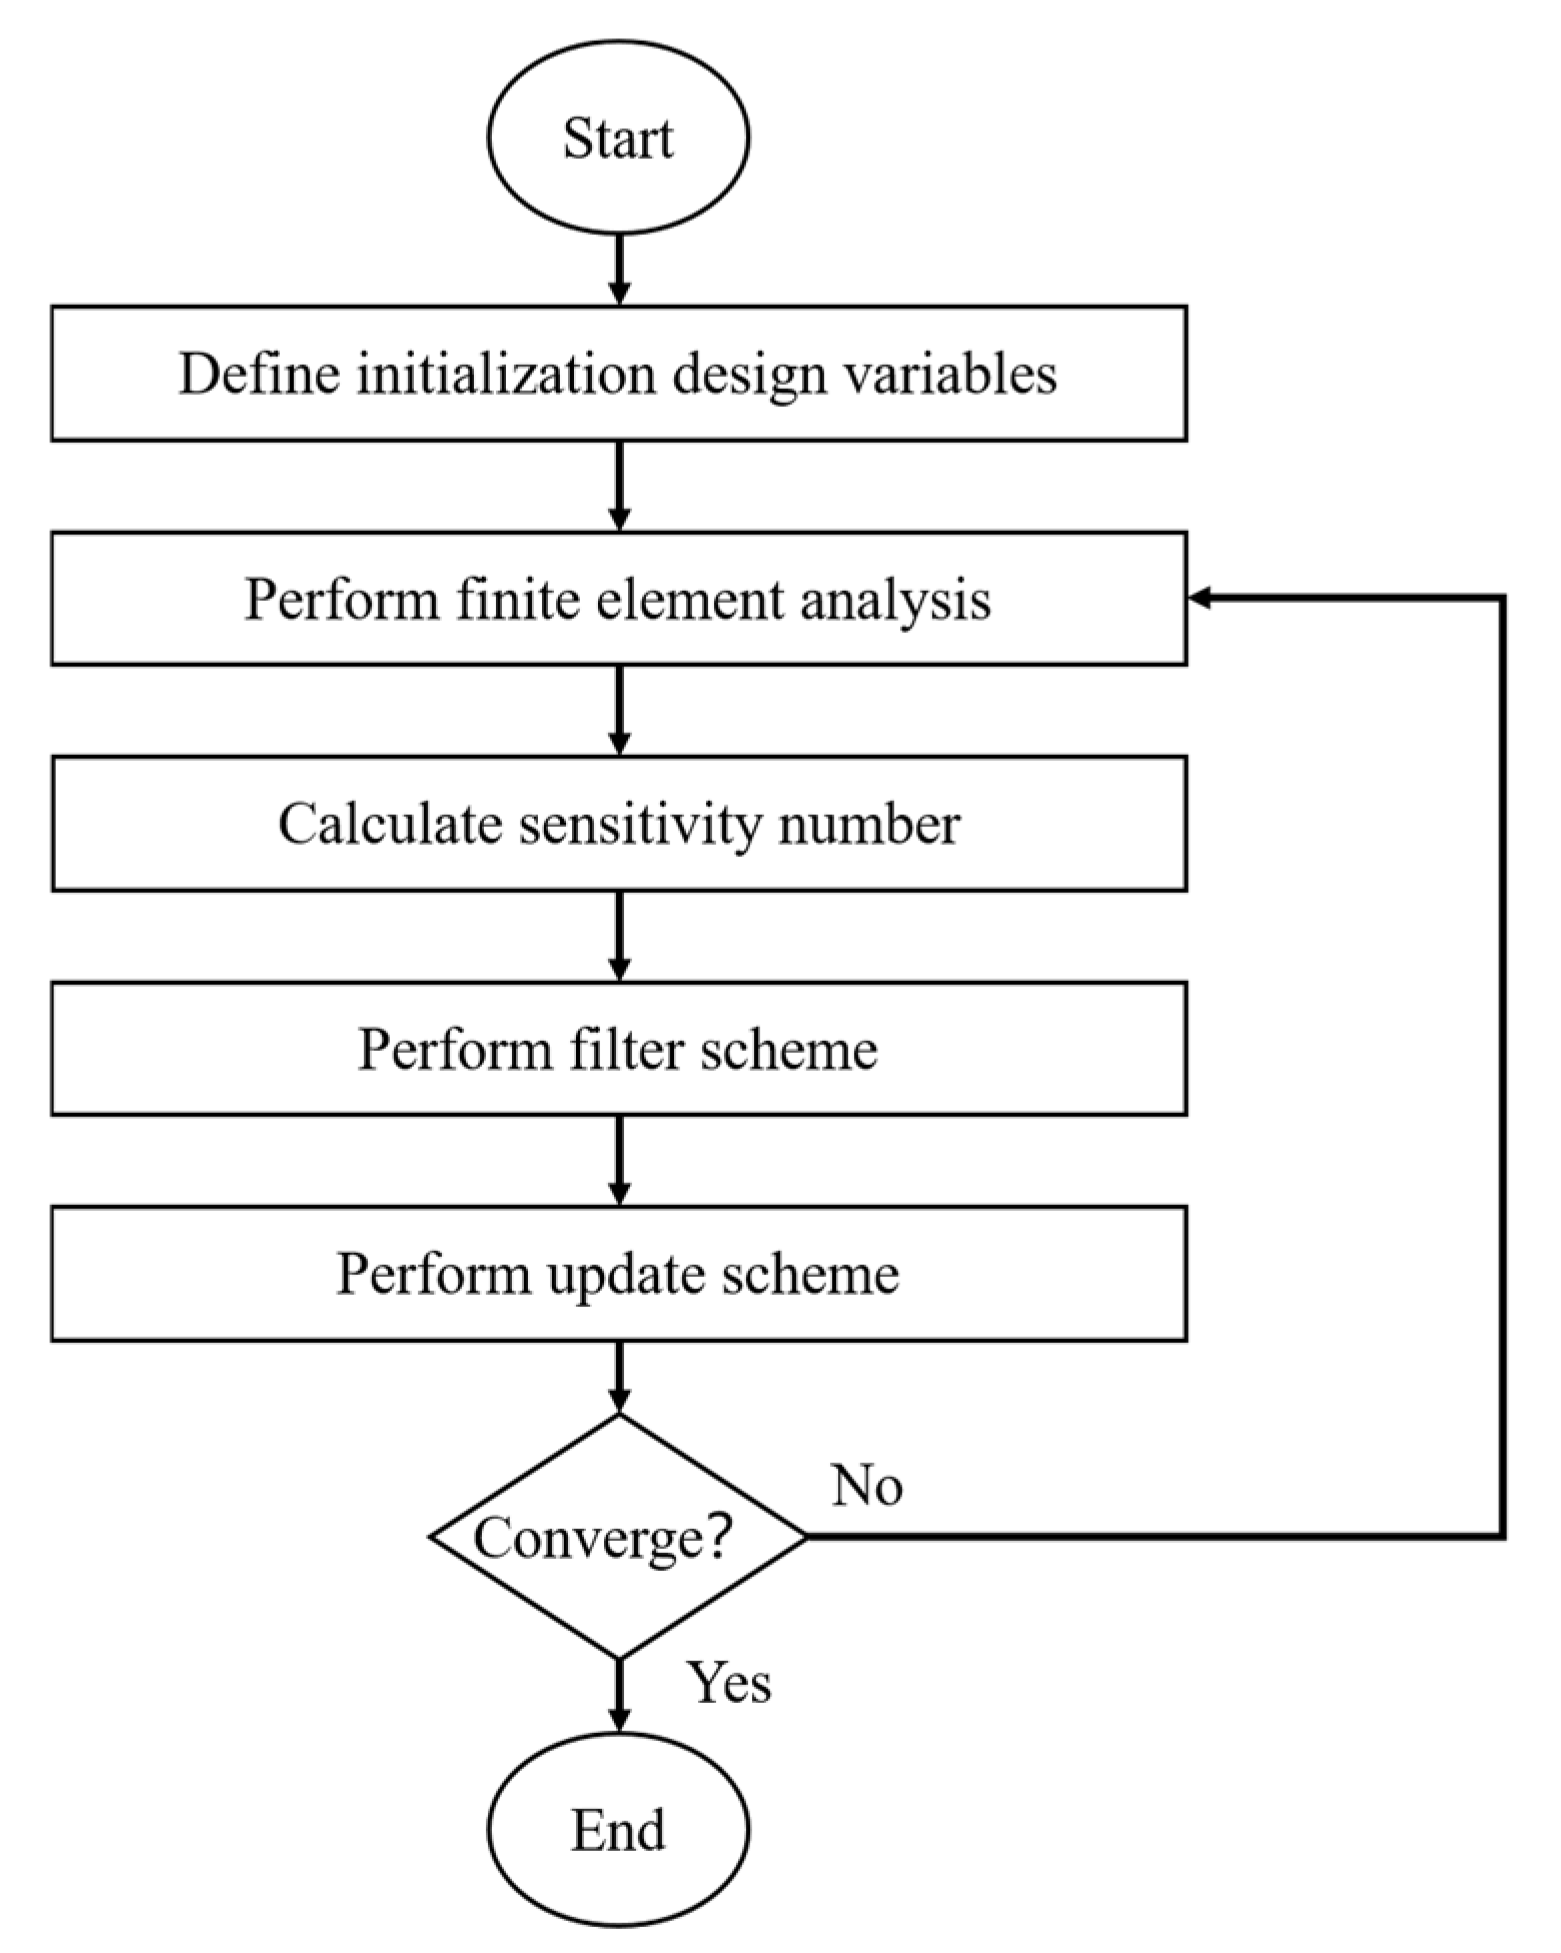
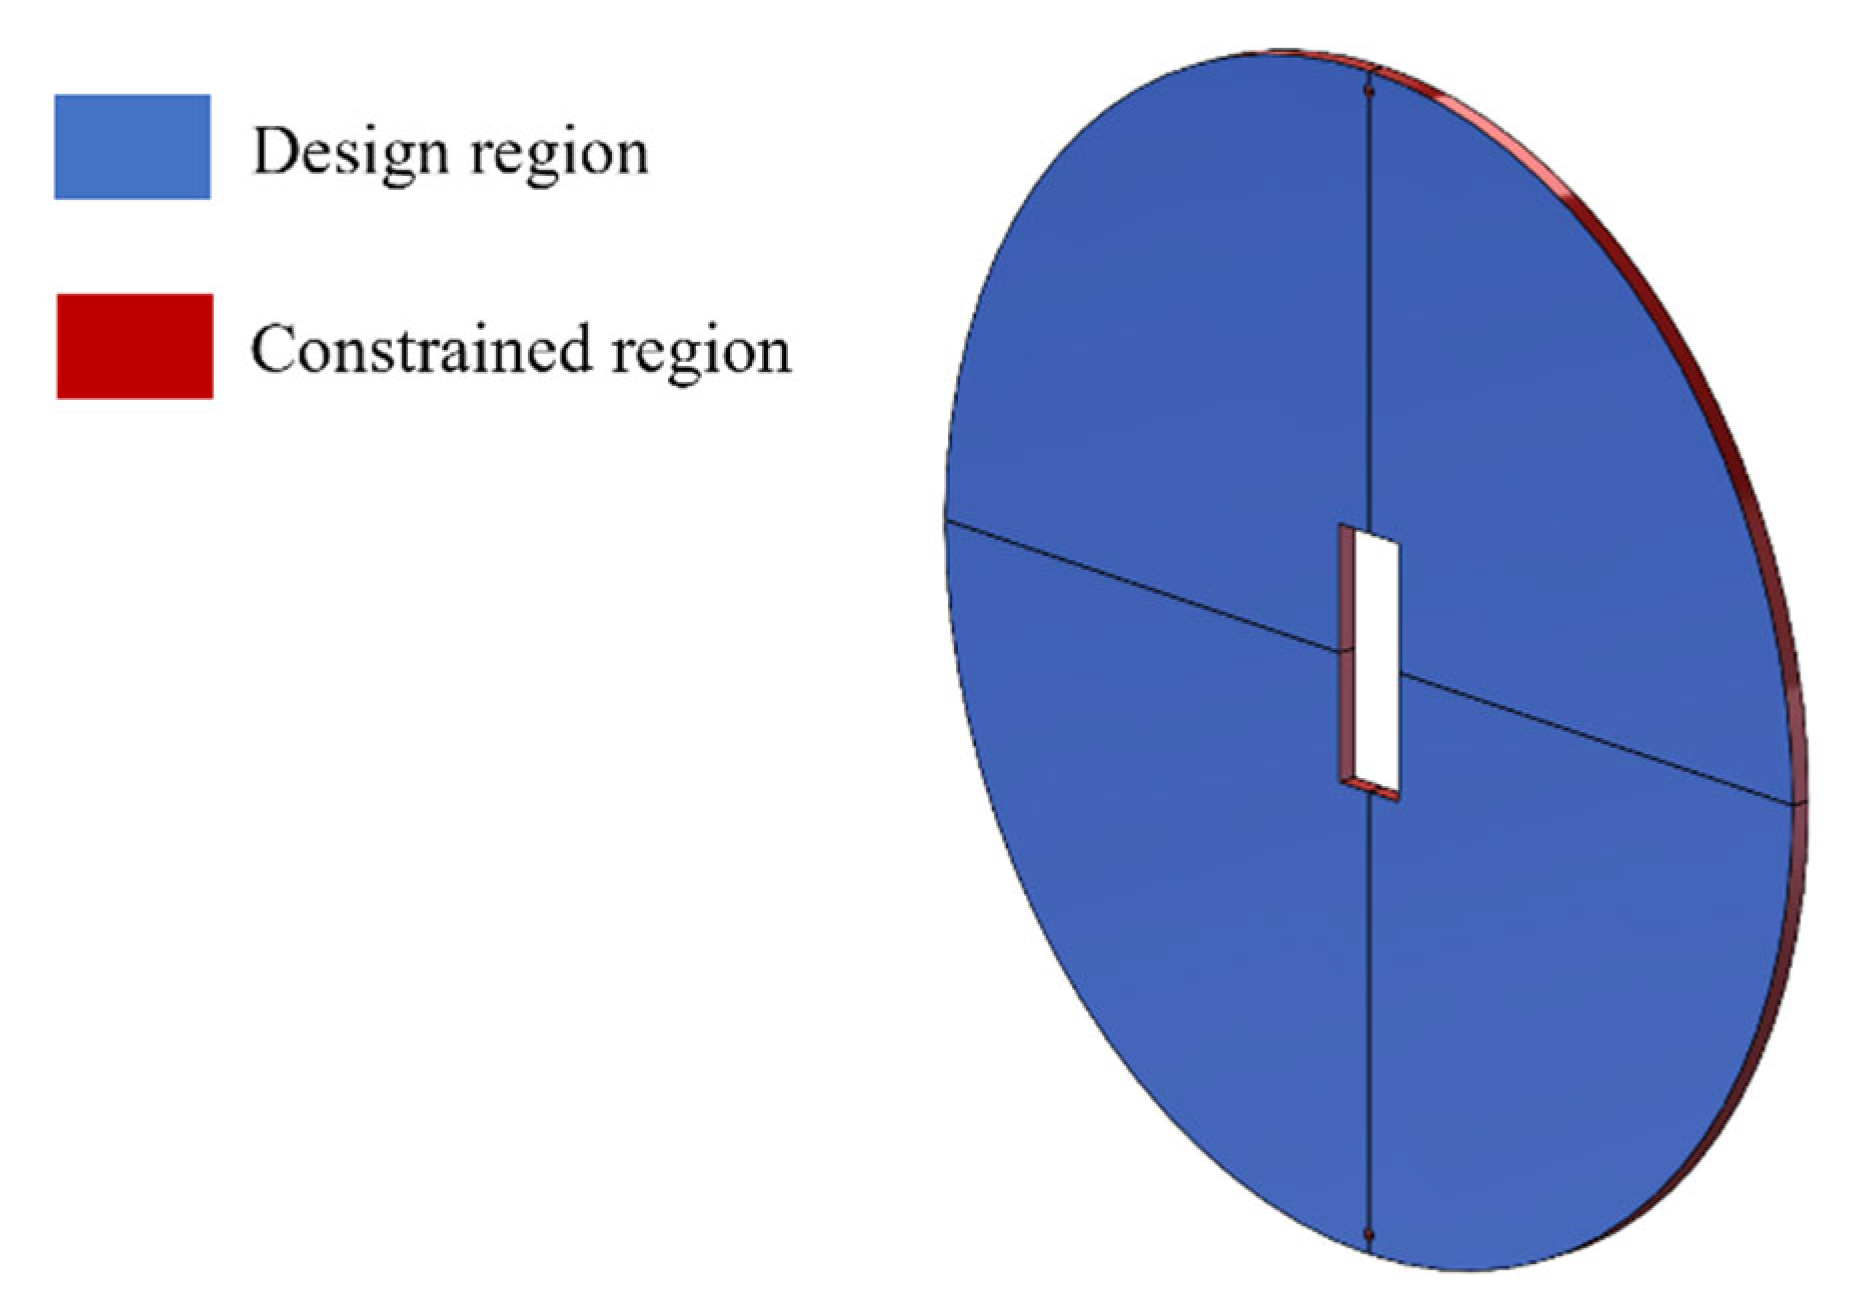
The flowchart of the topology optimization procedure used in this study is given in Figure 5. The first step is to define initial design domain and boundary conditions as illustrated in Figure 6. The loads are applied on the surface of the constrained region. Then, the global stiffness matrix is calculated and the displacement field are solved by Finite Element Analysis (FEA) to evaluate the mechanical properties of the structure. The partial derivatives of the objective function with respect to p e are derived through sensitivity analysis. Then, a density filtering technique is introduced to ensure the smoothness and mesh independence of the solution, and the design variables are updated using an optimization algorithm. The iterative process ends when the convergence condition is satisfied, and the final output is an optimized structural design that satisfies the constraints.

3.4. Boundary Conditions for Spacer Ring Structures

To facilitate structural topology, the design region is initially determined. This region is then adjusted based on constraints to optimize mechanical properties. The spacer ring is fixed by screws through top and bottom holes, which constrains its position. The stress constraint is set to 54.6 MPa. The constraints on the spacer ring are shown in Figure 6.

3.5. Topology Optimization Resulting Configurations

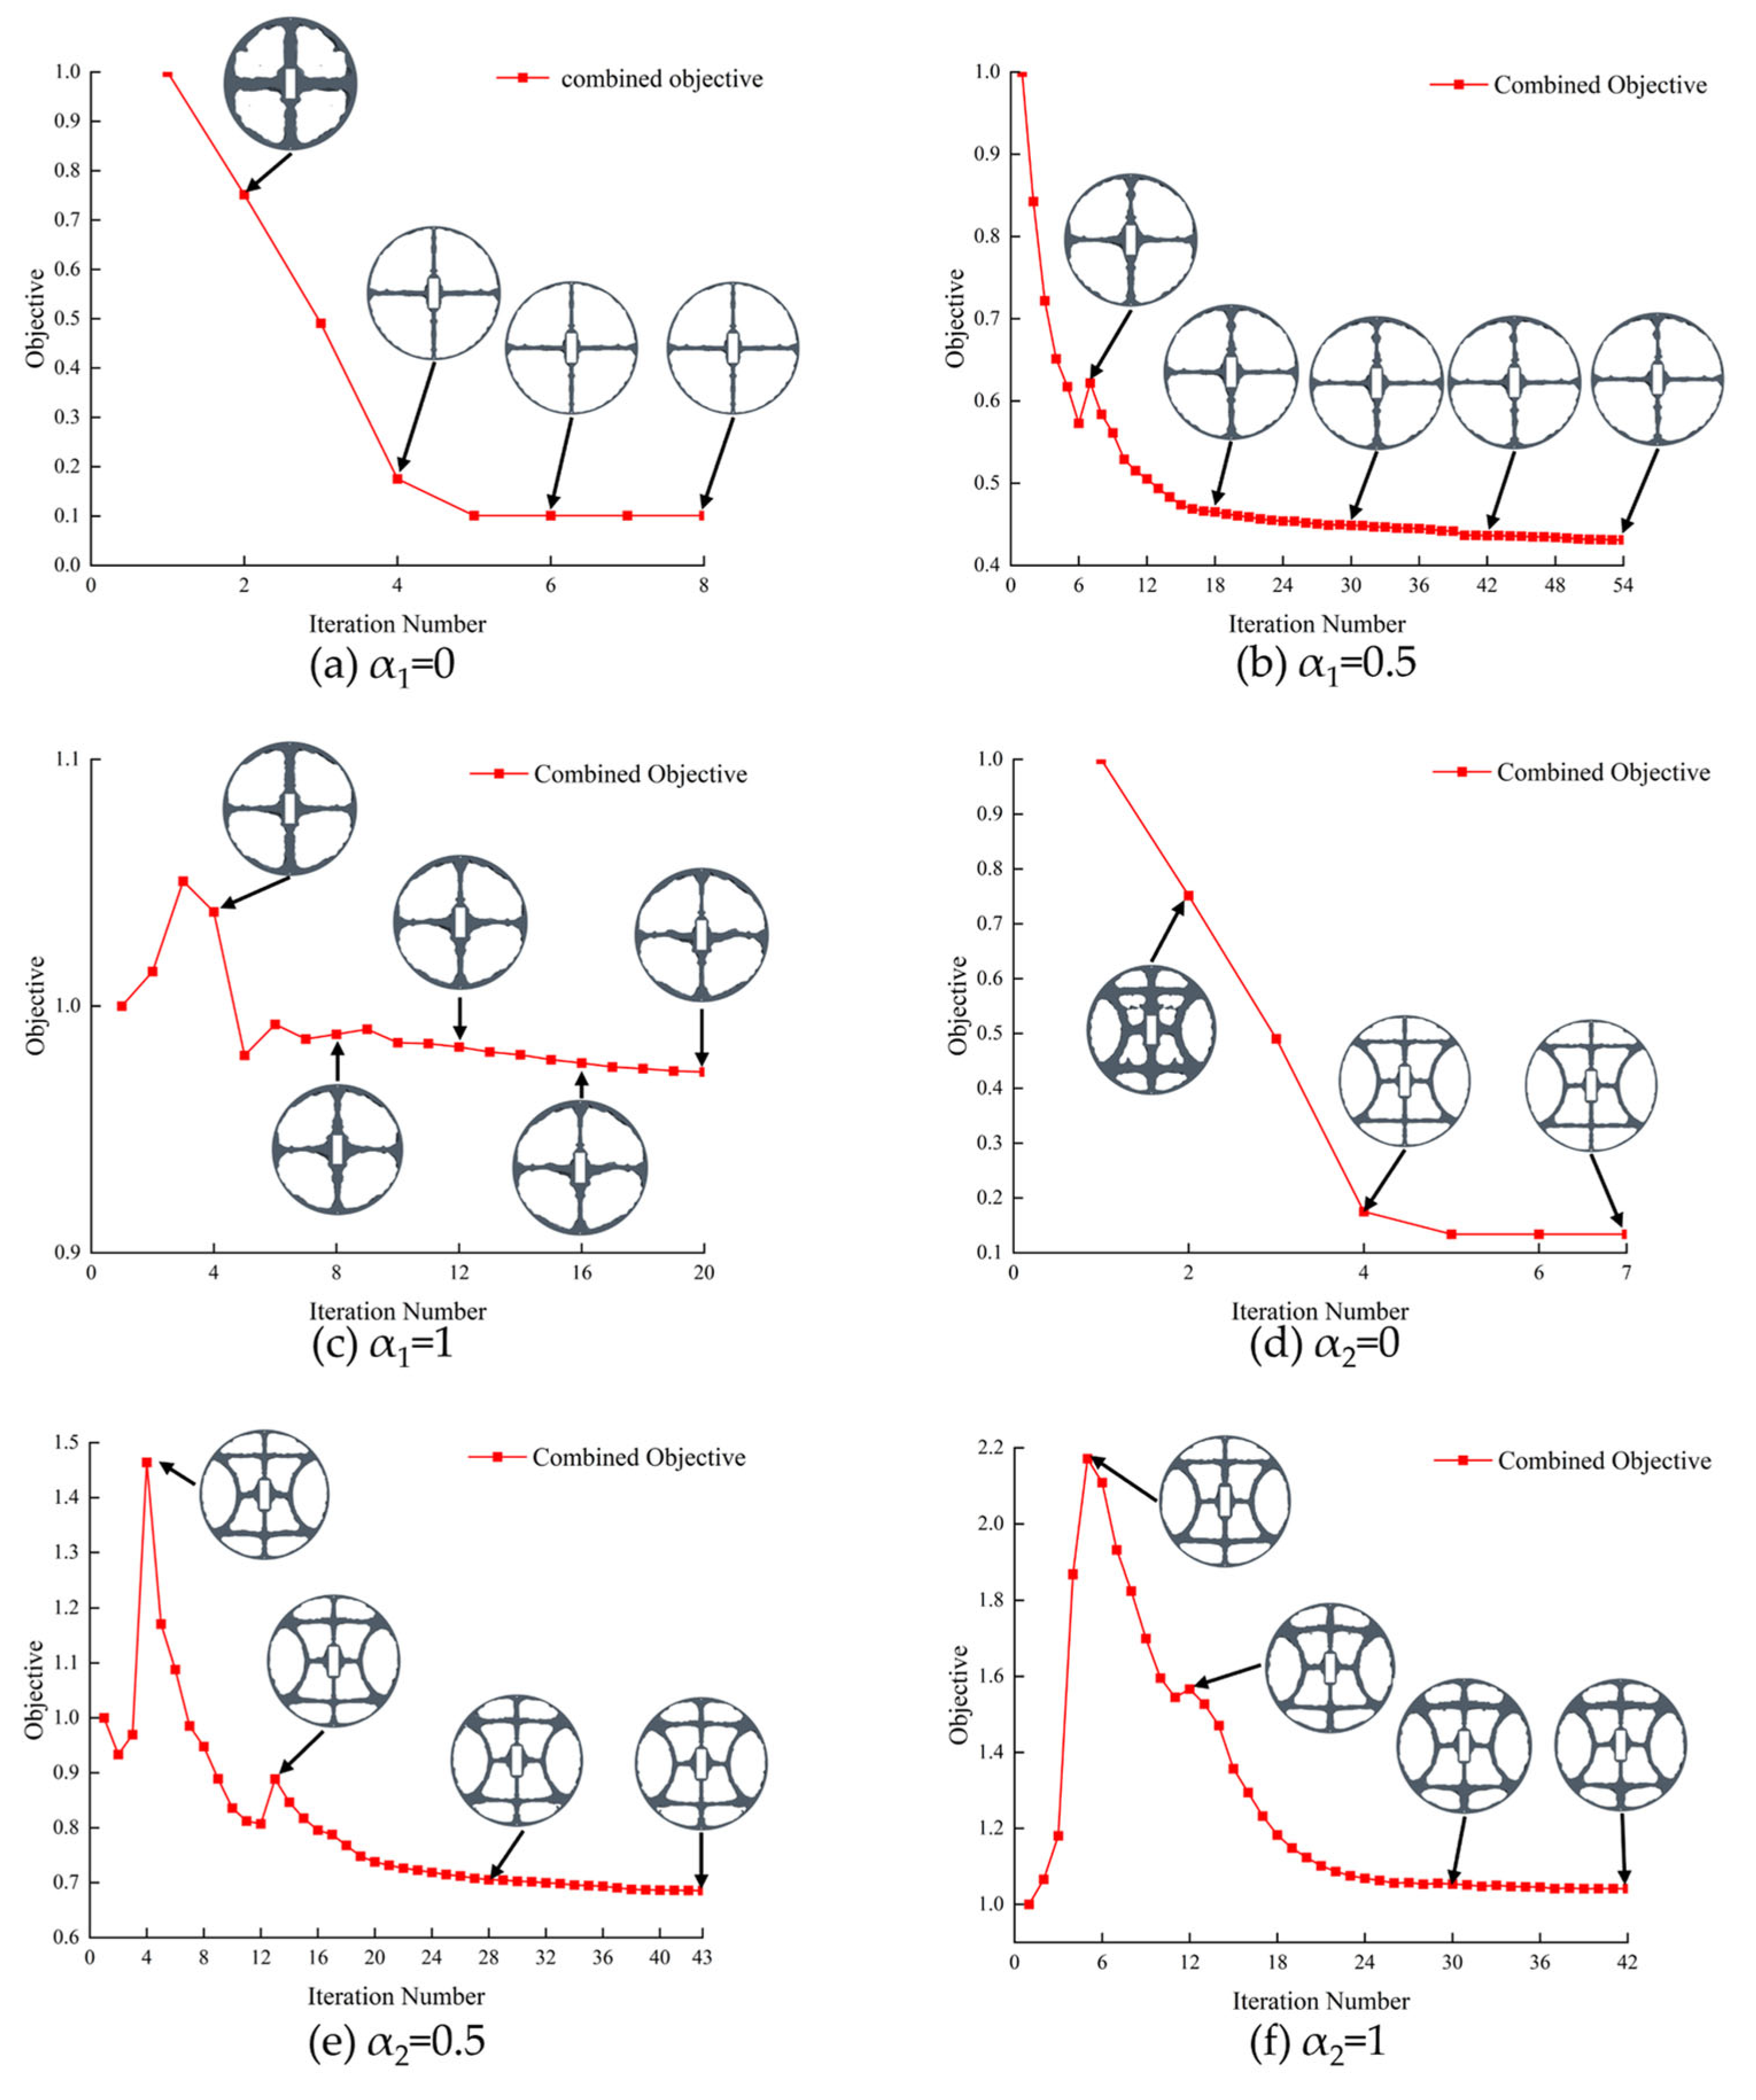
The topology optimization results at specific iterations can be observed in Figure 7. Figure 7 shows the iterative results for the minimization process of the objective function value, where α1 and α2 are weighting coefficients under different constraint conditions. The topology optimization results for the spacer ring at several specific iterations are also given in Figure 7. At α1 = 0, it can be observed that the topology optimization result for the spacer ring does not change significantly after the 4th iteration. At α1 = 0.5, the topology optimization result for the spacer ring does not change significantly after the 15th iteration. At α1 = 1, the topology optimization result for the spacer ring does not change significantly after the 12th iteration. At α2 = 0, it can be observed that the topology optimization result for the spacer ring does not change significantly after the 4th iteration. At α2 = 0.5, the topology optimization result for the spacer ring does not change significantly after 20 iterations. At α2 = 1, the topology optimization result for the spacer ring does not change significantly after 24 iterations. The black and white of the material layout denote solid and void elements, respectively.
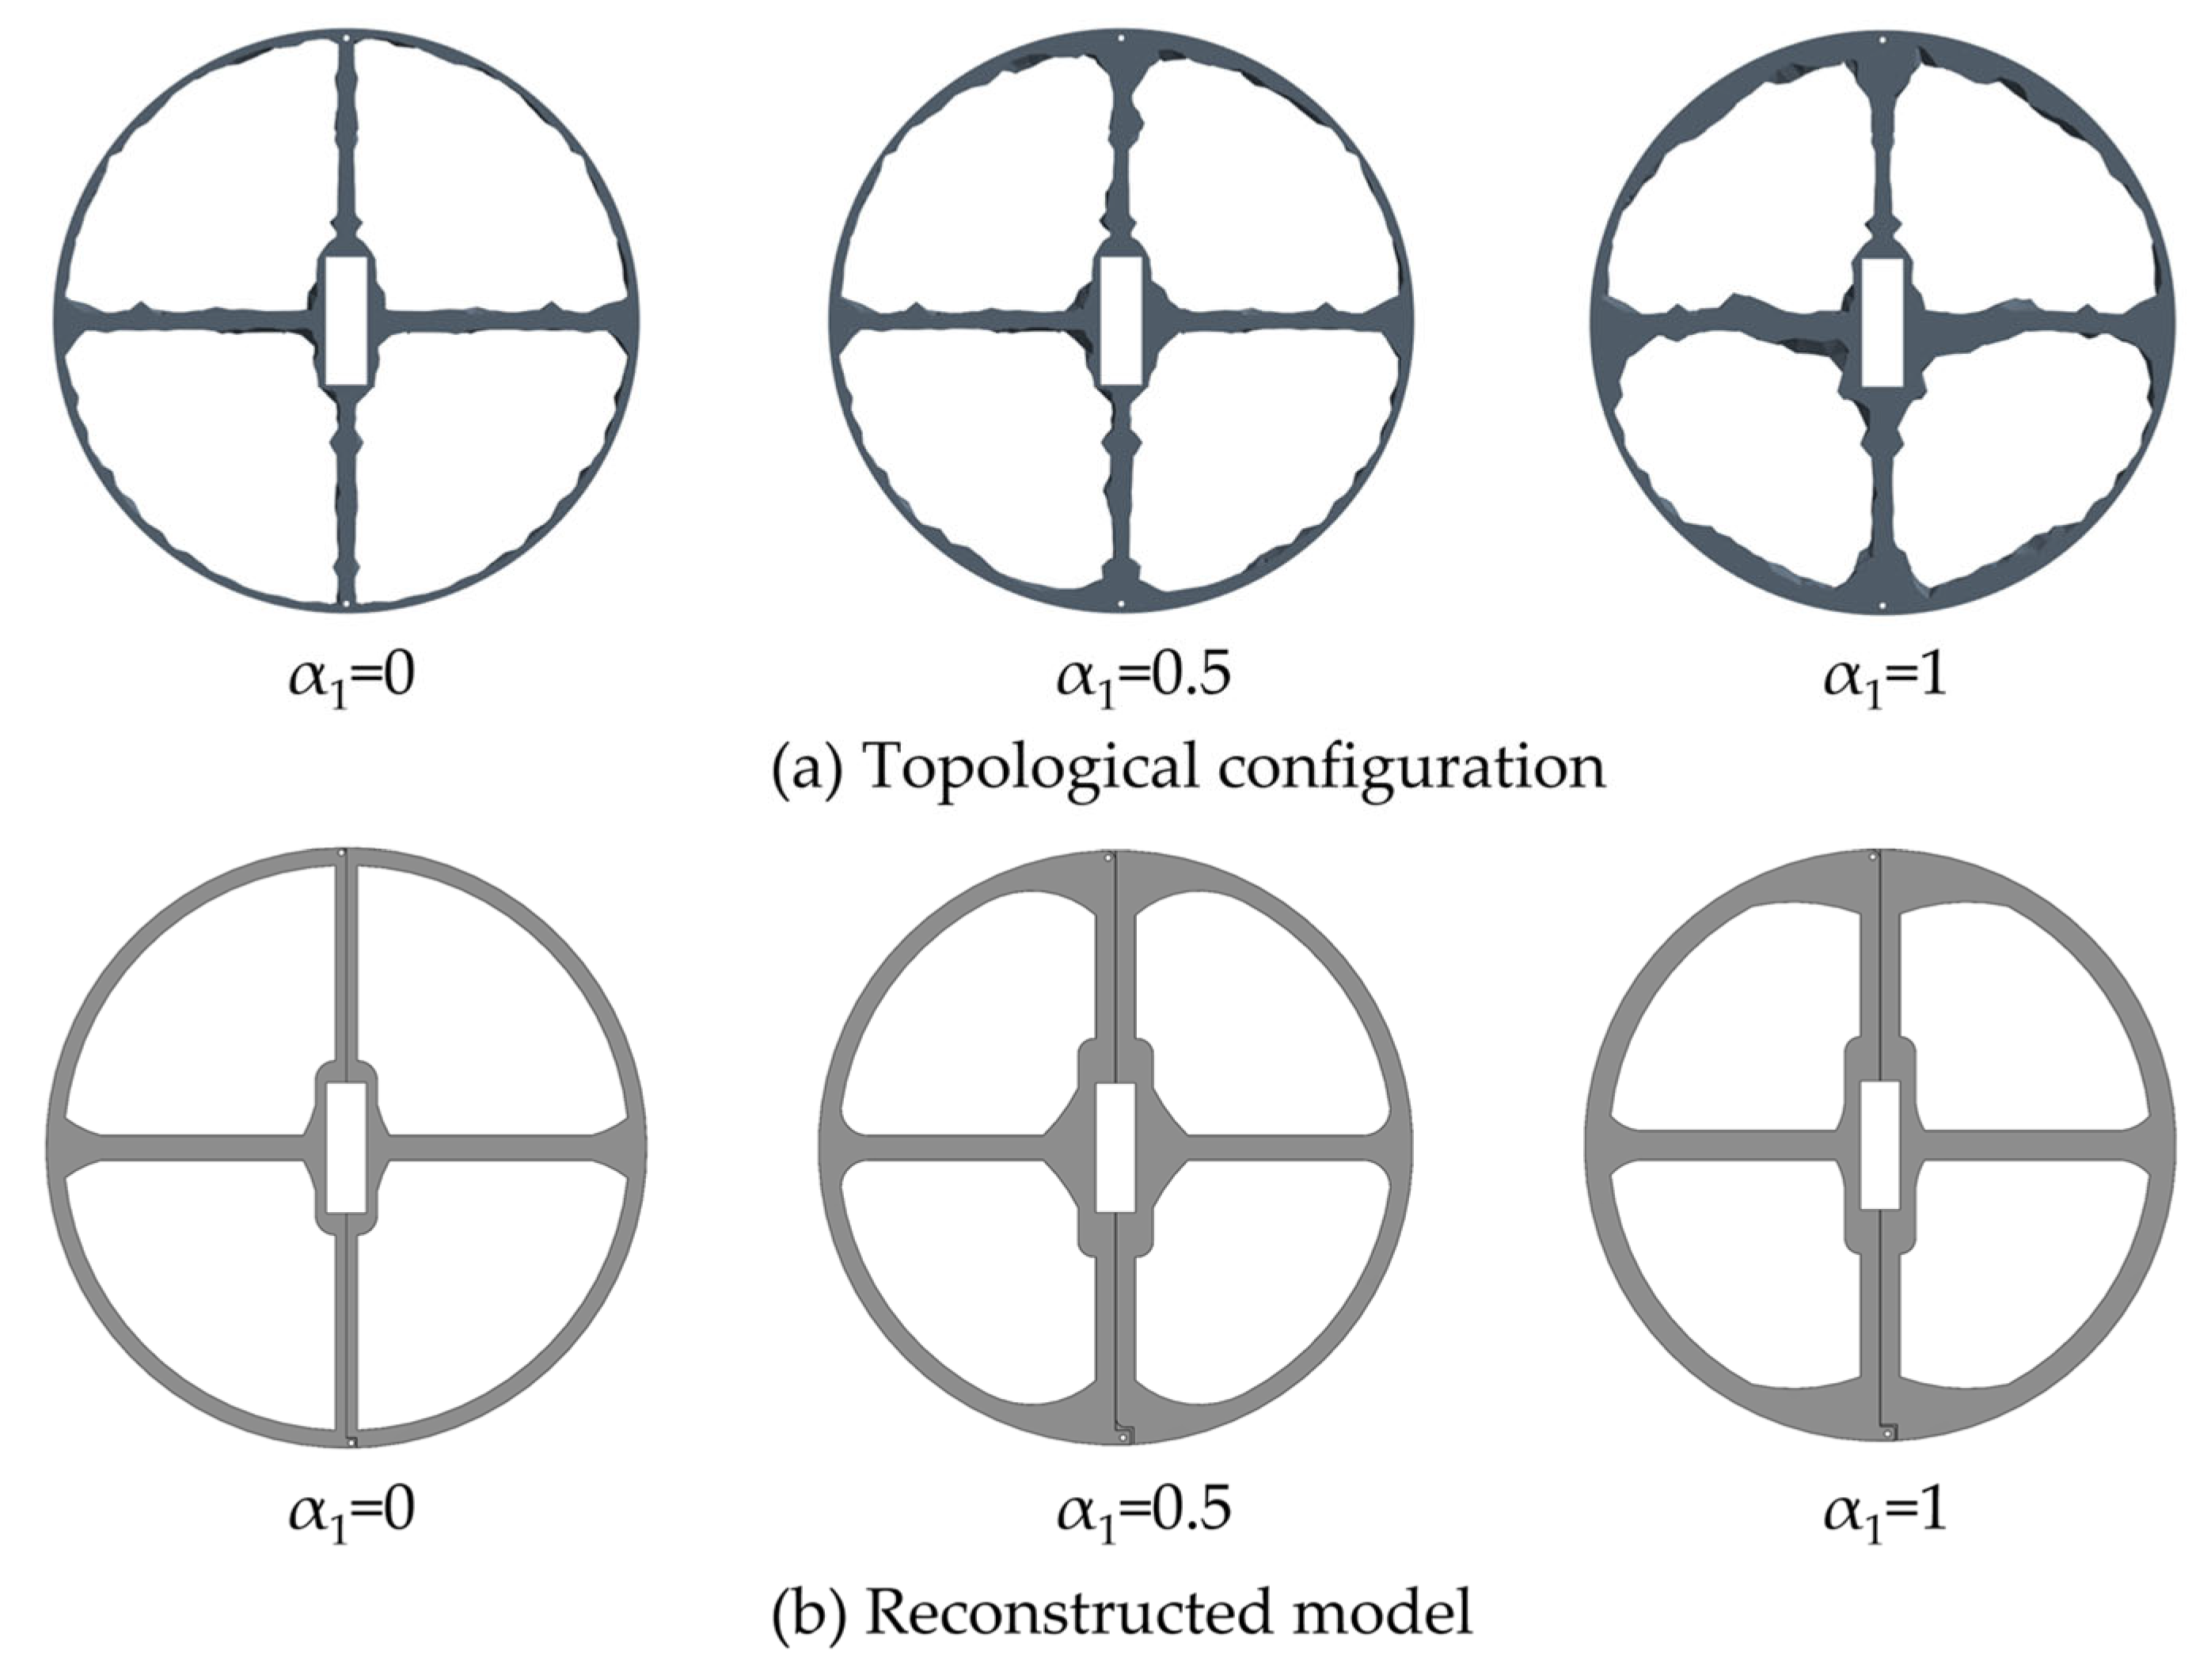
The topological results and reconstructed models with different weighting factors are shown in Figure 8 and Figure 9, where α = 0 and α = 1 are equivalent to single-objective optimization, respectively. When α = 0.5, the stiffness and mass of the spacer ring are taken into account at the same time. The optimized results of α1 form a continuous frame connection and an approximate fan-shaped blank region. The optimized result of α1 = 0.5 shows increased fan-shaped regions at the top and bottom compared to α1 = 0, resulting in enhanced stiffness of the structure. The optimized result of α1 = 0.5 shows a larger inner radius compared to α1 = 1, leading to a lower mass of the structure. The optimized results of α2 show a continuous, approximately square internal structure. Compared to the result of α2 = 0, the optimized result of α2 = 0.5 reduces the void region within the approximately square region, thereby enhancing the structural stiffness. The optimized result of α2 = 0.5 shows a larger inner radius compared to α2 = 1, leading to a lower mass of the structure. The optimized structure at α2 = 0.5 features a reduced solid region in its top, central, and bottom parts compared to α2 = 1, thereby reducing the structural mass. Multi-objective topology optimization can well synthesize the characteristics of each single-objective topology optimization result, and the topology optimization result of the structure is more reasonable.

4. Spacer Ring Performance Simulation Analysis

4.1. Static Analysis of the Spacer Ring

4.1.1. Deformation Characteristics and Stress Distribution of Spacer Ring at Different Applied Force Angles

In this experiment, ANSYS simulation software is used to analyze and study the total deformation and stress distribution of the initial spacer ring at different applied force angles. In the simulation, tetrahedral elements are selected for meshing because this type of element is suitable for complex geometries. The magnitude of the force is set to be 1000 N. The forces are applied at 0°, 45°, and 60°, which are the angles measured from the negative X-axis toward the negative Y-axis. Under each applied force angle, static analysis is performed to obtain the stress distribution, deformation and possible stress concentration region.
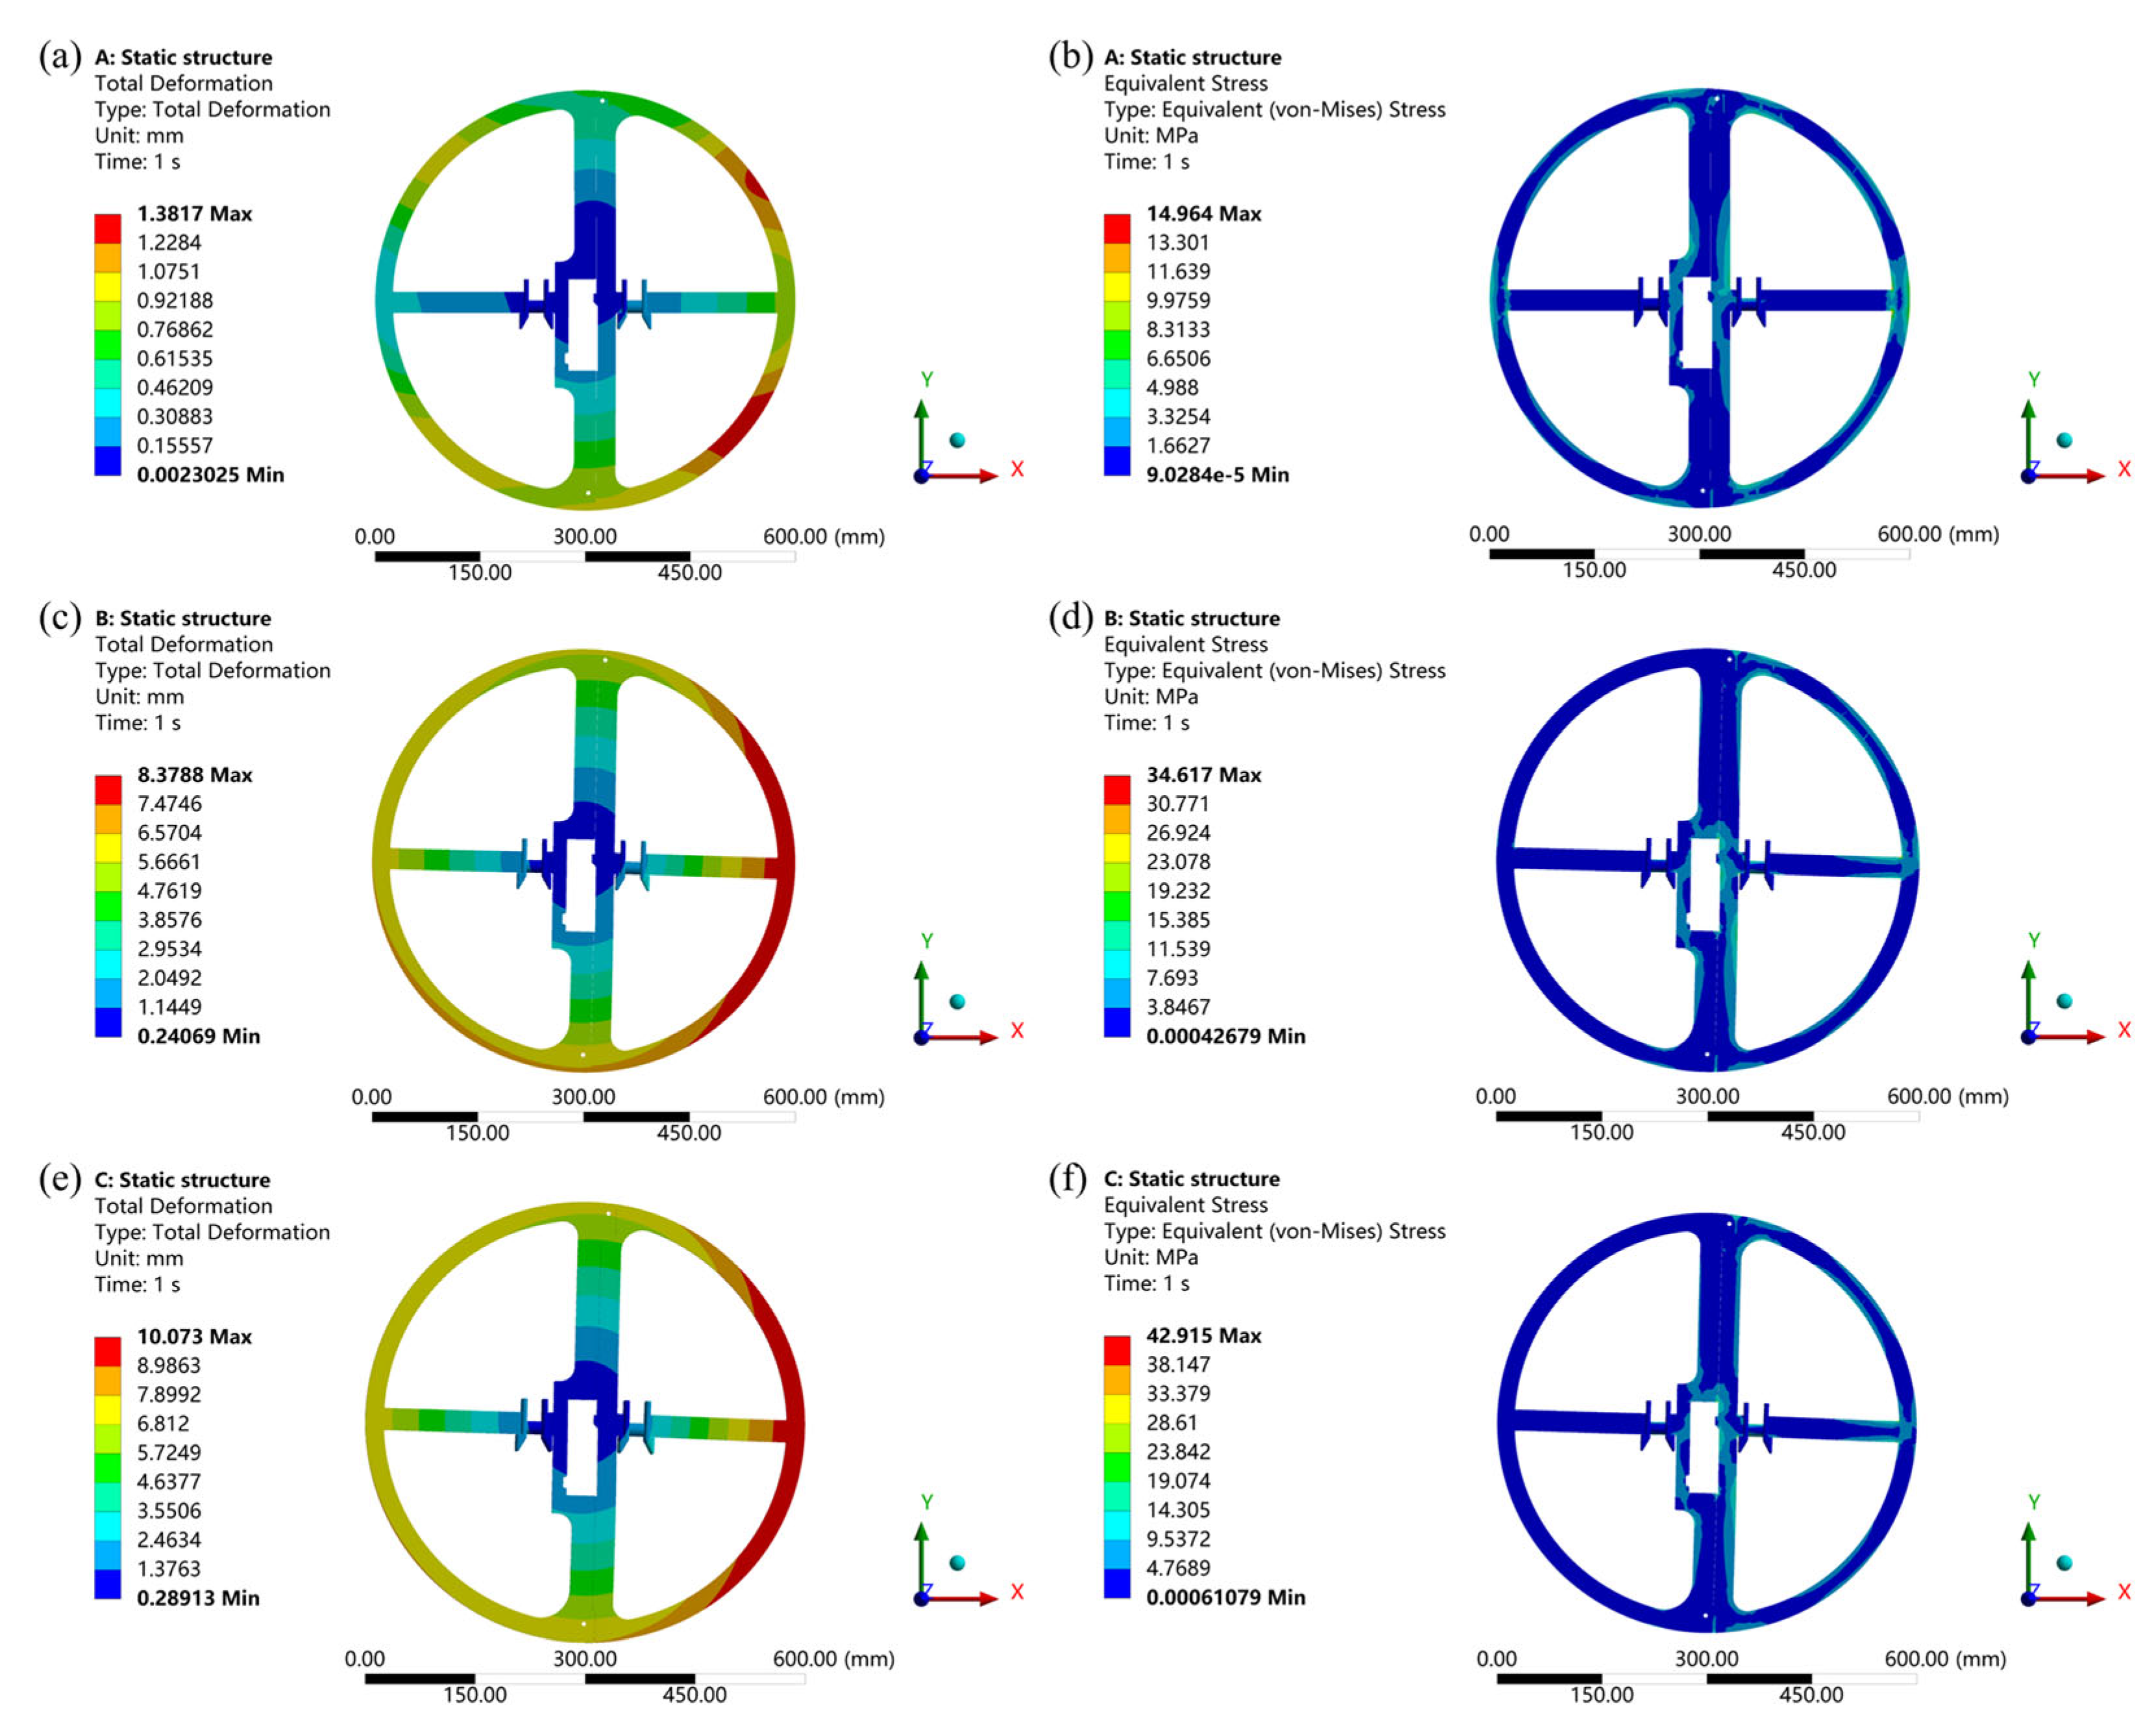
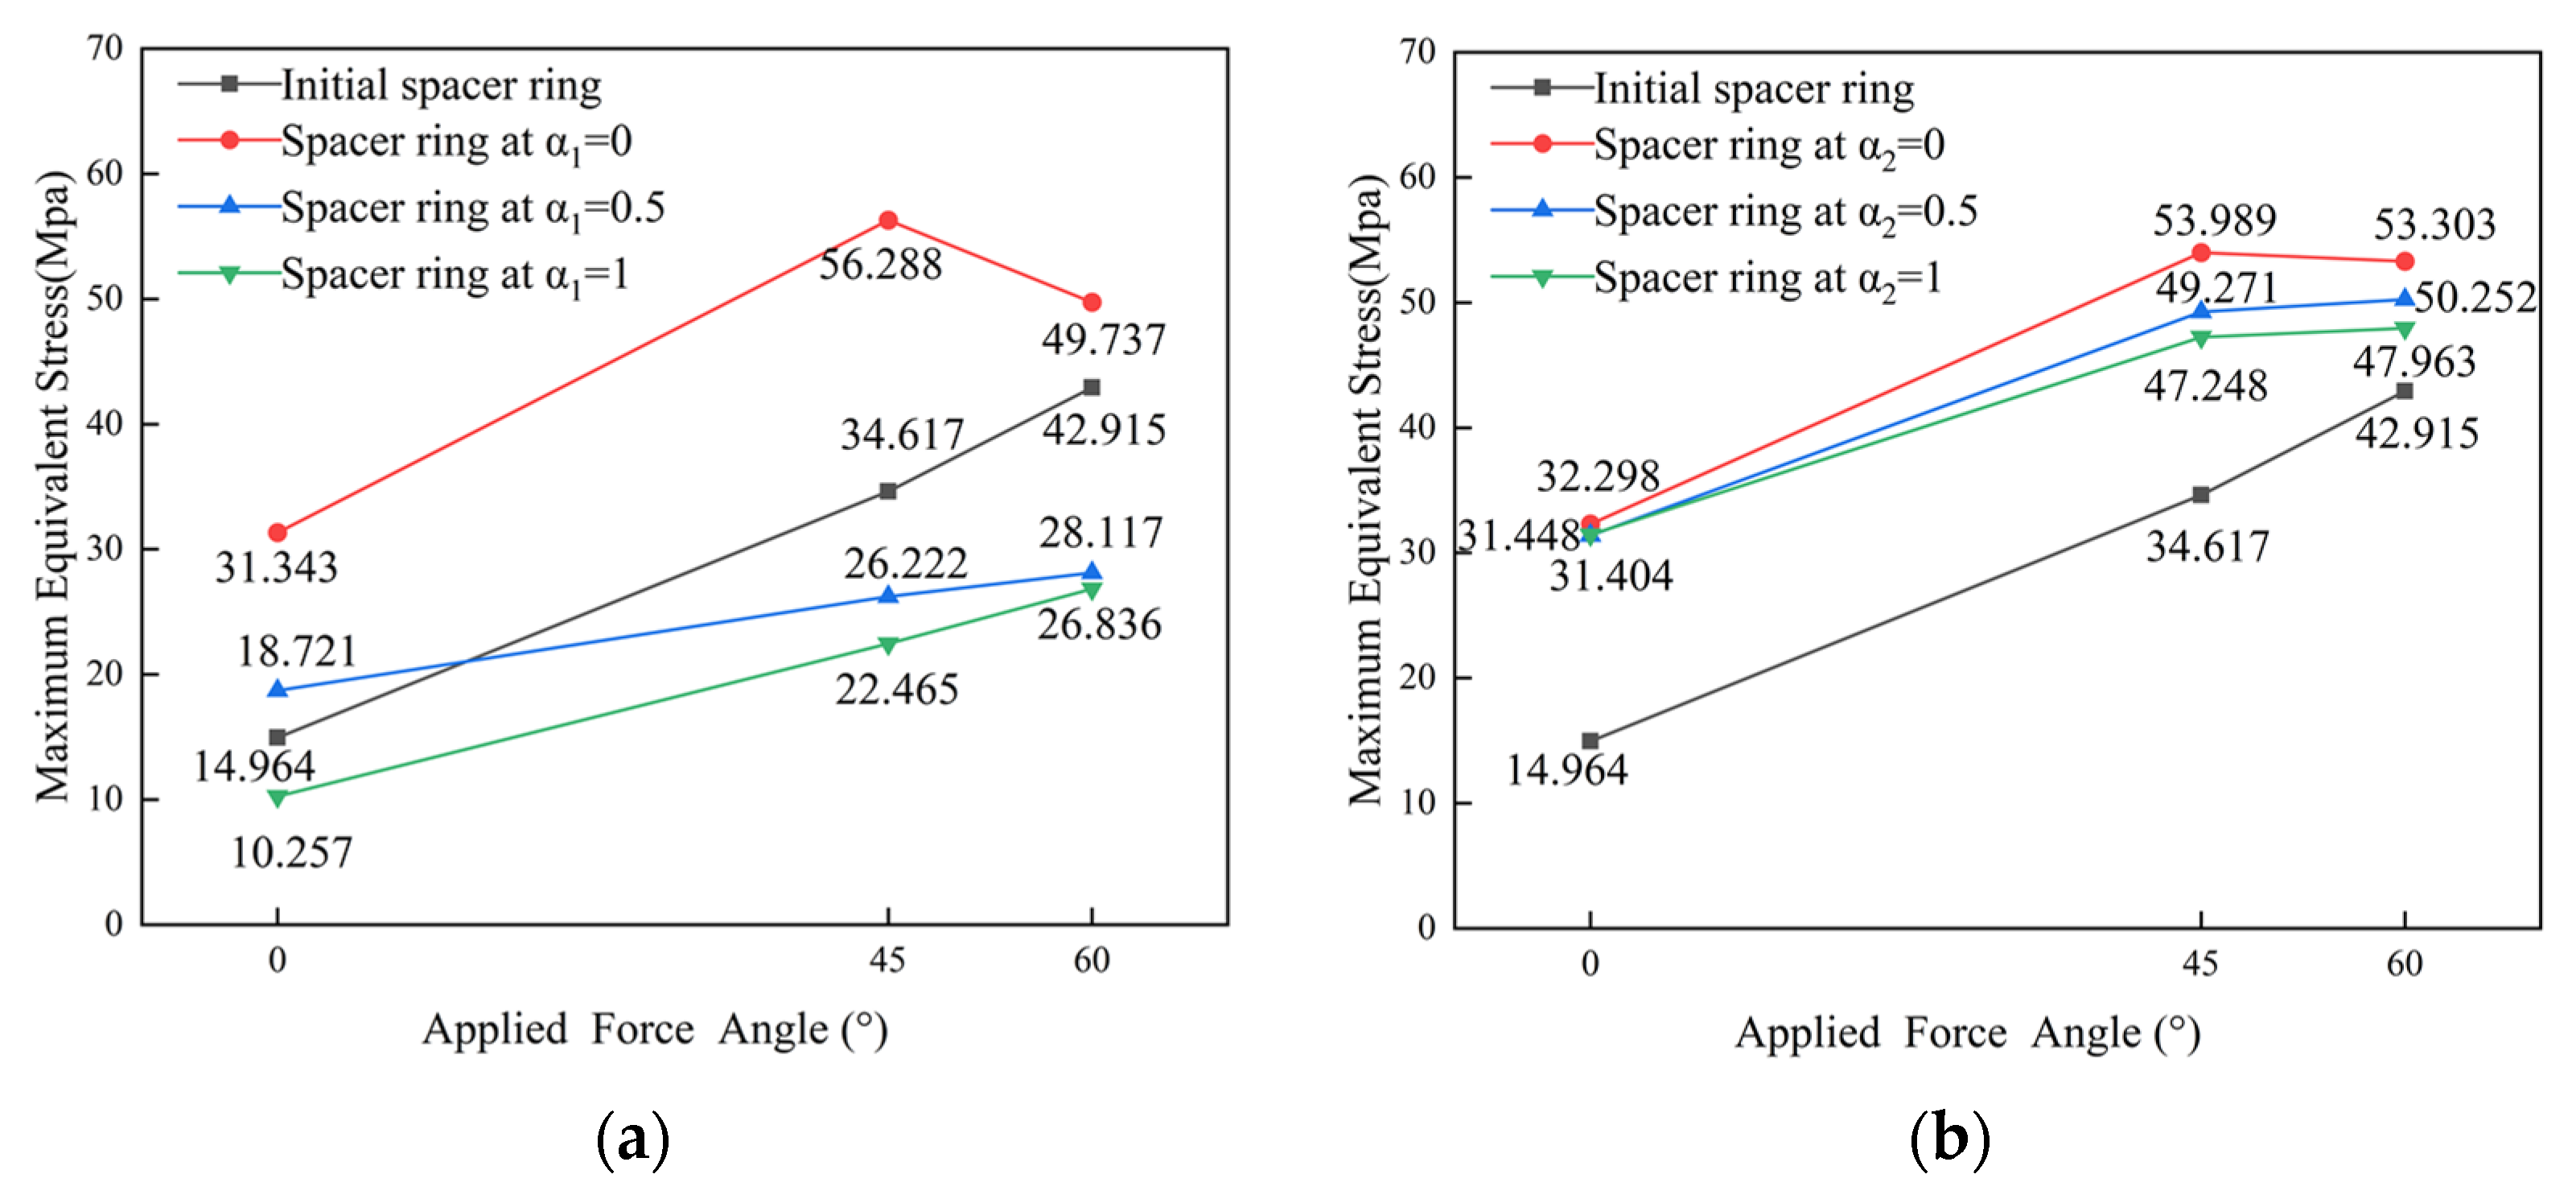
From Figure 10, it can be seen that the maximum equivalent stress and the total deformation of the spacer ring increase as the angle increases. The stress concentrations were primarily localized around the spacer ring locking device. Moreover, as the angle increases, both the maximum equivalent stress and the total deformation of the spacer ring also increase. Based on the analysis of the initial spacer ring structure, the spacer ring structure is optimized, and the performance changes before and after the optimization are compared. As shown in Figure 11a, the maximum equivalent stress of most of the optimized structures is reduced compared to the initial structures. Compared to the initial spacer ring, the maximum equivalent stress of the optimized spacer ring for α1 = 1 showed reductions for all three loading angles. For α1 = 0.5, the maximum equivalent stress initially increased and then decreased compared to the original. Compared to the initial spacer ring, when α1 = 0, the maximum equivalent stress of the optimized spacer ring increases at 0°, 45° and 60°. This may be because when α1 = 0, the mass of the spacer ring decreases too much. This leads to a significant reduction in its solid region, which in turn increases its stress. For both the initial and optimized spacer rings with α1 = 0.5 and α1 = 1, the maximum equivalent stress consistently increased as the angle of applied force increased. As shown in Figure 11b, the optimized spacer ring shows higher maximum equivalent stress than the initial spacer ring under different applied force angles. The maximum equivalent stress at α2 = 1 is the lowest compared to α2 = 0 and α2 = 0.5. Under the α2 = 1 condition, the maximum equivalent stress at applied force angles of 0°, 45°, and 60° are 31.448 MPa, 47.248 MPa, and 47.963 MPa, respectively. When α1 = 0, the maximum equivalent stress is the highest among the conditions of α1 = 0, 0.5, and 1. Compared with the condition of α2 = 1, when α1 = 0, the maximum equivalent stresses increase by 19.13% and 3.69% at applied force angles of 45° and 60°, respectively, while the maximum stress decreases at 0°. Moreover, the spacer ring mass at α1 = 0 is lower than that at α2 = 1. Overall, the optimization results under condition α1 show lower maximum equivalent stress compared to those under condition α2.

4.1.2. Deformation Characteristics and Stress Distribution of the Spacer Ring in a Constant Direction

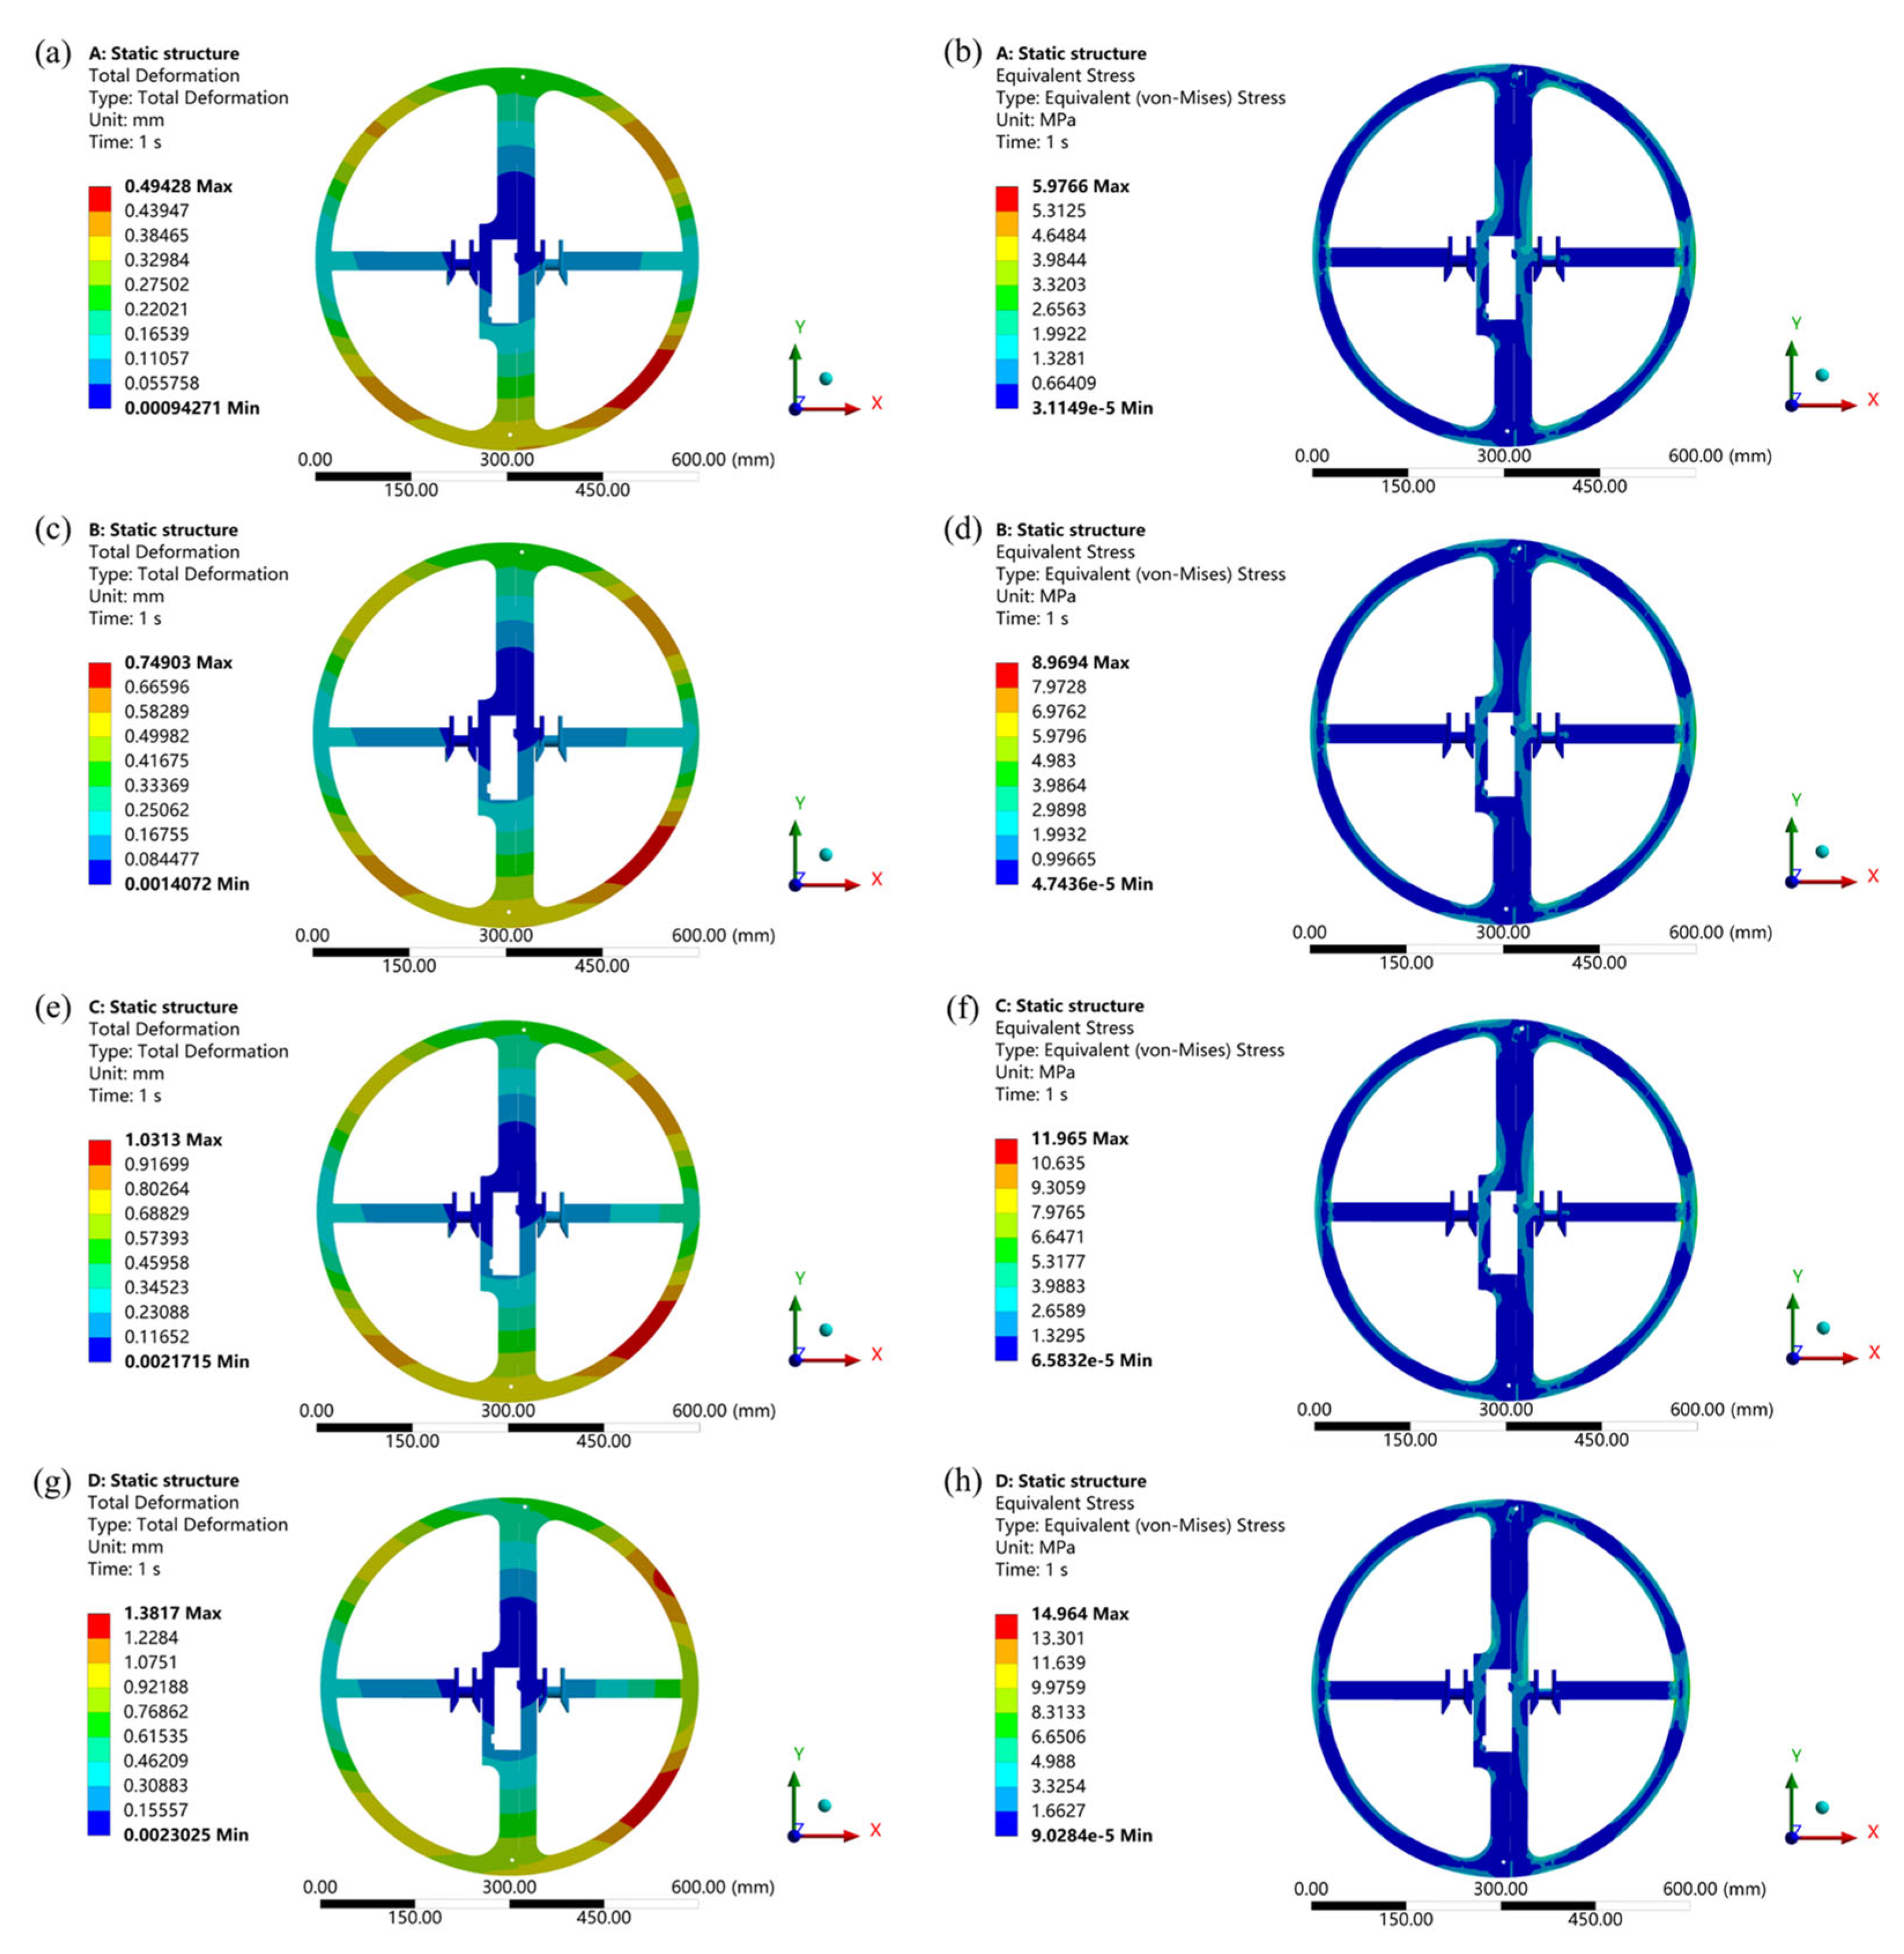
As shown in Figure 12, static simulations of the initial spacer ring are performed at different load levels, and the direction of applied force is 0°. Figure 12a,c,e,g illustrate the total deformation under 400 N, 600 N, 800 N, and 1000 N loads, respectively. Figure 12b,d,f,h correspond to the equivalent stress distributions under each load level. With increasing load, the total deformation of the spacer ring showed an obvious linear growth trend. This linear relationship indicates that the deformation behavior of the spacer ring is in accordance with the theory of elasticity in the load range studied. In terms of equivalent stress, the maximum equivalent stress increases as the load increases. Under a load of 1000 N, the maximum equivalent stress in the spacer ring remained below the yield strength of the epoxy resin (54.6 MPa), indicating that the spacer ring does not undergo plastic deformation at this load level. From the perspective of stress distribution, stress concentration mainly occurs in the edge and central regions of the spacer ring. These regions are often the structural weak points, which can lead to localized damage or fatigue failure of the material.
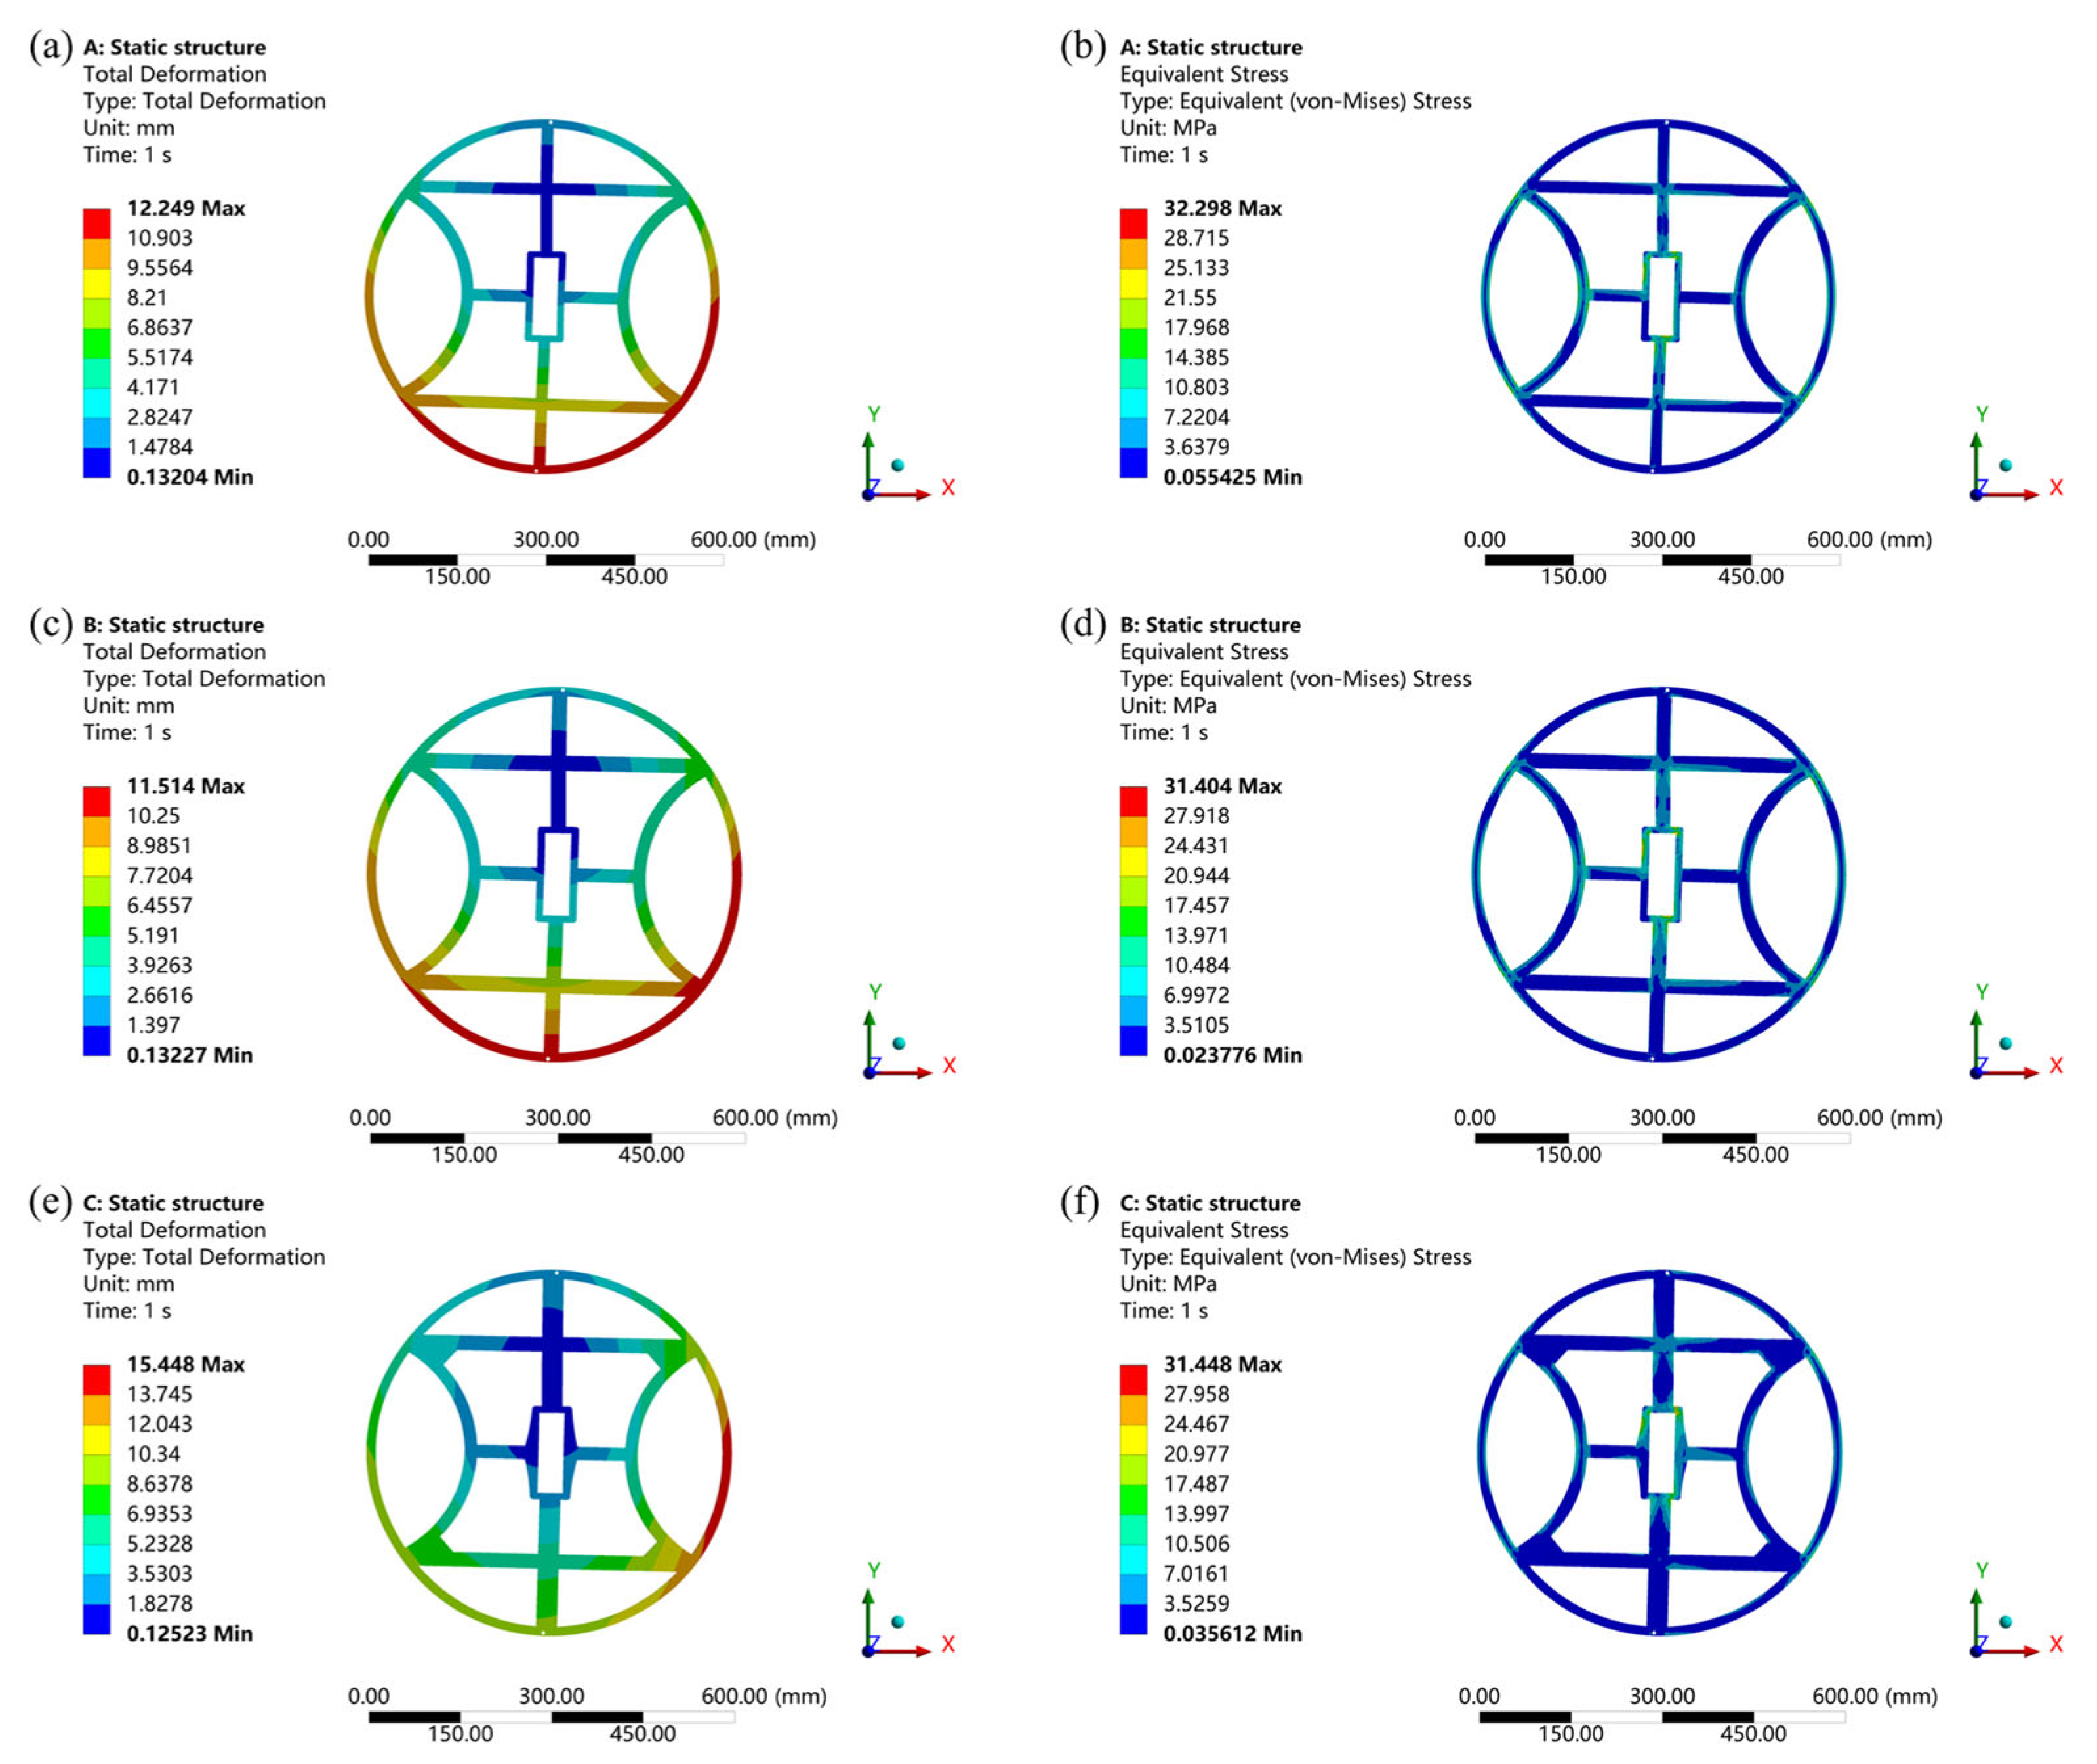
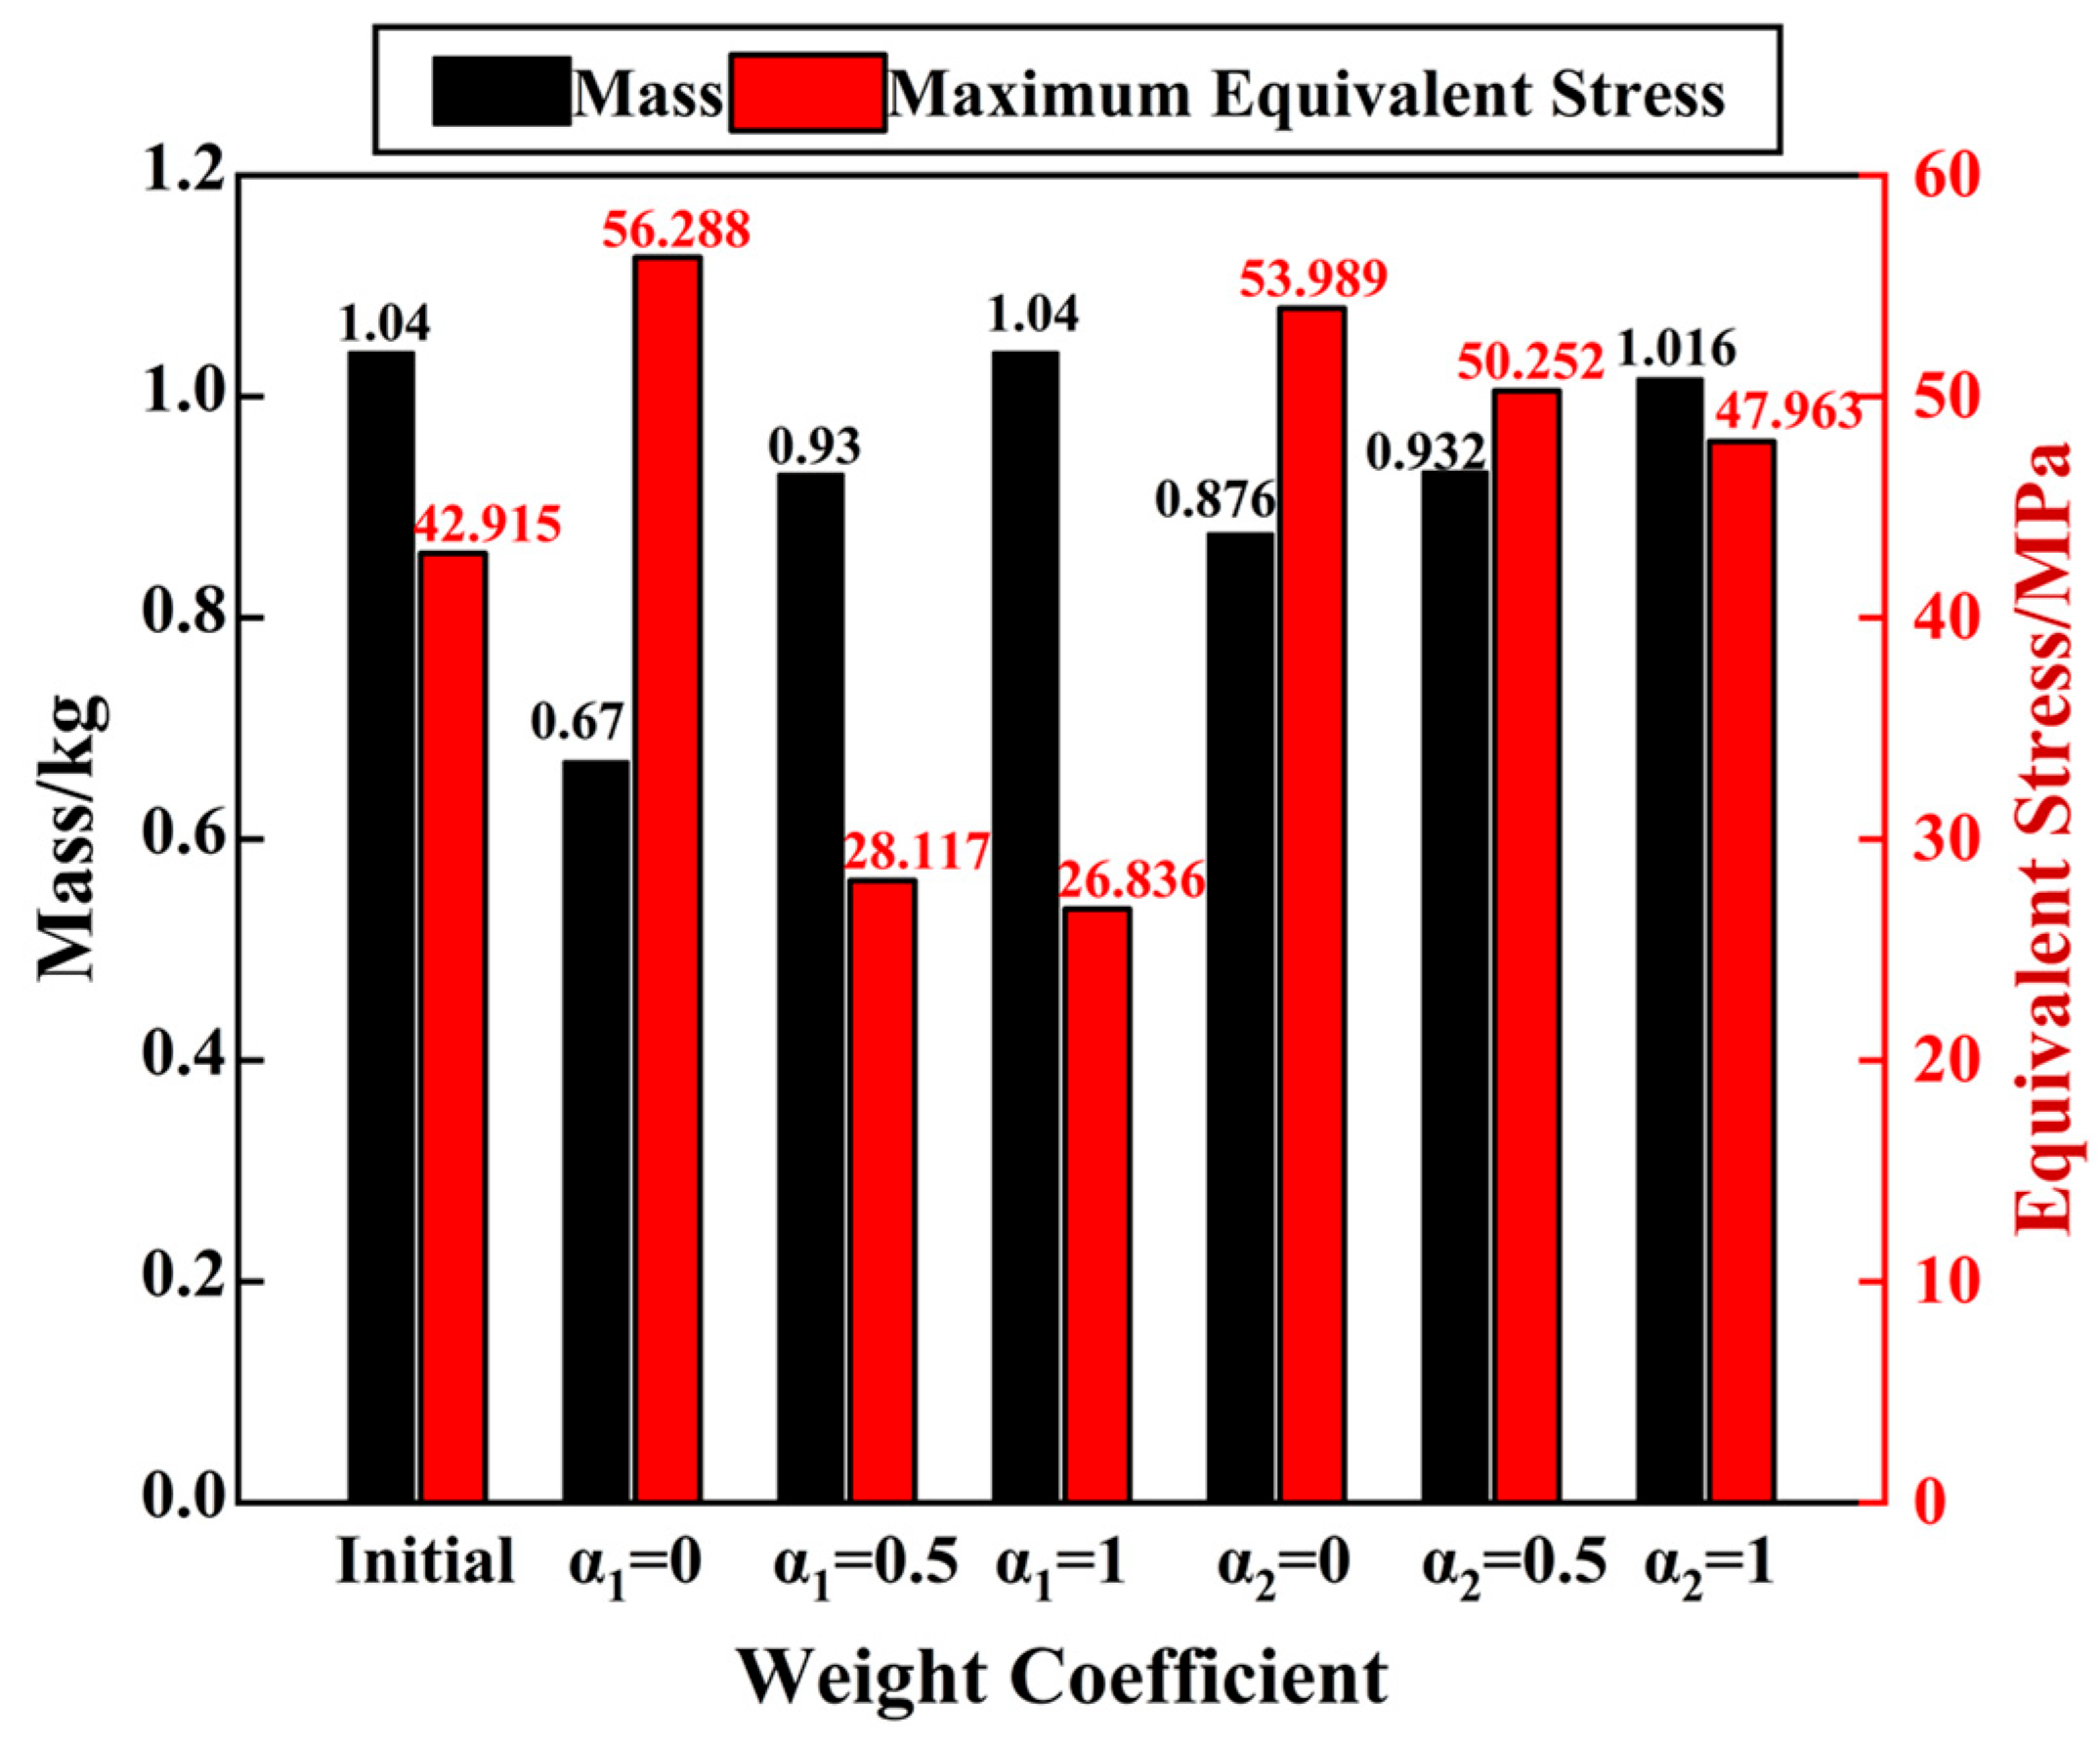
To evaluate the effectiveness of the optimization, the optimized structures are compared with the initial structure. Static analysis is conducted under a 1000 N load applied to the optimized spacer ring, and the results are shown in Figure 13 and Figure 14. Figure 15 shows the mass and maximum equivalent stress of the spacer ring before and after optimization. The maximum equivalent stress is the highest value among the equivalent stresses, which are obtained under loading angles of 0°, 45°, and 60°. Compared to the initial structure, the optimization results for both α1 = 0.5 and α1 = 1 show reductions in maximum equivalent stress. The maximum equivalent stress for α1 = 0.5 is higher than that for α1 = 1, since the optimization objectives of stiffness and mass are not separate when α1 = 0.5, and under the interaction of these two objectives, the structure may reduce mass in some places, which reduces the overall stiffness and increases the maximum equivalent stress. In comparison with the initial design, the spacer ring of α1 = 0 shows increased maximum equivalent stress and total deformation. This is due to its small mass, which reduces the structural strength. Compared to the initial structure, the optimization results for α2 = 0, 0.5 and 1 show increases in total deformation and maximum equivalent stress. These results contradict the objectives of structural optimization.
In conclusion, the optimization results under condition α2 do not meet the design objectives. For α1 = 0, although the optimized structure’s mass is reduced compared to the initial structure, it exhibits higher maximum equivalent stresses under different loading angles than those of the initial structure. For α1 = 1, the optimized structure retains the same mass as the initial structure, and thus fails to achieve the intended weight reduction. The optimized structure for α1 = 0.5 is considered optimal as it achieves a balance between mechanical strength and lightweight design. It shows a 34.4% decrease in maximum equivalent stress and a 10.5% decrease in mass compared to the initial structure. This optimized structure enhances stiffness while reducing its mass.

4.2. Spacer Ring Electrical Performance

As an important insulating component in power equipment, the electrical performance of spacer ring directly affects the operational stability and safety of the power system. In this study, the electrical performance of the optimized spacer ring with α1 = 0.5 at different voltages is evaluated using FEA. The experimental conditions for the simulation are as follows: voltages of 10 kV, 20 kV, and 30 kV are applied sequentially to the power transmission lines, and the environmental conditions are set to an air medium. To determine the electric potential distribution and electric field distribution of the spacer ring, the electrostatic field analysis is performed using power transmission lines with different voltages. The results are shown in Figure 16.
From Figure 16a,c–e, it can be seen that the distribution of the electric potential shows a clear asymmetry. As the voltage value increases, the electric potential shows a significant growth trend in the central part of the spacer ring, especially in Figure 16e, the electric potential reaches the maximum value and shows a highly concentrated region. This indicates a large electric potential difference between the center and edge parts of the spacer ring. Figure 16b,d–f show the variation of the electric field norm with voltage. As the voltage increases from 10 kV to 30 kV, the electric field modulus of the spacer ring consistently maintains a low level. Since the breakdown strength of epoxy is 23.145 kV/mm [36], the simulation results indicate that the spacer ring design meets the insulation requirements for transmission lines of 30 kV and below.
This simulation model considers only the epoxy resin solid insulator and the surrounding air. This simplification allows for a detailed analysis of the electric field distribution within the material system. It should be emphasized that wet or contaminated conditions, surface conductivity changes, and corona onset phenomena are not modeled in this study, which significantly affects creepage distance and discharge behavior. The model is suitable for static electric field analysis but does not capture dynamic surface or environmental effects. Further work will incorporate surface charge accumulation, humidity/pollution layers, and corona discharge modeling to extend applicability to outdoor transmission line conditions.

5. Conclusions

In this paper, a topology optimization method is used to synthesize the spacer ring. Finite element models are developed to investigate the relationship between the magnitude and angle of the input force and the maximum equivalent stress of the spacer ring. Static analysis of the spacer ring shows that its design needs to take into account the different magnitudes and directions of the force. The reliability of the design under these conditions has also been validated, and stress concentration regions are identified to provide data support for subsequent optimization. In terms of optimal design, the simulation results show that the optimized spacer ring design reduces the maximum equivalent stress by 34.4% and the mass by 10.5% compared to the initial design.
Future work will focus on translating the optimized structure into practical engineering applications. Experimental validation of the optimized structure will be conducted both in laboratory and on practical environment. Authors believe that the spacer ring will enhance the resilience of the electrical power transmission systems.

Author Contributions

Author Contributions: Conceptualization, T.W.; methodology, T.W., T.C., and H.L.; software, T.W., T.C., and H.L.; validation, H.L.; investigation, T.C.; resources, T.W.; data curation, T.W.; writing—original draft preparation, T.W., and T.C.; writing—review and editing, T.W., and T.C.; supervision, T.W.; project administration, T.W.; funding acquisition, T.W. All authors have read and agreed to the published version of the manuscript.

Funding

This work is supported by the National Natural Science Foundation of China (Grant No. 52201398) and the Natural Science Foundation of Jiangsu Province, China (Grant No. BK20220343).

Institutional Review Board Statement

Not applicable.

Informed Consent Statement

Not applicable.

Data Availability Statement

Data will be made available on request.

Conflicts of Interest

The authors declare no conflicts of interest.

References

  1. Tan, T.; Duan, C.; Liu, X.; Fan, D.; Ye, Z.; Xie, K.; Chai, Q.; Tian, Y.; Zhang, J. Research on Monitoring the Transmission Line Tension and Galloping Based on FBG Fitting Sensor. IEEE Trans. Instrum. Meas. 2022, 71, 1–8. [Google Scholar] [CrossRef]
  2. Lou, W.; Huang, C.; Huang, M.; Yu, J. An aerodynamic anti-galloping technique of iced 8-bundled conductors in ultra-high-voltage transmission lines. J. Wind Eng. Ind. Aerodyn. 2019, 193, 103972. [Google Scholar] [CrossRef]
  3. Si, J.; Rui, X.; Liu, B.; Zhou, L.; Liu, S. Study on a New Combined Anti-Galloping Device for UHV Overhead Transmission Lines. IEEE Trans. Power Deliv. 2019, 34, 2070–2078. [Google Scholar] [CrossRef]
  4. Xie, K.; Zhang, H.; Zhao, Y.; Tian, Y.; Lü, Z.; Wei, J.; Chai, Q.; Liu, Y.; Meng, Y.; Zhang, J.; et al. Structural Health Monitoring of Power Transmission System Based on Optical Fiber Sensor Under Transmission Line Galloping. Laser Optoelectron. Prog. 2018, 55, 070606. [Google Scholar] [CrossRef]
  5. Lou, W.; Huang, C.; Huang, M.; Liang, H.; Yu, J. Galloping Suppression of Iced Transmission Lines by Viscoelastic-Damping Interphase Spacers. J. Eng. Mech. 2020, 146, 04020135. [Google Scholar] [CrossRef]
  6. Sigmund, O.; Maute, K. Topology optimization approaches: A comparative review. Struct. Multidiscip. Optim. 2013, 48, 1031–1055. [Google Scholar] [CrossRef]
  7. Zargham, S.; Ward, T.A.; Ramli, R.; Badruddin, I.A. Topology optimization: A review for structural designs under vibration problems. Struct. Multidiscip. Optim. 2016, 53, 1157–1177. [Google Scholar] [CrossRef]
  8. Cai, J.; Huang, J.; Huang, L.; Li, Q.; Yin, L. Topology optimization of periodic structures under multiple dynamic uncertain loads. Adv. Eng. Softw. 2024, 198, 103777. [Google Scholar] [CrossRef]
  9. Hofmeyer, H.; Schevenels, M.; Boonstra, S. The generation of hierarchic structures via robust 3D topology optimisation. Adv. Eng. Inform. 2017, 33, 440–455. [Google Scholar] [CrossRef]
  10. Chen, A.; Cai, K.; Zhao, Z.-L.; Zhou, Y.; Xia, L.; Xie, Y.M. Controlling the maximum first principal stress in topology optimization. Struct. Multidiscip. Optim. 2021, 63, 327–339. [Google Scholar] [CrossRef]
  11. Vogel, A.; Junker, P. Adaptive thermodynamic topology optimization. Struct. Multidiscip. Optim. 2021, 63, 95–119. [Google Scholar] [CrossRef]
  12. Bokhari, A.H.; Mousavi, A.; Niu, B.; Wadbro, E. Topology optimization of an acoustic diode? Struct. Multidiscip. Optim. 2021, 63, 2739–2749. [Google Scholar] [CrossRef]
  13. Zhou, S.; Wang, M.Y. Multimaterial structural topology optimization with a generalized Cahn–Hilliard model of multiphase transition. Struct. Multidiscip. Optim. 2006, 33, 89–111. [Google Scholar] [CrossRef]
  14. Tavakoli, R. Multimaterial topology optimization by Volume Constrained Allen–Cahn System and Regularized Projected Steepest Descent Method. Comput. Methods Appl. Mech. Eng. 2014, 276, 534–565. [Google Scholar] [CrossRef]
  15. Zhao, F. Topology optimization with meshless density variable approximations and BESO method. Comput. Aided Design. 2014, 56, 1–10. [Google Scholar] [CrossRef]
  16. Chu, S.; Xiao, M.; Gao, L.; Li, H.; Zhang, J.; Zhang, X. Topology optimization of multi-material structures with graded interfaces. Comput. Methods Appl. Mech. Eng. 2019, 346, 1096–1117. [Google Scholar] [CrossRef]
  17. Zhu, B.; Zhang, X.; Liu, M.; Chen, Q.; Li, H. Topological and Shape Optimization of Flexure Hinges for Designing Compliant Mechanisms Using the Level Set Method. Chin. J. Mech. Eng. 2019, 32, 13. [Google Scholar] [CrossRef]
  18. Xia, L.; Zhang, L.; Xia, Q.; Shi, T. Stress-based topology optimization using bi-directional evolutionary structural optimization method. Comput. Methods Appl. Mech. Eng. 2018, 333, 356–370. [Google Scholar] [CrossRef]
  19. Simonetti, H.L.; Almeida, V.S.; Neves, F.d.A.d. Smoothing evolutionary structural optimization for structures with displacement or natural frequency constraints. Eng. Struct. 2018, 163, 1–10. [Google Scholar] [CrossRef]
  20. Zhang, W.; Zhou, J.; Zhu, Y.; Guo, X. Structural complexity control in topology optimization via moving morphable component (MMC) approach. Struct. Multidiscip. Optim. 2017, 56, 535–552. [Google Scholar] [CrossRef]
  21. Zhao, F. A nodal variable ESO (BESO) method for structural topology optimization. Finite Elem. Anal. Des. 2014, 86, 34–40. [Google Scholar] [CrossRef]
  22. Xie, L.; Zhang, Y.; Ge, M.; Zhao, Y. Topology optimization of heat sink based on variable density method. Energy Rep. 2022, 8, 718–726. [Google Scholar] [CrossRef]
  23. Ma, W.; Lu, Y.; Wang, P.; Wang, Y.; Wang, J. Double Optimization Design of the Formula Racing Car Frame Based on the Variable Density Method and the Joint Variable Method. Appl. Sci. 2023, 13, 10155. [Google Scholar] [CrossRef]
  24. Liu, B.; Guo, D.; Jiang, C.; Li, G.; Huang, X. Stress optimization of smooth continuum structures based on the distortion strain energy density. Comput. Methods Appl. Mech. Eng. 2019, 343, 276–296. [Google Scholar] [CrossRef]
  25. Santos, d.; Batista, R.; Torii, A.J.; Novotny, A.A. Reliability-based topology optimization of structures under stress constraints. Int. J. Numer. Methods Eng. 2018, 114, 660–674. [Google Scholar] [CrossRef]
  26. Liu, J.; Luo, L.; Xiao, X.; Zhang, C.; Zhang, L.; Mi, C. Multi-Objectives topology optimization of frame in an electric mining dump truck based on fuzzy satisfaction variable weight coefficients method. J. Mech. Sci. Technol. 2022, 36, 3059–3069. [Google Scholar] [CrossRef]
  27. Zhao, Q.; Chen, X.; Wang, L.; Zhu, J.; Ma, Z.-D.; Lin, Y. Simulation and experimental validation of powertrain mounting bracket design obtained from multi-objective topology optimization. Adv. Mech. Eng. 2015, 7, 1–10. [Google Scholar] [CrossRef]
  28. Zhong, W.; Su, R.; Gui, L.; Fan, Z. Multi-objective topology and sizing optimization of bus body frame. Struct. Multidiscip. Optim. 2016, 54, 701–714. [Google Scholar] [CrossRef]
  29. Liu, C.-H.; Chung, F.-M.; Chen, Y.; Chiu, C.-H.; Chen, T.-L. Optimal Design of a Motor-Driven Three-Finger Soft Robotic Gripper. IEEEASME Trans. Mechatron. 2020, 25, 1830–1840. [Google Scholar] [CrossRef]
  30. Ferro, N.; Micheletti, S.; Perotto, S. POD-Assisted Strategies for Structural Topology Optimization. Comput. Math. Appl. 2019, 77, 2804–2820. [Google Scholar] [CrossRef]
  31. Du, Y.; Li, H.; Xie, H.; Tian, Q.; Zhou, X.; Luo, Z. Topology Optimization of Multiple Materials Compliant Mechanisms Based on Sequence Interpolation Model and Multigrid Method. J. Mech. Eng. 2018, 54, 47–56. [Google Scholar] [CrossRef]
  32. Wan, C.; Jiao, H.; Lv, L.; Lu, C. Multi-material topology optimization based on multiple simp of variable density method. J. Mech. Sci. Technol. 2024, 38, 749–759. [Google Scholar] [CrossRef]
  33. Lazarov, B.S.; Wang, F.; Sigmund, O. Length scale and manufacturability in density-based topology optimization. Arch. Appl. Mech. 2016, 86, 189–218. [Google Scholar] [CrossRef]
  34. Shu, J.; Fu, X. Optimal design of wind turbine’s base based on weight ratio. J. Mach. Des. 2024, 41, 128–135. [Google Scholar]
  35. Russ, J.B.; Waisman, H. Topology optimization for brittle fracture resistance. Comput. Methods Appl. Mech. Eng. 2019, 347, 238–263. [Google Scholar] [CrossRef]
  36. Park, J.J. Electrical Properties of Epoxy Composites with Micro-sized Fillers. Trans. Electr. Electron. Mater. 2018, 19, 475–480. [Google Scholar] [CrossRef]
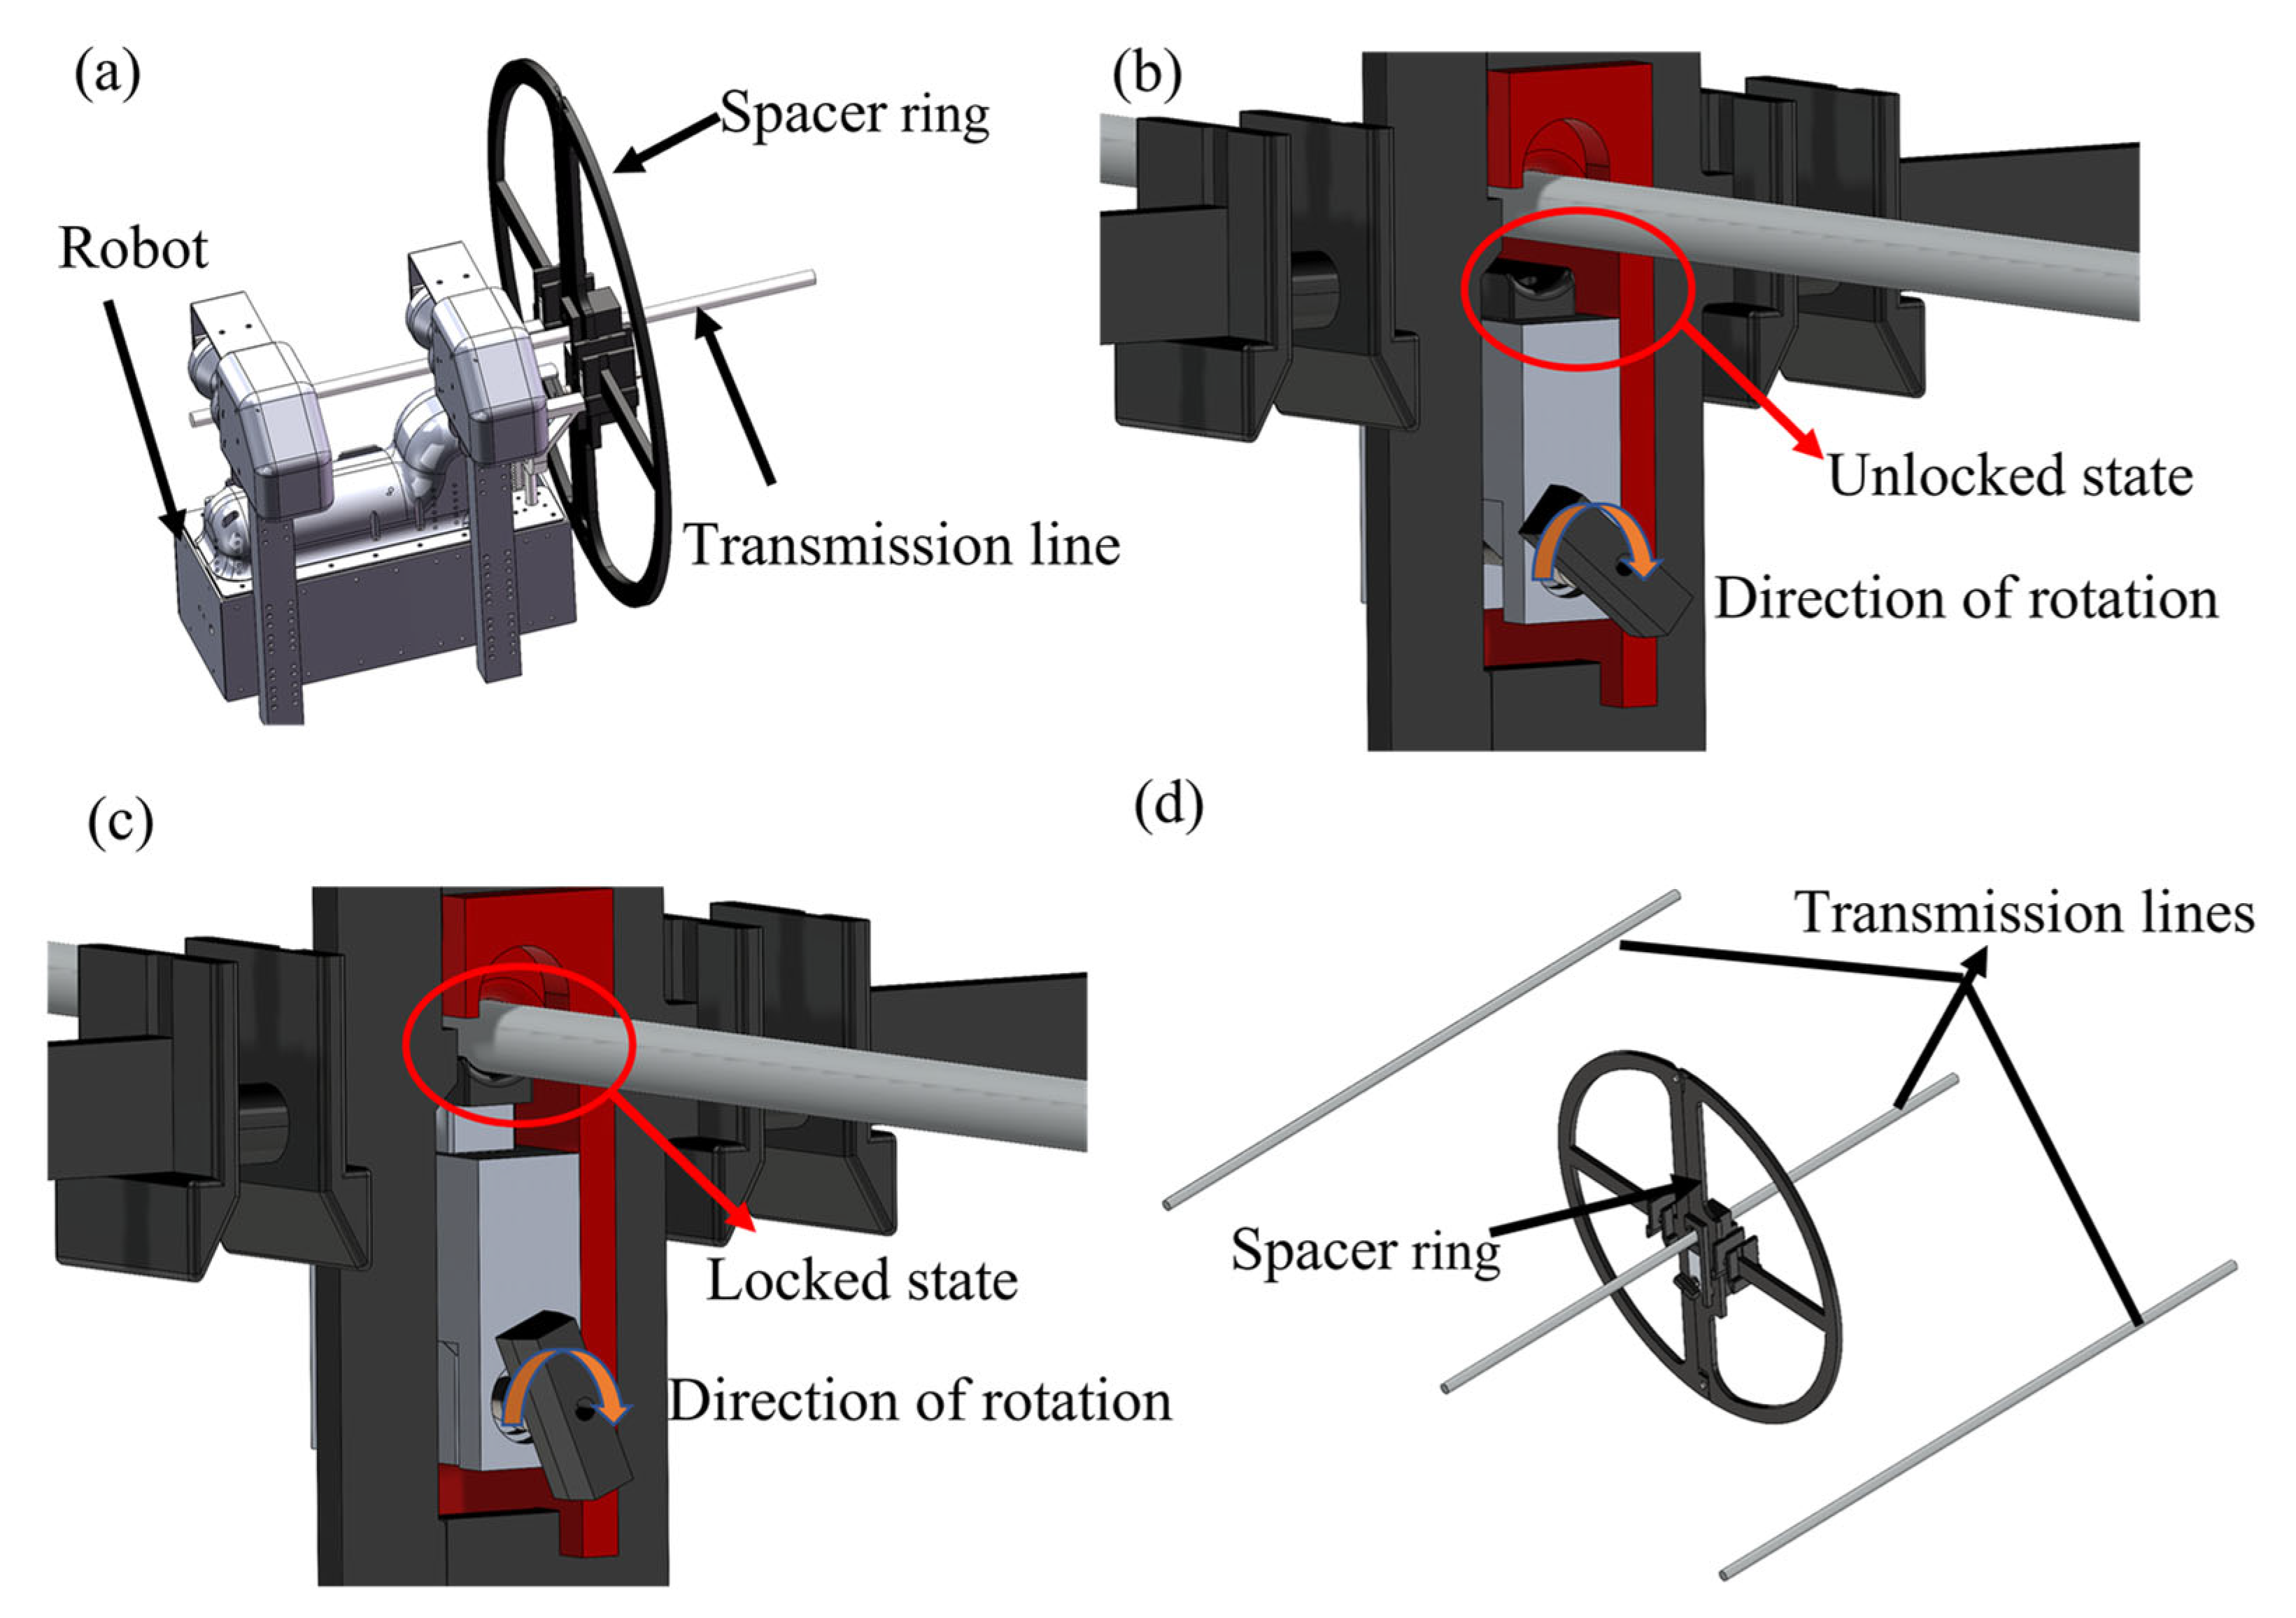
Figure 1. Spacer ring system: components, operating states, and application scenario. (a) Components of the spacer ring system; (b) The spacer ring is in an unlocked state; (c) The spacer ring is in a locked state; (d) Application scenario schematic diagram of spacer rings.
Applsci 15 12496 g001
Figure 2. (a) Spacer Ring; (b) Spacer Ring Locking Device.
Applsci 15 12496 g002
Figure 3. The spacer ring installation experiment. (a) The spacer ring is in an unlocked state; (b) The robot locking the spacer ring; (c) The spacer ring is in a locked state.
Applsci 15 12496 g003
Figure 4. Training field experiment: spacer ring installation under simulated real scenarios. (a) The robot carries a spacer ring and moves along the transmission line; (b) The robot installs a spacer ring on the transmission line.
Applsci 15 12496 g004
Figure 5. Flowchart of the topology optimization method. (The optimization was considered converged when the objective function became stable or when the maximum number of 100 iterations was reached.).
Applsci 15 12496 g005
Figure 6. Topology optimization boundary condition description.
Applsci 15 12496 g006
Figure 7. Iteration curves at different weights coefficient.
Applsci 15 12496 g007
Figure 8. Topological configuration and reconstruction model of α1.
Applsci 15 12496 g008
Figure 9. Topological configuration and reconstruction model of α2.
Applsci 15 12496 g009
Figure 10. Total deformation and equivalent stress distribution of the initial spacer ring under different applied force angles. ((a,b): 0°, (c,d): 45°, (e,f): 60°, where (a,c,e) are total deformation and (b,d,f) are equivalent stress distribution).
Applsci 15 12496 g010
Figure 11. Maximum equivalent stress curves of spacer rings at different loading angles. (a) Maximum equivalent stress curves of optimized spacer ring under α1 condition and the initial spacer ring; (b) Maximum equivalent stress curves of optimized spacer ring under α2 condition and the initial spacer ring.
Applsci 15 12496 g011
Figure 12. Static analysis results of the initial spacer ring under a 0° applied force angle: (a,c,e,g) Total deformation at different load levels (400 N, 600 N, 800 N, 1000 N), (b,d,f,h) Equivalent stress distribution at corresponding load levels.
Applsci 15 12496 g012
Figure 13. Total deformation and equivalent stress distribution of optimized spacer ring under α1 condition ((a,b): α1 = 0, (c,d): α1 = 0.5, (e,f): α1 = 1).
Applsci 15 12496 g013
Figure 14. Total deformation and equivalent stress distribution of optimized spacer ring under α2 condition ((a,b): α2 = 0, (c,d): α2 = 0.5, (e,f): α2 = 1).
Applsci 15 12496 g014
Figure 15. Comparison of mass and maximum equivalent stress of spacer rings before and after optimization.
Applsci 15 12496 g015
Figure 16. Electric potential distribution and electric field distribution of spacer ring at different voltages ((a,b): 10 kV, (c,d): 20 kV, (e,f): 30 kV).
Applsci 15 12496 g016
Table 1. Parameters for simulation and optimization.
Simulation Modeling of Spacer RingMaterialsModulus of Elasticity/MPaPoisson’s Ratio
Spacer ringEpoxy resin37800.35
Spacer ring locking device7075 Aluminum alloy71,0000.33
Input bolt of locking device316 stainless steel193,0000.28
Transmission lines6061 Aluminum alloy69,0400.33
Density/(g/cm3)Yield Strength/MPaRelative PermittivityConductivity/(S/m)
1.1654.63.8/
2.81455/2.2 × 107
8.03205/1.35 × 106
2.713259.2/2.5 × 107
Disclaimer/Publisher’s Note: The statements, opinions and data contained in all publications are solely those of the individual author(s) and contributor(s) and not of MDPI and/or the editor(s). MDPI and/or the editor(s) disclaim responsibility for any injury to people or property resulting from any ideas, methods, instructions or products referred to in the content.