Article

Earthquake Ground Motion Characteristics as a Function of a Preprocessing Procedure

1
Department of Civil and Environmental System Engineering, Hanyang University, Seoul 04763, Republic of Korea
2
Earthquake and Volcanic Research Division, Korea Meteorological Administration, Seoul 07062, Republic of Korea
3
Department of Civil and Environmental Engineering, Hanyang University ERICA, Ansan 15588, Republic of Korea
*
Author to whom correspondence should be addressed.
Appl. Sci. 2025, 15(23), 12453; https://doi.org/10.3390/app152312453
Submission received: 17 October 2025 / Revised: 18 November 2025 / Accepted: 21 November 2025 / Published: 24 November 2025
(This article belongs to the Special Issue Soil Dynamics and Earthquake Engineering)

Featured Application

The work proposed in this manuscript is able to process raw ground motion records with low- to mid-amplitude levels to achieve effective seismic ground motions.

Abstract

To enable the engineering application of earthquake ground motion records, this study establishes a standardized preprocessing procedure and systematically analyzes how each preprocessing step affects the characteristics of the ground motion data. Due to recent expansion of seismic networks in South Korea, low- to mid-amplitude seismic ground motions become abundant. However, raw ground motion recordings contain instrument responses and ambient noise and are often affected by baseline drift, which leads to divergence in the integrated displacement time histories. Therefore, reliable use of these records in engineering analysis requires a comprehensive preprocessing procedure that includes instrument response correction, signal windowing, filtering, and baseline correction. In this study, we performed a sensitivity analysis on ground motion data recorded in South Korea to quantitatively assess how key preprocessing parameters influence ground motion characteristics. Based on the findings, a standardized preprocessing workflow is proposed to support the effective use of ground motion records in site response analysis, dynamic structural analysis, and seismic hazard assessments.

1. Introduction

Earthquake ground motion time histories are essential data in various engineering fields, including site response analysis, dynamic structural analysis, slope stability evaluations, and liquefaction assessments. In the past, due to the limited availability of moderate-to-large earthquake records in South Korea, ground motions from international databases, such as the PEER NGA ground motion database [1], were commonly adopted for engineering analyses. However, since the introduction of digital seismic monitoring in 2000, the number of ground motion recordings in South Korea has steadily increased. In particular, significant earthquakes with local magnitudes (ML) greater than 5.0 (e.g., the 2016 Gyeongju earthquake and the 2017 Pohang earthquake) have contributed to the accumulation of usable records for engineering applications. Figure 1 presents the distribution of peak ground acceleration (PGA) recorded by the Korea Meteorological Administration (KMA) seismic network for earthquakes with ML values greater than 3.5 from 2000 to August 2025. A total of 19 ground motions with PGA values exceeding 0.1 g have been observed, indicating the presence of a substantial number of records that could potentially impact structural performance.
Raw ground motion recordings obtained from seismic stations include instrument noise and ambient environmental disturbances. To extract meaningful ground motion signals induced solely by earthquakes for engineering applications, a preprocessing procedure is required to isolate seismic ground motion components and eliminate noise from the observed waveforms. Inappropriate preprocessing can lead to distorted results: (1) artificial permanent displacements that do not actually exist, (2) divergent displacement time histories, or (3) ground motions dominated by noise.
Ground motion preprocessing consists of three main steps: (1) instrument response correction, (2) filtering, and (3) baseline correction. Ground motions recorded at seismic stations are measured as electrical signals through seismometers (velocimeters or accelerometers) and are stored as time series of digital counts by recorders. Instrument response correction converts these digital counts into physical quantities (velocity or acceleration) by removing the inherent response characteristics of seismometers and recorders. However, even after this transformation, ambient noise often remains in the signal. Therefore, filtering is necessary to remove frequency bands with low signal-to-noise ratios (SNR). Additionally, when integrating the filtered acceleration (or velocity) signal to obtain displacement time histories, improper baselines can lead to unrealistic divergence in displacement, making baseline correction essential.
Several international strong-motion databases also rely on preprocessing systems to ensure consistency across records, such as the KiK-net flatfile protocol [2], the USGS PRISM system [3], and the European ESM/ITACA service [4]. Detailed preprocessing procedures have also been proposed from several studies, including the NGA projects [5,6], the gmprocess tool by U.S. Geological Survey (USGS) [7], and the Korea Institute of Geoscience and Mineral Resources (KIGAM) Quake open platform [8]. Table 1 compares key preprocessing parameters, such as filter order, corner frequency settings, and baseline correction methods adopted by NGA, USGS, and KIGAM.
The PEER NGA ground motion database provides preprocessed ground motion records that are ready for use in engineering analyses without requiring additional processing. In contrast, the KMA, the main national seismic network operator, provides raw ground motion data in miniSEED format through the National Earthquake Comprehensive Information System (NECIS) [9]. As a result, users must perform their own preprocessing steps, including instrument response correction, filtering, and baseline correction, before the records can be used for engineering purposes. In this study, we establish a systematic preprocessing procedure for ground motion records provided by KMA and analyze the effects of each preprocessing step on the physical characteristics of the ground motion waveforms. We anticipate that the proposed practical and standardized preprocessing workflow can enhance the applicability of raw seismic data for engineering practice.
Table 1. Methods of ground motion preprocessing procedures from previous studies.
StudyProcessing StepContents
NGA East [6]FilteringFilter pole (n) selectionHigh-pass: 5 poles
Low-pass: 4 poles
Corner frequency selectionBased on f2 acceleration decay model and SNR
Baseline correction
(1)
Fit 6th order polynomial to displacement time series
(2)
Subtract the polynomial from the displacement time series
(3)
Differentiate back to acceleration time series
USGS [7]FilteringFilter pole (n) selectionHigh-pass: 5 poles
Low-pass: 5 poles
Corner frequency selectionWider bandwidth than fmin to fmax
SNR > SNRmin
Baseline correction
(1)
Fit 6th order polynomial (set 0th and 1st coefficients to zero) to displacement time series
(2)
Subtract second derivative of the polynomial from acceleration time series
KIGAM [8]FilteringFilter pole (n) selectionHigh-pass: 2 poles
Low-pass: 2 poles
Corner frequency selectionHigh-pass: fc = 0.1 Hz
Low-pass: fc = 25 Hz
Baseline correction
(1)
Fit 4th order polynomial to velocity time series
(2)
Subtract the polynomial from the velocity time series
(3)
Differentiate back to acceleration time series

2. Seismic Networks

In South Korea, the national seismic monitoring network is primarily established and operated by KMA (network code KS) and KIGAM (network code KG). In addition to these agencies, other organizations such as Korea Hydro & Nuclear Power (KHNP), Korea Water Resources Corporation (K-water), and Korea Electric Power Corporation (KEPCO) maintain their own independent seismic monitoring networks. However, only KMA and KIGAM publicly provide raw ground motion records, making them the primary sources of seismic data used in research and engineering applications. Figure 2 illustrates the nationwide distribution of seismic stations operated by KMA and KIGAM. As of August 2025, KMA operates 364 seismic stations across the country, while KIGAM manages 61 stations. KMA’s stations are classified based on the installation location of the seismometers: surface-type stations, where sensors are installed at the ground surface, and borehole-type stations, where sensors are placed inside boreholes. KMA operates 44 surface-type and 320 borehole-type stations. KIGAM manages 28 surface-type stations, 13 borehole-type stations, and 20 hybrid-type stations that operate both surface and borehole sensors simultaneously.
KMA provides raw ground motion data through the NECIS [9], while KIGAM distributes its seismic records via the KIGAM Quake platform [8]. Both systems offer waveform data in miniSEED format.

3. Ground Motion Preprocessing Procedure

The preprocessing of ground motion records refers to the procedure of converting raw digital count data into physically meaningful seismic waveforms that are suitable for engineering application. This procedure generally consists of three stages: instrument response correction, filtering, and baseline correction. In the 1st stage, the raw count data measured by the seismometer is converted into physical quantities such as acceleration or velocity. This process removes the inherent response characteristics of the recording instrument, enabling the recovery of ground motion waveforms. The 2nd stage involves removing the effects of instrumental noise and ambient environmental noise that may still be present in the converted ground motion waveform. Noise is typically characterized by a relatively uniform amplitude across all frequencies or an increasing amplitude in the low-frequency range, whereas seismic signals are usually concentrated within a mid-frequency band. Therefore, a bandpass filter is applied to emphasize the frequency range in which the seismic signal dominates while attenuating frequency regions where noise is prevalent. After filtering, the acceleration or velocity time series is integrated to calculate displacement time histories. However, integration can accumulate numerical errors, resulting in artificial drifts or divergence in the displacement time series. To address this issue and obtain reliable displacement records, baseline correction is performed. This process involves removing long-period or low-amplitude slope components that are not part of the actual seismic signal, typically using polynomial regression techniques. Figure 3 presents a flowchart of the complete preprocessing procedure, illustrating how raw seismic records are transformed through filtering and correction steps into waveforms suitable for subsequent engineering analysis.

3.1. Instrument Response Correction

The raw waveforms recorded at seismic observatories represent ground motions detected by accelerometers or velocimeters, converted into electrical signals, and stored as time-series digital counts by the data logger. These count values inherently reflect the frequency response characteristics of the recording instruments. Therefore, using them directly without correction may lead to discrepancies from the actual ground motion. To obtain physically meaningful motion data, it is essential to apply instrument response correction, which removes the instrument-specific frequency characteristics and converts the data into physical quantities such as acceleration or velocity [10].
For this correction, response files corresponding to the specific accelerometer (or velocimeter) and data logger at each station are required. In South Korea, the KMA provides these response files through the NECIS, while the KIGAM distributes metadata through the KIGAM Quake platform. However, for certain seismic records instrument response files are often unavailable via NECIS (e.g., older than 2018). In such cases, instrument response files developed based on KMA station metadata by Lim and Kim (2020) and Ahn et al. (2024) [11,12] can be used as alternatives.
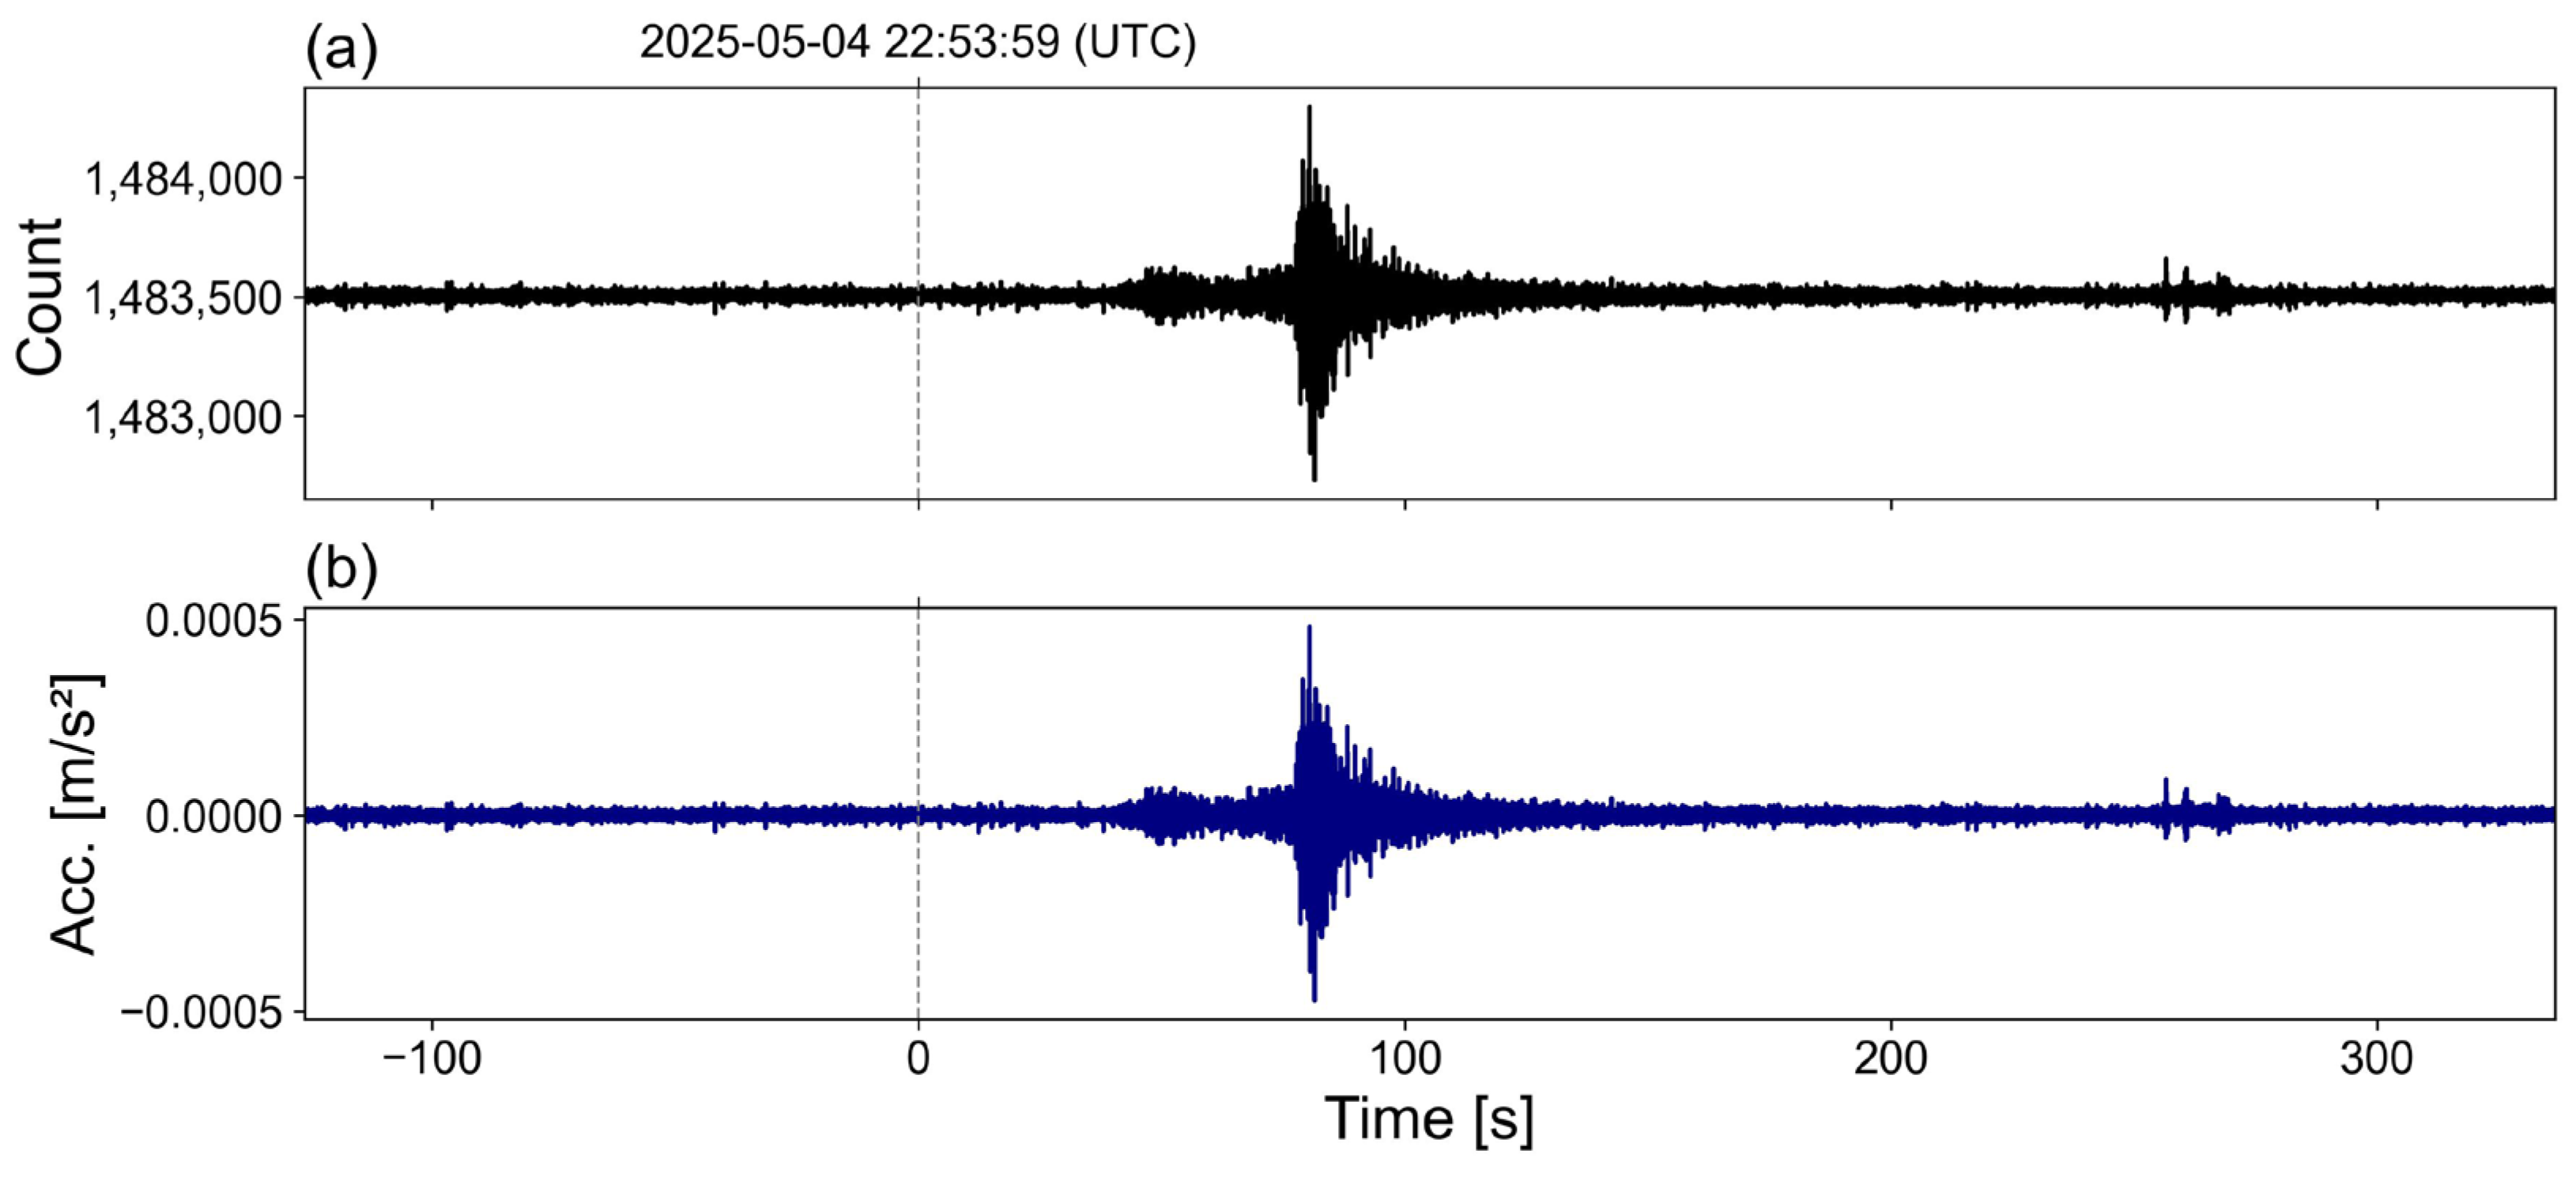
After instrument correction, waveforms measured by accelerometers are converted into units of acceleration, while those measured by velocimeters are converted into velocity. Figure 4 compares the raw waveform recorded on the north–south component (HGN) of the accelerometer at the KS.JOGB station (located approximately 275 km from the epicenter of the 2025 ML3.7 Taean earthquake) with the waveform after instrument response correction. The response file (RESP.KS.JOGB) was obtained from NECIS. This corrected waveform from the Taean earthquake is used as the example ground motion for subsequent preprocessing analyses in this study.

3.2. Signal Window Selection

Event waveform data provided by NECIS includes a fixed-duration time window from at least 100 s ahead to 320 s behind of origin time of the earthquake. However, such records often contain not only the actual ground motion caused by the earthquake but also segments of ambient noise before and after the seismic event. Therefore, for reliable waveform preprocessing and seismic analysis, it is essential to accurately define the signal window (SW) which is the portion of the waveform significantly influenced by earthquake ground shaking.
In the NGA-East approach [6], the end time of the signal window is estimated using empirical relationships based on the event magnitude and the hypocentral distance. The expected P-wave arrival time can also be approximated by assuming a propagation velocity of 6.1 km/s in South Korea, and this value may be used to determine the window start time. In addition, a buffer time of approximately 20 s is often applied to both ends of the window.
KIGAM proposes a method for SW selection based on Arias Intensity. The normalized Arias Intensity (NAI) is computed from the entire waveform, and the segment from 1% to 99% of the cumulative NAI is defined as the primary signal window. An additional 15 s is then appended to both ends of this window to form the final SW. If the addition of this padding exceeds the available record duration, the window is automatically adjusted to fit within the recorded time range. This method is intuitive and efficient, it may over-include pre-event noise, particularly when the energy contrast between the signal and background noise is low. In cases where background noise accumulates gradually, the NAI curve may rise steadily, making it difficult to pinpoint the actual onset of seismic shaking.
To address this limitation, this study proposes an alternative approach based on the slope (i.e., time derivative) of the smoothed NAI. The proposed SW selection is as follows:
  • Start time: Identify the first time point where the slope of the smoothed NAI exceeds ten times the average slope observed from the record’s beginning up to that point. Smoothing is performed using a moving average over a ±2.5 s window, and slope inspection begins 10 s after the initial time.
  • End time: Define the end of the SW as the point where the NAI slope first falls below twice the average slope before the start time.
  • Buffer Padding: Add 5 s before the start time and 10 s after the end time to define the final SW.
Figure 5 shows the comparison of SW determined using the empirical P-wave arrival and NGA-East approach, the 1–99% NAI approach and the SW determined using the proposed slope-based method (excluding the added buffer time). Due to the cumulative nature of NAI, the 1–99% approach tends to include pre-event noise before the arrival of the P-wave. In contrast, the proposed slope-based method effectively isolates the strong-motion portion of the signal. The start time is similar with the P-wave arrival, and the end time is shorter than the NGA-East approach.
Figure 6 presents the acceleration time series corresponding to the final SW with padding applied with duration of approximately 100 s. It becomes a more physically meaningful and concise seismic waveform for engineering applications.

3.3. Filtering

Raw ground motion records obtained from seismic monitoring stations contain not only the actual ground motion signals but also instrument noise and ambient background noise. When the amplitude of the ground motion is sufficiently large, the influence of such noise is relatively minor, resulting in a high SNR. However, for small-magnitude or distant earthquakes, noise can dominate the recorded signal. Therefore, to ensure reliable ground motion data, a filtering process is required to remove or suppress frequency bands dominated by noise.
As a preliminary step to filtering, it is necessary to perform a comparative spectral analysis between the ambient noise segment and the SW of the seismic record. This allows identification of frequency bands where noise levels are significantly higher. The frequency bands where seismic signals are clearly distinguishable from noise are preserved, while others are attenuated using filtering techniques. In this study, an acausal Butterworth filter (ABF) [13] was employed for this purpose. The ABF is applied bidirectionally to avoid phase distortion in the filtered signal. This process eliminates phase delay and has been widely adopted in major ground motion preprocessing protocols, such as the NGA project [5,6] and the USGS gmprocess framework [7].
Effective filtering requires appropriate selection of the high-pass corner frequency (fc-hp) and low-pass corner frequency (fc-lp). In addition, the filtering process involves several other key steps, including the determination of the filter order (number of poles), application of cosine tapering, and use of zero padding (ZP) to minimize edge effects. In the subsequent sections, we detail each of the filtering steps: (1) corner frequency determination, (2) tapering, (3) ZP application, (4) ABF application, and (5) ZP removal after ABF.

3.3.1. Determination of Corner Frequencies

The frequency spectrum of earthquake ground motions generally exhibits energy concentration in the mid-frequency range (1–20 Hz) and tends to decrease in the low-frequency range with a slope of approximately f2 [6]. However, ambient noise can exhibit higher amplitudes than seismic signals in both the low-frequency and high-frequency ranges due to natural or anthropogenic sources of vibration. As a result, the SNR becomes low in these frequency bands, which reduces the reliability of the seismic signals.
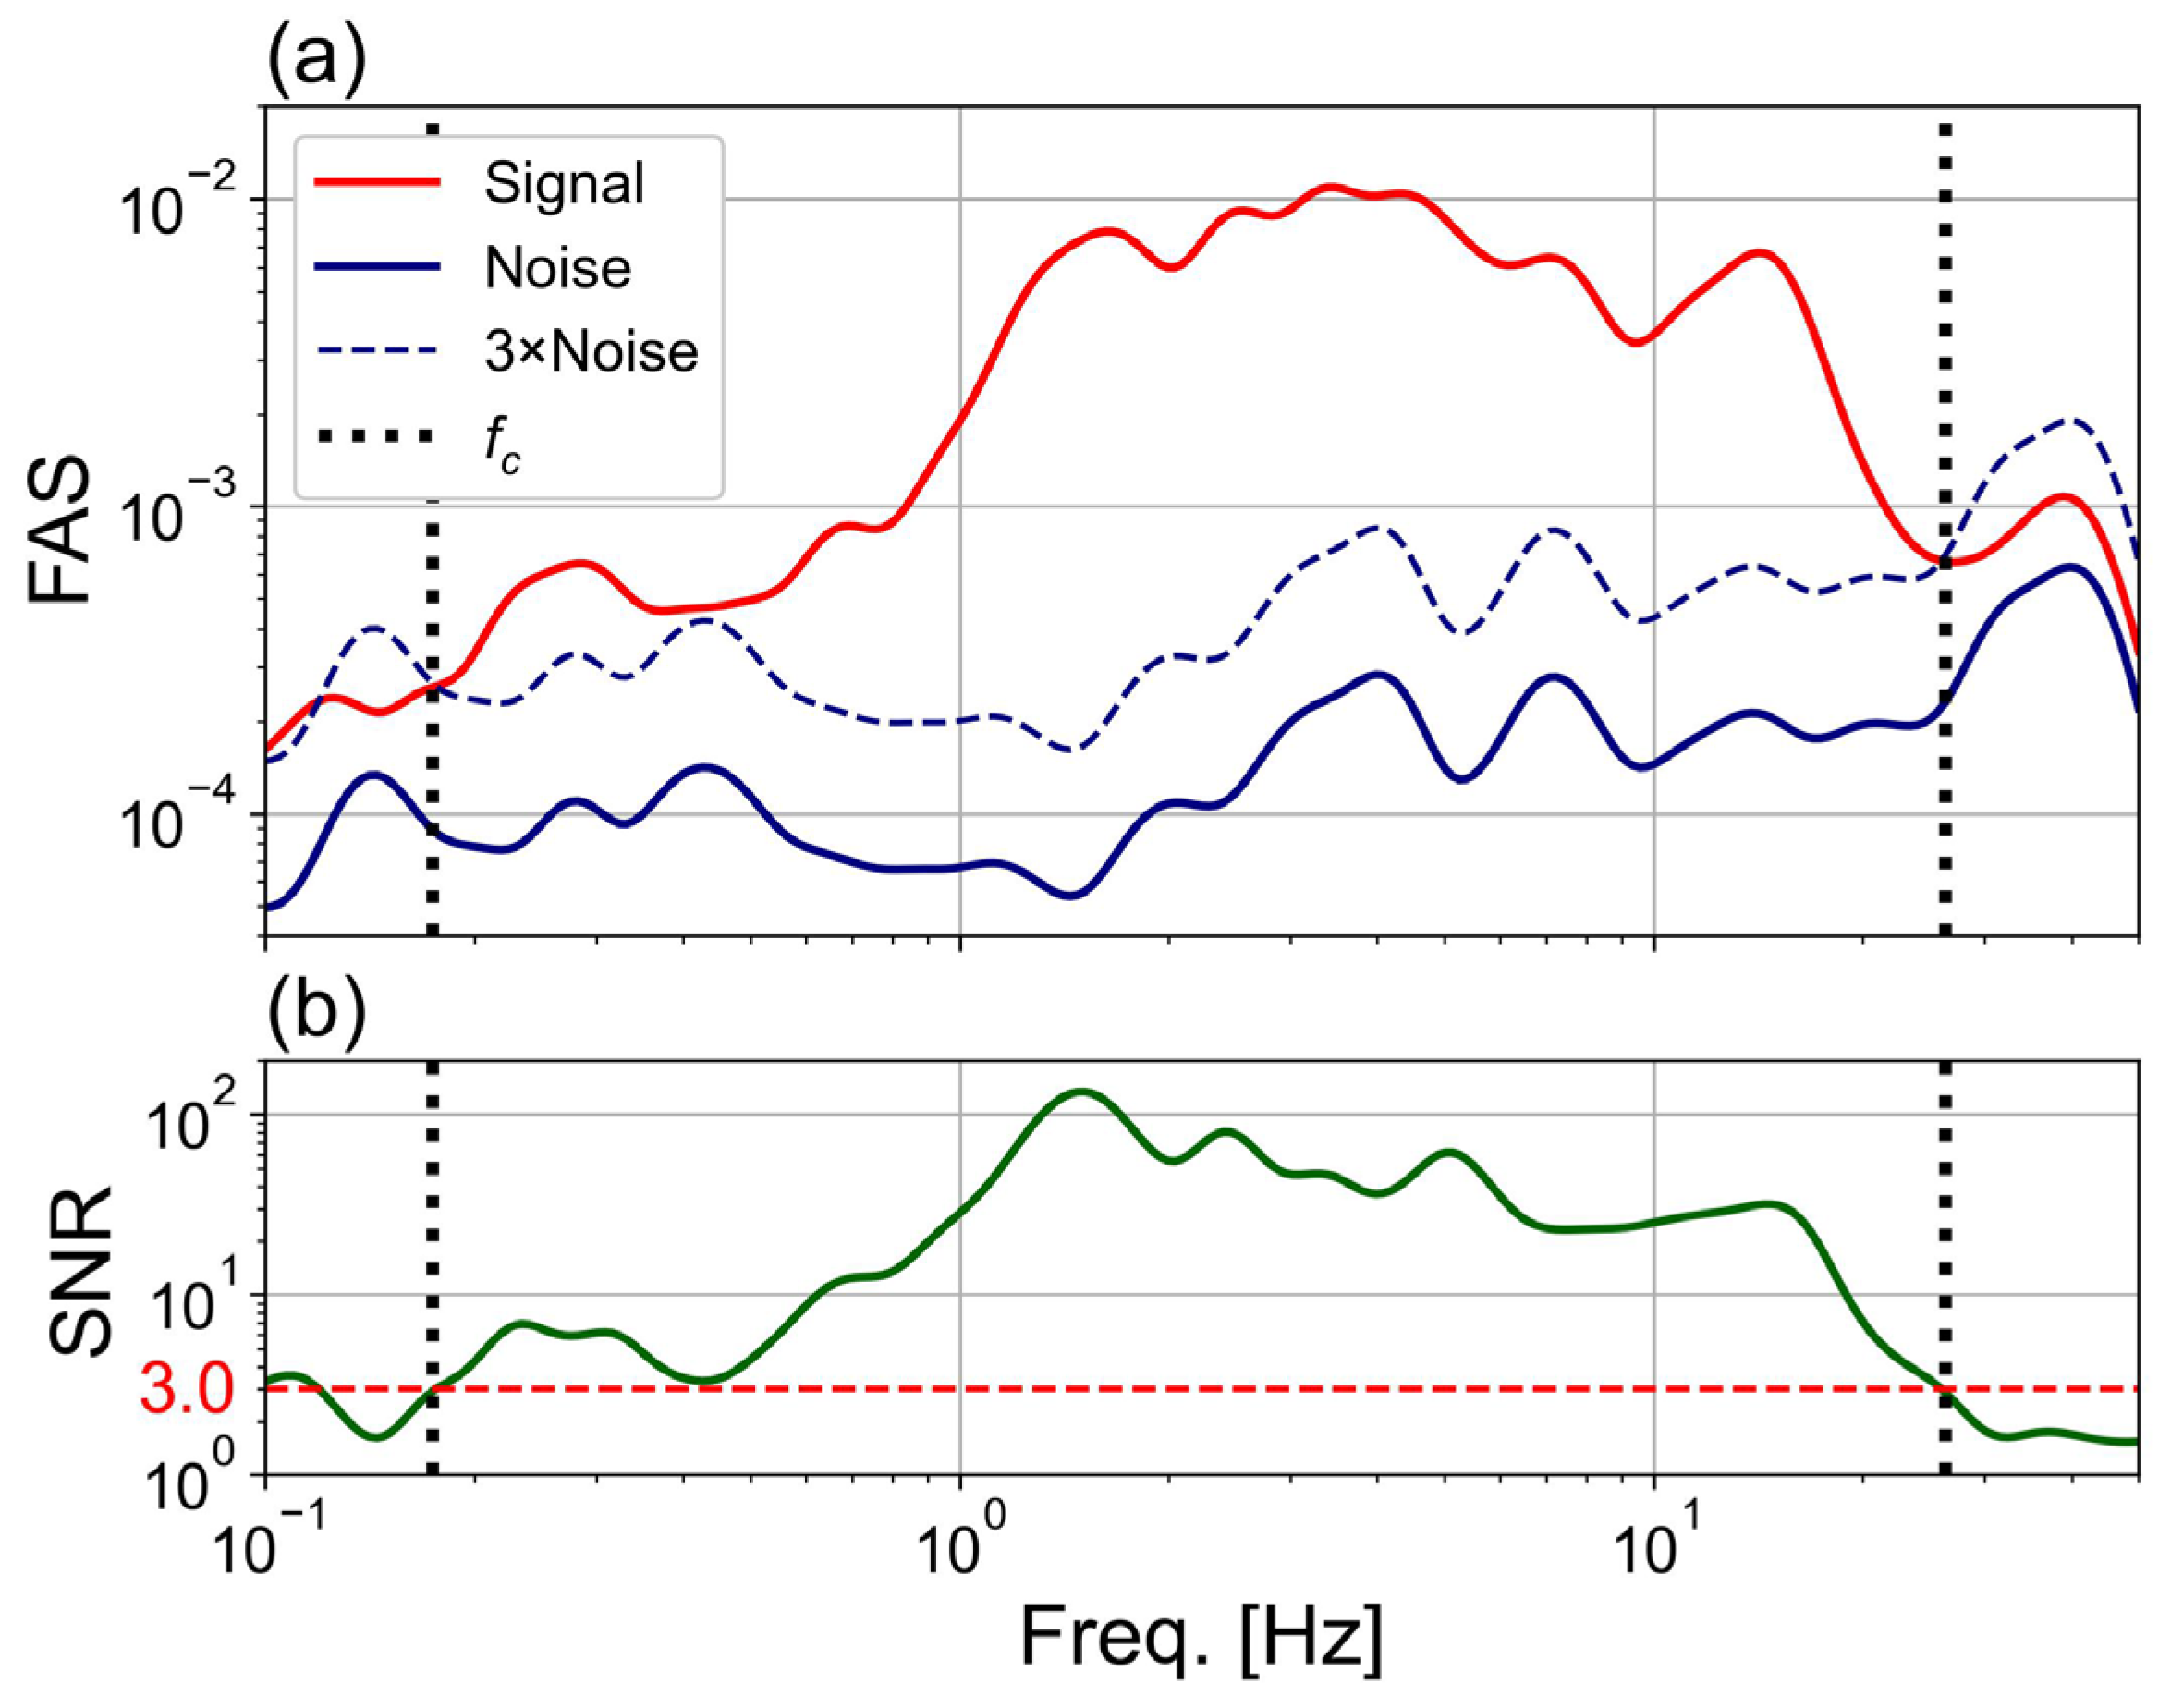
To remove such low-SNR components and preserve the reliable portion of the seismic signal, it is essential to define appropriate fc-hp and fc-lp values. In this study, the time segment preceding the SW start time was treated as the noise window, and the SW was compared against it to calculate frequency-dependent SNR smoothed by the Konno and Ohmachi approach [14]. The frequency range where SNR exceeds a threshold of 3 was considered to represent reliable seismic signal content, and this range was used to determine the fc-hp and fc-lp values.
Figure 7 shows the calculated SNR for the example ground motion and the corresponding fc-hp and fc-lp values. While the SNR exceeded 3 over most of the frequency spectrum, it was observed to drop below this threshold in the low-frequency range below 0.17 Hz and in the high-frequency range above 26 Hz. Accordingly, the corner frequencies were selected as fc-hp = 0.17 Hz and fc-lp = 26 Hz for this example motion.

3.3.2. Tapering

To gradually bring the ends of the SW to zero, a tapering function was applied to the beginning and end portions of the seismic signal. The cosine taper of the following form is used:
w t = 1 2 1 cos π t T 0 t T 1 T < t < D T 1 2 1 cos π D t T D T t D
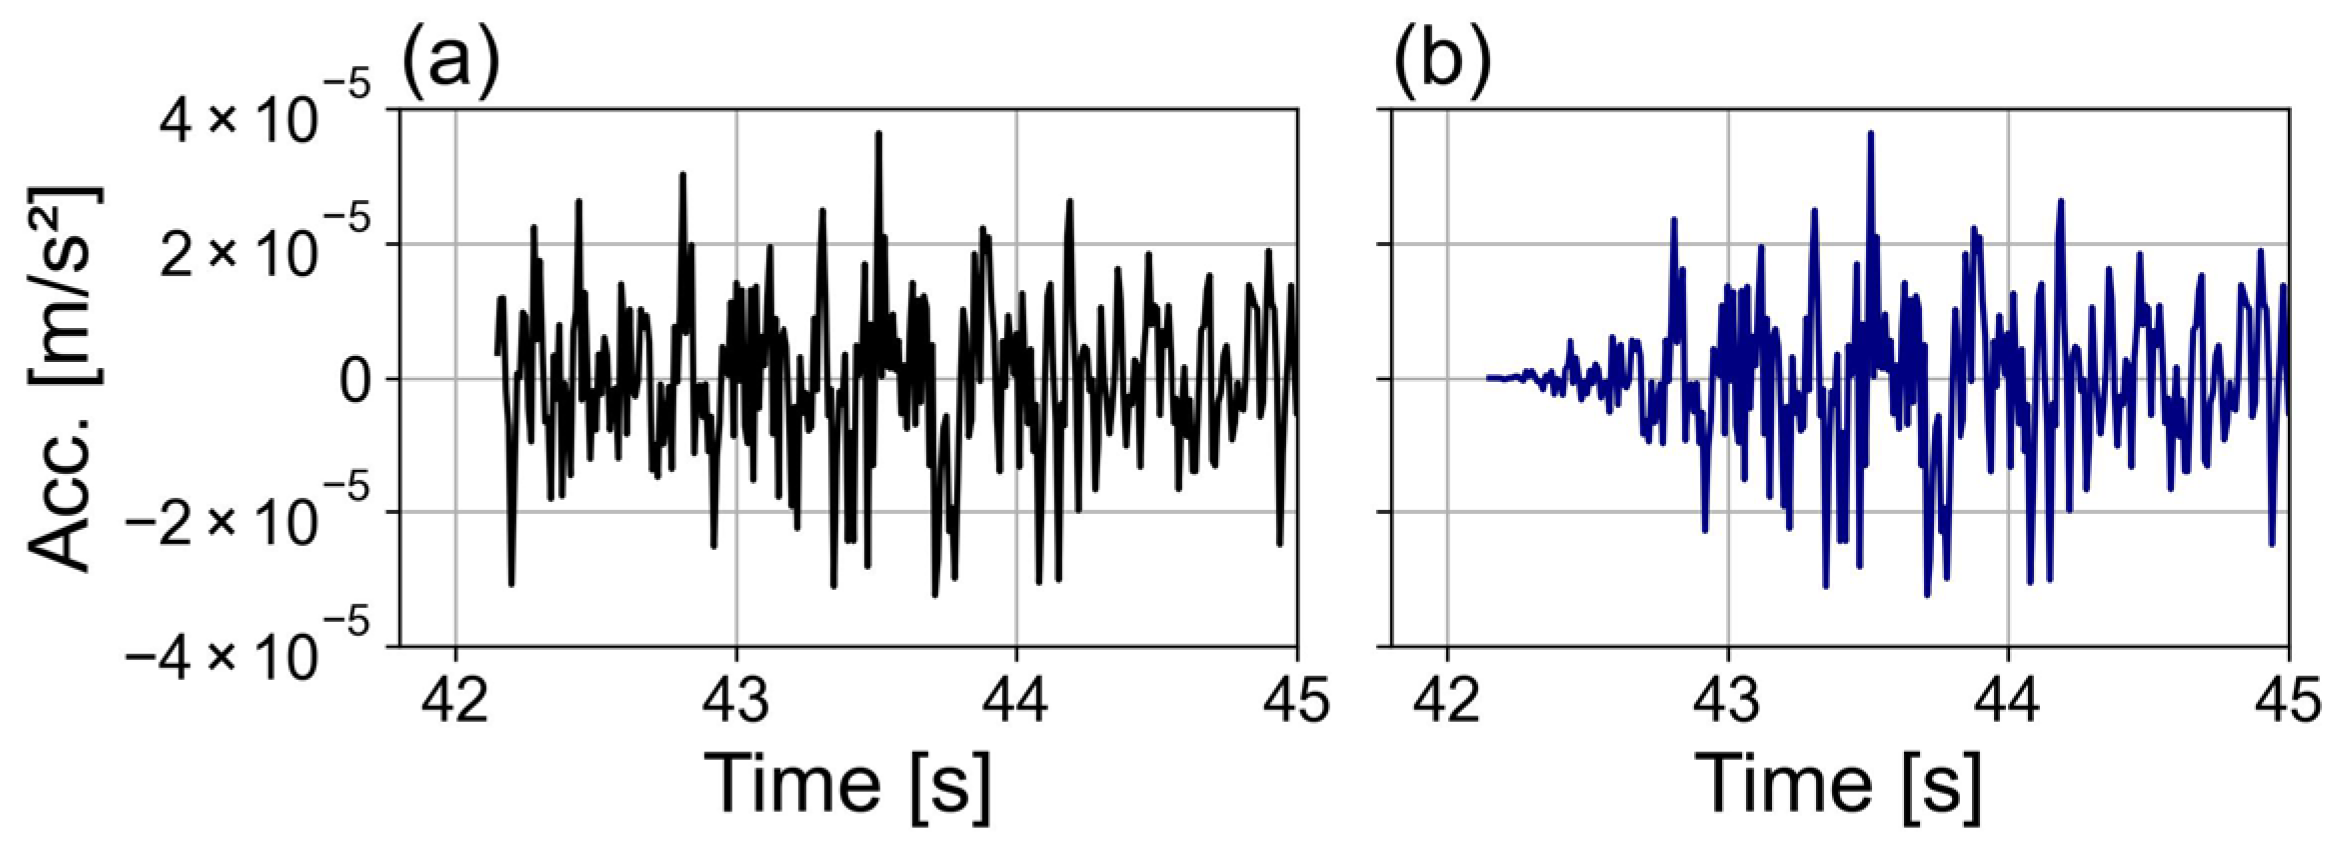
where t is time, T is the taper length, and D is the duration of the SW. In general, about 1% of D is applied as the taper length on both ends. Figure 8 shows the beginning portion of the SW before and after applying the taper. By multiplying the signal with the taper function w at both ends of the SW, the amplitude gradually converges to zero, thereby minimizing discontinuities and spectral leakage in the frequency domain.

3.3.3. Zero Padding

Since the ABF applies filtering in both forward and reverse directions in the time domain, distortions can occur at the beginning and end of the SW by filtering. To account for these edge effects, appropriate zero padding (ZP) must be added to both ends of the signal. ZP refers to artificially appended segments filled with zero values at the start and end of the signal. These ZP segments are required to ensure that the convolution effect of the ABF does not affect the valid portion of the seismic signal. Converse and Brady (1992) [15] proposed that the required ZP duration (Tpad) for ABF as follows:
T p a d = 1.5 × n f c
where n is the number of poles of the Butterworth filter and fc is the fc-hp. This expression is based on the temporal extent of the impulse response of the ABF [16].

3.3.4. Acausal Butterworth Filter

The transfer function of the ABF is expressed as:
H f = 1 1 + f f c ± 2 n
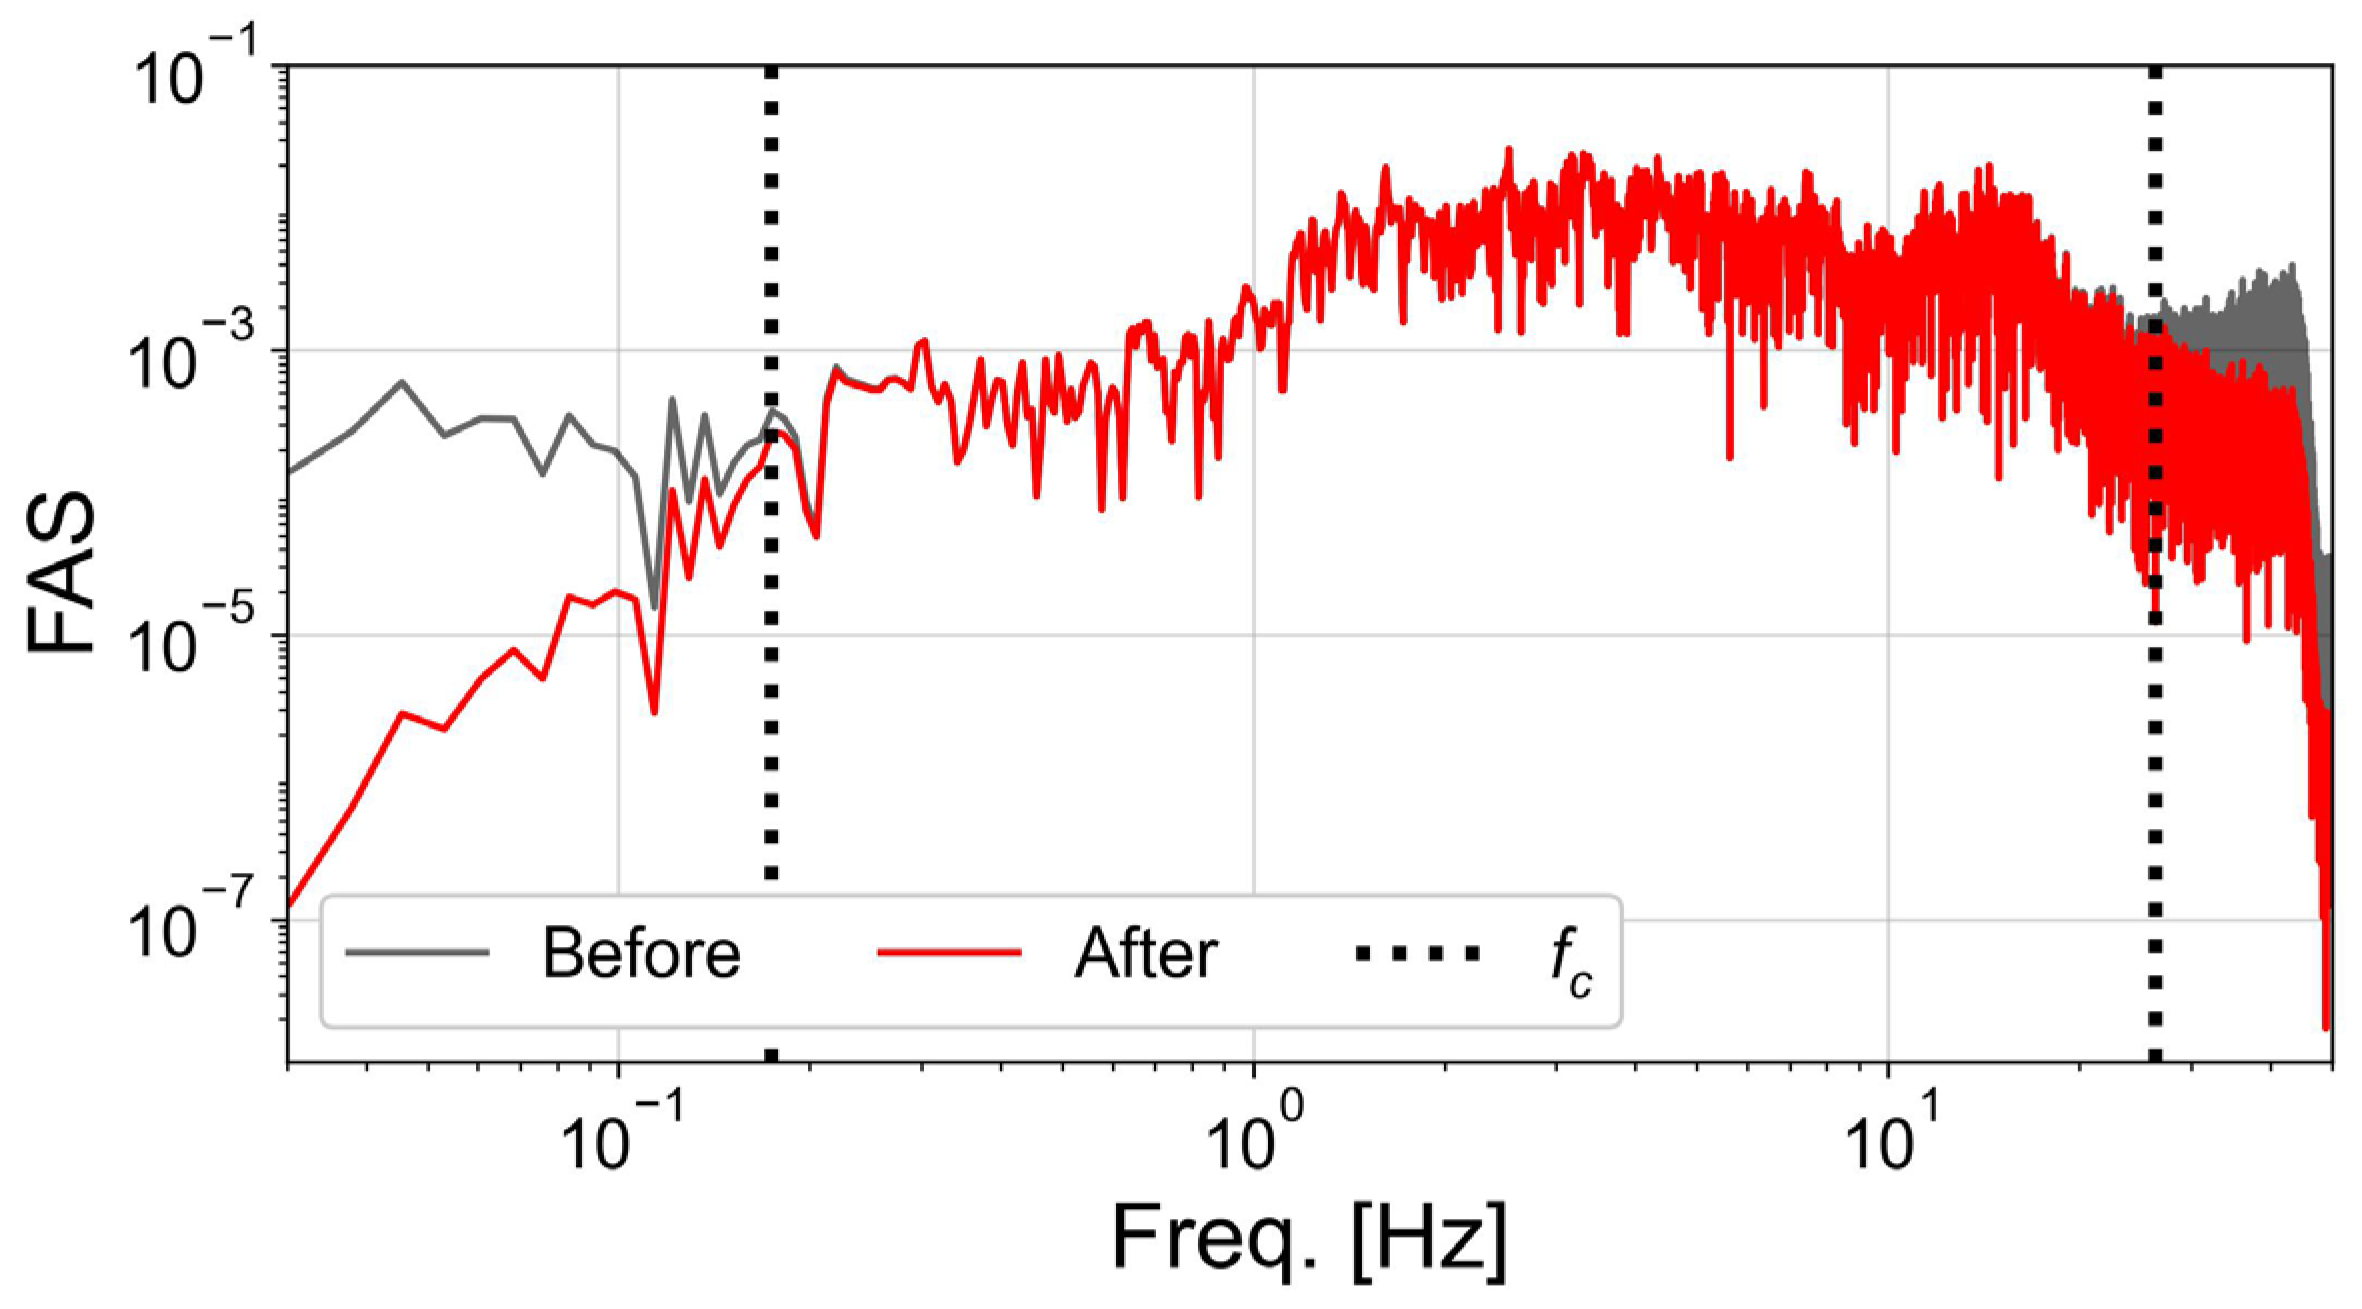
where f is the frequency, fc is the corner frequency, and n is the order (number of poles) of the filter. A positive n is applied for low-pass filters, and a negative n for high-pass filters. The attenuation becomes steeper in the stopband as the order n increases. Existing ground motion preprocessing methodologies adopt different values of n, as summarized in Table 1. Figure 9 shows the change in the Fourier amplitude spectrum (FAS) of the example record before and after filtering, using fc-hp = 0.17 Hz, fc-lp = 26 Hz, and n = 4. The signal rapidly attenuates in the frequency ranges below fc-hp and above fc-lp.

3.3.5. Zero Pad Removal

After the filtering process is completed, the ZP is removed to retain only the SW that is relevant for subsequent analysis. A shorter SW is advantageous in time-history analysis in terms of computational efficiency. However, after applying ABF, artificial waveforms are generated near the interface between the ZP and the actual signal onset as shown in Figure 10. These artificially generated waveforms can lead to divergence in the displacement time history when the acceleration record is subsequently integrated. Therefore, rather than removing the entire ZP section indiscriminately after filtering, it is recommended to retain the portion of the ZP up to where the waveform gradually decays and stabilizes. Truncating the waveform only after such convergence improves the reliability and convergence of the resulting displacement time history.

3.4. Baseline Correction

Even after filtering, the acceleration time history may still lead to divergence in the displacement time history during subsequent integration. This issue arises because the baseline of the acceleration record does not converge to zero. To mitigate this divergence and ensure the physical validity of the ground motion, a baseline correction procedure is essential.
The NGA project [5,6] and the USGS gmprocess toolkit [7] employ a displacement-based baseline correction procedure, which includes the following steps:
1.
Double integration of the filtered acceleration time history to obtain the displacement time history;
2.
Application of a 6th-order polynomial regression to the displacement time history, with the 0th and 1st order coefficients constrained to zero;
3.
Differentiation of the fitted 6th-order polynomial twice to convert it into acceleration form, followed by subtraction of this trend from the original acceleration time history;
4.
Re-integration of the corrected acceleration time history to verify convergence in the displacement record.
If the displacement time history still exhibits divergence after correction, the filtering parameters (fc-hp and fc-lp) and the length of the ZP may be adjusted, and the preprocessing repeated.
The KIGAM [8] adopts a more simplified velocity-based correction approach, as follows:
  • Single integration of the acceleration time history to obtain the velocity time history;
  • Application of a 4th-order polynomial regression to the velocity time history;
  • Subtraction of the fitted trend from the velocity record;
  • Differentiation of the corrected velocity time history to reconstruct the acceleration record.
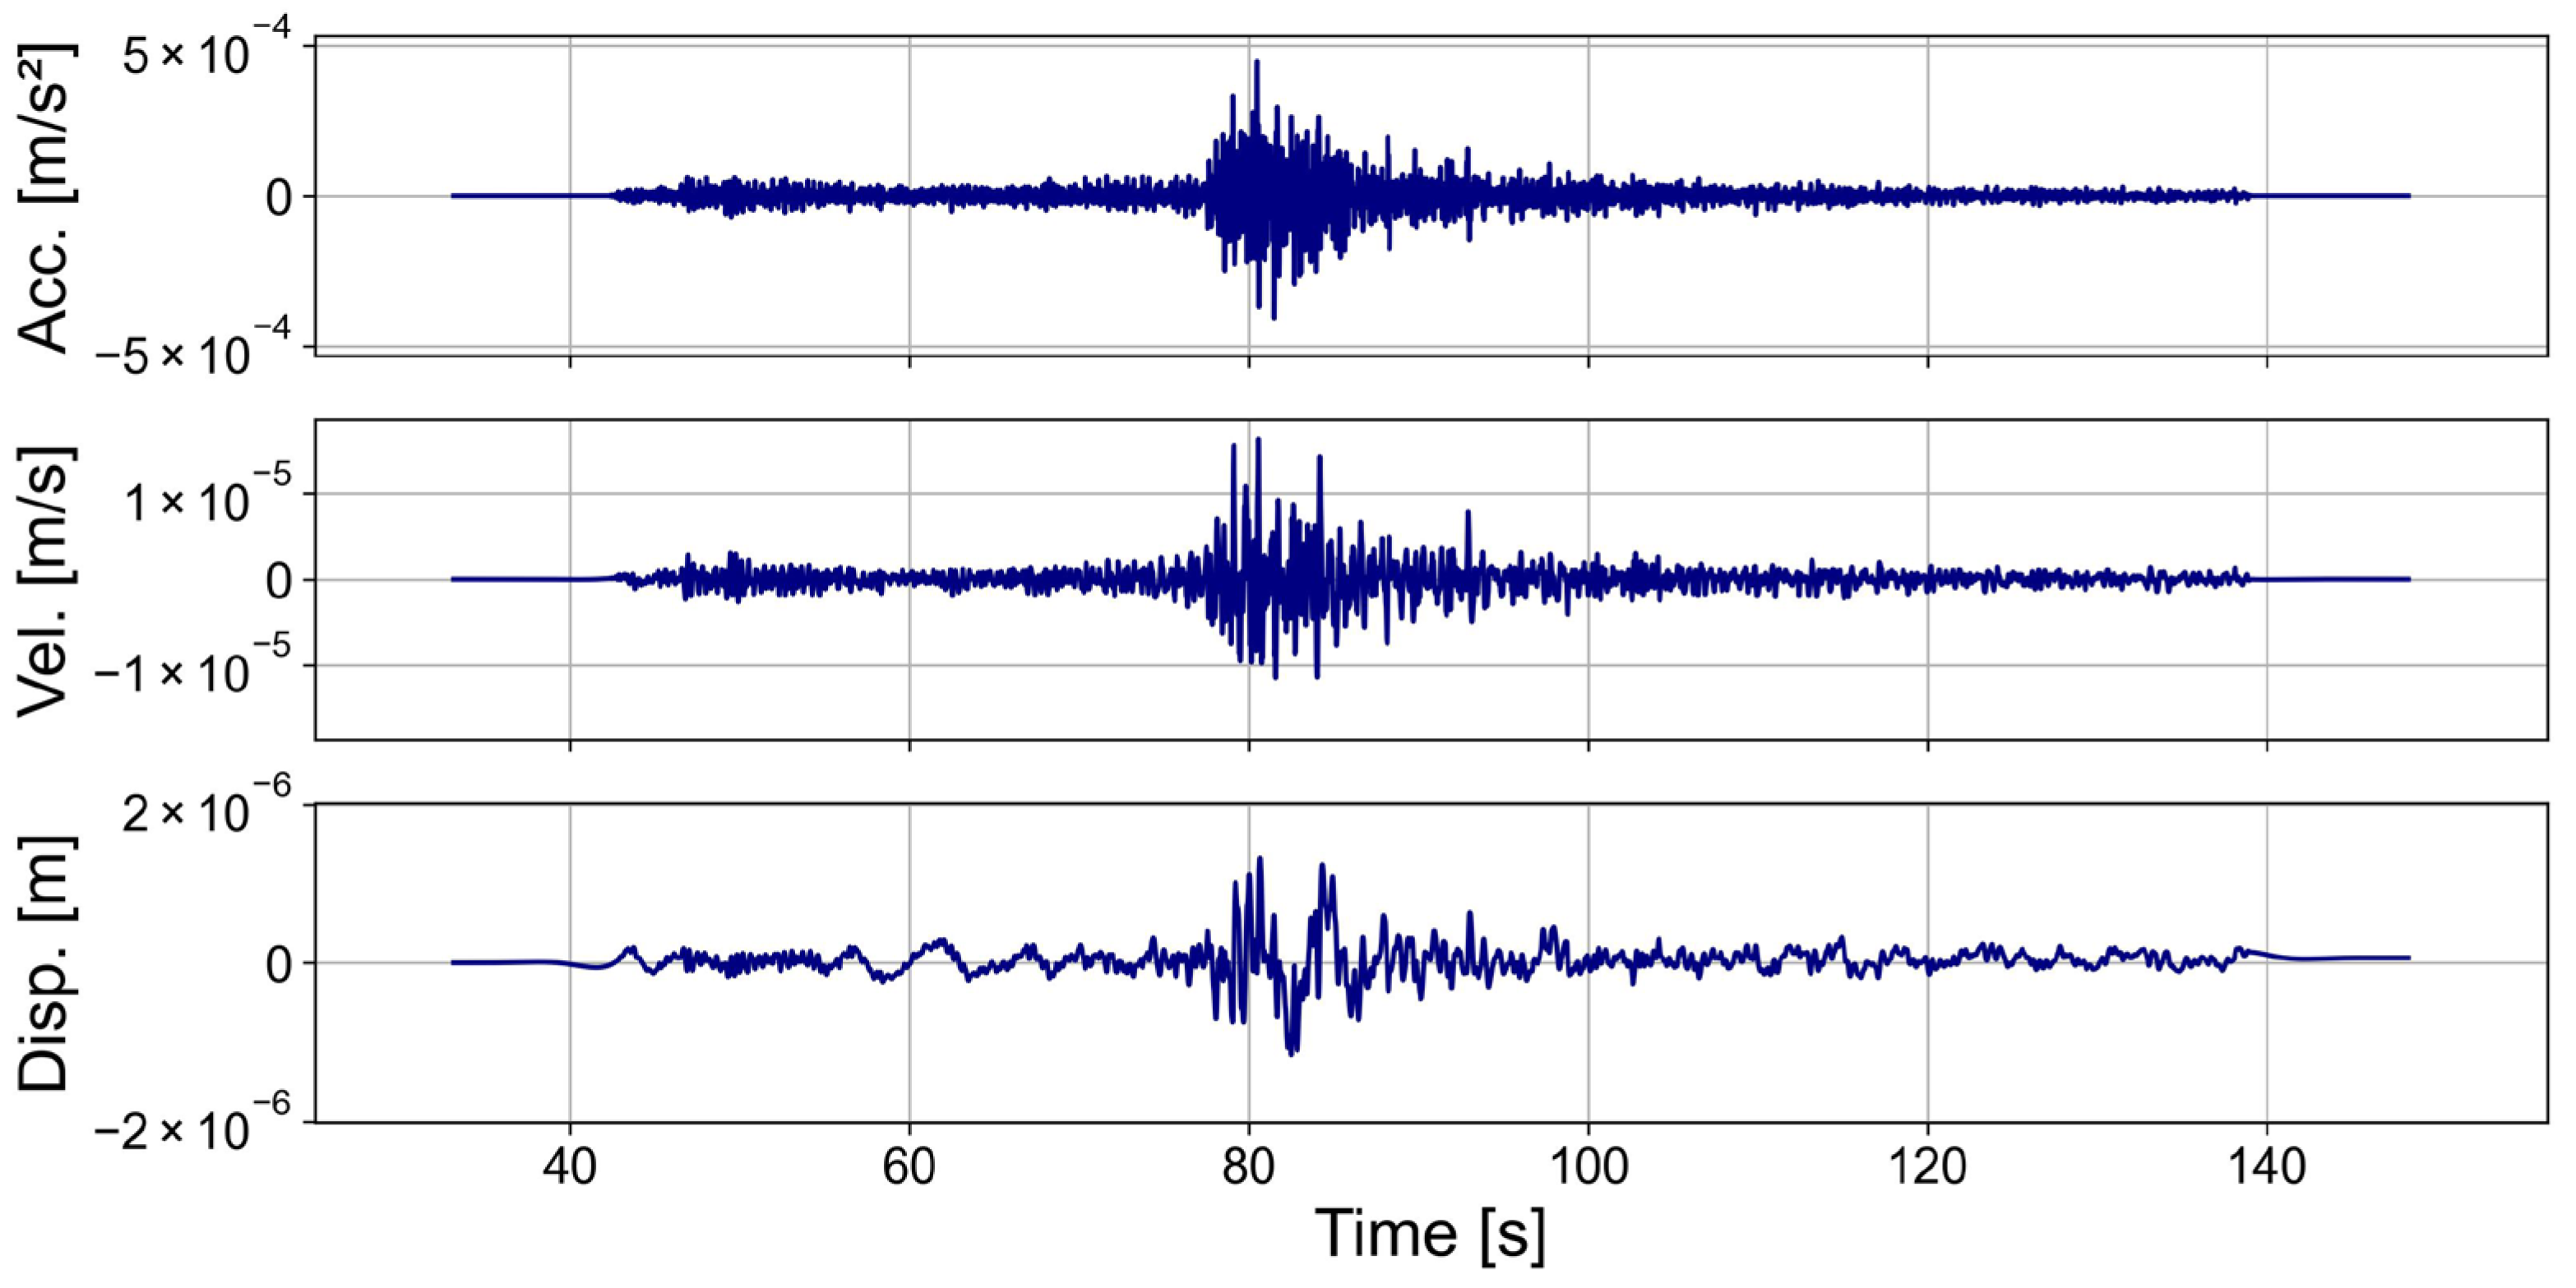
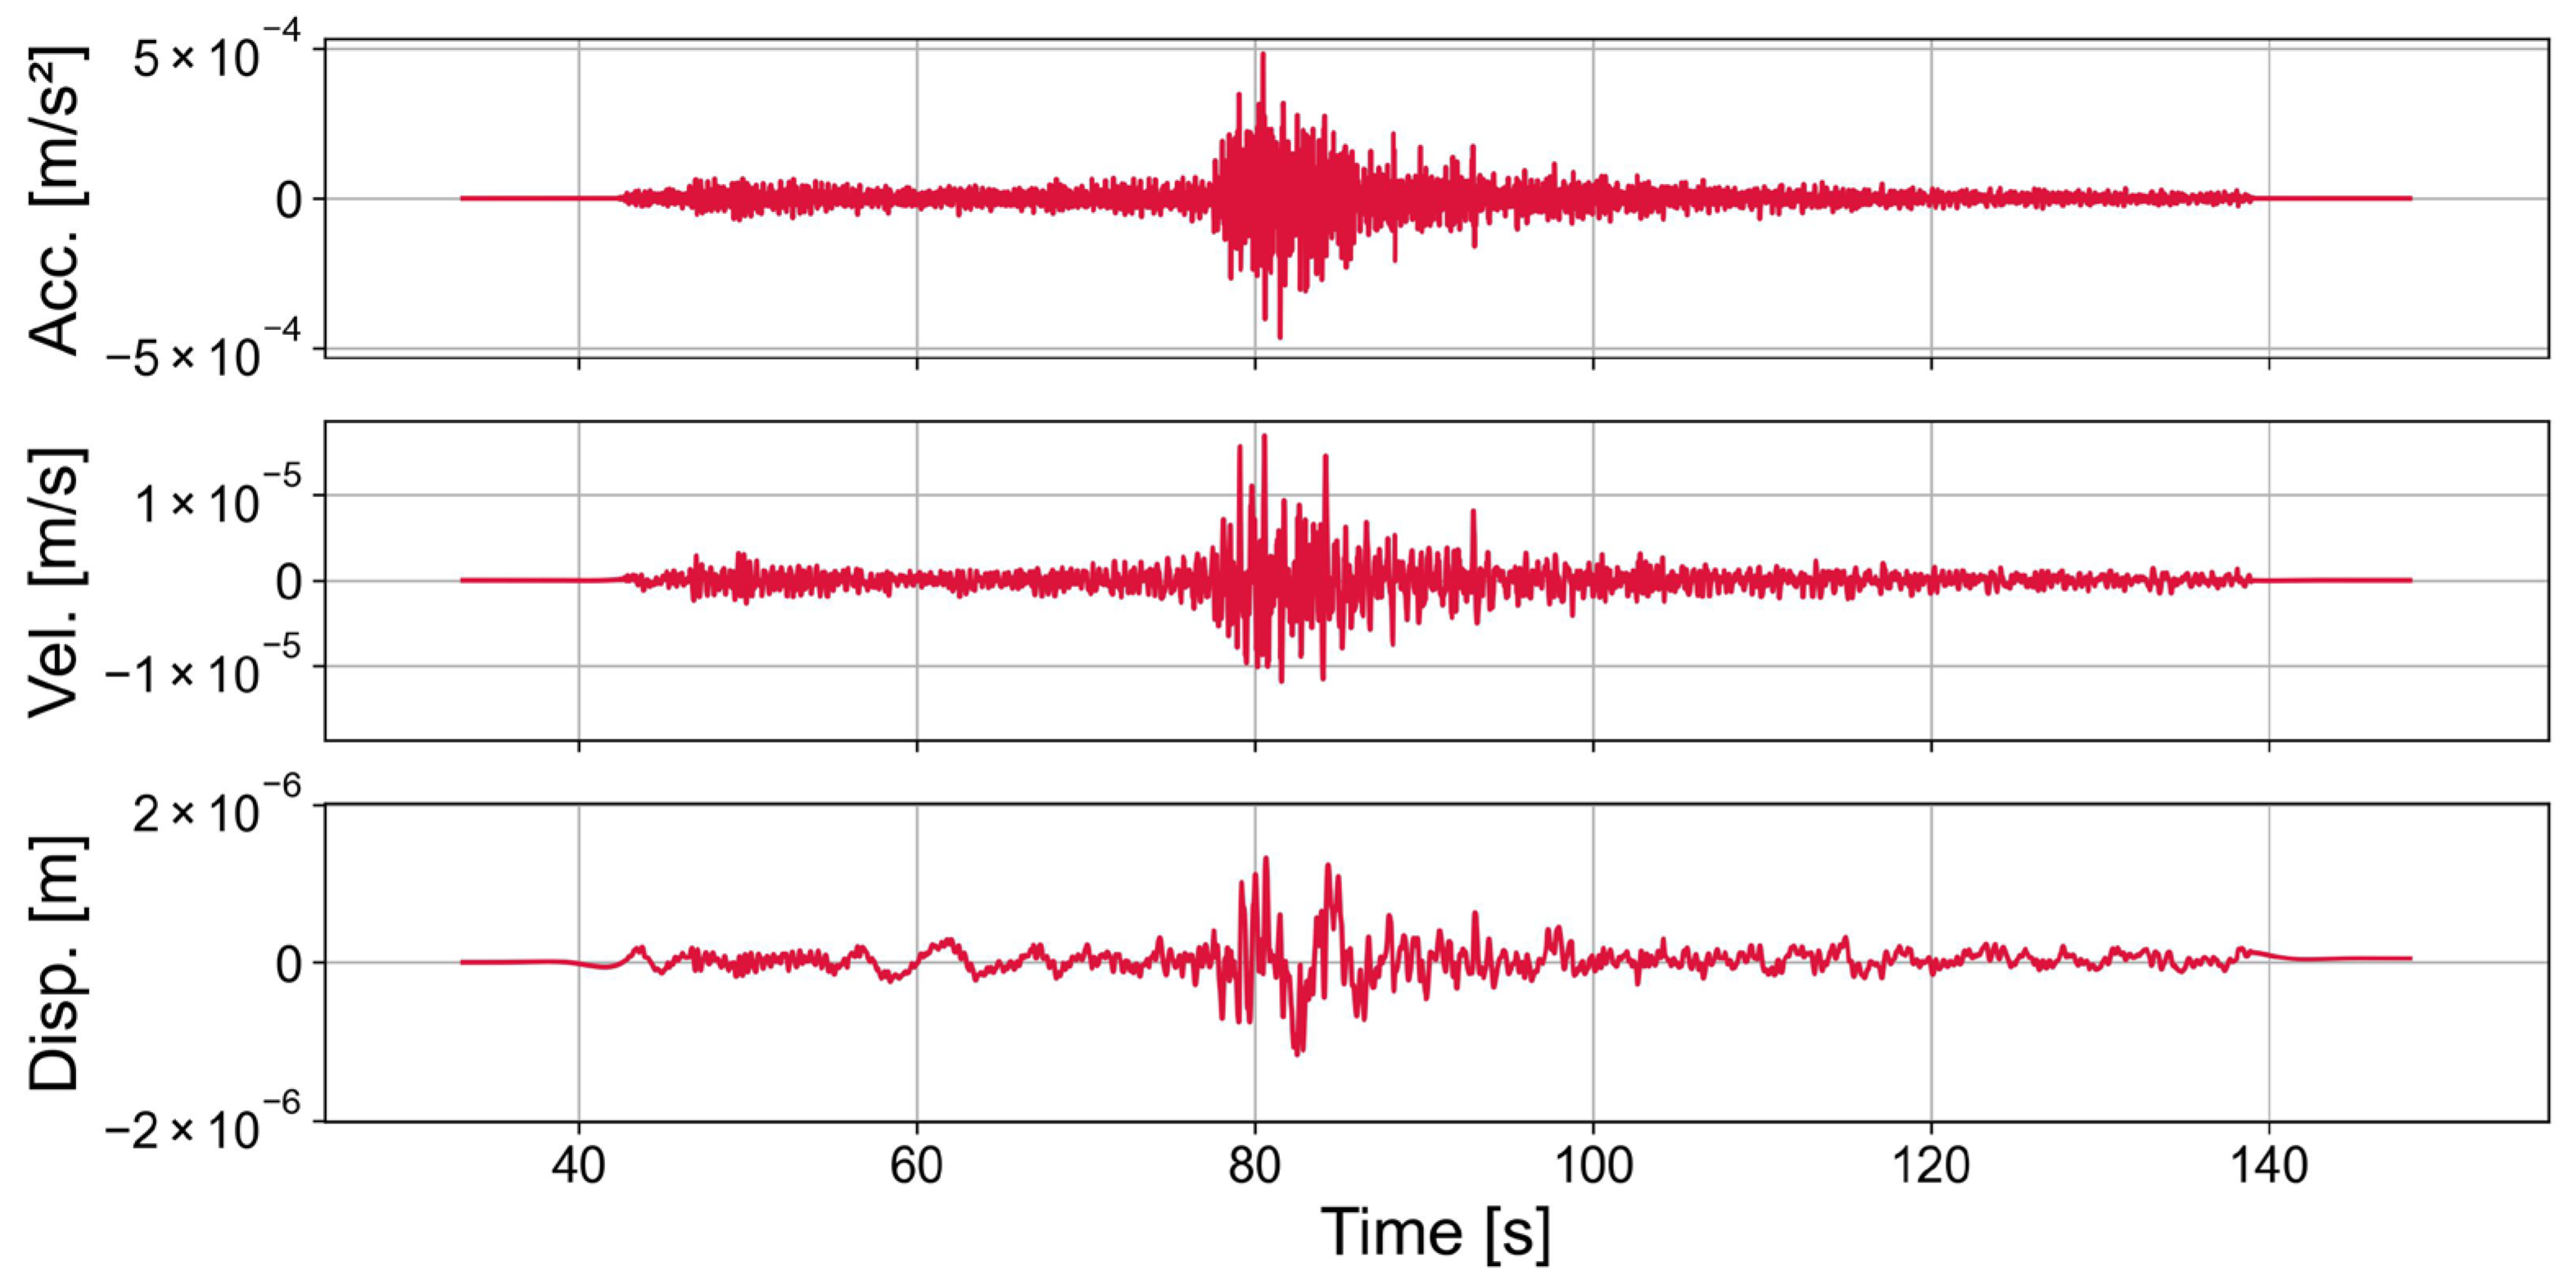
Figure 11 illustrates the acceleration, velocity, and displacement time histories of the example waveform after ABF application and ZP removal. The displacement correction in this figure is based on the NGA project method, while the velocity correction is based on the KIGAM method. Figure 12 and Figure 13 show the time histories corrected using the KIGAM and NGA methods, respectively. As shown in Figure 11, the displacement time history prior to correction does not converge to zero. The velocity-based correction method used by KIGAM yields generally stable waveforms (Figure 12), although small deviations remain in the displacement. In contrast, the displacement-based correction method from the NGA project effectively ensures convergence of the displacement time history to near zero (Figure 13). However, excessive baseline correction may distort long-period components or permanent displacements of the ground motion, highlighting the importance of carefully selecting the polynomial degree and evaluating the convergence behavior.

4. Ground Motion Characteristics Depending on Preprocessing Methods

Depending on the parameter settings used in preprocessing, there are significant variations in time series duration, amplitude, frequency content, and the convergence behavior of displacement. To investigate this, this study selected a ground motion record sensitive to preprocessing parameters and quantitatively analyzed how changes in these parameters affect the resulting ground motion characteristics. The selected record is the east–west component (HGE) of the accelerogram recorded at the KMA Hataedo station (KS.HTDA), located approximately 200 km from the epicenter of the 2024 ML3.8 Seogwipo earthquake. The following preprocessing steps were sequentially applied to this waveform to assess the effects of filtering and baseline correction:
  • Instrument response correction to convert the raw count-based record into a physical quantity (acceleration or velocity);
  • Definition of the SW using the Arias Intensity-based method;
  • Examination of waveform characteristics with varying n and corner frequencies in the ABF;
  • Evaluation of the effects of varying ZP length and regression polynomial degree during baseline correction.
Through these procedures, the effects of key preprocessing parameters on the waveform shape, frequency spectrum, and displacement convergence were analyzed both qualitatively and quantitatively.

4.1. Butterworth Filter

To analyze the effect of Butterworth filter order (n) on ground motion characteristics, variations in ground motion time histories, FAS, and 5%-damped Response Spectrum (RS) were examined for different values of n. The analysis was conducted using the SW of the example ground motion after instrument response correction. Before filtering, tapering and ZP were applied. Tapering was applied over 1% of the total signal length at both ends, and ZP was added based on the Tpad value calculated using Equation (2), which depends on n and fc-hp.
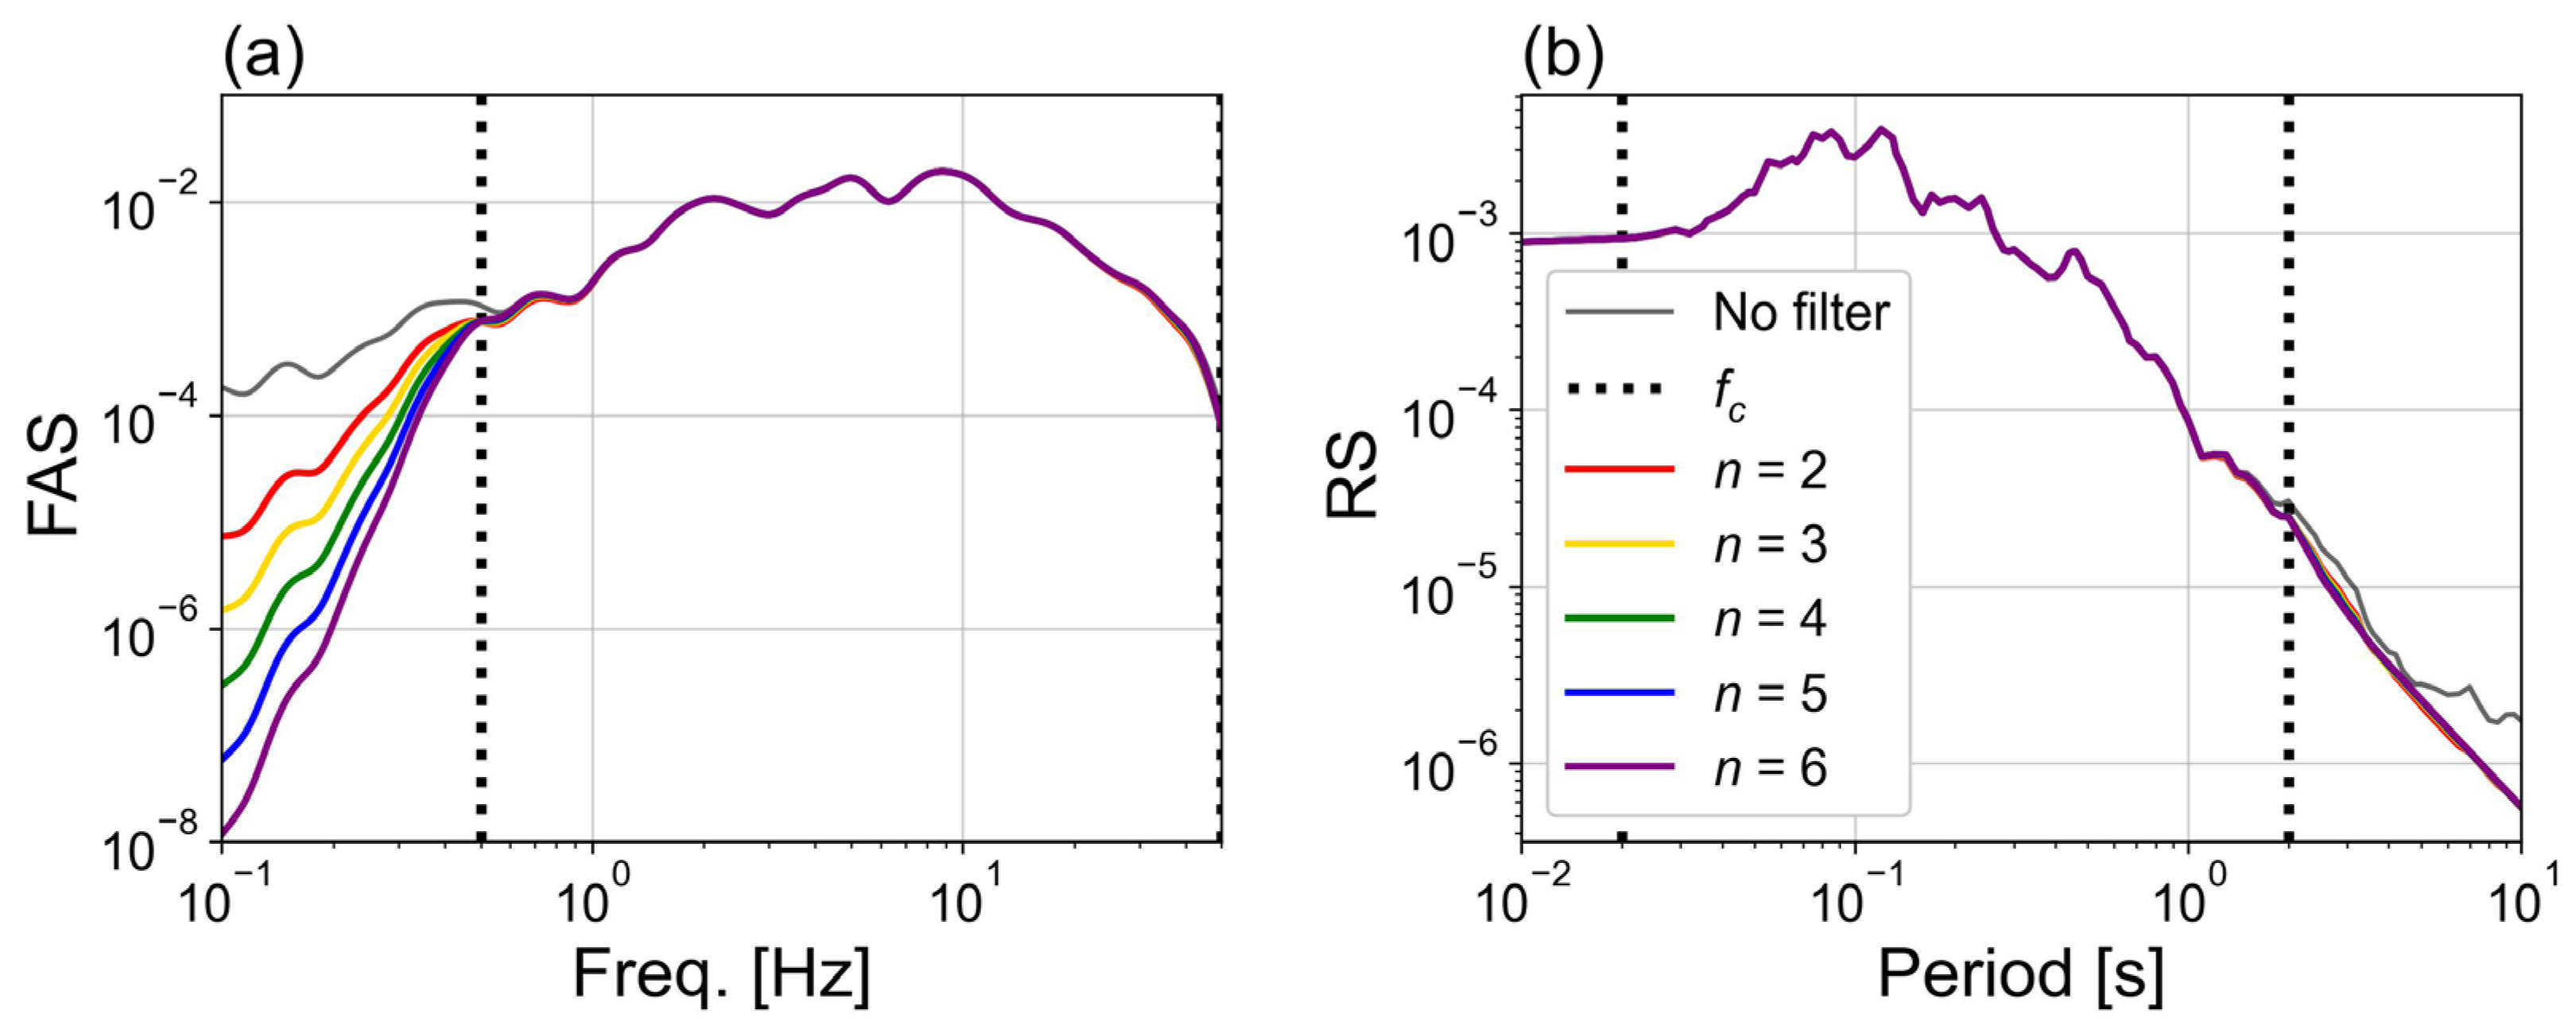
The filter order n was varied from 2 to 6, and filtering was performed using fixed corner frequencies (fc-hp = 0.5 Hz, fc-lp = 50 Hz). Figure 14 shows how FAS and RS change depending on the n. As n increases, frequency components outside the corner frequencies are more attenuated, clearly reflecting the filtering effect in FAS. In the RS, attenuation due to filtering is observed in the long-period range (above 2 s). However, the magnitude of reduction appears similar regardless of the n.
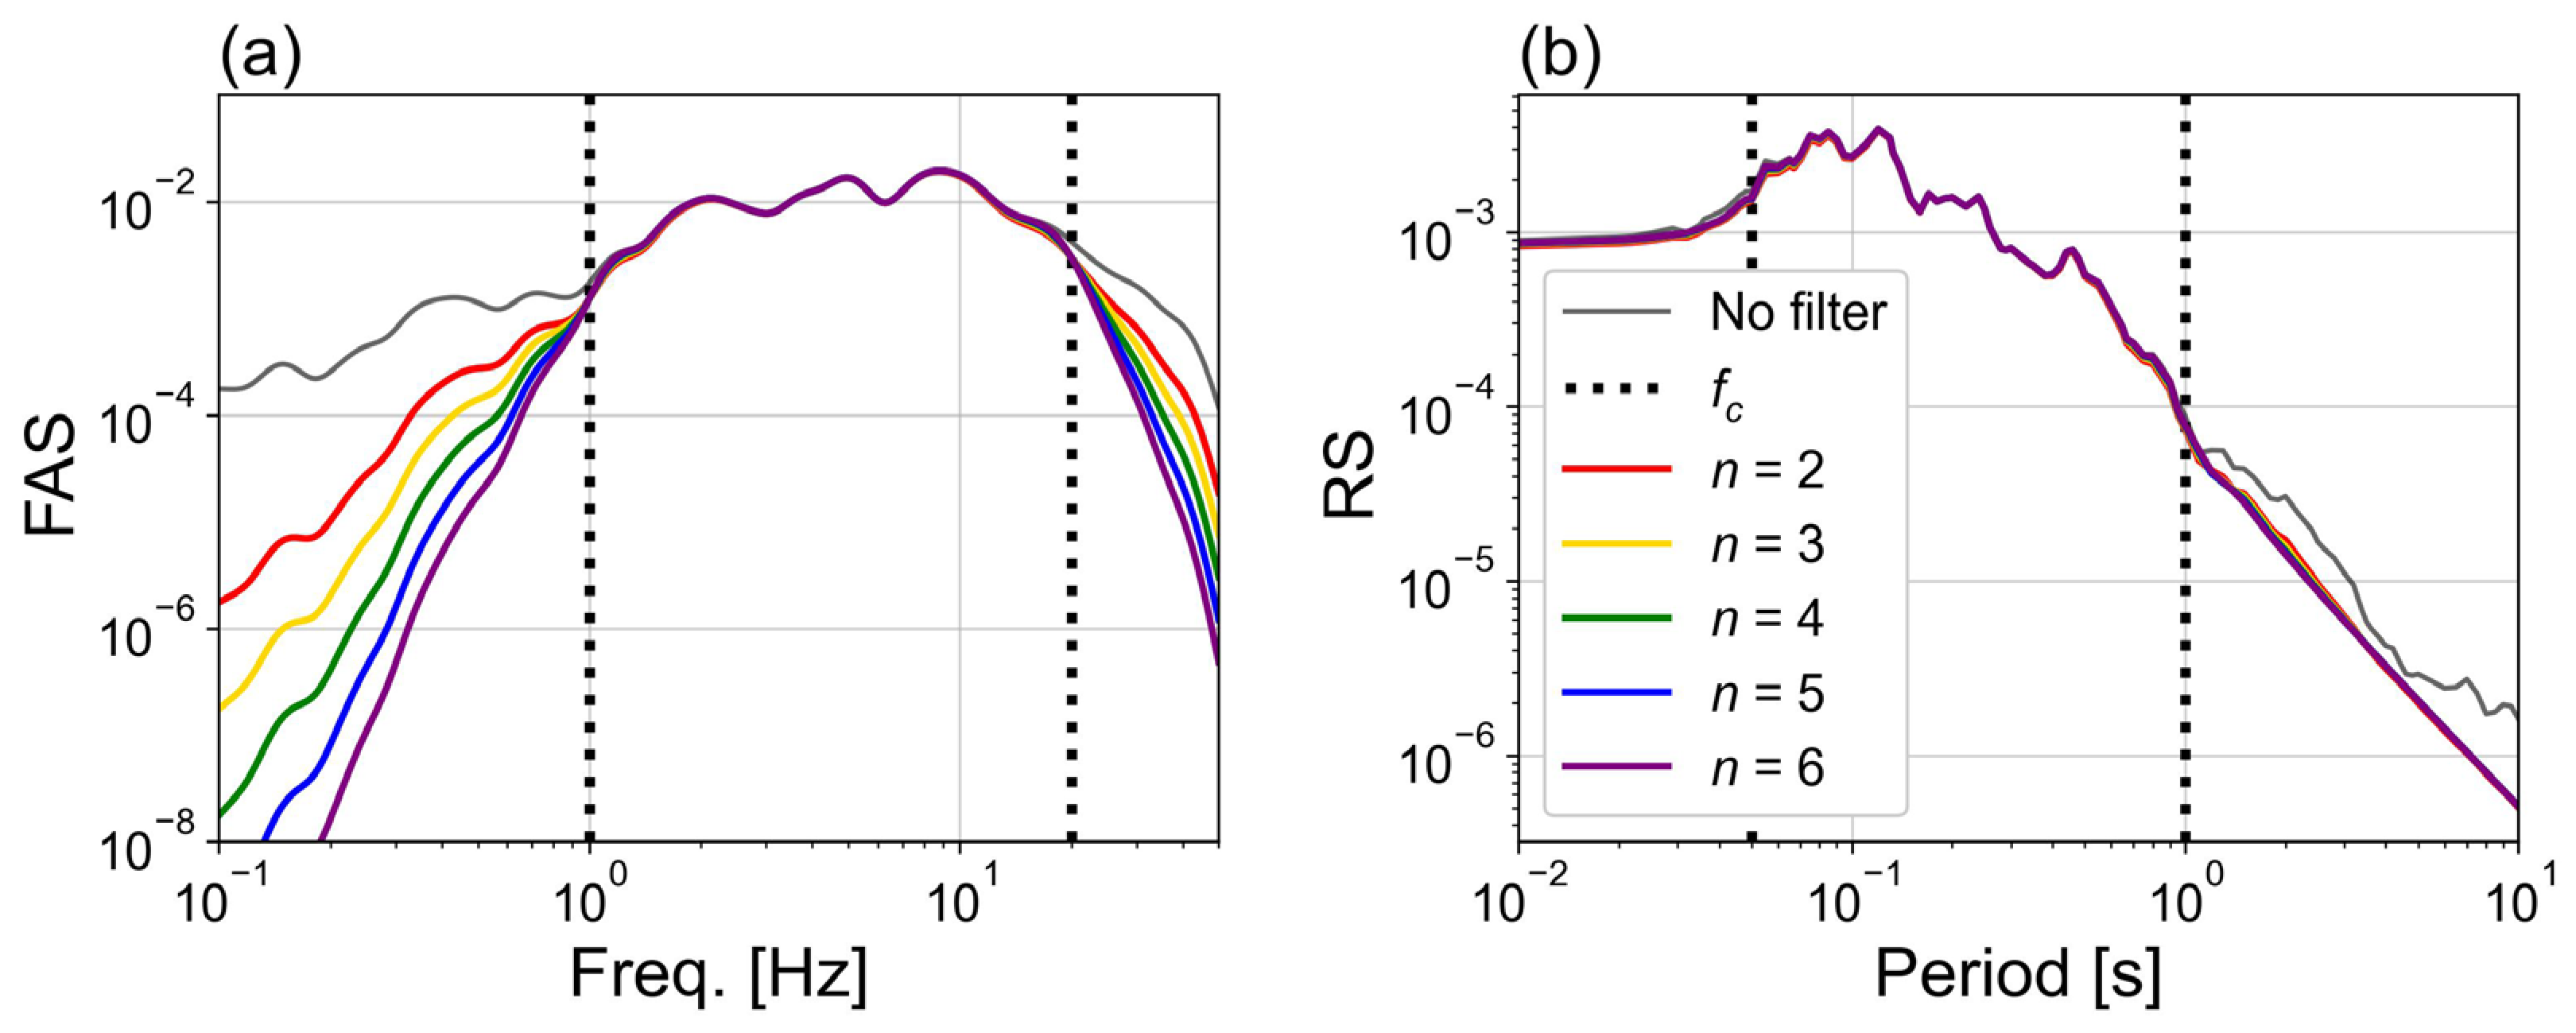
Figure 15 shows FAS and RS with narrower corner frequencies (fc-hp = 1 Hz, fc-lp = 20 Hz). Similar to Figure 14, FAS decreases outside the passband. On the other hand, for RS, little change is observed regardless of the filter settings for short periods (below 0.05 s). This is likely because the short-period RS is relatively insensitive to the high-frequency content of the signal.
We recommend n = 4, as it is the lowest filter order commonly employed in previous strong motion processing studies [6,7,8,17] and constitutes the minimum order that effectively suppresses low-frequency noise. Although a lower order produces little difference in the RS, many ground-motion records can contain substantial long-period noise that cannot be effectively attenuated with such a low order. Higher-order filters provide more substantial attenuation but may introduce waveform distortion near the corner frequencies. Thus, n = 4 offers a practical balance between noise reduction and waveform fidelity.

4.2. Baseline Correction

Baseline correction is performed to prevent divergence in the displacement time history, which can occur when the acceleration time history is integrated. In this section, we quantitatively analyze the effect of (1) the remaining length of the ZP segment and (2) the polynomial regression order on the results of baseline correction.

4.2.1. Zero Padding Length

To mitigate the distortion by ABF, ZP is added to both ends of the signal prior to filtering. However, if all ZP segments are removed after filtering, distorted signals that remain near the boundaries can lead to divergence in the displacement time history.
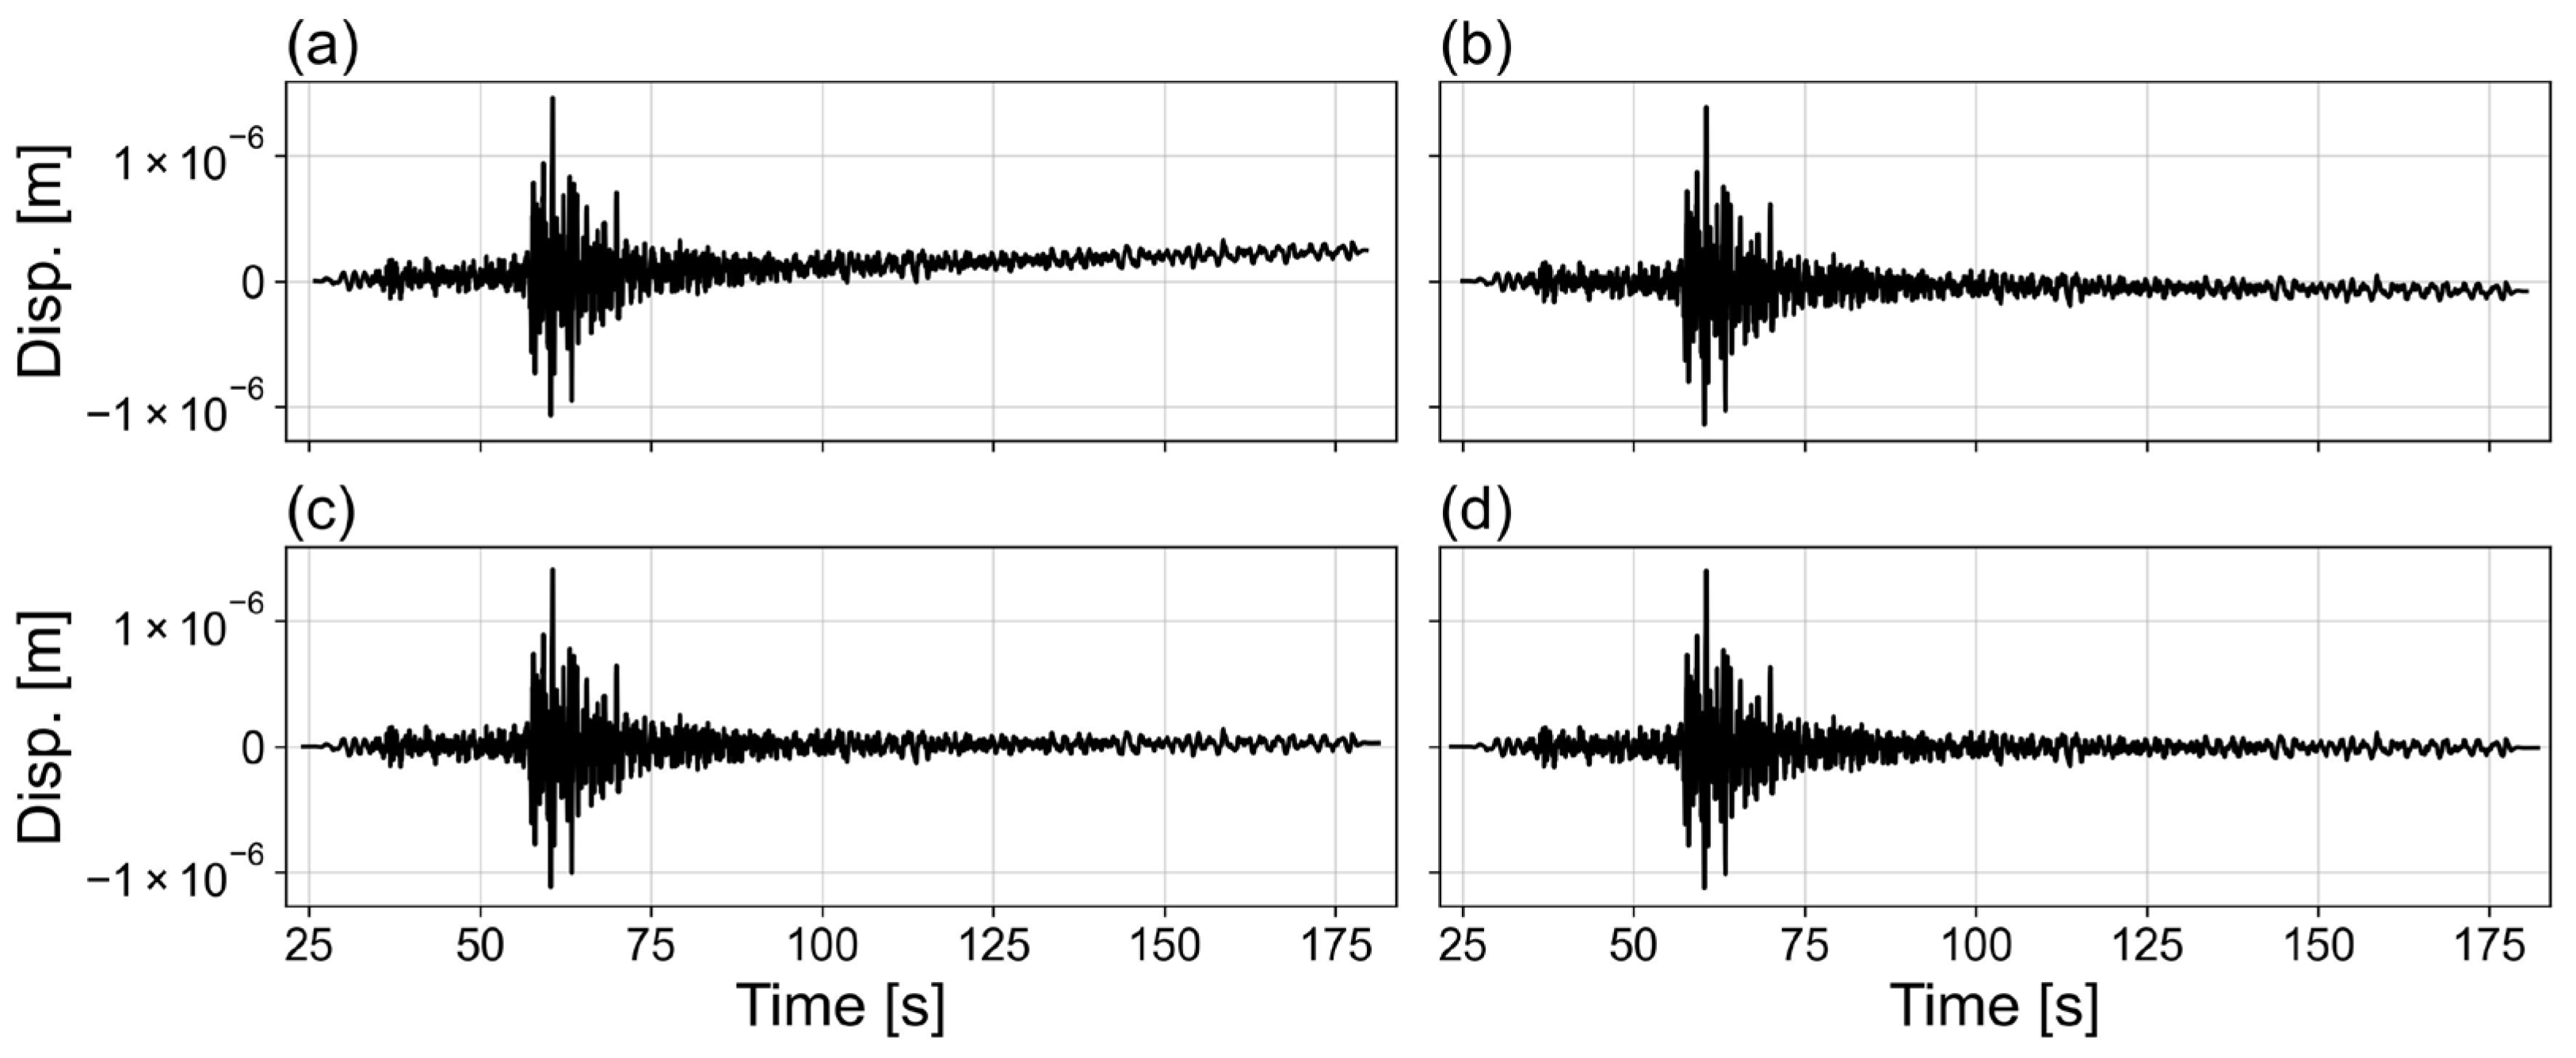
Figure 16 presents the acceleration and displacement time histories of the example ground motion when all ZP segments are removed after filtering and integration. While the acceleration time history efficiently includes only the signal window (SW), the displacement time history shows a divergent trend, failing to converge.
The characteristics of distortion introduced by the ABF vary depending on the n. Figure 17 compares the distortion patterns in the pre-signal segment of the SW when the n is varied from 2 to 6. The corner frequencies were set to fc-hp = 0.6 Hz and fc-lp = 39 Hz, based on the SNR = 3 criterion. As the n increases, high-frequency distortions become more pronounced, resulting in the formation of short-period sine wave patterns. Since the duration of these distortions depends on both the n and the fc-hp, it is necessary to appropriately retain a portion of the ZP segment after filtering.
Figure 18 compares the displacement time histories obtained after integration, with varying lengths of the retained ZP segment: 0.25 n/fc, 0.5 n/fc, 0.75 n/fc, and 1.0 n/fc, for n = 4. As the retained ZP length increases, divergence in the displacement time history is more effectively suppressed, leading to more stable convergence. However, excessively long ZP segments may be inefficient for dynamic analysis. Therefore, this study proposes retaining a ZP length of 0.5 n/fc as the optimal compromise.

4.2.2. Polynomial Regression Order

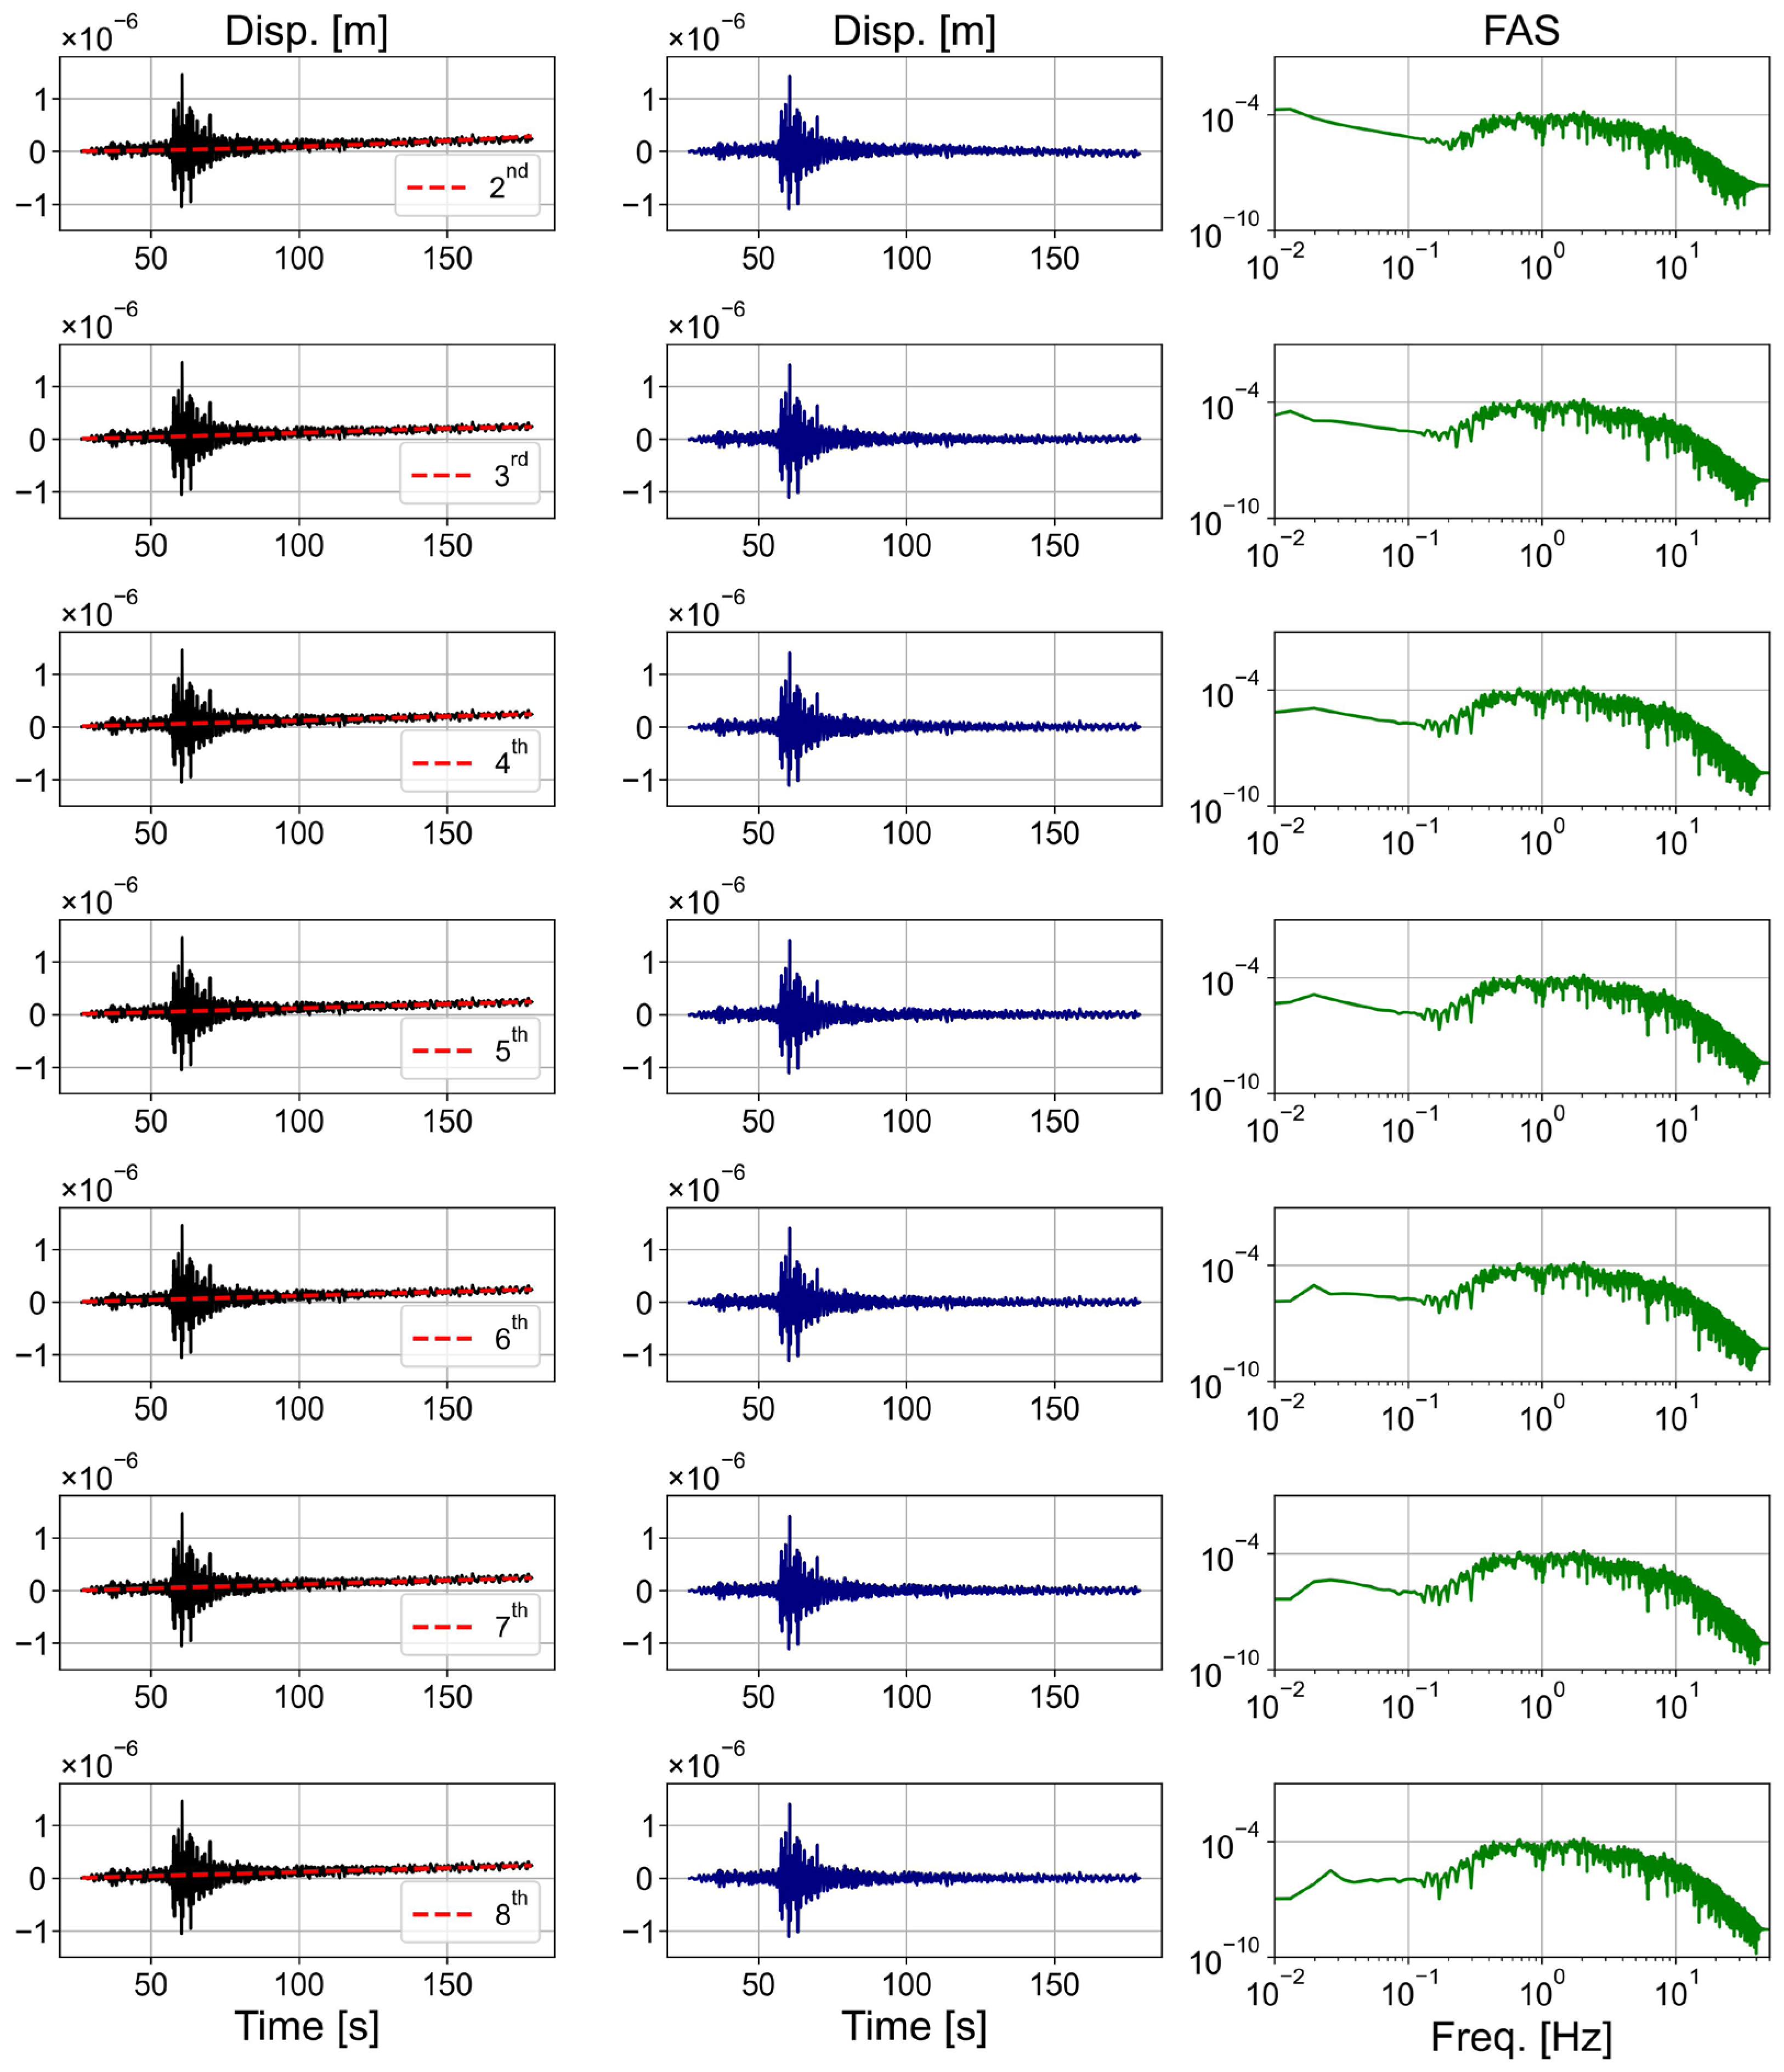
The polynomial order used in the baseline correction has a significant impact on the displacement time history. If the order is too low, the correction may be insufficient, while an excessively high order can distort the long-period components of the displacement. Figure 19 shows the results of baseline correction using polynomial regression of orders 2 through 8, applied to the displacement time history after filtering and ZP removal. To isolate the effects of polynomial order, the entire ZP segment was removed without retaining any portion. The left panel displays the original displacement time history along with the fitted polynomial regression curves; the middle panel shows the corrected displacement time histories; and the right panel presents the FAS of the corresponding displacement time histories after correction. In the cases of 2nd- and 3rd-order regression, the regression curves fail to adequately follow the diverging displacement time histories, resulting in continued divergence after correction. Conversely, when the order exceeds 6, the displacement FAS shows excessive attenuation in both low-frequency (<0.1 Hz) and high-frequency (>20 Hz) bands. This indicates that overfitting through higher-order polynomials may lead to undesired distortion in displacement. Therefore, 4th- to 6th-order polynomials are recommended, which provide a reasonable balance between displacement convergence and preservation of the spectral characteristics.

4.3. Recommendation of Preprocessing Procedure

Based on the sensitivity analysis conducted in this study, a standardized preprocessing procedure is proposed for engineering utilization of ground motion records. The proposed procedure consists of four key steps: instrument response correction, SW selection, filtering, and baseline correction.
  • Instrument Response Correction: For KMA records, the instrument response correction is performed by first retrieving the station-specific response file (RESP) from the NECIS. If the RESP file is unavailable, alternative response files provided by previous studies [11,12] are used to convert raw counts into physical quantities (i.e., acceleration or velocity time histories).
  • SW Selection: To capture the primary energy content of the ground motion while minimizing background noise, the time gradient of the NAI is utilized to define the SW. Start time is the first time point where the NAI gradient exceeds 10 times the mean gradient of the preceding segment. End time is the first time point where the gradient falls below 2 times the average of the initial period. Additional 5 s before and 10 s after are appended to the window to form the final SW.
  • Filtering: An ABF is employed, with a filter order of n = 4. The corner frequencies (fc-hp and fc-lp) are determined based on the following criteria; (1) the frequency range where the SNR exceeds 3 is used to define fc-hp and fc-lp; (2) if SNR increases again in the low-frequency range (<1 Hz), the corresponding frequency is assigned as fc-hp. Prior to filtering, a zero-padding length of 1.5 n/fc-hp is added to both ends of the SW. After filtering, ZP is trimmed remaining 0.5 n/fc-hp such that any artificially generated waveform is sufficiently attenuated.
  • Baseline Correction: The filtered acceleration time history is twice integrated to compute the displacement time history. A 6th-order polynomial regression, with the 0th and 1st orders constrained to zero, is then fitted to the displacement. The fitted curve is then twice differentiated and subtracted from the original acceleration time history. Finally, the corrected acceleration is again twice integrated to verify that the displacement time history converges toward zero, confirming the adequacy of the baseline correction.

4.4. Application to Strong Ground Motion

The proposed ground motion process procedure can also be applied to a strong ground motion. The selected record is the north–south component of the accelerogram (HGN) recorded at the KMA Ulsan station (KS.USN2), located 8.8 km from the epicenter of the 2016 ML5.8 Gyeongju earthquake which has PGA~0.43 g. Figure 20 shows the result for SW selection. The average pre-event slope of the NAI becomes very small due to high SNR, which causes the longer duration of SW.
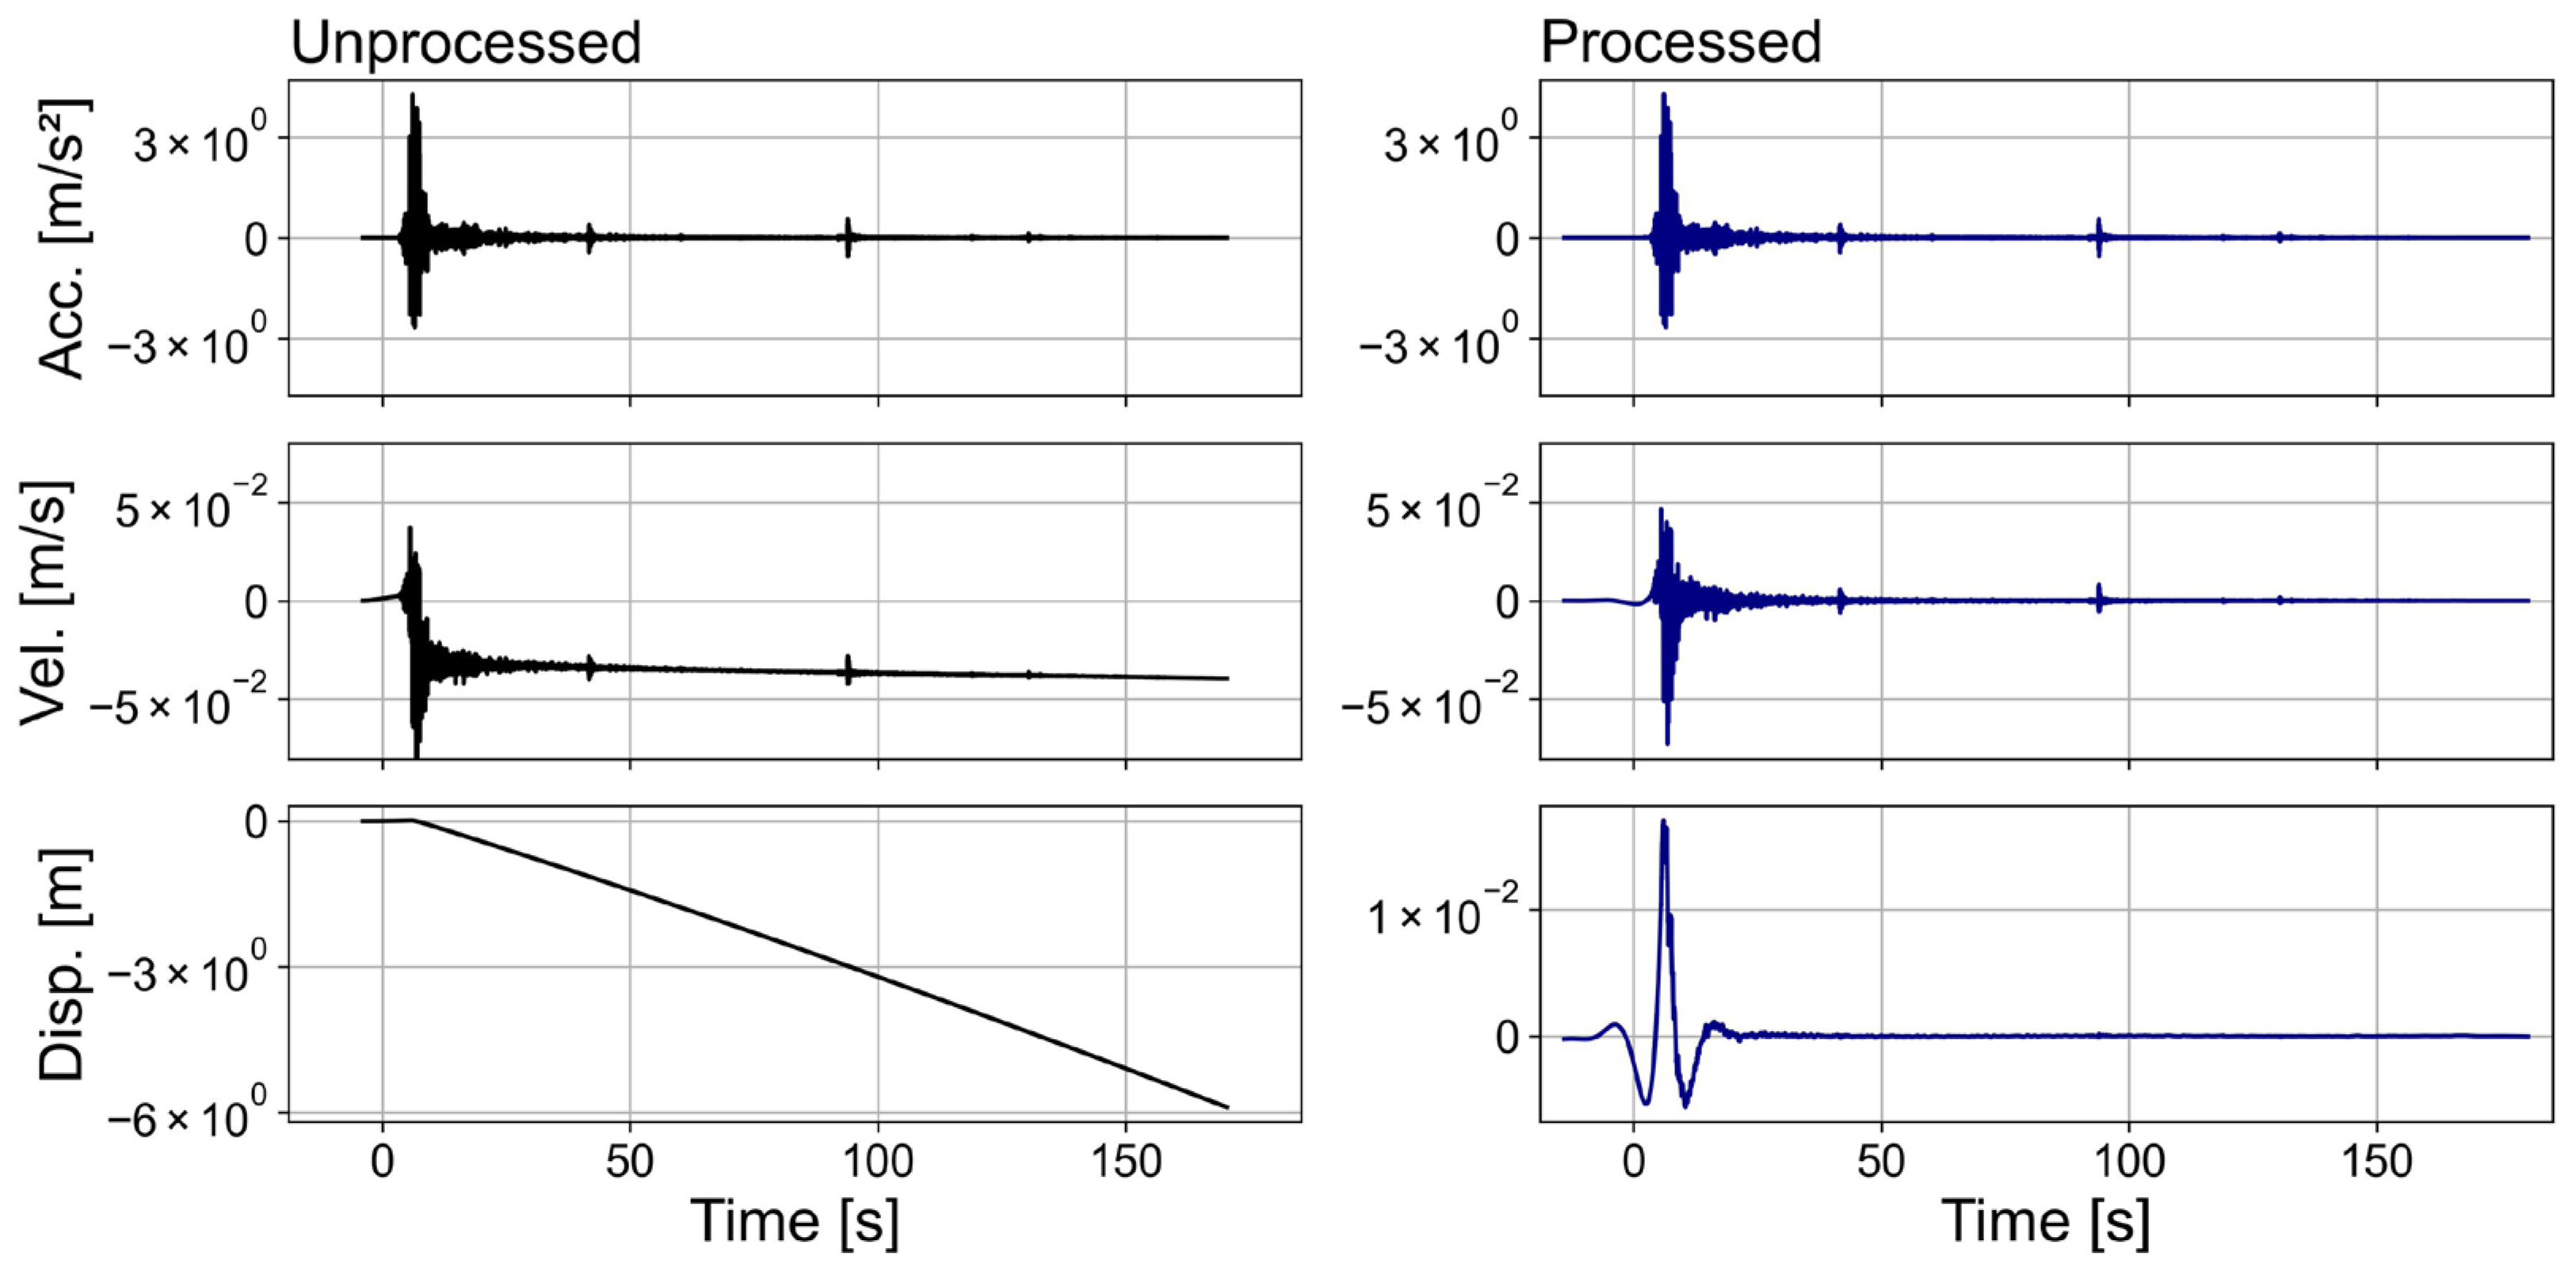
Figure 21 compares the unprocessed and processed acceleration, velocity, and displacement time histories. Instrument correction and SW selection are only applied to the unprocessed acceleration. The unprocessed velocity and displacement have a drift and divergent, respectively, while processed time histories are stable. These results confirm that the proposed procedure can be effective in suppressing baseline drift and stabilizing the integrated displacement.

5. Conclusions

In this study, a systematic preprocessing procedure was suggested to enhance the engineering applicability of ground motion records measured in South Korea. A sensitivity analysis was conducted to evaluate how each preprocessing step affects the characteristics of ground motion records. By independently analyzing SW selection, filtering, and baseline correction, the influence of processing parameters on waveform properties was examined in detail. The main findings for each step are summarized as follows:
  • Signal Window Selection: A method based on the time gradient of NAI was proposed to define the SW. Adding a padding of 5 s before the signal onset and 10 s after the end was found to be appropriate to compensate the starting and ending times of the event.
  • Filtering: The application of the ABF showed that increasing the filter order not only enhances noise suppression outside the corner frequency range but also increases waveform distortion near the filter boundaries. A higher high-pass corner frequency leads to a greater reduction in the long-period range of the RS. However, varying the filter order from 2 to 6 had negligible effects on the RS.
  • Baseline Correction: To minimize ABF-induced distortion and suppress displacement drift, it was effective to retain the ZP segment of length 0.5 n/fc before the start of the SW. For baseline correction, the displacement-based 6th-order polynomial fitting method provided sufficient stability and convergence. Nonetheless, overfitting with higher-order polynomials introduced low- and high-frequency attenuations, highlighting the need for careful selection of the regression order.
The proposed preprocessing procedure reflects the physical characteristics of strong motion records and provides a practical guideline for implementation. It is expected to contribute significantly to various engineering applications such as probabilistic seismic hazard analysis, site response analysis, and dynamic structural analysis in Korea. While the procedure can also be applied to strong ground motions, enhancing the procedure to incorporate near-fault phenomena including permanent displacements would further extend its applicability, and this will be explored in future work.

Author Contributions

Conceptualization, B.R. and D.K.; methodology, B.R. and D.K.; software, B.R.; validation, B.R. and S.B.; formal analysis, B.R.; investigation, B.R. and D.K.; resources, S.B.; data curation, B.R.; writing—original draft preparation, B.R. and D.K.; writing—review and editing, B.R., S.B. and D.K.; visualization, B.R.; supervision, D.K.; project administration, S.B.; funding acquisition, S.B. and D.K. All authors have read and agreed to the published version of the manuscript.

Funding

This work was supported by the Korea Meteorological Administration, grant number RS-2021-KM211911 and the National Research Foundation of Korea, grant number RS-2023-00220751.

Data Availability Statement

The original data (ground motions and response files) presented in the study are available in NECIS at https://necis.kma.go.kr/.

Acknowledgments

During the preparation of this manuscript/study, the author used ChatGPT 5 for the purposes of editorial check correcting grammatical error. The authors have reviewed and edited the output and take full responsibility for the content of this publication.

Conflicts of Interest

The authors declare no conflicts of interest. The funders had no role in the design of the study; in the collection, analyses, or interpretation of data; in the writing of the manuscript; or in the decision to publish the results.

Abbreviations

The following abbreviations are used in this manuscript:
ABFAcausal Butterworth filter
FASFourier amplitude spectrum
NAINormalized Arias intensity
PGAPeak Ground Acceleration
RSResponse spectrum
SNRSignal-to-noise ratio
SWSignal window
ZPZero padding

References

  1. Bozorgnia, Y.; Abrahamson, N.A.; Atik, L.A.; Ancheta, T.D.; Atkinson, G.M.; Baker, J.W.; Baltay, A.; Boore, D.M.; Campbell, K.W.; Chiou, B.S.J.; et al. NGA-West2 research project. Earthq. Spectra 2014, 30, 973–987. [Google Scholar] [CrossRef]
  2. Dawood, H.M.; Rodriguez-Marek, A.; Bayless, J.; Goulet, C.; Thompson, E. A Flatfile for the KiK-net Database Processed Using an Automated Protocol. Earthq. Spectra 2016, 32, 1281–1302. [Google Scholar] [CrossRef]
  3. Jones, J.; Kalkan, E.; Stephens, C.; Ng, P. PRISM Software: Processing and Review Interface for Strong-Motion Data. Seismol. Res. Lett. 2017, 88, 851–866. [Google Scholar] [CrossRef]
  4. Puglia, R.; Russo, E.; Luzi, L. Strong-motion processing service: A tool to access and analyse earthquakes strong-motion waveforms. Bull. Earthq. Eng. 2018, 16, 2641–2651. [Google Scholar] [CrossRef]
  5. Ancheta, T.D.; Darragh, R.B.; Stewart, J.P.; Seyhan, E.; Silva, W.J.; Chiou, B.S.J.; Wooddell, K.E.; Graves, R.W.; Kottke, A.R.; Boore, D.M.; et al. NGA-West2 database. Earthq. Spectra 2014, 30, 989–1005. [Google Scholar] [CrossRef]
  6. Goulet, C.A.; Kishida, T.; Ancheta, T.D.; Cramer, C.H.; Darragh, R.B.; Silva, W.J.; Hashash, Y.M.; Harmon, J.; Parker, G.A.; Stewart, J.P.; et al. PEER NGA-east database. Earthq. Spectra 2021, 37, 1331–1353. [Google Scholar] [CrossRef]
  7. Thompson, E.M.; Hearne, M.; Aagaard, B.T.; Rekoske, J.M.; Worden, C.B.; Moschetti, M.P.; Hunsinger, H.E.; Ferragut, G.C.; Parker, G.A.; Smith, J.A.; et al. Automated, near real time ground motion processing at the US Geological Survey. Seism. Res. Lett. 2025, 96, 538–553. [Google Scholar] [CrossRef]
  8. Lee, M.G.; Kim, Y.; Cho, H.I.; Kim, H.S.; Sun, C.G.; Seong, Y.J.; Che, I.Y. KIGAM Quake: An open platform for seismological data and earthquake research information. Geomech. Eng. 2024, 37, 279–291. [Google Scholar]
  9. National Earthquake Comprehensive Information System (NECIS). Available online: https://necis.kma.go.kr/ (accessed on 15 October 2025).
  10. Beyreuther, M.; Barsch, R.; Krischer, L.; Megies, T.; Behr, Y.; Wassermann, J. ObsPy: A Python Toolbox for Seismology. Seismol. Res. Lett. 2010, 81, 530–533. [Google Scholar] [CrossRef]
  11. Lim, H.; Kim, Y.H. A dataset of seismic sensor responses of South Korea seismic stations. J. Geol. Soc. Korea 2020, 56, 515–524. [Google Scholar] [CrossRef]
  12. Ahn, B.S.; Kang, T.; Jung, J.O. Station metadata integration of regional seismic networks in the southern Korean Peninsula. J. Geol. Soc. Korea 2024, 60, 111–119. [Google Scholar] [CrossRef]
  13. Butterworth, S. On the theory of filter amplifiers. Wirel. Eng. 1930, 7, 536–541. [Google Scholar]
  14. Konno, K.; Ohmachi, T. Ground-motion characteristics estimated from spectral ratio between horizontal and vertical components of microtremor. Bull. Seism. Soc. Am. 1998, 88, 228–241. [Google Scholar] [CrossRef]
  15. Converse, A.; Brady, A.G. BAP: Basic Strong-Motion Accelerogram Processing Software, Version 1.0; US Department of the Interior, US Geological Survey: Reston, VA, USA, 1992.
  16. Boore, D.M. On pads and filters: Processing strong-motion data. Bull. Seism. Soc. Am. 2005, 95, 745–750. [Google Scholar] [CrossRef]
  17. Boore, D.M.; Bommer, J.J. Processing of strong-motion accelerograms: Needs, options and consequences. Soil Dynam. Earthq. Eng. 2005, 25, 93–115. [Google Scholar] [CrossRef]
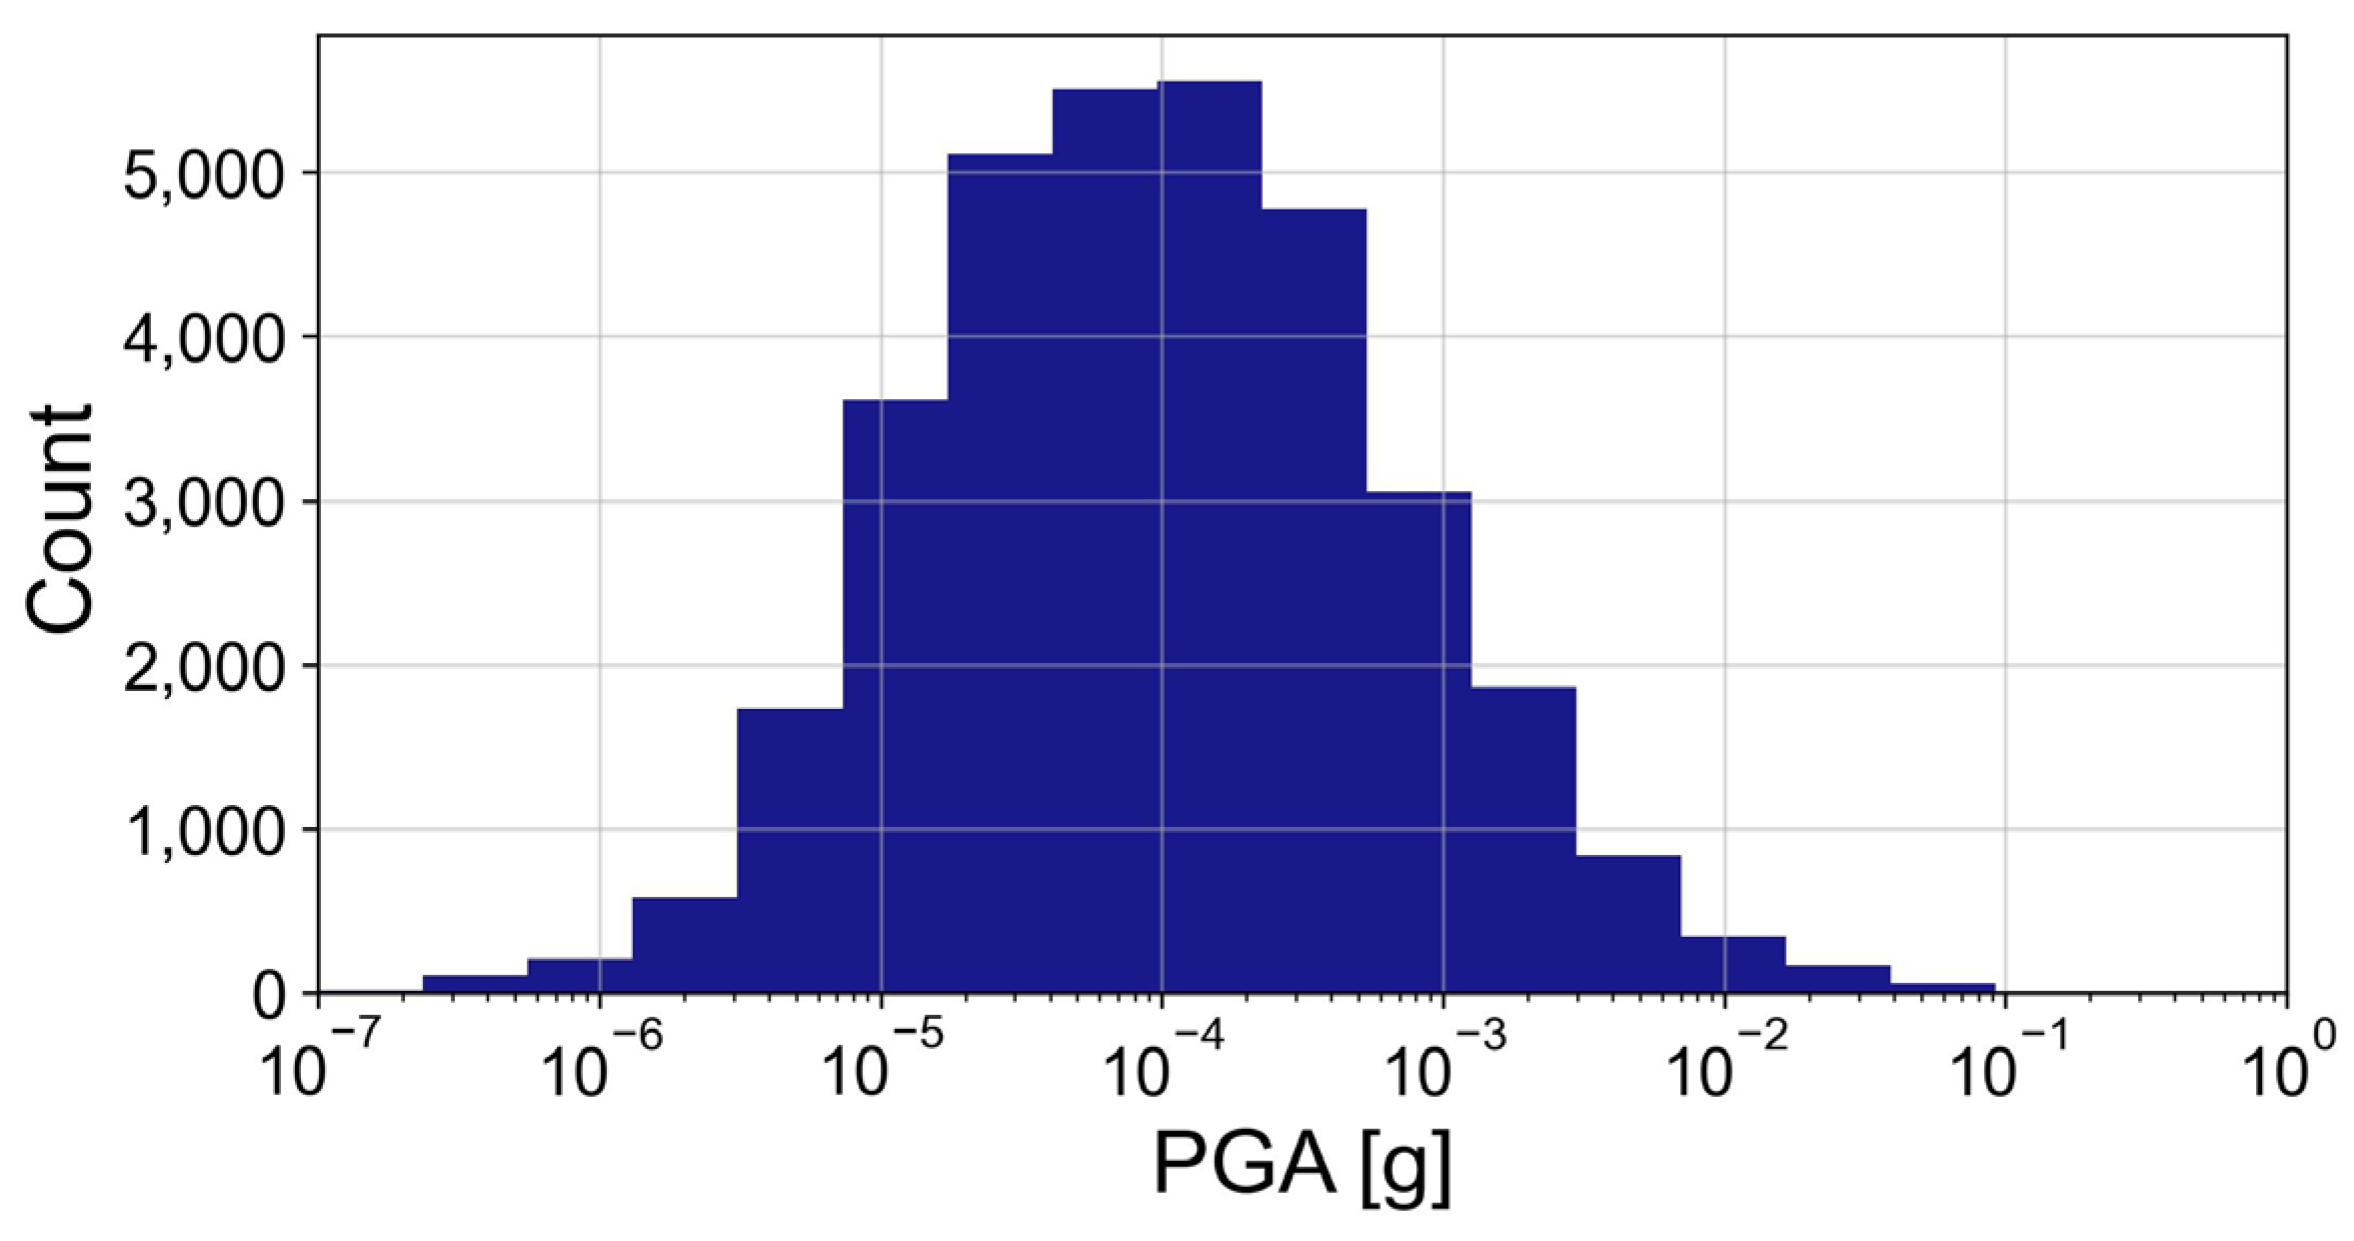
Figure 1. Histograms of peak ground accelerations (PGAs) from KMA ground motion records collected for earthquakes with ML ≥ 3.5 between 2000 and August 2025.
Applsci 15 12453 g001
Figure 2. Locations of national seismic stations operated by (a) KMA and (b) KIGAM.
Applsci 15 12453 g002
Figure 3. Flow chart for ground motion preprocessing.
Applsci 15 12453 g003
Figure 4. Ground motion time series for 2025 ML3.7 Taean earthquake, recorded at KS.JOGB seismic station (accelerometer, north–south component). (a) raw time series, (b) time series after instrument response adjustment.
Applsci 15 12453 g004
Figure 5. Normalized arias intensity and window selection results (yellow background) without buffer padding for 2025 ML3.7 Taean earthquake, KS.JOGB seismic station: (a) the empirical P-wave arrival and NGA-East approach, (b) 1–99% NAI approach, (c) the proposed slope-based method.
Applsci 15 12453 g005
Figure 6. Windowed ground motion time series for 2025 ML3.7 Taean earthquake, KS.JOGB seismic station.
Applsci 15 12453 g006
Figure 7. Signal-to-noise ratio (SNR) and corner frequencies decided for the example ground motion: (a) FAS of the signal and noise, (b) SNR.
Applsci 15 12453 g007
Figure 8. Beginning part of SW: (a) before tapering, (b) after tapering.
Applsci 15 12453 g008
Figure 9. Fourier amplitude spectrum (FAS) of the signal before and after filtering.
Applsci 15 12453 g009
Figure 10. Time series at the boundary of zero pad and signal, illustrating the beginning of the SW: (a) before ABF, (b) after ABF.
Applsci 15 12453 g010
Figure 11. Acceleration, velocity, displacement time series after filtering, and polynomial fits to velocity and acceleration following KIGAM and NGA approaches, respectively.
Applsci 15 12453 g011
Figure 12. Acceleration, velocity, displacement time series after baseline correction following KIGAM approach.
Applsci 15 12453 g012
Figure 13. Acceleration, velocity, displacement time series after baseline correction following NGA approach.
Applsci 15 12453 g013
Figure 14. (a) Fourier amplitude spectra (FAS) and (b) 5% response spectra (RS) before and after filtering with 2 to 6 Butterworth poles for an example ground motion with [fc-hp = 0.5 Hz and fc-lp = 50 Hz].
Applsci 15 12453 g014
Figure 15. (a) Fourier amplitude spectra (FAS) and (b) 5% response spectra (RS) before and after filtering with 2 to 6 Butterworth poles for an example ground motion with [fc-hp = 1 Hz and fc-lp = 20 Hz].
Applsci 15 12453 g015
Figure 16. (a) Acceleration and (b) displacement time series after filtering without pad for the example ground motion with [n = 4, fc-hp = 0.6 Hz, and fc-lp = 39 Hz].
Applsci 15 12453 g016
Figure 17. Initial part of acceleration time series after filtering with n = 2 to n = 6 for the example ground motion with [fc-hp = 0.6 Hz and fc-lp = 39 Hz].
Applsci 15 12453 g017
Figure 18. Displacement time series after filtering and integration with variable Tpad remained for the example ground motion with [n = 4, fc-hp = 0.6 Hz, and fc-lp = 39 Hz]. (a) T p a d = 0.25 n / f c , (b) T p a d = 0.5 n / f c , (c) T p a d = 0.75 n / f c , and (d) T p a d = 1.0 n / f c .
Applsci 15 12453 g018
Figure 19. Displacement time series after filtering and polynomial fit (red dashed line) (left panel), displacement after baseline correction (center panel), and displacement FAS (right panel) varying polynomial order from 2nd to 8th.
Applsci 15 12453 g019
Figure 20. SW selection for the 2016 ML5.8 Gyeongju earthquake recorded at KS.USN2 station using the proposed NAI-slope method. The top panel shows the normalized Arias intensity, the middle panel shows its slope with the threshold levels, and the bottom panel presents the corresponding acceleration record. The selected window is highlighted in yellow.
Applsci 15 12453 g020
Figure 21. Comparison of the unprocessed and processed time histories for the 2016 ML5.8 Gyeongju earthquake record at KS.USN2 station.
Applsci 15 12453 g021
Disclaimer/Publisher’s Note: The statements, opinions and data contained in all publications are solely those of the individual author(s) and contributor(s) and not of MDPI and/or the editor(s). MDPI and/or the editor(s) disclaim responsibility for any injury to people or property resulting from any ideas, methods, instructions or products referred to in the content.