Article

The Use of the Idea of Loan Extraction to Produce a Skin Care Serum (Cosmetic) Containing a High Concentration of Bioactive Ingredients Isolated from Calendula officinalis L. Petals

by
Wiktoria Orzechowicz
1,
Tomasz Wasilewski
1,2,*,
Zofia Hordyjewicz-Baran
1,
Natalia Stanek-Wandzel
1,
Katarzyna Malorna
1 and
Joanna Fleszer
1
1
Łukasiewicz Research Network-Institute of Heavy Organic Synthesis “Blachownia”, Energetykow 9, 47-225 Kedzierzyn-Kozle, Poland
2
Department of Cosmetology, Faculty of Medical and Health Sciences, University of Radom, Chrobrego 27, 26-600 Radom, Poland
*
Author to whom correspondence should be addressed.
Appl. Sci. 2025, 15(23), 12444; https://doi.org/10.3390/app152312444
Submission received: 17 October 2025 / Revised: 16 November 2025 / Accepted: 19 November 2025 / Published: 24 November 2025
(This article belongs to the Special Issue Novel Extraction Methods and Applications)

Abstract

In this study, the concept of loan extraction was used to design a skin care serum (cosmetic) containing high concentrations of bioactive components isolated from marigold petals. A series of extraction media derived from the final formulation were used. The effect of the type of medium on the quality of the extracts obtained was evaluated based on the physicochemical properties of the extracts and the concentrations of the extracted bioactive compounds (phenolic acids, polyphenols, amino acids, and sugars) determined by LC-MS/MS. The antioxidant potential was measured using UV-Vis methods. The final preparations were analyzed for the effect of the extract addition on physicochemical parameters (stability, viscosity, color) and anti-irritant properties. LC-MS/MS identification confirmed the presence of key phenolic metabolites of Calendula officinalis L. (including phenolic acids and flavonoids) and accompanying amino acids and sugars. The UV-Vis technique confirmed the antioxidant properties of the obtained extracts. The resulting serum shows a low value of anti-irritant potential without significantly impairing the physicochemical parameters of the product. The obtained results confirmed the possibility of direct use of Calendula officinalis L. extracts in cosmetic serum formulations, obtaining additional functional benefits.

1. Introduction

The skin, being the largest organ of the human body, performs key physiological functions, including serving as an essential protective barrier against environmental factors, preventing the entry of pathogens, affecting thermoregulation, and enabling sensory perception [1]. In addition to its protective functions, the skin plays an important role in maintaining overall health and has a significant impact on self-esteem and even quality of life [2]. However, the skin is exposed to a variety of daily challenges that can affect its integrity and function. Environmental pollution, ultraviolet (UV) radiation, and harsh weather conditions cause oxidative stress and inflammation, which can accelerate the aging process of the skin and lead to problems such as dryness, loss of elasticity, and irritation [3]. Additionally, lifestyle factors such as insufficient hydration, poor diet, and high levels of psychological stress increase the skin’s susceptibility to irritation and other dermatological conditions [4]. The cumulative effect of these stressors affects not only the esthetics of the skin but also weakens its defense mechanisms, emphasizing the need for effective skincare treatments. These measures are designed to restore and maintain skin health in the face of ongoing environmental and lifestyle challenges [5].
In line with growing concerns about the use of synthetic chemicals in cosmetic products, there is an increasing trend toward natural and plant-based ingredients in cosmetic formulations. Consumers increasingly prefer products that are perceived as safer, more sustainable, and consistent with a holistic approach to health and well-being [6]. Plant extracts are characterized by a high content of bioactive compounds with antioxidant, anti-inflammatory, and antibacterial properties. These compounds exhibit a favorable safety profile and support skin health [7]. The multifunctionality of plant extracts allows them to address various skin problems simultaneously, influencing the effectiveness of cosmetic formulations. Additionally, sustainable and environmentally friendly plant sources respond to the growing demand for ethically produced products while minimizing negative environmental impact and supporting innovation in the cosmetics industry in the context of the development of modern skincare solutions [8].
Marigold (Calendula officinalis L.) is a plant with a rich tradition in folk medicine, as well as in the pharmaceutical and cosmetics industries. It is characterized by intense, colorful flowers with a wide range of tones, from sunny yellow and orange to deep red and mahogany shades. In addition to its esthetic qualities, marigold has a wide range of uses, including ornamental gardening, medicinal, and industrial applications. In traditional and homeopathic medicine, it is used in the treatment of various skin conditions, such as wounds, burns, eye inflammation, and other ailments [9]. This plant occurs both as a wild and cultivated species, widely distributed in Europe and North America. Calendula officinalis L. flowers are used as a spice, an ingredient in herbal teas, and as a medicinal raw material. They can be used both fresh and dried, as well as in the production of tinctures, ointments, and creams. The therapeutic effect of Calendula officinalis L. is associated with the presence of various classes of secondary metabolites, such as essential oils, natural pigments, flavonoids, sterols, carotenoids, tannins, saponins, triterpene alcohols, polysaccharides, and resin [10]. Due to the presence of these compounds, Calendula officinalis L. extracts may be particularly interesting in cosmetic applications due to their anti-inflammatory, antioxidant, and regenerative properties.
Due to its properties, Calendula officinalis L. extract is widely used in skin care products, especially in preparations designed to soothe irritation, support wound healing, and provide antibacterial protection [11].
Before using Calendula officinalis L. extracts, it is important to select an effective extraction method and develop cosmetic product formulations that maximize the potential of the extracts obtained. A comprehensive, comparative evaluation of different extraction methods and their impact on the properties of the final products is essential for optimizing formulation strategies. This aims to maximize the potential of extracts in skincare formulas. An example of a relatively simple and effective cosmetic product with potential applications for the properties of Calendula officinalis L. extracts is a face serum.
Solvent extraction is one of the conventional methods widely used to isolate many valuable plant-derived products from raw materials. This process involves penetration of the solvent into the solid matrix, dissolution of the substance in the solvent, diffusion of the dissolved substance, and finally the recovery of the extracted solutes. The efficiency of the extraction process is influenced by many factors, including the properties of the extraction solvent, the size and structure of the raw material, the solubility of the solute in a given solvent, the ratio of solvent to solute, the extraction temperature, and time. Moreover, safety, environmental impact, and cost-effectiveness are key parameters in the selection of an appropriate solvent extraction method [12,13]. The solvent extraction has numerous advantages, such as efficiency and wide applicability; however, it also raises numerous concerns, including the potential negative impact on the environment associated with the use of hazardous chemicals.
To overcome the disadvantages associated with solvent extraction, environmentally friendly green solvents are used. These solvents are produced from renewable biomass raw materials. Alternatively, solvents derived from petrochemical products are acceptable, as they are non-toxic and biodegradable, which minimizes their negative impact on the environment [14,15].
As part of our research, we developed a formula for a facial serum based on the idea of loan extraction, which involves using the ingredients of the final cosmetic formula as natural and environmentally friendly extraction agents. The aim was to determine the effect of selected extraction agents (borrowed from the final cosmetic formulation) on the properties of the obtained extracts from Calendula officinalis L. These extracts were then used in a designed face serum formulation, and the resulting cosmetic products were analyzed regarding the effect of the extract additive on the physicochemical and anti-irritant properties. In this context, “facial serum” refers to a cosmetic product with specific compositional characteristics intended for topical application to the skin of the face.

2. Materials and Methods

2.1. Chemicals and Reagents

Analytical standards of DL-Malic acid, Quinic acid, Rutin, L-Phenyloalanine, L-Aspartic acid, L-Valine, L-Lysine, L-Tryptophan, L-Leucine, L-Threonine, L-Histidine, D-(-)-fructose, D-(+)-mannose were purchased from Merck (Darmstadt, Germany); Quercetin and Gallic acid from POL-AURA (Zabrze, Poland); D-(+)-glucose and sucrose from Supelco (Pennsylvania, PA, USA); and tartaric acid from Chempur (Piekary Slaskie, Poland). All standards used were of analytical grade (≥99% purity).
DPPH (2,2-diphenyl-1-picrylhydrazyl) was purchased from Sigma-Aldrich (St. Louis, MO, USA).
To develop cosmetic preparations (facial serums), certified, plant-delivered, raw materials approved by COSMOS and ECOCERT standards for the production of natural products used in commercial products were applied: 1,3-propanediol (Cosphaderm, Propanediol natural, Cosphatec, Hamburg, Germany), and glycerin (Pure Chemical, Warka, Poland). Polyglyceryl-4 laurate/sebacate (and) polyglyceryl-6 caprylate/caprate (Natragem S140, Croda, UK), sodium benzoate and potassium sorbate (Euxyl K712, Ashland, OR, USA), sodium chloride (Krakchemia, Krakow, Poland), and distilled water.

2.2. Plant Material

Flower petals of the marigold plant (Calendula officinalis L.) were purchased from Nanga Przemysław Błękwit company, Złotów, Poland.

2.3. Sample Preparation

An aliquot of 98 g aqueous solutions containing either pure water, 10% (w/w) glycerin, 10% (w/w) 1,3-propanediol, or 2% (w/w) polyglyceryl-4 laurate/sebacate and polyglyceryl-6 caprylate/caprate surfactant mixture was prepared as extraction media. A preservative mixture comprising sodium benzoate and potassium sorbate was added at a concentration of 0.225% (w/w). Subsequently, dried Calendula officinalis L. flower petals were ground using a laboratory knife mill (Cutter Mixer R5 Plus, Robot Coupe, France), sieved, and a fraction of 1–2 mm was collected. Then, 2 g of the plant material was weighed and added to the prepared extraction medium, resulting in a 2% extraction suspension. The mixture was then subjected to vigorous stirring using a mechanical stirrer (CAT, R50D; M. Ziperer GmbH, Ballrechten-Dottingen, Germany) at 380 rpm for 20 min at room temperature. After the extraction process, the mixture was filtered under vacuum with a Büchi V-700 vacuum pump using Nalgene® bottle-top sterile filter units fitted with 0.45 μm pore size polyethersulfone membranes (Thermo Fisher Scientific Inc., Waltham, MA, USA), and the filtrate was used for further studies.

2.4. Formulations of Facial Serum

Table 1 details the composition of the facial serum formulations based on the borrowed extraction medium. The gray cells in the table indicate the extract composition, and the specific ingredients and their concentrations are part of the cosmetic preparation formula.

2.5. Determination of Bioactive Compounds by UPLC-ESI-MS/MS

The separation of the extract was performed using a reverse-phase column (Kinetex 3.5 µm XB-C18, 100 Å; 100 × 4.6 mm, Phenomenex, Torrance, CA, USA) on an ultra-high performance liquid chromatography system (Sciex ExionLC AD, AB Sciex, Concord, ON, Canada) maintained at 30 °C. The mobile phase consisted of 0.1% (v/v) aqueous formic acid as solvent A and methanol as solvent B. The gradient elution conditions for the analysis in positive-ion mode were set as follows: 0.0–20 min, 15–50% B; 20–25 min, 50% B; 25.0–25.1 min, 50–15% B; 25.1–30 min, 15% B. For the method in negative-ion mode, the gradient was 0.0–10 min, 5% B; 10–20 min, 5–50% B; 20–25 min, 50% B; 25.0–25.1 min, 50–15% B; 25.1–30 min, 15% B. The flow rate of the mobile phase was 0.5 mL/min, and the injection volume was 1 µL. All extracts were filtered through a 0.2 µm syringe filter.
For detection, a triple quadrupole mass spectrometer (4500 QTRAP, AB Sciex, Concord, ON, Canada) equipped with an electrospray ionization source (ESI) operating in both negative and positive ion modes was used. The ion spray voltages were +4500 V (positive mode) and −4500 V (negative mode). The nebulizing gas, drying gas, and curtain gas pressures were 50 psi, 50 psi, and 35 psi, respectively. The source temperature was set to 650 °C. For quantification purposes, multiple reaction monitoring (MRM) scan mode was used for all transitions. ANALYST 1.7.2 software was employed to automatically optimize the data collection parameters obtained in MRM mode.

2.6. Total Phenolic Content

The total phenolic content of the extracts was determined spectrophotometrically using a modified Folin–Ciocalteu colorimetric method [16]. Prior to analysis, extracts were diluted one-fold with distilled water. A 40 µL aliquot of the diluted extract was transferred to a test tube, followed by the addition of 200 µL of Folin–Ciocalteu reagent and 600 µL of a 20% (w/v) aqueous sodium carbonate solution. The mixture was then made up to a total volume of 4 mL with distilled water and incubated in the dark at room temperature for 120 min. After incubation, absorbance was measured at 765 nm using a UV–Vis spectrophotometer (HP 8452A, Hewlett Packard, Palo Alto, CA, USA). A blank sample containing all reagents except the extract was used as a reference. TPC values were calculated from a gallic acid calibration curve and expressed as milligrams of gallic acid equivalents per liter of extract (mg GAE/L). All measurements were performed in triplicate, and results are reported as mean ± standard deviation.

2.7. Antioxidant Activity (DPPH Test)

The antioxidant potential of the extracts was assessed using a free radical scavenging assay with the DPPH radical. For each sample, 50 µL of the extract was mixed with 950 µL of methanol, followed by the addition of 3 mL of a 0.1 mM DPPH solution prepared in methanol. The resulting mixture was vortexed briefly and incubated in the dark at room temperature for 30 min. After incubation, the decrease in absorbance was measured at 517 nm against a methanol blank using a UV–Vis spectrophotometer (Hewlett Packard, Palo Alto, CA, USA). Trolox was used as a reference standard, and the antioxidant capacity was expressed as milligrams of Trolox equivalents per liter of extract (mg TE/L). Each measurement was performed in triplicate, and results are expressed as mean ± standard deviation.

2.8. Organoleptic Properties

Organoleptic properties refer to the sensory attributes of a formulation, including color, odor, and texture. These characteristics are assessed visually and through tactile or olfactory examination. The color is observed under natural or standardized light, the odor is evaluated by smelling, and the texture is determined by assessing the formulation’s smoothness, uniformity, and feel to the touch. Organoleptic evaluations provide qualitative insights into the acceptability and overall quality of the formulation.

2.9. Turbidity

Turbidity of extracts and product samples was measured using a TN-100 Waterproof turbidimeter (Thermo Fisher Scientific Eutech Instruments Pte Ltd., Singapore). Turbidity was determined in the nephelometric turbidity unit (NTU).

2.10. Color Parameters of Extracts and Cosmetics (Face Serum) Containing Extracts

Samples of extracts and cosmetics underwent reflectance color measurement using a Konica Minolta CM-3600 with CM-S100w software, SpectraMagic NX version 1.07, and a D65 light source. Color was expressed in the CIE LAB system, where L* indicates lightness (0 = black, 100 = white), and a* and b* represent red-green and yellow-blue axes, respectively.
Chromaticity coordinates (a*, b*) are converted to chroma (C*):
C * = ( a * ) 2 + ( b * ) 2
Color differences (ΔE) for extracts and cosmetics are calculated as:
Δ E * = ( Δ L * ) 2 + ( Δ a * ) 2 + ( Δ b * ) 2
where ΔL*, Δa*, and Δb* denote the differences in the respective color parameters between the extract and the corresponding extraction medium, or between the cosmetic containing the extract and the cosmetic without the extract.

2.11. Spreadability Test

The spreadability test determines the extent of the area covered by the extraction medium and serum when applied to the skin or an affected surface. Pre-cut filter paper pieces are used for the test. First, the total area of each filter paper (A1) is measured, and its initial weight (W1) is recorded. A precise amount of 0.5 g of sample is drawn using a calibrated syringe and dispensed onto the center of the filter paper. Once the serum is applied, a timer is started, allowing the serum to spread uniformly for 10 min. After the allotted time, the boundary between the saturated (wet) and unsaturated (dry) portions of the filter paper is carefully cut along the line using scissors. The remaining dry portion of the filter paper is weighed, and this weight is recorded as W2. The diameter of the saturated portion is then measured. If the spread area is not perfectly circular, multiple diameter readings are taken at different points, and the average diameter is calculated. This measurement is recorded as A2.
The spreadability is expressed as a percentage of the total area of the filter paper using the formula:
Spread by area (%) = (A2/A1) × 100

2.12. Viscosity

The viscosity of the extraction medium and facial serum was directly measured at 22 °C in triplicate using a calibrated Ubbelohde viscometer with K = 0.00273 mm2/s2 for extraction media and extracts and K = 4512 mm2/s2 for serum. Kinematic viscosity was directly obtained from these measurements, and dynamic viscosity was calculated by multiplying the kinematic viscosity by the sample’s density.

2.13. Determination of Irritant Potential—Zein Value

In the zein test procedure, a sample of 2 g of protein was solubilized in 40 g of an extraction medium. The solutions with zein were shaken on a shaker for 60 min at 35 °C. The concentration of solubilized protein was quantified using Kjeldahl analysis. One milliliter of the filtrate was mineralized using concentrated sulfuric acid that contained copper sulfate pentahydrate and potassium sulfate. The mixture was transferred to a Wagner-Parnas apparatus flask containing 50 mL of Milli-Q water. Then, 20 mL of 25% NaOH was added. Next, ammonia was distilled with steam and captured in 0.1 N H2SO4 (5 mL). The unbound acid was then titrated with 0.1 N NaOH using a Tashiro indicator. The results are expressed as milligrams of released nitrogen from solubilized protein per 100 mL of the sample. To ensure reliability, the final result is reported as the arithmetic mean of three independent measurements. This methodology was originally detailed by Wasilewski et al. [17].

2.14. Microbiological Stability

The microbiological stability of the extracts and facial serum was evaluated using the Microcount® Duo microbiological testers (Schülke & Mayr GmbH, Norderstedt, Germany). Agar-coated slides were immersed in the samples to promote eventual microbial colony growth.
Subsequently, the slides were placed into the designated tester chambers and incubated at a consistent temperature of 28 °C. The incubation duration was set to 3 days for bacterial and fungal colony assessments and 5 days specifically for detecting yeasts and molds. After incubation, the slides were examined visually for microbial growth. Microorganism counts were performed using a standardized template supplied by the manufacturer, ensuring precise quantification of the colonies.

2.15. Statistical Analysis

All UPLC-ESI-MS/MS data, as well as total phenolic content (TPC) and DPPH radical scavenging activity results, are presented as the mean ± standard deviation (SD) of four replicates (n = 4). Mean values were analyzed using one-way ANOVA, and significant differences were further evaluated with Tukey’s HSD post hoc test. Statistical analyses were performed using Statistica software version 10 (StatSoft, Tulsa, OK, USA).

3. Results and Discussion

3.1. Characterization of Extraction Process Applying the Idea of Using an Extraction Medium Based on Components Derived from the Final Formulation

The goal of this study was to develop eco-friendly cosmetic formulations enriched with bioactive compounds from Calendula officinalis L. that prioritize human safety and environmental sustainability. A key innovation was the “loan extraction” (LE) approach, in which ingredients from the final product serve as the extraction medium. This eliminates the need for additional purification steps and minimizes chemical residues, thus enhancing safety and reducing environmental impact [18].
A face serum was formulated using natural ingredients in line with consumer demand for natural products. The extraction process employed solvents (water, an aqueous solution of glycerin, or 1,3-propanediol) and a mild non-ionic surfactant mixture solution (polyglyceryl-4 laurate/sebacate and polyglyceryl-6 caprylate/caprate). These solutions served dual roles: first, they obtained bioactives from the plant material of Calendula officinalis L. petals as extraction media; second, they functioned as ingredients in the final product.
First, a formula for a facial serum was developed (Table 1). Then the extraction media were “borrowed” from the cosmetic formulation and used directly during extraction. The resulting extracts were incorporated into the final serum, achieving a high extract content of 50%. The formulations were labeled based on the extraction medium: FS_E_50p_Aqua (water), FS_E_50p_G (aqueous glycerin solution), FS_E_50p_PD (aqueous 1,3-propanediol solution), and FS_E_50p_S (surfactant solution). A control serum without extract was designated FS_E_0p.
Commonly, technologies used for polyphenol extraction include solvent extraction [19], ultrasonic auxiliary extraction [20], microwave-assisted extraction [21], enzymatic extraction [22], and combined methods [23,24]. Among these technologies, solvent extraction is the most widely used method for polyphenol isolation. It is divided into two methodologies: aqueous solvent extraction and organic solvent extraction. Given that polyphenols are polyhydroxy compounds, they are typically soluble in water, alcohols, and aldehydes. Although the most environmentally friendly solvent is water, and it can be used as the solvent for plant polyphenols, it does not apply to all kinds of polyphenols due to, for example, the fact that the presence of hydrogen bonding and hydrophobic bonds enables the formation of stable molecular complexes between polyphenols and proteins or polysaccharides. Therefore, the extraction of polyphenols should consider not only the solvent compatibility but also the various forms of interactions between target polyphenols and substances they naturally associate with inside the biomass. Researchers have demonstrated that a biphasic extraction fluid that includes organic solvent and water is the most suitable method for the extraction of polyphenols [25]. Commonly used solvents for this extraction include aqueous methanol, ethanol, and acetone at a concentration of 60–70% in volume. It is known that when the solvents with different polarities were used to extract polyphenols, the components and contents of the isolated polyphenols can be significantly different. For this reason, the choice of extractant greatly influences the yield and properties of the obtained polyphenols [26].
This method has been widely used because of its simple procedures, low cost, and high isolation purity, although the extraction rate is relatively low. Although organic solvents and water can be used effectively to extract phenolic compounds, there remain significant mass transfer hurdles due to the complex, intertwined makeup of biomass cell walls. Therefore, different types of extraction techniques with different mechanisms are incorporated to provide new angles to extract polyphenols with greater yields, rates, and efficiencies. Depending on the solvents used, larger amounts of hydrophilic or hydrophobic polyphenol compounds can be isolated. Our research focused on determining the influence of a water-organic solvent mixture on extraction efficiency. For comparison, a mixture of surfactant solutions known for its high efficiency in isolating and solubilizing of hydrophobic compounds was used.
Many natural extracts used as ingredients in cosmetics are formulated as solutions in high-boiling-point solvents. 1,3-propanediol and glycerin produced from renewable biomass raw materials are particularly important following the trend of using environmentally friendly green solvents for extraction processes. The comprehensive chemical characterization of these extracts is a valuable source of information for the cosmetics industry, as it streamlines the product development process. In this study, aqueous solutions of these solvents were used to extract compounds from marigold.
Upon solvent application, the effectiveness of the hydrophilic-lipophilic balance of surfactants on extraction performance for the extraction of compounds from marigold petal powder was demonstrated using an aqueous solution of a mixture of non-ionic surfactants. The extraction efficiency of the surfactant solutions was compared with the result obtained by solvent extraction under the same conditions.
For the extraction process, water and vegetable-derived 1,3-propanediol—or a glycerin–water mixture—were used as a green solvent. The results were compared to the effectiveness of surfactant-enhanced extraction using a mixture of Polyglyceryl-4 Laurate/Sebacate (and) Polyglyceryl-6 Caprylate/Caprate surfactants.
Glycerin is one of the most valued organic solvents due to its natural origin, environmentally friendly characteristics, favorable safety profile, and affordable price [27]. In addition, its biocompatibility and low toxicity make it widely used in the extraction process and cosmetics industry [28]. Glycerin is highly compatible with the skin, acting as a moisturizer, preventing moisture loss, soothing dryness, and refreshing the skin’s surface. In cosmetic applications, it also regulates the viscosity of products, facilitating their application and improving the stability of formulations. Glycerin displays low volatility and is not flammable. It is easily mixed with water, which is one of the properties that can be used for the plant extraction of active substances with health-promoting properties.
1,3-Propanediol is an attractive alternative to petroleum-derived solvents such as glycols and glycerin. It is produced through the microbial fermentation of natural glycerin. This compound is a colorless, viscous liquid that is highly soluble in water. Its properties and biocompatibility make it relevant for applications in cosmetics as a moisturizer and humectant.
Polyglyceryl-4 Laurate/Sebacate (and) Polyglyceryl-6 Caprylate/Caprate is a mixture of non-ionic surfactants, polyethers containing glyceryl units, end-capped by esterification with simple carboxylic acids, such as fatty acids. The product is obtained by reacting and mixing polyglycerol-4 with sebacic acid and lauric acid on the one hand and polyglycerol-6 with caprylic/capric acid on the other. The products of both processes are dissolved in water before mixing. It is 100% naturally derived. Its HLB value, defined as the ratio of a surfactant’s hydrophilicity to its hydrophobicity [29], is 14.
The extraction media used were water; a 10% aqueous solution of glycerin; a 10% aqueous solution of 1,3-propanediol; and a 2% surfactant mixture solution. These were marked as Aqua, G_10p, PD_10p, and S_2p, respectively. A comparison of the physicochemical properties of the used extraction media is presented in Table 2. The viscosity of the extraction media can influence the penetration of solvents into the structure of plant material and the diffusion of biologically active substances from plants. The measured viscosities increased in the range of 0.899, 0.985, 1.011, and 1.247 mPa·s for water, the glycerin solution, the surfactant solution, and the 1,3-propanediol solution, respectively.
The extraction medium was characterized by a similar pH value.
The extraction process was performed by dispersing ground Calendula officinalis L. flower petals in an extraction medium. Dried Calendula officinalis L. flower petals are characterized by vivid, multi-colored inflorescences, which exhibit a spectrum of colors ranging from light yellow to deep orange (Figure 1).
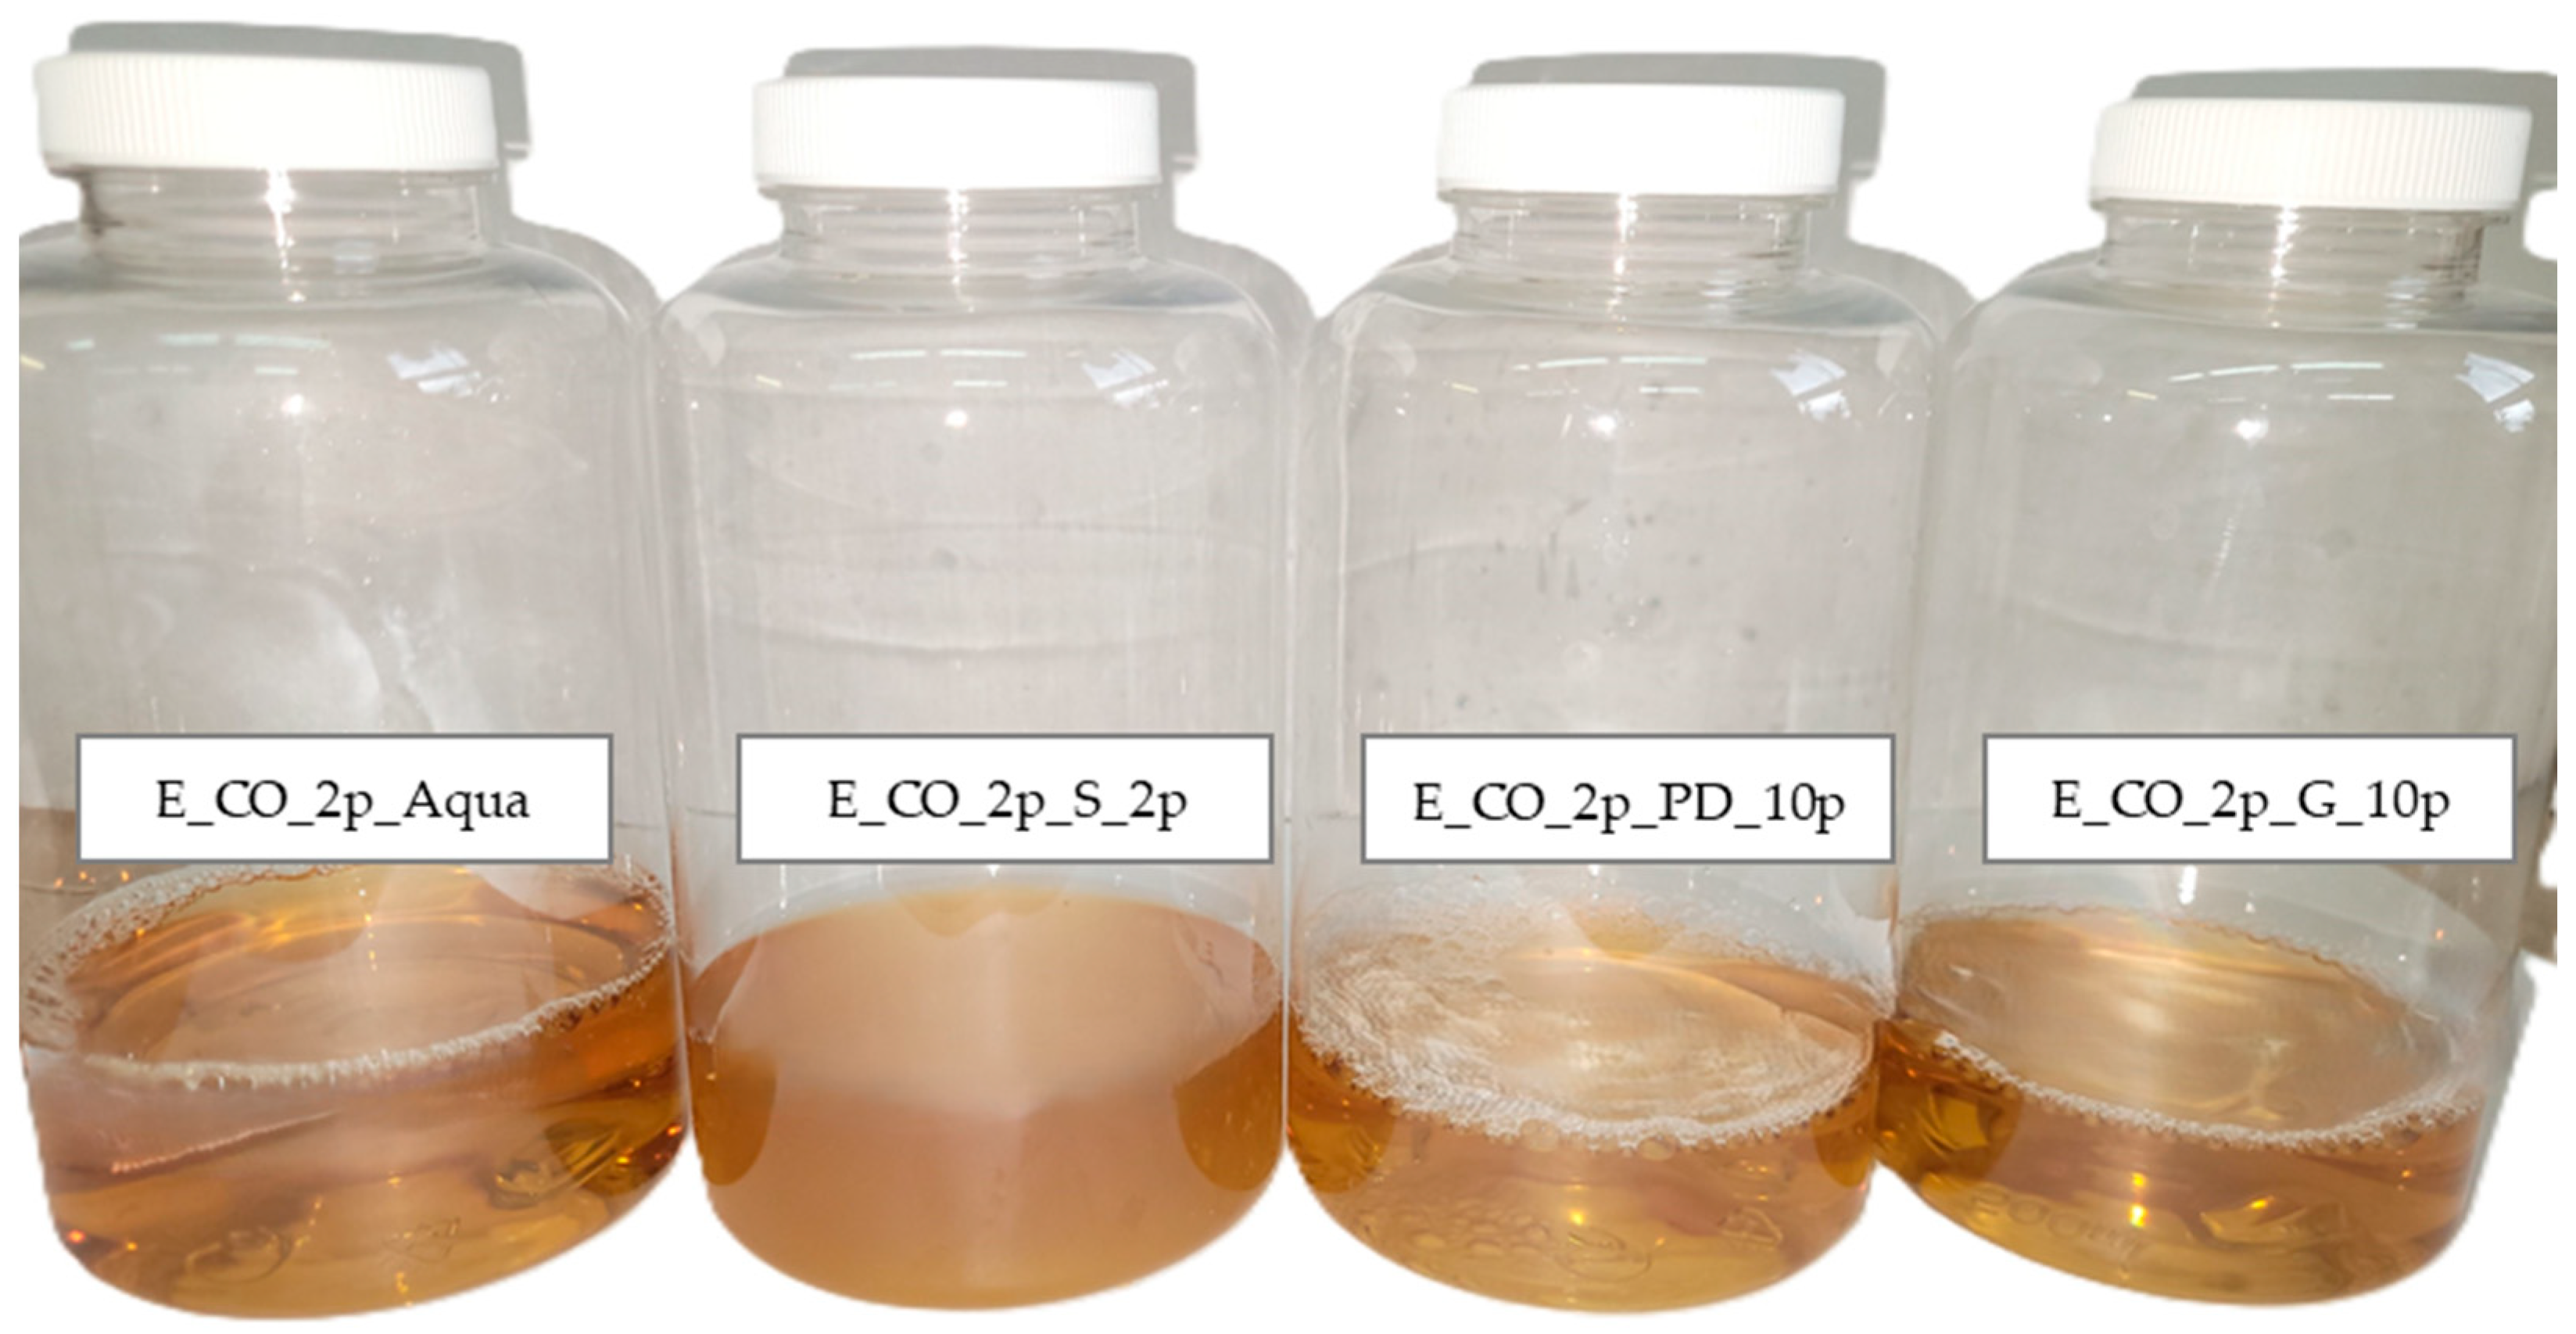
The resulting extracts were characterized for their physicochemical properties (viscosity, color parameters) and phytochemical composition. The appearance of the extracts obtained from the media used—water, glycerin, 1,3-propanediol, and a surfactant solution—labeled as E_CO_2p_Aqua, E_CO_2p_G_10p, E_CO_2p_PD_10p, and E_CO_2p_S_2p, respectively, is shown in Figure 2. The viscosity properties and spectrophotometric data of the extracts are summarized in Table 3.
After completion of the extraction process, the viscosity values of all extracts obtained were higher than the initial viscosity of the extraction medium. The extracted bioactive compounds caused an increase in viscosity, and the extract obtained with the surfactant-containing solution had the highest viscosity value among the analyzed samples. Additionally, compared to other extracts, this extract yielded a solution with the highest turbidity value, which was also noticeable to the naked eye. The extracts were characterized by a straw-yellow color. In order to determine the difference in color between the tested extracts, colorimetric tests were carried out. The CIE L*a*b* system was used with a three-dimensional color space represented in rectangular coordinates: L* (lightness), a* (+a* red, -a* green), and b* (+b* yellow, -b* blue). Analysis of color parameters indicated that sample E_2p_S_2p differed from the other samples. This sample exhibited the highest L* and b* values, indicating a dominant influence of yellow coloration. The color difference between the extract and the extraction medium was quantified by calculating the ΔE value. The extract samples relevant to the appropriate extraction medium showed a ΔE greater than 10, indicating a noticeable color difference attributable to the natural pigments in marigold petals. According to standard color difference criteria, a ΔE value greater than 10 signifies a perceptible color difference to the average observer, whereas a ΔE less than 3.00 suggests no significant perceptible difference [30]. Color analysis in the CIE LAB system indicated a color change in the extraction medium after the extraction process. The highest value was obtained for the E_CO_2p_S_2p sample.

3.2. Determination of Selected Compounds by UPLC-MS/MS

Calendula officinalis L. has been valued for centuries for its medical properties and wide application in traditional medicine systems in the treatment of various diseases. This plant is one of the important herbal raw materials rich in bioactive compounds with, among others, anti-inflammatory, antiviral, antimicrobial, antioxidant, immunomodulatory, insecticidal, and antimutagenic properties. Thanks to such a wide spectrum of biological activity, Calendula officinalis L. extracts are used in both the pharmaceutical and cosmetic industries [31].
The quantitative and qualitative composition of bioactive substances in Calendula officinalis L. extracts depend largely on the method and extraction medium used. This was determined using the UHPLC-MS/MS method. The study compared the content of biologically active compounds in extracts obtained using different extraction media: water, 10% aqueous solution of glycerin, 10% aqueous solution of propanediol, and 2% aqueous solution of polyglyceryl-4 laurate/sebacate and polyglyceryl-6 caprylate/caprate surfactant mixture. The results, expressed in mg/L, are displayed in Table 4. The examined compounds were divided into four groups: organic acids, phenolic compounds, amino acids, and sugars.
DL-malic acid turned out to be the most dominant compound in all the extracts tested. The use of solvents such as glycerin and propanediol promoted significant dissolving of this substance, reaching 933 mg/L in the E_CO_2p_G_10p extract and 884 mg/L in the E_CO_2p_PD_10p extract, respectively. Slightly lower concentrations were obtained in extracts E_CO_2p_S_2p (770 mg/L), while water E_CO_2p_Aqua was the least effective (468 mg/L).
A notable correlation was observed in the case of tartaric acid, whose highest concentration was recorded in E__CO_2p_Aqua—105 mg/L, which is almost ten times higher than in the other extracts. This result may indicate that water is a more effective solvent in the context of extracting this compound.
Quinic acid reached the highest concentrations in extracts based on solvent solutions of propanediol (31.03 mg/L) and glycerin (34.0 mg/L). In the case of E_CO_2p_S_2p, a value of 23.4 mg/L was measured, while in E_CO_2p_Aqua, 14.9 mg/L. Quinic acid is one of the important phenolic compounds present in plant extracts, including Calendula officinalis L. Quinic acid is reported to exhibit radioprotective and antioxidant activities. Additionally, it has anti-inflammatory properties. Antioxidants are compounds capable of scavenging free radicals in the human body. Due to these properties, antioxidants are widely employed to stabilize pharmaceuticals, food products, petrochemicals, and cosmetics [32]. Significant amounts of quinic acid, DL-malic acid, and fumaric acid have been found in Calendula officinalis L. extracts. The presence of these compounds has also been confirmed in studies by other authors, which further confirms the typical presence of these organic acids in Calendula officinalis L. extracts. This phytochemical profile indicates the characteristic composition of compounds belonging to the group of organic acids in Calendula officinalis L., which are often described in the phytochemical literature on this plant [33].
A similar correlation was observed in the case of rutin, another important phenolic compound. In the E_CO_2p_Glycerin_10p extract, its concentration was 3.05 mg/L, while in E_CO_2p_propanediol_10p it was 4.49 mg/L. On the other hand, water proved to be the least effective solvent in terms of rutin extraction.
A number of amino acids were also identified in the tested extracts. Proper skin function requires adequate care and the use of cosmetics rich in natural active ingredients, including amino acids. These compounds play an important role in supporting skin regeneration processes and improving its overall condition. Beneficial effects can be achieved in many ways, one of which is external application. Due to the skin’s constant exposure to many harmful environmental factors, direct application of preparations to its surface is the most effective form of protection. Cosmetics enriched with amino acids can significantly help maintain proper moisture balance and improve skin condition [34]. The highest concentrations in all extracts were found for L-Lysine, reaching a value of 20.5 mg/L in both E_CO_2p_PD_10p and E_CO_2p_G_10p. In the other extracts, the concentration of this amino acid was slightly lower, which allows them to be considered relatively stable in different extraction media. L-Lysine is valued, among other things, for its properties supporting collagen synthesis [35]. The extracts also contained L-Valine, L-Aspartic acid, L-Phenylalanine, and L-Leucine. The highest concentrations of these amino acids were found in E_CO_2p_PD_10p, with values for the first two being 12.5 mg/L and 13.8 mg/L, respectively, and for the others—9.22 mg/L and 9.36 mg/L. L-Histidine, which is the amino acid present in the smallest amounts, did not exceed a concentration of 1 mg/L in all extracts.
As in the previously discussed compounds, the highest sugar extraction efficiency was observed in extracts where a solution of propanediol and glycerin was used as the extraction medium. Glucose, a monosaccharide, was the dominant sugar in all samples tested. Its highest concentration was obtained in the E_CO_2p_PD_10p extract, reaching a value of 38.2 mg/L. In addition to glucose, other sugars were also identified, such as fructose, mannose, and sucrose, with sucrose, as a complex sugar, occurring in smaller amounts, especially in extracts E_CO_2p_Aqua (1.51 mg/L) and E_CO_2p_S_2p (1.33 mg/L). The reduced sucrose content in these samples may result from its partial decomposition to simple sugars in the extraction media used, which could correlate with the relatively higher concentrations of glucose and fructose in these extracts.

3.3. Total Phenolic Content (TPC) and Antioxidant Capacity (DPPH)

The total phenolic content (TPC) and antioxidant activity (DPPH assay) of Calendula officinalis L. flower extracts were evaluated (Table 5). The TPC results showed the highest value for the E_CO_2p_S_10p, followed by E_CO_2p_PD_10p and E_CO_2p_G_10p, and the lowest in E_CO_2p_Aqua. These findings confirm that surfactant- and solvent-based systems enhance the release of phenolic compounds compared to water. This observation is in line with the LC-MS/MS data (Table 4), which showed higher concentrations of individual phenolic compounds such as quinic acid and rutin in the extracts obtained with 1,3-propanediol and glycerin. Although LC-MS/MS provides targeted quantification of selected compounds, while TPC reflects the overall reducing capacity of all phenolic constituents, both approaches consistently indicate that polyol- and surfactant-containing media promote a more efficient solubilization of phenolic compounds than pure water. However, the antioxidant activity results, measured via DPPH radical scavenging, revealed a slightly different trend. The E_CO_2p_PD_10p sample demonstrated the highest DPPH activity, closely followed by E_CO_2p_S_10p and E_CO_2p_G_10p, while water again showed the lowest activity. Interestingly, although the surfactant solution produced the highest phenolic yield, the antioxidant capacity of the propanediol solution was slightly superior, suggesting that this medium may preferentially extract phenolic compounds with higher radical-scavenging efficiency. Overall, the results demonstrate that both the quantity and functional quality of extracted phenolics are influenced by the choice of extraction medium. The LE method, when applied with a suitable extraction medium such as a mixture of surfactants polyglyceryl-4 laurate/sebacate (and) polyglyceryl-6 caprylate/caprate solution or propanediol solution, enables efficient and reproducible recovery of bioactive compounds directly into formulation-relevant phases, supporting its application in sustainable and multifunctional cosmetic product development.

3.4. Characteristic of Model Cosmetics

The aim of the study was to evaluate the effect of the extract additive on the properties of the final cosmetic products. For this purpose, facial serum formulations with a 50% addition of Calendula officinalis L. flower petal extracts were developed. Depending on the extraction medium used, the samples were labeled as FS_E_50p_Aqua, FS_E_50p_G_10p, FS_E_50p_PD_10p, and FS_E_50p_S_2p for water, glycerin, 1–3 propanediol, and surfactant solution, respectively. The added extract was prepared using a loan extraction method involving solvents and surfactants, partly borrowed from a cosmetic formulation for solvent and micellar extraction. This approach aimed to obtain a product that meets safety and efficacy standards. The detailed composition of the developed preparations is presented in Table 1.
The face serum was designed based on a water-based nature, which ensures faster absorption and enhanced skin penetration of active ingredients. Xanthan gum as a viscosity modifier was dispersed into the water while stirring continuously to prevent clumping. Separately, the extract was prepared using an appropriate borrowing solvent. Once the gums were fully hydrated, glycerin, propanediol, and surfactant were mixed, and the extract solution was added to the main vessel, followed by the preservative mixture, ensuring thorough mixing after each addition. Finally, the serum was stirred at a low speed to remove air bubbles and transferred to sterilized containers for storage.
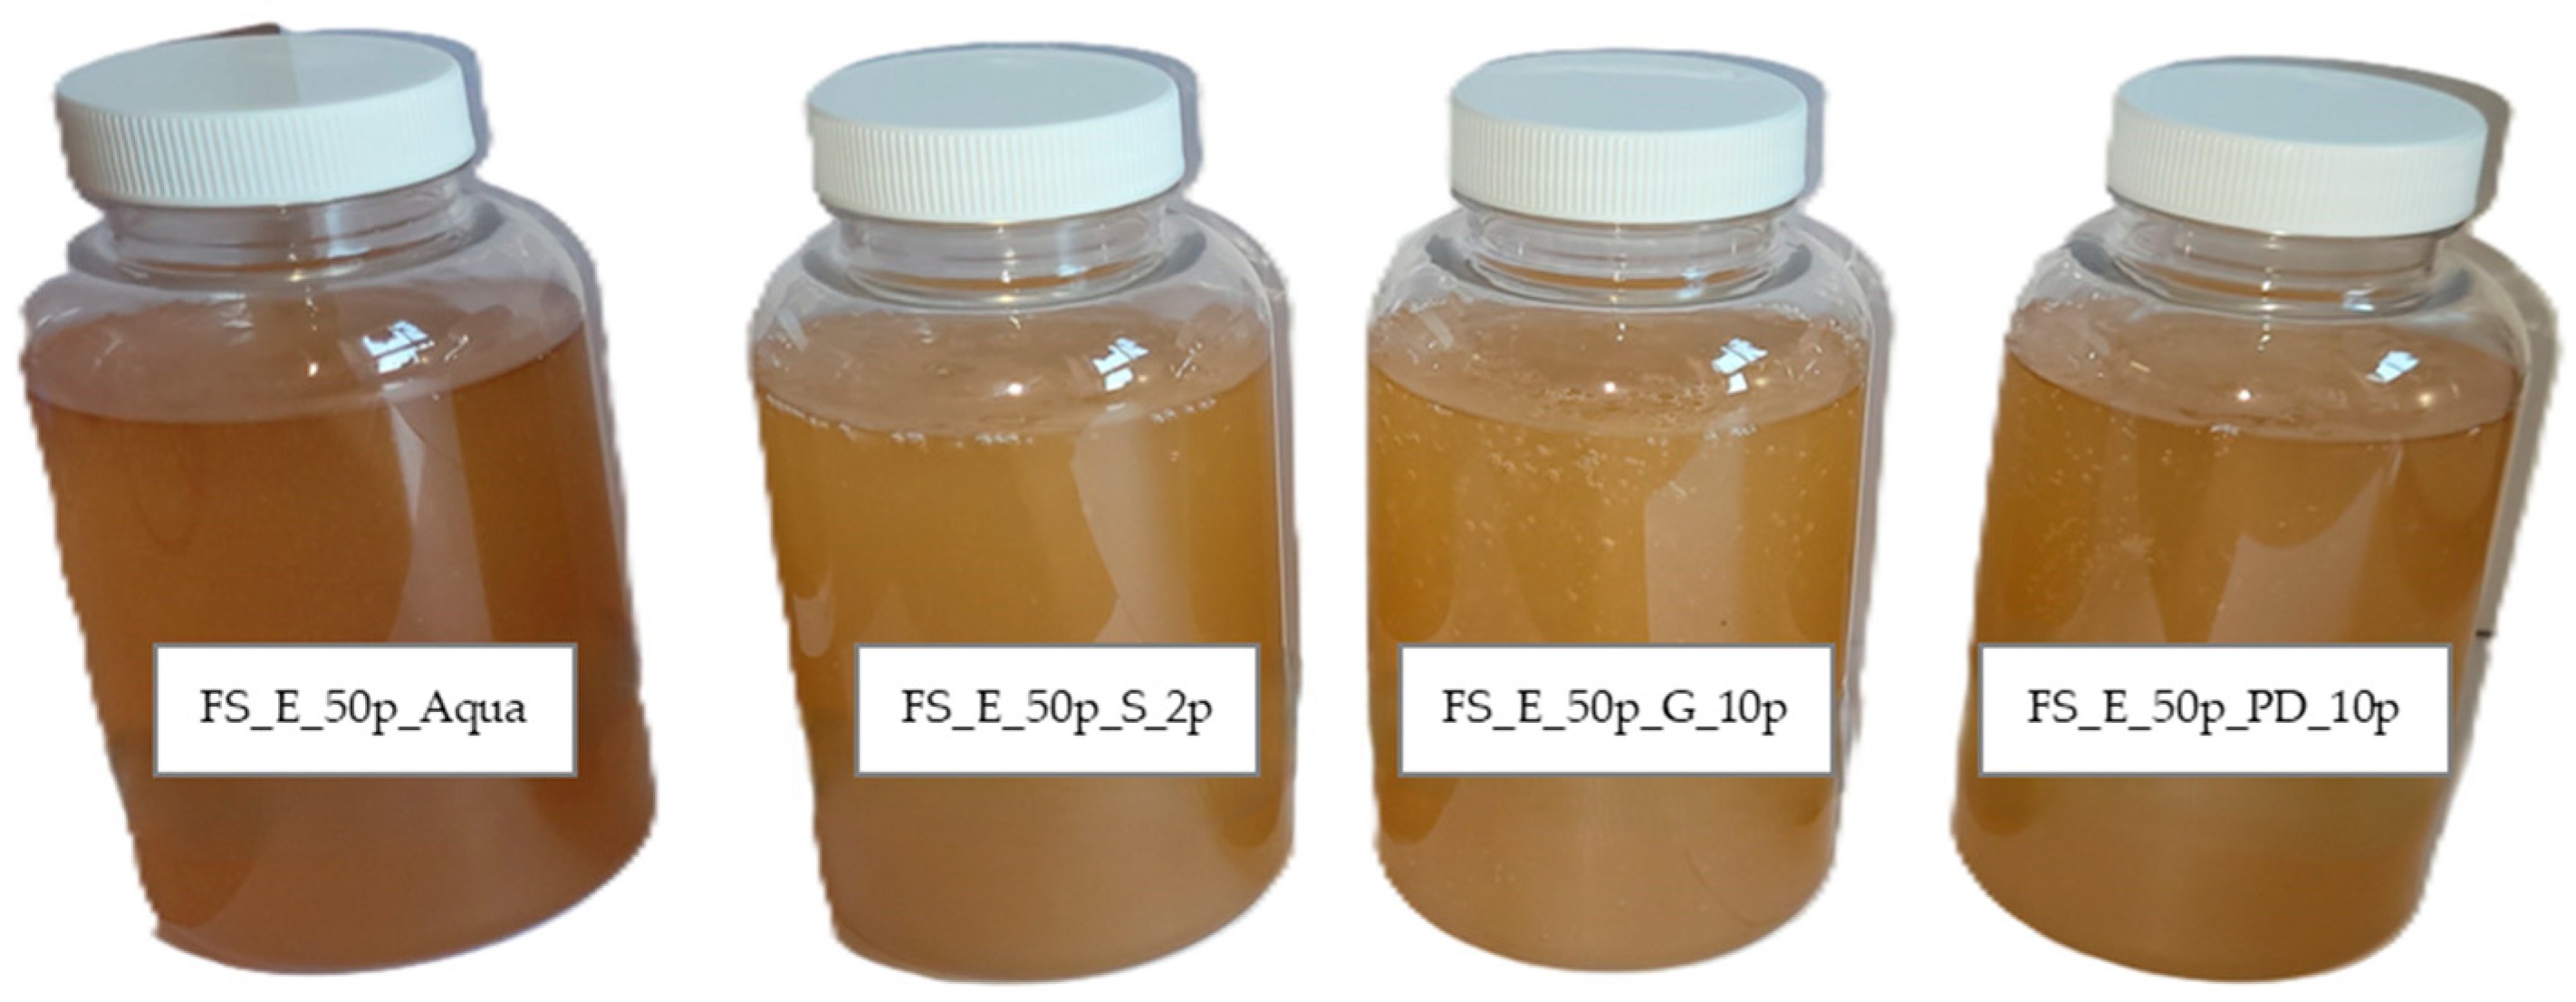
The serums, which were developed using borrowed compounds for extraction and then returned for the final formulation, were assessed for their physicochemical properties. Table 6 summarizes the physicochemical characterization of the face serum, including viscosity, density, spreadability, turbidity, and zein number. Figure 3 presents the appearance of the designed products.
Stability tests confirmed the serums’ robustness, maintaining consistent organoleptic properties over 30 days. The formulations remained stable under temperature variation tests, with no signs of phase separation or sedimentation. These results highlight the successful incorporation of a viscosity modifier, which ensured proper homogenization and maintained the integrity of the formulations under mechanical and environmental stress.
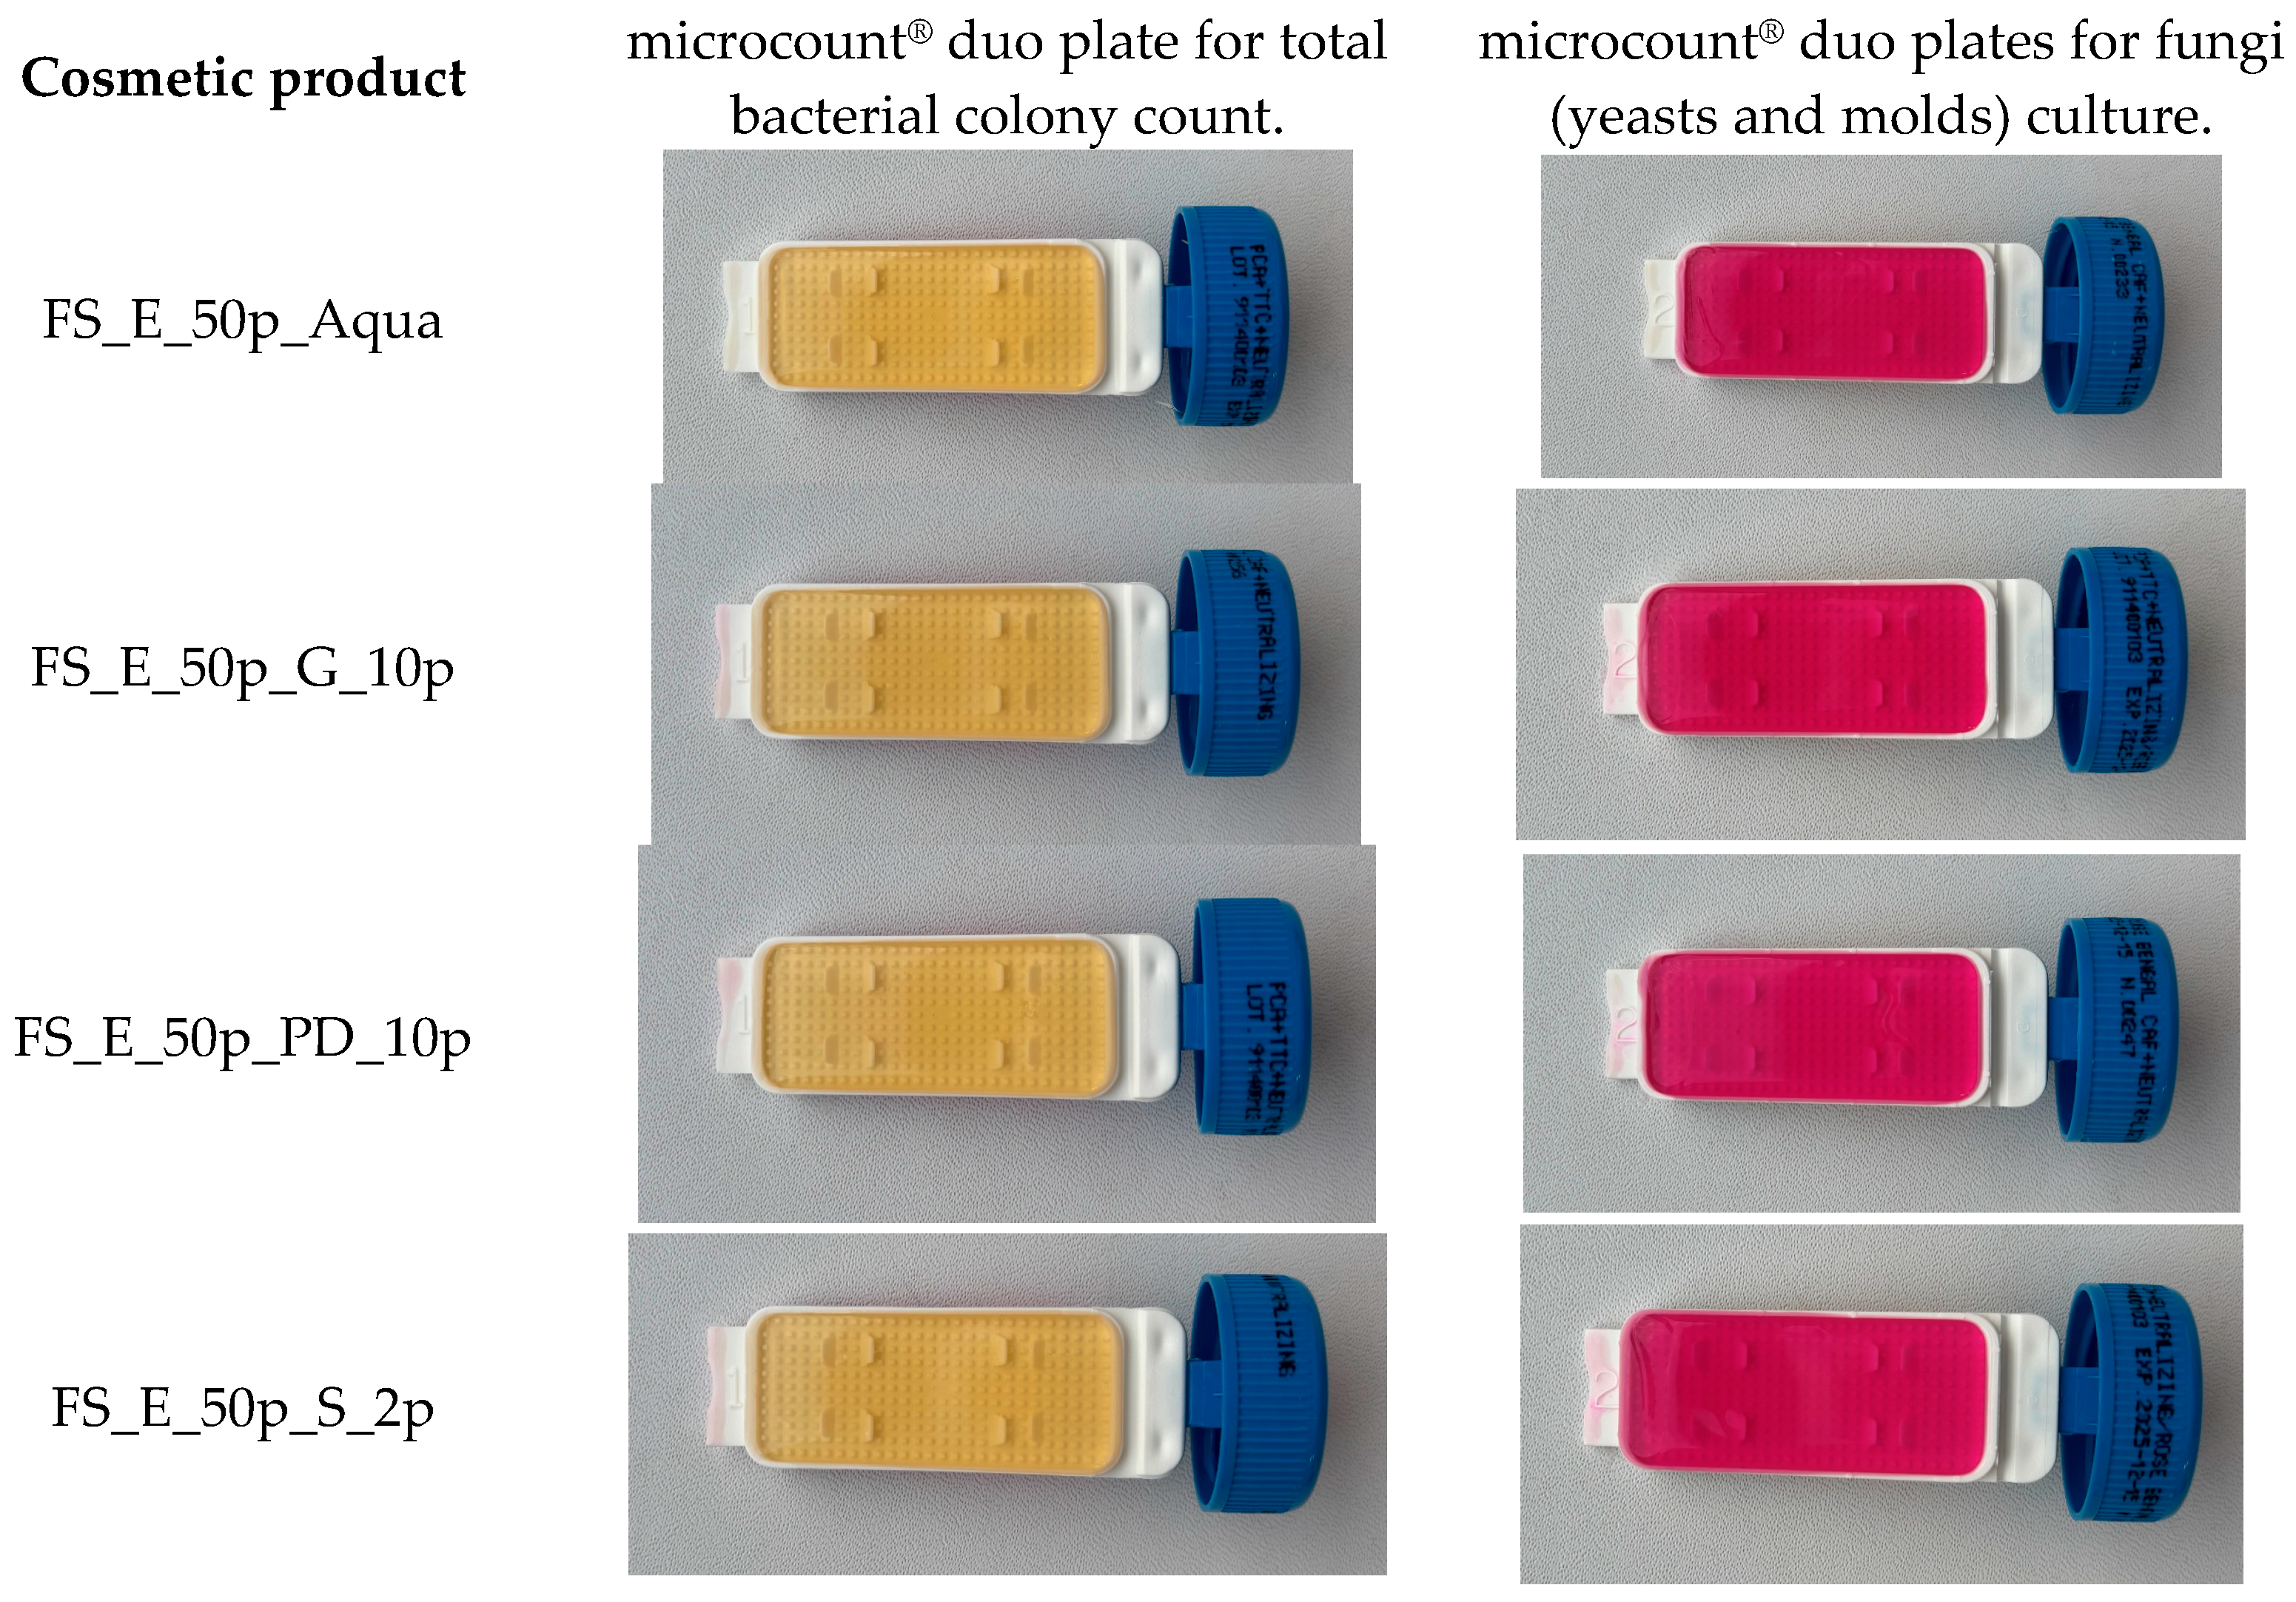
The basic properties, including texture, odor, and color, were consistent across all formulations. The serums exhibited a smooth texture and a characteristic plant odor, with differences in color. Microbiological stability evaluations showed that the extracts and cosmetic products were stable in terms of bacterial and fungal contamination (yeast and mold). No alterations were detected on the test dipslides after the specified incubation period under controlled temperature and humidity conditions (Figure 4).
The viscosity control is essential for cosmetic serums, as they determine ease of application, stability, and consumer satisfaction [36]. The viscosity of all formulations was in the range of 3156 to 4393 mPa·s. The obtained viscosity ensures easy application and spreading while maintaining stability at rest. Overall, the addition of xanthan gum provided optimal flow properties for stability and usability of all prepared cosmetic samples. The viscosity measurements revealed that the FS_E_50p_Aqua sample exhibited the highest viscosity among the tested formulations. Concurrently, this sample demonstrated the lowest value of spreadability; the highest was observed for the FS_E_50p_G_10p sample. The results indicated that the serums can effectively spread on the skin, enhancing their usability and consumer appeal.
In our work, the color parameters L*, a*, b*, C*, and ΔE were characterized and presented in Table 7.
Adding Calendula officinalis L. extract to the face serum influenced the color of the cosmetic products. The resulting cosmetics exhibited a light yellow color with the lowest b* value for FS_E_50p_PD_10p and the highest for FS_E_50p_S_2p, reflecting the natural pigmentation of the extracts. The results of the study showed that the FS_E_50p_G_10p cosmetic product was considered the brightest, with the lowest red (a*) values compared to the other preparations. The FS_E_50p_Aqua sample showed the lowest L* value, indicating the darkest color. The sample FS_E_50p_S_2p exhibited the highest saturation (C*) and the highest value in the turbidity analysis. Color difference analysis (ΔE) with respect to the face serum without extract showed a visible influence of extract addition (ΔE > 10).
The turbidity measurements of the cosmetic samples showed different values obtained for different media borrowed for the extraction process. FS_E_50p_S_2p had the highest turbidity value. The obtained results are consistent with visual observations. Above the critical range of 0–10 NTU, turbidity is visible to the human eye [37].
Depending on the composition of a cosmetic product, individual chemical compounds or their mixtures may have an irritating effect on the skin. Empirical studies have shown that the addition of plant extracts to solutions of surfactants can reduce their irritating potential [38]. The presence of bioactive compounds such as polyphenols, flavonoids, proteins, and carbohydrates in these extracts may contribute to reducing the irritation potential of surfactants. In the case of the developed face serum formulation, the return of the borrowed medium after extraction enriched with bioactive components had an effect on the irritation potential value, suggesting an important role of the extraction medium selection in modulating the irritation properties of the prepared cosmetics. The zein values obtained for the tested cosmetic prototypes range from 16.8 to 21.0 mg N/100 mL. Analysis of these results indicates that, in accordance with literature data [39], the obtained facial serums do not irritate the skin. The least irritating effect was observed with a serum that used an aqueous propanediol solution as an extraction medium. This extract revealed a high TPC value and antioxidant potential, as measured by the DPPH method. The results indicating a reduction in irritation potential may be due to the presence of phenolic compounds in the extract; however, the irritating effect of surfactants was also observed.

4. Conclusions

The results of this study highlight the importance of plant extracts in cosmetic preparations, especially in terms of enhancing the antioxidant and protective properties of the skin. Calendula officinalis L. serves as a valuable source of bioactive compounds with potential applications in cosmetic products. These findings enhance our understanding of the phytochemical composition of plant extracts and provide a foundation for future research into their anti-inflammatory, antioxidant, and regenerative properties.
The addition of Calendula officinalis L. extract to serum formulations emphasizes the potential of bioactive plant compounds in modern skincare. Considering the growing consumer demand for natural ingredients with scientifically proven efficacy, these extracts represent a viable alternative to synthetic additives.
A critical assessment of these results suggests that, while preparations rich in bioactive ingredients offer many functional benefits, challenges remain in optimizing the extraction medium. Water, as an extraction solvent, showed the lowest efficiency values based on total concentration of extracted compounds and antioxidant properties. Conversely, surfactant solution and aqueous propanediol solution proved more effective in extracting phenolic compounds and enhancing antioxidant potential. The variability in extract composition and antioxidant potential observed when using different extraction media highlights the complexity of extract standardization. Factors such as extraction methods and solvent type significantly impact the quality, concentration, and activity of phytochemicals. Another key issue is the bioavailability of active compounds within cosmetic formulations. While in vitro studies confirm their antioxidant and anti-irritant properties, the extent to which these compounds penetrate the skin and exert their effects at the cellular level remains an open question.
Overall, this study emphasizes the role of natural compounds in promoting sustainable and biocompatible skincare solutions. With growing concerns about the environmental impact of synthetic ingredients, the use of natural ingredients and bioactive substances of plant origin offers a promising alternative.
The application of optimized extraction methods, such as the concept of “loan extraction,” can facilitate the development of safe, effective, and sustainable next-generation skincare products.

Author Contributions

Conceptualization, T.W. and Z.H.-B.; methodology, W.O., T.W., Z.H.-B., N.S.-W., K.M. and J.F.; validation, W.O., T.W., Z.H.-B., N.S.-W., K.M. and J.F.; formal analysis, W.O., T.W., Z.H.-B., N.S.-W., K.M. and J.F.; investigation, W.O., T.W., Z.H.-B., N.S.-W., K.M. and J.F.; resources, W.O., T.W., Z.H.-B., N.S.-W., K.M. and J.F.; data curation, W.O., T.W., Z.H.-B., N.S.-W., K.M. and J.F.; writing—original draft preparation, W.O., T.W., Z.H.-B., N.S.-W. and K.M.; writing—review and editing, W.O., T.W., Z.H.-B., N.S.-W., K.M. and J.F.; visualization, W.O., T.W., Z.H.-B., N.S.-W., K.M. and J.F.; supervision, T.W.; project administration, T.W. and Z.H.-B.; funding acquisition, T.W. and Z.H.-B. All authors have read and agreed to the published version of the manuscript.

Funding

This research received no external funding.

Institutional Review Board Statement

Not applicable.

Informed Consent Statement

Not applicable.

Data Availability Statement

The original contributions presented in this study are included in the article. Further inquiries can be directed to the corresponding author.

Conflicts of Interest

The authors declare no conflicts of interest.

Abbreviations

NTUNephelometric turbidity unit
ESIElectrospray ionization
LELoan extraction
TPCTotal phenolic content
FSFace serum
E_CO_2p_AquaCalendula officinalis L. petal extract obtained using aqueous solution
E_CO_2p_G_10pCalendula officinalis L. petal extract obtained using aqueous solution of glycerin
E_CO_2p_PD_10pCalendula officinalis L. petal extract obtained using aqueous solution of propanediol
E_CO_2p_S_2pCalendula officinalis L. petal extract obtained using aqueous solution of surfactants
FS_E_50p_AquaFace serum with 50% extract based on aqueous solution
FS_E_50p_G_10pFace serum with 50% extract based on aqueous solution of glycerin
FS_E_50p_PD_10pFace serum with 50% extract based on aqueous solution of propanediol
FS_E_50p_S_2pFace serum with 50% extract based on aqueous solution of surfactants

References

  1. Walker, M. Human skin through the ages. Int. J. Pharm. 2022, 622, 121850. [Google Scholar] [CrossRef]
  2. Mian, M.; Silfvast-Kaiser, A.S.; Paek, S.Y.; Kivelevitch, D.; Menter, A. A review of the most common dermatologic conditions and their debilitating psychosocial impacts. Int. Arch. Intern. Med. 2019, 3, 18. [Google Scholar] [CrossRef]
  3. Naidoo, K.; Birch-Machin, M.A. Oxidative stress and ageing: The influence of environmental pollution, sunlight and diet on skin. Cosmetics 2017, 4, 4. [Google Scholar] [CrossRef]
  4. Hu, S.; Anand, P.; Laughter, M.; Maymone, M.B.C.; Dellavalle, R.P. Holistic dermatology: An evidence-based review of modifiable lifestyle factor associations with dermatologic disorders. J. Am. Acad. Dermatol. 2022, 86, 868–877. [Google Scholar] [CrossRef] [PubMed]
  5. Parrado, C.; Mercado-Saenz, S.; Perez-Davo, A.; Gilaberte, Y.; Gonzalez, S.; Juarranz, A. Environmental stressors on skin aging. Mechanistic insights. Front. Pharmacol. 2019, 10, 759. [Google Scholar] [CrossRef]
  6. Camilleri, M.A.; Cricelli, L.; Mauriello, R.; Strazzullo, S. Consumer perceptions of sustainable products: A systematic literature review. Sustainability 2023, 15, 8923. [Google Scholar] [CrossRef]
  7. Kumar, V. Perspective of natural products in skincare. Pharm. Pharmacol. Int. J. 2016, 4, 339–341. [Google Scholar] [CrossRef]
  8. Sasounian, R.; Martinez, R.M.; Lopes, A.M.; Giarolla, J.; Rosado, C.; Magalhães, W.V.; Robles Velasco, M.V.; Baby, A.R. Innovative approaches to an eco-friendly cosmetic industry: A review of sustainable ingredients. Clean Technol. 2024, 6, 176–198. [Google Scholar] [CrossRef]
  9. Wichtl, M. (Ed.) Herbal Drugs and Phytopharmaceuticals: A Handbook for Practice on a Scientific Basisi; CRC Press: Boca Raton, FL, USA, 2004. [Google Scholar]
  10. Vidal-Ollivier, E.; Elias, R.; Faure, F.; Babadjamian, A.; Crespin, F.; Balansard, G.; Boudon, G. Flavonol glycosides from Calendula officinalis flowers. Planta Medica 1989, 55, 73–74. [Google Scholar] [CrossRef]
  11. Wasli, A.L.; Wan Ismail, W.A.; Zamery, M.I. Review on pharmacological and potential cosmeceutical values of Centella asiatica (Pegaga). Int. J. Pharm. Nutraceut. Cosmet. Sci. 2022, 5, 13–32. [Google Scholar] [CrossRef]
  12. Zhang, Q.W.; Lin, L.G.; Ye, W.C. Techniques for extraction and isolation of natural products: A comprehensive review. Chin. Med. 2018, 13, 20. [Google Scholar] [CrossRef]
  13. Lapornik, B.; Prošek, M.; Wondra, A.G. Comparison of extracts prepared from plant by-products using different solvents and extraction time. J. Food Eng. 2005, 71, 214–222. [Google Scholar] [CrossRef]
  14. Buarque, F.S.; Gautério, G.V.; Coelho, M.A.Z.; Lemes, A.C.; Dias Ribeiro, B. Aqueous two-phase systems based on ionic liquids and deep eutectic solvents as a tool for the recovery of non-protein bioactive compounds—A review. Processes 2023, 11, 31. [Google Scholar] [CrossRef]
  15. Yara-Varon, E.; Fabiano-Tixier, A.S.; Balcells, M.; Canela-Garayoa, R.; Bily, A.; Chemat, F. Is it possible to substitute hexane with green solvents for extraction of carotenoids? A theoretical versus experimental solubility study. RSC Adv. 2016, 6, 27750–27759. [Google Scholar] [CrossRef]
  16. Singleton, V.L.; Orthofer, R.; Lamuela-Raventós, R.M. Analysis of total phenols and other oxidation substrates and antioxidants by means of folin-ciocalteu reagent. Methods Enzymol. 1999, 299, 152–178. [Google Scholar] [CrossRef]
  17. Wasilewski, T.; Seweryn, A.; Bujak, T. Supercritical carbon dioxide blackcurrant seed extract as an anti-irritant additive for hand dishwashing liquids. Green Chem. Lett. Rev. 2016, 9, 114–121. [Google Scholar] [CrossRef]
  18. Wasilewski, T.; Hordyjewicz-Baran, Z.; Zarębska, M.; Stanek, N.; Zajszły-Turko, E.; Tomaka, M.; Bujak, T.; Nizioł-Łukaszewska, Z. Sustainable Green Processing of Grape Pomace Using Micellar Extraction for the Production of Value-Added Hygiene Cosmetics. Molecules 2022, 27, 2444. [Google Scholar] [CrossRef] [PubMed]
  19. Li, B.; Li, M.; Wang, G.; Wang, K.; Jian, K. The antioxidant activity of pomegranate seed polyphenols in vitro. Sci. Technol. Food Ind. 2018, 39, 17–20. [Google Scholar]
  20. Su, H.; Wei, J.; Bi, Y.; Hu, H.; Wang, Z. Optimization of ultrasonic-assisted extraction of polyphenols from Chinese Seabuckthorn berries and composition analysis. Food Ferment. Sci. Technol. 2017, 53, 34–41. [Google Scholar]
  21. Zhang, X.; Bei, Z.; Qiao, Y. The anti-oxidation effects of polyphenols in Lyciumbarbarum L. fresh flower. Feed. Ind. 2017, 38, 38–43. [Google Scholar]
  22. Stanek-Wandzel, N.; Krzyszowska, A.; Zarębska, M.; Gębura, K.; Wasilewski, T.; Hordyjewicz-Baran, Z.; Tomaka, M. Evaluation of Cellulase, Pectinase, and Hemicellulase Effectiveness in Extraction of Phenolic Compounds from Grape Pomace. Int. J. Mol. Sci. 2024, 25, 13538. [Google Scholar] [CrossRef]
  23. Xia, T.; Zhao, C.; Du, P.; Yu, Y.; Zhu, S.; Zheng, Y.; Wang, M. Research progress of polyphenols in food, extraction methods and detection techniques. Food Ferment Ind. 2019, 45, 231–238. [Google Scholar]
  24. Hu, Y.; Yan, B.; Chen, Z.S.; Wang, L.; Tang, W.; Huang, C. Recent Technologies for the Extraction and Separation of Polyphenols in Different Plants: A Review. J. Renew. Mater. 2022, 10, 1471–1490. [Google Scholar] [CrossRef]
  25. Chemat, F.; Li, Y.; Tomao, V.; Ginies, C.; Cravotto, G. Optimization of procedures for in-line extraction of lipids and polyphenols from grape seeds. Food Anal. Methods 2014, 7, 459–464. [Google Scholar] [CrossRef]
  26. Akowuah, G.; Ismail, Z.; Norhayati, I.; Sadikun, A. The effects of different extraction solvents of varying polarities on polyphenols of Orthosiphon stamineus and evaluation of the free radical-scavenging activity. Food Chem. 2005, 93, 311–317. [Google Scholar] [CrossRef]
  27. Wolfson, A.; Dlugy, C.; Shotland, Y. Glycerol as a green solvent for high product yields and selectivities. Environ. Chem. Lett. 2007, 5, 67–71. [Google Scholar] [CrossRef]
  28. Chemat, F.; Vian, M.A.; Cravotto, G. Green extraction of natural products: Concept and principles. Int. J. Mol. Sci. 2012, 13, 8615–8627. [Google Scholar] [CrossRef]
  29. Griffin, W.C. Classification of surface-active agents by “HLB”. J. Soc. Cosmet. Chem. 1949, 1, 311–326. [Google Scholar]
  30. Abasi, S.; Amani Tehran, M.; Fairchild, M.D. Distance metrics for very large color differences. Color Res. Appl. 2020, 45, 208–223. [Google Scholar] [CrossRef]
  31. Khouchlaa, A.; El Baaboua, A.; El Moudden, H.; Lakhdar, F.; Bakrim, S.; El Menyiy, N.; Belmehdi, O.; Harhar, H.; El Omari, N.; Balahbib, A.; et al. Traditional Uses, Bioactive Compounds, and Pharmacological Investigations of Calendula arvensis L.: A Comprehensive Review. Adv. Pharm. Pharm. Sci. 2023, 2023, 2482544. [Google Scholar] [CrossRef] [PubMed]
  32. Ercan, L.; Doğru, M. Antioxidant and Antimicrobial Capacity of Quinic Acid. Bitlis Eren Üniversitesi Fen Bilimleri Dergisi 2022, 11, 1018–1025. [Google Scholar] [CrossRef]
  33. Miguel, M.; Barros, L.; Pereira, C.; Calhelha, R.C.; Garcia, P.A.; Castro, M.Á.; Santos-Buelga, C.; Ferreira, I.C.F.R. Chemical characterization and bioactive properties of two aromatic plants: Calendula officinalis L. (flowers) and Mentha cervina L. (leaves). Food Funct. 2016, 7, 2223–2232. [Google Scholar] [CrossRef] [PubMed]
  34. Noguchi, A.; Djerassi, D. Amino Acids and Peptides: Building Blocks for Skin Proteins. In Nutritional Cosmetics; Elsevier: Amsterdam, The Netherlands, 2009; pp. 287–317. [Google Scholar] [CrossRef]
  35. Gandhi, F.; Rosario, C.; Mishra, M.; Gandhi, M.d.H.; Kadam, P. Review on application of one of the most valuable players of amino acids: L-Lysine. Int. J. Pharm. Res. Appl. 2024, 9, 1337–1344. [Google Scholar] [CrossRef]
  36. Morávková, T.; Stern, P. Rheological and textural properties of cosmetic emulsions. Appl. Rheol. 2011, 21, 35189. [Google Scholar] [CrossRef]
  37. Kelley, C.D.; Krolick, A.; Brunner, L.; Burklund, A.; Kahn, D.; Ball, W.P.; Weber-Shirk, M. An Affordable Open-Source Turbidimeter. Sensors 2014, 14, 7142–7155. [Google Scholar] [CrossRef]
  38. Nizioł-Łukaszewska, Z.; Furman-Toczek, D.; Bujak, T.; Wasilewski, T.; Hordyjewicz-Baran, Z. Moringa oleifera L. extracts as bioactive ingredients that increase safety of body wash cosmetics. Dermatol. Res. Pract. 2020, 2020, 8197902. [Google Scholar] [CrossRef]
  39. Pezron, I.; Galet, L.; Clausse, D. Surface interaction between a protein monolayer and surfactants and its correlation with skin irritation by surfactants. J. Colloid Interface Sci. 1996, 180, 285–289. [Google Scholar] [CrossRef]
Figure 1. Flower petals of Calendula officinalis L. were used for the study.
Applsci 15 12444 g001
Figure 2. Appearance of Calendula officinalis L. extracts in 500 mL containers, obtained in various extraction media.
Applsci 15 12444 g002
Figure 3. Appearance of designed face serum in 500 mL containers.
Applsci 15 12444 g003
Figure 4. Photos of the duo-plate dipslides after 5 days of incubation time.
Applsci 15 12444 g004
Table 1. Formulations of Facial Serum.
Name According
to INCI Nomenclature
Concentration, % [w/w]
FS_E_0pFS_E_50p_AquaFS_E_50p_GFS_E_50p_PDFS_E_50p_S
Polyglyceryl-4 Laurate/Sebacate (and) Polyglyceryl-6 Caprylate/Caprate1111-
Propanediol555-5
Glycerin55-55
Extract050505050
Polyglyceryl-4 Laurate/Sebacate (and) Polyglyceryl-6 Caprylate/Caprate----1
Propanediol---5-
Glycerin--5--
Aqua-49.887544.887544.887548.8875
Sodium Benzoate, Potassium Sorbate-0.11250.11250.11250.1125
Sodium Benzoate Potassium Sorbate0.2250.11250.11250.11250.1125
Xanthan Gum0.60.60.60.60.6
Aquato 100to 100to 100to 100to 100
Table 2. Comparison of viscosity, density, pH, spreadability, and turbidity of the used extraction media. Values are presented as the mean ± standard deviation of five replicate measurements (n = 5).
Extraction MediumViscosity
mPa·s
Density
g/cm3
pHSpreadability
%
Turbidity
NTU
Aqua0.899 ± 0.0031.000 ± 0.0027.079.40.2 ± 0.1
G_10p0.985 ± 0.0021.026 ± 0.0026.776.20.3 ± 0.1
PD_10p1.247 ± 0.0021.010 ± 0.0027.077.00.4 ± 0.1
S_2p1.011 ± 0.0051.006 ± 0.0026.461.42.2 ± 0.2
Table 3. Viscosity and spectrophotometric data of the extracts. The ΔE value was obtained in relation to the corresponding extraction medium. The values are means of five replicate determinations ± standard deviation (n = 5).
SampleViscosity
mPa·s
Turbidity
NTU
L*a*b*C*ΔE
E_CO_2p_Aqua0.986 ± 0.00114 ± 0.526.28−1.513.1813.2731.84
E_CO_2p_G_10p1.304 ± 0.00213 ± 0.528.44−1.7314.0414.1513.60
E_CO_2p_PD_10p1.283 ± 0.00115 ± 0.526.84−0.7914.2514.2713.88
E_CO_2p_S_2p1.326 ± 0.001209 ± 5.071.37−1.1724.1424.1750.25
Table 4. UPLC-ESI-MS/MS quantification of the detected compounds in tested Calendula officinalis L. extracts, mean values ± standard deviation (n = 4). Different lowercase letters (a–d) indicate significant differences (p < 0.05) among mean values for the same compound across different extraction conditions, according to Tukey’s HSD test. Means sharing the same letter are not significantly different.
CompoundMRM, Q1 > Q3
m/z
E_CO_2p_
Aqua
E_CO_2p_
S_2p
E_CO_2p_PD_10pE_CO_2p_
G_10p
mg/L
Tartaric acid148.9 > 87.0, 148.9 > 73.0105 a ± 59.9 b ± 0.411.7 b ± 0.613.2 b ± 0.4
DL-malic acid132.9 > 114.9, 132.9 > 71.0468 a ± 9770 b ± 10884 c ± 8933 d ± 13
Fumaric acid114.8 > 70.9, 114.8 > 26.98.9 a ± 0.24.4 b ± 0.24.2 b ± 0.14.5 b ± 0.2
Sum of organic acids582784950900
Quinic acid190.9 > 84.9, 190.9 > 93.014.9 a ± 0.323.4 b ± 0.631.3 c ± 0.734.0 c ± 0.4
Rutin608.9 > 299.9, 608.9 > 270.9 1.6 a ± 0.32.8 b ± 0.24.5 c ± 0.73.1 b ± 0.1
Sum of phenolic compounds16.526.137.135.7
L-Valine118.1 > 72.0, 118.8 > 55.011.4 b ± 0.19.6 a ± 0.112.5 c ± 0.310.0 a,b ± 0.2
L-Leucine132.1 > 86.0, 132.1 > 44.08.5 b ± 0.16.6 a ± 0.19.4 c ± 0.68.9 b ± 0.1
L-Histidine156.1 > 82.9, 156.1 > 74.00.71 a ± 0.010.72 a ± 0.010.71 a ± 0.020.71 a ± 0.02
L-Threonine120.3 > 74.0, 120.3 > 56.05.6 b ± 0.15.4 a ± 0.16.2 c ± 0.16.0 c ± 0.1
L-Lysine 147.1 > 84.0, 147.1 > 130.019.1 b ± 0.117.9 a ± 0.420.5 c ± 0.420.5 c ± 0.3
L-Phenylalanine 163.9 > 147.0, 163.9 > 103.06.1 a ± 0.17.5 b ± 0.49.2 c ± 0.99.6 c ± 0.4
L-Aspartic acid 131.9 > 88.0, 131.9 > 114.97.5 a ± 0.99.4 b ± 1.113.8 c ± 1.016.0 d ± 1.6
Sum of amino acids58.857.171.672.2
Glucose178.9 > 58.9, 178.9 > 88.920.2 a ± 0.625.2 b ± 0.432.1 c ± 1.438.2 d ± 1.1
Sucrose340.9 > 179.0, 340.9 > 179.01.5 b ± 0.11.3 a ± 0.24.4 c ± 0.94.6 c ± 0.1
Fructose179.9 > 59.0, 179.9 > 90.017.8 a ± 1.118.5 a ± 1.322.8 b ± 1.230.7 c ± 1.2
Mannose178.8 > 58.9, 178.8 > 88.916.0 a ± 0.722.4 b ± 1.426.3 c ± 0.927.7 c ± 1.0
Sum of sugars55.567.3101.285.5
Table 5. Comparison of TPC and DPPH antioxidant activity of Calendula officinalis L. extracts obtained via LE. The values are means of three replicate determinations ± standard deviation (n = 3). Different lowercase letters (a–c) indicate significant differences (p < 0.05) among mean values across different extraction conditions, according to Tukey’s HSD test. Means sharing the same letter are not significantly different.
Extraction MediumTPC [mg GAE/L] ± SDDPPH [mg TE/L] ± SD
E_CO_2p_Aqua317 a ± 6162 a ± 5
E_CO_2p_G_10p346 b ± 4167 a,b ± 1
E_CO_2p_PD_10p365 c ± 3171 b ± 3
E_CO_2p_S_2p375 c ± 6170 b ± 4
Table 6. Comparison of viscosity, density, spreadability, turbidity, and the zein number of the face serum. Values are presented as the mean ± standard deviation of five replicate measurements (n = 5).
SampleViscosity
mPa·s
Density
g/cm3
Spreadability
%
Turbidity
NTU
Zein Number
mgN/100 mL
FS_E_50p_Aqua4393 ± 361.28718.0211 ± 1017.5 ± 0.5
FS_E_50p_G_10p3480 ± 631.28418.9302 ± 1221.0 ± 0.6
FS_E_50p_PD_10p3157 ± 321.33618.3240 ± 1016.8 ± 0.5
FS_E_50p_S_2p4374 ± 1591.28318.5590 ± 1520.3 ± 0.5
Table 7. Spectrophotometric data of the face serum obtained by D65. ΔE products compared to base serum without extract. Values are means of five replicate determinations (n = 5).
SampleL*a*b*C*ΔE
FS_E_50p_Aqua78.520.222.8722.8754.76
FS_E_50p_G_10p81.79−0.2222.1522.1555.73
FS_E_50p_PD_10p79.97−0.1422.1222.1257.39
FS_E_50p_S_2p80.690.0723.6623.6657.05
Disclaimer/Publisher’s Note: The statements, opinions and data contained in all publications are solely those of the individual author(s) and contributor(s) and not of MDPI and/or the editor(s). MDPI and/or the editor(s) disclaim responsibility for any injury to people or property resulting from any ideas, methods, instructions or products referred to in the content.