Abstract
Assessing the water quality of lakes with complex morphometry requires the assumption that hydrochemical differences may exist between distinct parts of the lake. Understanding the mechanisms behind these differences may be useful in planning protection and restoration efforts. The subject of the two-year study was Lake Studzieniczno-Kłączno-Ryńskie (215.5 ha, 17.1 m) (Pomeranian Lake District, northern Poland), with a maximum length of 5.6 km and an elongation index of 7.9. The studies revealed significant variation in the hydrochemical parameters of individual parts of the lake. The worst environmental conditions were found in the northern part of the lake (water transparency at approximately 1 m, chlorophyll a concentration up to 35 µg/L, BOD5 of 35 mg O2/L, TP concentrations up to 1.82 mg P/L, and TN concentrations up to 7.50 mg N/L in the bottom layer of the water due to deoxygenation and internal loading). This was due to the lake’s orientation in the direction of winds, the blowing of various materials towards the northern end of the lake, and the inflow of a stream draining the marshland areas. To restore recreational use in the northern part of the SKRL, a simple and inexpensive solution (costing approximately EUR 300,000) was proposed: installing a curtain to reduce suspended solids emissions into this part of the reservoir and installing a pipeline to introduce inflow water to the bottom of this bay, which should slow down eutrophication.
1. Introduction
Lakes created by different natural processes and weather patterns are key parts of the water system in the area and, along with the surrounding land that drains into them, are essential parts of the basic ecological systems [1,2,3]. Many complex chemical, physical, and biological changes take place in lake ecosystems [4,5]. The direction of these processes is influenced by the chemical composition of water, which is a result of the geological structure of the catchment area and its use, the size of the soil sorption complex, weathering and dissolution of minerals that make up the catchment area, atmospheric conditions, and especially the amount of precipitation that washes away components from the soil, the mixing of waters of different composition (inflow of streams and groundwater and underwater springs), and the type of aquatic organisms [6,7,8,9].
Lakes, like all natural creations, develop and age, passing through the phase of oligotrophy, through mesotrophy, to eutrophy [10,11]. This process, eutrophication, is caused by a constant inflow of mineral compounds (mainly nitrogen and phosphorus) and organic substances from the catchment area [12]. The phenomenon of eutrophication, which occurs slowly in natural conditions, is accompanied by morphometric changes in the water body consisting of the gradual filling of the basin with sediments and overgrowing with aquatic plants, which leads to its leveling and the transformation of the lake into a swamp and peat bog [13,14]. For over a hundred years, human activity has had a decisive influence on the nutrient load flowing into lakes. Urbanization, industrialization, intensification of agricultural production, deforestation, excessive tourist pressure, and sewage discharge into waters increase the load of mineral and organic substances on lakes, often to values exceeding the loads defined by Vollenweider [15,16] as critical.
Excessive fertility of lakes causes deterioration of water quality standards and a decrease in species diversity at all trophic levels, as well as a loss of the reservoir’s suitability for economic and utility purposes [17]. The effect of the reservoir’s high nutrient content is excessive primary production, which manifests itself, among others, in phytoplankton and dangerous cyanobacteria blooms, over-oxygenation of surface and deoxygenation of bottom water layers, and a decrease in transparency. The lack of oxygen in the deeper layers of the lake causes the release of nitrogen and phosphorus from the bottom sediments, where they were previously retained (internal loading) [18,19].
In each lake, the rate of eutrophication and increase in fertility resulting from the intensification of primary production processes varies. The size of production processes depends on the amount and availability of nutrients for primary producers, as well as on the intensity of matter circulation in the lake. The concentrations of nutrients in water depend on the size of their supply from external sources, which in turn is determined by catchment conditions. Water supply with nutrients also occurs from internal sources, i.e., from the bottom sediment of the water body. Morphometric conditions of the lake and its exposure to wind, and local climatic conditions, which include annual distribution of air temperature, rainfall, and the frequency and strength of wind, determine the circulation intensity in the lake.
Taking into account the factors mentioned above, determining the rate of eutrophication, it can be assumed that in shallow lakes with a large surface area, exposed to wind, with high hydrodynamics favoring the maximum turnover of nutrients in the production zone, the processes of primary production are intensified, fertility increases quickly, and eutrophication progresses faster. The situation is different in water bodies with difficult water circulation, i.e., in small, deep lakes with steep banks, where thermal stratification occurs in summer, with a thin epilimnion and a large, capacious hypolimnion. The productivity of such lakes should be lower, and the rate of eutrophication is slower [20,21].
Many of the postglacial lakes have a varied morphometric structure. This genetic type of lake usually consists of many parts with different water dynamics or exposure to wind. Different rates of eutrophication can be observed in individual parts, and at the same time, different productivity. The Pomeranian Lake District contains over 4000 glacial lakes, often ribbon lakes and deep lakes, with varied shorelines and bottom configurations. The young glacial landscape of the Pomeranian Lake District is characterized by a diverse natural environment, which is reflected in the distinct variation in local geological and orographic conditions, as well as the hydrographic network. According to Nowiński et al. [22], the specific geographic features of the Pomeranian Lake District result in spatial differences in both the organization of water circulation and the aquatic migration of matter. This further influences the lakes’ alimentation and the size and structure of the substance loads delivered from the catchment, contributing to significant hydrochemical diversity within the lakes.
The dwindling resources of high-quality surface waters necessitate the search for effective methods to mitigate or slow the eutrophication process and its adverse consequences. According to data from the Chief Inspectorate of Environmental Protection, over 90% of lakes in Poland require radical restoration action due to their poor ecological condition and failure to meet the WFD (Water Framework Directive) targets. Climate change and the invasion of alien plant and animal species are exacerbating the situation.
Recent scientific literature describes and demonstrates the effectiveness of numerous technical, chemical, and biological methods that can reverse or at least slow down the eutrophication process and its negative effects [23]. Methods used to restore water bodies include artificial aeration, phosphorus inactivation, selective drainage of hypolimnion water, removal of bottom sediments, covering of bottom sediments, flushing, bottom sediment processing, and various biomanipulation methods (controlling ichthyofauna populations, removing excess aquatic vegetation). There is no single universal method. Appropriate methods are selected for each body of water, taking into account environmental, morphometric, and hydrological conditions. Recently, NbS methods, based on nature-friendly solutions combined with a circular economy, have also been favored [24].
The aim of this research is to present the seasonal and spatial variability of the hydrochemical conditions of the ribbon lake Studzieniczno-Kłączno-Ryńskie and develop a conception of a technical solution that slows down the rate of eutrophication (a pipeline bringing surface water to the lake bed with a curtain separating the most eutrophicated bay from the rest of the lake).
2. Materials and Methods
2.1. Morphology and Morphometry of Research Lake
Studzieniczno-Kłączno-Ryńskie Lake (SKRL) with an area of 15.5 ha and a maximum depth of 17.1 m is located in the Pomeranian Lake District (northern Poland) at an altitude of 151.8 m above sea level [25]. The location of the lake is described by the following geographic coordinates: 54°04′4″ N and 17°32′8″ E. The lake is characterized by a convex bowl shape (depth index 0.4) with a capacity of 14,803 thousand m3. The analyzed lake is moderately deep in the ground, as evidenced by the relative depth value of 0.010 (Figure 1). It is an elongated water body stretching from the southwest to the northeast. The shoreline of the analyzed lake is 14,900 m long. It is moderately diversified, which is confirmed by the value of its development index (K) of 2.87 (Figure 1).
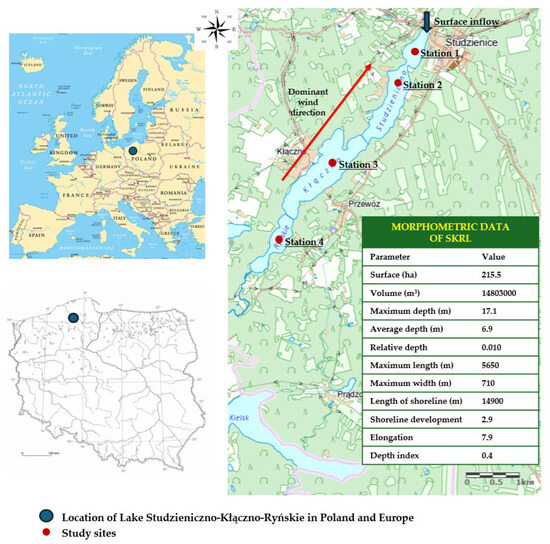
Figure 1.
Location and morphometric data of SKRL.
The studied lake is located in northern Poland, where the mean annual wind speed oscillated around 4 m/s. According to the Institute of Meteorology and Water Management, the highest wind speeds occur between late autumn and early spring, while the lowest occur in summer and early autumn (https://meteo.imgw.pl, accessed on 29 September 2025). The share of individual wind directions is not the same throughout the year. In summer, westerly and north-westerly winds predominate (average wind speed 2.62 m/s). In autumn, the share of winds that take on an easterly and south-easterly direction increases (average wind speed 3.26 m/s). In winter, winds blowing from the south-west predominate (average wind speed 3.76 m/s). Spring is characterized by a relatively even distribution of wind directions (average wind speed 3.32 m/s). However, the dominant direction is always the west.
2.2. The Catchment of the Studzieniczno-Kłączno-Ryńskie Lake
The watershed of SKRL (an area of 25.21 km2) is situated in the lower Vistula River basin (Figure 2). On the north-eastern shore, stream inflows into the lake. The stream drains the marshy area and wet meadows. From the southwestern end of the lake outflows the Kłonecznica River, which flows through the Małe and Kielskie lakes and carries its waters to the Zbrzyca River. The Zbrzyca is a left tributary of the Brda, the largest left-bank tributary of the Vistula in its lower course. The catchment area of the SKRL is covered with mixed forest in 75%, agricultural land in 20% and buildings in 5% (Figure 2).
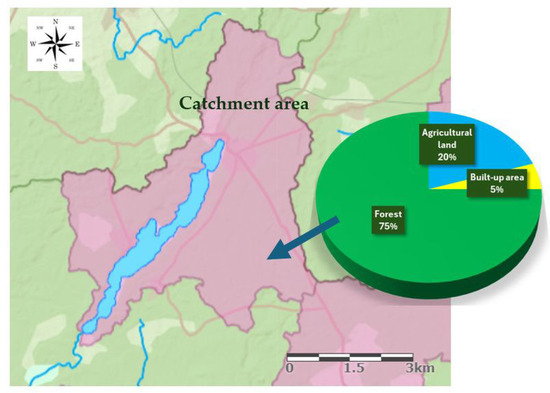
Figure 2.
The range and development of the Studzieniczno-Kłączno-Ryńskie lake catchment area (Hydroportal-ISOK).
2.3. External Loading of the Lake with Nutrients
The total phosphorus load introduced to SKRL, determined based on research and calculations, is 15,425.4 kg N/year and 804.6 kg P/year (Figure 3).
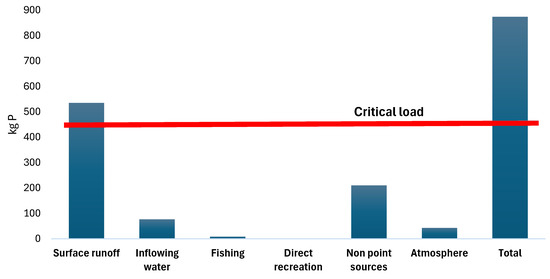
Figure 3.
External phosphorus load of SKRL against the background of the critical load.
The permissible and critical load calculated for this lake from the Vollenweider hydrological model [16] are, respectively, 0.098 g P/m2/year and 0.196 g P/m2/year. This corresponds to a total amount of phosphorus of 211 and 422 kg P per year, respectively. This value may seem large, but the actual amounts reaching the lake are several times higher–874.1 kg of P. This means that the current impact of external pressures exceeds the critical load level twice. The long-term perspective of such loading will inevitably lead to a process of further eutrophication of the lake. Although this lake can withdraw a certain part of nutrients beyond its borders–surface runoff through the Kłoniecznica River (approximately 1102 kg of phosphorus and 9204 kg of nitrogen), the retention time of the inflowing water in the lake basin is too long for the pool of these nutrients not to enter the links of the lake’s food chain. The retention time is 1.58 years, which translates to about 80 weeks, while the life cycle of plankton is, on average, a dozen or so days. Therefore, nutrients supplied from external sources have a chance to cause mass phytoplankton appearances in the lake several times.
2.4. Methods
The research of SKRL was carried out monthly from April to November 2022 and from April to November 2024. In the description of the results, we treated April and May as spring, the months from June to August as summer, and the months from September to November as autumn. According to the guidelines used in lake monitoring research, water samples for laboratory tests were collected at 4 research stations situated along the longitudinal axis toward the south; subsequent stations were progressively shallower. Station 1 was 17.1 m deep, Station 2—16.5 m, Station 3—14.2 m, and Station 4—12.9 m deep (Figure 1). The localization of the deepest points in particular parts of the lake was established according to a bathymetric map and GPS. At the measuring stations 1, 2, 3, 4, water samples (128) were collected using a 3.5 L Ruttner sampler (Geomor Technik, Szczecin, Poland) into 2 L plastic bottles from 1 m below the surface and 1 m above the bottom. At each site, 32 samples were collected, and analyses were performed in triplicate. At the measuring stations, at every meter of depth, water temperature, oxygen content, pH, chlorophyll a, and conductivity were measured using a YSI 6600V2 multiparameter sensor (Yellow Springs, OH, USA). Water transparency was measured using a Secchi disc (Ø 0.30 m, KC, Silkeborg, Denmark, Geomor Technik, Poland).
The scope of the water analysis included P and N compounds such as PO4, Porg., TP, NH4, NO3, Norg., TN, and BOD5, COD.
Chemical analyses of water were performed using Standard Methods [26]. The scope of the water analysis included: PO43− (with the use of ammonium molybdate—(NH4)6Mo7O24 × 4H2O and tin (II) chloride–SnCl2 as indicator λ = 690 nm—colorimetrically, using the NANOCOLOR MACHEREY–NAGEL spectrophotometer) (GmbH&Co. KG, Düren, Germany), total phosphorus (mineralization with sulfuric acid–H2SO4 and ammonium persulfate–(NH4)2S2O8, colorimetrically with ammonium molybdate—(NH4)6Mo7O24 × 4H2O and tin (II) chloride SnCl2 as indicator, NANOCOLOR UV/VIS, MACHEREY–NAGEL, α–690 nm), NO3−, NH4+ (Spectroquant®Prove300 VIS Merck) (KGaA, Darmstadt, Germany), total nitrogen (Shimadzu TOC-TN carbon and nitrogen analyzer) (Shimadzu Corporation, Kyoto, Japan), BOD5 (determination of oxygen content in the sample before and after 5 days of incubation at 20 °C without access to light), COD (titrimetric method with potassium permanganate–KMnO4 and sodium oxalate–Na2C2O4). Every analysis was made in triplicate. The coefficient of variation (CV) for the repeated analysis was 2%.
The obtained results of selected water quality parameters were statistically analyzed (one-way ANOVA, p = 0.05, Tukey’s HSD, Fisher coefficient F > 1, significance level—p = 0.05) using the Statistica 13.3 software package [27]. The alternative tested hypothesis presumed the presence of significant differences in the content of selected parameters of water (PO4, Porg., TP, NH4, NO3, Norg., TN, BOD5, COD, chlorophyll a, SD disc visibility) between research stations 1, 2, 3, and 4.
3. Results
Studies of SKRL conducted over two hydrological years (2022 and 2024) enabled a precise determination of the differences in the progression of the eutrophication process in individual parts of this water body.
Selected water parameters, such as nutrients, nitrogen, and phosphorus, as well as indicators of organic matter content (BOD5, COD) and primary production (chlorophyll a, water transparency), were statistically analyzed. ANOVA was used to assess whether there were significant differences in the mean contents of selected hydrochemical indicators between the study sites. Highly significant differences are indicated by the Fisher coefficient F > 1 and the significance level p < 0.05. Statistical analysis revealed highly significant differences in most of the tested components between research Stations (1–4), especially in the bottom water layers. The results of the statistical analysis are included in Table 1.

Table 1.
Results of one–way ANOVA analyses for investigated variables in the study lake water (SW—surface water layer, BW -bottom water layer).
3.1. Thermal and Oxygen Settings in SKRL Water
3.1.1. Spring Thermal and Oxygen Settings in the Studied Lake
The surface layers of the northern part of the lake (Stations 1 and 2) were warmed to about 11 °C, and deeper down, the water temperature gently decreased to 6 °C at the bottom (Figure 4). At that time, at Station 1, the water layer up to 5 m depth was overoxygenated (from 114 to 142% oxygen saturation), and deeper down the oxygen content dropped rapidly to 3.8 mg O2/L (31% saturation) above the bottom. At Station 2, the water layer up to 7 m depth was overoxygenated (from 104.7 to 119% oxygen saturation, which corresponds to oxygen concentrations ranging from 12.3 to 13.0 mg O2/L), and deeper down the oxygen content decreased gently to 7.9 mg O2/L (65% saturation) above the bottom (Figure 5). In the southern part of the lake, the water was colder. At Station 3, the surface water layers were warmed to 9.5 °C, and with depth, the water temperature decreased gently to 6.6 °C at the bottom (Figure 4).
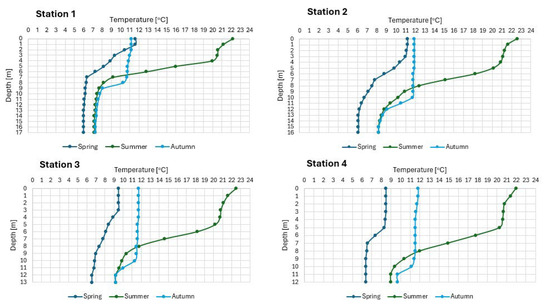
Figure 4.
The thermal settings in the waters of SKRL.
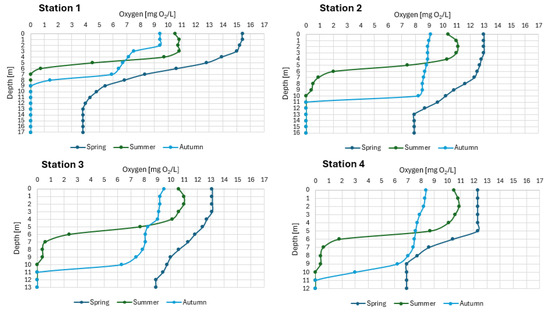
Figure 5.
The oxygen settings in the waters of SKRL.
During this period, the entire water mass was well oxygenated. Up to 6 m depth, water overoxygenation was observed (from 102 to 115% oxygen saturation), and deeper, the oxygen content slowly decreased to 72% saturation in the bottom layers of water (8.9 mg O2/L) (Figure 5). At the shallowest part of the lake (Station 4), the surface water layers were heated only to 8.5 °C, and the water temperature at the bottom was 6.5 °C (Figure 4). Up to 5 m depth, the water of this part was supersaturated with oxygen (105%, 12.3 mg O2/L), while deeper, oxygen concentrations began to gradually decrease to 6.9 mg O2/L (57% saturation) above the bottom (Figure 5).
3.1.2. Summer Thermal and Oxygen Settings in the Studied Lake
At the peak of summer stagnation, in the lake were noted thermal settings, typical of lakes in the temperate geographical zone. The epilimnion layer was 5 m thick and heated in the range of 20.3 to 22.7 °C (Figure 4). Below the epilimnion, there was a metalimnion with the highest gradient of 4 °C/m, which was recorded in the northern part of the lake, and a hypolimnion with temperatures varying from 7 to 9.2 °C. The lowest water temperature at the bottom in the summer was characteristic of the deepest part of the lake (Station 1). Strong thermal differentiation in the water column was reflected in the oxygen profile. Only in the epilimnion layer the oxygen concentrations were high and ranged from 7.4 to 10.5 mg O2/L (85–125% saturation), while in the upper metalimnion the amount of this gas dropped dramatically and in the northern part of the lake the water was deoxygenated below 7 m depth, and in the remaining parts of the reservoir below 10 m (Figure 5).
3.1.3. Autumn Thermal and Oxygen Settings in the Studied Lake
In autumn, full homothermy was not observed. At site 1, the water temperature varied from 11.2 °C at the surface to 7.3 °C at the bottom (Figure 4). Oxygen conditions did not improve significantly. In the water layer up to 8 m depth, oxygenation varied between 13 and 86% oxygen saturation (from 1.4 to 9.4 mg O2/L), while below this level, the presence of this gas was not detected (Figure 5). The situation was similar at the other sites. The water temperature varied from 11.9 °C at the surface to 8.2 °C at the bottom. The 10 m-thick layer of water was saturated with oxygen at about 80%, and anoxic conditions still prevailed deeper down (Figure 5). The situation was similar at the other sites. The water temperature varied from 11.9 °C at the surface to 8.2 °C at the bottom. The 10 m-thick layer of water was saturated with oxygen at about 80%, and anoxic conditions still prevailed deeper down (Figure 5).
3.2. Content of Nitrogen Compounds
In the surface water layers of SKRL, ammonium nitrogen was present throughout the study period in the range from 0.013 to 0.139 mg N/L. No clear seasonal trend was observed in its occurrence, with maximum values recorded in autumn (Figure 6a). Considerably higher concentrations of NH4, reaching 4.5 mg N/L, were characteristic of the bottom water layer (Figure 6b). In the northern, deeper parts of the lake, NH4 concentrations increased steadily from spring to autumn, while in the southern, shallower parts, the content of this form of nitrogen increased from spring to late summer and then decreased. The data’s statistical interpretation showed highly statistically significant differences in the content of ammonium nitrogen between the bottom layers of the separated parts of the lake (Table 1). The bottom waters at Station 1 characterized the highest average concentrations (Figure S1).
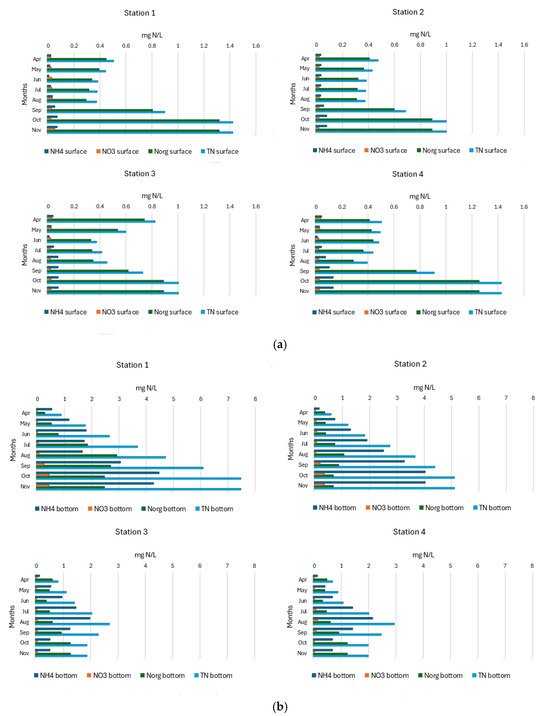
Figure 6.
(a). Spatial and seasonal fluctuations of nitrogen compounds (mg N/L) in the surface water layer of SKRL. (b). Spatial and seasonal fluctuations of nitrogen compounds (mg N/L) in the bottom water layer of SKRL.
Nitrate nitrogen occurred in the water of the studied lake in the range between 0.023 and 0.466 mg N/L, with higher contents in the bottom layers of water. No clear seasonal trend was observed in the occurrence of this form of nitrogen (Figure 6a,b). Statistical analysis of the data showed statistically significant differences in the content of nitrates in the surface water of the separated parts of the lake (Table 1).
Organic nitrogen concentrations in SKRL water varied between 0.39 and 2.95 mg N/L (Figure 6a,b). The content of organic nitrogen in surface water layers increased continuously from spring to autumn. In the bottom water of the northern part of the lake (Stations 1 and 2), the amount of organic nitrogen increased from spring to the end of summer and then decreased, while in the southern part (Stations 3 and 4), similarly to the surface water, the concentration of organic nitrogen increased from April to November (Figure 6a,b). Statistical analysis showed significant differences in the content of organic nitrogen between the bottom water of the selected parts of the lake (Table 1). The deepest part of the lake (Station 1) was characterized by significantly higher contents of this form of nitrogen (Figure S1). The total content of nitrogen compounds in the studied lake varied widely between 0.38 and 7.50 mg N/L (Figure 6a,b). The bottom layers of water were much richer in nitrogen compounds, especially at Station 1, where the maximum values were recorded. In the surface water layers as well as in the bottom water of the northern part of the lake (Stations 1 and 2), seasonal changes in the concentration of total nitrogen consisted of a constant increase from spring to autumn. In the near-bottom layers of water in the southern part of the lake (Stations 3 and 4), concentrations of TN increased from April to September and later decreased in November. During the ANOVA analysis, which assesses whether there are significant differences in the mean concentrations of total nitrogen in the bottom layers of the water across individual parts of the lake, a Fisher’s F coefficient of 4.7 was obtained, with a significance level of p < 0.009. This result demonstrated highly statistically significant differences in the analyzed parameter between the different parts of SKRL (Table 1, Figure S1).
3.3. Content of Phosphorus Compounds
In the surface layers of SKRL water, phosphates were present throughout the study period in the range from 0.010 to 0.031 mg P/L (Figure 7a). Its occurrence at most study stations showed seasonal changes, which consisted of a gradual increase from spring to the end of summer, followed by a decrease in concentrations in autumn. In the northern part of the lake (Station 1), the highest concentrations of phosphates were recorded, and their values increased from spring to autumn (Figure 7a). Significantly higher concentrations of mineral phosphorus, reaching 0.791 mg P/L, were characterized by bottom water layers (Figure 7b). In the extreme northern part of the lake and in the southern stations, phosphate concentrations increased from spring to late summer and then decreased. At site 2, a steady increase in mineral phosphorus content was noted from spring to late autumn (Figure 7b). Statistical interpretation of the data showed statistically significant differences in phosphate content only between the bottom layers of the separated parts of the lake (Table 1). The highest average concentrations (0.550 ± 0.3 mg P/L) were found in the bottom waters at Station 1 (Figure S2).
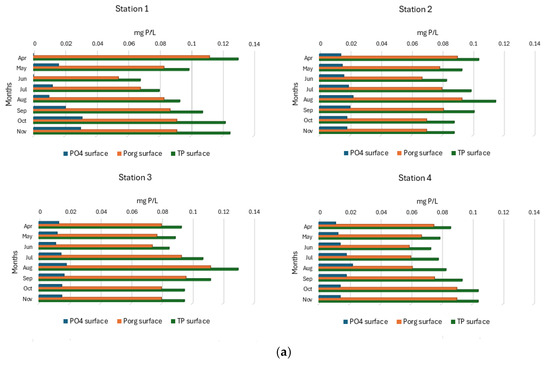
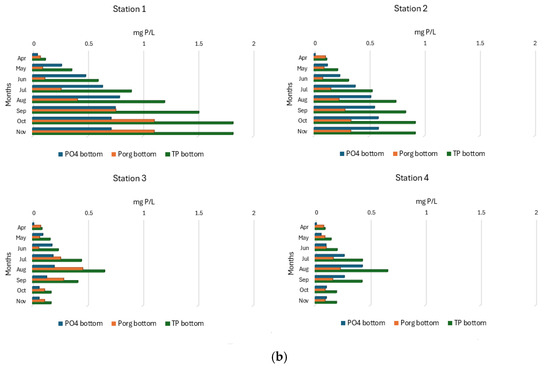
Figure 7.
(a). Spatial and seasonal fluctuations of phosphorus compounds (mg P/L) in the surface water layer of SKRL. (b). Spatial and seasonal fluctuations of phosphorus compounds (mg P/L) in the bottom water layer of SKRL.
Organic phosphorus concentrations in SKRL waters varied between 0.054 and 1.106 mg P/L (Figure 7a,b). No clear seasonal trend in the occurrence of this form of phosphorus was observed in the entire mass of the lake water. Statistical analysis showed significant differences in the content of organic phosphorus only between the bottom water of the particular parts of the lake (Table 1). The deepest part of the lake (Station 1) was characterized by significantly higher contents of this form of phosphorus (Figure S2).
The total content of phosphorus compounds in the studied lake varied widely between 0.068 and 1.820 mg P/L (Figure 7a,b). The water layers near the bottom were much richer in phosphorus compounds, especially at Site 1, where the maximum values were recorded. No clear seasonal trend in the occurrence of total phosphorus was observed in the surface water layers of the studied lake. In the bottom water of the northern parts of the lake (Stations 1 and 2), seasonal changes in the concentration of total phosphorus consisted of their constant increase from spring to autumn, while in the southern parts (Stations 3 and 4), the TP content increased from spring to the end of summer and then decreased (Figure 7b). Statistical analysis of the data showed significant differences between the particular stations only in the bottom waters (Table 1, Figure S2).
3.4. Content of Organic Matter in Water of SKRL
In the surface water layer of the SKRL, BOD5 values were moderate for most of the year and did not exceed 5 mg O2/L, while in the bottom water layers, the values of this parameter were much higher, reaching even 25 mg O2/L (Station 1, October) (Figure 8a,b). Seasonal changes in BOD5 values in the bottom layers of water consisted of their constant increase from spring to maximum values recorded in autumn (Figure 8b). This indicates that organic matter produced in the surface layers of the lake water during the growing season, after dying, sedimented towards the bottom and was deposited at the bottom of the lake, thus causing an increase in the value of biochemical oxygen demand. Statistical analysis of the data showed highly statistically significant differences in BOD5 values only in the bottom water of the particular parts of the lake (Table 1).
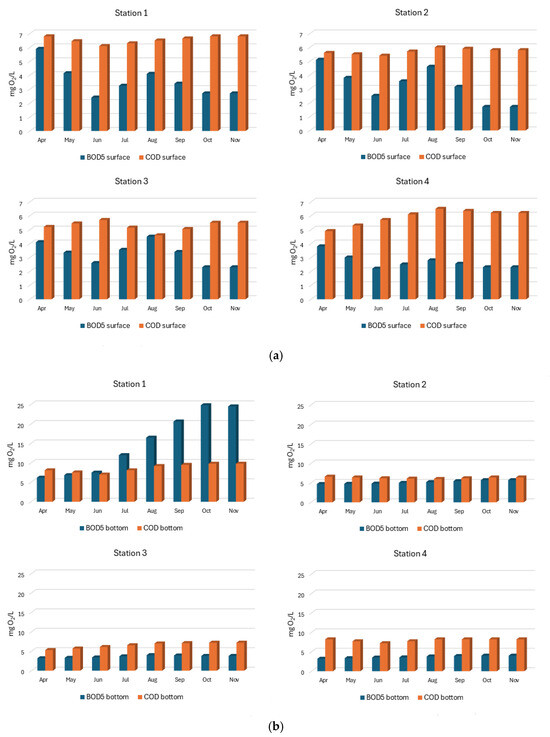
Figure 8.
(a). Spatial and seasonal fluctuations of BOD5 (mg O2/L) and COD (mg O2/L) in the surface water layer of SKRL. (b). Spatial and seasonal fluctuations of BOD5 (mg O2/L) and COD (mg O2/L) in the bottom water layer of SKRL.
During the SKRL studies, COD values were usually found to be 1 to 3 times higher in the waters of stations 2–4 (Figure 8a,b). The values of this parameter varied in the range from 5 to 10 mg O2/L. The source of this matter was certainly the catchment area surrounding the lake, with a predominance of forest areas. It is worth noting that at the extreme northern Station 1, in the water layers near the bottom, except for the spring period, autochthonous organic matter (BOD5) produced during the vegetation period in the lake water (dead phytoplankton) predominated (Figure 8b). Statistical analysis of the data showed highly statistically significant differences in COD values both in the surface waters and near the bottom of the separated parts of the lake (Table 1).
3.5. Primary Production Indicators
The transparency of SKRL water (measured by the Secchi disk visibility) range varied from 1.2 to 4.1 m (Figure 9). The lowest average water transparency at the level of 1.7 ± 0.4 m was noted in the extreme northern part of the lake (Station 1), while the highest, 2.2 ± 1.0 m, was in Station 2. Statistical data analysis did not reveal any statistically significant differences in water transparency between particular parts of the lake (Table 1).
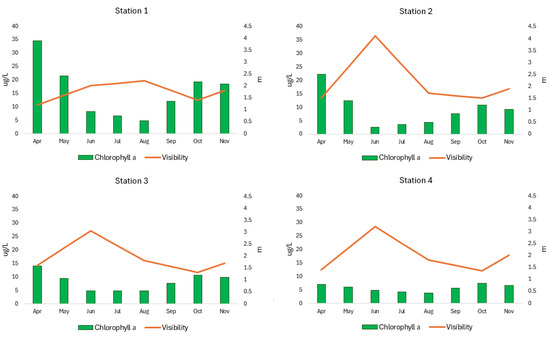
Figure 9.
Spatial and seasonal fluctuation of chlorophyll a and visibility (transparency) in SKRL.
Chlorophyll a concentration in SKRL water ranged between 2.54 and 34.6 µg/L (Figure 9). The lowest average chlorophyll content at the level of 5.75 ± 1.4 µg/L was characterized by the shallowest, most southern part of the lake (Station 4), while the highest, 15.73 ± 9.8 µg/L, was the northern, deepest part (Station 1) (Figure 9). Statistical analysis of the data showed statistically significant differences in chlorophyll a content between the selected research stations (Table 1).
3.6. Electrolytic Conductivity and pH of SKRL Waters
The pH of the surface layers of the studied lake varied from 7.1 to 9.10 (Table 2). The highest average pH (8.24 ± 0.6 pH) during the year was found in the shallowest, most southern part of the SKRL (Station 4). The bottom water was characterized by pH ranging from 6.40 to 8.18 (Table 2). The highest average pH value of 7.05 ± 0.5 was determined for the southern Station 3.

Table 2.
Characteristics of selected parameters of SKRL water.
The SKRL water was characterized by electrolytic conductivity between 246 and 436 µS/cm, with higher values recorded in the bottom layers of the lake (Table 2).
3.7. Principal Component Analysis (PCA) and Pearson Analysis
PCA analysis revealed positive correlations between phosphorus and nitrogen compounds and BOD5 in the bottom water layer and chlorophyll a, and a negative correlation between phosphorus and nitrogen compounds and water transparency (SD) and BOD5 in the surface water layer (Figures S3–S5). Two main analyzed factors explained more than 50% of the variability.
Pearson correlation analysis showed a positive relationship between total phosphorus and total nitrogen levels and chlorophyll a and organic matter (BOD5) concentrations, which are indicators of the intensity of production processes in the lake. Increased nutrient concentrations are associated with increased primary production (Figures S6 and S7). Pearson correlation analysis for total phosphorus, total nitrogen, and water transparency, as measured by the Secchi disk visibility range, revealed a negative relationship. This means that the higher the nutrient content in the trophogenic layer, the lower the water transparency (Figures S6 and S7).
4. Discussion
4.1. Hydrochemical Characterization
Many researchers [28,29,30,31] indicate that the wind is the most important factor influencing hydrodynamics in lakes, apart from morphometry (area, depth, bowl shape) and the nature of the surroundings. SKRL is quite well exposed to the wind because it stretches from the southwest to the northeast, i.e., in line with the direction of the winds dominant in Poland (predominance of westerly and southwesterly winds). However, the shores of this lake are quite steep, covered with trees, and additionally built up from the east, which to some extent hinders the access of wind. The characteristics of thermal settings in SKRL in different seasons of the lake year showed that it is a reservoir characterized by average hydrodynamics. The theoretical range of water mixing calculated from the empirical formula of Patalas [32] (E = 4.4√D, where D is the average effective length of the lake axis) for SKRL is 6.5 m. The value of this indicator exceeds the maximum range of the circulation layer found during the tests by 1.5 m, which qualifies the analyzed lake as a eumictic water body, with the III degree of statics. Moreover, the ratio of the theoretical range of the epilimnion to the maximum depth for SKRL is 0.38 and corresponds to lakes with an average water exchange between the surface and the bottom [32].
Wind-induced water circulation plays an important role in the distribution of oxygen in the lake ecosystem [33]. This is very important because oxygen is necessary for the respiration of aquatic organisms and enables the mineralization of organic matter and the oxidation of reduced substances contained in water. Moreover, changes in oxygen settings observed in the annual cycle allow for determining the trophic type of the water body [34]. In eutrophic lakes, the oxygen profile takes the shape of a clinograde, which means that the surface layers of water contain excess oxygen (oxygen saturation of water exceeds 100%), while the amount of this element decreases rapidly with depth, often to analytical zero [35,36]. Such a distribution of oxygen in water was observed in SKRL. The most pronounced shape of the clinograde occurred in the northern part of the lake, where oxygen in the lower parts of the water was intensively used to decompose organic matter pushed with the water masses by the wind. Moreover, oxygen concentrations recorded in the surface layer of the lake water showed significant seasonal fluctuations related to the different intensities of production processes, i.e., biomass synthesis [37]. According to Nara et al. [38] and Romero-Viana et al. [39], biomass production is a very complex process, dependent on interactions between physical factors such as temperature, light conditions, water dynamics, or wind-induced turbulence, and chemical factors, i.e., the content of nutrients in the euphotic zone, and biological factors, including planktonic organisms. Studies have shown that in spring, the most intensive production processes occurred in the northernmost, the deepest Station 1. Water oxygenation exceeded 140% of oxygen saturation. High production of organic matter in the northern part is associated with the abundance of water and nutrients circulating between the water layers in the biogeochemical cycle. The sources of nutrients in this part of SKRL are surface inflow and delivery from other bays of the lake by wind.
In addition to oxygenation, an important indicator of the primary production level is water transparency, which is an approximate measure of the penetration of solar radiation through water. Transparency is determined by suspended particles present in water, which absorb or scatter solar radiation [40,41]. SKRL studies have shown that water transparency was characteristic of eutrophic lakes in the classification given by Faraś-Ostrowska and Lange [42]. According to Jamu et al. [43], the main factor determining water transparency is the number of phytoplankton, and its production can be determined, among others, by the content of chlorophyll a. In the analyzed lake, the lowest transparency values were accompanied by maximum concentrations of chlorophyll a, which confirms that water transparency was determined by the intensity of photosynthesis processes in the lake. However, the Pearson correlation coefficient r calculated for water transparency and chlorophyll a is 0.486 (y = −0.0475x + 2.4034), which indicates that the statistical relationship between these parameters was moderate. It can be supposed that, in addition to the number of phytoplankton cells, water transparency was reduced by other suspended matter and humus substances originating from the catchment area, with a predominance of forest areas. The worst transparency was recorded in the northern part of the lake, where the wind-blown suspension floating in the water column disturbs light conditions, and the nutrient content of the water favors photosynthesis processes. In this part of the lake, in spring, the average Secchi disc visibility was 1.7 m, and the chlorophyll concentration was above 30 μg/L. Once again, it allows us to state that this is part of the lake characterized by the most intensive processes of organic matter production.
Another indicator of potential oxygen consumption by the organic matter produced within the ecosystem is BOD5 [44]. Its value indicates how much oxygen must be supplied to bacteria to mineralize easily decomposable organic compounds contained in water [45]. This indicator’s very clear spatial differentiation was found in the bottom layers of the lake water. The highest value of BOD5 was noted in the bottom waters of Station 1. The positioning of the lake in the wind direction caused the wind to transport masses of water towards the northern end of the lake, as well as autochthonous organic matter, algae remains, reed fragments, detritus, and other solids floating in the water. Because the extreme northern part of the lake is sheltered, isolated, and deep, organic matter fell towards the bottom of this part of the lake and was mineralized by microorganisms, depleting the oxygen contained in the water. Seasonal changes in BOD5 values in the bottom layers of water consisted of their constant increase from spring to maximum values recorded in autumn. This means that organic matter produced in the surface layers of the lake water during the growing season, after dying, sedimented towards the bottom and was deposited at the bottom of the water body, thereby causing an increase in the value of biochemical oxygen demand. Moreover, the progressive deoxidation of the bottom water layers in the entire lake from spring to the end of summer was certainly associated with the intensive decomposition of organic matter accumulated in the bottom sediments, which, apart from the growing BOD5, was evidenced by the gradually increasing concentrations of ammonium nitrogen and phosphates in the bottom water.
According to Hayakawa et al. [46], another type of organic matter found in surface waters is the so-called allochthonous organic matter, or difficult to decompose, which is indicated by COD (potential oxygen consumption to decomposition of this organic matter). In natural conditions, the main source of allochthonous organic matter is humic substances, which are formed as a result of humification processes, i.e., biochemical transformations of dead plants, animals, or microorganisms occurring in the soil [47]. This matter enters the waters as a result of soil erosion or surface runoff. During the SKRL studies, COD values were usually found to be 1.1 to 2.7 times higher in the water of Stations 2–4 than at Station 1. The source of this matter is certainly the catchment area surrounding SKRL (predominance of forest areas). It is worth noting that at Station 1, autochthonous organic matter predominated (2- or even 3-fold), produced during the vegetation period in the lake water (dead phytoplankton) in the bottom layer of water. This phenomenon indicates that the most intensive primary production processes occurred in the northern part of SKRL.
Due to the great importance of nitrogen and phosphorus in the eutrophication of lakes, in studies on their trophic state, special attention is paid to the concentrations and seasonal variability of these elements in water [48,49].
Significantly lower amounts of phosphates were observed in the vegetation season. In a moderately eutrophic lake, the phosphorus cycle is largely regulated by phytoplankton, and during its increased development, the phosphate level can drop to analytical zero. In SKRL, despite high primary production (oxygen saturation of waters, high pH above 8.3), the mineral form of phosphorus was still present in the lake water. This may indicate a constant supply of phosphorus to the water from the catchment or from shallow, epilimnetic bottom sediment rich in phosphorus. More than 40% of the SKRL bottom is in contact with the epilimnetic zone and may play an important role in the loading of waters with nutrients. It should be noted that although the release from bottom sediment under aerobic conditions is usually lower than under anaerobic conditions [50,51], phosphates are released directly to the trophogenic zone, where they are taken up by algae. The near-bottom water layers characterized much higher phosphate concentrations. The highest concentrations of mineral phosphorus were recorded at the end of summer stagnation at the bottom, which is certainly related to the internal loading process, i.e., the release of phosphates from bottom sediment in anaerobic conditions. Significantly higher phosphate concentrations in the water layers near the bottom were observed at the northern, deepest Station 1. In the hypolimnion of all parts of the lake, anoxic conditions were noted for most of the research season. According to Augustyniak-Tunowska et al. [52], in anaerobic conditions, 30% of phosphorus can form complexes with iron, another 30% can be incorporated into the biomass, and the rest remains dissolved in water. In SKRL, the part of phosphorus that can be bound to iron could be lower due to low concentrations of this metal, a maximum of 0.22 mg Fe/L found in water, and also due to the desorption of P complexes with iron, manganese, and calcium occurring at low redox potential [53,54]. Studies have shown that in the structure of total phosphorus, the proportions between mineral and organic forms were variable. In surface waters, the organic form usually dominates, while in bottom waters, the mineral form does. By relating the obtained results of phosphorus content and its seasonal fluctuations in SKRL to the observations of Carey and Rydin [55], it can be stated that the analyzed reservoir is eutrophic, especially in its northern part.
The next very important element in the eutrophication process is nitrogen. The total amount of nitrogen compounds in the surface layer of the lake water was mainly determined by the organic form, which constituted 76% to 93% of its composition. According to Zhan et al. [56], such a regularity is characteristic of eutrophic lakes.
NO3 was constantly present in the lake water. This may indicate limited nitrification processes, which were not supported by the anaerobic conditions at the bottom, and also by the presence of manganese (manganese 0.05–2.70 mg Mn/L), which inhibits the development of nitrifying bacteria even in low concentrations [57]. According to Paulsson and Winderlund [58], the basic form of nitrogen taken up by phytoplankton is nitrate nitrogen (V), but plants can also assimilate and incorporate ammonium nitrogen into their cells. The results of the SKRL studies confirmed these assumptions. The form of nitrogen preferred by algae in this water body was NO3. In turn, NH4 was constantly present in the productive layer during the vegetation period. In the bottom layers of the lake water, the concentrations of NH4 reached 4.50 mg N/L. The maximum concentrations were recorded in the northern part of the lake. This was probably related to the ammonification process leading to the release of ammonium nitrogen into the water, which was facilitated by the relatively high temperature of the water above the bottom. Relating the obtained results to the studies of Müller et al. [59], SKRL can be classified as a moderately eutrophic water body in terms of nitrogen compounds.
The spatial variability of the trophic state of SKRL was analyzed [60,61,62]. The TSITP (total phosphorus) index values calculated for the entire lake indicate eutrophy. TSITN (total nitrogen) calculated for the water of all research stations of the analyzed reservoir indicates mesotrophic conditions. In turn, the values of the TSISD (water transparency) and TSIChl (chlorophyll) indices classify the northernmost part of the reservoir (Station 1) as eutrophic water, and the remaining parts (Stations 2, 3, 4) as mesotrophic waters (Table 3).

Table 3.
The values of the Carlson [60] and Kratzer and Brezonik [61] trophic indexes TSI for SKRL.
The spring concentration of total phosphorus determined during the study was 130 mg/m3 at Site 1, 104 mg/m3 at Site 2, 93 mg/m3 at Site 3, and 86 mg/m3 at Site 4. According to the OECD criteria [62], these values place the northern part of the lake (Stations 1 and 2) as polytrophic reservoirs or with trophic degree IV, while the waters of the southern part (Stations 3 and 4) are eu-polytrophic reservoirs or with trophic degree III (Table 4).

Table 4.
Trophic assessment criteria of water based on spring TP concentration (mg/m3).
4.2. Conception of Restoration Techniques
4.2.1. The Use of the Curtain to Protect Against the Inflow/Delivery of Pollutants into the Northern Bay of SKRL
The purpose of the curtain is to limit the inflow of organic particles from the main basin of the lake complex into the northern bay (Figure 10). Naturally, in accordance with the direction of prevailing winds, indigenous matter is transported with the water masses into the bay. As an isolated, deep, and wind-sheltered end of the lake, the bay serves as a settling basin for detritus, algae debris, reed fragments, and other organic solids that float in the water and are pushed into the interior by the wind. Due to the morphometric conditions, i.e., the relatively large relative depth, this debris is subject to low aerobic decomposition, as it is deposited on the bottom at depths beyond the reach of wind mixing, where it undergoes putrefaction processes. The curtain separating the transfer of suspended solids will reduce the organic matter load in the bay by about 70%. Consequently, this will gradually improve oxygen conditions in deeper water layers. This process will not be abrupt, but rather unfold over decades. If consistently implemented, it will bring measurable and economically optimal environmental benefits.
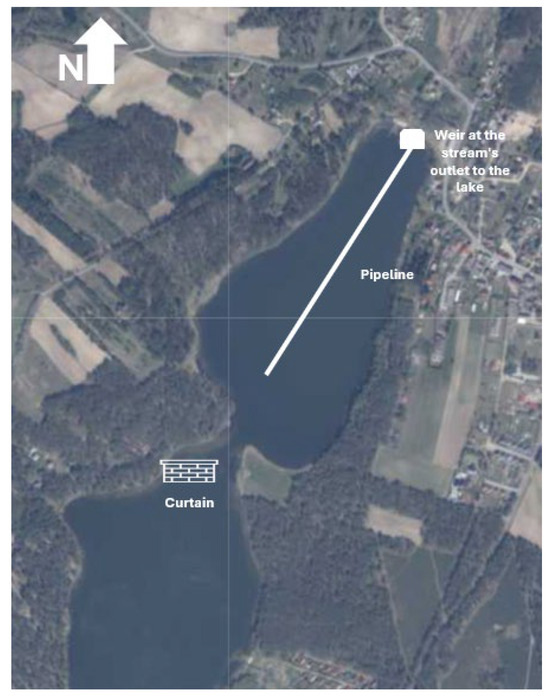
Figure 10.
Scheme of technical solutions.
Locally (under the curtain itself), massive deposition of debris (mainly reed stems) may occur, but the cost-benefit analysis for the entire lake environment indicates that such action is justified. Organic material that settles near the curtain will be collected and transported to the field as fertilizer.
The curtain is a lightweight structure made of 2 mm HDPE foil, supported by polyethylene floats, anchored to the seabed with steel–concrete anchors, or an equivalent solution. To enhance aesthetics, the curtain’s crown, protruding approximately 0.25 m above the water surface, can be concealed with floating gabions with aquatic vegetation. This also provides pro-environmental functionality due to the natural water filtration through the ecosystem of the artificial peninsula (curtain). The structure should be designed in a segmented layout (10 × 10 × 5 m) to allow for repairs and maintenance as needed, as well as to allow for easy adjustments to the half-barrier’s foundation (Figure S6).
4.2.2. The Use of a Pipeline Introducing Surface Water Inflow into the Bottom Zone
Another crucial measure aimed at reducing external loading and nutrient availability in the production zone and improving oxygen conditions in the bottom waters is the use of a pipeline (Figure 10). Surface inflow water will be redirected via a pipeline to the bottom zone of the northern part of the lake, near the deepest point, ensuring its oxygenation.
The method of lake renaturalization by controlling selective water outflow has been known in the literature for over 60 years, although examples of its practical application are still scarce. Poland is the country where this solution was first implemented on Lake Kortowskie [63]. In 1956, the natural outflow from this lake was blocked by a weir, allowing the water to be dammed to a depth of approximately 0.5 m, and the overfertilized hypolimnium waters were drained through a pipeline laid on the bottom sediments. Lake reclamation using selective hypolimnion water extraction has been used on several lakes in North America and Europe, including five lakes currently located in Poland [64]. The pipeline serves to improve oxygenation above the bottom and the nutrient balance in the reservoir. The method proposed for SKRL also utilizes selective control of water flow through the pipeline, but in the opposite direction. This innovative technique involves injecting surface water into the deep part of the lake, thus separating the nutrient load (nitrogen and phosphorus) and organic pollutants introduced with inflow water from the trophogenic (productive) zone. This solution limits the availability of nutrients to primary producers during the growing season. An additional aspect is the introduction of a certain amount of oxygen with inflow water into the bottom waters of the deep part, which is deoxygenated for most of the year, triggering internal fertilization. A similar method to the one proposed by the SKRL has been in operation for several years on Lake Łajs (Warmian-Masurian Voivodeship) and Lake Święte (Greater Poland Voivodeship).
The approximately 640 m-long pipeline will be constructed of 0.4 m-diameter plastic pipes reinforced with an external frame made of polyester fabric or steel profiles. The pipeline will be anchored to the bottom of the reservoir with ballast. The outlet is supported by a stabilizing plate measuring at least 2 × 2 m. A reinforced concrete gate at the lake inlet is designed to dam the stream to a height of 0.1 to 0.4 m, with a retaining plate and a sediment trap. For the SSQ flows of the studied stream, the desired dam height should not exceed 0.2 m, which will not disturb water conditions in adjacent areas.
5. Conclusions
Studies of SKRL have shown that the deepest, northern part of the reservoir was characterized by significantly worse hydrochemical conditions (Station 1). Environmental conditions this part of the lake are typical for highly eutrophic reservoirs according to OECD criteria (overoxygenation of surface water, deoxygenation of bottom water, periodic low water transparency, the internal loading process initiated, indicated by a constant in-crease in the concentration of phosphates and ammonium nitrogen at the bottom, high BOD5 values, indicating increased production of organic matter in the ecosystem).
Research has proven that two factors cause the worst situation at the northern end of the lake. First, the analyzed lake is well exposed to the wind because it stretches from southwest to northeast, i.e., in line with the prevailing wind direction in Poland. In this situation, the wind carries with the masses of water, towards the northern end of the lake, autochthonous organic matter, algae remains, fragments of reed beds, detritus, and other solids floating in the water. The northern part plays a settling role because it is sheltered, isolated, and deep. Secondly, an additional source of allochthonous organic matter and nitrogen and phosphorus, which increased the productivity of this bay, was the inflow, which drains marsh areas and wet meadows.
The results of this study are consistent with historical hydrochemical data for Studzieniczno-Kłączno-Ryńskie Lake, described by Brodzińska et al. [65] in the 1980s. At that time, it was also noted that the northern part of the lake was undergoing progressive eutrophication due to the bay’s unfavorable location relative to the direction of winds, which transport a significant load of mineral and organic matter to it, and the strongest impact of the catchment area (stream inflow). In studies from the 1980s, the bottom layers of water at Site 1 contained 1.5 mg O2/L of oxygen in summer, while total phosphorus concentrations fluctuated around 1 mg P/L.
SKRL studies have shown that natural morphometric, hydrological, and hydrodynamic features of the lake can affect the rate of aging of individual parts of the water body. These factors contribute to variations in nutrient cycling and biodiversity within the bay.
The main step to maintaining the good quality of the water of the northern part of SKRL will be to redirect the water of the surface inflow to the hypolimnion zone by pipeline. The water of this tributary must be directed to the hypolimnetic water to eliminate the load with which they enter into the trophogenic (production) zone. This treatment will limit phytoplankton (especially cyanobacteria) blooms. In addition, diverting well-oxygenated water of surface inflow into the bottom zone of SKRL will contribute to improving the oxygen conditions in the hypolimnion.
In addition, the use of the curtain will limit the inflow of organic particles from the main basin of the SKRL into the northern bay. The curtain separating the transfer of detritus, algae debris, reed fragments, and other organic solids that float, suspended solids will reduce the organic matter load into the bay by about 70%. Consequently, this will gradually improve oxygen conditions in deeper water layers and the environmental conditions of the lake.
A simple technical solution could protect the studied lake, especially the northern part (Station 1), from progressive eutrophication and maintain good water quality.
The cost of the proposed solutions is approximately €300,000. Thanks to these solutions, the northern part of the lake will be able to provide lost ecosystem services for recreational use—a beach for residents, a restaurant, and a water sports equipment rental.
Supplementary Materials
The following supporting information can be downloaded at: https://www.mdpi.com/article/10.3390/app152312437/s1, Figure S1: The changes in the average contents of nitrogen compounds in water of SKRL. Figure S2: The changes in the average contents of phosphorus compounds in water of SKRL. Figure S3: Results of PCA analysis for phosphorus and nitrogen compounds and BOD5. Figure S4: Results of PCA analysis for phosphorus and nitrogen compounds and chlorophyll a. Figure S5: Results of PCA analysis for phosphorus and nitrogen compounds and visibility. Figure S6: Results of Pearson analysis for TP, TN and chlorophyll a, SD visibility and BOD5 for Stations 1–2. Figure S7: Results of Pearson analysis for TP, TN and chlorophyll a, SD visibility and BOD5 for Stations 3–4.
Author Contributions
Conceptualization, J.K.G.; Investigation, J.K.G. and R.A.-T.; Methodology, J.K.G. and R.A.-T.; Software, J.K.G.; Supervision, J.K.G.; Writing—review and editing, J.K.G. and R.A.-T. All authors have read and agreed to the published version of the manuscript.
Funding
This study was founded by Studzienice Commune Office.
Institutional Review Board Statement
Not applicable.
Informed Consent Statement
Not applicable.
Data Availability Statement
Data are available at the Department of Water Protection Engineering and Environmental Microbiology.
Conflicts of Interest
The authors declare no conflicts of interest.
References
- Håkanson, L. Origin of lakes and their and physical characteristics. In Encyclopedia of Lakes and Reservoirs; Springer: Dordrecht, The Netherlands, 2012. [Google Scholar] [CrossRef]
- Tundisi, J.G.; Tundisi, T.M. The origin of lakes. In Limnology, 1st ed.; CRC Press: Boca Raton, FL, USA, 2011. [Google Scholar]
- Sun, Z.; Groll, M.; Opp, C. Lake-catchment interactions and their responses to hydrological extremes. Quat. Int. 2018, 475, 1–3. [Google Scholar] [CrossRef]
- Grochowska, J.K.; Tandyrak, R. Water chemistry of Lake Gilwa. J. Elem. 2010, 15, 89–99. [Google Scholar] [CrossRef]
- Raicevic, V.; Bozic, M.; Rudic, Z.; Lalevic, B.; Kikovic, D. The evolution of the eutrophication of the Palić Lake. Afr. J. Biotechnol. 2011, 10, 1736–1744. [Google Scholar] [CrossRef]
- Bhateria, R.; Jain, D. Water quality assessment of lake water: A review. Sustain. Water Resour. Manag. 2016, 2, 161–173. [Google Scholar] [CrossRef]
- Shi, C.; Zhuang, N.; Li, Y.; Xiong, J.; Zhang, Y.; Ding, C.; Liu, H. Identifying factors influencing reservoir eutrophication using interpretable machine learning combined with shoreline morphology and landscape hydrological features: A case study of Danjiangkou Reservoir, China. Sci. Total Environ. 2024, 951, 175450. [Google Scholar] [CrossRef]
- Schoonover, J.E.; Lockaby, B.G. land cover impacts on stream nutrients and fecal coliform in the lower Piedmont of West Georgia. J. Hydrol. 2006, 331, 371–382. [Google Scholar] [CrossRef]
- Vasitha, P.; Ganguly, R. Water quality assessment of natural lakes and its importance: An overview. Mater. Today Proc. 2020, 32, 544–552. [Google Scholar] [CrossRef]
- Qin, B.; Yang, L.; Chen, F.; Zhu, G.; Zhang, L.; Chen, Y. Mechanism and control of lake eutrophication. Chin. Sci. Bull. 2006, 51, 2401–2412. [Google Scholar] [CrossRef]
- Ahmed, T.; Haque, K.; Haque, M.; Khatun, T.; Mahlemb, S.; Shetu, M.S.; Uddin, M.; Hossin, Y. Lake eutrophication mechanism and control: Current status and future tendency. Life Sci. Stud. 2024, 1, 10–31. Available online: https://www.researchgate.net/publication/385653369_Lake_Eutrophication_Mechanism_and_Control_Current_Status_and_Future_Tendency#fullTextFileContent (accessed on 4 October 2025).
- Bhagowati, B.; Ahamad, K.U. A review on lake eutrophication dynamics and recent developments in lake modelling. Ecohydrol. Hydrobiolgy 2019, 19, 155–156. [Google Scholar] [CrossRef]
- Grochowska, J.; Teodorowicz, M. Assessment of potential impact of drainage basins on upper Pasłęka lakes and susceptibility of lakes to degradation. Acta Sci. Pol. Form. Circumiectus 2006, 5, 99–111. (In Polish) [Google Scholar]
- Tandyrak, R.; Teodorowicz, M.; Grochowska, J. Observations of selected chemical components of meromictic Lake Zapadłe waters in 1990–1993, 2000–2001 and 2005–2006. Arch. Environ. Prot. 2010, 36, 75–82. [Google Scholar]
- Vollenweider, R.A. Scientific Fundamentals of the Eutrophication of Lakes and Flowing Waters with Particular Reference to Nitrogen and Phosphorus as Factors in Eutrophication; Organization for Economic Co-operation and Development, Directorate for Scientific Affairs: Paris, France, 1968. [Google Scholar]
- Vollenweider, R.A. Advances in defining critical loading level for phosphorus in lake eutrophication. Mem. Inst. Ital. Hydrobiol. 1976, 33, 53–83. [Google Scholar]
- Akinnawo, S.O. Eutrophication: Causes, consequences, physical and biological techniques for mitigation strategies. Environ. Chall. 2023, 12, 100733. [Google Scholar] [CrossRef]
- Nędzarek, A.; Tórz, A.; Kubiak, J. Oxygen conditions and trophic state of Lake Głębokie (Szczecin, Poland) in year 2008–2010. Limnol. Rev. 2010, 10, 163–172. [Google Scholar] [CrossRef]
- T-Krasznai, E.; Török, P.; Borics, G.; Lukács, A.; Kókai, Z.; Lerf, V.; Görgényi, J.; B-Béres, V. Functional dynamics of phytoplankton assemblages in hypertrophic lakes: Funcional-and species diversity is highly resistant to cyanobacterial blooms. Ecol. Indic. 2022, 145, 109583. [Google Scholar] [CrossRef]
- Grochowska, J.K.; Wiśniewski, G.; Tandyrak, R. Productivity of lakes varying in water mass dynamics. Limnol. Rev. 2011, 11, 7–13. [Google Scholar] [CrossRef]
- Wang, W.; Li, W.; Xue, M.; Gu, X.; Ye Ch Jiao, Y.; Liu, B.; Han, Y.; Tang, Y.; Zhang, X. Spatial-temporal characteristics and influencing factors of lake water and groundwater chemistry in Hulun Lake, northeast China. Water 2023, 15, 937. [Google Scholar] [CrossRef]
- Nowiński, K.; Maślanka, W.; Lange, W. Chemical properties of lakes water. Limnol. Res. 2005, 3, 279–294. (In Polish) [Google Scholar]
- Tammeorg, O.; Kragh, T.; Nürnberg, G.K.; Carvalho, L.; Huser, B.; Jilbert, T.; Augustyniak-Tunowska, R.; Dadi, T.; Friese, K.; Grinberga, L.; et al. Towards sustainable lake restoration. Sci. Total Environ. 2025, 994, 180001. [Google Scholar] [CrossRef]
- Harkonen, L.H.; Lurling, M.; Kang, L.; Augustyniak-Tunowska, R.; Grochowska, J.K.; Jarvinen, M.; Kramer, L.; Łopata, M.; Masi, F.; Rizzo, A.; et al. Innovation in Lake Restoration: Literature Review; Technical Report; FutureLakes: Oslo, Norway, 2025; 55p, Available online: www.futurelakes.eu (accessed on 20 November 2025).
- Kondracki, J. Pomeranian Lake District. In Regional Geography of Poland; PWN Scientific Publishing House: Warsaw, Poland, 2009; 444p. (In Polish) [Google Scholar]
- Members of the American Public Health Association(APHA). Standard Methods for Examination of Water and Wastewater, 24th ed.; American Water Works Association: Denver, CO, USA, 2023. [Google Scholar]
- Tibco Software Inc. STATISTICA, Version 13.3; Tibco Software Inc.: Palo Alto, CA, USA, 2021. [Google Scholar]
- Bengtsson, L. Circulation processes in lakes. In Encyclopedia of Lakes and Reservoirs; Encyclopedia of Earth Sciences Series; Bengtsson, L., Herschy, R.W., Fairbridge, R.W., Eds.; Springer: Dordrecht, The Netherlands, 2012. [Google Scholar] [CrossRef]
- Chikita, K.A.; Oyagi, H.; Amita, K. A thermal regime and water circulation in a very deep lake: Lake Tazawa, Japan. Hydrology 2024, 11, 40. [Google Scholar] [CrossRef]
- Zhan Ch Chen, L. A review of wind-driven hydrodynamics in large, shallow lakes: Importance, process-based modeling and perspectives. Camb. Prism. Water 2023, 1, e16. [Google Scholar] [CrossRef]
- Skowron, R. Criteria of thermal classification of lakes. Bull. Geogr. Phys. Geogr. Ser. 2009, 2009, 89–105. [Google Scholar] [CrossRef][Green Version]
- Patalas, K. Mixing of water as a factor determining the intensity of matter flow in morphologically different lakes near Węgorzewo. Ann. Agric. Sci. 1960, 77, 223–242. (In Polish) [Google Scholar]
- Liu, S.; Ye, Q.; Wu, S.; Stive, M.J. Horizontal circulation patterns in a large shallow lake: Taihu Lake, China. Water 2018, 10, 792. [Google Scholar] [CrossRef]
- Wetzel, R.G. Limnology, Lake and River Ecosystems; Academic Press: New York, NY, USA, 2001; pp. 1–1006. [Google Scholar]
- Castro, B.F.; Chmiel, H.E.; Minaudo, C.; Krishna, S.; Perolo, P. Primary and net ecosystem production in a large lake diagnosed from high—Resolution oxygen measurements. Water Resour. Res. 2021, 57, e2020WR029283. [Google Scholar] [CrossRef]
- Cao, Y.; Scharfenberger, U.; Shatwell, T.; Adrian, R.; Agasild, H.; Angeler, D.G.; Baklioğlu, M.; Cakiroğlu, A.I.; Hejzlar, J.; Papasterigiadou, E.; et al. Predicting daily net ecosystem production in shallow lakes from dissolved oxygen saturation levels: A pen—European mesocosm experiment and modelling approach. Hydrobiologia 2024, 852, 471–487. [Google Scholar] [CrossRef]
- Karlsson, J.; Byström, P.; Ask, J.; Persson, L.; Jansson, M. Light limitation of nutrient poor lake ecosystems. Nature 2009, 460, 506–509. [Google Scholar] [CrossRef]
- Nara, F.; Tani, Y.; Soma, Y.; Soma, M.; Naraoka, H.; Watanabe, T.; Horiuchi, K.; Kawai, T.; Oda, T.; Nakamura, T. Response of phytoplankton productivity to climate change recorded by sedimentary photosynthetic pigments in Lake Hovsgol (Mongolia) for the last 23,000 years. Quat. Int. 2005, 136, 71–81. [Google Scholar] [CrossRef]
- Romero-Viana, L.; Keely, B.J.; Camacho, A.; Vicente, E. Primary production in Lake La Cruz (Spain) over the last four centuries: Reconstruction based on sedimentary signal of photosynthetic pigments. J. Paleolimnol. 2010, 43, 771–786. [Google Scholar] [CrossRef]
- Liu, X.; Steele Ch Simis, S.; Warren, M.; Tyler, A.; Spyrakos, E.; Selmes, N.; Hunter, P. Retrieval of chlorophyll—A concentration and associated product uncertainty in optically diverse lakes and reservoirs. Remote Sens. Environ. 2021, 267, 112710. [Google Scholar] [CrossRef]
- Karimian, H.; Huang, J.; Chen, Y.; Wang, Z.; Huang, J. A novel framework to predict chlorophyll—A concentrations in water bodies through multi-source big data and machine learning algorithms. Environ. Sci. Pollut. Res. 2023, 30, 79402–79422. [Google Scholar] [CrossRef] [PubMed]
- Faraś-Ostrowska, B.; Lange, W. Transparency of water as a measure of the severity of lake eutrophication. Degradation threats and lake protection. Limnol. Res. 1998, 1, 181–191. [Google Scholar]
- Jamu, D.M.; Lu, Z.; Piedrahita, R.H. Relationship between Secchi disc visibility and chlorophyll a in aquaculture ponds. Aquaculture 1999, 170, 205–214. [Google Scholar] [CrossRef]
- Xu, Z.; Xu, J. Rapid field estimation of biochemical oxygen demand in a subtropical eutrophic urban lake with chlorophyll a fluorescence. Environ. Monit. Assess. 2015, 187, 4171. [Google Scholar] [CrossRef]
- Yiun, Y.; Zhang, Y.; Liu, X.; Zhu, G.; Qin, B.; Shi, Z.; Feng, L. Temporal and spatial variations of chemical oxygen demand in Lake Taihu, China from 2005 to 2009. Hydrobiologia 2011, 665, 129–141. [Google Scholar] [CrossRef]
- Hayakawa, K.; Okamoto, T.; Hirose, Y.; Sato, Y. Quality characteristics indicators in freshwater environments at low concentration levels: Comparison among COD(Mn), BOD and TOC in Lake Biwa catchment. J. Jpn. Soc. Water Environ. 2018, 41, 193–203. [Google Scholar] [CrossRef]
- Lee, J.; Lee, S.; Yu, S.; Rhew, D. Relationships between water quality parameters in rivers and lakes: BOD5, COD, NBOPs, and TOC. Environ. Monit. Assess. 2016, 188, 252. [Google Scholar] [CrossRef]
- Cai, Y.; Wang, H.; Zhang, T.; Zhou, Y.; Dong, A.; Huang, R.; Zeng, Q.; Yuan, H. Seasonal variation regulate the endogenous phosphorus release in sediments of Shijiuhu Lake via water-level fluctuation. Environ. Res. 2023, 238, 117247. [Google Scholar] [CrossRef]
- Wu, X.; Ma, T.; Du, Y.; Jiang, Q.; Shen, S.; Liu, W. Phosphorus cycling in freshwater lake sediments: Influence of seasonal water level fluctuations. Sci. Total Environ. 2021, 792, 148383. [Google Scholar] [CrossRef]
- Boström, B.; Jansson, M.; Forsberg, C. Phosphorus release from lake sediments. Arch. Hydrobiol. 1982, 18, 5–59. [Google Scholar]
- Shaw, J.F.P.; Prepas, E.E. Relationship between phosphorus in shallow sediments and in the trophogenic zone of seven Alberta Lakes. Water Res. 1990, 24, 551–556. [Google Scholar] [CrossRef]
- Augustyniak-Tunowska, R.; Karczmarczyk, R.; Grochowska, J.; Łopata, M.; Napiórkowska-Krzebietke, A.; Lürling, M. Phosphorus inactivation mitigates the effect of warm winters in a temperate shallow lake (Mielenko Lake, Poland). Biogeochemistry 2024, 167, 1234–1267. [Google Scholar] [CrossRef]
- Ye, L.; Xiao, Y.; Qin, J.; Tang, J.; Yin, Y.; Zhang, W. The influence of redox potential on phosphorus release from sediments in different water bodies. Mar. Bull. 2024, 207, 116909. [Google Scholar] [CrossRef]
- Christophoridis Ch Fytianos, K. Conditions affecting the release of phosphorus from surface lake sediments. J. Environ. Qual. 2006, 35, 1181–1192. [Google Scholar] [CrossRef]
- Carey, C.; Rydin, E. Lake trophic status can be determined by the distribution of sediment phosphorus. Limnol. Oceanogr. 2011, 56, 2051–2063. [Google Scholar] [CrossRef]
- Zhan, J.; Han, X.; Brookes, J.D.; Qin, B. High probability of nitrogen and phosphorus co-limitation occurring in eutrophic lakes. Environ. Pollut. 2022, 292, 118276. [Google Scholar] [CrossRef]
- Shahzad, S.; Mehdi, S.E.H.; Sharma, A.; Hussain, F.; Gurung, A.; Kang, W.; Jang, M.; Oh, S.E. Characterization of nitrifying bacteria and exploring a novel approach for toxicity monitoring in water. Environ. Chem. Ecotoxicol. 2025, 7, 106–116. [Google Scholar] [CrossRef]
- Paulsson, O.; Winderlund, A. Algal nutrient limitation and metal uptake experiment in the Akerberg pit lake, northern Sweden. Appl. Geochem. 2020, 125, 104829. [Google Scholar] [CrossRef]
- Müller, B.; Thoma, R.; Baumann, K.B.L.; Callbeck, C.M.; Schubert, C.J. Nitrogen removal processes in lakes of different trophic states from on-site measurements and historic data. Aquat. Sci. 2021, 83, 37. [Google Scholar] [CrossRef]
- Carlson, R.E. A trophic state index for lakes. Limnol. Oceanogr. 1977, 22, 361–369. [Google Scholar] [CrossRef]
- Kratzer, C.R.; Brezonik, P.L. A Carlson—Type trophic state index for nitrogen in Florida lakes. Water Res. Bull. 1981, 17, 713–715. [Google Scholar] [CrossRef]
- OECD (Organisation for Economic Cooperation and Development). Eutrophication of Waters: Monitoring, Assessment and Control; OECD: Paris, France, 1982. [Google Scholar]
- Olszewski, P. Removal of lake hypolimnion. The results of the first year of the experiment on Lake Kortowskie. Zesz. Nauk. WSR 1959, 9, 331–339. (In Polish) [Google Scholar]
- Łopata, M.; Augustyniak, R.; Grochowska, J.; Parszuto, K.; Tandyrak, R. Selected Aspects of Lake Restorations in Poland. In The Mediterranean Sea; Springer Science and Business Media: Berlin, Germany, 2019; pp. 327–352. [Google Scholar]
- Brodzińska, B.; Jańczak, J.; Kowalik, A.; Lamparska, A.; Rekowska, J.; Sziwa, R. Atlas of Polish Lakes; Bogucki Scientific Publishing House: Poznań, Poland, 1997; Volume II. (In Polish) [Google Scholar]
Disclaimer/Publisher’s Note: The statements, opinions and data contained in all publications are solely those of the individual author(s) and contributor(s) and not of MDPI and/or the editor(s). MDPI and/or the editor(s) disclaim responsibility for any injury to people or property resulting from any ideas, methods, instructions or products referred to in the content. |
© 2025 by the authors. Licensee MDPI, Basel, Switzerland. This article is an open access article distributed under the terms and conditions of the Creative Commons Attribution (CC BY) license (https://creativecommons.org/licenses/by/4.0/).