Article

Quality Properties of Crackers Enriched with Composite Flours: Effect on Dough and Final Product

by
Konstantinos Giannoutsos
1,
Danai Ioanna Koukoumaki
1,
Vasiliki Bountziouka
2,3,4,
Tonia Poriazi
5,
Maria Papageorgiou
6,
Dimitris Sarris
1,
Konstantinos Gkatzionis
1 and
Eleni Naziri
1,*
1
Laboratory of Consumer and Sensory Perception of Food & Drinks, Department of Food Science and Nutrition, School of the Environment, University of the Aegean, Metropolite Ioakeim 2, 81400 Lemnos, Greece
2
Computer Simulations, Genomics and Data Analysis Laboratory, Department of Food Science and Nutrition, School of the Environment, University of the Aegean, 81400 Lemnos, Greece
3
Cardiovascular Research Centre, Department of Cardiovascular Science, College of Life Science, University of Leicester, Leicester LE1 7RH, UK
4
Population, Policy and Practice Research, GOS Institute of Child Health, University College London, London WC1N 1EH, UK
5
Poriazi Bakery, 81400 Lemnos, Greece
6
Department of Food Science and Technology, International Hellenic University, Alexandrian Campus, POB 141, 57400 Thessaloniki, Greece
*
Author to whom correspondence should be addressed.
Appl. Sci. 2025, 15(23), 12361; https://doi.org/10.3390/app152312361
Submission received: 5 October 2025 / Revised: 16 November 2025 / Accepted: 19 November 2025 / Published: 21 November 2025

Abstract

Composite flours have been increasingly introduced in bakery products, aiming to enhance their nutritional value and reduce overdependence on imported wheat. Crackers are popular snack items, with potential to affect body weight and health status. This study aimed to examine the effects of different flour types, specifically pulses (chickpea, lupin, yellow split pea and cowpea), agricultural by-products (grape seeds and olive stones) and cereals (barley), on flour functionality, dough quality and final product characteristics compared with wheat flour (control) at various substitution levels. The functional properties of the composite flours were associated with the properties of dough and the characteristics of the crackers. Barley flour produced crackers with significantly higher hardness and lightness (L*) compared to the control, whereas chickpea flour had a similar but non-significant trend for both hardness and L* value. In contrast, high-level olive stone formulations yielded softer textures and the highest total color difference (ΔE), followed by grape seed crackers, which also exhibited high ΔE values and reduced hardness. The effects of composite flours on product texture were mediated by water absorption capacity and the compositional characteristics of the added flours. Crackers prepared with composite flours generally resulted in darker and diverse color profiles as well as low water activity and moisture values. Overall, the findings indicate that variations in composite flour type and substitution level influence product quality, allowing targeted modification of specific cracker attributes.

1. Introduction

Crackers are popular bakery products widely consumed due to their convenience and long shelf life. Traditionally, their production relies mainly on refined wheat flour, which is characterized by its low nutritional value compared to whole grains [1,2]. Wheat is an important dietary staple, averaging 65.6 kg annual per capita consumption globally, which amounts to 37% of the annual cereal consumption [3]. However, dependence on a single cereal crop does not align with the principles of food security and biodiversity and could potentially lead to problems in the supply chain of countries heavily dependent on imports. Furthermore, the development of a circular economy model in agriculture requires the promotion of natural biodiversity and the utilization of local crops in products. Thus, the use of composite flours (blends of different flours with or without wheat) to partially or fully substitute wheat in bakery products is an attractive approach to improve nutritional quality, diversify ingredient sources, and enhance sustainability.
Consumers nowadays are health conscious and increasingly demand foods of higher nutritional value with established health benefits [4,5]. Thus, attempts have been made to substitute wheat flour in bakery products with flours from other sources such as spirulina (biscuits), barley and rye (biscuits), pomegranate peel (muffins), wine and olive by-products (crackers), and pulses (crackers) [6,7,8,9,10] and assess their effects on product characteristics and consumer acceptability.
Barley is another type of cereal, grown in several countries, mainly used as a substitute of wheat in bakery products due to its high fibre, b-glucan, and phenolic content [7]. Alongside cereal intake, pulses are also recognized for their health benefits, high protein and fibre levels [11]. In Greece, national dietary guidelines advise consuming at least three servings of pulses weekly [12]. Lemnos is a Greek island, located in the North Aegean Sea, with unique soil properties that allow the cultivation of different local varieties of pulses, namely afkos (yellow split pea; Lathyrus ochrus (L.) D.C.) and aspromytiko (cowpea; Vigna unguiculata (L.) Walp.). Consumption of these local pulses could help consumers meet the guidelines whilst supporting the local biodiversity. Additionally, agricultural by-products such as olive stone, a rich source of phenolic antioxidants [13], and grape seeds, which contain high levels of resveratrol, phenolic acids, flavonoids, procyanidins, minerals, and dietary fibre [14], have been successfully incorporated into bakery applications, including biscuits [13] and waffles [14], to produce products with enhanced functional properties. These specific by-products are abundant in Lemnos due to the large production of olive oil and wine and can be easily obtained from olive mills and wineries. Therefore, their incorporation into baked products would offer a dual benefit: nutritional enrichment and reduction of local agricultural waste.
As highly consumed snacks, crackers provide an excellent vehicle for testing the functional and technological potential of alternative flours. However, partial substitution of wheat may alter flour hydration dynamics, dough gluten development, and cracker baking behavior, affecting product texture, color, and shelf stability across the processing stages, i.e., flour, dough, and final cracker. Therefore, this study aimed to elucidate how high-protein legume flours (chickpea, lupin, cowpea, yellow split pea), high-fibre by-product flours (grape seed, olive stone), and cereal flour (barley) influence the functional and physicochemical properties of composite systems upon partial replacement of wheat flour at levels of 10%, 20%, and 30%, weight/weight (w/w). Functional and rheological properties were evaluated in flour and dough systems at all three substitution levels, whereas crackers were prepared and analysed at 10% and 30% to represent the lower and upper limits of replacement. Specifically, this work investigates how compositional differences among flours affect hydration and oil-binding capacity, dough rheology and texture, and how these variations translate into changes in cracker structure, colour, and water activity.

2. Materials and Methods

2.1. Materials and Samples

Wheat flour (Triticum durum, ‘Limnos’), barley flour (Hordeum vulgare, ‘Panagia’), yellow split pea flour (Lathyrus ochrus, ‘Afkos’), cowpea flour (Vigna unguiculata, ‘Aspromytiko’), grape seed flour (Vitis vinifera, ‘Moschato Alexandrias’) and olive stone flour (Olea europea, ‘Koroneiki’) were locally obtained from Lemnos, Greece (harvest of 2020–2021). Chickpea flour (Cicer arietinum) and Lupin flour (Lupinus albus) were purchased from local retailers.
Alternatives to wheat legume flours were tested at 100% and at 10%, 20% and 30% concentration in mixture with wheat flour. For baking experiments, only the 10% and 30% substitution levels were used, representing the lowest and highest inclusion rates tested, to capture the most pronounced differences in product performance (Figure S1).

2.2. Dough and Cracker Preparation

Product formulation consisted of 100 g of flour, 40 g of water, 20 g of canola oil, 1.85 g of baking powder, 1 g of salt and 2 g sugar. Dry ingredients were first mixed for 1 min in a heavy duty stand mixer (KitchenAid, Benton Harbor, MI, USA). Separately, the liquid ingredients and sugar were blended to form an emulsion. Subsequently, all ingredients were combined and mixed for 6 min to form the dough, which was then briefly kneaded and allowed to rest at 25 °C for 30 min [9]. For dough analysis, samples were tested immediately. For cracker preparation, sheeting of the dough was done using a manual dough molding machine and pieces (10 cm × 7.5 cm) were cut with a mold. The crackers were baked in a professional oven (North, FK-60W, Athens, Greece) at 170 °C for 17 min, cooled at room temperature, packaged in polyethylene wraps and stored 24 h before analysis. All analyses were performed in triplicate on independently prepared dough and cracker batches to ensure statistical validity.

2.3. Analysis of Functional Properties of Flours

Water absorption capacity (WAC), oil absorption capacity (OAC) and swelling capacity (SC) were determined as described by Chandra et al. (2015) [15] with small modifications. For the WAC, one gram of sample was mixed with 10 mL of distilled water and allowed to stand at room temperature for 30 min and then centrifuged at 3000 rpm for 30 min. Water absorption was expressed as the percentage of water bound per gram of flour. For OAC, one gram of sample was mixed with 10 mL of sunflower oil, left to stand at room temperature for 30 min, and centrifuged at 3000 rpm for 30 min. Oil absorption was expressed as the percentage of oil bound per gram of flour. For SC, a 100 mL graduated cylinder was filled with sample up to the 10 mL mark and distilled water was added to a final volume of 50 mL. The top of the graduated cylinder was tightly covered and mixed by inverting the cylinder. The suspension was inverted again after 2 min and left to stand for a further 8 min. The volume occupied by the sample was taken after the eighth minute. Bulk density (BD) was measured according to Yadav et al. (2012) [16]. Samples (50 g) were put into a 100 mL graduated cylinder and tapped 20–30 times. BD was calculated as the weight of sample per unit volume.

2.4. Farinograph

Farinograph tests were performed in a Brabender farinograph (Brabender, Duisburg, Germany) according to the ICC-standard method 115/1 [17]. Flours were first mixed into the mixing bowl (300 g) that was connected to a circulating water pump and a thermostat operating at a constant temperature (30 ± 0.2 °C). The following parameters were obtained from the farinograms: farinograph water absorption (WA), dough development time (DDT), dough stability (ST) and degree of softening (DS) at 12 min after the peak dough consistency at 500 farinograph units (FU).

2.5. Texture Profile Analysis (TPA) of Dough

Dough samples were molded to a cylindrical shape (30 mm diameter, 20 mm height). To relieve residual stresses produced during sample preparation, the cylindrical dough was placed immediately in a plastic container to avoid dehydration and left to rest for one hour before testing. Samples were placed on a flat base of a texture analyser (TA. XT Plus, Stable Micro Systems, Godalming, Surrey, UK) and were compressed by a probe up to the distance of 10 mm (50% strain level) for two times which resulted in two curves (two bite test). The condition set up for measuring textural properties was as follows: Pre-test speed: 1.00 mm/s; test speed: 2.00 mm/s; post-test speed: 2.00 mm/s; load cell: 50 kg; probe: 75 mm compression platen.
Four textural parameters were determined from each TPA curve: hardness (g), cohesiveness, adhesiveness (g × s) and springiness (%). Hardness represents the maximum compression force during the first cycle in the TPA curve. Cohesiveness is obtained from the ratio between the positive force area during the second compression cycle to that during the first compression cycle and shows how well the product withstands a second deformation relative to how it behaved under the first deformation. Adhesiveness is the negative force area of the first compression, and springiness refers to how well a product physically springs back after it has been deformed during the first compression. Springiness is calculated as the distance ratio between the beginning and the maximum force of the second and first peaks.

2.6. Analysis of Final Product Properties

2.6.1. Water Activity and Moisture Content of Crackers

Water activity (aw) was measured using a water activity meter (Lab Touch-aw, Novasina, Lachen, Switzerland). The moisture content of crackers was calculated based on the AOAC official method 930.15 (2005) [18].

2.6.2. Physical Parameters of Crackers

Cracker dimensions, including length, width and thickness, were measured with a digital caliper and the spread ratio was calculated according to Equation (1).
S p r e a d   r a t i o = w i d t h t h i c k n e s s
The weight before and after baking was measured and bake loss was determined based on Equation (2).
B a k e   l o s s = w e i g h t   b e f o r e   b a k i n g     w e i g h t   a f t e r   b a k i n g   a n d   c o o l i n g w e i g h t   b e f o r e   b a k i n g × 100
Puffiness (%) of crackers was determined according to Equation (3).
P u f f i n e s s % = t h i c k n e s s   o f   b a k e d   c r a c k e r     t h i c k n e s s   o f   c r a c k e r   d o u g h t h i c k n e s s   o f   c r a c k e r   d o u g h × 100

2.6.3. Texture Profile Analysis (TPA) of Crackers

The texture of the crackers was analyzed using a texture analyzer (TA. XT Plus, Stable Micro Systems, Godalming, Surrey, UK) equipped with a 50 kg load cell. Textural attributes measured were the following: peak force (N) which indicates hardness; first break distance (mm) indicating fracturability; and total area of work (J) which indicates the total energy used or toughness.
These were measured by carrying out the snap test with the use of the blade set (HDP/BS). For executing the test, the cracker is placed onto two support beams, while a third moves down in parallel, causing the sample to fracture in the middle. The parameters used for testing were: pre-test speed (1.00 mm/s), test speed (1.00 mm/s), post-test speed (10.00 mm/s), descending distance (15 mm) and trigger force (5 g). The crackers were supported across two beams spaced at 6.5 cm apart on the base plate.

2.6.4. Color Analysis of Crackers

A spectrocolorimeter (LC 100, Lovibond, Amesbury, UK) was used for the measurement of color in the CIELAB system. The results were expressed in terms of L*, lightness (values increasing from 0% to 100%); a*, redness to greenness (positive to negative values, respectively); b*, yellowness to blueness (positive to negative values, respectively); Chroma, C* (saturation), hue angle, h° and total color difference (ΔΕ). ΔΕ was calculated using Equation (4).
Δ Ε = ( L L * ) 2 + ( a a * ) 2 + ( b b * ) 2

2.7. Statistical Analysis

Each sample was analyzed in triplicate using independently prepared batches. Differences among the mean values were assessed by one-way analysis of variance (ANOVA). Post hoc comparisons were performed using Tukey’s HSD test adjustment and the significance level was set at 0.05. A correlation coefficient was used to measure the strength of a linear relationship between two variables. All statistical analyses were two-sided and carried out using XLSTAT software (Version, 2018.1, Addinsoft).

3. Results and Discussion

The relationships between flour composition, dough behavior, and final cracker characteristics were interpreted through two complementary mechanisms: water redistribution and gluten network modification. The first reflects how flour constituents, fibre, protein, and phenolic compounds govern the binding and mobility of water, thereby influencing dough hydration, moisture retention, and colour development during baking. The second concerns how non-gluten proteins and other components interact with, or disrupt, gluten polymerization, altering dough viscoelasticity and the texture of the final product. This conceptual framework guided the interpretation of the experimental data presented in the following sections.

3.1. Functional Properties of Composite Flours

Functional properties such as swelling capacity, water absorption capacity, oil absorption capacity, and bulk density are influenced by various components of food and help to evaluate and predict how flours may affect processing as well as final product characteristics [19]. Composite flours, except for olive stone flour, had lower SC compared to WF (Figure 1), indicating that wheat substitution can reduce swelling in crackers, likely due to the absence of gluten network formation. SC was higher when olive stone flour was used instead. SC describes the ability of flour to increase in volume when soaked in water. A lower SC could be helpful for crackers where, unlike bread, swelling of product is not desirable.
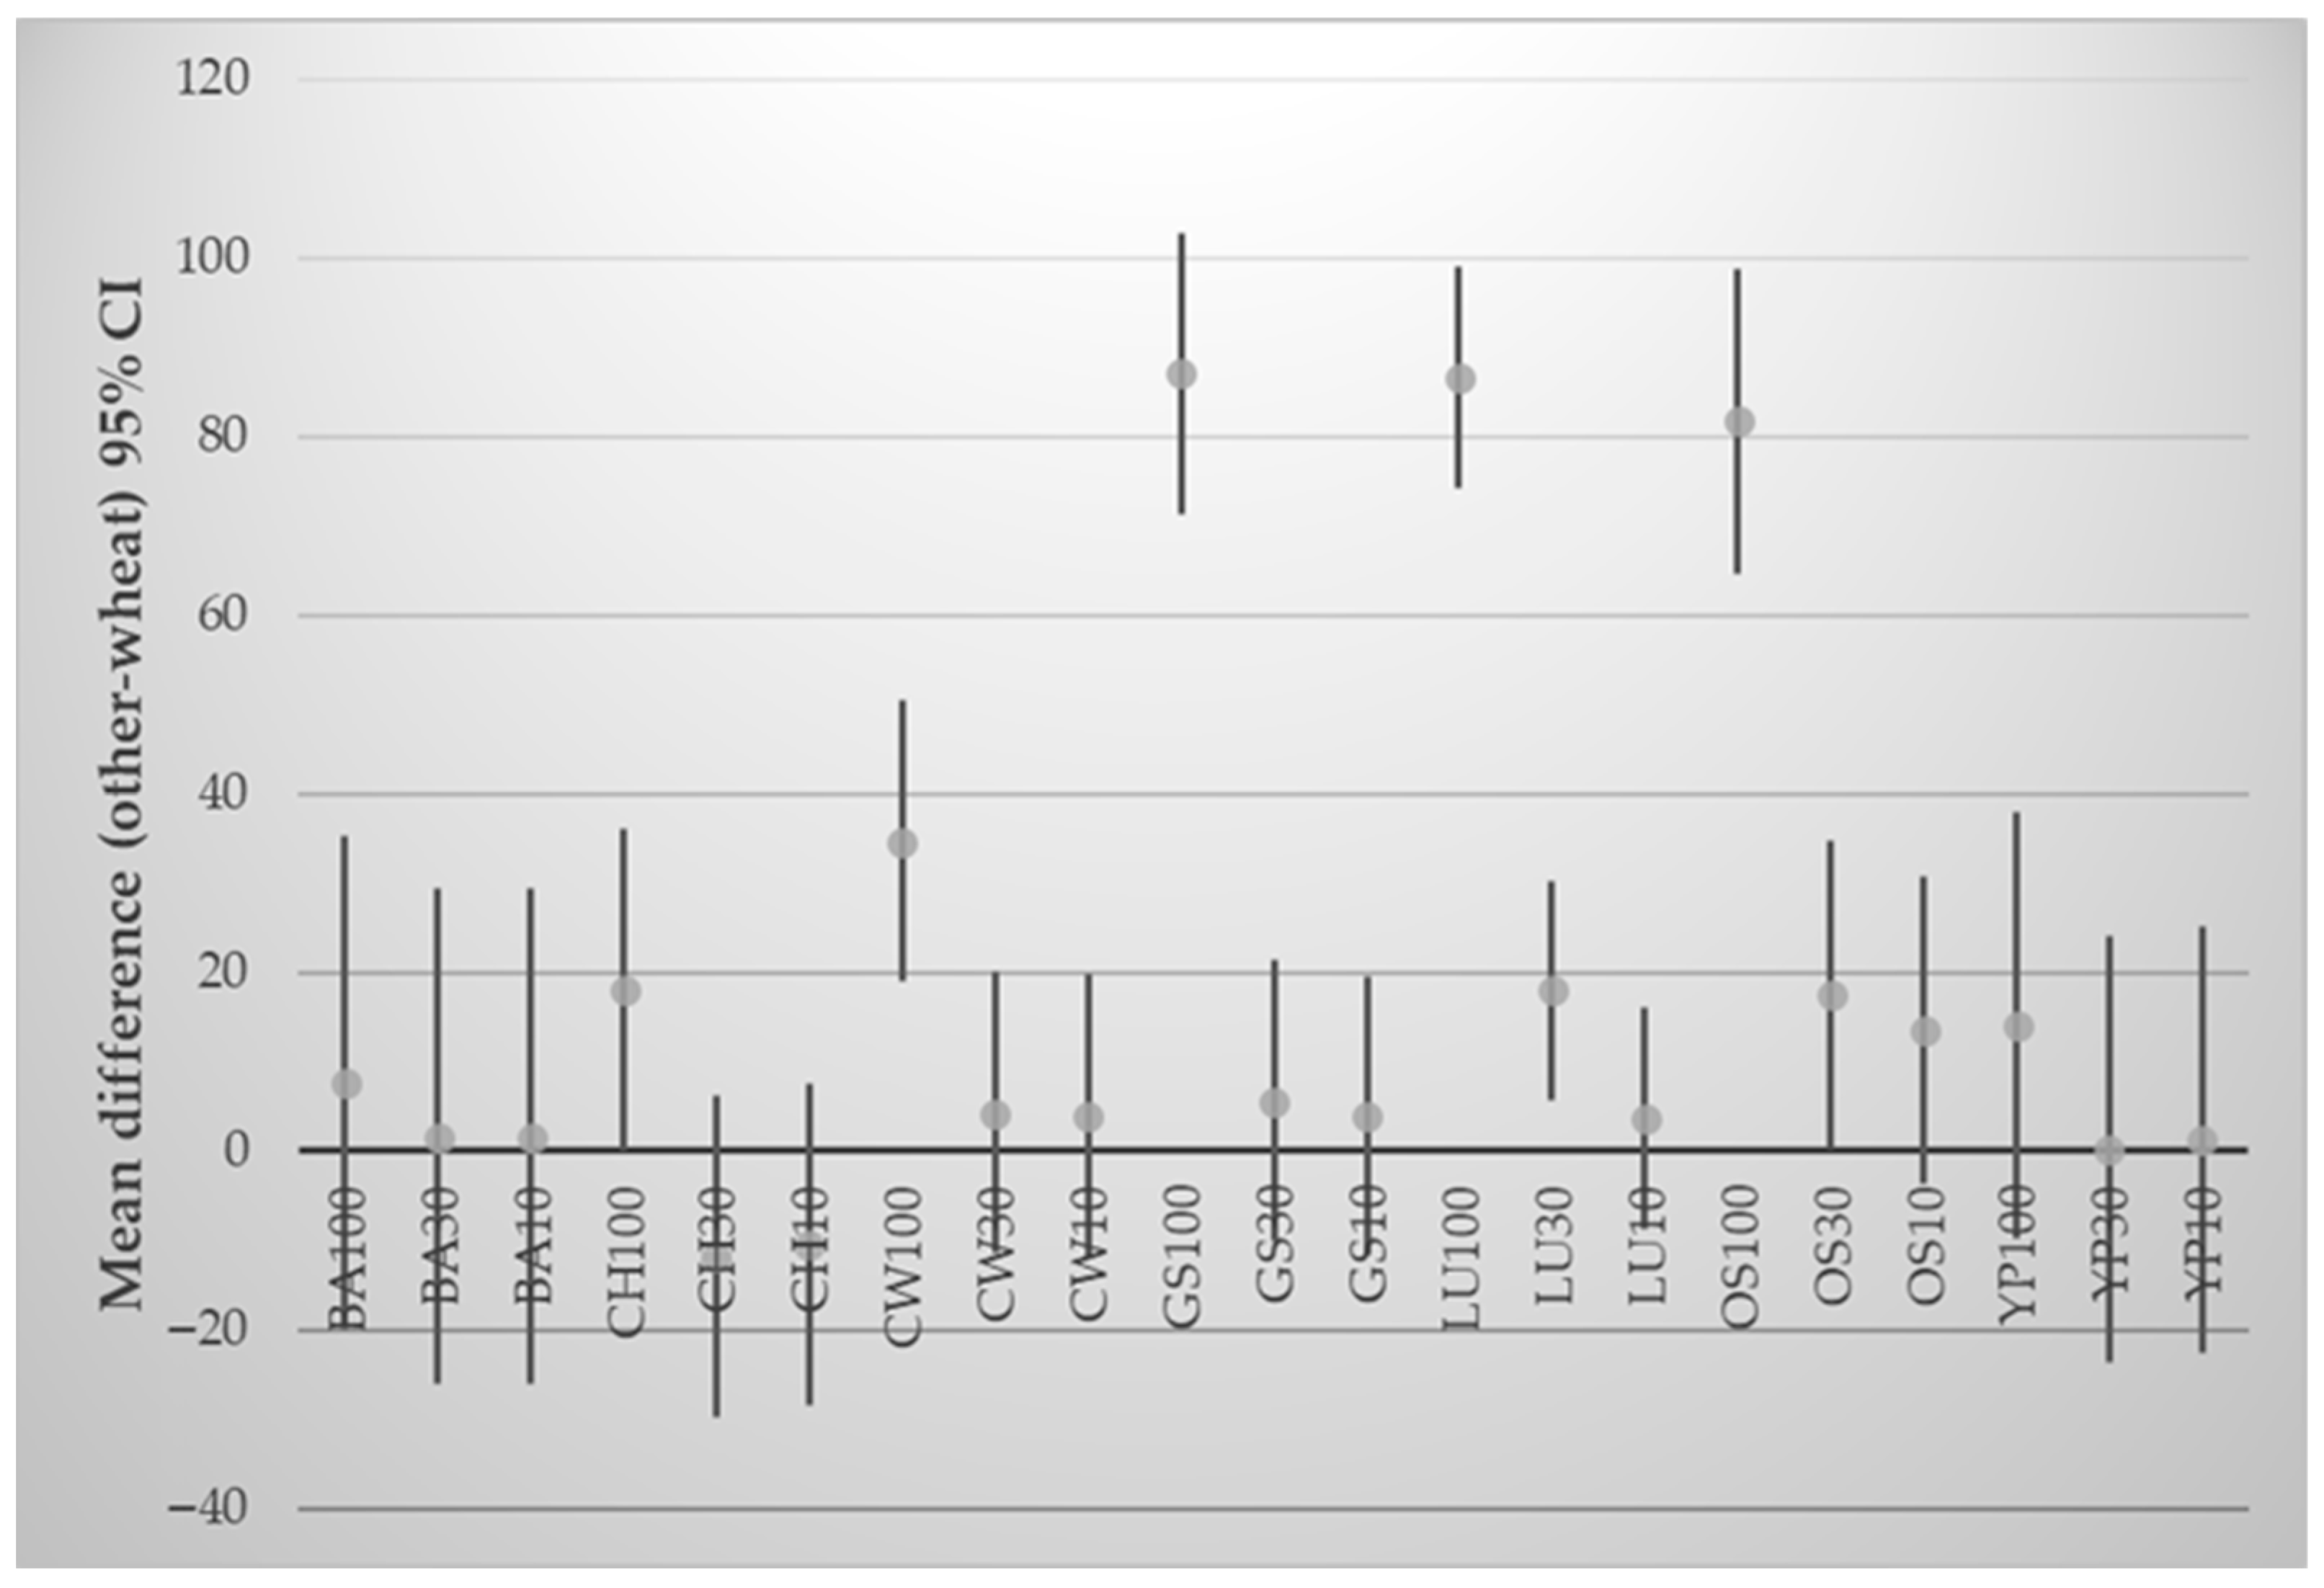
Samples LU100, CW100, OS100 and GS100 exhibited significantly higher WAC than WF (Figure 2). WAC reflects the ability of flour to retain water against gravity and is a key parameter influencing dough handling and consistency. Both excessive and insufficient water absorption can negatively affect dough development and final product quality [19]. The elevated WAC observed in LU100, OS100, and GS100 can be primarily attributed to their high fibre content and, in the case of lupin, to its protein gelation capacity and strong water-binding ability [20]. Insoluble fibres in olive stone and grape seed flours [21,22] contain numerous hydroxyl groups that can immobilize water through hydrogen bonding, while lupin proteins and soluble fibres form viscous gels that entrap water within the protein–polysaccharide network [13,23]. Conversely, the increase in WAC for CW100 was more moderate, likely due to its comparatively lower fibre content and the compact nature of cowpea storage proteins, which exhibit limited water-binding capacity relative to lupin or by-product flours. In composite blends of 10–30% wheat substitution, WAC increased only for LU30 and OS30 suggesting limited impact at lower levels (<30%) of substitution. Again, the enhanced WAC of olive stone flour has been attributed to its high fibre content [13]. Similarly, high-protein and high-fibre pulse flours such as green pea, yellow pea [11] and pea flour [24] have been reported to exhibit elevated WAC due to the combined effects of their protein–polysaccharide matrices [23]. The expected enhancement from other pulse flours, such as chickpea and yellow split pea, was not observed. These samples showed consistently lower WAC values than WF despite their reported high protein and fibre content [20]. This behavior may be related to the higher lipid fraction of chickpea, which limits water binding by coating hydrophilic sites [16].
Additionally, the partial substitution of wheat with legume or by-product flours likely reduced the overall proportion of damaged starch in the blends, as legumes have been reported to contain less damaged starch than wheat flours [25]. Moreover, by-product flours such as grape seed and olive stone lack starch, further decreasing the starch-related water uptake potential. This reduction may partly explain the similar or lower WAC values compared with wheat flour, while the higher WAC observed in LU and GS samples is more possibly related to protein gelation and fibre–phenolic water binding rather than starch damage.
The generally lower swelling capacity observed for most composite flours aligns with their limited water absorption ability, particularly in pulse-based formulations where restricted starch hydration reduces volumetric expansion. In contrast, by-product flours such as grape seed and olive stone, despite exhibiting higher WAC, contain largely insoluble fibre matrices that retain water through hydrogen bonding rather than swelling, explaining partially their low SC values.
Oil absorption capacity was highest for BA100 and lowest for GS100 and CW100 (Table S1). When yellow split pea flour was blended with wheat, OAC became significantly lower than WF. OAC refers to the rate at which protein binds to fat in food and is an important indicator for flavor retention, mouthfeel and product shelf life [26]. Results for barley flour suggest that its use could possibly enhance the sensory perception of wheat crackers. OAC is positively affected by hydrophobic proteins as well as other food characteristics, such as particle size and starch content [23]. The high fat content of specific flours, such as olive stone, for instance, can have an adverse effect on OAC [26]. Our data showed a small, but nonetheless non-significant, decline in OAC level in olive stone flour. OAC results offer a possible explanation for the lower reported flavor rankings received by wheat crackers enriched with olive stone flour and grape seed flour as opposed to those enriched with barley flour [9].
LU100, BA100 and OS100 had significantly higher bulk density (BD) than WF, whereas YP100 had the lowest BD (Table S1). The BD of a sample is indicative of its density without the influence of any compression. It reflects the heaviness, as well as how much of a load a product can carry and can be used to determine a product’s packaging requirements [23]. Drakos et al. (2019) [7] reported higher BD for composite flours with barley. This is in line with this study’s results for BA10 and BA30. Barley flour, as well as other flours with similar effect (lupin and olive stone) could, therefore, be used in future product formulations to help maximize packaging efficiency and reduce waste.

3.2. Dough Rheology (Farinograph Recordings) of Composite Flours

Table 1 shows the rheological characteristics of mixtures of wheat and composite flours at a ratio of 70% to 30% (w/w). The 30% substitution level was selected for rheological testing as it was expected to produce the most pronounced effects on dough development and stability. This concentration also corresponded to the higher level used in the baking trials (10% and 30%), ensuring consistency between rheological and product-quality evaluations.
The control sample corresponds to a typical hard wheat flour used for breadmaking, which is also the predominant flour type produced locally and widely employed in bakery applications across Mediterranean regions [27]. Substitution with 30% barley flour increased both the DDT and stability, likely due to the high β-glucan and fibre content, which slows water penetration and supports hordein–gluten interactions. Both the farinographs of BA100 and CH100 reached a maximum consistency of less than 350 FU at 60% WA, with the chickpea dough showing a typical gluten free dough farinograph [28]. The detrimental effect of CH30 on the DS is evident from its high DDT and degree of softening (DS = 131 FU), suggesting weak network formation. Lupin flour addition, on the other hand, drastically increased WA compared to WF without affecting stability. Both the starch and gluten free flours, OS and GS exhibited increased stability, with the GS showing minimum WA. This behavior reflects the absence of starch and the predominance of fibre–phenolic matrices capable of reinforcing the dough structure through non-gluten interactions. It is worth noting that GS100 did not form a consistent dough mass on the farinograph (no water absorbent constituents) confirming the absence of starch and other water-absorbing polysaccharides typical of cereal-based systems.

3.3. The Effect of Composite Flours on Dough Texture

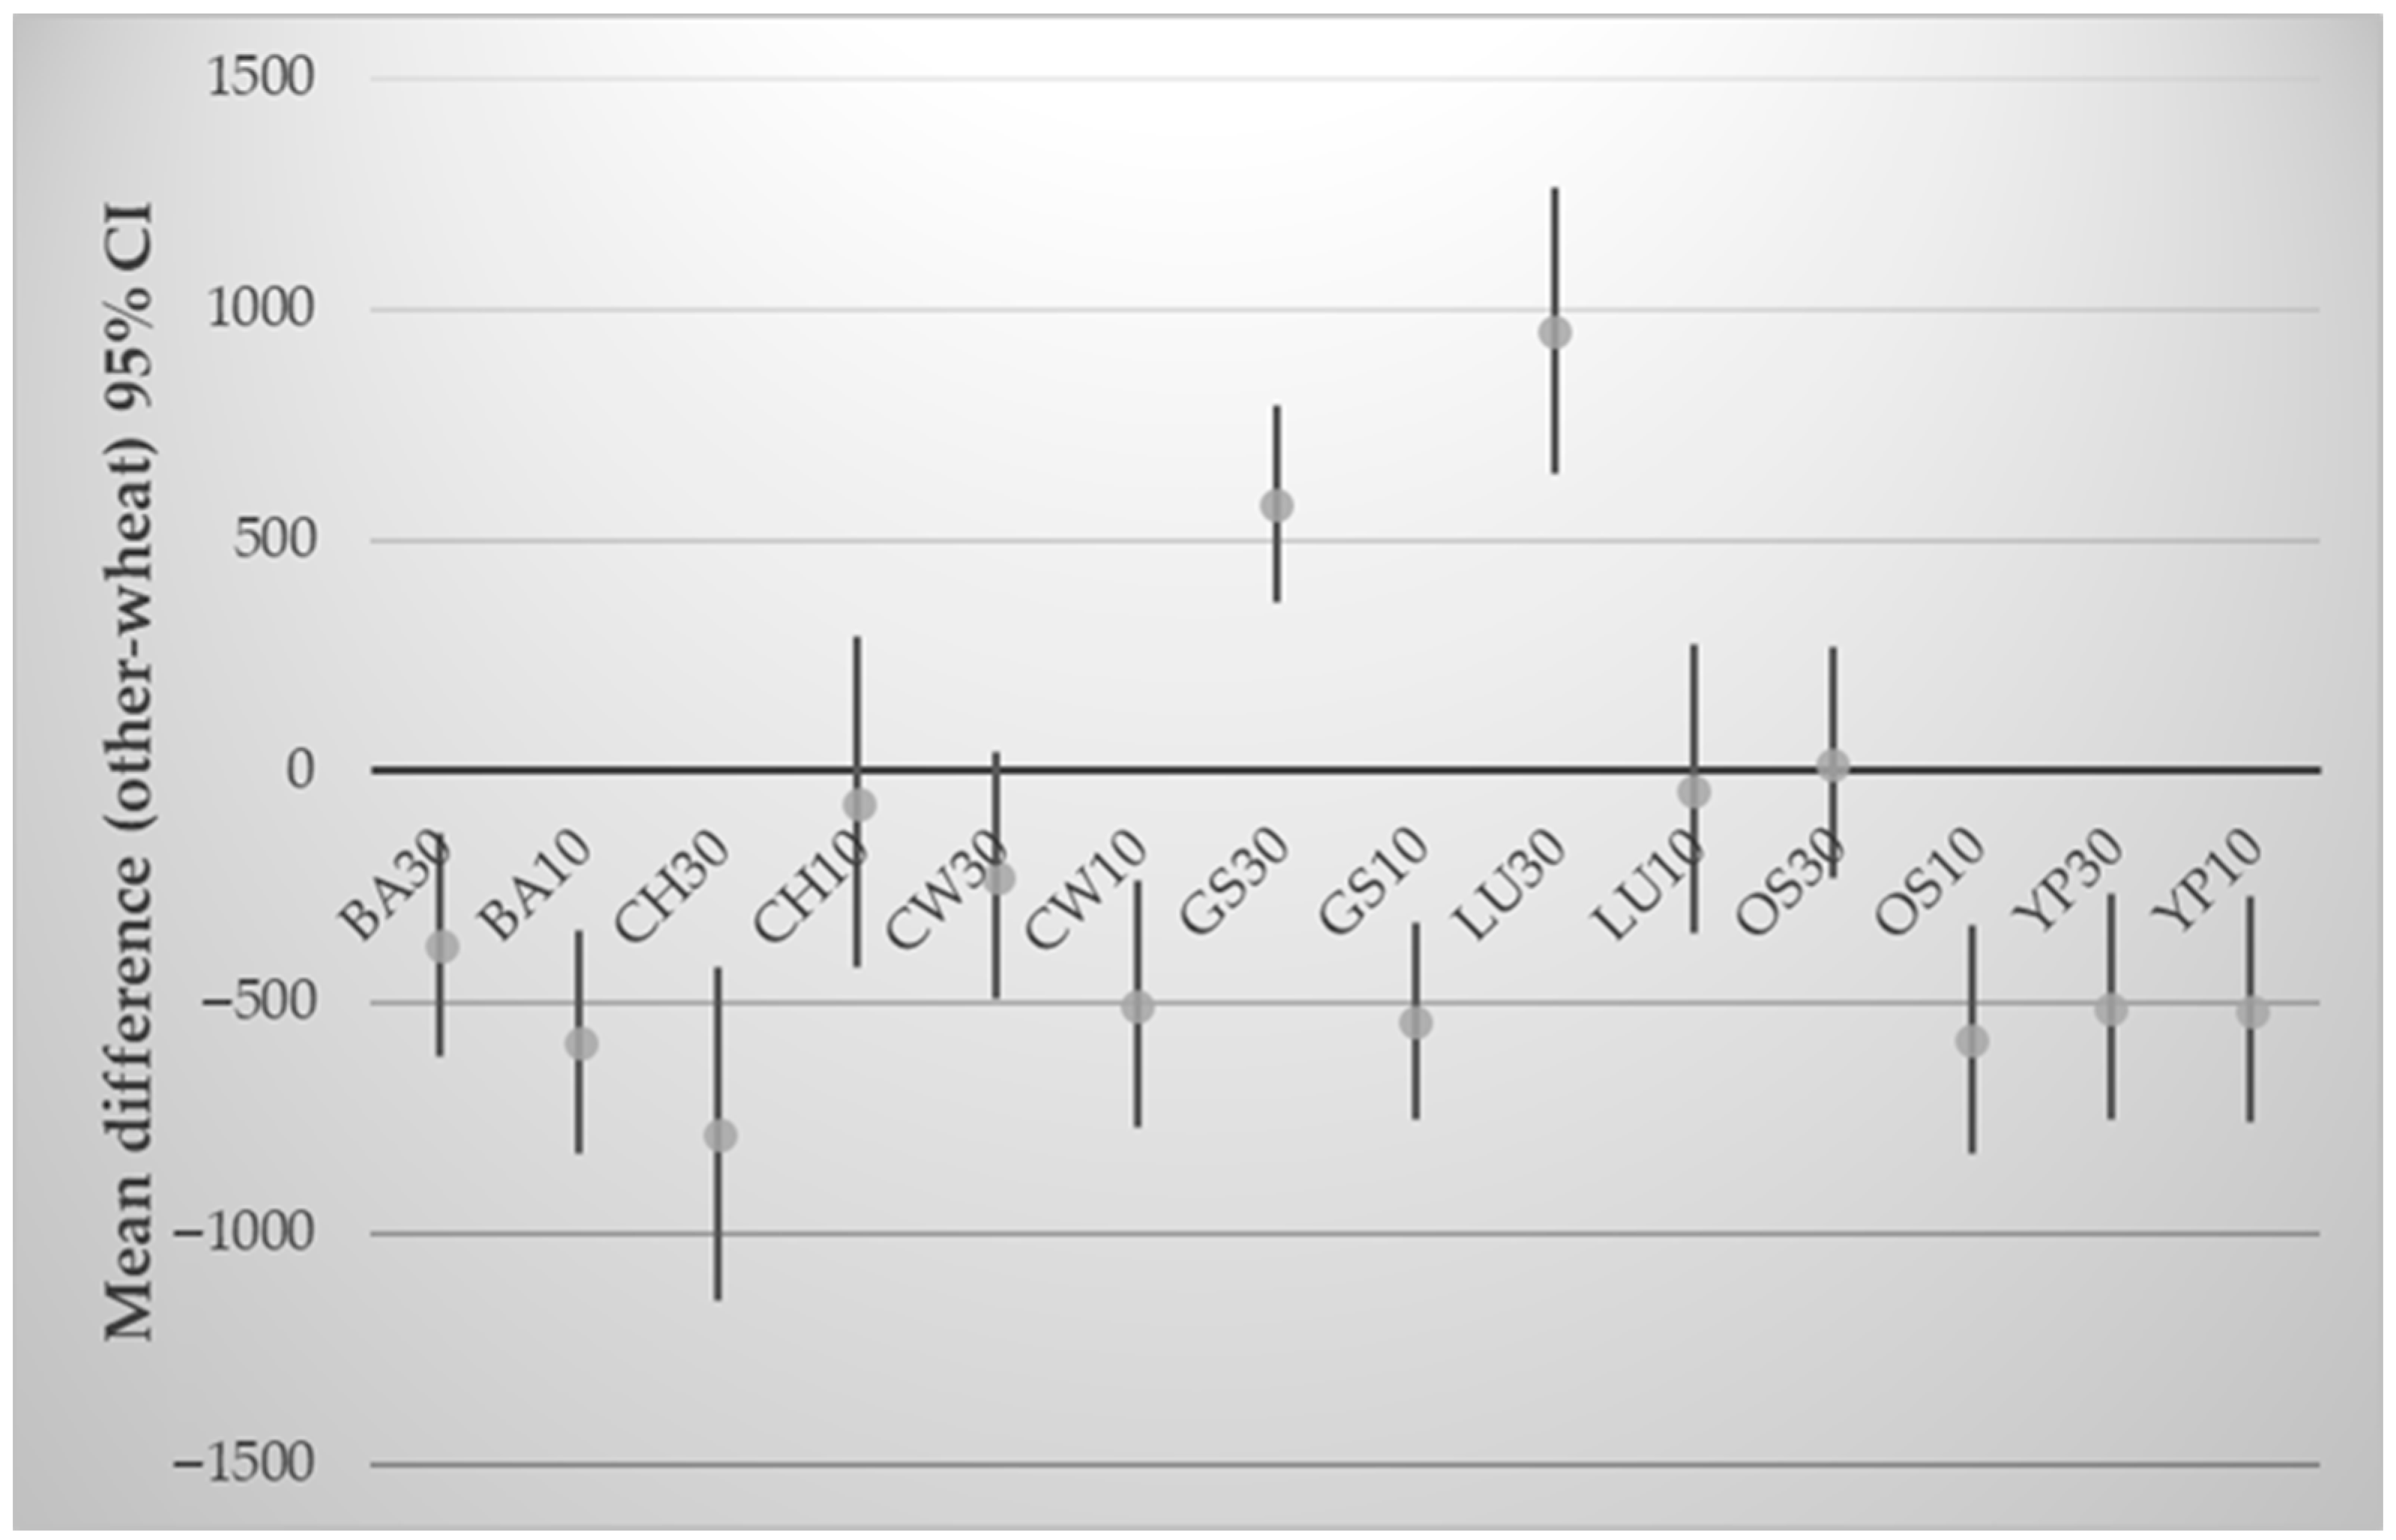
Compared to control, dough hardness was significantly higher in LU30, and GS30 (Figure 3). Bolek et al. (2020) [13] reported that high fibre content can lead to harder dough. However, all barley and yellow split pea flour formulations presented significantly lower hardness, suggesting that fibre is not the only determining factor for dough hardness. Dough from chickpea flour was also softer than control, but only at higher substitution levels while cowpea flour resulted in softer dough at lower substitution levels. This may be due to higher water retention of the dough, resulting from the gluten network disruption [1].
These differences in dough hardness among the various composite flours (Figure 3) highlight the complex interplay between protein functionality, fibre composition, and phenolic content in shaping dough structure. Wheat proteins consist mainly of gliadins (alcohol-soluble prolamins) and glutenins (alcohol-insoluble prolamin polymers). Upon hydration and mixing, they form an interconnected viscoelastic gluten network through hydrogen bonding and disulfide cross-linking. The partial replacement of wheat flour with non-wheat flours introduces proteins of distinct structural characteristics and solubility profiles that alter this network. Specifically, legume flours such as chickpea, cowpea, and yellow split pea contain predominantly salt-soluble globulins and water-soluble albumins, which are compact globular proteins that cannot participate in gluten polymerization. Because of their solubility and molecular structure, these proteins remain dispersed in the aqueous phase and act as inert fillers, physically interrupting the gluten matrix and diluting its extensible network [20,29]. This explains the lower hardness values recorded for CH30, CW30, and YP30. In contrast, LU flour produced a significant increase in hardness, particularly at 30%, consistent with its higher protein (32–55%) and fibre content (14–55%) compared to other pulses [20] and its distinctive protein composition. Lupin proteins are dominated by legumin-type (11S) globulins, which exhibit strong gelation capacity, disulfide cross-linking, and high water-holding ability, promoting the formation of compact aggregates that stiffen the dough matrix [30]. Although lupin lacks gluten, recent findings suggest that cysteine- and tyrosine-containing globulins and albumins may form partial disulfide and dityrosine bonds with wheat gluten proteins, creating limited structural reinforcement within the composite network [31]. These interactions likely contribute to the higher dough hardness observed for LU30. However, as shown by Paraskevopoulou et al. (2010) [32], such associations cannot fully compensate for gluten dilution, and the dough remains less extensible. Therefore, both independent lupin protein aggregation and weak interfacial interactions with gluten appear to underlie the distinct strengthening effect of lupin flour compared with other legume formulations.
Additionally, dietary fibre critically modulates dough hardness. Specifically, flours dominated by insoluble fibres (e.g., grape seed and olive stone flour) [21,22] might act as rigid fillers and strong water competitors, limiting gluten hydration and increasing matrix stiffness, consistent with the higher hardness observed for GS30 and OS30 (Figure 3) and the respective elevated WAC at 100% flour level (Figure 2). In contrast, barley flour, although rich in dietary fibres, contains substantial soluble β-glucans [33], which behave as hydrocolloids: they thicken the aqueous phase, retain water within the continuous phase, and can soften the gluten–starch network rather than rigidify it.
Beyond these fibre-type effects, phenolic–protein interactions provide a further control on protein aggregation and thus hardness, particularly in grape seed flour. Phenolic compounds such as flavan-3-ols, proanthocyanidins, and hydroxytyrosol derivatives, abundant in grape seed flour, can form non-covalent complexes with gluten proteins, altering their solubility and aggregation behavior. Depending on concentration and molecular weight, these interactions may either promote protein aggregation, leading to higher dough hardness, or hinder gluten polymerization, causing network weakening. Consistent with this, Pečivová et al. (2016) [34] reported that increasing grape-seed flour levels reduced dough moisture and significantly increased firmness, reflecting the combined influence of fibre enrichment and phenolic-induced cross-linking. The overall pattern observed in Figure 3 therefore reflects the interplay of gluten dilution, water redistribution, and phenolic-mediated protein aggregation, which together determine whether the dough matrix becomes softer or more compact.
Collectively, these results indicate that dough hardness is governed by the balance between gluten continuity and the filler or crosslinking behavior of added flours. Legume flours tend to soften the dough through gluten dilution and water retention, whereas fibre- and phenolic-rich by-product flours (grape seed and olive stone) reinforce the structure. This compositional–structural relationship supports the mechanical diversity of composite-flour doughs and provides a framework for predicting texture in subsequent baking processes.
Overall, the trends observed between WAC and dough hardness reinforce the combined influence of protein and fibre composition. As shown in Figure 2 and Figure 3, flours with higher WAC, particularly lupin and grape seed, also produced higher doughs’ hardness, indicating that their strong water-binding capacity limits water availability for gluten hydration and promotes a denser, more compact dough matrix. In contrast, chickpea flour, which exhibited lower WAC, resulted in softer doughs, consistent with its weaker water competition and higher proportion of soluble proteins. Thus, WAC appears to be a reliable indirect indicator of how composite flours modulate dough texture through water redistribution and matrix hydration dynamics. This relationship highlights that dough hardness is not solely a function of protein type or fibre content, but rather of how these constituents collectively govern water partitioning within the system.
No significant differences were seen for dough springiness between control and composite flour samples (Table S2). GS30 was the only sample with significantly lower dough adhesiveness and cohesiveness than the control, suggesting a possible link between the two parameters. The reduction in adhesiveness may result from the high phenolic and insoluble-fibre content of grape seed flour, which limits polymer–polymer contact and reduces the availability of free water for interfacial adhesion. Consequently, the dough becomes less sticky but more compact, reflecting an inverse relation between hardness and adhesiveness. The absence of significant differences at lower substitution levels (10% and 20%) indicates that this effect is dose-dependent. High adhesiveness is generally undesirable during processing, as it increases dough stickiness and complicates handling and machinery operation [1].

3.4. Effect of Composite Flours on Physicochemical Parameters of Crackers

Crackers were tested for bake loss, dimensions, puffiness, spread ratio, water activity (aw) and moisture (Table 2). No significant differences were observed for bake loss between composite flours and WF. Crackers with yellow split pea, lupin, and grape seed flours had higher spread ratio (Table 2) and lower puffiness at higher levels of wheat substitution (30% concentration), indicating a high linear association (average r = 0.984) between these two properties. Cracker puffiness may also be affected by flour swelling capacity, as observed by the flours’ lower SC values. Bake loss and spread ratio are important quality indicators for bakery products as they are both linked to sensorial perception. Spread ratio is positively associated with texture, grain finesse, bite and mouthfeel and a lower bake loss is desirable, as it directly affects a product’s shape [1].
Composite flours led to a significantly lower aw and moisture level in the final product (Table 2). Moisture was found to be significantly reduced in biscuits enriched with composite flours from cereals, pulses, millets and wheat germ [35]. In this study, the same amount of added water was intentionally used in all formulations to allow direct comparison of flour effects on water retention. Consequently, differences in final moisture and aw values reflect variations in each flour’s intrinsic water-binding capacity and native moisture content rather than differences in water addition.
The reduction in water activity and moisture content likely arises from differences in the water-binding capacity of the added flours. By-product flours such as grape seed and olive stone, rich in insoluble dietary fibre and phenolic compounds, can immobilize water through extensive hydrogen bonding and fibre–phenolic–protein interactions, thereby reducing the fraction of free or mobile water. In contrast, lupin formulations, which contain soluble fibres and gel-forming proteins, retained slightly higher moisture levels due to water being trapped within a cohesive protein–fibre matrix. Moreover, partial gluten network disruption likely produced a denser, less porous structure that restricted water migration and evaporation during baking. Although water distribution was not directly examined, future studies using low-field nuclear magnetic resonance (LF-NMR) could differentiate between bound, immobile, and free water fractions to verify these mechanisms. Importantly, aw values below 0.5, also observed in this study, are critical for ensuring microbiological safety and sensory acceptability of crackers [11]. Therefore, the use of composite flours could improve shelf stability while maintaining product quality, making them viable alternatives to wheat for commercial applications.

3.5. Effect of Wheat Flour Substitution on the Texture and Color of Crackers

GS30 was presented with lower hardness and total energy values (Table 2). This negative effect could partly be explained by the composite flour’s observed dough hardness. An inverse relation has been reported between hardness of dough and biscuit hardness [1], which is also supported by our cracker results (r = 0.935 for grape seed flour). On the contrary, BA10 had significantly higher hardness values than WF. BA30 also had higher values; however, the result was not statistically significant. Results for barley flour also revealed a correlation (r = 0.836) between dough and final product hardness. A higher level of hardness and fracturability is desirable as they are attributes of a cracker’s crunchy and crisp texture [11,36]. It has been reported that hardness is increased by a flour’s protein and fibre content [1,13]. This is confirmed by data for barley flour, a rich source of β-glucan fibre. Overall, texture was not significantly affected by enrichment with most types and levels of composite flours.
The lightness (L*) of crackers decreased significantly in most samples except those containing lupin and barley flours (Table 3). Crackers with grape seed and olive stone flours were the darkest, particularly at 30% substitution, consistent with their high phenolic content and the formation of dark polymeric pigments during baking. The same result was observed when wheat flour was substituted with olive stone flour in biscuits [13] and with encapsulated grape skin extract in whole wheat cookies [37]. The mechanisms underlying color development differed among the composite flours. In protein- and sugar-rich legume flours (chickpea, cowpea, yellow split pea), the darker color and the increased redness (higher a*) are probably linked to non-enzymatic browning, mainly Maillard and caramelization reactions occurring during baking [38]. These reactions intensify with higher protein and available sugar contents and are favored by the high surface temperature of thin cracker doughs. In contrast, the pronounced darkening of grape seed and olive stone crackers cannot be explained by these pathways, since these by-products are low in starch and protein; rather, it likely results from phenolic oxidation and polymerization of flavan-3-ols, proanthocyanidins, and hydroxytyrosol derivatives. Phenolic-rich ingredients have also been shown to modulate or inhibit Maillard reactions by trapping α-dicarbonyl intermediates and forming quinone adducts, thereby reducing the formation of Maillard end-products in bakery matrices [39]. Lupin-enriched crackers, despite their high protein content, remained comparatively light, which may be attributed to the limited reducing-sugar content of lupin flour and the presence of native yellow pigments (carotenoids and lutein) that counteract Maillard-derived browning. The yellowness index (b*) was reduced in grape seed and olive stone samples, indicating a shift toward darker bluish tones. The same effect was observed by substitution of wheat with olive stone flour in biscuits [13]. Lupin formulations retained higher b* values due to their intrinsic pigments such as carotenoids and lutein [40].
The overall color saturation (C*) decreased for grape seed and olive stone flours, likely due to phenolic oxidation and pigment polymerization leading to darker but less vivid hues. In contrast, legume- and cereal-based samples exhibited higher C* values, consistent with enhanced Maillard-derived browning from their higher protein and sugar content. The hue angle (h°) declined in all formulations, confirming a general movement toward red-brown tones as a result of thermal reactions and pigment oxidation. H° values were also reduced in biscuits when wheat flour was substituted by various cereals, pulses, millets and wheat germ [35]. The total color difference (ΔE) increased proportionally with substitution level, particularly in grape seed and olive stone crackers (ΔE > 25), indicating visually perceptible darkening.
These findings demonstrate that the color modifications of composite-flour crackers result from the combined effects of Maillard and caramelization reactions, phenolic oxidation, and inherent pigment composition, each depending on the chemical nature of the substituting flour. While such color changes are easily perceptible, their influence on consumer perception remains complex [41]. Shankar et al. (2010) [42] suggested that the degree of discrepancy between an individual’s actual and expected experience can significantly affect the extent to which color influences flavor. Therefore, intense color changes, as those indicated by ΔΕ values, could be used as a guide in evaluating and detecting thresholds for altered product perception.

4. Conclusions

Wheat flour substitution with composite flours modified the properties of the flours and dough, depending on both the type of flour and level of substitution. The results suggest that these properties may influence and to some extent help predict, the characteristics of the final product. These effects can be interpreted through a balance between water redistribution and gluten network disruption, which governed the technological behavior of the different formulations. Composite flours tended to produce crackers with lower moisture content and water activity, in a manner that appeared to depend on substitution level. Their use could, therefore, potentially enhance microbiological stability and shelf life. The final product appeared to be softer with the addition of grape seed flour and olive stone flour (30%), compared with barley and chickpea formulations. This effect may be attributed to the flours’ WAC and compositional features such as fibre and protein content. A higher WAC was generally associated with increased dough hardness, leading to denser structures and softer crackers; conversely, lower WAC was linked to higher cracker hardness. Cracker lightness (L* values) tended to decrease with most composite flours, whilst the effect was more pronounced with increasing substitution level. However, crackers with chickpea, lupin and barley flours retained color lightness comparable to the control. Total color difference (ΔΕ) was greatest in crackers made with grape seed and olive stone flour. The quality features of wheat crackers (texture and physicochemical properties) may be optimized through the appropriate selection of composite flours and substitution levels. Visual and statistical comparisons against the control indicated that flour type exerted the stronger overall influence, particularly on texture, color, and water activity, while substitution level primarily modulated the magnitude of these changes. This has implications for future product development and ingredient selection. Future studies should evaluate whether color changes associated with composite flours, and higher levels of wheat flour substitution would influence product quality and consumer acceptability.

Supplementary Materials

The following supporting information can be downloaded at: https://www.mdpi.com/article/10.3390/app152312361/s1, Figure S1: Crackers made with composite flours; Table S1. Functional properties of flours; Table S2. Texture Profile Analysis of dough from composite flours.

Author Contributions

K.G. (Konstantinos Giannoutsos): Conceptualization, Methodology, Investigation, Writing—Original Draft. D.I.K.: Conceptualization, Methodology, Investigation, Writing—Original Draft. V.B.: Methodology, Review and Editing. T.P.: Conceptualization. M.P.: Methodology and Investigation. D.S.: Methodology. K.G. (Konstantinos Gkatzionis): Conceptualization, Supervision, Project administration, Funding acquisition. E.N.: Conceptualization, Methodology, Investigation, Review and Editing, Supervision, Project administration. All authors have read and agreed to the published version of the manuscript.

Funding

This research has been co-financed by the European Regional Development Fund of the European Union and Greek national funds through the Operational Program Competitiveness, Entrepreneurship and Innovation, under the call RESEARCH—CREATE—INNOVATE (project code: T2EDK-02137).

Institutional Review Board Statement

Not applicable.

Informed Consent Statement

Not applicable.

Data Availability Statement

The raw data supporting the conclusions of this article will be made available by the authors on request.

Acknowledgments

The authors are grateful to Poriazi Family-Lemnos for providing raw materials, expertise and equipment.

Conflicts of Interest

Author Tonia Poriazi was employed by Poriazi Bakery. The remaining authors declare that the research was conducted in the absence of any commercial or financial relationships that could be construed as a potential conflict of interest.

Abbreviations

The following abbreviations are used in this manuscript: WF: Wheat Flour—Control; LU100: Lupin flour 100%; CH100: Chickpea flour 100%; YP100: Yellow split pea flour 100%; CW100: Cowpea flour 100%; BA100: Barley flour 100%; OS100: Olive stone flour 100%; GS100: Grape seed flour 100%; LU10: Lupin flour 10%; CH10: Chickpea flour 10%; YP10: Yellow split pea flour 10%; CW10: Cowpea flour 10%; BA10: Barley flour 10%; OS10: Olive stone flour 10%; GS10: Grape seed flour 10%; LU20: Lupin flour 20%; CH20: Chickpea flour 20%; YP20: Yellow split pea flour 20%; CW20: Cowpea flour 20%; BA20: Barley flour 20%; OS20: Olive stone flour 20%; GS20: Grape seed flour 20%; LU30: Lupin flour 30%; CH30: Chickpea flour 30%; YP30: Yellow split pea flour 30%; CW30: Cowpea flour 30%; BA30: Barley flour 30%; OS30: Olive stone flour 30%; and GS30: Grape seed flour 30%.

References

  1. Agrahar-Murugkar, D.; Gulati, P.; Kotwaliwale, N.; Gupta, C. Evaluation of nutritional, textural and particle size characteristics of dough and biscuits made from composite flours containing sprouted and malted ingredients. J. Food Sci. Technol. 2015, 52, 5129–5137. [Google Scholar] [CrossRef]
  2. Gallardo, M.A.; Martínez-Navarro, M.E.; García Panadero, I.; Pardo, J.E.; Álvarez-Ortí, M. Nutritional enhancement of crackers through the incorporation of by-products from the frozen pumpkin industry. Foods 2025, 14, 42548. [Google Scholar] [CrossRef]
  3. Erenstein, O.; Jaleta, M.; Mottaleb, K.A.; Sonder, K.; Donovan, J.; Braun, H.J. Global trends in wheat production, consumption and trade. In Wheat Improvement; Reynolds, M.P., Braun, H.J., Eds.; Springer: Cham, Switzerland, 2022; pp. 47–66. [Google Scholar] [CrossRef]
  4. Czeczotko, M.; Górska-Warsewicz, H.; Zaremba, R. Health and non-health determinants of consumer behavior toward private label products—A systematic literature review. Int. J. Environ. Res. Public Health 2022, 19, 1768. [Google Scholar] [CrossRef]
  5. Albornoz, R.; García-Salirrosas, E.E.; Millones-Liza, D.Y.; Villar-Guevara, M.; Toyohama-Pocco, G. Using the theory of perceived value to determine the willingness to consume foods from a healthy brand: The role of health consciousness. Nutrients 2024, 16, 13995. [Google Scholar] [CrossRef] [PubMed]
  6. Singh, P.; Singh, R.; Jha, A.; Rasane, P.; Gautam, A.K. Optimization of a process for high fibre and high protein biscuit. J. Food Sci. Technol. 2015, 52, 1394–1403. [Google Scholar] [CrossRef] [PubMed]
  7. Drakos, A.; Andrioti-Petropoulou, L.; Evangeliou, V.; Mandala, I. Physical and textural properties of biscuits containing jet milled rye and barley flour. J. Food Sci. Technol. 2019, 56, 367–375. [Google Scholar] [CrossRef] [PubMed]
  8. Topkaya, C.; Isik, F. Effects of pomegranate peel supplementation on chemical, physical, and nutritional properties of muffin cakes. J. Food Process. Preserv. 2019, 43, e13868. [Google Scholar] [CrossRef]
  9. Giannoutsos, K.; Zalidis, A.P.; Koukoumaki, D.I.; Menexes, G.; Mourtzinos, I.; Sarris, D.; Gkatzionis, K. Production of functional crackers based on non-conventional flours: Study of the physicochemical and sensory properties. Food Chem. Adv. 2023, 2, 100194. [Google Scholar] [CrossRef]
  10. Koukoumaki, D.I.; Giannoutsos, K.; Devanthi, P.V.P.; Karmiris, P.; Bourni, S.; Monemvasioti, A.; Psimouli, V.; Sarris, D.; Gkatzionis, K. Effect of wheat replacement by pulse flours on the texture, color, and sensorial characteristics of crackers: Flash profile analysis. Int. J. Food Sci. 2022, 2022, 2354045. [Google Scholar] [CrossRef]
  11. Millar, K.A.; Barry-Ryan, C.; Burke, R.; Hussey, K.; McCarthy, S.; Gallagher, E. Effect of pulse flours on the physiochemical characteristics and sensory acceptance of baked crackers. Int. J. Food Sci. Technol. 2017, 52, 1155–1163. [Google Scholar] [CrossRef]
  12. European Commission. Food-Based Dietary Guidelines in Europ. National FBDG Recommendations for Food Groups. Health Prevention Knowledge Gateway. 2025. Available online: https://knowledge4policy.ec.europa.eu/health-promotion-knowledge-gateway/food-based-dietary-guidelines-europe-table-6_en (accessed on 9 November 2025).
  13. Bolek, S. Olive stone powder: A potential source of fiber and antioxidant and its effect on the rheological characteristics of biscuit dough and quality. Innov. Food Sci. Emerg. Technol. 2020, 64, 102423. [Google Scholar] [CrossRef]
  14. Antonic, B.; Dordevic, D.; Jancikova, S.; Holeckova, D.; Tremlova, B.; Kulawik, P. Effect of grape seed flour on the antioxidant profile, textural and sensory properties of waffles. Processes 2021, 9, 131. [Google Scholar] [CrossRef]
  15. Chandra, S.; Singh, S.; Kumari, D. Evaluation of functional properties of composite flours and sensorial attributes of composite flour biscuits. J. Food Sci. Technol. 2015, 52, 3681–3688. [Google Scholar] [CrossRef]
  16. Yadav, R.B.; Yadav, B.S.; Dhull, N. Effect of incorporation of plantain and chickpea flours on the quality characteristics of biscuits. J. Food Sci. Technol. 2012, 49, 207–213. [Google Scholar] [CrossRef]
  17. ICC-Standard No. 115/1; Method for Using the Brabender Farinograph. International Association for Cereal Science and Technology: Vienna, Austria, 1992.
  18. AOAC. Official Methods of Analysis of AOAC International, 18th ed.; Method 935.29; AOAC International: Gaithersburg, MD, USA, 2005. [Google Scholar]
  19. Awuchi, G.C.; Igwe, S.V.; Echeta, K.C. The functional properties of foods and flours. Int. J. Adv. Acad. Res. 2019, 5, 139–160. [Google Scholar]
  20. Zhang, W.; Boateng, I.D.; Xu, J.; Zhang, Y. Proteins from Legumes, Cereals, and Pseudo-Cereals: Composition, Modification, Bioactivities, and Applications. Foods 2024, 13, 1974. [Google Scholar] [CrossRef]
  21. Oprea, O.B.; Popa, M.E.; Apostol, L.; Gaceu, L. Research on the Potential Use of Grape Seed Flour in the Bakery Industry. Foods 2022, 11, 1589. [Google Scholar] [CrossRef]
  22. Abdel Rahman, M.F.; Elhawary, E.; Hafez, A.M.; Capanoglu, E.; Fang, Y.; Farag, M.A. How Does Olive Seed Chemistry, Health Benefits and Action Mechanisms Compare to Its Fruit Oil? A Comprehensive Review for Valorization Purposes and Maximizing Its Health Benefits. Food Biosci. 2024, 59, 104017. [Google Scholar] [CrossRef]
  23. Du, S.; Jiang, H.; Yu, X.; Jane, J. Physicochemical and functional properties of whole legume flour. LWT 2014, 55, 308–313. [Google Scholar] [CrossRef]
  24. Kohajdová, Z.; Karovičová, J.; Magala, M. Rheological and qualitative characteristics of pea flour incorporated cracker biscuits. Croat. J. Food Sci. Technol. 2013, 5, 11–17. [Google Scholar]
  25. Monnet, A.F.; Eurieult, A.; Berland, S.; Almeida, G.; Jeuffroy, M.H.; Michon, C. Damaged Starch in Pea versus Wheat Flours: Fragmentation Behavior and Contribution of Fine and Coarse Fractions. Cereal Chem. 2019, 96, 465–477. [Google Scholar] [CrossRef]
  26. Hasmadi, M.; Noorfarahzilah, M.; Noraidah, H.; Zainol, M.K.; Jahurul, M.H.A. Functional properties of composite flour: A review. Food Res. 2020, 4, 1820–1831. [Google Scholar] [CrossRef]
  27. Labuschagne, M.; Guzmán, C.; Crossa, J.; van Biljon, A. Determining Factors of Durum Wheat Bread Loaf Volume and Alveograph Characteristics Under Optimal, Drought and Heat Stress Conditions. J. Cereal Sci. 2023, 114, 103791. [Google Scholar] [CrossRef]
  28. Lazaridou, A.; Duta, D.; Papageorgiou, M.; Belc, N.; Biliaderis, C.G. Effects of hydrocolloids on dough rheology and bread quality parameters in gluten-free formulations. J. Food Eng. 2007, 79, 1033–1047. [Google Scholar] [CrossRef]
  29. Boukid, F.; Zannini, E.; Carini, E.; Vittadini, E. Pulses for Bread Fortification: A Necessity or a Choice? Trends Food Sci. Technol. 2019, 88, 416–428. [Google Scholar] [CrossRef]
  30. Chukwuejim, S.; Kadam, D.; Aluko, R.E. Structural, Physicochemical, and Functional Properties of White and Blue Lupin Vicilin and Legumin Fractions. Food Chem. X 2025, 31, 103078. [Google Scholar] [CrossRef]
  31. Holkovičová, T.; Lauková, M.; Minarovičová, L.; Kohajdová, Z. Wheat-Lupin Flour Blends, Functionally and Nutritionally Valuable Raw Materials for Bakery Applications. ACS Food Sci. Technol. 2025, 5, 3823–3834. [Google Scholar] [CrossRef]
  32. Paraskevopoulou, A.; Provatidou, E.; Tsotsiou, D.; Kiosseoglou, V. Dough Rheology and Baking Performance of Wheat Flour–Lupin Protein Isolate Blends. Food Res. Int. 2010, 43, 1009–1016. [Google Scholar] [CrossRef]
  33. Abdullah, M.; Tufail, T.; Hussain, M.; Nadeem, M.; Owais, M.; Zulkiffa, M.; Tanveer, M.H.; Al Jbawi, E. Effect of Sprouted Barley Flour on the Quality of Wheat Bread, Biscuits and Cakes. J. Sci. Food Agric. 2023, 103, 8711–8718. [Google Scholar] [CrossRef]
  34. Pečivová, P.B.; Kráčmar, S.; Kubáň, V.; Mlček, J.; Juríková, T.; Sochor, J. Effect of Addition of Grape Seed Flour on Chemical, Textural and Sensory Properties of Bread Dough. Potravin. Slovak J. Food Sci. 2016, 10, 368–373. [Google Scholar] [CrossRef]
  35. Kumar, K.A.; Sharma, G.K.; Khan, M.A.; Govindaraj, T.; Semwal, A.D. Development of multigrain premixes—Its effect on rheological, textural and micro-structural characteristics of dough and quality of biscuits. J. Food Sci. Technol. 2015, 52, 7759–7770. [Google Scholar] [CrossRef] [PubMed]
  36. Batista, A.P.; Niccolai, A.; Bursic, I.; Sousa, I.; Raymundo, A.; Rodolfi, L.; Biondi, N.; Tredici, M.R. Microalgae as functional ingredients in savory food products: Application to wheat crackers. Foods 2019, 8, 611. [Google Scholar] [CrossRef] [PubMed]
  37. Dordoni, R.; Garrido, G.D.; Marinoni, L.; Torri, L.; Piochi, M.; Spigno, G. Enrichment of whole wheat cocoa biscuits with encapsulated grape skin extract. Int. J. Food Sci. 2019, 2019, 9161840. [Google Scholar] [CrossRef]
  38. Mancebo, C.M.; Rodriguez, P.; Gomez, M. Assessing rice flour-starch-protein mixtures to produce gluten-free sugar-snap cookies. LWT 2016, 67, 127–132. [Google Scholar] [CrossRef]
  39. Melini, V.; Vescovo, D.; Melini, F.; Raffo, A. Bakery Product Enrichment with Phenolic Compounds as an Unexplored Strategy for the Control of the Maillard Reaction. Appl. Sci. 2024, 14, 2647. [Google Scholar] [CrossRef]
  40. Zhao, J.; Liu, X.; Bai, X.; Wang, F. Production of biscuits by substitution with different ratios of yellow pea flour. Grain Oil Sci. Technol. 2019, 2, 91–96. [Google Scholar] [CrossRef]
  41. Spence, C. On the psychological impact of food colour. Flavour 2015, 4, 21. [Google Scholar] [CrossRef]
  42. Shankar, M.; Simons, C.; Shiv, B.; Mcclure, S.; Levitan, C.; Spence, C. An expectations-based approach to explaining the cross-modal influence of color on orthonasal olfactory identification: The influence of the degree of discrepancy. Atten. Percept. Psychophys. 2010, 72, 1981–1993. [Google Scholar] [CrossRef] [PubMed]
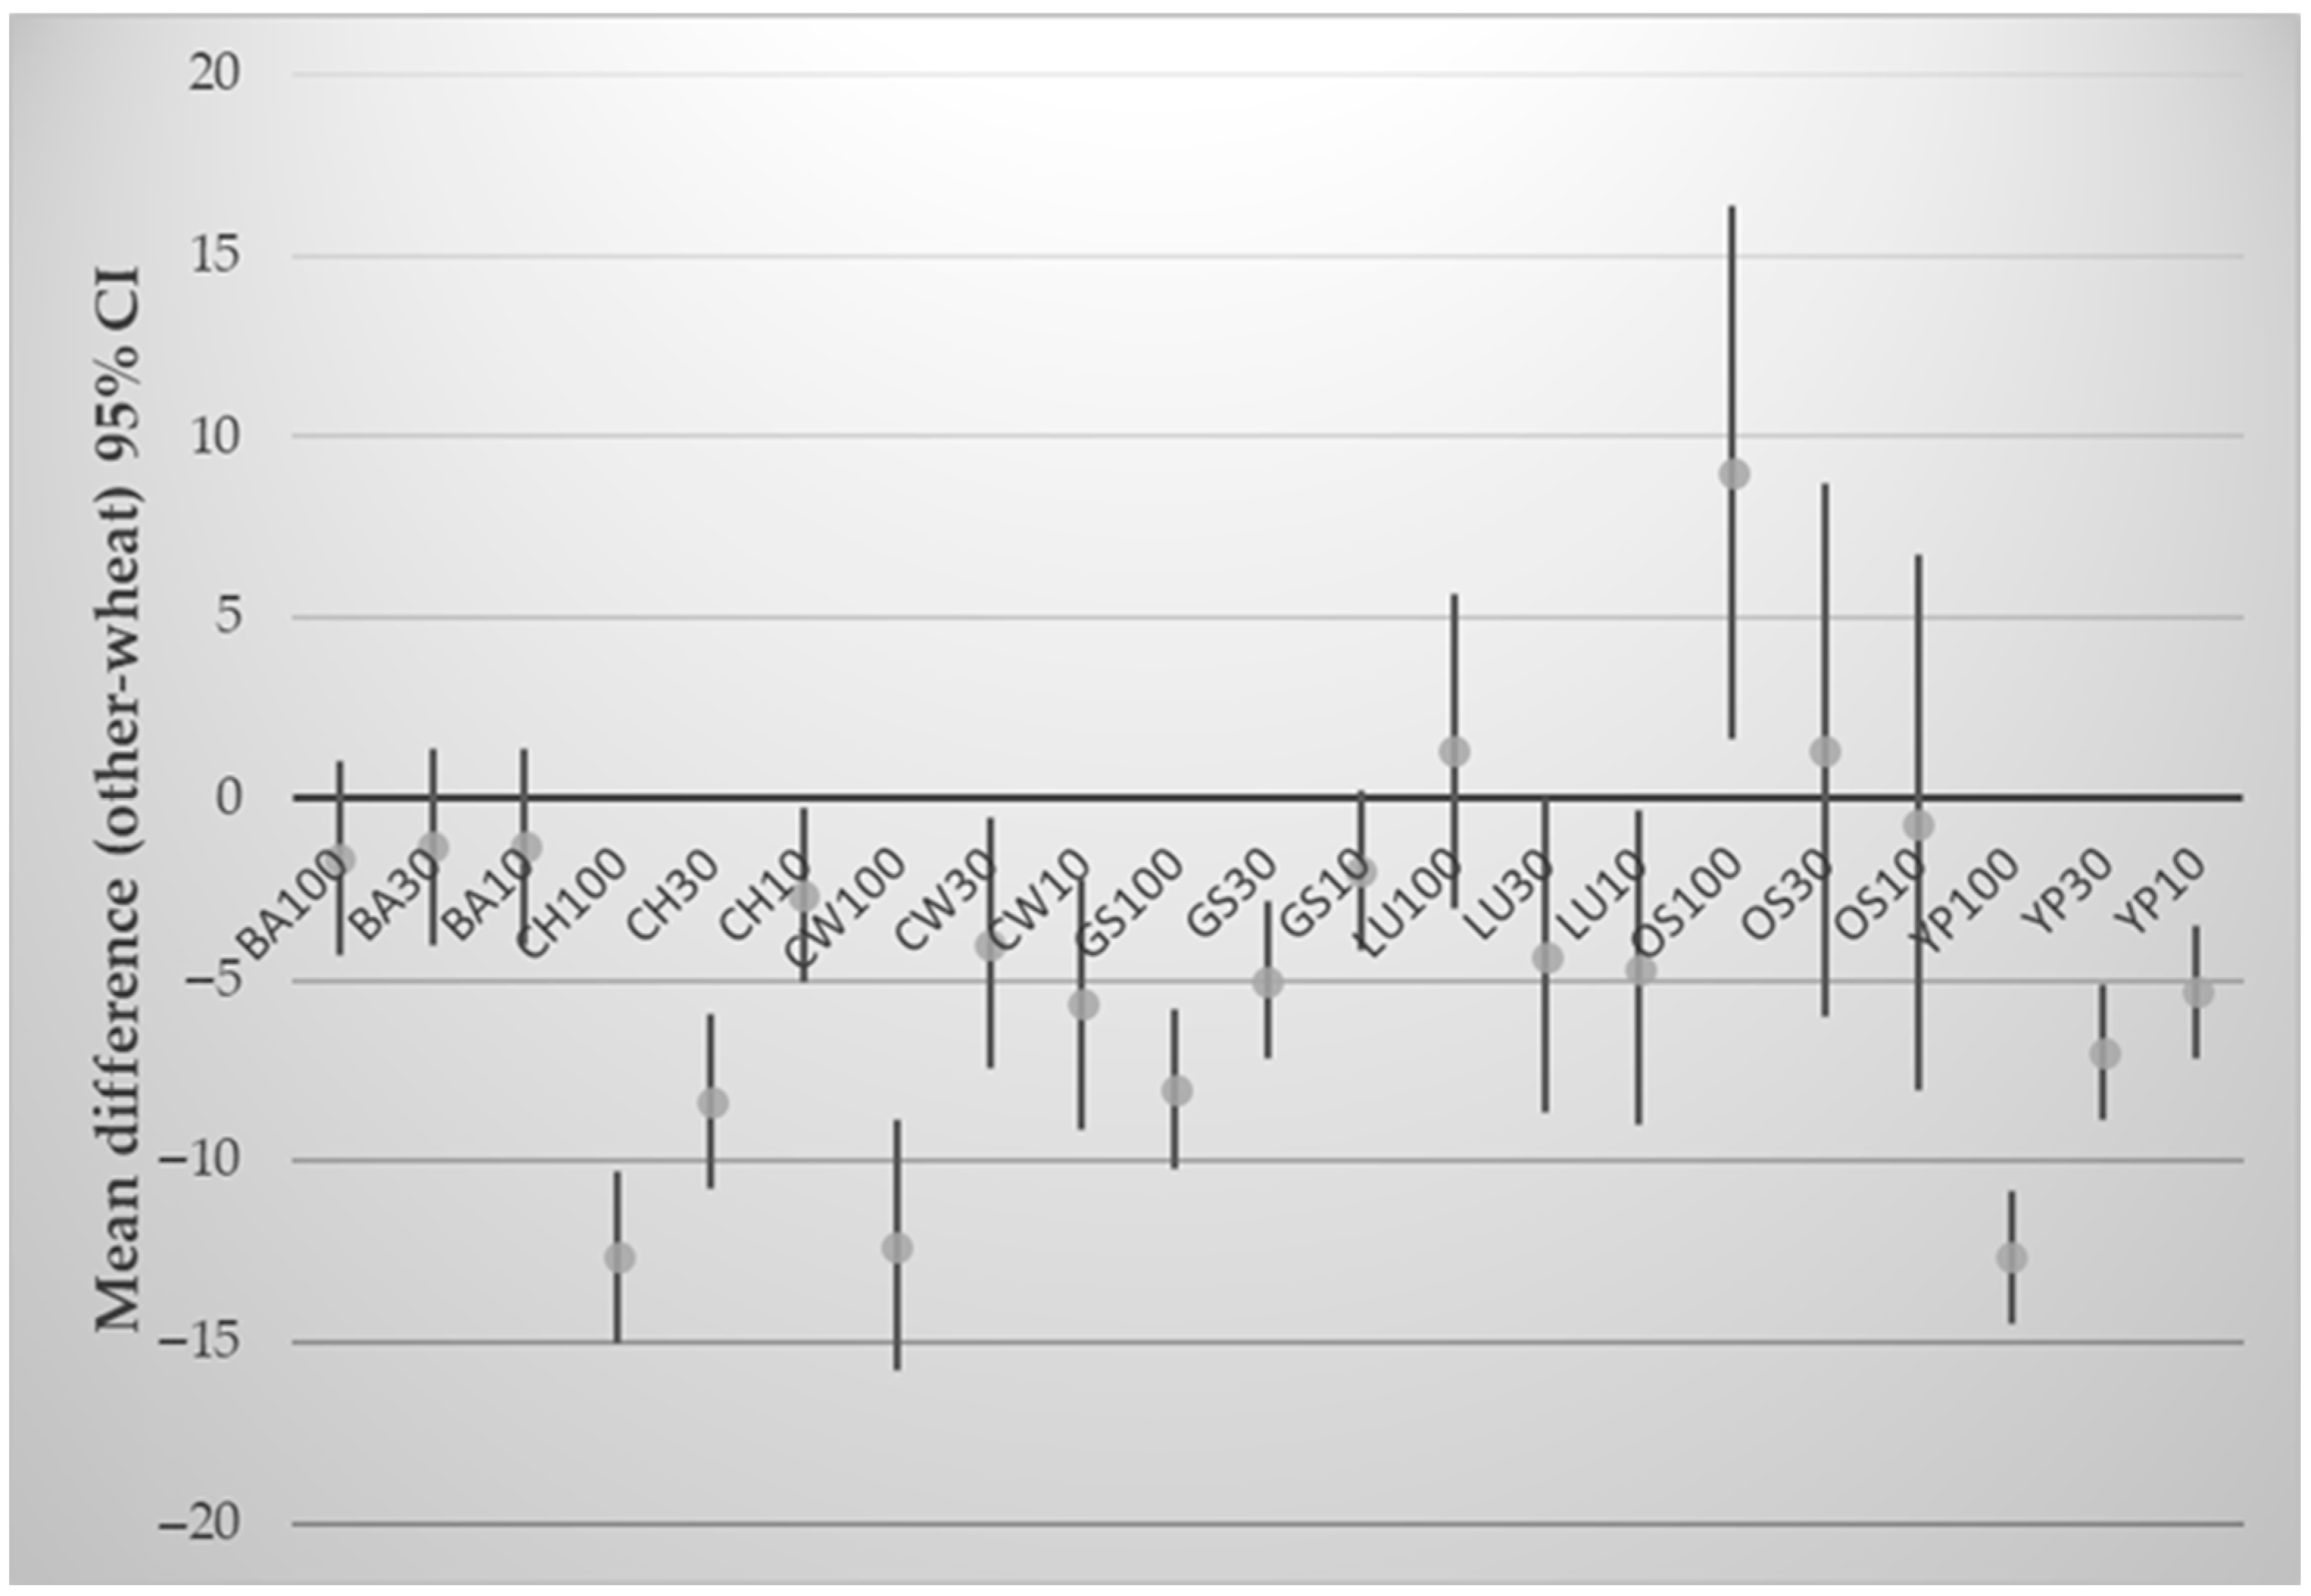
Figure 1. Mean differences in swelling capacity between composite flours and WF. Positive values represent higher SC while negative values represent lower SC of composite flours compared to WF, with results expressed as means, n = 3.
Applsci 15 12361 g001
Figure 2. Mean differences in water absorption capacity between composite flours and WF. Positive values represent higher WAC while negative values represent lower WAC of composite flours compared to WF, with results expressed as means, n = 3.
Applsci 15 12361 g002
Figure 3. Mean differences in dough hardness between composite flours and WF. Positive values represent higher dough hardness while negative values represent lower dough hardness of composite flours compared to WF, with results expressed as means, n = 3.
Applsci 15 12361 g003
Table 1. Effect of composite flour addition at 30% level on the rheological characteristics of wheat flour.
Rheological Characteristics (Farinograph Testing)
SamplesWater Absorption,
WA (%)
Dough Development Time, DDT (min)Stability,
STA (min)
Degree of Softening,
DS (FU)
WF (control)61.92.46.078.0
BA3060.06.212.664.0
CH3057.910.212.0131.0
LU3068.66.25.750.0
OS3061.312.911.063.0
GS3053.221.533.30.0
Table 2. Physicochemical and mechanical properties of crackers made from composite flours.
SamplesawMoisture
(%)
Puffiness
(%)
Bake Loss (%)Spread RatioHardness
(N)
Fracturability (mm)Total Energy (J)
WF0.245 ± 0.024.27 ± 0.0550.00 ± 10.1528.37 ± 1.9023.83 ± 1.8211.65 ± 2.313.02 ± 1.0620.80 ± 4.83
LU100.267 ± 0.004.45 ± 0.1745.00 ± 6.5428.23 ± 0.8024.81 ± 1.2312.31 ± 3.181.44 ± 0.0414.40 ± 3.18
LU300.191 * ± 0.002.94 * ± 0.1328.16 * ± 2.0228.18 ± 1.3527.54 * ± 0.7913.26 ± 2.461.52 ± 0.4517.24 ± 11.78
CH100.224 ± 0.023.25 * ± 0.1743.33 ± 14.6529.50 ± 2.3523.53 ± 2.2113.50 ± 1.031.70 ± 0.1715.46 ± 1.39
CH300.182 * ± 0.022.79 * ± 0.2134.66 ± 5.3930.17 ± 3.6325.63 ± 1.1516.66 ± 5.771.32 * ± 0.3515.59 ± 2.69
GS100.136 * ± 0.002.68 * ± 0.1146.16 ± 8.5229.80 ± 0.4023.75 ± 1.0012.34 ± 0.792.31 ± 0.3214.88 ± 3.35
GS300.136 * ± 0.011.82 * ± 0.0624.33 * ± 3.0629.66 ± 0.9527.70 * ± 0.726.51 * ± 1.941.83 ± 0.508.16 * ± 3.53
OS100.162 * ± 0.002.59 * ± 0.0253.83 ± 11.1429.37 ± 0.3522.65 ± 1.6813.03 ± 1.031.82 ± 0.5714.22 ± 1.74
OS300.131 * ± 0.011.84 * ± 0.1722.00 ± 20.4229.83 ± 0.2829.35 ± 4.479.87 ± 1.502.70 ± 1.3814.03 ± 3.40
CW100.143 * ± 0.012.53 * ± 0.0644.00 ± 16.9327.13 ± 4.3724.49 ± 3.0513.90 ± 3.482.08 ± 0.1015.60 ± 2.64
CW300.135 * ± 0.001.60 * ± 0.0223.00 ± 6.2428.53 ± 2.9128.52 ± 1.4312.63 ± 3.401.96 ± 0.4315.91 ± 3.71
YP100.151 * ± 0.012.81 * ± 0.0341.33 ± 7.1122.13 ± 6.3424.78 ± 1.3814.28 ± 3.581.88 ± 0.2322.92 ± 11.36
YP300.137 * ± 0.001.84 * ± 0.0914.00 * ± 4.9228.91 ± 0.7429.97 * ± 1.068.09 ± 0.732.15 ± 0.3111.61 ± 2.04
BA100.143 * ± 0.012.47 * ± 0.0548.83 ± 9.5725.21 ± 1.3723.22 ± 1.1418.65 * ± 0.672.22 ± 0.6919.33 ± 4.51
BA300.151 * ± 0.012.69 * ± 0.0254.83 ± 0.5826.86 ± 2.5722.49 ± 0.1614.61 ± 2.402.11 ± 0.7821.32 ± 7.31
Results are expressed as mean SD, n = 3. Numbers followed by an asterisk (*) indicate that difference from control is of statistical significance (p < 0.05).
Table 3. Color analysis of crackers.
SamplesL*a*b*C*ΔΕ
WF70.60 ± 1.552.46 ± 1.7828.26 ± 0.9828.43 ± 0.9585.00 ± 3.630.00 ± 0.00
LU1069.66 ± 3.075.63 * ± 0.4633.30 * ± 1.3533.76 * ± 1.4080.36 ± 0.476.68 * ± 0.62
LU3064.76 ± 2.2510.73 * ± 1.0441.03 * ± 0.6542.40 * ± 0.4475.36 * ± 1.5516.50 * ± 0.47
CH1071.20 ± 1.666.10 ± 1.9129.56 ± 2.0630.23 ± 2.3278.50 ± 2.864.37 * ± 2.39
CH3064.46 * ± 1.8912.56 * ± 1.2131.86 ± 1.2634.26 * ± 0.7068.50 * ± 2.6612.54 * ± 1.53
GS1053.53 * ± 1.427.23 * ± 2.6722.03 * ± 0.6023.26 * ± 1.0071.96 * ± 6.3618.93 * ± 0.71
GS3039.06 * ± 0.4011.00 * ± 0.1015.56 * ± 0.4019.10 * ± 0.2654.83 * ± 1.0135.03 * ± 0.44
OS1046.00 * ± 0.265.63 ± 0.3817.50 * ± 0.7918.36 * ± 0.8672.16 * ± 0.6527.02 * ± 0.48
OS3030.83 * ± 2.405.06 ± 1.4710.66 * ± 0.2311.83 * ± 0.5564.83 * ± 6.8643.56 * ± 2.09
CW1062.63 * ± 2.5712.23 * ± 1.2933.10 * ± 0.5335.30 * ± 0.2669.73 * ± 2.2813.66 * ± 2.20
CW3049.23 * ± 2.8317.20 * ± 0.2028.30 ± 2.1733.10 * ± 1.7358.66 * ± 2.0326.08 * ± 2.33
YP1061.20 * ± 1.5412.10 * ± 0.7232.63 * ± 0.4034.83 * ± 0.3269.63 * ± 1.2114.24 * ± 1.41
YP3046.66 * ± 1.2516.80 * ± 0.6225.03 * ± 0.8430.13 * ± 0.3556.20 * ± 1.8228.16 * ± 1.45
BA1066.80 ± 2.268.73 * ± 1.2533.33 * ± 1.2034.53 * ± 1.4675.33 * ± 1.629.15 * ± 1.91
BA3067.86 ± 1.657.36 * ± 1.1831.30 * ± 0.4432.13 * ± 0.7276.76 * ± 1.856.48 * ± 1.81
Results are expressed as means SD, n = 3. Numbers followed by an asterisk (*) indicate that difference from control is of statistical significance (p < 0.05). L*: Lightness; a*: Red/Green value; b*: Blue/Yellow value; C*: chroma; h°: hue; ΔΕ: Total color difference was measured in comparison to WF (those with a ΔΕ > 3 exhibit a color difference from WF which is visible to the eye).
Disclaimer/Publisher’s Note: The statements, opinions and data contained in all publications are solely those of the individual author(s) and contributor(s) and not of MDPI and/or the editor(s). MDPI and/or the editor(s) disclaim responsibility for any injury to people or property resulting from any ideas, methods, instructions or products referred to in the content.