Abstract
To address the challenges that rolling bearing vibration signals are easily affected by noise and that traditional single-channel methods cannot fully exploit multi-channel information, this paper proposes a multi-channel fault diagnosis method combining Whale Optimization Algorithm-assisted Variational Mode Decomposition (WOA-VMD) with Tucker tensor decomposition. In this method, multi-channel vibration signals are first adaptively decomposed using WOA-VMD, with optimized decomposition parameters to effectively extract weak fault features. The resulting intrinsic mode functions (IMFs) are then structured into a third-order tensor to preserve inter-channel correlations. Tucker decomposition is subsequently applied to extract robust feature vectors from the tensor factor matrices, achieving dimensionality reduction, redundancy suppression, and enhanced noise mitigation. Finally, statistical features such as standard deviation, kurtosis, and waveform factor are computed from the denoised signals and fed into a Support Vector Machine (SVM) classifier for precise fault identification. Experimental results show that the proposed method outperforms traditional approaches in extracting weak fault features, effectively leveraging correlations among multi-channel signals to extract meaningful features from noise-corrupted signals, and achieving efficient and reliable fault diagnosis.
1. Introduction
Rolling bearings are indispensable core components in rotating machinery, and their operating conditions directly affect machine safety, stability, and production efficiency. Once a bearing fails, it may impair equipment performance at best or, in severe cases, cause machine shutdown or even safety accidents. Therefore, timely fault detection is of great significance for ensuring equipment safety and reducing maintenance costs [1,2,3].
In recent years, with the rapid advancement of intelligent manufacturing and Industrial Internet of Things technologies, intelligent fault diagnosis based on vibration signal analysis [4,5,6] has become a major research focus. This approach is widely adopted due to its accessibility and its ability to reflect the dynamic characteristics of mechanical structures. However, in real-world operating environments, vibration signals are typically non-stationary and easily contaminated by background noise. Especially during the early stages of failure, fault features are weak and often submerged in environmental interference, making accurate recognition extremely challenging.
To enhance the identifiability of fault features, a variety of techniques have been proposed, such as Wavelet Transform (WT) [7], Empirical Mode Decomposition [8], envelope analysis [9], and manifold learning [10]. Wu et al. [11] proposed a joint adaptive signal decomposition method combining Variational Mode Decomposition (VMD) and ACMD, optimized using integration kurtosis, to effectively extract and identify incipient faults in electromechanical systems. Huang et al. [12] proposed a time-varying targeted enhancement method to suppress noise and enhance weak stress wave features for precise bearing fault diagnosis. Although these approaches improve single-channel feature extraction, they still suffer from limited inter-channel coordination and insufficient exploitation of multi-source information.
Multi-channel signals, by contrast, can collect information from multiple directions and positions, offering stronger representation capability. For instance, Liao et al. [13] proposed a multi-source signal fusion method for AC motor fault diagnosis based on SDP and AlexNet, achieving 99.16% accuracy and outperforming single-signal approaches. Hsieh et al. [14] proposed a GSA-optimized multi-sensor fusion method, combining WPD, Empirical Mode Decomposition (EMD), and SVM for harmonic drive fault diagnosis, effectively reducing overfitting and improving diagnostic accuracy. Although these methods have made notable progress in multi-channel feature extraction and collaborative processing, they still suffer from challenges such as incomplete feature representation and fluctuating diagnostic accuracy.
High-order tensors [15], as natural representations of multidimensional data structures, are capable of preserving the intrinsic correlations and structural characteristics among data dimensions. With the advancement of multilinear algebra and its widespread application in data analysis, tensor decomposition has been extensively applied in multi-channel or multi-sensor signal processing, showing significant advantages in feature extraction and information fusion. However, understanding how to effectively organize multi-channel signals into appropriate tensor forms remains an open problem.
Therefore, this study proposes a hybrid approach that combines VMD and Tucker tensor decomposition for multi-channel fault feature extraction, as both methods exhibit strong capabilities in processing non-stationary and multidimensional vibration signals. Specifically, VMD decomposes complex vibration signals into a series of Intrinsic Mode Functions (IMFs) with distinct frequency characteristics, while Tucker decomposition provides an effective multilinear framework for capturing inter-channel correlations and achieving dimensionality reduction [16,17]. To further enhance the adaptability and precision of signal decomposition, the Whale Optimization Algorithm (WOA) [18] is employed to optimize key VMD parameters, including the mode number and penalty factor. WOA simulates the cooperative foraging behavior of humpback whales, where elite individuals guide the population toward the global optimum through spiral updating and encircling mechanisms. This metaheuristic strategy enables fast global convergence and avoids premature stagnation in local optima, while its adaptive parameter adjustment effectively balances global exploration and local exploitation. This paper presents the following contributions: (1) A multi-channel fault diagnosis framework is proposed, integrating Variational Mode Decomposition (VMD) and Tucker tensor decomposition, which fully exploits cross-channel information to enhance fault feature representation. (2) The WOA is introduced to adaptively optimize key VMD parameters (mode number and penalty factor), improving decomposition accuracy and noise robustness. (3) A tensor-based feature extraction approach is employed using Tucker decomposition, enabling effective dimensionality reduction and extraction of discriminative features. (4) A support vector machine (SVM) classifier is constructed based on statistical features, achieving accurate identification of different bearing fault types in both simulated and real-world datasets.
2. Methods
2.1. Principle of Variational Mode Decomposition and Adaptability Analysis for Tensor Construction
VMD is an adaptive signal decomposition technique capable of decomposing a signal into a set of IMFs with finite bandwidth, each concentrated around a specific center frequency. Compared to EMD, VMD introduces a variational framework that minimizes the bandwidth of each mode through an iterative optimization process, enabling effective mode separation. This property makes VMD particularly suitable for extracting critical fault-related components from bearing vibration signals that are often contaminated by background noise. Therefore, VMD is adopted in this study to perform mode decomposition on the raw vibration signals.
The VMD model can be formulated as follows:
where
- denotes the partial derivative with respect to time t;
- is the dirac dalta function;
- is the k-th mode component;
- is its center frequency, and j is the imaginary unit.
By introducing a quadratic penalty term α and Lagrangin multiplier , Equation (1) can be converted into an unconstrained variational problem, as shown in Equation (2):
This optimization problem can be solved using the Alternating Direction Method of Multipliers (ADMM), in which the modal components
and center frequencies and the lagrange multiplier are alternately updated. The update rules are given in Equations (3)–(5):
where
- is a step-size parameter controlling convergence;
The iteration stops when the convergence condition in Equation (6) is satisfied:
where
- is the pre-set convergence tolerance.
By decomposing a one-dimensional vibration signal into multiple intrinsic mode functions (IMFs), VMD enables the expansion of the signal along a modal dimension, facilitating the construction of a higher-order tensor [19]. Owing to its variational optimization framework, VMD yields decomposition results that are consistent and robust, with each mode possessing a clear frequency interpretation and energy concentration. This enhances the effectiveness of subsequent tensor decomposition for both denoising and fault diagnosis.
However, as evident from Equations (3)–(5), the performance of VMD heavily depends on the selection of its parameters: the number of modes K and the penalty factor α. If K and α are set too low, multiple frequency components may be mixed into a single mode, thereby reducing the feature discriminability after tensor decomposition. Conversely, excessively high values for K and α can lead to tensor dimensional explosion, increased redundancy, reduced decomposition efficiency, and poorer denoising results. Therefore, determining the optimal parameter combination (K, α) is essential for achieving high-quality decomposition.
2.2. Adaptive Parameter Optimization Strategy for VMD Based on Whale Optimization Algorithm (WOA)
The WOA is a heuristic optimization technique inspired by the social behavior and hunting strategies of humpback whales. By simulating whales’ migration and cooperative foraging mechanisms, WOA demonstrates strong global search capabilities and fast convergence, which effectively prevents the optimization process from getting trapped in local optima. In this study, WOA is introduced to improve the decomposition quality of VMD and enhance the independence among intrinsic mode functions (IMFs). Specifically, WOA is used to search for the optimal parameter set Φ = (K, α), i.e., the number of decomposition modes and the penalty factor, using the reconstruction error as the fitness function. This helps avoid issues such as mode mixing, feature loss, and inefficiency caused by suboptimal values of K and α.
In WOA, the search process of the whale population Φ is divided into two main phases: exploitation and exploration. The exploitation phase includes shrinking encircling and spiral bubble-net attacking mechanisms. In each iteration, the algorithm decides the phase based on a random number p ∈ [0, 1].
When |A| < 1, p ≥ 0.5, the population adopts the shrinking encircling mechanism, and the position is updated as:
where
- b is the spiral constant;
- l ∈ [−1, 1] is a random number.
- D is the distance between the simulation and the target.
When |A| < 1, p < 0.5, the population adopts the shrinking encircling mechanism, and the position is updated as
When |A| ≥ 1, the algorithm enters the exploration phase, aiming to search globally away from the best current solution and enhance its ability to escape local optima. The position is updated as
where
- represents the current position of the whale;
- denotes the current global best position;
- refers to a randomly selected whale from the population.
The vector parameters A and C are defined to control the search direction and step size as follows:
where
- and are random numbers uniformly distributed in [0, 1];
- is a linearly decreasing factor over the iterations.
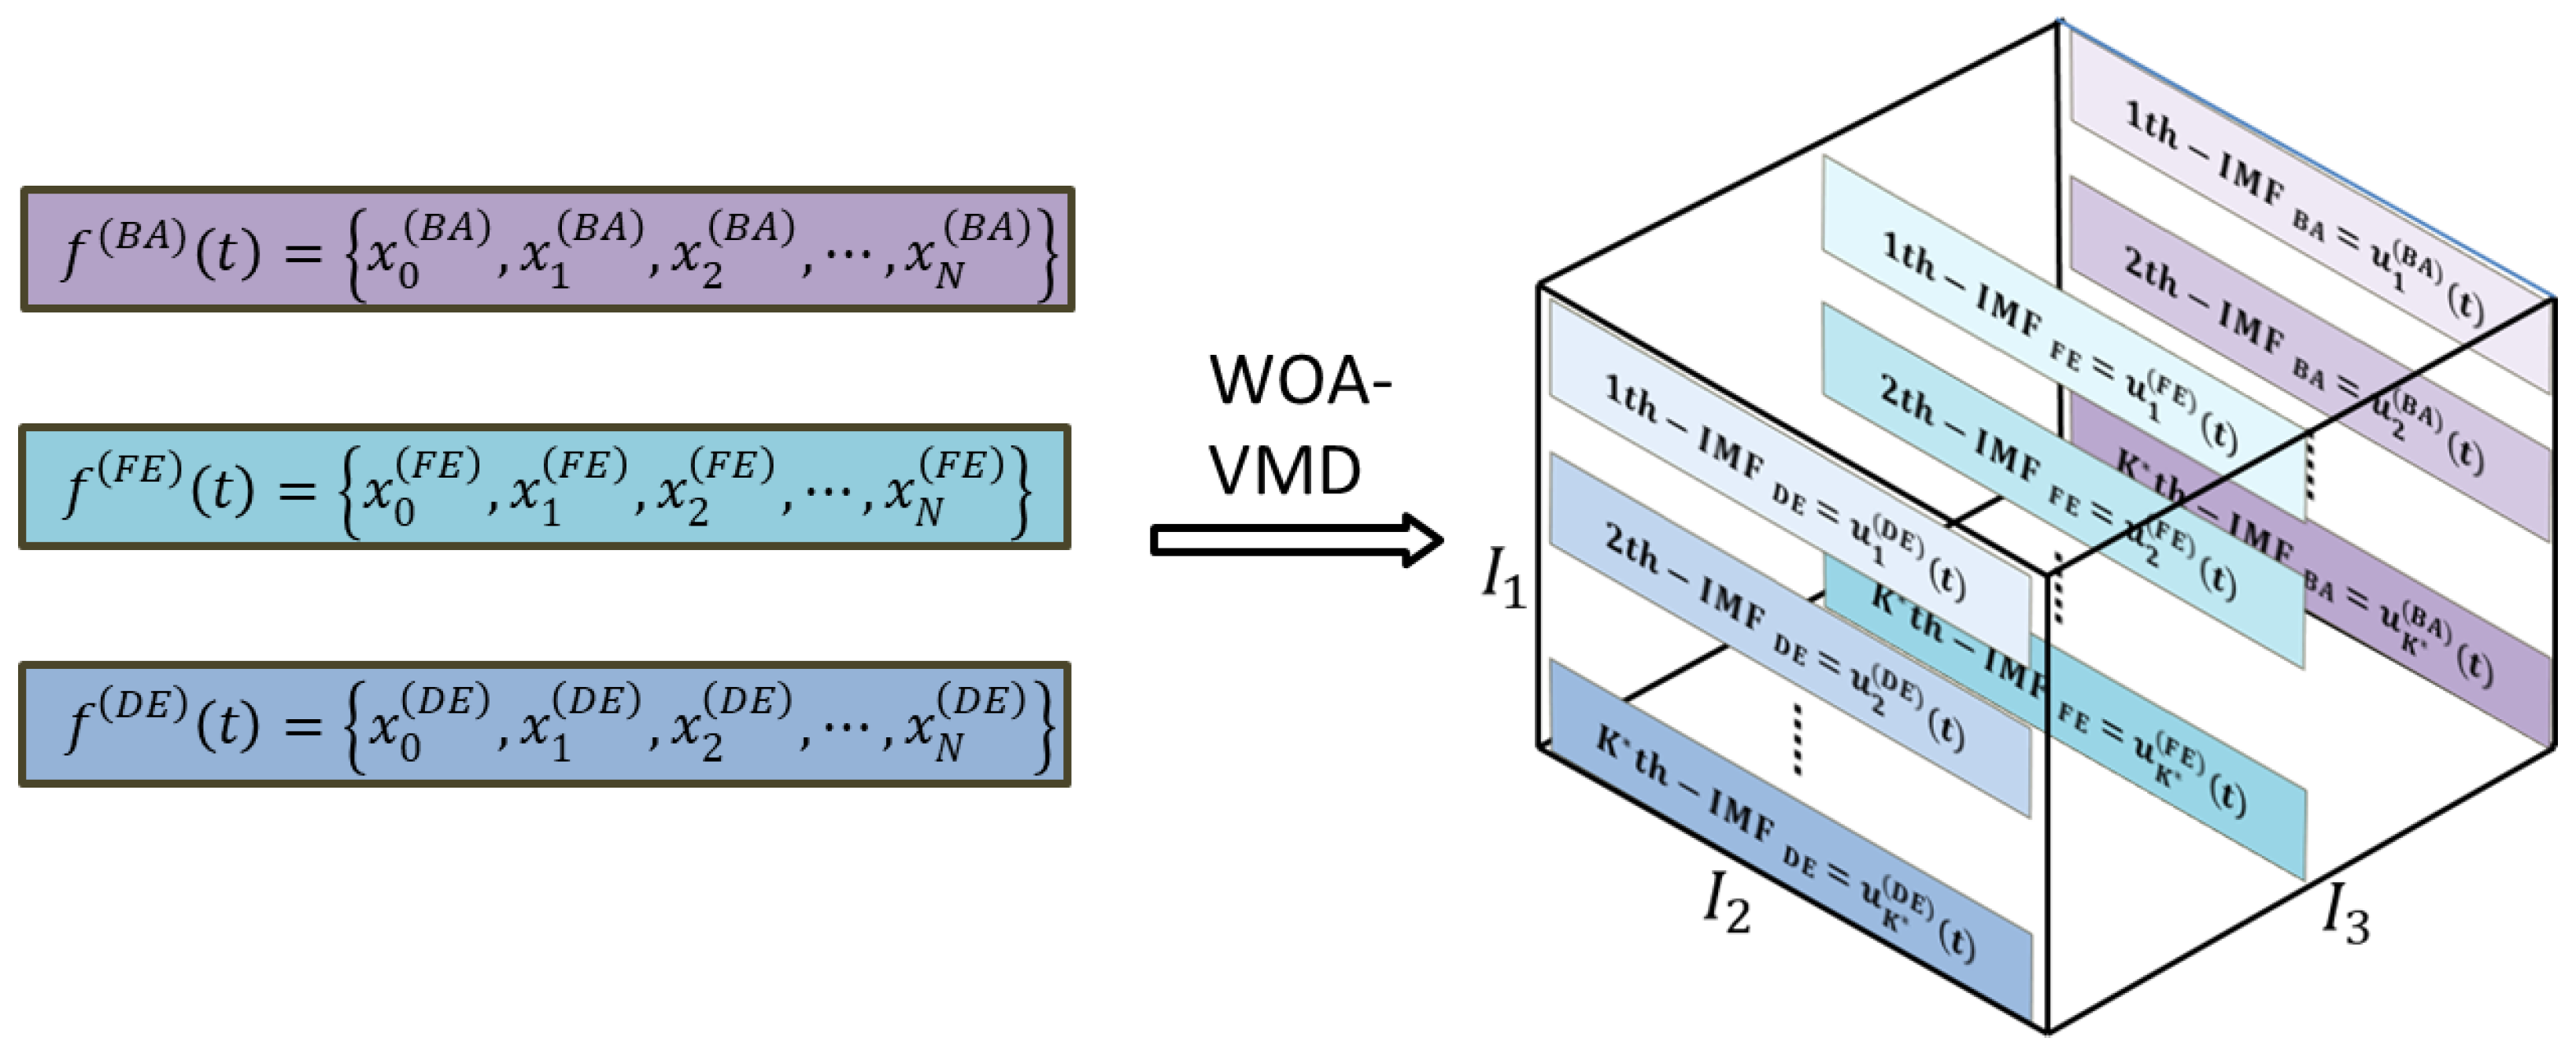
After multiple iterations, the algorithm converges to an optimal decomposition parameter set. Once the optimal VMD parameters for each channel signal are obtained, the VMD results are stacked along the channel dimension to construct a third-order tensor , as shown in Figure 1, where is the number of VMD modes K, denotes the length of the time series, and is the number of channels.
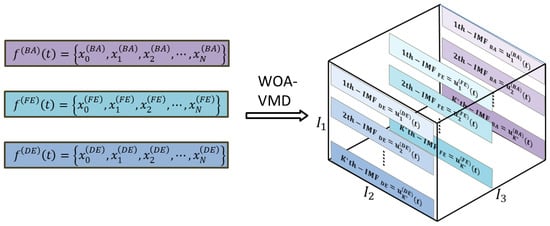
Figure 1.
Tensor construction process.
2.3. Tensor Dimensionality Reduction and Feature Extraction Based on Tucker Decomposition
Although the constructed tensor effectively integrates multi-channel information, its high dimensionality makes it unsuitable for direct input into classification models. Moreover, the embedded fault features are often difficult to distinguish. Therefore, dimensionality reduction is necessary. Tucker decomposition offers a solution by decomposing a high-order tensor into a core tensor and several factor matrices, where the factor matrices reveal latent information along each mode of the tensor [20].
To enhance the discriminability of fault features, the tensor , constructed from VMD results, is treated as the input sample. Tucker decomposition is then applied to extract column vectors from the factor matrices as denoised feature representations of different bearing fault types. The decomposition can be expressed as follows:
where
- denotes the mode-n product between a tensor and a matrix;
- is the core tensor;
- , , and are the factor matrices along the mode (modal), time, and channel dimensions, respectively.
To determine the optimal core tensor and factor matrices, the Alternating Least Squares (ALS) algorithm is employed to minimize the reconstruction error. The objective function is formulated as
where
- is core tensor;
- , , and are and factor matrices
The following update rules are iteratively applied:
Update :
Update :
Update :
Update the core tensor :
After t iterations, convergence is evaluated by computing the maximum relative change in the factor matrices between successive iterations:
If δ is below a predefined threshold, the iteration process terminates, and the optimal factor matrices and core tensor are obtained.
When a bearing fault occurs, impulsive components are enhanced, leading to increased standard deviation, kurtosis, and deviations in waveform factor. The frequency spectrum also reveals distinct changes caused by the fault. Therefore, in this study, column vectors in the factor matrix that represent fault-related features are analyzed in two ways: (1) their spectra are plotted to observe fault characteristics in the frequency domain, and (2) three statistical indicators—standard deviation σ, kurtosis K, and waveform factor S are computed to quantify the dynamics of the signal for fault classification:
Standard deviation:
Kurtosis:
Waveform factor:
where
- denotes the i-the sample;
- μ is the sample mean;
- N is the length of the signal.
2.4. Construction of Fault Classification Model Based on SVM
To achieve accurate identification of bearing faults, the extracted features are fed into a classification model for modeling and inference. Support Vector Machine (SVM), as an effective supervised learning method [21], has strong generalization ability and performs well under small-sample conditions. Its goal is to find the optimal separating hyperplane that maximizes the margin between different classes. The basic optimization objective of SVM is formulated as follows:
where
- is the slack variable to allow misclassification;
- C is the regularization parameter (penalty factor) that controls the trade-off between maximizing the margin and minimizing the classification error.
To handle nonlinear classification tasks, a nonlinear mapping function φ(x) is employed to project the input features into a high-dimensional feature space. Then, the Lagrangian function is constructed for optimization:
where
- α is the Lagrange multiplier.
According to the Karush–Kuhn–Tucker (KKT) optimality conditions, redundant variables are eliminated to obtain the final decision function of the SVM model:
where
- is the input vector;
- is the corresponding label;
- is the kernel function used to compute the inner product in the high-dimensional feature space.
In this study, the Gaussian Radial Basis Function (RBF) kernel is adopted, which is defined as
where
- is the kernel width parameter that controls the smoothness of the decision boundary.
2.5. Diagnostic Process
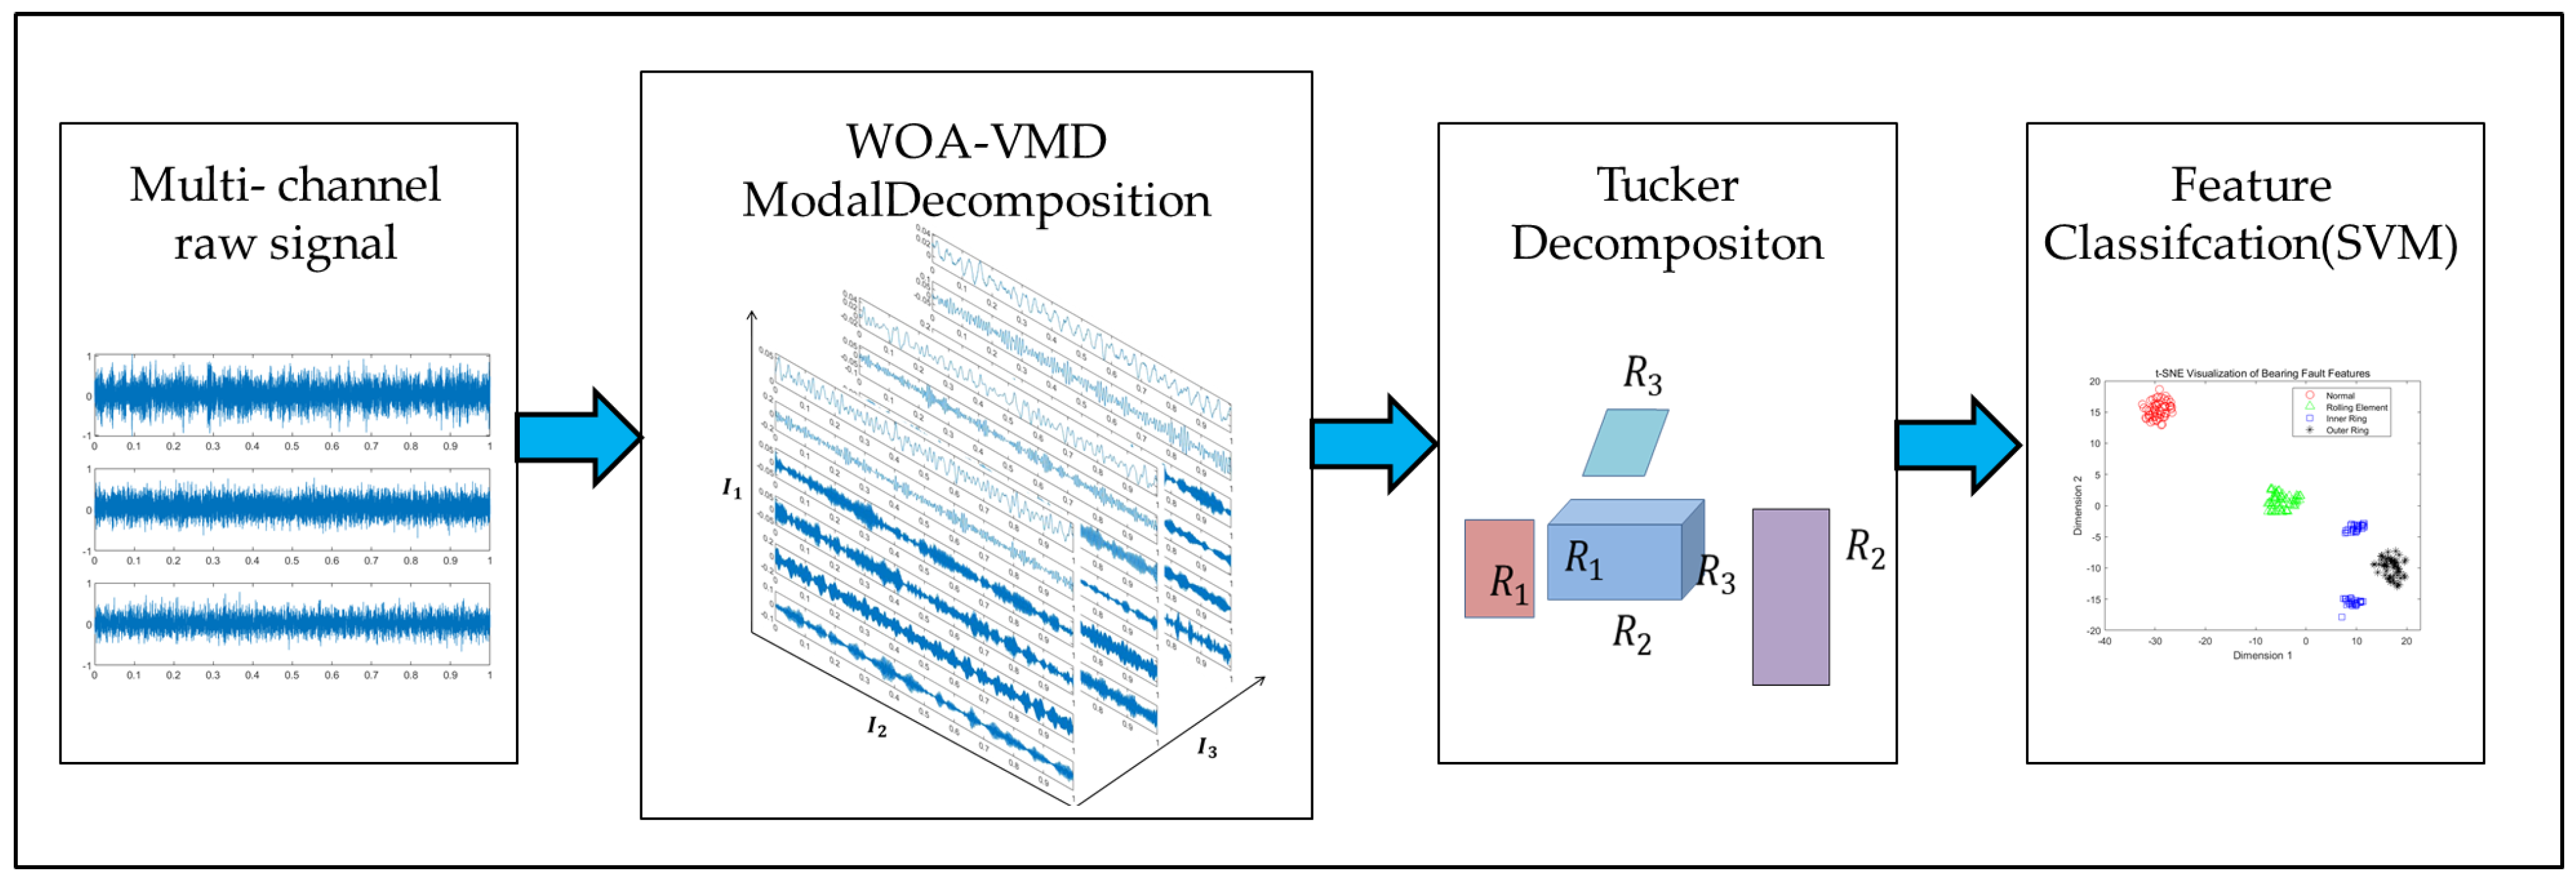
In this study, five bearing conditions were established, including normal, inner race fault, outer race fault, rolling element fault, and compound fault. The proposed method integrates VMD and Tucker decomposition to extract fault features from multi-channel vibration signals. The multi-channel IMFs obtained through VMD are used to construct a high-order tensor, which preserves both spatial and temporal information. Tucker decomposition is then applied to extract compact and discriminative features from the constructed tensor. To enhance the accuracy and adaptability of signal decomposition, the WOA is introduced to optimize the key VMD parameters, including the mode number and penalty factor. Finally, statistical features such as kurtosis, standard deviation, and waveform factor are calculated from the factor matrices and fed into a Support Vector Machine (SVM) classifier to achieve accurate identification of different bearing fault types (Figure 2).
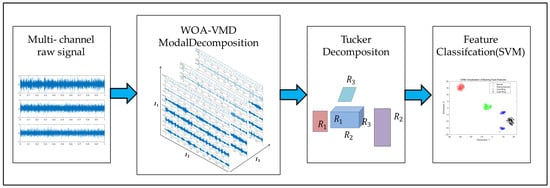
Figure 2.
Flowchart of Multi-channel Bearing Fault Diagnosis Based on WOA-VMD-Tucker.
Based on the above theory, this paper proposes a fault diagnosis method combining WOA-VMD, Tucker tensor decomposition, and SVM. The process is as follows:
- (1)
- The signals were decomposed using WOA-VMD, with key parameters adaptively optimized via the WOA.
- (2)
- The IMFs from all channels were stacked along the channel dimension to construct a third-order tensor (mode × time × channel), preserving both temporal and spatial information.
- (3)
- Tucker decomposition was applied to the constructed tensor to extract compact and discriminative features, from which statistical indicators, including standard deviation, kurtosis, and waveform factor, were calculated.
- (4)
- The extracted features were divided into training and testing sets and input into SVM classifier for model training and fault diagnosis, enabling accurate identification of different bearing fault types.
3. Experimental Analysis
3.1. Denoising Performance Verification Based on Simulated Signals
To verify the denoising performance of the proposed WOA-VMD-Tucker method, a simulated signal composed of randomly superimposed exponentially decaying sinusoidal pulses is constructed. The simulated noisy rolling bearing fault signal is defined as
where
- P is the number of impact pulses;
- is the amplitude of the i-th pulse;
- is the occurrence time of the i-th pulse;
- is the attenuation coefficient that controls the decay rate of each impact;
- is the resonance frequency;
- represents Gaussian white noise added to mask the impulsive features and simulate various levels of signal-to-noise ratio (SNR) across channels.
In the experiment, the sampling frequency is set to 10 kHz and the sampling duration is 1 s, resulting in a signal length of 10,000
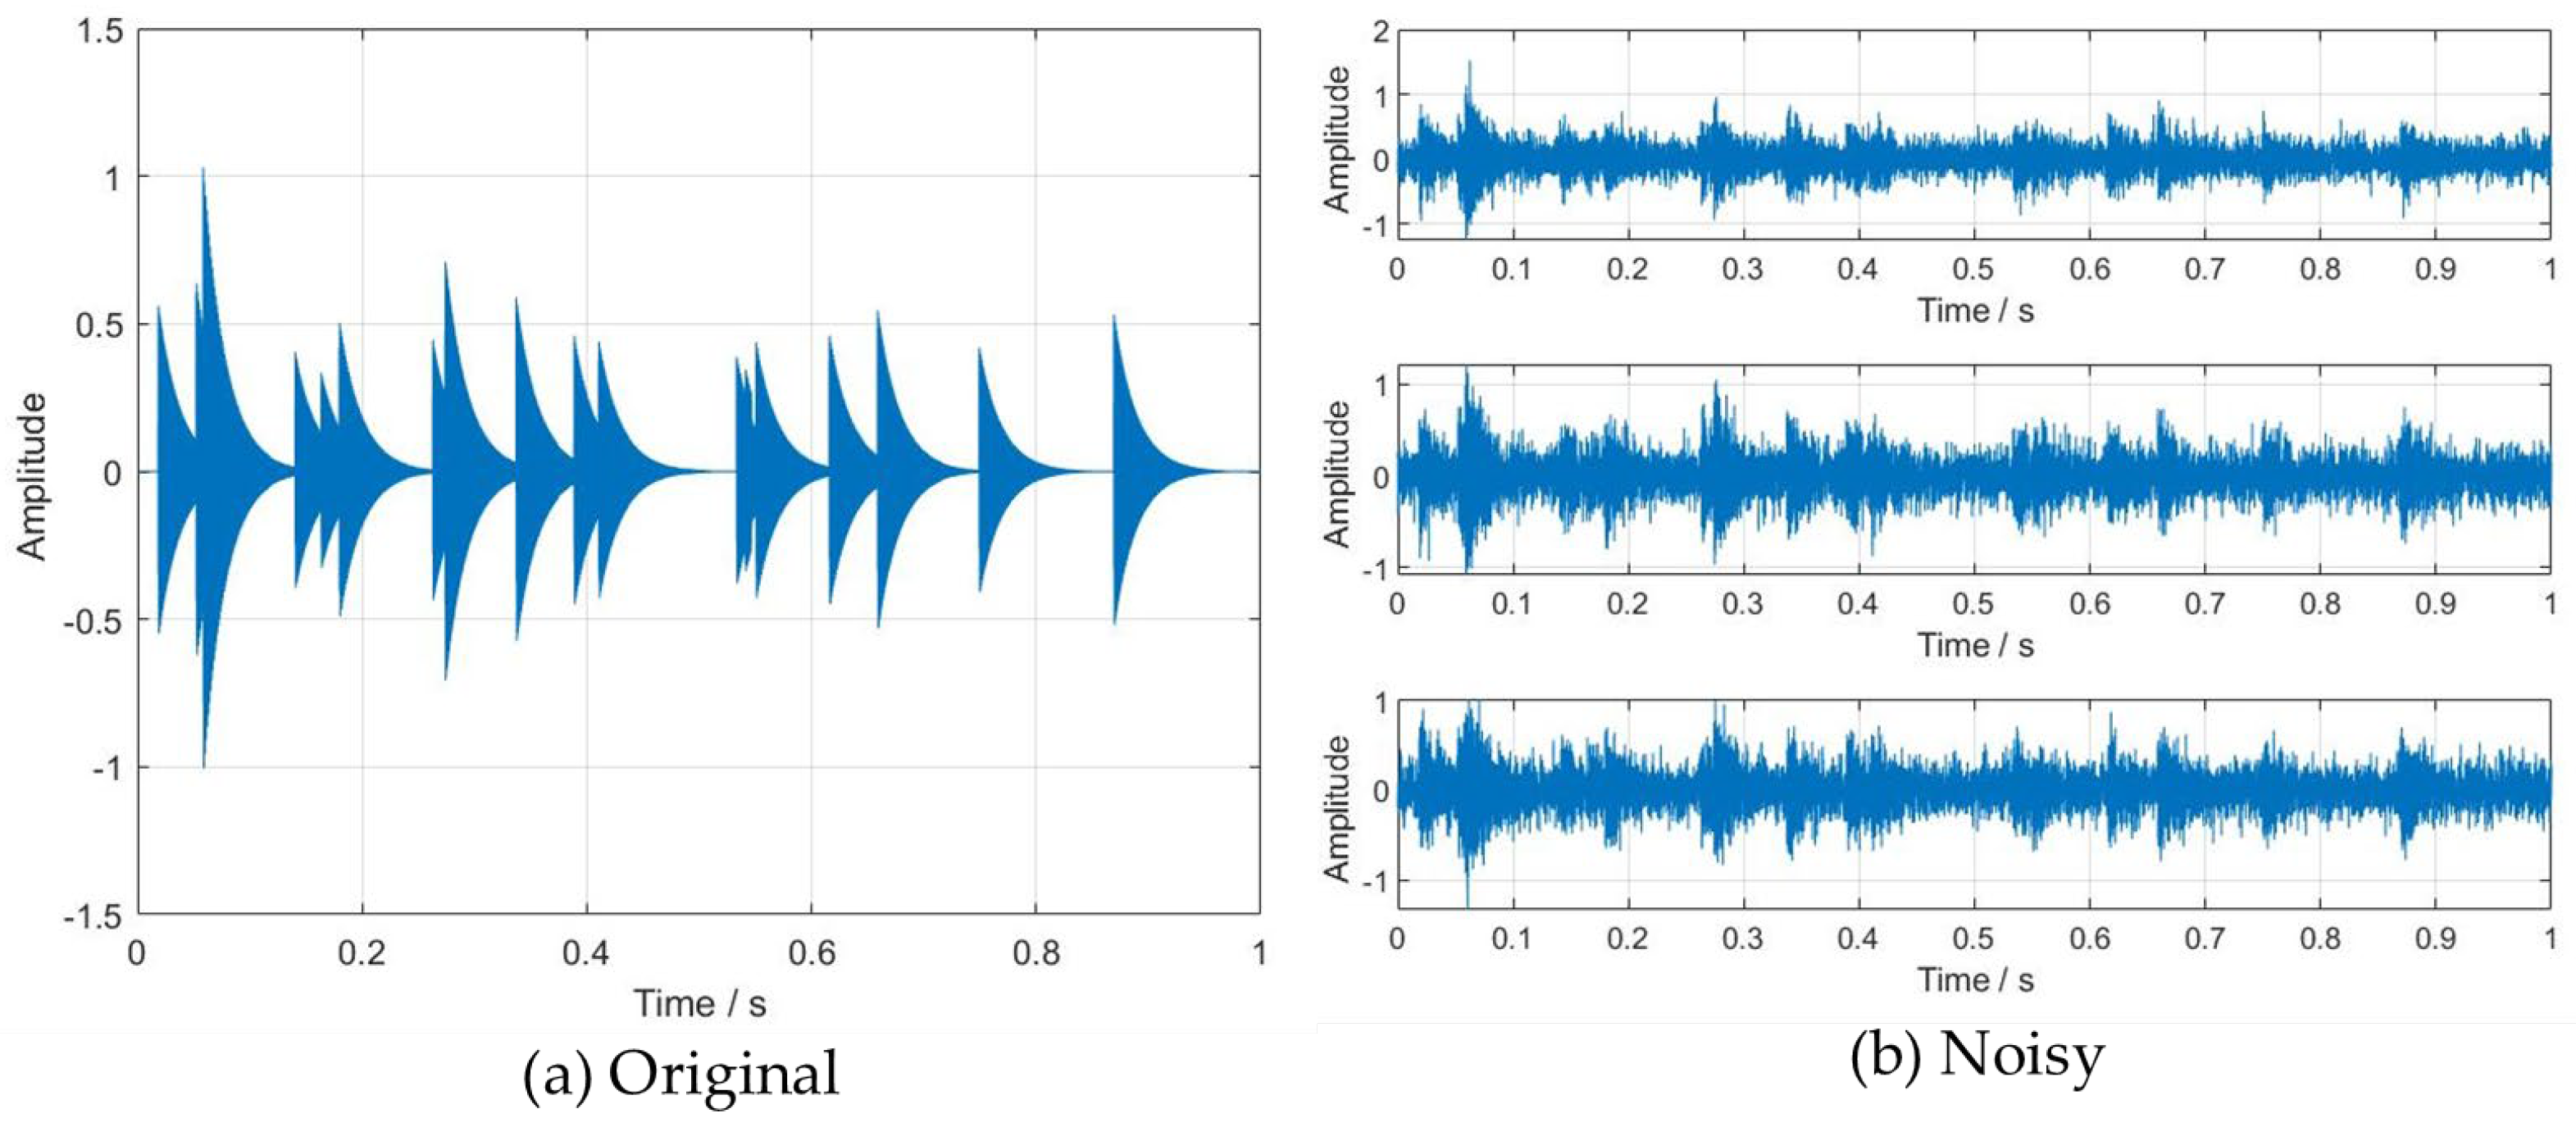
points. To simulate a multi-channel scenario, Gaussian white noise with three different SNR levels is added to the simulated signals, representing three channels. Figure 3 illustrates the time-domain waveforms of the simulated multi-channel rolling bearing fault signal before and after noise contamination.
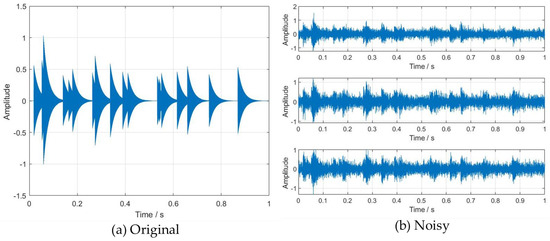
Figure 3.
(a) Original signals without noise; (b) signals after noise addition with signal-to-noise ratios (SNR) of −10 dB, −8 dB, and −5 dB from top to bottom.
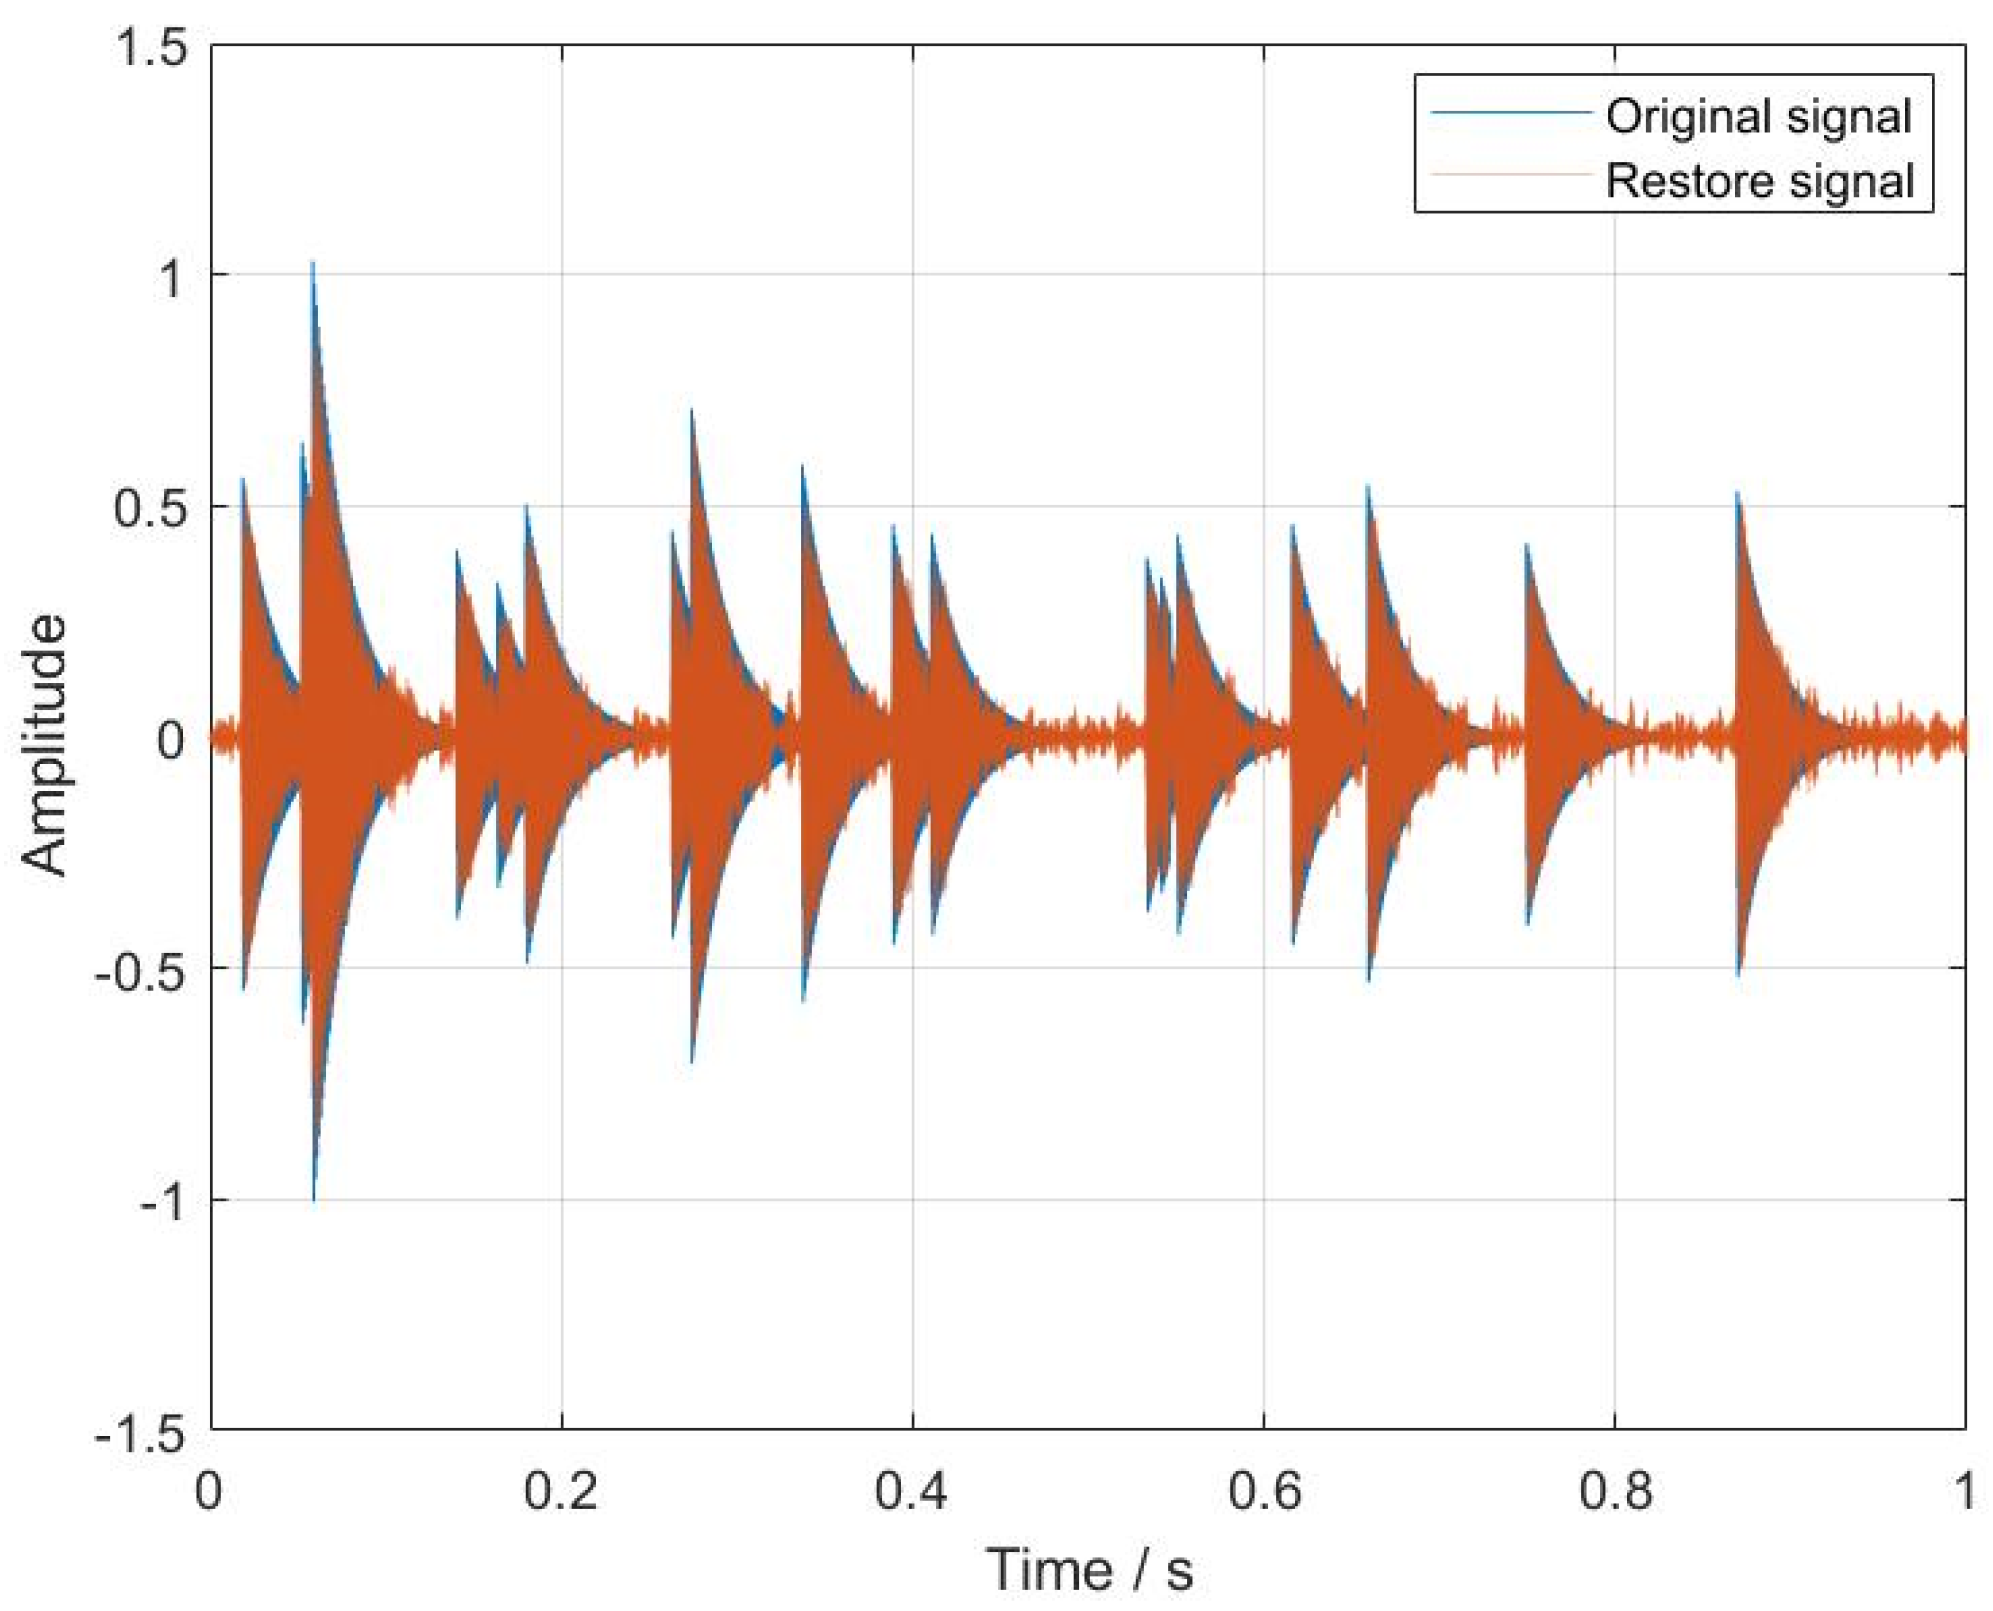
During the WOA optimization of the VMD parameters, the whale population size is set to 20, and the maximum number of iterations is 20. The decomposition level K is constrained within the range [5, 10], and the penalty factor is searched within [200, 5000]. The parameters optimized for each channel are then used to construct the third-order tensor , which is subsequently subjected to Tucker decomposition. The denoised waveform is shown in Figure 4.
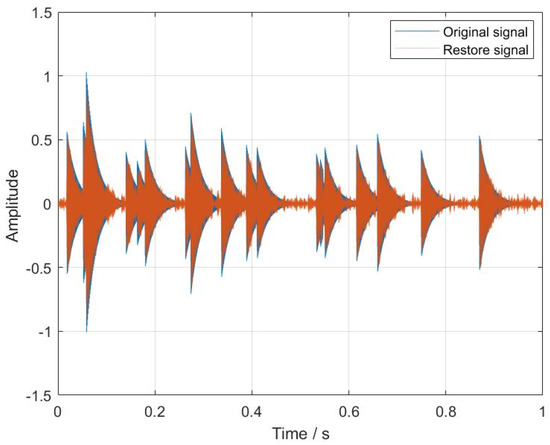
Figure 4.
Comparison between the original and restored signals after denoising.
As shown in Figure 4, the waveform originally immersed in noise becomes much clearer after denoising, with significantly reduced noise interference. Compared with the original signal, the denoised signal retains the main features of the original waveform, such as periodic variations and fault-related components, while effectively suppressing noise. These results indicate that the proposed WOA-VMD-Tucker method can efficiently integrate multi-channel information, achieving both noise reduction and feature preservation.
To further validate the effectiveness of the Whale Optimization Algorithm (WOA) in the proposed method, four alternative VMD-based tensor construction approaches—VMD, AO-VMD, GA-VMD, and ALO-VMD—were selected for comparison. In the experiments, different fault types were simulated by generating signals with P = [10, 15] impact pulses, where the pulse amplitudes randomly varied between 0.8 and 1.2, and the damping coefficients λ were randomly distributed between 600 and 1000, producing samples with varying decay characteristics and energy distributions. To simulate multi-channel signals, different levels of Gaussian white noise were added to the same signal across channels, reflecting realistic inter-channel variations in measurement conditions.
To validate the effectiveness of WOA in the proposed framework, four alternative VMD-based tensor construction approaches—VMD, AO-VMD, GA-VMD, and ALO-VMD—were compared. The denoising performance of each method was assessed by measuring the Signal-to-Noise Ratio (SNR) of the fault features extracted after Tucker decomposition. As shown in Table 1, WOA-VMD achieves the highest SNR, indicating superior noise suppression capability, which is calculated based on the standard power definition as follows:
where
- Psignal and Pnoise represent the average power of the clean signal and noise, respectively.

Table 1.
Signal-to-Noise Ratio (SNR) of Extracted Fault Signals (SNR= −10 dB, −5 dB, 0 bB).
Table 1.
Signal-to-Noise Ratio (SNR) of Extracted Fault Signals (SNR= −10 dB, −5 dB, 0 bB).
| Method | SNR (dB) |
|---|---|
| VMD | 7.02 |
| GA-VMD | 9.14 |
| AO-VMD | 9.19 |
| ALO-VMD | 10.17 |
| WOA-VMD | 13.35 |
In addition, the diagnostic performance of each method was evaluated using Accuracy (ACC), Precision (PC), Recall (RC), and F1-score. Table 2 presents the results under different SNR conditions. With the incorporation of optimization strategies (GA-VMD, AO-VMD, ALO-VMD, and WOA-VMD), all metrics show notable improvement. Specifically, WOA-VMD achieves ACC values of 98.4% and 98.9% under SNRs of (−10, −5, 0) dB and (−10, −8, −5) dB, respectively, while PC, RC, and F1 remain high, demonstrating excellent classification accuracy and robustness.

Table 2.
Diagnostic Performance of VMD Variants under Different SNRs.
Furthermore, to verify the diagnostic capability of the proposed method for different fault categories, Table 3 presents the classification results of inner race, outer race, and ball faults under various noise levels. The results show that WOA-VMD maintains high accuracy across all fault types, indicating strong adaptability and generalization to noisy environments.

Table 3.
Classification Performance of Different Fault Types under Varying SNR Conditions.
These results confirm that WOA-VMD can consistently extract fault features from noisy multi-channel signals, enabling efficient and reliable rolling bearing fault diagnosis.
3.2. Fault Diagnosis Verification Based on Real Multi-Channel Signals
3.2.1. Dataset Description
To validate the effectiveness of the proposed WOA-VMD-Tucker method for extracting fault features from real multi-channel rolling bearing signals, experiments were conducted using the Case Western Reserve University (CWRU) bearing dataset. The experiments employed SKF6205 bearings, with bearing parameters listed in Table 4. Vibration signals were collected from three channels, Drive End (DE), Fan End (FE), and Base (BA), at a rotational speed of 1797 rpm and a sampling frequency of 12 kHz. Vibration data were selected from the dataset under four different bearing conditions: Normal, Ball Fault, Inner Race Fault, and Outer Race Fault. For each condition, 60 samples were selected, with each sample containing 10,000 data points. The experimental setting environment is as follows: Intel(R) Core(TM) i7-8550U CPU @ 1.80GHz 2.00 GHz, and the running environment is Matlab R2020b.

Table 4.
Bearing Parameters.
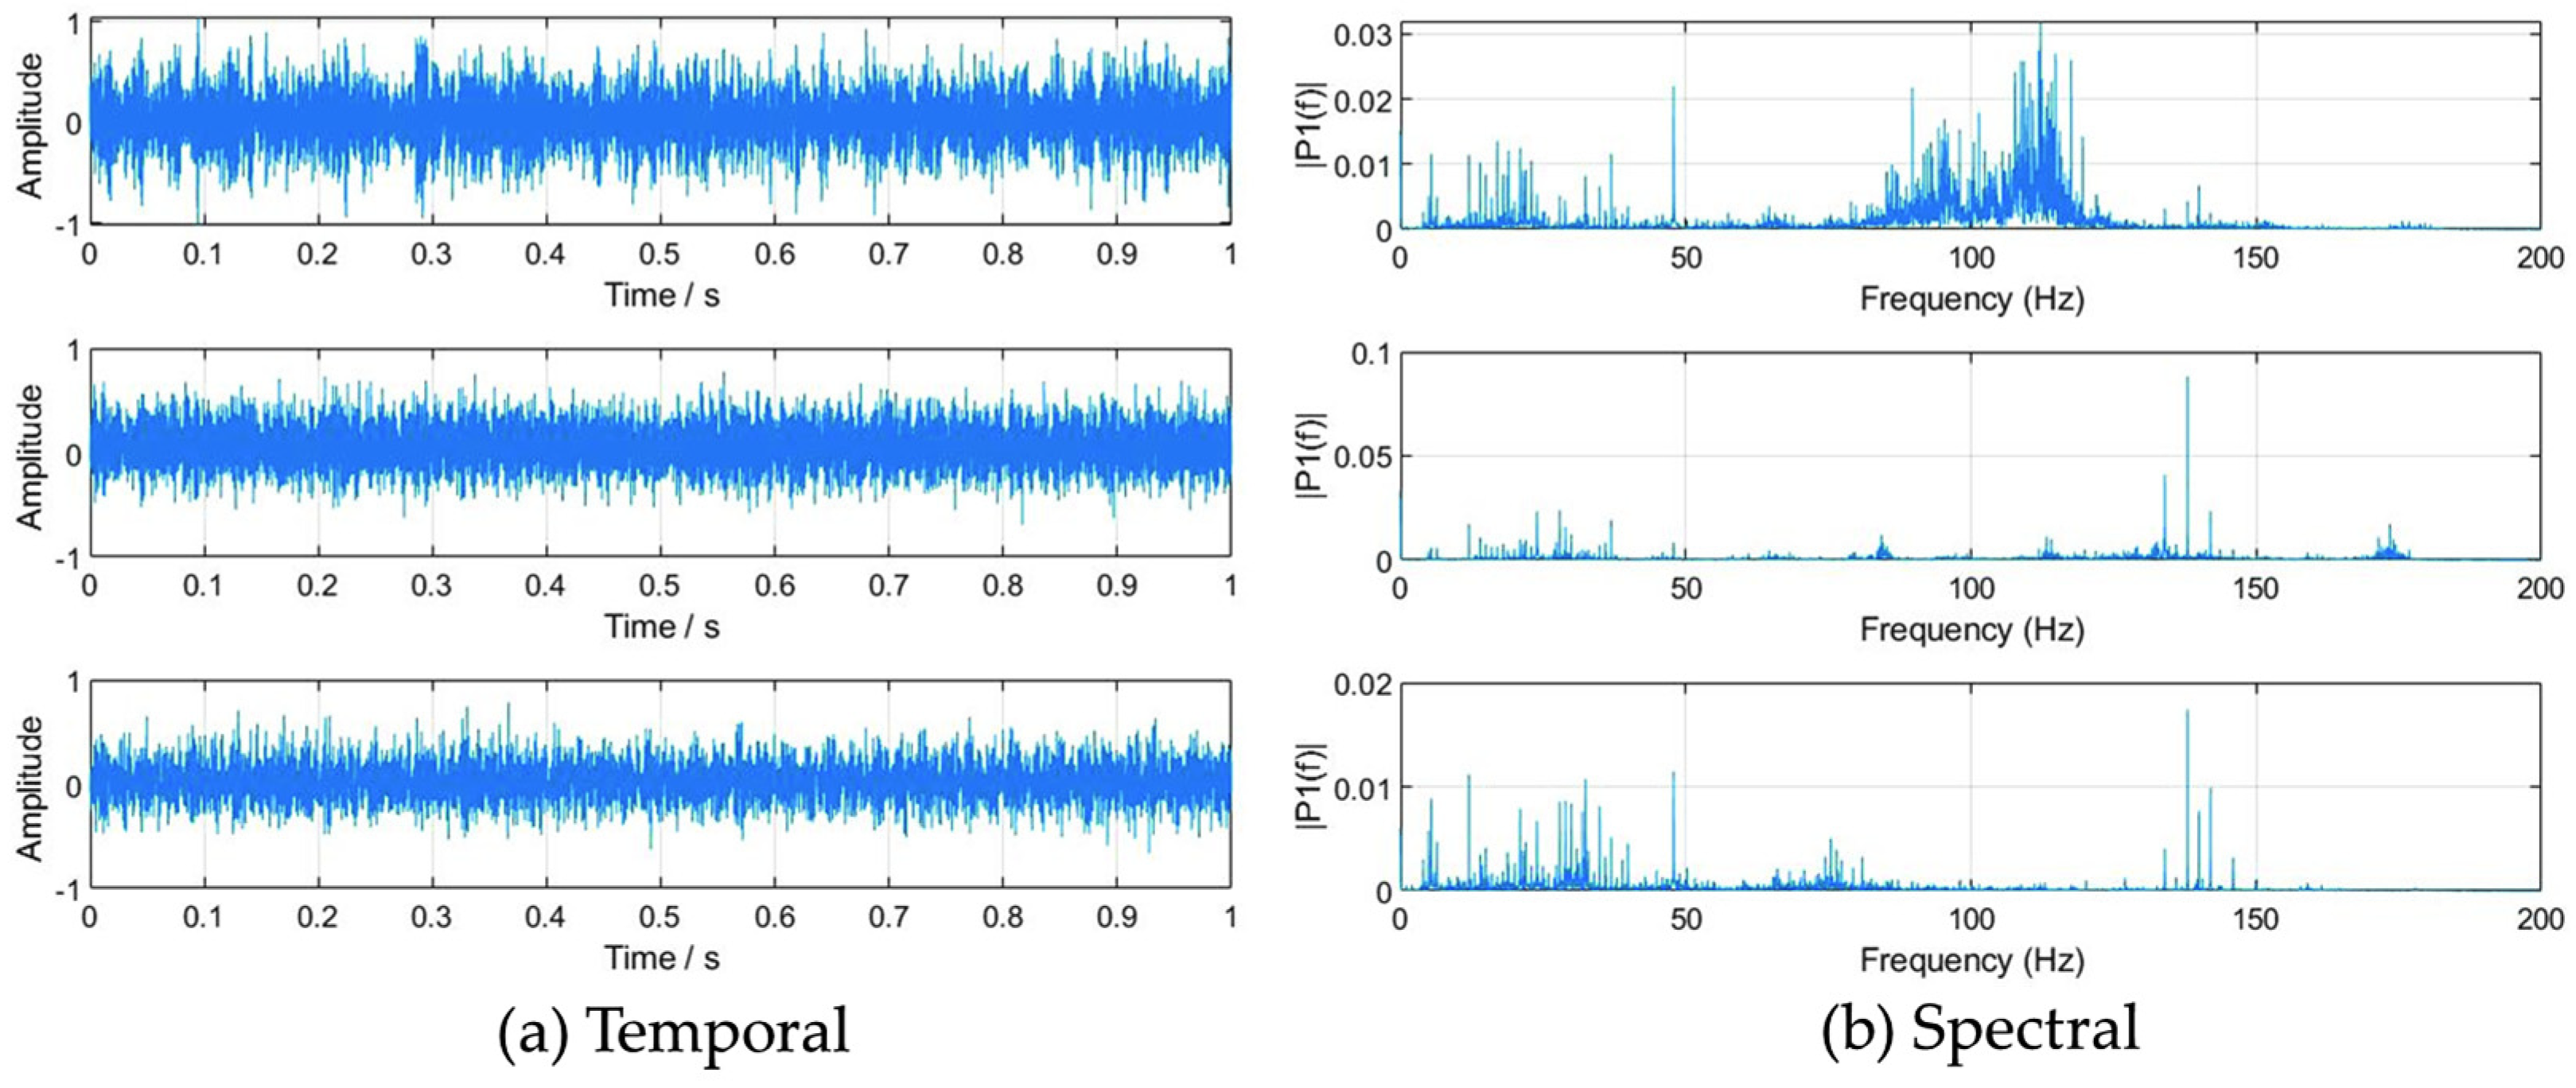
Taking the ball fault signal as an example, Figure 5a,b show the time-domain waveform and frequency spectrum, respectively. As seen in Figure 5a, the waveform does not present obvious fault-related features. In the frequency spectrum shown in Figure 5b, the fault-related frequency components vary significantly across channels due to the influence of background noise and signal transmission paths. In particular, the first channel lacks clearly identifiable fault frequencies.
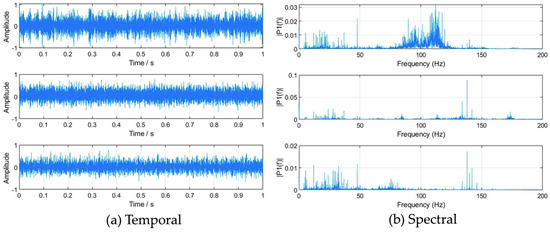
Figure 5.
Rolling element fault signal: (a) time-domain waveform; (b) corresponding frequency spectrum.
3.2.2. Effectiveness of the WOA-VMD Method in Fault Signal Denoising
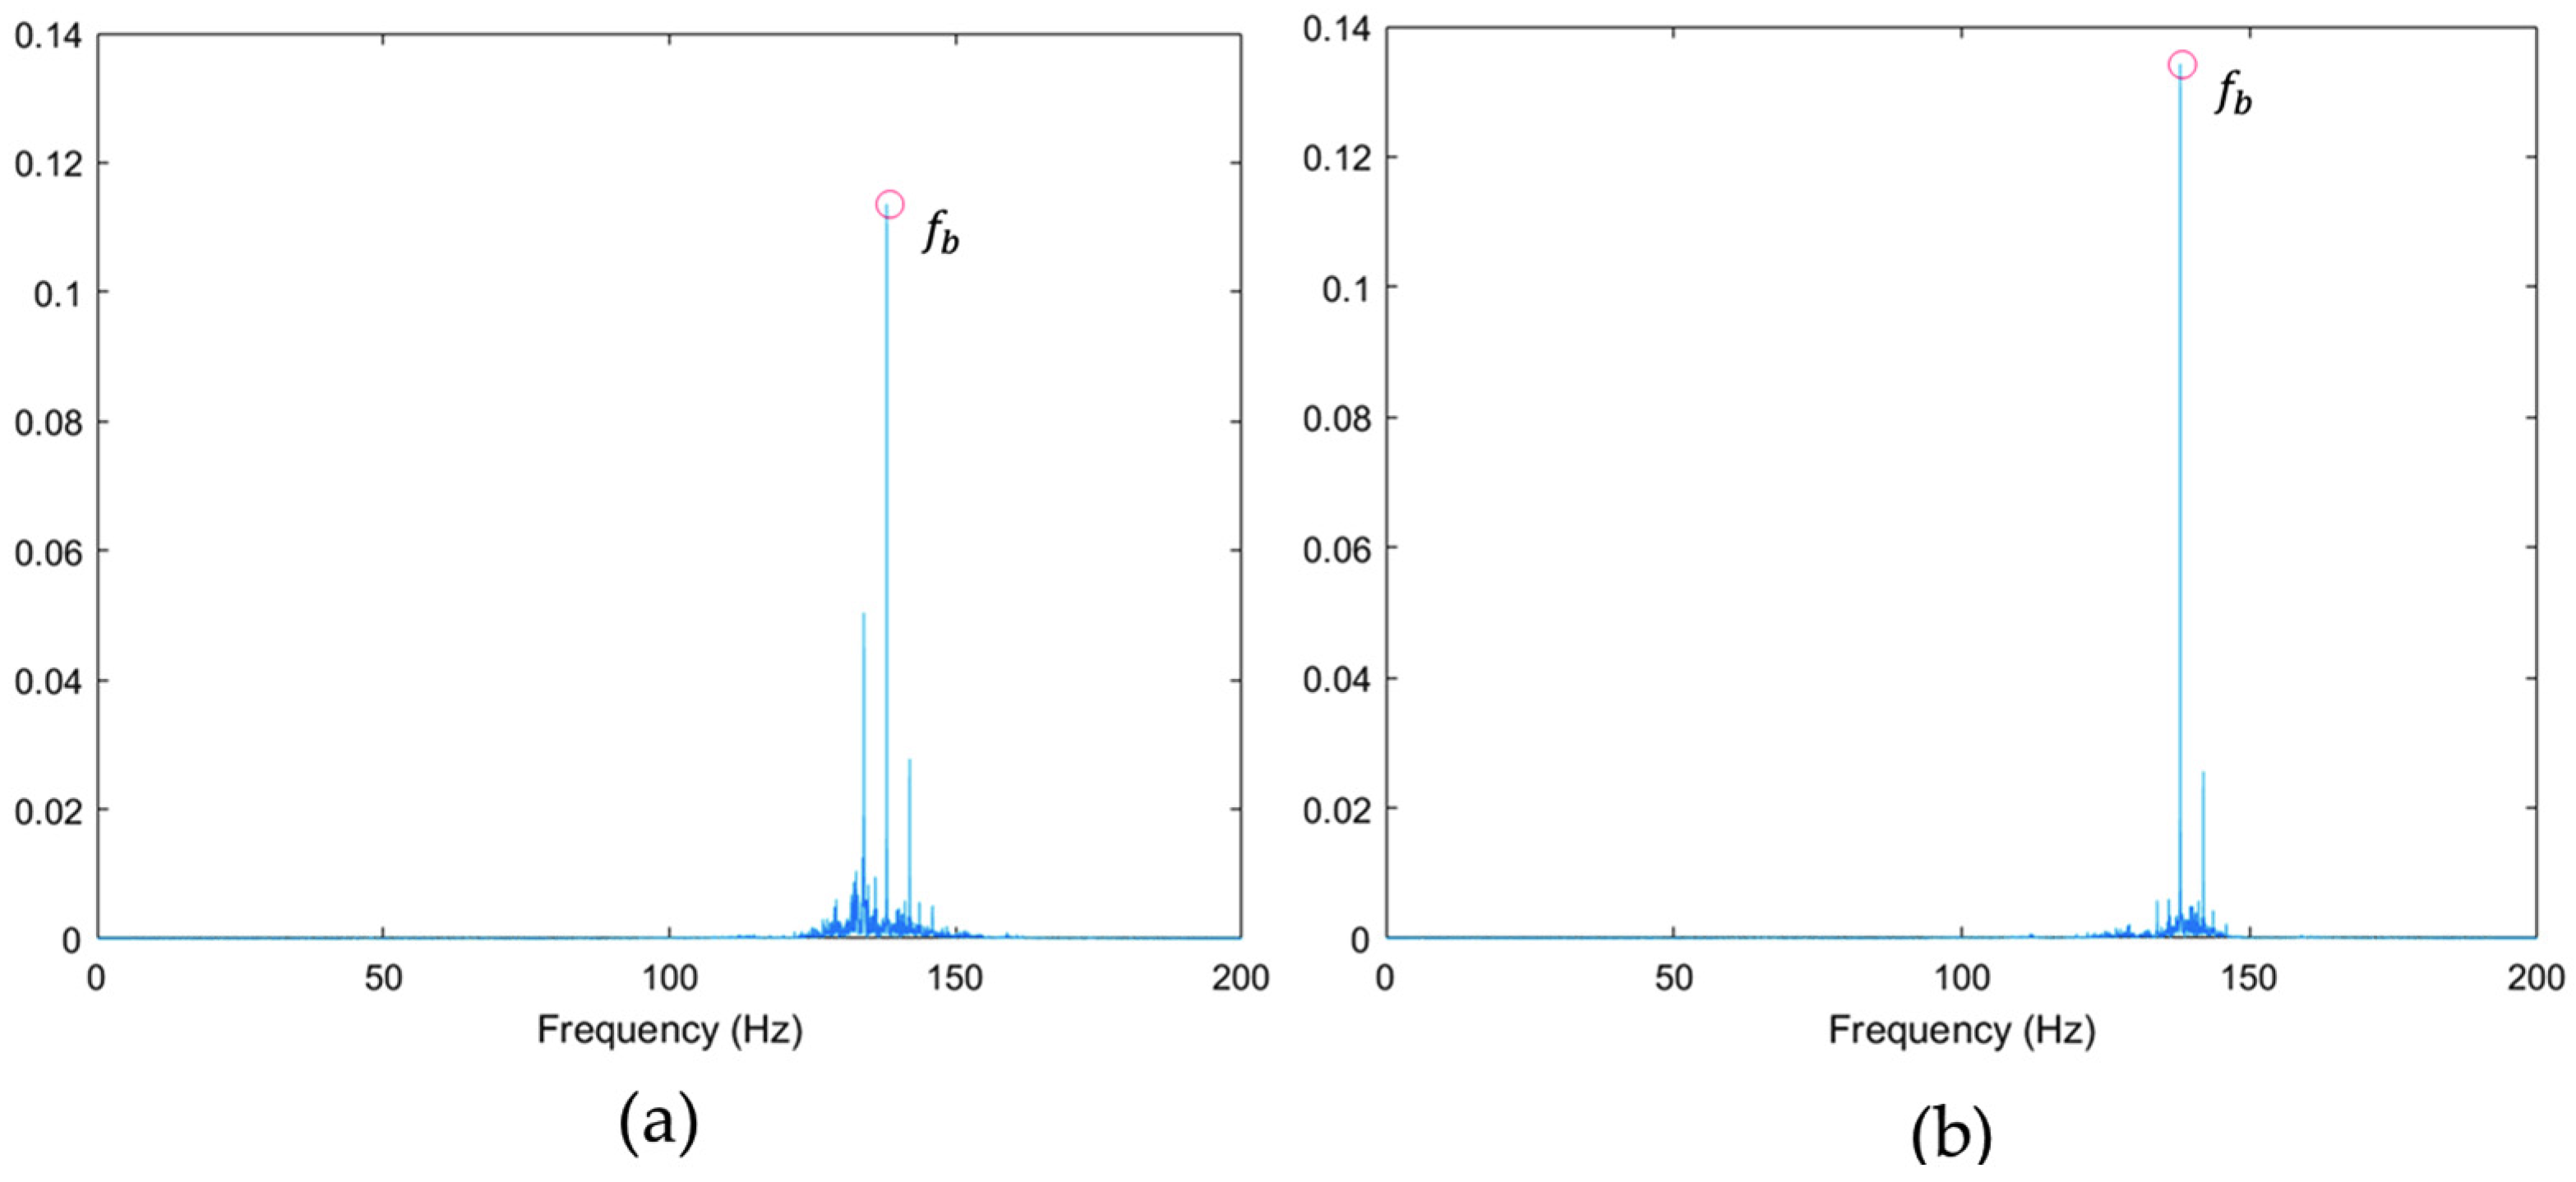
To evaluate the denoising performance of the proposed method using WOA-VMD, tensor construction was performed on ball fault signals using both VMD and WOA-VMD approaches. For the WOA-VMD algorithm, the search ranges for the parameters (K, α) were set to [5, 15] and [10, 5000], the whale population size was set to 20, and the maximum number of iterations was set to 20. In contrast, the parameters for the standard VMD were empirically set to K = 6, α = 1600. Subsequently, Tucker decomposition was applied to the constructed tensors, with the tensor rank set to 3. The resulting denoised frequency spectra are shown in Figure 6a,b. As observed, both methods effectively utilized multi-channel information to enhance the ball fault frequency components of the rolling bearing, while significantly suppressing environmental noise and interference peaks. However, a difference in performance is evident.
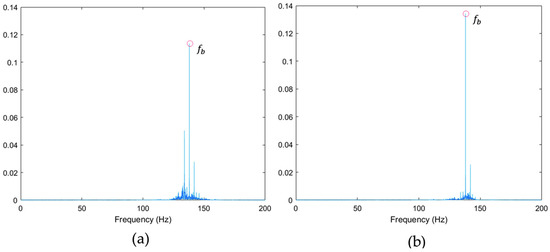
Figure 6.
Feature extraction results using different methods: (a) frequency spectrum after VMD-Tucker decomposition (); (b) frequency spectrum after WOA-VMD-Tucker decomposition ().
In Figure 6a, the frequency spectrum obtained using standard VMD still retains some interference-related frequency components. In contrast, the WOA-optimized VMD method shown in Figure 6b exhibits a cleaner spectrum with nearly no visible interference frequencies, and the fault-related frequencies are more distinctly highlighted. The marked frequency represents the characteristic fault frequency of the rolling bearing.
These results demonstrate the feasibility and robustness of incorporating the WOA into the proposed fault diagnosis framework. The optimized VMD parameters not only enhance the fault feature extraction capability but also effectively suppress environmental noise and irrelevant frequency components.
3.3. Comparative Analysis of Fault Diagnosis Performance Using Different Feature Extraction Methods
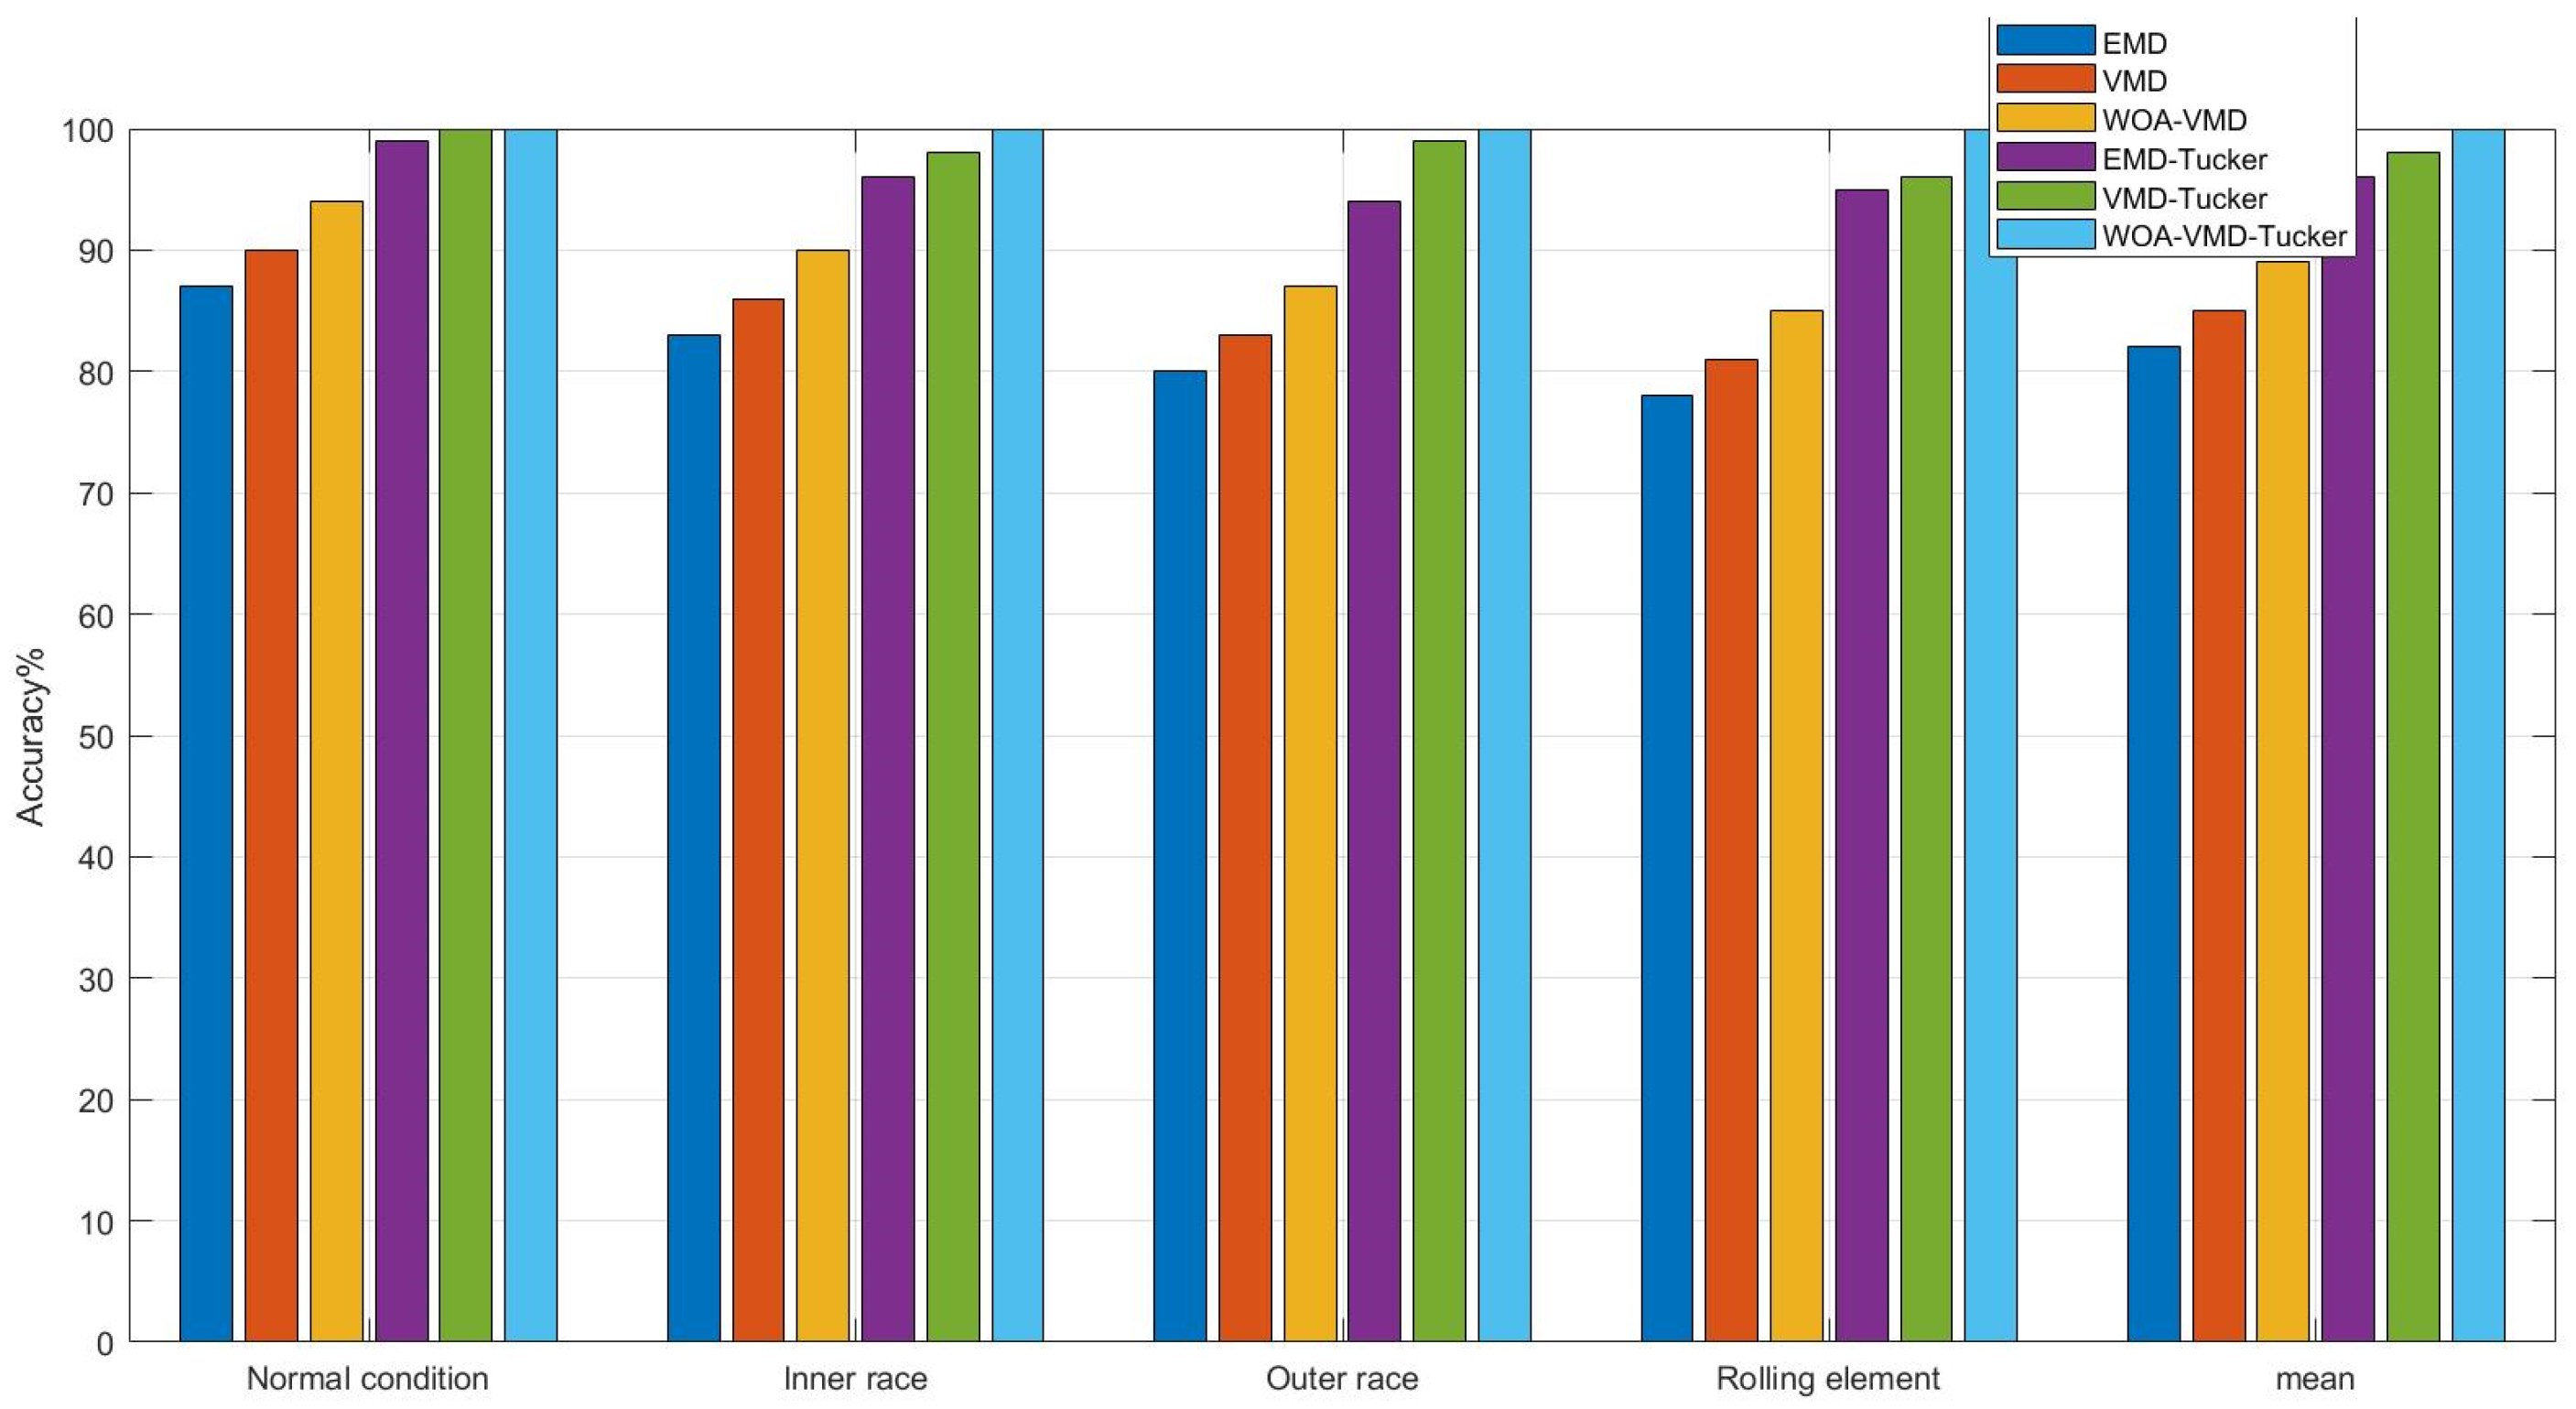
To further verify the effectiveness of the proposed WOA-VMD-Tucker multi-channel feature extraction method, six methods, EMD, VMD, WOA-VMD, EMD-Tucker, VMD-Tucker, and the proposed WOA-VMD-Tucker, were selected for comparison. Classification accuracy was evaluated under four operating conditions: normal, inner ring fault, outer ring fault, and rolling element fault. Each method was trained multiple times, and the average accuracy was calculated. The results are shown in Figure 7.
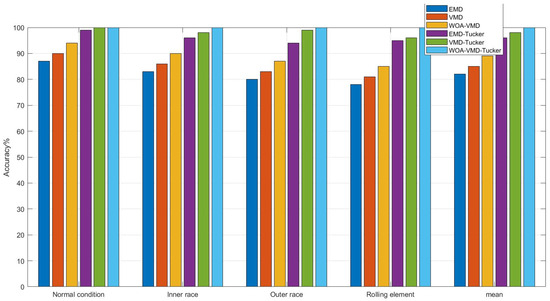
Figure 7.
Classification accuracy comparison of different feature extraction methods under various fault conditions.
In the experimental setup, the number of intrinsic mode functions (IMFs) for EMD and EMD-Tucker was set to 7, while for VMD and its improved variants, the mode number was K = 6 and the penalty factor was α = 1600. The WOA-VMD-Tucker method utilized the Whale Optimization Algorithm to search for optimal parameters within the ranges K ∈ [5, 10] and α ∈ [200, 5000]. For all tensor-based methods, the Tucker decomposition rank was set to 3. During the classification stage, an SVM classifier with a Gaussian kernel (C = 10, λ = 0.1) was employed, and five-fold cross-validation was conducted.
To further compare the diagnostic performance of different fault types, Table 5 presents the results for inner race, outer race, and ball faults, showing that the proposed WOA-VMD-Tucker method achieves perfect accuracy across all fault categories. The precision, recall, and F1-score remain high (ranging from 98.0% to 99.2%), demonstrating excellent robustness and generalization capability even for weak fault features.

Table 5.
Comparison of fault diagnosis performance for different fault types.
As shown in Figure 7, the proposed WOA-VMD-Tucker method achieved the best recognition performance under all operating conditions, reaching 100% accuracy in identifying weak faults such as rolling element and inner race defects. Compared with single-channel methods (EMD and VMD), the multi-channel fusion methods (EMD-Tucker and VMD-Tucker) demonstrated overall performance improvement, indicating that tensor modeling effectively integrates features across multiple channels.
To further compare the performance in fault diagnosis, CNN-based models (WOA-VMD-CNN, VMD-Tucker-CNN, WOA-VMD-Tucker-CNN) were introduced. As shown in Table 6, the traditional MEMD-SVM method exhibits relatively poor performance, with limited ability to extract discriminative features from vibration signals. The VMD-SVM method achieves improved performance by decomposing the signal into intrinsic mode functions, thereby extracting more informative features. The introduction of WOA in the WOA-VMD model further enhances the stability of the decomposition and the discriminative ability of the extracted features. After incorporating Tucker decomposition, the method reduces feature dimensionality while preserving the correlations among multi-channel information. The WOA-VMD-Tucker-SVM method achieves the best results across all evaluation metrics (ACC, PC, RC, F1), demonstrating excellent robustness and generalization capability.

Table 6.
Comparison of fault diagnosis performance.
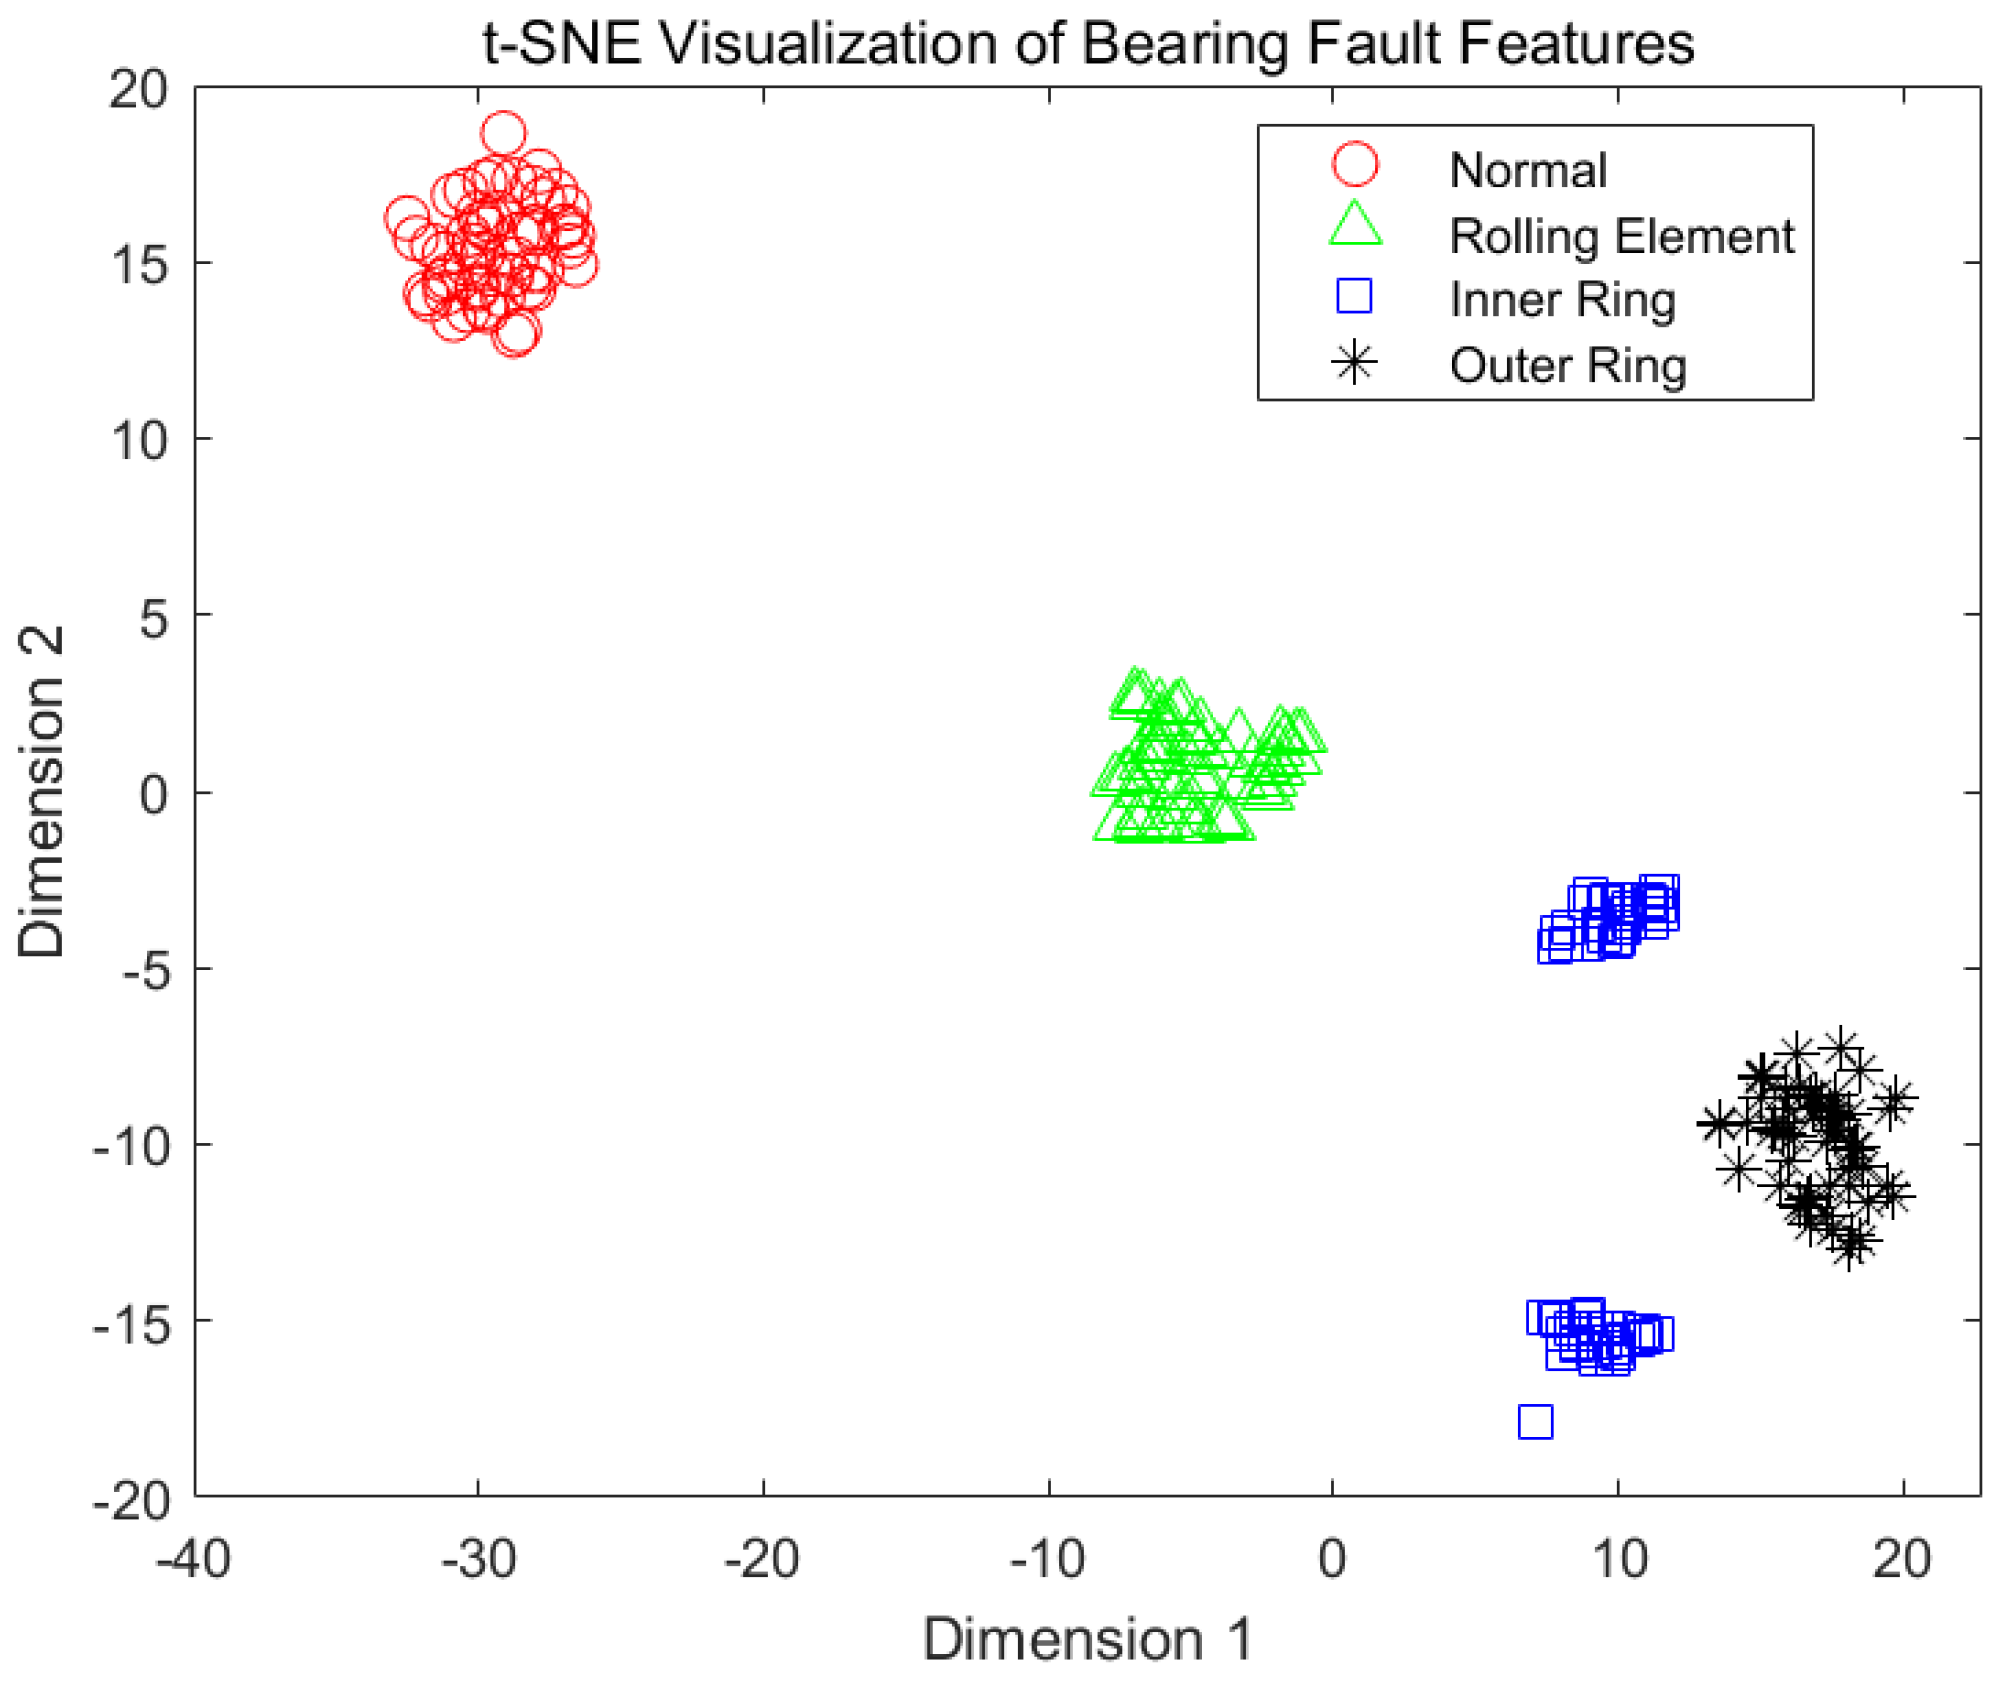
To further illustrate the classification results, Figure 8 shows the t-SNE-based visualization of fault categories. Different fault types form compact and clearly separated clusters in the feature space, with weak faults also well distinguished. For this visualization, the t-SNE perplexity was set to 30 and the learning rate to 200, chosen based on recommended values and preliminary experiments to achieve clear cluster separation. This demonstrates that the combination of WOA-optimized VMD parameters and Tucker decomposition significantly enhances feature separability, confirming the proposed method’s potential for engineering applications under complex operating conditions.
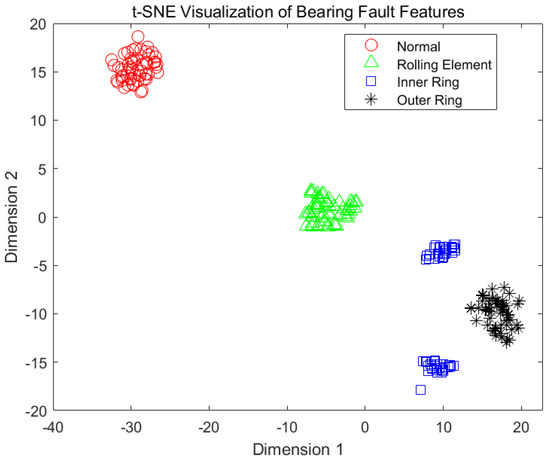
Figure 8.
t-SNE scatter plot of bearing fault features obtained using the proposed method.
4. Conclusions
The proposed multi-channel fault diagnosis method based on WOA-VMD and Tucker decomposition can effectively extract weak fault features under noisy conditions. WOA-optimized VMD improves mode separation and reduces noise, while tensor construction integrates multi-channel information, enhancing the method’s sensitivity and robustness. Tucker decomposition preserves key information while reducing dimensionality, and in this study, the decomposition rank was set empirically. Future work will include a sensitivity analysis to investigate how classification performance varies with different rank selections, or to explore strategies for automatically determining the optimal rank.
Validation was conducted using multiple simulated signals under varying SNRs, and statistical metrics, including average Accuracy, Precision, Recall, and F1-score with ranges, demonstrate strong robustness. Experimental results show that the proposed method outperforms single-channel and non-optimized approaches, can adapt to complex operating conditions and weak faults, and achieved 100% accuracy on the CWRU dataset. Since the CWRU dataset is a standardized benchmark with relatively controlled data collection conditions, this result reflects validation under controlled conditions. Future work will further evaluate the robustness and generalizability of the method under more complex, real-world operating conditions to enhance its practical significance and applicability.
In terms of computational efficiency, the main steps—WOA, VMD, Tucker decomposition, and SVM—require a moderate amount of computation, with the average runtime for the entire program being approximately 300 s. While suitable for offline analysis, real-time applications may require further optimization or hardware acceleration.
Author Contributions
Conceptualized, Z.W. and L.C.; Methodology, Z.W., W.P. and L.C.; Software, W.P. and H.Q.; Validation, W.P., M.X. and D.X.; Formal analysis, D.X., M.X. and H.Q.; Investigation, Y.W.; Data curation, W.P. and Z.W.; Writing—original draft, L.C. and W.P.; Writing—review and editing, Z.W. and L.C.; Visualization, W.P., D.X., M.X. and H.Q.; Supervision, Z.W.; Project administration, Y.W.; Funding acquisition, L.C. and Y.W. All authors have read and agreed to the published version of the manuscript.
Funding
This work was supported by the National Natural Science Foundation of China under Grant no. 62106074, and in part by the Natural Science Foundation of Hunan Province (Grant No. 2025JJ70057), in part by the open project initiative of the Hunan Key Laboratory for Intelligent Information Perception and Processing Technology (Grant No. 2024KF03), and in part by the Key Project of Hunan Provincial Education Department (Grant No. 23A0440), and in part by the Hunan Provincial Natural Science Foundation of China, under Grant No. 2025JJ50420.
Institutional Review Board Statement
Not applicable.
Informed Consent Statement
Not applicable.
Data Availability Statement
All data generated or analyzed during this study are included in this article. The experimental dataset used is from the CWRU bearing dataset. Specifically, the DE, FE, and BA subsets were used. Publicly available datasets were analyzed in this study. This data can be found here: https://engineering.case.edu/bearingdatacenter/download-data-file (accessed on 9 September 2024).
Conflicts of Interest
The authors declare no conflicts of interest. The funders had no role in the design of the study; in the collection, analyses, or interpretation of data; in the writing of the manuscript; or in the decision to publish the results.
References
- Fang, Z.; Wu, Q.-E.; Wang, W.; Wu, S. Research on Improved Fault Detection Method of Rolling Bearing Based on Signal Feature Fusion Technology. Appl. Sci. 2023, 13, 12987. [Google Scholar] [CrossRef]
- Sacerdoti, D.; Strozzi, M.; Secchi, C. A Comparison of Signal Analysis Techniques for the Diagnostics of the IMS Rolling Element Bearing Dataset. Appl. Sci. 2023, 13, 5977. [Google Scholar] [CrossRef]
- Wang, N.; Ma, P.; Zhang, H.; Wang, C. Fault Feature Enhancement and Diagnosis of Rolling Bearing Based on Complex Network. In Proceedings of the 2021 CAA Symposium on Fault Detection, Supervision, and Safety for Technical Processes (SAFEPROCESS), Chengdu, China, 17–18 December 2021; pp. 1–6. [Google Scholar]
- Xia, P.; Xu, H.; Lei, M.; Zhang, S. An Improved Underdamped Asymmetric Bistable Stochastic Resonance Method and its Application for Spindle Bearing Fault Diagnosis. IEEE Access 2020, 8, 46824–46836. [Google Scholar] [CrossRef]
- Wen, J.; Xu, F. Decision-Level Fusion-Based Compressor Blade Crack Detection Method Using Acoustic and Vibration Signals. In Proceedings of the 2023 6th International Conference on Mechatronics, Robotics and Automation (ICMRA), Xiamen, China, 17–19 November 2023. [Google Scholar]
- Tang, H.; Lu, S.; Qian, G.; Ding, J.; Liu, Y.; Wang, Q. IoT-Based Signal Enhancement and Compression Method for Efficient Motor Bearing Fault Diagnosis. IEEE Sens. J. 2021, 21, 1820–1828. [Google Scholar] [CrossRef]
- Nadide, G.; Mahmut, O. Diagnosis of Major Depressive Disorder from EEG Signals Using Empirical Wavelet Transform and Machine Learning Methods. In Proceedings of the 2024 Medical Technologies Congress (TIPTEKNO), Mugla, Turkiye, 10–12 October 2024; pp. 1–4. [Google Scholar]
- Alimuradov, A.; Tychkov, A. EMD-Based Noise-Robust Method For Speech/Pause Segmentation. In Proceedings of the 2021 3rd International Youth Conference on Radio Electronics, Electrical and Power Engineering (REEPE), Moscow, Russia, 11–13 March 2021; pp. 1–8. [Google Scholar]
- Chen, X.; Guo, Y.; Na, J. Proportional Selection Scheme: A Frequency Band Division Tool for Rolling Element Bearing Diagnostics. IEEE Trans. Ind. Electron. 2022, 69, 9504–9513. [Google Scholar] [CrossRef]
- Kucukselbes, H.; Sayilgan, E. Analysing SCI Patients’EEG Signal Using Manifold Learning Methods For Triple Command BCI Design. In Proceedings of the 2024 International Conference on INnovations in Intelligent SysTems and Applications (INISTA), Craiova, Romania, 4–6 September 2024; pp. 1–5. [Google Scholar]
- Wu, Q.; Gao, Q.; Lu, Y.; Zhu, D.; Sun, D.; Zhao, D. Incipient Fault Diagnosis Method via Joint Adaptive Signal Decomposition. IEEE Sens. J. 2024, 24, 24308–24318. [Google Scholar] [CrossRef]
- Huang, Y.; Xu, Z.; Jie, Z.; Shen, T.; Cao, L.; Wang, J. Bearing Fault Diagnosis Based on Time-Varying Targeted Enhancement of Stress Wave Signal. In Proceedings of the 2024 IEEE International Conference on Sensing, Diagnostics, Prognostics, and Control (SDPC), Shijiazhuang, China, 26–28 July 2024; pp. 57–62. [Google Scholar]
- Liao, Z.; Liang, G.; Song, X.; Li, X.; Huang, Z. AC Motor Fault Diagnosis Based on Multi-Source Signal Fusion SDP. In Proceedings of the 2024 Global Reliability and Prognostics and Health Management Conference (PHM-Beijing), Beijing, China, 11–13 October 2024; pp. 1–8. [Google Scholar]
- Hsieh, N.-K.; Yu, T.-Y. Fault Detection in Harmonic Drive Using Multi-Sensor Data Fusion and Gravitational Search Algorithm. Machines 2024, 12, 831. [Google Scholar] [CrossRef]
- Ma, H.; Li, J.; Huang, J.; Wang, R.; Ge, R.; Zhang, F. Adaptive Embedded Flexible Tensor Singular Spectrum Decomposition. Electronics 2025, 14, 21. [Google Scholar] [CrossRef]
- Yin, Y.; Yuan, R.; Lv, Y.; Wu, H.; Li, H.; Zhu, W. Low-Rank Tensor Train Dynamic Mode Decomposition: An Enhanced Multivariate Signal Processing Method for Mechanical Fault Diagnosis. IEEE Trans. Instrum. Meas 2025, 74, 1–16. [Google Scholar] [CrossRef]
- Jiang, H.; Wu, Y.; Yuan, J.; Zhao, Q.; Chen, J. Adaptive Low-Rank Tensor Estimation Model Based Multichannel Weak Fault Detection for Bearings. Sensors 2024, 24, 3762. [Google Scholar] [CrossRef] [PubMed]
- Chu, Z.; Guo, Q.; Wang, C. The PID Control Algorithm based on Whale Optimization Algorithm Optimized BP Neural Network. In Proceedings of the 2023 IEEE 7th Information Technology and Mechatronics Engineering Conference (ITOEC), Chongqing, China, 15–17 September 2023; pp. 2450–2453. [Google Scholar]
- Zou, Y.; Zhang, X.; Zhao, W.; Liu, T. Rolling Bearing Fault Diagnosis Based on Optimized VMD Combining Signal Features and Improved CNN. World Electr. Veh. J. 2024, 15, 544. [Google Scholar] [CrossRef]
- Yang, L.; Wang, J.; Xie, X.; Kuang, J. Application of tucker decomposition in speech signal feature extraction. In Proceedings of the 2013 International Conference on Asian Language Processing, Urumqi, China, 17–19 August 2013; pp. 155–158. [Google Scholar]
- Zhang, M.; Yin, J.; Chen, W. Rolling Bearing Fault Diagnosis Based on Time-Frequency Feature Extraction and IBA-SVM. IEEE Access 2022, 10, 85641–85654. [Google Scholar] [CrossRef]
Disclaimer/Publisher’s Note: The statements, opinions and data contained in all publications are solely those of the individual author(s) and contributor(s) and not of MDPI and/or the editor(s). MDPI and/or the editor(s) disclaim responsibility for any injury to people or property resulting from any ideas, methods, instructions or products referred to in the content. |
© 2025 by the authors. Licensee MDPI, Basel, Switzerland. This article is an open access article distributed under the terms and conditions of the Creative Commons Attribution (CC BY) license (https://creativecommons.org/licenses/by/4.0/).

