Article

Bridging Text and Knowledge: Explainable AI for Knowledge Graph Classification and Concept Map-Based Semantic Domain Discovery with OBOE Framework

by
Raúl A. del Águila Escobar
1,*,
María del Carmen Suárez-Figueroa
2,
Mariano Fernández López
3 and
Boris Villazón Terrazas
4
1
Department of Information Technology, CEU San Pablo University, 28668 Madrid, Spain
2
Department of Artificial Intelligence, Polytechnic University of Madrid, 28660 Madrid, Spain
3
Spanish Ministry of Education, Vocational Training and Sports, 28014 Madrid, Spain
4
EY AI Center of Excellence, EY Europe West Technology, 28003 Madrid, Spain
*
Author to whom correspondence should be addressed.
Appl. Sci. 2025, 15(22), 12231; https://doi.org/10.3390/app152212231
Submission received: 21 October 2025 / Revised: 10 November 2025 / Accepted: 14 November 2025 / Published: 18 November 2025
(This article belongs to the Special Issue Explainable Artificial Intelligence Technology and Its Applications)

Abstract

Explainable Artificial Intelligence (XAI) has primarily focused on explaining model predictions, yet a critical gap remains in explaining semantic structure discovery within knowledge graphs derived from concept maps (CMs). This study extends the OBOE (explanatiOns Based On concEpts) framework to address a fundamentally different problem, explainable domain discovery in knowledge graphs (KGs) classification, moving beyond supervised classification to unsupervised structural explanation. Our approach integrates Knowledge Graph Embeddings (KGEs), clustering algorithms, and Large Language Models (LLMs) in a novel triple role—generating structural explanations, verifying hallucinations, and enabling large-scale evaluation. Concept–relation–concept triples are embedded through KGEs and clustered using hierarchical and spectral methods to reveal semantic domains, with QualIT-inspired LLM prompting via Chain-of-Thought reasoning. Evaluation across three corpora (Amazon, BBC News, and Reuters) demonstrated robust classification with mean per-class errors of 0.1, 0.147, and 0.142, and LogLoss values of 0.236, 0.342, and 0.395, discovering 92 semantic domains across 17 topics. Hierarchical clustering achieved superior performance (mean 3.78/5) with higher relevance, while spectral clustering offered better coverage (3.51/5) through more compact structures. By bridging traditional clustering with LLM-based explanation and evaluation, this work establishes a new XAI paradigm for knowledge organization contexts where understanding semantic graph structure is as critical as classification accuracy.

1. Introduction

Explainable Artificial Intelligence (XAI) has become a central field within artificial intelligence, motivated by the need to provide transparency and interpretability for complex machine learning models [1,2]. In natural language processing, most XAI approaches have focused on explaining model predictions [3,4], particularly in text classification tasks, through feature-attribution methods such as LIME and SHAP [5,6] or through generative models based on Large Language Models (LLMs) like Clinical-T5 [7] or Polyjuice [8]. These advances have substantially improved the understanding of how models reach classification outcomes, yet they largely remain confined to prediction-centered explainability.
Beyond classification, the organization of knowledge derived from textual data represents an equally critical challenge. CMs and KGs [9,10] have emerged as powerful structures for representing knowledge through explicit concept–relation–concept triples [11], supporting applications in digital libraries, semantic web platforms, and educational technologies. Moreover, This organizational structure presents conceptual similarities with knowledge graphs like DBPedia [12] or YAGO [13], leading to research exploring ontology construction from CMs [10,14,15].
As these graph-based representations are increasingly generated automatically from texts, new questions arise regarding how to identify and explain the semantic domains that emerge within them. Addressing this challenge requires explainability not of prediction outputs, but of structural organization: understanding why certain concepts cluster together and form coherent semantic regions within a graph.
The emergence of Large Language Models (LLMs) has revolutionized the XAI landscape, introducing new possibilities for generating and evaluating explanations. Recent surveys [16,17] highlight how LLMs can be employed to generate explanations across different domains, including topic modeling pipelines. However, these advances also present new challenges in terms of hallucination prevention, explanation verification, and maintaining semantic coherence [18,19,20].
Building on the modular architecture of OBOE [21], this paper addresses Explainable AI for domain discovery—a fundamentally different problem that requires unsupervised structure explanation rather than prediction justification. This work addresses two interconnected challenges: (1) explainable classification of knowledge graphs—answering “why does this knowledge graph belong to category Y?” and (2) unsupervised domain discovery—answering “how and why do concepts within the graph cluster into semantic domains”.
The proposed implementation extends OBOE’s principles of data- and context-driven interpretability to the discovery of semantic domains within KGs derived from CMs. The approach combines KGEs to represent relational structures, hierarchical clustering to identify domains, and recent advances in LLM-enhanced topic modeling, particularly the Chain-of-Thought prompting strategies and verification mechanisms inspired by QualIT and contextualized coherence metrics [18].
This integration enables a hybrid symbolic–statistical strategy capable of producing coherent and verifiable explanations of how knowledge is organized.
The main contributions of this study are as follows:
  • This study demonstrates how the OBOE principles can be extended to solve a fundamentally different problem: unsupervised domain discovery and explanation in knowledge graphs derived from text in classification task, establishing a new XAI paradigm beyond traditional supervised classification explanation.
  • This study demonstrates that the OBOE framework principles can be extended to solve a fundamentally different problem from its original design. While the original OBOE framework explains a text classification decision based on text, our work establishes a novel XAI paradigm that addresses two interrelated challenges: (1) the explainable classification of knowledge graphs derived from text; (2) the unsupervised discovery and explanation of semantic domains within these graphs to ease the understanding of this classification.
  • The integration of LLM-based reasoning and verification mechanisms inspired by QualIT to ensure coherence and prevent hallucination in generated explanations.
  • A hybrid evaluation strategy combining quantitative clustering metrics with LLM-assisted qualitative assessment to achieve scalable explanation validation.
  • An empirical demonstration across three corpora—Reuters Activities, BBC News, and Amazon Reviews—identifying 92 semantic domains across 17 topics with coherence and relevance scores close to 4.0/5.
To guide the research, the following questions are addressed:
  • RQ1. To what extent can hierarchical clustering over concept-map-derived knowledge graphs reveal coherent and interpretable semantic domains within a broader conceptual domain?
  • RQ2. How effectively can Large Language Models generate coherent and comprehensible natural-language explanations of these hierarchically identified semantic domains?
  • RQ3. To what extent can structured prompting and verification mechanisms mitigate semantic inaccuracies or hallucinations in LLM-generated explanations?
  • RQ4. How can LLM-assisted evaluation methods provide scalable and reliable assessments of explanation quality across multiple domains?
Through this extension, the study demonstrates that XAI can move beyond explaining individual predictions toward explaining the organization of knowledge itself, opening new opportunities for transparent and verifiable knowledge management in AI-driven systems.
The remainder of this paper is structured as follows: Section 2 reviews related work and positions our contribution; Section 3 presents the methodology including KGE integration and clustering approaches; Section 4 details experimental results; Section 5 discusses findings, limitations, practical implications and future research directions; Section 6 present the main conclusions of this research work.

2. Related Work

Explainable AI in text classification has evolved from traditional feature attribution and model-specific methods to leveraging LLMs for richer, context-aware explanations. Semantic structures like knowledge graphs provide domain insights, while recent hybrid approaches combine symbolic reasoning with LLM-generated explanations to enhance transparency and user interaction. In this section, we present some of the most relevant works in the field, highlighting their contributions as well as the common limitations encountered.

2.1. Explainable AI in Text Classification

Text classification remains a central challenge in NLP due to its complexity and the rapid evolution of deep learning algorithms [22,23,24]. Existing explainability approaches can be broadly grouped into three categories:
  • Feature attribution: Post hoc methods such as LIME [5], SHAP [6], and ANCHORS [22] highlight influential tokens or features in model predictions. These have been applied to both classical and transformer-based architectures [23,24].
  • Example-based explanations: Approaches that provide exemplar text fragments to justify predictions [25,26].
  • Model-specific methods: Architectures embedding interpretability by design, e.g., attention-based explanations or rule extraction [27,28,29].
Despite their utility, most of these methods focus on post hoc interpretations and remain detached from model training.

2.2. LLM-Enhanced Explainability

The widespread adoption of large language models (LLMs) has transformed explainability research. Beyond improving predictive performance, LLMs serve as engines for producing, evaluating, and refining explanations.
  • LLM-based surveys and taxonomies: Recent surveys [16,17] outline the challenges and opportunities for explainability in LLMs, including explanation generation and evaluation.
  • Hybrid approaches: Methods such as Contextualized Topic Coherence (CTC) [18] and QualIT [19] demonstrate how LLMs complement traditional models by capturing semantic coherence and generating human-readable insights.
  • Domain-specific adaptation: Zhao et al. [30] and related works provide taxonomies tailored to transformer-based classifiers, highlighting LLMs’ role in medical, legal, and social applications.

2.3. Knowledge Graphs and Concept Maps

Knowledge graphs provide semantic layers that enrich explanations, supporting higher-level interpretability [31,32,33,34]. Similarly, CMs, long used for human reasoning [35], have been mined automatically from text [36,37,38,39] and integrated into ontology learning pipelines [10,14,15]. These tools enable explanations that are more structured, domain-informed, and human-centric.
Knowledge Graph Embeddings represent entities and relations in continuous vector spaces [40] Translation-based models (e.g., TransE [40]) and semantic matching methods [41] have been successfully applied to text classification [42,43]. Their integration with LLMs enhances both performance and explainability by linking symbolic and statistical representations.

2.4. Existing Frameworks and Limitations

Several explainable text classification frameworks have been introduced, including explAIner [44], which provides an iterative visual analytics approach for interactive model refinement through multiple model states and explainers MARTA [26], Legal Document Review [45], GEF [25], and SEXAI [46]. While innovative, these frameworks share common limitations:
  • Lack of LLM integration: Most predate the rise in modern LLMs.
  • Static explanations: Explanations are often one-shot and not verifiable.
  • Limited semantic depth: Earlier frameworks overlook nuanced linguistic patterns.
  • Minimal user interaction: Few allow interactive refinement of explanations (with the exception of explAIner).

2.5. Recent LLM-Based Frameworks

Between 2021 and 2025, novel frameworks have emerged that integrate LLMs directly into the explanation process. Examples include:
  • Hybrid symbolic–LLM methods: Combining rule-based reasoning with LLMs to translate outputs into natural-language justifications [47].
  • Counterfactual generators: Polyjuice [8] and FIZLE [48] exploit LLMs to create realistic counterfactuals for highlighting decision-driving features.
  • Prototype-based classifiers: ProtoryNet [49] and ProtoLens [50] use prototype exemplars to ground decisions in semantically meaningful examples.
  • Attention-based and rationale-generation methods: HELAS [51], MARTA [26], TaSc [52], LIREx [53] and joint generative–predictive models (Clinical-T5) [7] align explanations with human rationales.
  • Feature attribution pipelines: SLIME [54] and PLEX [55] adapt feature attribution to transformer architectures.

2.6. Comparative Positioning

Table 1 compares major explainable frameworks in terms highlighting differences in task scope, representation, and the integration of LLMs.
Most frameworks explain model predictions on textual data, while ours addresses the explanation of semantic structure in concept-map-derived knowledge graphs, extending explainability from the prediction to the organization of knowledge.
The combination of a graph-based representation with a triple LLM role (generation, verification, evaluation) and a model-independent modular architecture constitutes the principal novelty of this work and introduces a new paradigm for Explainable AI: one focused on knowledge organization transparency, not only on classification justification.

2.7. Research Gap

The comparative analysis reveals that current explainable frameworks—whether classical or LLM-enhanced—focus on explaining model predictions over textual data.
In contrast, this work targets a fundamentally different but complementary challenge: the explanation of emergent semantic structures within graph-based representations that need to be classified and explained. It advances the field by integrating KGEs and LLM-based reasoning for unsupervised domain discovery, ensuring both semantic coherence and verifiable interpretability.
From this analysis, the following research hypotheses are formulated:
  • H1. Explainable domain discovery over concept-map-derived knowledge graphs can reveal coherent and interpretable semantic domains.
  • H2. Large Language Models can provide meaningful, verifiable natural-language explanations of these domains when guided by structured prompting and verification mechanisms.
  • H3. Combining symbolic and statistical representations enhances both the transparency and the interpretability of knowledge organization systems.
These hypotheses articulate the theoretical foundation that guides the methodological development presented in the next section.

3. Materials and Methods

In this section, we describe our experimental materials (datasets, tools). As introduced in Section 1, this work builds upon the OBOE framework, previously introduced in [1]. OBOE is a modular and model-agnostic framework which defines an explicit workflow for text classification and explanation scenarios, in which data, models, users, and context play active roles. We first outline the input data and preprocessing (Section 3.1), then detail each component of the OBOE framework implementation (Section 3.2). We pay special attention to the novel components involving LLM prompting and verification (Section 3.2.4).

3.1. Datasets and Other Resources

In this study three main corpora were employed:
  • Amazon Reviews [56] comprising 3000 documents, evenly distributed between the Books and Pet Supplies categories (1500 documents per category). The class labels are distinct domains (literature vs. pet products).
  • BBC News [57]: comprises 2500 news article summaries across five topical categories: business, entertainment, politics, sport, and tech. We have 500 documents per category. The documents (news summaries) are moderate in length (a few paragraphs). We included this dataset to examine performance on multi-topic scenarios and to see how well the framework handles a broader range of topics with potentially overlapping domains (e.g., tech news might overlap with business at times).
  • Reuters [58]: consisting of 2400 articles, evenly distributed among Corporate_Earnings, International_Trade, Energy_Resources and Agrigultural_Markets activities. We included this dataset both to examine performance on multi topic scenarios with potentially more overlapping domains than BBC News dataset. Also, this dataset exhibits highly specialized linguistic characteristics not present in Amazon or BBC.
The scale of the corpora is about 2500–3000, which is aligned with specialized corpora in realistic scenarios such us corporate compliance (reviewing policy documents) or medical diagnosis support (case histories).
In addition to the text corpora, we integrated the following knowledge resources to enrich concept extraction: WordNet [59] and DBPedia and DBPedia Spotlight [12,60]. The aim of the use of this resources is both to find related concepts and generalize them and to map named entities in DBPedia.
These resources were employed in the Representation and Explanation components, as detailed later.
The main libraries and versions we used: spaCy (https://spacy.io, accessed 30 July 2025) v3.5.4 for basic NLP (tokenization, POS tagging), Stanford Stanza v1.3.2 (https://stanfordnlp.github.io/stanza/, accessed 30 July 2025) for dependency parsing and NER (it internally uses the Stanford CoreNLP models), the openie annotator of Stanford CoreNLP (accessed via Stanza) for triple extraction, PyKeen 1.11.2.dev-0 for KGE representation, scikit-learn 1.7.1 for clustering (Ward’s method) and metrics, gensim 4.3.3 for topic modeling, and Transformers 4.53 for loading the LLM (we used FLAN-T5-base for evaluation and QWEN-2-7B-Instruct for generation).
Experiments were conducted on Intel Xeon CPU systems with 32 GB RAM, and Apple Mac Studio (M1 Max, 64 GB RAM). Due to partial incompatibility between PyKEEN and Apple’s Metal Performance Shaders (MPS), all embedding models were trained on CPU for consistency. Also, inference over LLM were made on CPU.

3.2. Framework Implementation

OBOE provides a general pipeline which can be adapted to custom scenarios. This pipeline consists of four core components (A–D), which we customized for our concept-map scenario. Figure 1 shows these components and data flow: (A) Reordering (topic modeling), (B) Representation (KG construction), (C) Classification (with C.1: KGE training, C.2: classifier training), and (D) Explanation (with D.1: domain identification, D.2: explanation generation, D.3: explanation evaluation).

3.2.1. (A) Reordering

This component addresses the first step of OBOE: reorganizing the corpus in terms of topics or latent classes, essentially to ensure data is represented in a way conducive to explanation. Documents were organized into semantic topics using Latent Dirichlet Allocation (LDA) [61] to facilitate domain-specific explanation generation in subsequent components. Unlike the original OBOE framework, which employed term relevance for corpus partitioning, LDA provides probabilistic topic assignments that align with OBOE’s requirement for flexible supervised or semi-supervised learning approaches.
The number of topics was determined differently per corpus based on task characteristics: Amazon (binary classification) used k = 2 topics to match class structure, while BBC and Reuters employed coherence-based optimization [18] on validation sets, yielding k = 7 and k = 8 topics, respectively. These configurations reflect varying semantic granularities—BBC’s 5 categories map to 7 topics, and Reuters’ 4 categories to 8 topics—indicating natural subtopic structures within predefined classes.
Hyperparameters (α, η) were optimized via grid search maximizing C_v coherence scores. Optimal configurations exhibited corpus-specific patterns: low α values (Reuters: 0.009; BBC: 0.25) encouraged focused topic assignments suited to specialized journalistic content, while higher η values accommodated vocabulary diversity (BBC: 1.06) or balanced thematic coverage (Amazon: 0.8, symmetric α).
This process generates two key outputs integrated into subsequent components: a topic-specific vocabulary (top-10 terms per topic, for example {oil, price, crude, opec, barrel, bpd, mlns, saudi, production}) that guides entity recognition and relation extraction (Section 3.2.2), and a topic-labeled corpus where each document receives its maximum-probability topic assignment. For Amazon, topic assignments naturally align with binary classes; for BBC and Reuters, they provide finer-grained semantic partitions. This topic-based organization enables the framework to construct domain-specific KGs within coherent thematic contexts, supporting the interpretability objectives of OBOE’s explanation pipeline.

3.2.2. (B) Representation

This component transforms each document (labeled with its topic from Section 3.2.1) into a structured semantic representation: a set of subject-relation-object triples forming a document-specific KG. This representation bridges unstructured text and structured knowledge, enabling graph-based classification interpretable explanations. It comprises two main steps: Named Entity Recognition and Linking, and Hybrid Triple Extraction.
Named Entity Recognition and Linking. Entity identification employs spaCy’s en_core_web_lg model to recognize people, organizations, locations, and temporal expressions. Recognized entities are linked to DBpedia URIs via fuzzy matching (similarity threshold ≥0.85), providing semantic typing that disambiguates context-dependent terms—for instance, distinguishing dbr:Apple_Inc (organization) from Apple (fruit) in technology versus culinary contexts. Entity metadata informs downstream explanation generation (Section 3.2.4).
Hybrid Triple Extraction. Semantic triples are extracted through a two-stage pipeline combining syntactic parsing with pattern-based refinement (Algorithm 1).
Algorithm 1: Semantic triple extraction algorithm
Data: document(D), StanzaParser(𝒫), PatternRules(), stopWords(SW),
   threshold(θ)
Result: tripleSet(T), linkedEntities(E)
1   begin
2     T ← ∅;       // Initialize empty triple set
3     candidateTriples ← ∅;
4     validTriples ← [];
5     sentences ← SegmentSentences(D);
6     for sent ∈ sentences do
7       depGraph ← 𝒫.parse(sent);     // Stanza dependency parsing
8       T_dep ← ExtractFromDependencies(depGraph);
9       T_pat ← ExtractFromPatterns(sent,);    // Pattern matching
10     if T_dep = ∅ and T_pat = ∅ then
11       fallback ← GenerateFallbackTriple(sent);
12       candidateTriples ← candidateTriples ∪ {fallback};
13     else
14       candidateTriples ← candidateTriples ∪ T_dep ∪ T_pat;
    // Stage 2: Filtering and normalization
15  for (s,r,o) ∈ candidateTriples do
16     if s ∉ SW and o ∉ SW and |s| > 1 and |o| > 1 then
17       r ← RemoveAdverbs(r);     // Linguistic normalization
18       r ← RemoveModals(r);
19       r ← Lemmatize(r);
20       validTriples.Add((s,r,o));
    // Stage 3: Consolidation
21   T ← ConsolidateOverlapping(validTriples);
    // Stage 4: Entity linking
22   E ← ∅;
23   for (s,r,o) ∈ T do
24     s_linked ← LinkToDBPedia(s, θ);   // Link if similarity
25     o_linked ← LinkToDBPedia(o, θ);
26     E ← E ∪ {s_linked, o_linked};
27     T.update((s_linked,r,o_linked));
28 return T, E
Stage 1 employs Stanza’s neural dependency parser to identify core semantic relationships from grammatical dependencies (nsubj, dobj, amod). For example, “Apple announced quarterly results exceeding expectations” yields:
  • (Apple, announced, results) ← subject–verb–object chain.
  • (results, has_property, quarterly) ← adjectival modification.
  • (results, exceeded, expectations) ← clausal relation.
Stage 2 applies five systematic refinements to improve coverage and quality:
  • Pattern augmentation captures linguistic structures underrepresented in dependency parses: possessive constructions [(price, has_component, oil)], noun compounds [(technology, related_to, sector)], and prepositional phrases [(company, located_at, London)].
  • Fallback generation ensures semantic coverage by extracting triples from primary noun phrases when parsing fails on fragments or headlines.
  • Semantic filtering removes triples containing stop words, single-character artifacts, or duplicate subject-object pairs, retaining only semantically meaningful relations.
  • Linguistic normalization standardizes predicates through lemmatization and removal of adverbial/modal modifiers (e.g., quickly announced → announce), reducing relation vocabulary while preserving core semantics.
  • Triple consolidation merges semantically equivalent triples extracted from different grammatical structures (e.g., announced and has_announced both map to canonical announce).

3.2.3. (C) Classification

This component trains graph-based classifiers using semantic triples from Section 3.2.2, implemented as a two-phase pipeline: (C.1) Knowledge graph embedding training and (C.2) topic prediction.
  • (C.1) Knowledge Graph Embedding Training. Triple representations are learned using three complementary KGE paradigms: TransE [40] models relations as translations in vector space (minimizing ||s + r − o||); ConvKB [62] applies convolutional filters over concatenated embeddings; and ComplEx [63] employs complex-valued embeddings with trilinear scoring; and DistMult [64] that sees a bilinear interaction between entities and relations but fails to model antisymmetric patterns. These models represent distinct relational modeling approaches—translational, convolutional, and tensor factorization—providing architectural diversity for embedding quality assessment.
For each corpus, all three models were independently trained with hyperparameters optimized via grid search over embedding dimensions, margin values, learning rates, and negative sampling ratios.
2.
(C.2) Topic Classification. The learned embeddings—specifically subject and object vectors from validated triples—serve as features for XGBoost [65] classifiers that predict topic assignments from Section 3.2.1. XGBoost was selected for computational efficiency and robust performance on structured features. During the hyperparameter optimization stage of the XGBoost classifier, a stratified cross-validation procedure with randomized cross validation was applied to tune the parameters with the highest influence on predictive capacity and model generalization. Specifically, combinations of n_estimators, max_depth, learning_rate, subsample, colsample_bytree, min_child_weight, and gamma were explored, while the regularization parameters (reg_alpha, reg_lambda) were kept fixed at their default values (0 and 1, respectively).
Model selection was not based on intrinsic link prediction metrics such as MRR or Hits@k, but on downstream classification performance, which directly reflects the intended use of OBOE for semantic topic discrimination based on the vectorial representation contained in the embeddings.
Finally, this two-phase design decouples semantic encoding (KGE) from task-specific prediction (classification), enabling flexible adaptation; embeddings trained for link prediction generalize to classification without task-specific retraining, while classifiers can be retrained for new tasks using fixed embeddings.

3.2.4. (D) Explanations

As stated in Section 1 and Section 2, the explanation component in OBOE aims to explain and evaluate the domains underlying a knowledge representation of a CM. Through a combination of hierarchical clustering and natural language generation (NLG), the component bridges technical representations with user-accessible explanations, ensuring interpretability for both expert and non-expert audiences.
The pipeline integrates symbolic reasoning (clustering) with neural generation (LLMs), implemented through three subcomponents: domain identification (D.1), natural language generation (D.2), and explanation evaluation (D.3).
(D.1) Domain Identification. Semantic domains are identified from topic-specific KGs through hierarchical clustering of enriched term representations (Algorithm 2).
Algorithm 2: Domain identification algorithm
Data: Triplets(T), topic, similarityThreshold, number of unique triplets (N),
   vocabulary(V), DBPediaTerms(dbpedia), NerTerms(ner)
Result: dictionaryOfTerms, similarityMatrix
1   begin
2     T ← T[topic];          // triplets of the topic to explain
3     visitedTerms ← emptySet();
4     numberOfTriplets ← 1;
5     visited ← emptySet();      // empty triplet set
6     while numberOfTriplets < N do
7       triplet ← GetNextTriplet(T,visited);  // next non visited triplet
8       subject ← GetTermsFromSubject(triplet);
9       object ← GetTermsFromObject(triplet);
10     if ∀ ex Null o (NotDisjoint(subject,V) o NotDisjoint(object,V) then
11       termsOfTriplet ← GetTerms(subject,object);
12       for term en termsOfTriplet do
13         termsdb ← GetDBPediaResourceAndTypes(term,dbpedia)
14         termswordnet ← GetWNTermsAndTypes(term)
15         entityNer ← GetNerEntity(term,ner);
16         dictionaryOfTerms ←
NewDictionaryFrom(term,termsdb,termswordnet,entityNer)
17     similarityMatrix ←
BuildSimilarityMatrixWithEmbeddings(dictionaryOfTerms,similarityThreshold);
18 return similarityMatrix,dictionaryOfTerms
The process begins by selecting triples associated with a given topic, extracting subject and object terms as candidate concepts. These terms are enriched through three complementary knowledge sources:
  • GetDBPediaResourceAndTypes: Retrieves ontological types and related concepts from DBpedia, providing structured semantic context.
  • GetWNTermsAndTypes: Incorporates WordNet synonyms and hypernyms, expanding lexical coverage.
  • GetNerEntity: Identifies named entities and their categories, capturing domain-specific terminology.
Terms can be filtered to a user-specified vocabulary (e.g., LDA terms, NER entities, DBpedia concepts) through set intersection augmented by WordNet synonyms and spaCy-based semantic similarity, providing flexible control over domain granularity. Enriched terms populate a dynamic concept dictionary, with pairwise semantic similarity computed via word embeddings to construct a similarity matrix. Two approaches of clustering are adopted:
  • Hierarchical clustering (Ward linkage) groups conceptually related terms into domains, enabling analysis of inter-domain relationships through dendrograms and facilitating identification of multiple granular domains within single topics.
  • Spectral clustering to capture non-convex semantic structures, where similarity scores are normalized to the [0, 1] range to form an affinity matrix. Spectral clustering applies eigen decomposition of the graph Laplacian to project terms into a lower-dimensional spectral space, where standard clustering algorithms can identify semantically coherent groups.
D.2 Natural Language Generation. Domain clusters are transformed into structured explanations through a four-stage LLM prompting strategy designed to mitigate hallucination (inspired by QualIT [20]), implemented using Qwen2-7B-Instruct:
  • Key Phrase Extraction (Prompt A.1, Appendix A): The model receives cluster terms and topic context, extracting 2–3 key phrases (2–4 words each) that capture central semantic relationships. For example, given terms {Arabian, oil, Saudi, energy, sector} in a technology topic, the model generates phrases like “Arabian oil” and “Saudi energy sector”.
  • Semantic Verification (Prompt A.2, Appendix A): Generated phrases undergo validation to ensure: (i) grounding in actual cluster terms (no entity fabrication); (ii) alignment with topic domain; (iii) absence of spurious connections. The model returns binary validation (VALID/INVALID) with justification. Failed validations trigger phrase revision.
  • Explanation Synthesis (Prompt A.3, Appendix A): Validated phrases are synthesized into coherent explanatory text covering three aspects—semantic coherence of terms, domain relevance to topic context, and clustering justification. The model generates 2–3 sentence descriptions maintaining factual alignment with cluster content.
  • Structured Output Generation: Explanations are formatted as JSON objects containing: explanation text, reasoning narrative justifying quality scores, key phrases list, and preliminary scores (1–5 scale) for coherence, relevance, and coverage. For instance:
{“explanation”: “The cluster highlights Saudi Arabia’s strategic role in global oil markets through Arabian oil production within the Saudi energy sector”, “coherence”: 4, “relevance”: 5, “coverage”: 4}
This multi-stage architecture enforces semantic grounding at each step, with verification acting as a quality gate before explanation synthesis. Complete prompt templates are provided in Appendix A.
D.3 Explanation Evaluation. Generated explanations undergo automated quality assessment using FLAN-T5-base through a structured evaluation prompt (Prompt A.4, Appendix A) that scores three XAI-aligned dimensions on 1–5 scales:
  • Semantic Coherence: Evaluates whether terms exhibit logical unity and the explanation captures their conceptual relationships. The prompt instructs: “Are the terms semantically related? Does the explanation capture their unity?”
  • Domain Relevance: Assesses connection to broader topic context and identification of domain-specific relationships. The prompt asks: “How relevant are these terms to the [topic] domain? Are domain-specific relationships identified?”
  • Coverage Completeness: Determines whether main cluster aspects and key semantic relationships are adequately addressed. The prompt queries: “Does the explanation cover the main aspects? Is the scope appropriate?”
The evaluation model returns JSON-formatted scores with narrative justifications explaining score rationale, explicit strengths (e.g., “clear semantic grouping”, “strong domain connection”), and weaknesses (e.g., “lacks specificity”, “overly broad scope”). Scores are aggregated across all domains within a topic to compute topic-level quality metrics (mean ± standard deviation), stored alongside explanations for reproducibility. This structured evaluation ensures alignment with QualIT standards [20] for reliable, unbiased explanations while providing actionable feedback for iterative refinement.
This evaluation phase validates that explanations maintain fidelity to underlying knowledge graph structures while achieving natural language fluency suitable for non-technical audiences.
Hybrid XAI Architecture. OBOE’s design philosophy follows QualIT’s approach [20] by combining traditional clustering methods with LLM-enhanced explanation generation. Unlike purely neural methods, OBOE grounds explanations in graph-derived semantic structures extracted through symbolic processing (hierarchical clustering, knowledge base enrichment), ensuring factual traceability. LLMs operate as generation and evaluation modules constrained by these structures rather than as primary knowledge sources, preventing unconstrained generation that could introduce hallucinations. This architecture maintains interpretable-by-design principles while leveraging neural models’ natural language capabilities.

4. Results

The evaluation focuses on three main components: (A) Reordering (topic assignment with respect to the initial classes), (C) Classification (model performance), and (D) Generated Explanations. This section specifically addresses these components or phases of the process. For components (A) and (C), the evaluation relies on metrics: (i) Mean per class error, (ii) AUC, and (iii) LogLoss.
Regarding component (D) Explanations, we follow established practices in XAI and topic modeling [18,19,20], and adopt a metrics-based evaluation approach where computational measures act as validated proxies for explanation quality. In particular:
  • Topic Coherence (cv) has been shown to strongly correlate with human judgments of topic interpretability [18], with correlation coefficients of 0.7–0.8 across multiple studies. The coherence measure is employed, computed from the N words with the highest probability of belonging to a given topic, using mutual information as the similarity measure and cosine distance as the adjustment metric.
  • Silhouette Coefficient [66] calculated from inter-cluster distance (a) and intra-cluster distance (b), providing an indicator of cluster compactness and separation.
  • LLM-based evaluation is an emerging best practice in XAI [19,20] allowing large language models to systematically assess explanation quality across dimensions such as coherence, relevance, and coverage.
This combined approach aligns with recent research emphasizing reproducible and scalable evaluation methods. It leverages computational metrics and LLMs to robustly assess explanations while acknowledging that future work can complement these methods with targeted human studies for specific use cases.

4.1. (A) Reordering

Table 2 details the results obtained during the classification of the topics with respect to the original classes.
These results indicate that the probabilistic reordering effectively structured the corpus into semantically meaningful clusters, providing a robust basis for subsequent graph-based representation and classification stages.

4.2. (C) Classification

Following topic reordering, the classification component evaluated the predictive capacity of KGEs derived from extracted triples.
Following the topic reordering phase, the classification component assessed the discriminative performance of KGEs when used as feature representations for topic prediction via XGBoost.
Each document was represented as a set of semantic triples extracted from the corresponding CM. These triples were embedded using three paradigms—TransE, DistMult, ComplEx, ConvKB—capturing translational, relations, tensor, and convolutional relational patterns, respectively. The resulting embeddings (subject–object vectors) were used as structured numerical features for an XGBoost classifier, enabling topic-level prediction grounded in semantic graph structure.
A comprehensive 10-fold cross-validation was performed for each corpus. TransE consistently achieved the highest predictive performance and the lowest variance across folds, indicating superior relational generalization and embedding stability. Interestingly, the hyperparameter optimization process yielded similar optimal configurations across the three corpora: gamma 0.1, learning_rate 0.2, n_estimators 100, colsample_bytree 0.8. This behavior is consistent with previous findings on the stability and transferability of gradient boosting models across datasets sharing comparable feature representations or embedding geometries.
Studies, such as Ke et al. [67] and Prokhorenkova et al. [68], have reported that, when datasets originate from similar embedding distributions, the same hyperparameter regions tend to generalize well across tasks, especially for parameters controlling learning rate, tree depth, and subsampling. Therefore, the convergence toward identical parameter sets across Amazon, BBC, and Reuters corpora likely reflects the shared statistical structure of their embedding spaces rather than overfitting or methodological artifacts.
Figure 2 illustrates the cross-validation variance across datasets, showing stable AUC values above 0.97 for all corpora. Slightly higher dispersion in the Amazon corpus reflects its binary composition and reduced inter-class variability.
Table 3 also details the evaluation results, and Appendix B.1 extends this table with a comprehensive comparison among all the embeddings models, their downstream classification, and the statistical validation. Appendix B.2 contains the figures depicting the embeddings visualization. As detailed in Appendix B.1, statistical validation (Wilcoxon p > 0.9 across all folds) confirmed that performance differences were not significant, supporting the robustness of the classification stage.
Overall, these results demonstrate that KGE-based representations provide effective, semantically grounded features for topic classification using XGBoost.

4.3. (D) Explanation

4.3.1. (D.1) Domains Identification

Topic Coherence
As described at the beginning of this section, the explanation relies on the identification of knowledge areas within a topic represented in a KG.
One valid approach for evaluating explanations is to rely on metrics that justify their quality, provided that the models used during the process have been previously and sufficiently validated. The evaluation of explanations in OBOE follows a quantitative yet human-aligned approach. Each explanation is grounded in the identification of semantic domains and concept clusters derived from term similarity within the topic.
In this framework, topic coherence is adopted as a proxy for human interpretability, reflecting how understandable a topic is based on the semantic consistency of its defining terms. This metric has proven to be a reliable indicator of perceived explanation quality, linking computational validation with human-centered evaluation.
Table 4 summarizes the coherence values obtained for component (A) Reordering. As previously noted, coherence serves as a measure of how interpretable a topic is for humans, based on the words that define it.
Domains Interpretation and Natural Language Evaluation
As described in Section 3.2.4, the objective of the explanation component is to identify and describe the relevant domains or subject areas within each subgraph representing a CM. Each subgraph corresponds to a single topic obtained in component (A) Reordering. To achieve this, a second topic-modeling phase is executed using LDA, enabling the identification of several potential domains or subtopics within each main topic.
The process can be executed either individually for a specific topic or globally across the entire corpus, depending on the analytical requirements.
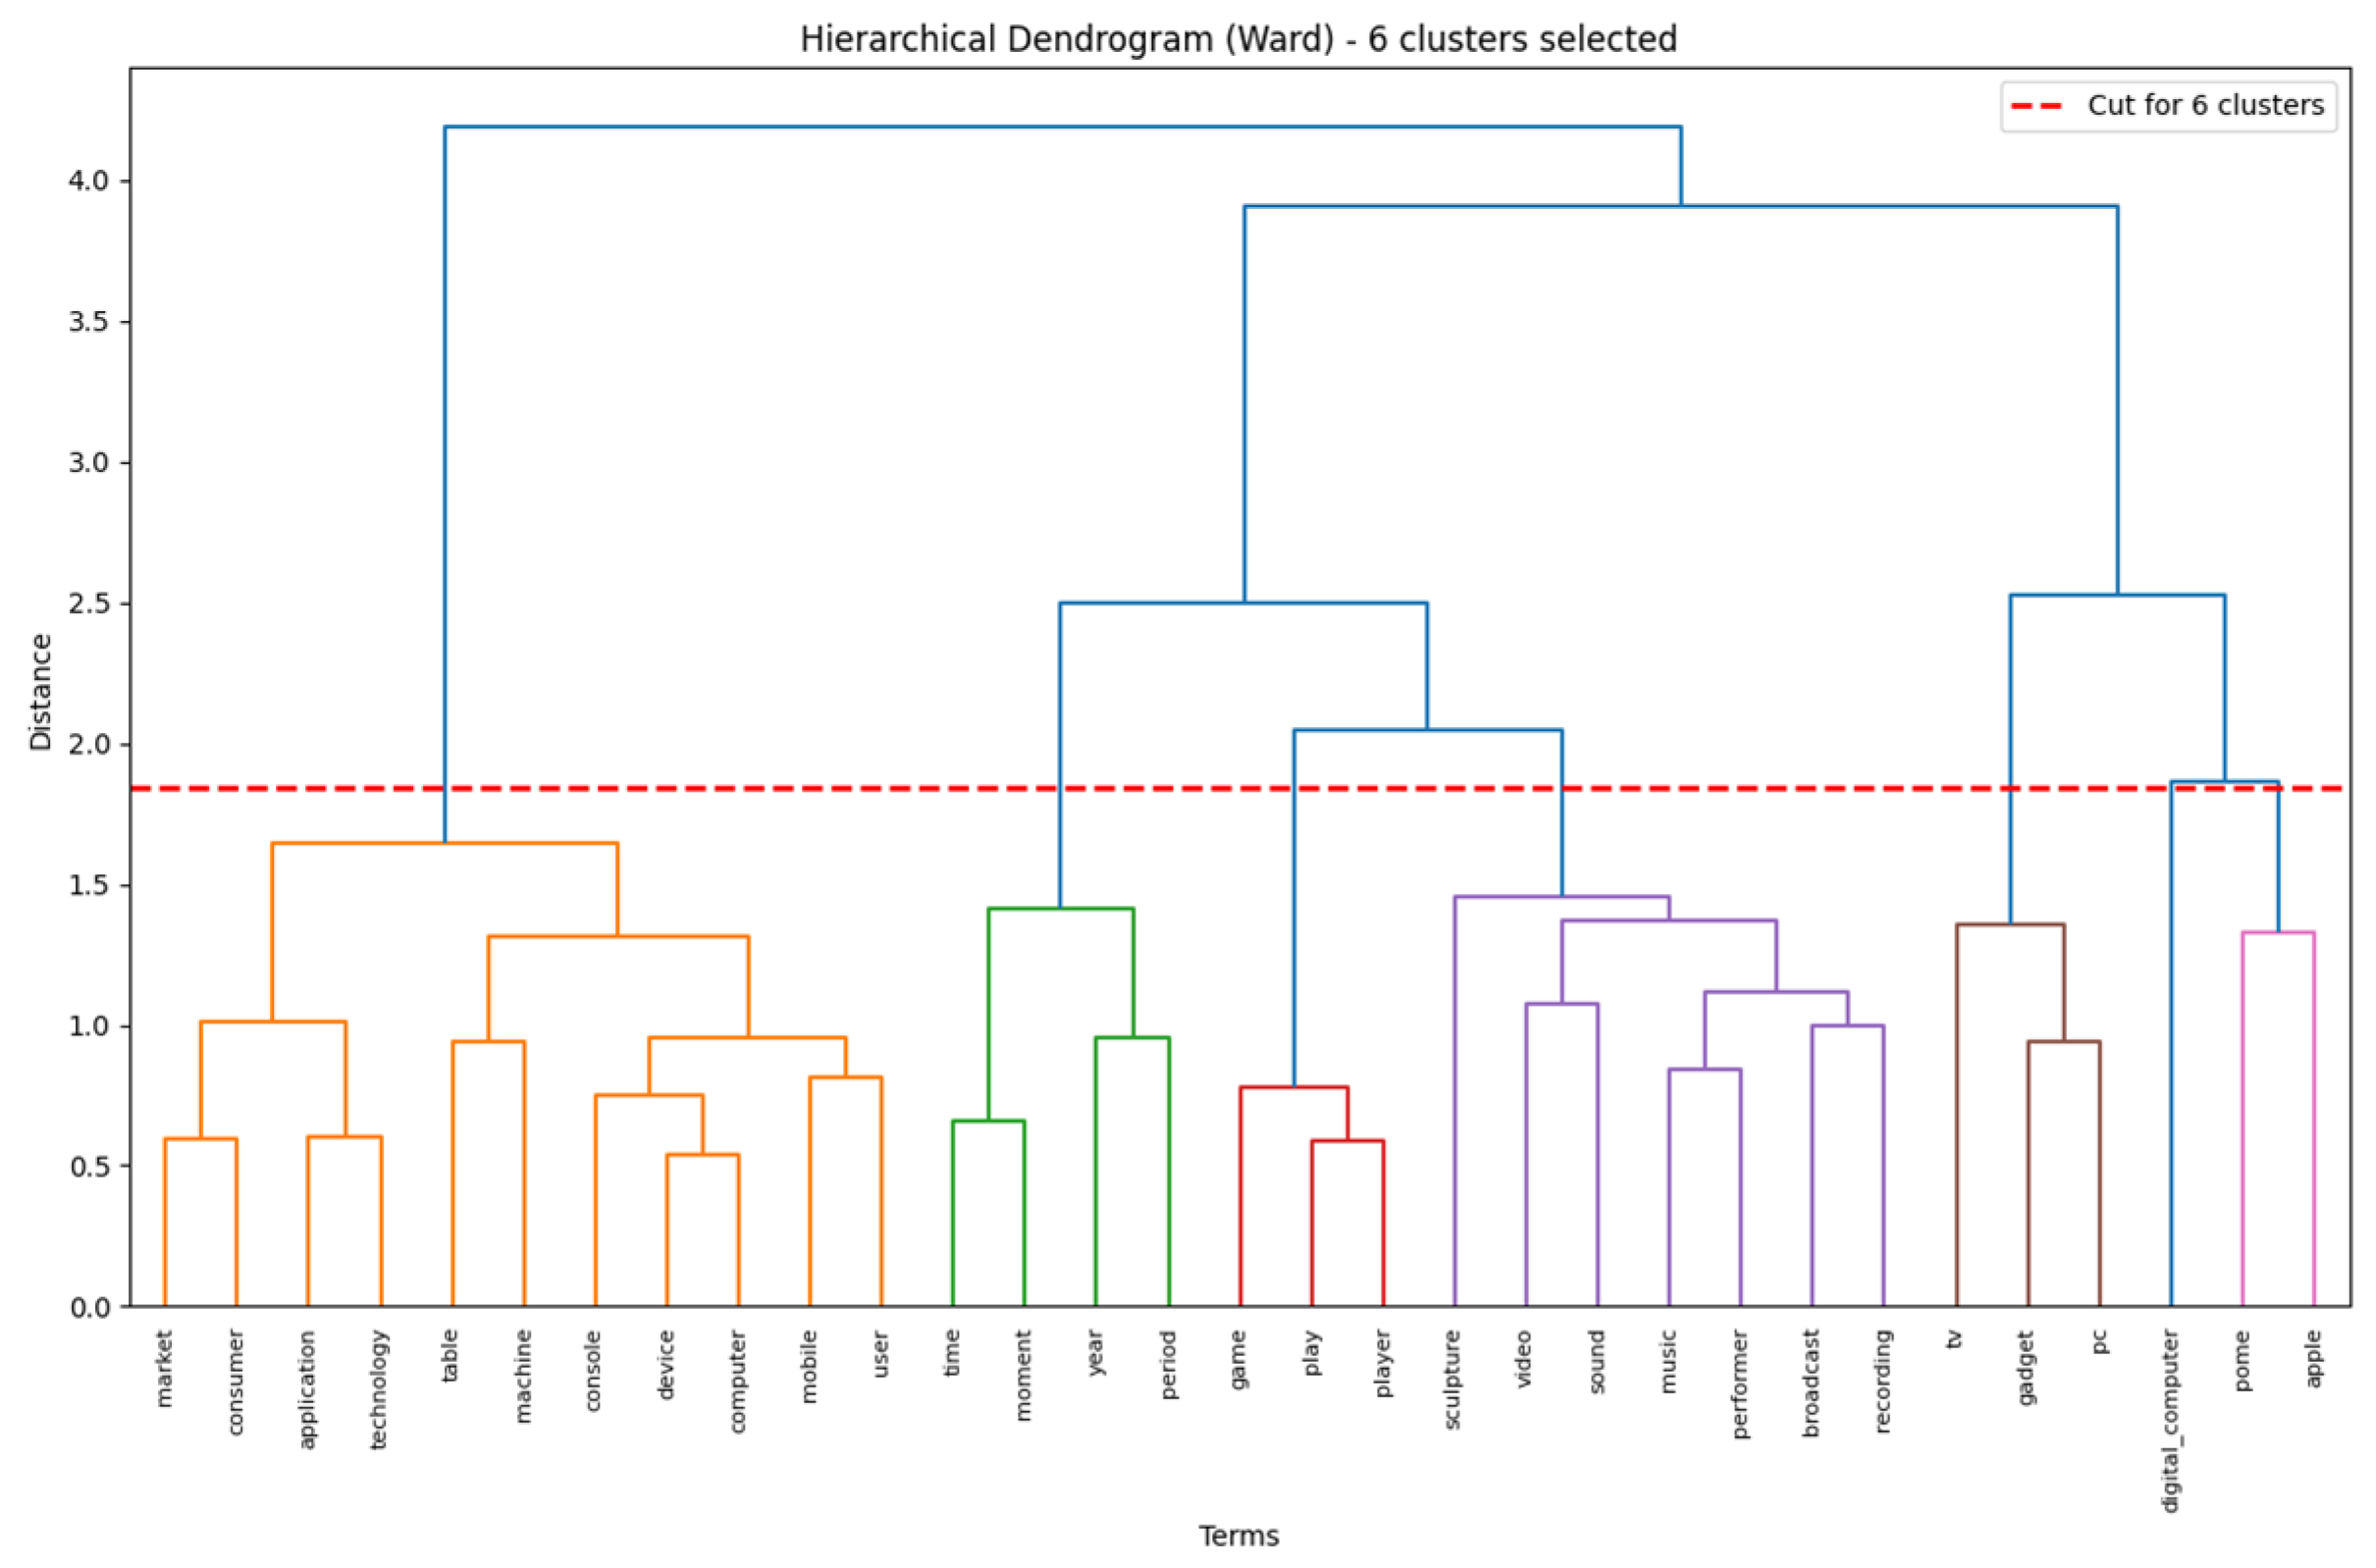
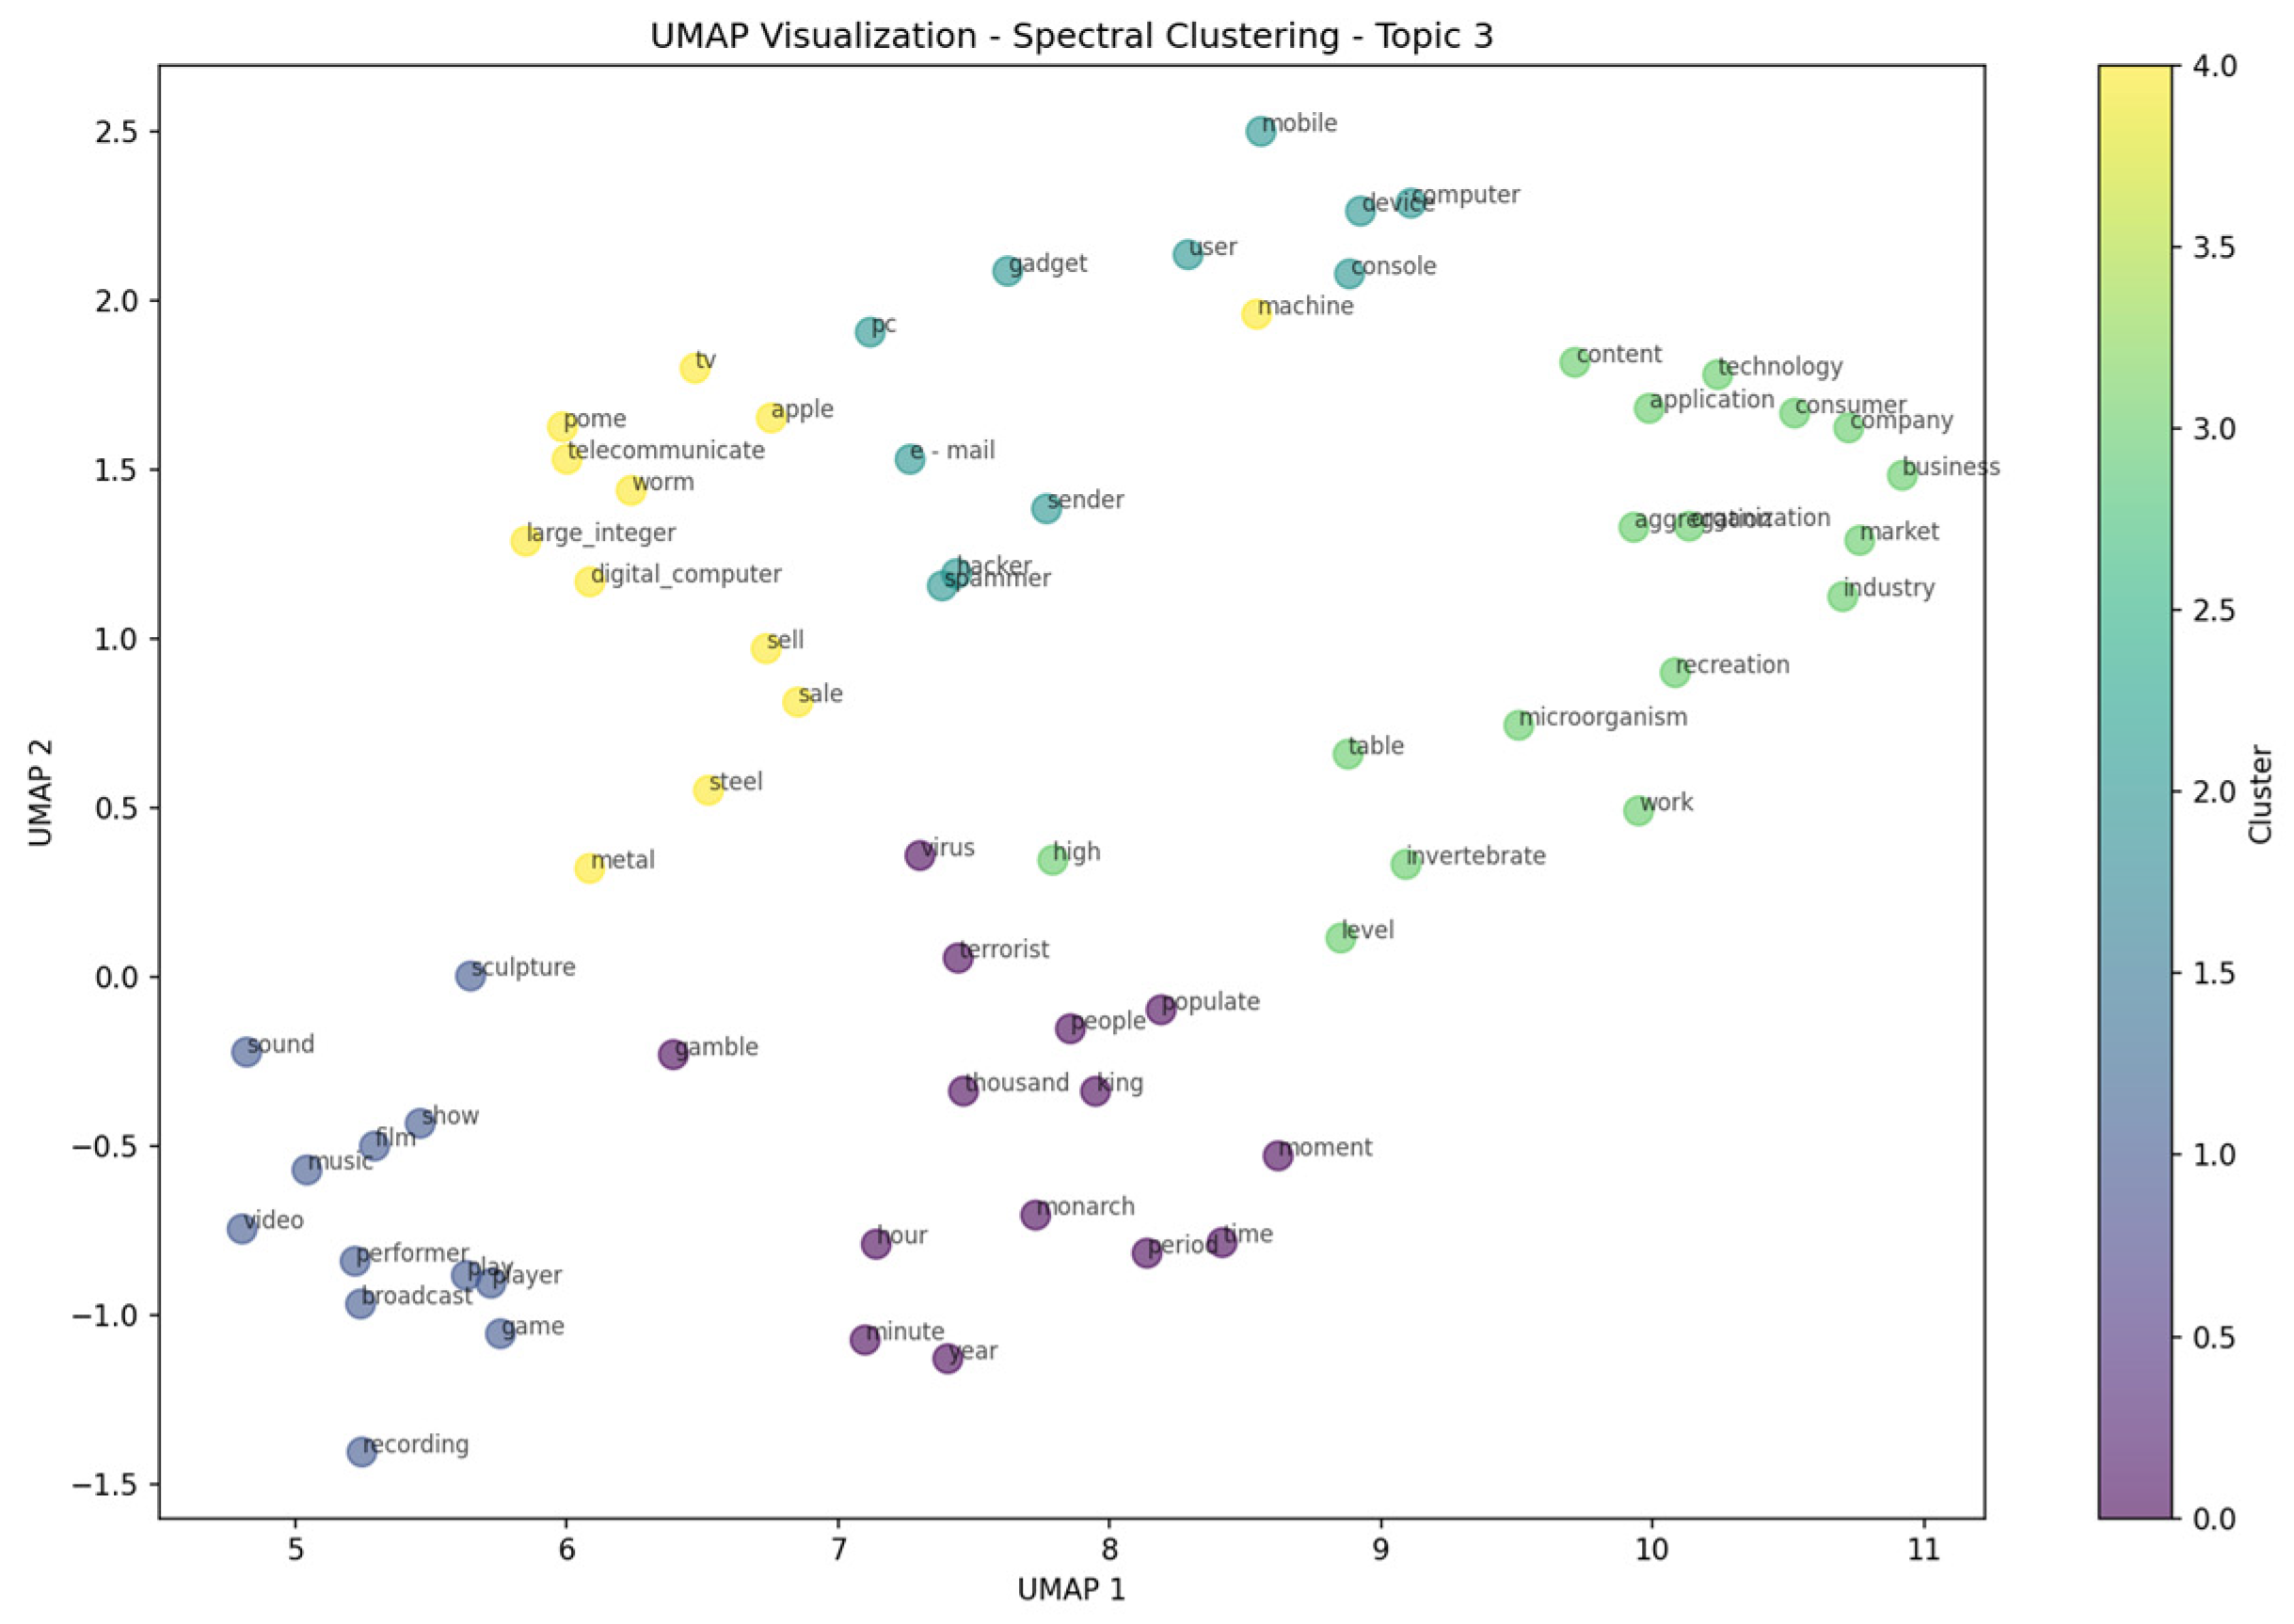
The user may interact with the system in a human-in-the-loop mode by selecting one or several vocabularies—such as the default topic terms, NER-extracted entities, or DBpedia concepts—and, if desired, by specifying the number of clusters to be extracted. This number can also be automatically determined by the Silhouette metric or adjusted manually by inspecting the Ward’s distance dendrogram. For example, in the experiments conducted, Topic 3 from the BBC dataset was analyzed using the default vocabulary and hierarchical clustering, resulting in six domains (Silhouette = 0.257). In the case of spectral clustering, an additional UMAP visualization was generated to illustrate the spatial distribution and overlap of topics in the reduced embedding space, complementing the hierarchical analysis. An example of these visualizations for Topic 3 of BBC dataset are provided in Appendix C, allowing readers to verify clustering stability and determine the appropriate number of semantic domains.
After domain identification, OBOE generates natural-language explanations for each cluster, describing the semantic relationships among the identified terms.
The automated assessment evaluates each explanation across three complementary dimensions:
  • Coherence, measuring the internal semantic consistency of terms within a cluster;
  • Relevance, indicating alignment between the explanation and the contextual domain;
  • Coverage, reflecting the degree to which the explanation represents the semantic diversity of the cluster.
Following established explainable AI evaluation practices [20,21], coherence is adopted as a proxy for human interpretability, as it reflects how understandable and semantically consistent a topic is for human readers. This approach links computational validation with subjective interpretability, providing a consistent bridge between automatic and human-centered evaluation.
Again, the evaluation framework uses an LLM-based module to generate both quantitative scores (1–5 scale) and qualitative analyses identifying the main strengths, weaknesses, and justification of each explanation. The system produces an executive report for every analyzed topic, summarizing configuration parameters, vocabulary statistics, per-cluster scores, and global results.
The complete report structure—including configuration details, evaluation summaries, and visualization outputs for the Amazon corpus—is provided in Appendix D, serving as a detailed example of the full analytical workflow applied to this dataset. As an illustration, the executive report for Topic 0 from the Amazon dataset (summarized below) includes configuration metadata, vocabulary statistics, and per-cluster evaluations. Two clusters were identified (Silhouette = 0.305), each receiving high coherence and relevance scores, confirming the interpretability of the domain explanations. Table 5 resumes this example.
Summary of LLM Evaluation Metrics
Table 6 and Table 7 present the aggregated metrics for all datasets in terms of generation and evaluation for both clustering
Overall, the results indicate that both clustering and explanation stages produce semantically coherent and interpretable topic structures. When comparing both clustering approaches, hierarchical clustering achieves marginally higher overall performance (mean = 3.78 vs. 3.74) and exhibits greater stability across datasets, whereas spectral clustering produces more compact yet slightly less interpretable topic structures. Coherence remains uniformly perfect (4.0 ± 0.0) in all cases, confirming strong semantic consistency of the explanations generated by OBOE. Relevance differences (≈+0.2 in favor of hierarchical) are compensated by minor gains in coverage for spectral methods, indicating complementary behaviors: hierarchical clustering favors stability and interpretability, while spectral clustering highlights narrower but cohesive semantic subspaces.
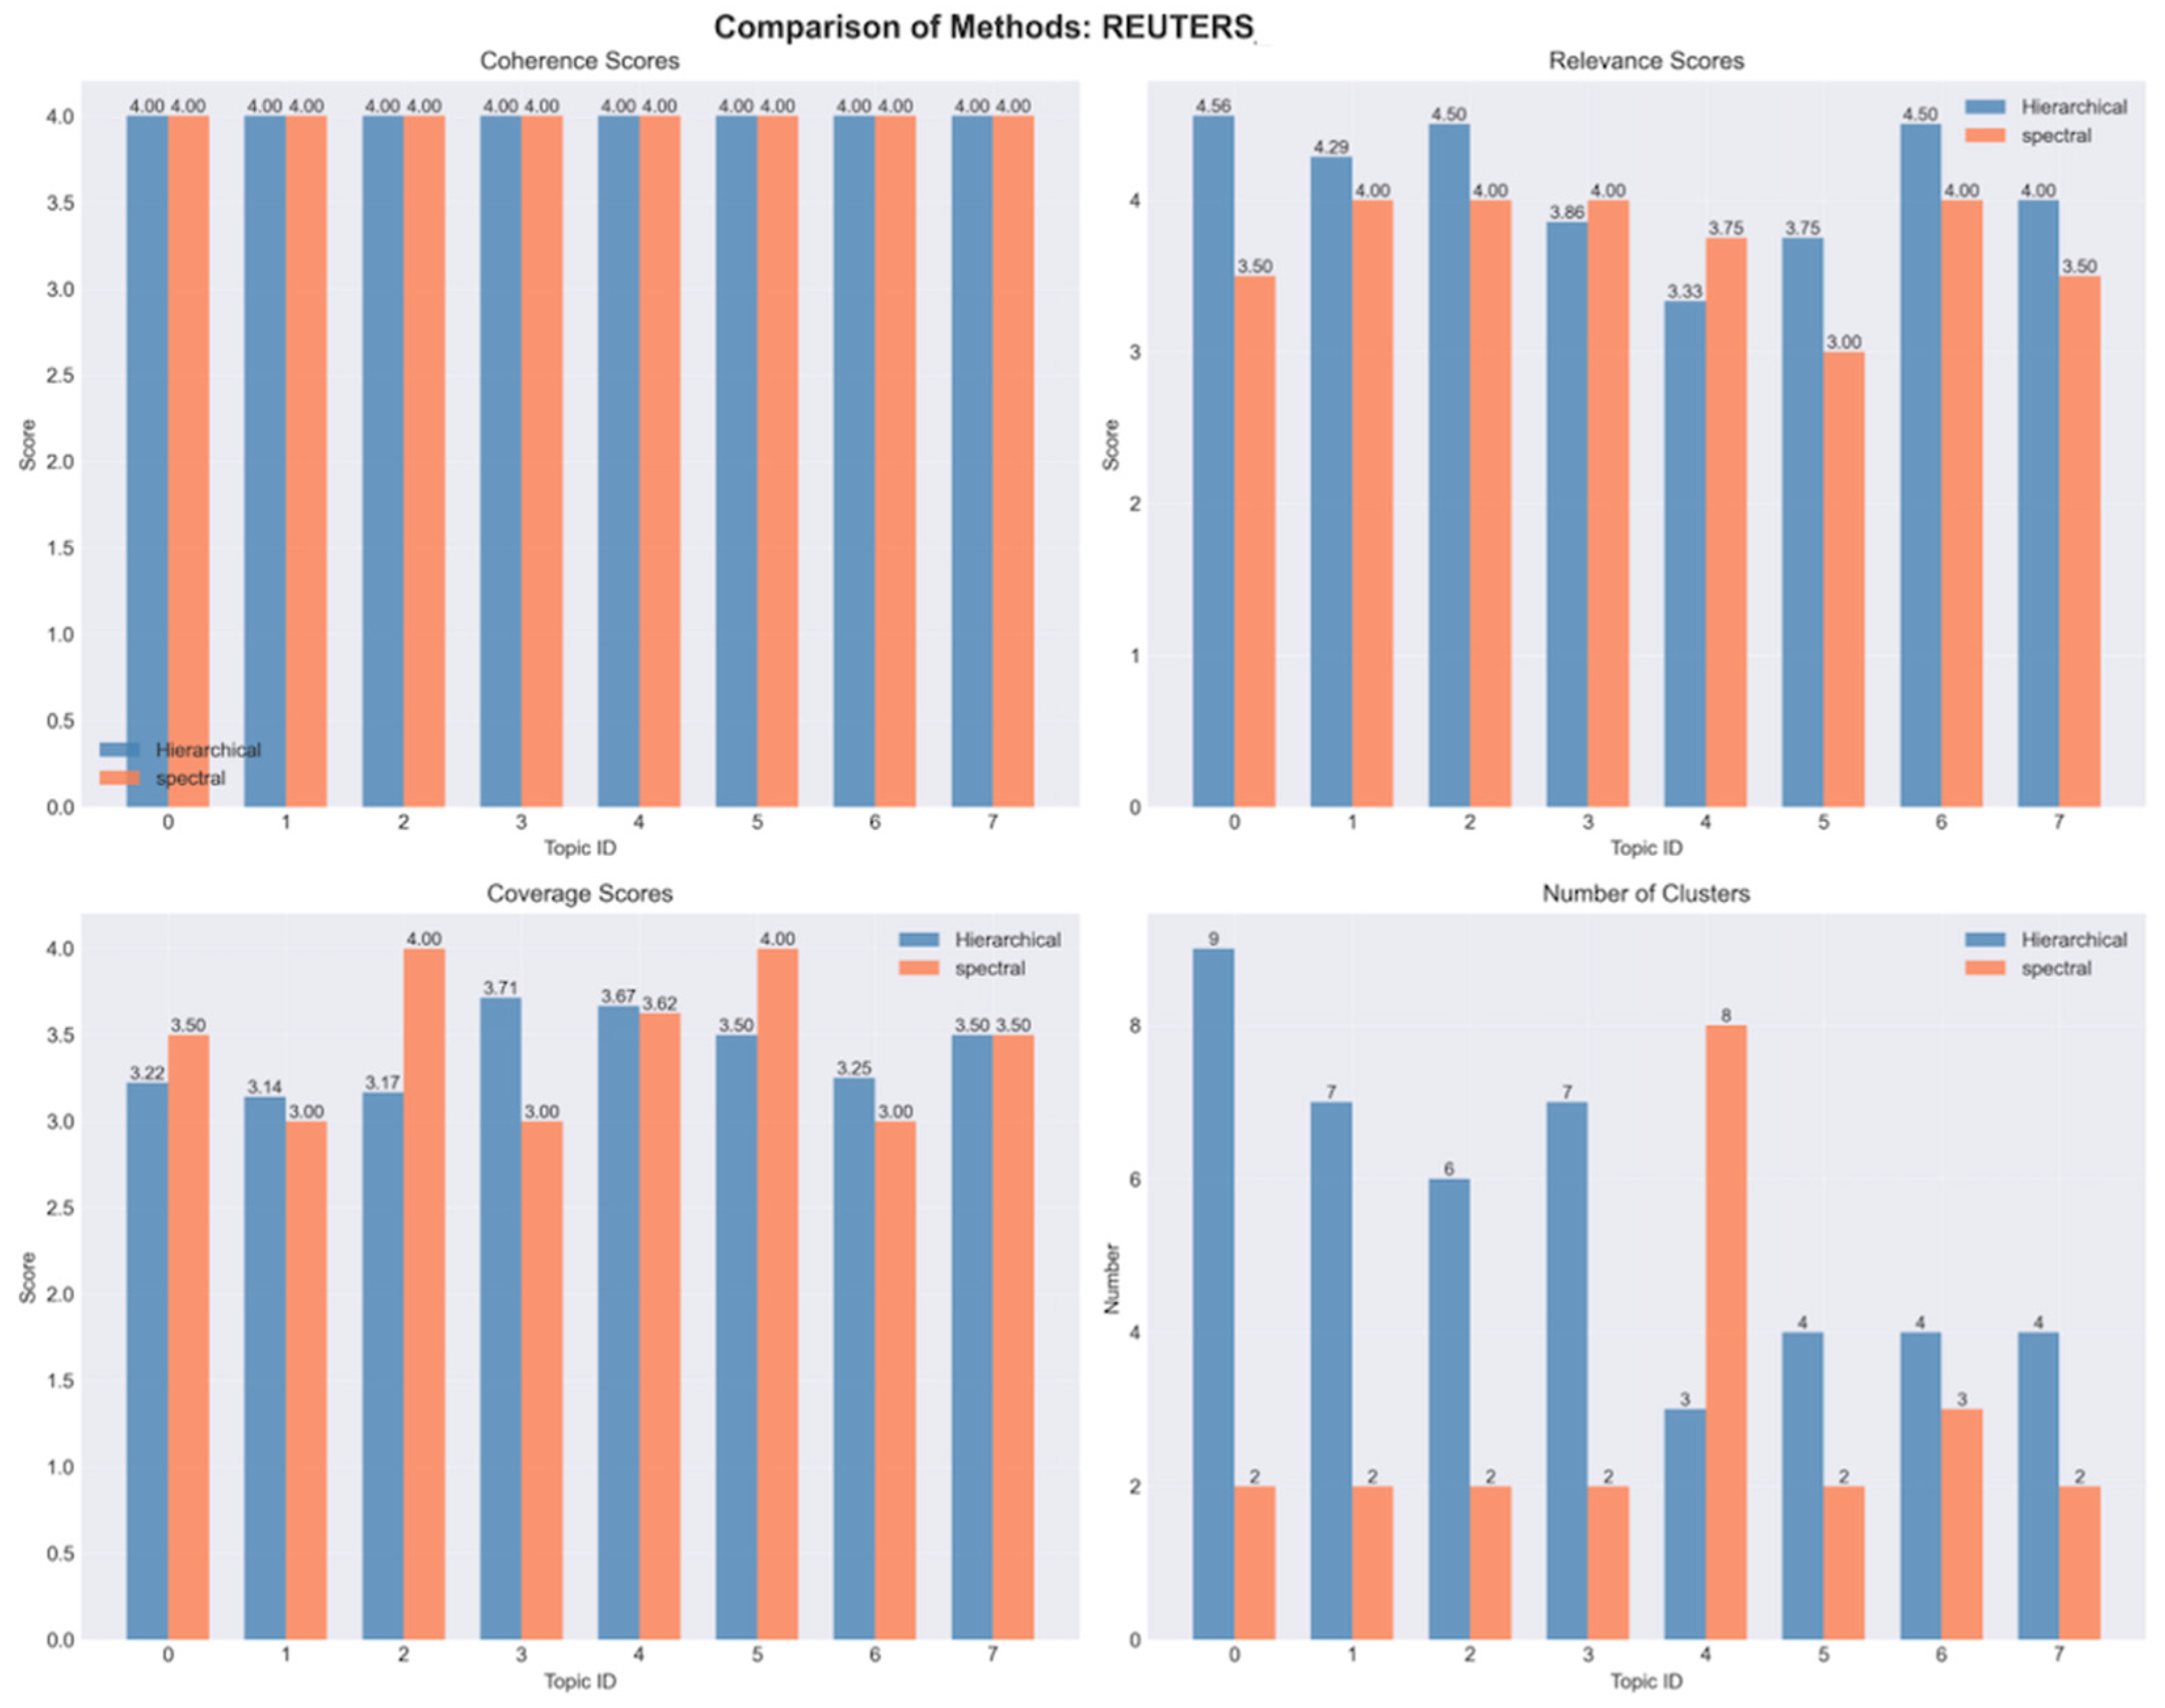
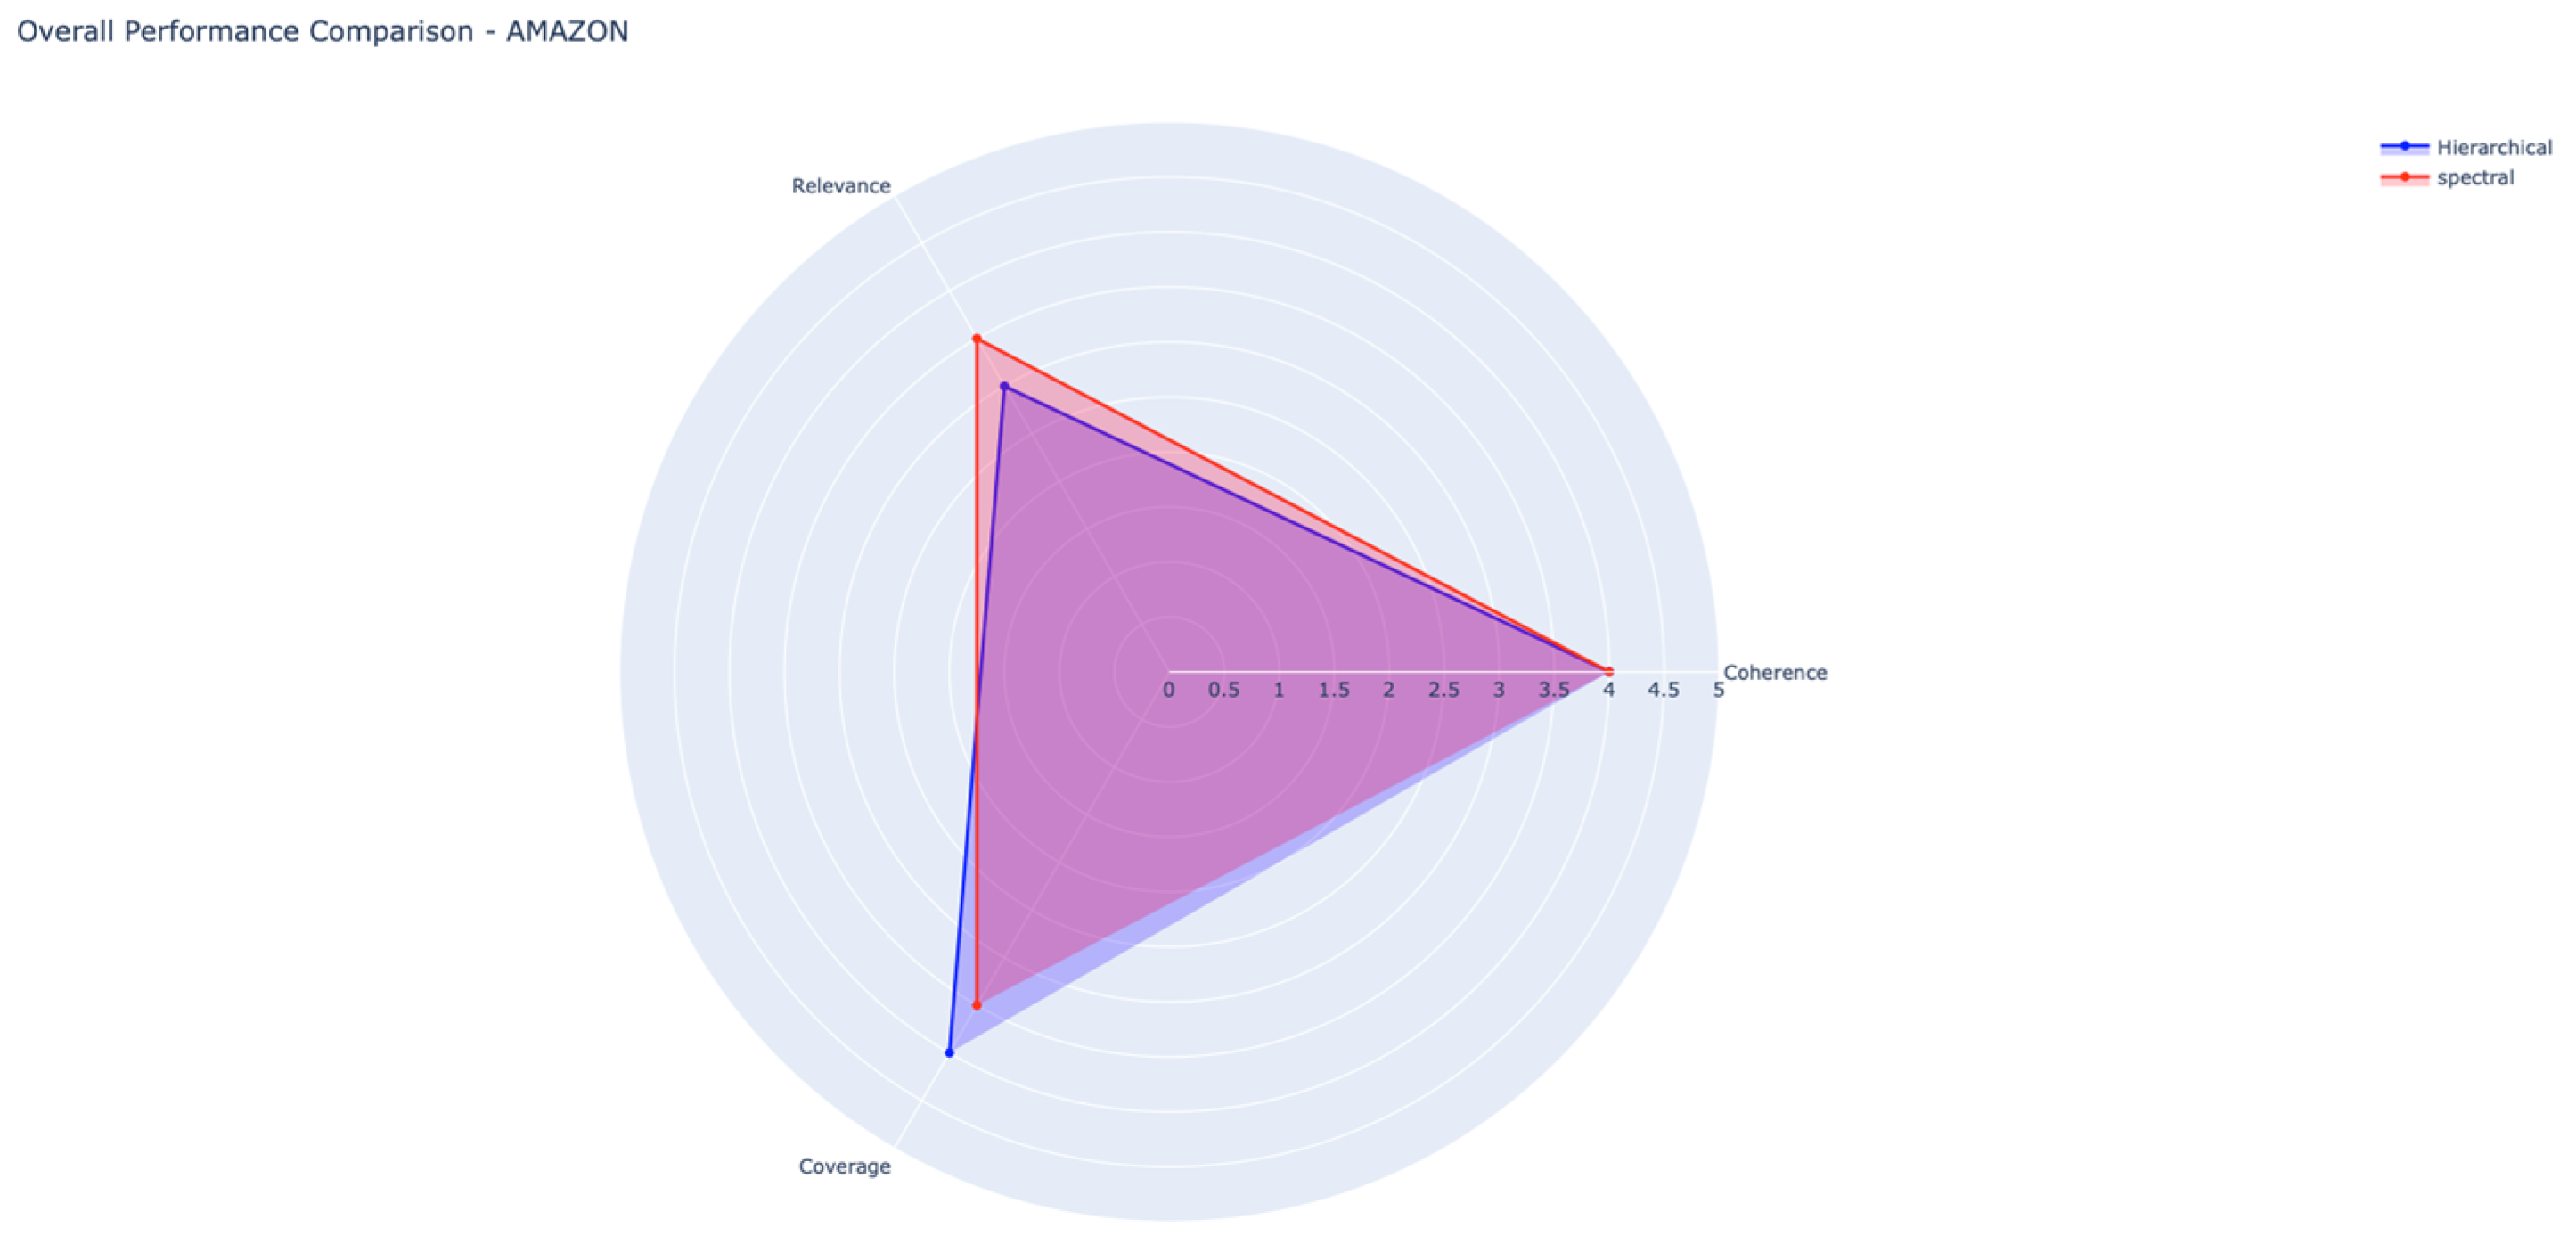
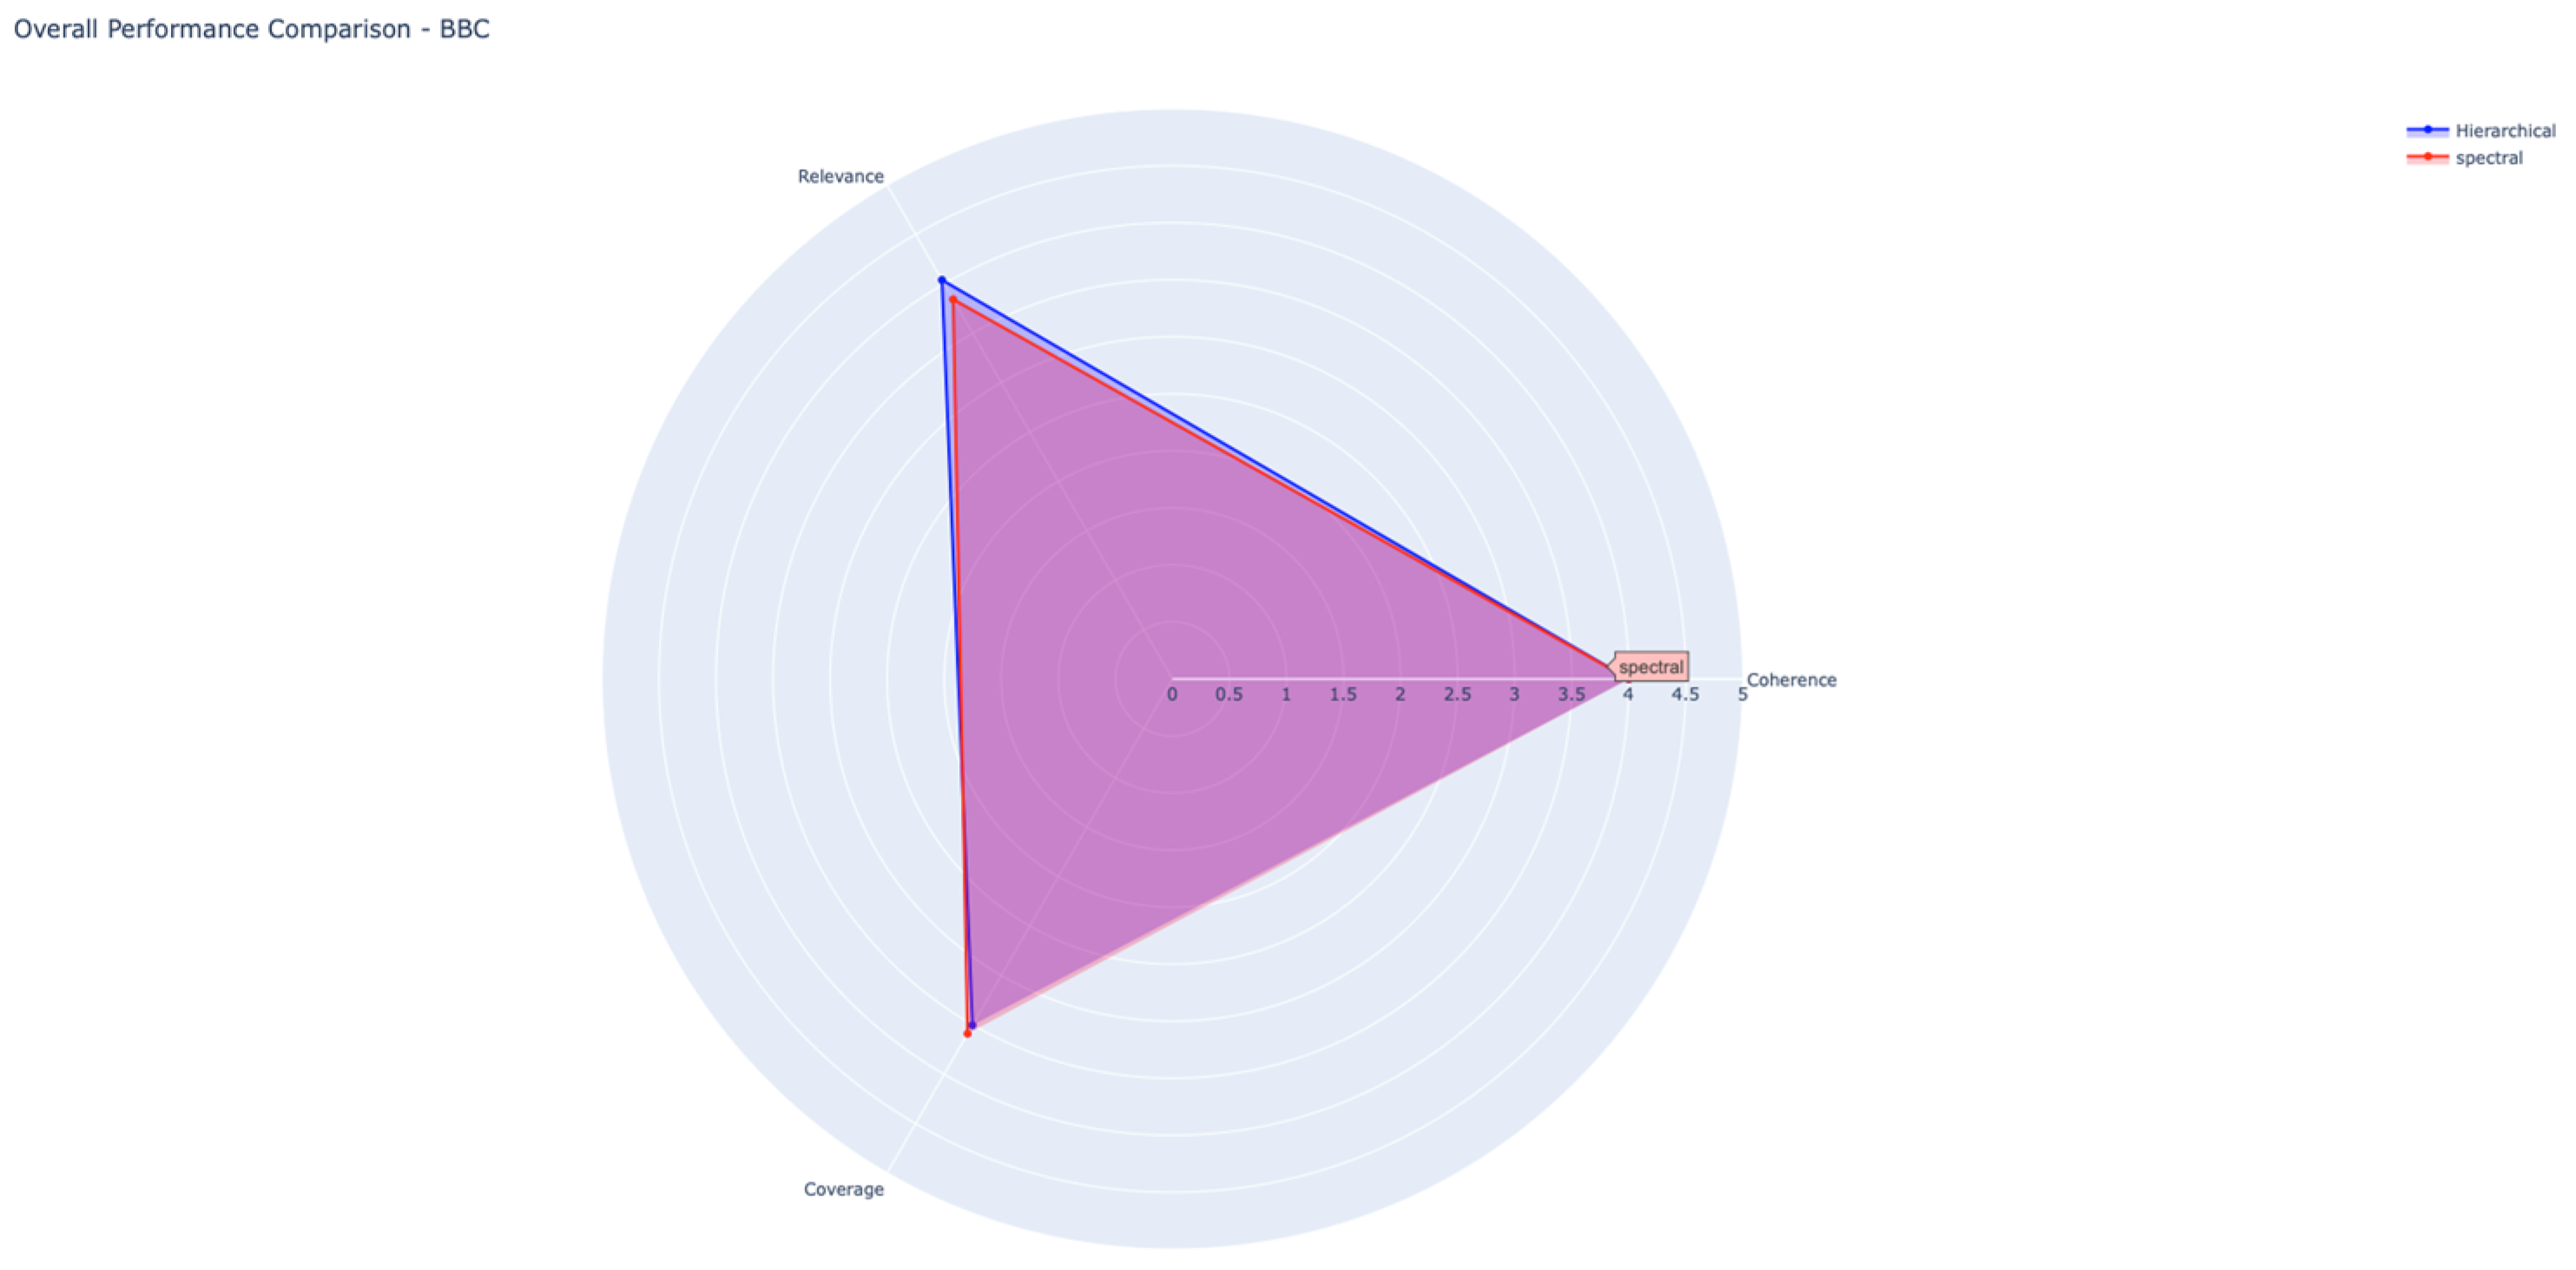
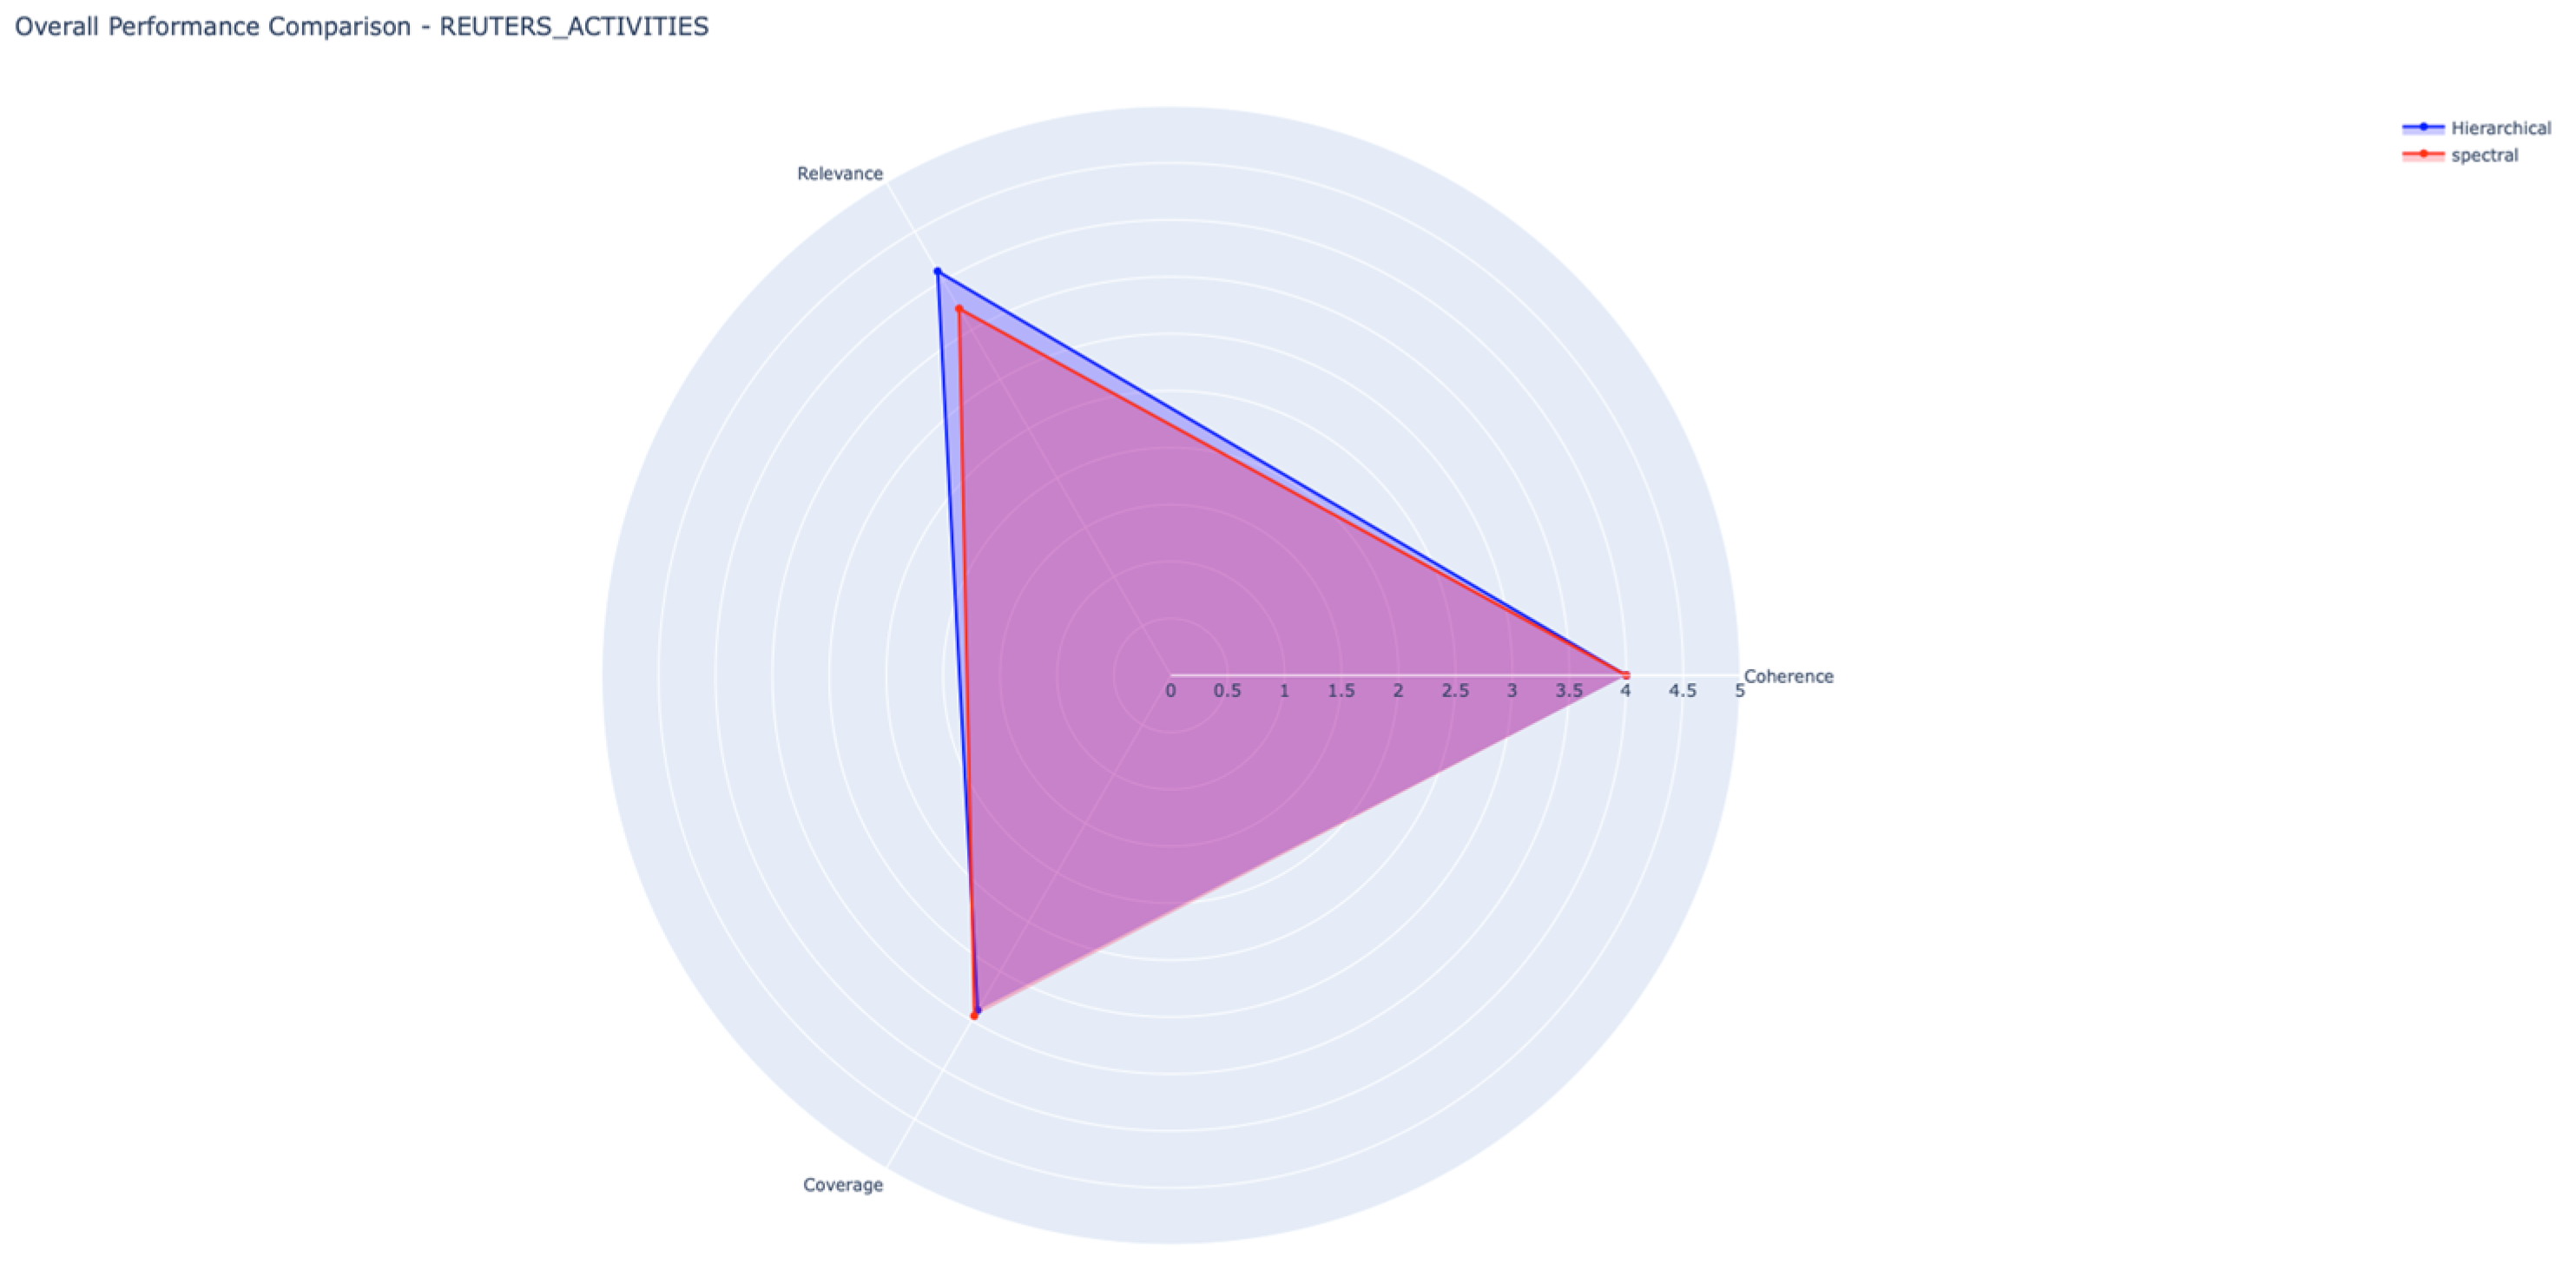
To assess the interpretability and stability of our approach across datasets and clustering types, Figure 3, Figure 4 and Figure 5 display radar charts comparing the three main evaluation metrics—coherence, relevance, and coverage—for the Reuters, BBC, and Amazon corpora. Results show consistent performance across datasets and clustering methods, with uniformly high coherence and relevance values indicating semantically well-structured topics. Minor variations in coverage, slightly higher for spectral clustering, reflect dataset- and topology-specific differences in topic distribution, confirming the model’s adaptability and balanced explanatory power across diverse textual domains. In addition, Appendix E contains a visual topic by topic comparison of number of clusters, coherence, coverage and relevance for all the corpora.

5. Discussion

This section discusses the results obtained in light of the four research questions (RQ1–RQ4) and three working hypotheses (H1–H3) formulated in Section 2.6.
The discussion is organized to explicitly link each research question and hypothesis with the empirical findings presented in Section 4 and to highlight their theoretical and methodological implications.

5.1. RQ1/H1—Coherence and Interpretability of Semantic Domains

RQ1. 
To what extent can hierarchical clustering over concept-map-derived knowledge graphs reveal coherent and interpretable semantic domains within a broader conceptual domain?
H1. 
Explainable domain discovery over concept-map-derived knowledge graphs can reveal coherent and interpretable semantic domains.
The results in Section 4.3.1 show that the proposed domain identification step produced clusters with Silhouette coefficients between 0.257 and 0.305. For graph- or topic-based semantic grouping over medium-sized corpora (2.5–3 K documents), such values are consistent with what has been reported for topic coherence and cluster validation in prior work [69,70,71]. In other words, the structure learned by the clustering algorithm is not random, and there is evidence of meaningful separation between semantic domains within the topic-level knowledge graphs.
This structural signal is reinforced by the qualitative content of the clusters: in Amazon, one cluster aggregated pet-related entities, while another grouped quality/usage-related terms; in BBC, clusters captured technology/device terms, media-related terms, and temporal terms. These are categories that are easy to interpret by a human subject-matter expert, which is a central requirement in XAI settings [2,3].
Therefore, these results support and validate H1, confirming that the explainable domain discovery process yields coherent and interpretable semantic domains.

5.2. RQ2/H2—Natural-Language Explanation Generation via LLMs

RQ2. 
How effectively can Large Language Models generate coherent and comprehensible natural-language explanations of these hierarchically identified semantic domains?
H2. 
Large Language Models can provide meaningful, verifiable natural-language explanations of these domains when guided by structured prompting and verification mechanisms.
The explanation component yielded very stable scores across the three corpora (Table 6), with a global mean for two clustering methods on terms of coherence, relevance and coverage of 4.000 ± 0.0, 3.80 ± 0.3, 3.57 ± 0.2, respectively.
These numbers show three things:
  • Coherence is consistently high (4.0) across datasets. This is exactly what we would expect when explanations are grounded in an already clustered, semantically filtered vocabulary.
  • Relevance and coverage vary with the domain and clustering algorithm. Across datasets, topic coherence remained at its maximum level (4.0 ± 0.0), indicating that the embeddings encode well-defined conceptual spaces.
Hierarchical clustering achieved slightly higher relevance (≈3.8–4.1) and overall stability, whereas spectral clustering obtained marginally higher coverage (≈3.5–3.6) by producing more compact and locally connected clusters.
This pattern is compatible with the evaluation approach advocated by the QualIT work ([19]) and with the need for explicit, multi-dimensional evaluation of explanations emphasized in the XAI evaluation review by Nauta et al. [20]: both argue for (i) structured criteria and (ii) human-aligned scales.
Given that all explanations were produced under a constrained, multi-prompt strategy (key-phrase extraction → verification → synthesis) and that they reached values around 4/5 in coherence for every dataset, H2 is supported: with structured prompting and verification, LLMs can deliver explanations that are both readable and tied to the underlying semantic clusters, in line with recent LLM-for-XAI surveys [16,17].

5.3. RQ3/H3—Mitigating Semantic Inaccuracies Through Symbolic–Statistical Integration

RQ3. 
To what extent can structured prompting and verification mechanisms mitigate semantic inaccuracies or hallucinations in LLM-generated explanations?
H3. 
Combining symbolic and statistical representations enhances both the transparency and the interpretability of knowledge organization systems.
In the proposed pipeline, the LLM never generates explanations “from scratch”: it is always fed (i) cluster terms extracted from the KG, (ii) topic context, and (iii) a verification step inspired by QualIT. This is consistent with the trend identified in surveys on LLMs and XAI, where LLMs are used within guarded, template-like, or verifier-in-the-loop procedures to reduce hallucinations [17,20,30]. In our experiments, all reported explanations passed verification, and no fabricated entities were reported.
This is precisely the effect H3 anticipates: because the symbolic layer (triples, DBpedia, WordNet) constrains what can be said, and the statistical/LLM layer only verbalizes and rates it, transparency is improved over purely neural pipelines such as those reviewed in [25,26,30]. Therefore, H3 is validated.

5.4. RQ4—Scalable and Reliable Evaluation of Explanations

RQ4. 
How can LLM-assisted evaluation methods provide scalable and reliable assessments of explanation quality across multiple domains?
The adoption of LLM-assisted evaluation through the QualIT-aligned framework proved to be a scalable and reliable alternative to traditional human judgment.
As shown in Table 6, for hierarchical clustering, coherence remained uniformly high (4.0 ± 0.0) across all datasets, with relevance ranging between 3.0 and 4.1 (mean = 3.78) and coverage between 3.4 and 4.0 (mean = 3.63). For spectral clustering, coherence also stayed constant (4.0 ± 0.0), while relevance varied between 3.5 and 3.8 (mean = 3.69) and coverage between 3.45 and 3.59 (mean = 3.51).
These results indicate high inter-domain consistency and support the feasibility of LLM-based evaluation as a scalable proxy for human judgment.
This automation enables large-scale benchmarking of explanation quality without the cost and inconsistency of human annotators. Therefore, RQ4 is answered affirmatively: LLM-assisted evaluation yields consistent, scalable, and human-aligned assessments of explanation quality across heterogeneous knowledge domains.

5.5. Integrated Discussion and Theoretical Implications

Taken together, the results across all research questions show that the OBOE framework successfully fulfills its primary objective: to extend explainability beyond model prediction toward the structure and organization of knowledge. The evidence demonstrates that:
  • Hierarchical and Spectral clustering produces semantically meaningful domains (RQ1/H1).
  • LLM-based NLG modules generate coherent and verifiable explanations (RQ2/H2).
  • Symbolic–statistical integration mitigates hallucination and ensures factual grounding (RQ3/H3).
  • LLM-based evaluation provides scalable and consistent assessments (RQ4).
These findings establish OBOE as a hybrid, multi-stage XAI architecture where each component contributes complementary interpretability functions.
The results empirically validate the concept of progressive semantic refinement, whereby structural interpretability at earlier stages enables fluent, faithful explanations at the output stage.
From a theoretical standpoint, this work broadens the scope of XAI research by demonstrating that interpretability principles can be applied not only to predictive decisions but also to the discovery and explanation of semantic structures. Thus, explainability is applied not only to predictions (the classic NLP/XAI target) but to the organization of knowledge extracted from text—which is consistent with the direction of works on concept maps and ontology induction from text [10,11,15,16,36,37,38,39]. That is what justifies presenting OBOE as a framework for “knowledge organization transparency”. Practically, the proposed architecture provides a robust foundation for knowledge-intensive domains with limited corpora (such as education, medical reporting, or compliance and in contrast to big data scenarios in which the amount of documents is massive) where transparency in knowledge organization is critical.

5.6. Evaluation Metrics and Corpus Size Considerations

The joint analysis of the classification results (Table 3), the topic generation metrics, and the LLM-based evaluation (Table 5 and Table 6) reveals a coherent relationship between predictive accuracy, structural quality, and semantic interpretability.
The high classification performance obtained with XGBoost (accuracy ≈ 0.88–0.90, AUC > 0.96) demonstrates that TransE embeddings encode discriminative relations that remain effective even when visual separability in UMAP projections is low.
This latent structure is consistently reflected in the clustering stage, where both hierarchical and spectral methods achieved perfect coherence (4.0 ± 0.0), confirming that the embeddings preserve strong internal consistency across corpora.
The slightly higher relevance obtained with hierarchical clustering aligns with the superior generalization of the classifier, suggesting that this method produces topic structures that better capture the semantic dimensions exploited during supervised learning.
These results demonstrate that partial decoupling between intermediate coherence and final interpretability allows moderate corpora to yield meaningful explanations when supported by multi-stage semantic refinement.

5.7. Design Implications for Multi-Stage XAI Systems

The results of this research yield several insights for the design and evaluation of complex XAI systems:
  • Stage-appropriate metrics are essential. Intermediate components (topic modeling, clustering) should be evaluated using computational measures (coherence, silhouette), whereas final explanations require human-aligned metrics.
  • Architectural decoupling enhances both discriminative performance and interpretability by allowing independent optimization of structure and language generation.
  • Progressive refinement demonstrates that moderate intermediate metrics can still yield high interpretability at the output level.
  • Scalability: OBOE supports effective explainable classification with moderate-sized corpora, a practical advantage for resource-limited applications.

5.8. Knowledge Discovery Potential

Beyond interpretability, OBOE exhibits potential for semantic knowledge discovery. By clustering and explaining semantically related entities, the framework reveals latent conceptual structures and emergent semantic domains, enabling ontology enrichment and exploratory analysis.
This capability positions OBOE not merely as an explainability tool but as a knowledge discovery assistant bridging symbolic AI and generative reasoning.

5.9. Robustness to Topic-Level Characteristics

To evaluate the robustness of OBOE explanations under varying topic-level characteristics, we conducted a correlation-based analysis across 17 topics and 92 clusters (derived from hierarchical clustering) from the three corpora (Amazon, BBC and Reuters).
Four structural indicators—topic-document entropy, topic concentration, cluster overlap, and topic granularity—were analyzed in relation to explanation quality metrics (coherence, relevance, coverage).
  • Topic granularity emerged as the most influential factor (Spearman ρ = 0.760, p < 0.001, 95% CI [0.42, 0.91]). Topics with finer-grained semantic domain differentiation (8–13 clusters) achieved higher explanation quality (M = 4.05) compared to coarse-grained ones (2–3 clusters, M = 3.67), representing an 11% improvement.
This confirms that explanation richness scales with the number and diversity of semantic domains.
2.
Cluster overlap (mean Jaccard similarity = 0.012 ± 0.015) exhibited a relevance–coverage trade-off: overlap positively correlated with relevance (ρ = 0.665, p = 0.004) but negatively with coverage (ρ = −0.565, p = 0.018).
Hence, overlapping vocabularies enhance topical focus but may narrow explanatory breadth.
3.
Topic entropy and topic concentration had negligible effects (ρ < 0.1), suggesting that explanation quality is driven primarily by structural rather than distributional properties. Despite moderate noise in entity extraction (≈42% singleton entities), knowledge-graph embeddings and vocabulary-level aggregation effectively mitigated its impact.
Overall, the robustness analysis confirms that OBOE explanations remain structurally stable and semantically coherent, even under varying topic dispersion or entity noise.
Explanation quality is governed by internal graph structure—particularly semantic domains differentiation—rather than superficial corpus characteristics.

5.10. Limitations and Future Directions

Although promising, several limitations must be acknowledged:
  • Mixed-topic clusters: automatic clustering occasionally produced heterogeneous groups, requiring user refinement.
  • Metric reliance: while coherence and silhouette are useful, they may not capture all dimensions of explanation quality.
  • Computational constraints: Although OBOE has incorporated language models in its workflow, limited computational capacity has prevented the exploration of scenarios in which fine-tuning such models could have further enhanced the framework—for instance, in the generation of triples or in the retrieval of context-adapted explanations or coherence variance across embeddings libraries. Nevertheless, as will be discussed in the following section, this represents a promising direction for future work.
Future work should explore:
  • Deeper integration of semantic resources (DBpedia, WordNet) to enhance hybrid explanations.
  • Extending QualIT-based evaluation to systematically combine human feedback with metric-based results.
  • Explore standardized protocols for evaluating multi-stage XAI systems, ensuring metrics align with the architectural layer and objective being assessed
  • Integration with Retrieval-Augmented Generation (RAG) to incorporate external, dynamically updated knowledge sources into the explanation process. This would extend OBOE’s capabilities beyond static corpora, enabling richer semantic coverage, real-time adaptation, and enhanced support for knowledge discovery.
  • The use of fine-tuned language models would enable the framework to integrate context-specific explanations and enriched triples, thereby enhancing both adaptability and interpretability across diverse domains.

6. Conclusions

This research studied how to solve the task of explainable classification and domain discovery in text-derived knowledge graphs: a new XAI paradigm beyond traditional supervised classification explanations. The results confirm the suitability of this approach for integrating graph-based representations, unsupervised structure detection, and natural-language generation within a coherent explainability pipeline.
By aligning traditional graph-embedding and clustering techniques with LLM-driven explanation mechanisms, this adaptation demonstrates that interpretable domain structures can be automatically identified and described in natural language with high semantic fidelity.
The main outcomes can be summarized as follows:
  • Exploratory potential: The clustering and explanation modules revealed latent semantic domains and conceptual relations within corpora, highlighting the framework’s capacity for both interpretability and knowledge exploration.
  • Hybrid analytical workflow: The combination of graph embeddings (TransE), hierarchical and spectral clustering, and LLM-based explanation generation produced robust, interpretable, and human-readable results.
  • Quantitative and qualitative validation: The integration of performance metrics (MacroAUC > 0.96, Mean Per Class Error ≤ 0.2, LogLoss ≈ 0.4) with explanation metrics (Coherence = 4.0, Relevance ≈ 3.9, Coverage ≈ 3.5) ensured a multi-level and consistent evaluation of interpretability.
  • Cross-domain stability: Comparable results across the Reuters, BBC, and Amazon corpora indicate that the approach generalizes well, with minimal variance (≤0.3) in LLM-based evaluation scores.
  • Complementary clustering behavior: Hierarchical clustering generated more relevant and interpretable topic structures, while spectral clustering offered broader coverage—together reinforcing the semantic coherence of the embedding space.
  • Scalable explanation evaluation: The use of QualIT-aligned LLM evaluation (Prompt A.4) proved to be a reliable proxy for human judgment, enabling systematic benchmarking of explanation quality across domains.
In summary, this research demonstrates that explainable classification and domain discovery in knowledge graphs can be effectively achieved through the integration of symbolic, statistical, and generative components.
The proposed workflow provides a replicable model for hybrid XAI pipelines, capable of maintaining coherence and interpretability across diverse textual domains while enabling large-scale, automated evaluation of explanation quality. Indeed, our findings position OBOE as a bridge between traditional XAI and LLM-driven semantic reasoning, paving the way for interpretable, hybrid AI systems.

Author Contributions

Conceptualization, R.A.d.Á.E.; methodology, R.A.d.Á.E., M.d.C.S.-F. and M.F.L.; software, R.A.d.Á.E.; validation, R.A.d.Á.E.; investigation, R.A.d.Á.E. and B.V.T.; writing—original draft preparation, R.A.d.Á.E. and B.V.T.; writing—review and editing, R.A.d.Á.E., M.d.C.S.-F., M.F.L. and B.V.T.; supervision, M.d.C.S.-F. All authors have read and agreed to the published version of the manuscript.

Funding

This research received no external funding.

Data Availability Statement

Data can be downloaded from https://github.com/rdelaguila/sem_oboe.git, accessed 20 October 2025.

Conflicts of Interest

The authors declare no conflicts of interest.

Abbreviations

The following abbreviations are used in this manuscript:
CMConcept Map
KGKnowledge Graph
KGEKnowledge Graph Embedding
LDALatent Dirichlet Allocation
LLMLarge Language Models
NERName Entity Recognition
NLGNatural Language Generation
NLPNatural Language Processing
XAIeXplainable Artificial Intelligence
XGBeXtreme Gradient Boosting

Appendix A

Appendix A.1. Key Phrase Extraction Prompt

You are an expert in topic modeling and semantic analysis.
 
TASK: Extract 2-3 key phrases that best represent the semantic relationship between these terms.
TERMS: {clustered terms comma separated}
 
CONTEXT: These terms belong to topic {topic_id} (technology domain)
CLUSTERING QUALITY: Silhouette score = {silhouette_score}
INSTRUCTIONS:
1. Identify the most important semantic connections
2. Extract concise key phrases (2-4 words each)3. Focus on domain-specific relationships

Appendix A.2. Semantic Verification Prompt

VERIFICATION TASK: Check if these key phrases accurately represent the given terms.
 
TERMS: {separated terms}
EXTRACTED KEY PHRASES: {key_phrases_text}
 
VERIFICATION CRITERIA:
1. Do the key phrases accurately reflect the semantic relationships?
2. Are they relevant to the technology domain?
3. Do they avoid hallucinated connections?
 
VERIFICATION RESULT (True/False):

Appendix A.3. Explanation Synthesis Prompt

You are an expert in explainable AI and topic modeling. Generate a comprehensive explanation.
 
CLUSTER ANALYSIS:
- Cluster ID: {topic_id}-{cluster_id}
- Terms: {separated terms)}
- Key Phrases: {key_phrases_text}
- Verification Status: {‘Verified’ if is_verified else ‘Needs revision’}
- Clustering Quality: {silhouette_score:.3f}
 
EXPLANATION FRAMEWORK (following XAI best practices):
1. SEMANTIC COHERENCE: What conceptual theme unifies these terms?
2. DOMAIN RELEVANCE: How do these terms relate to the technology domain?
3. CLUSTERING JUSTIFICATION: Why does this grouping make computational sense?
 
Generate a JSON response with the following structure:
{
    “explanation”: “Clear, concise explanation of the cluster’s semantic unity”,
    “coherence”: [1-5 score],
    “relevance”: [1-5 score],
    “coverage”: [1-5 score],
     “key_phrases”: [list of verified key phrases],
    “reasoning”: “Brief justification for the scores”
}
JSON Response:

Appendix A.4. Explanation Evaluator

You are an expert evaluator of AI explanations. Evaluate this cluster explanation using XAI criteria.
CLUSTER INFORMATION:
- ID: {topic_id}-{cluster_id}
- Terms: {‘, ’.join(terms)}
- Explanation: “{explanation.get(‘explicación’, ‘’)}”
- Generated Key Phrases: {explanation.get(‘key_phrases’, [])}
EVALUATION CRITERIA (score 1-5):
COHERENCE (Semantic Coherence):
- Are the terms semantically related?
- Does the explanation capture their unity?
- Is the clustering logically sound?
RELEVANCE (Domain Relevance):
- How relevant are these terms to the technology domain?
- Does the explanation connect to the broader topic context?
- Are domain-specific relationships identified?
COVERAGE (Coverage Completeness):
- Does the explanation cover the main aspects of the cluster?
- Are key semantic relationships addressed?
- Is the scope appropriate for the term set?
PROVIDE EVALUATION as JSON:{
    “coherence”: [1-5],
    “relevance”: [1-5],
    “coverage”: [1-5],
    “justification”: “2-sentence explanation of scores”,
    “strengths”: [“strength1”, “strength2”],
    “weaknesses”: [“weakness1”, “weakness2”]
}
JSON Evaluation:

Appendix B

Appendix B.1. Classification Metrics Comparison

Table A1. Detailed Comparison of Downstream Metrics.
DatasetKGE ModelDim.CV AccuracyTest AccuracyCV Macro AUCCV LogLoss (±SD)CV MPCE (±SD)Statistical Validation (CV Folds)
AmazonTransE320.901 ± 0.0040.8890.966 ± 0.0030.236 ± 0.0130.099 ± 0.004Wilcoxon p = 1.000 → ns
ComplEx160.882 ± 0.0070.8660.954 ± 0.0040.274 ± 0.0130.119 ± 0.007Wilcoxon p = 0.438 → ns
ConvKB80.843 ± 0.0080.8360.931 ± 0.0060.331 ± 0.0130.158 ± 0.007Wilcoxon p = 0.625 → ns
DistMult200.855 ± 0.0080.8460.940 ± 0.0060.310 ± 0.0140.146 ± 0.008Wilcoxon p = 0.625 → ns
BBCTransE320.897 ± 0.0060.8880.985 ± 0.0020.342 ± 0.0180.147 ± 0.017Wilcoxon p = 0.438 → ns
ComplEx320.859 ± 0.0070.8540.977 ± 0.0030.439 ± 0.0190.191 ± 0.017Wilcoxon p = 0.188 → ns
ConvKB120.849 ± 0.0070.8460.972 ± 0.0040.493 ± 0.0210.212 ± 0.020Wilcoxon p = 0.125 → ns
DistMult200.865 ± 0.0050.8620.977 ± 0.0030.443 ± 0.0170.188 ± 0.018Wilcoxon p = 0.438 → ns
ReutersTransE320.880 ± 0.0080.8700.985 ± 0.0020.395 ± 0.0200.142 ± 0.010Wilcoxon p = 1.000 → ns
ComplEx240.860 ± 0.0070.8570.979 ± 0.0030.469 ± 0.0230.170 ± 0.010Wilcoxon p = 1.000 → ns
ConvKB120.820 ± 0.0110.8120.970 ± 0.0050.593 ± 0.0340.216 ± 0.019Wilcoxon p = 0.063 → ns
DistMult200.842 ± 0.0090.8320.974 ± 0.0040.536 ± 0.0290.197 ± 0.013Wilcoxon p = 0.313 → ns

Appendix B.2. Embedding Visualization
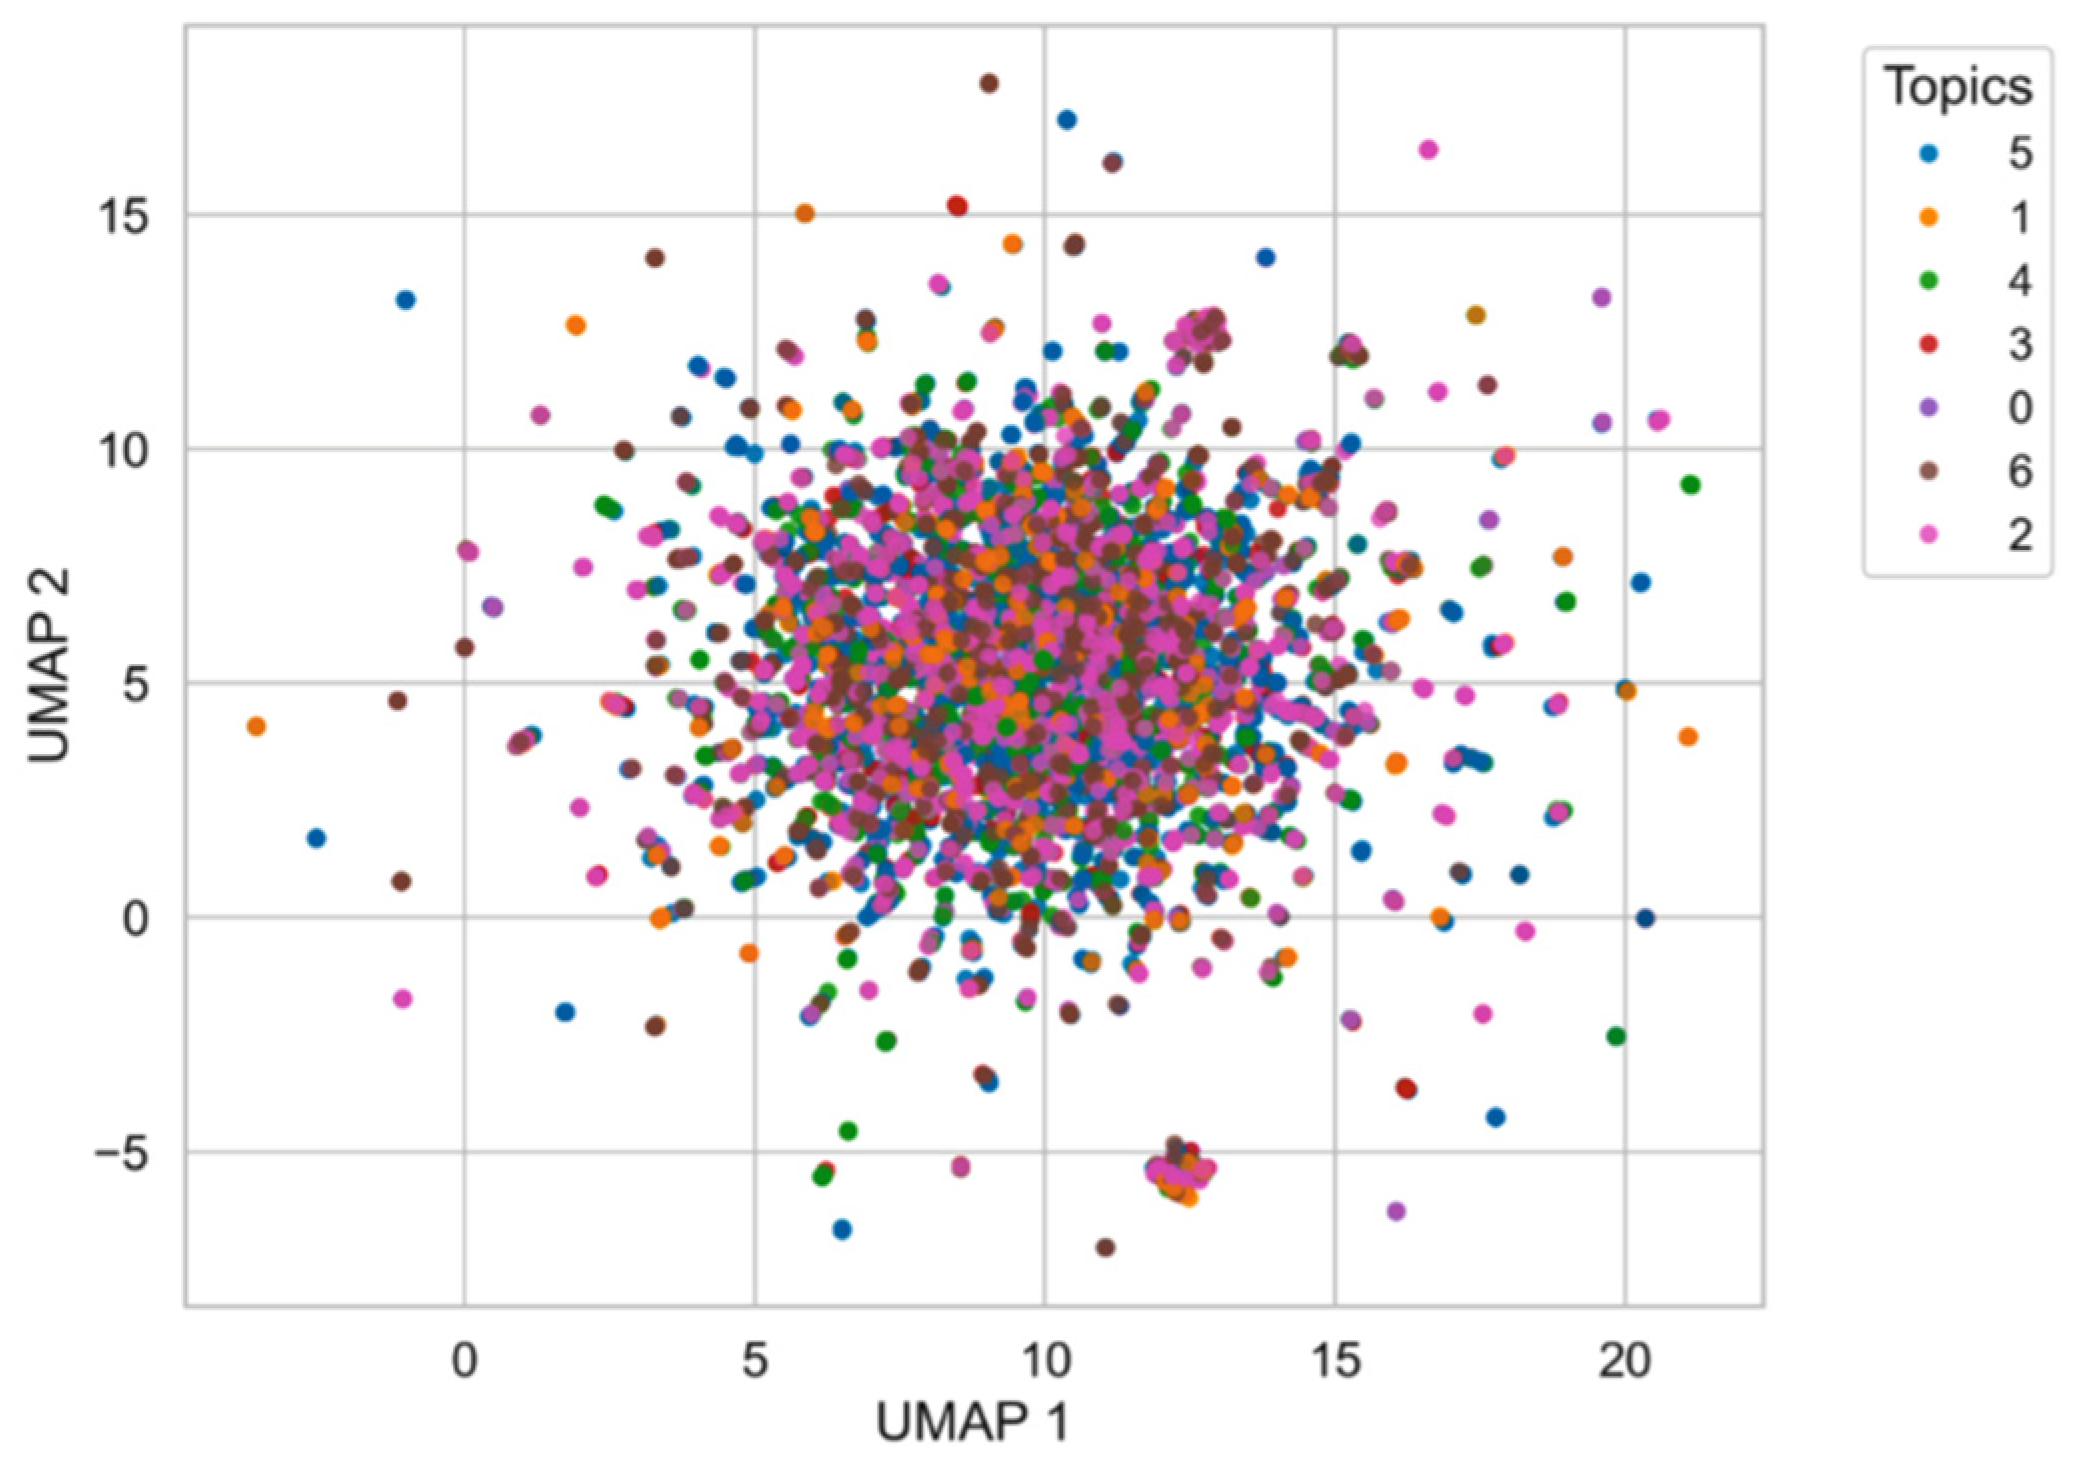
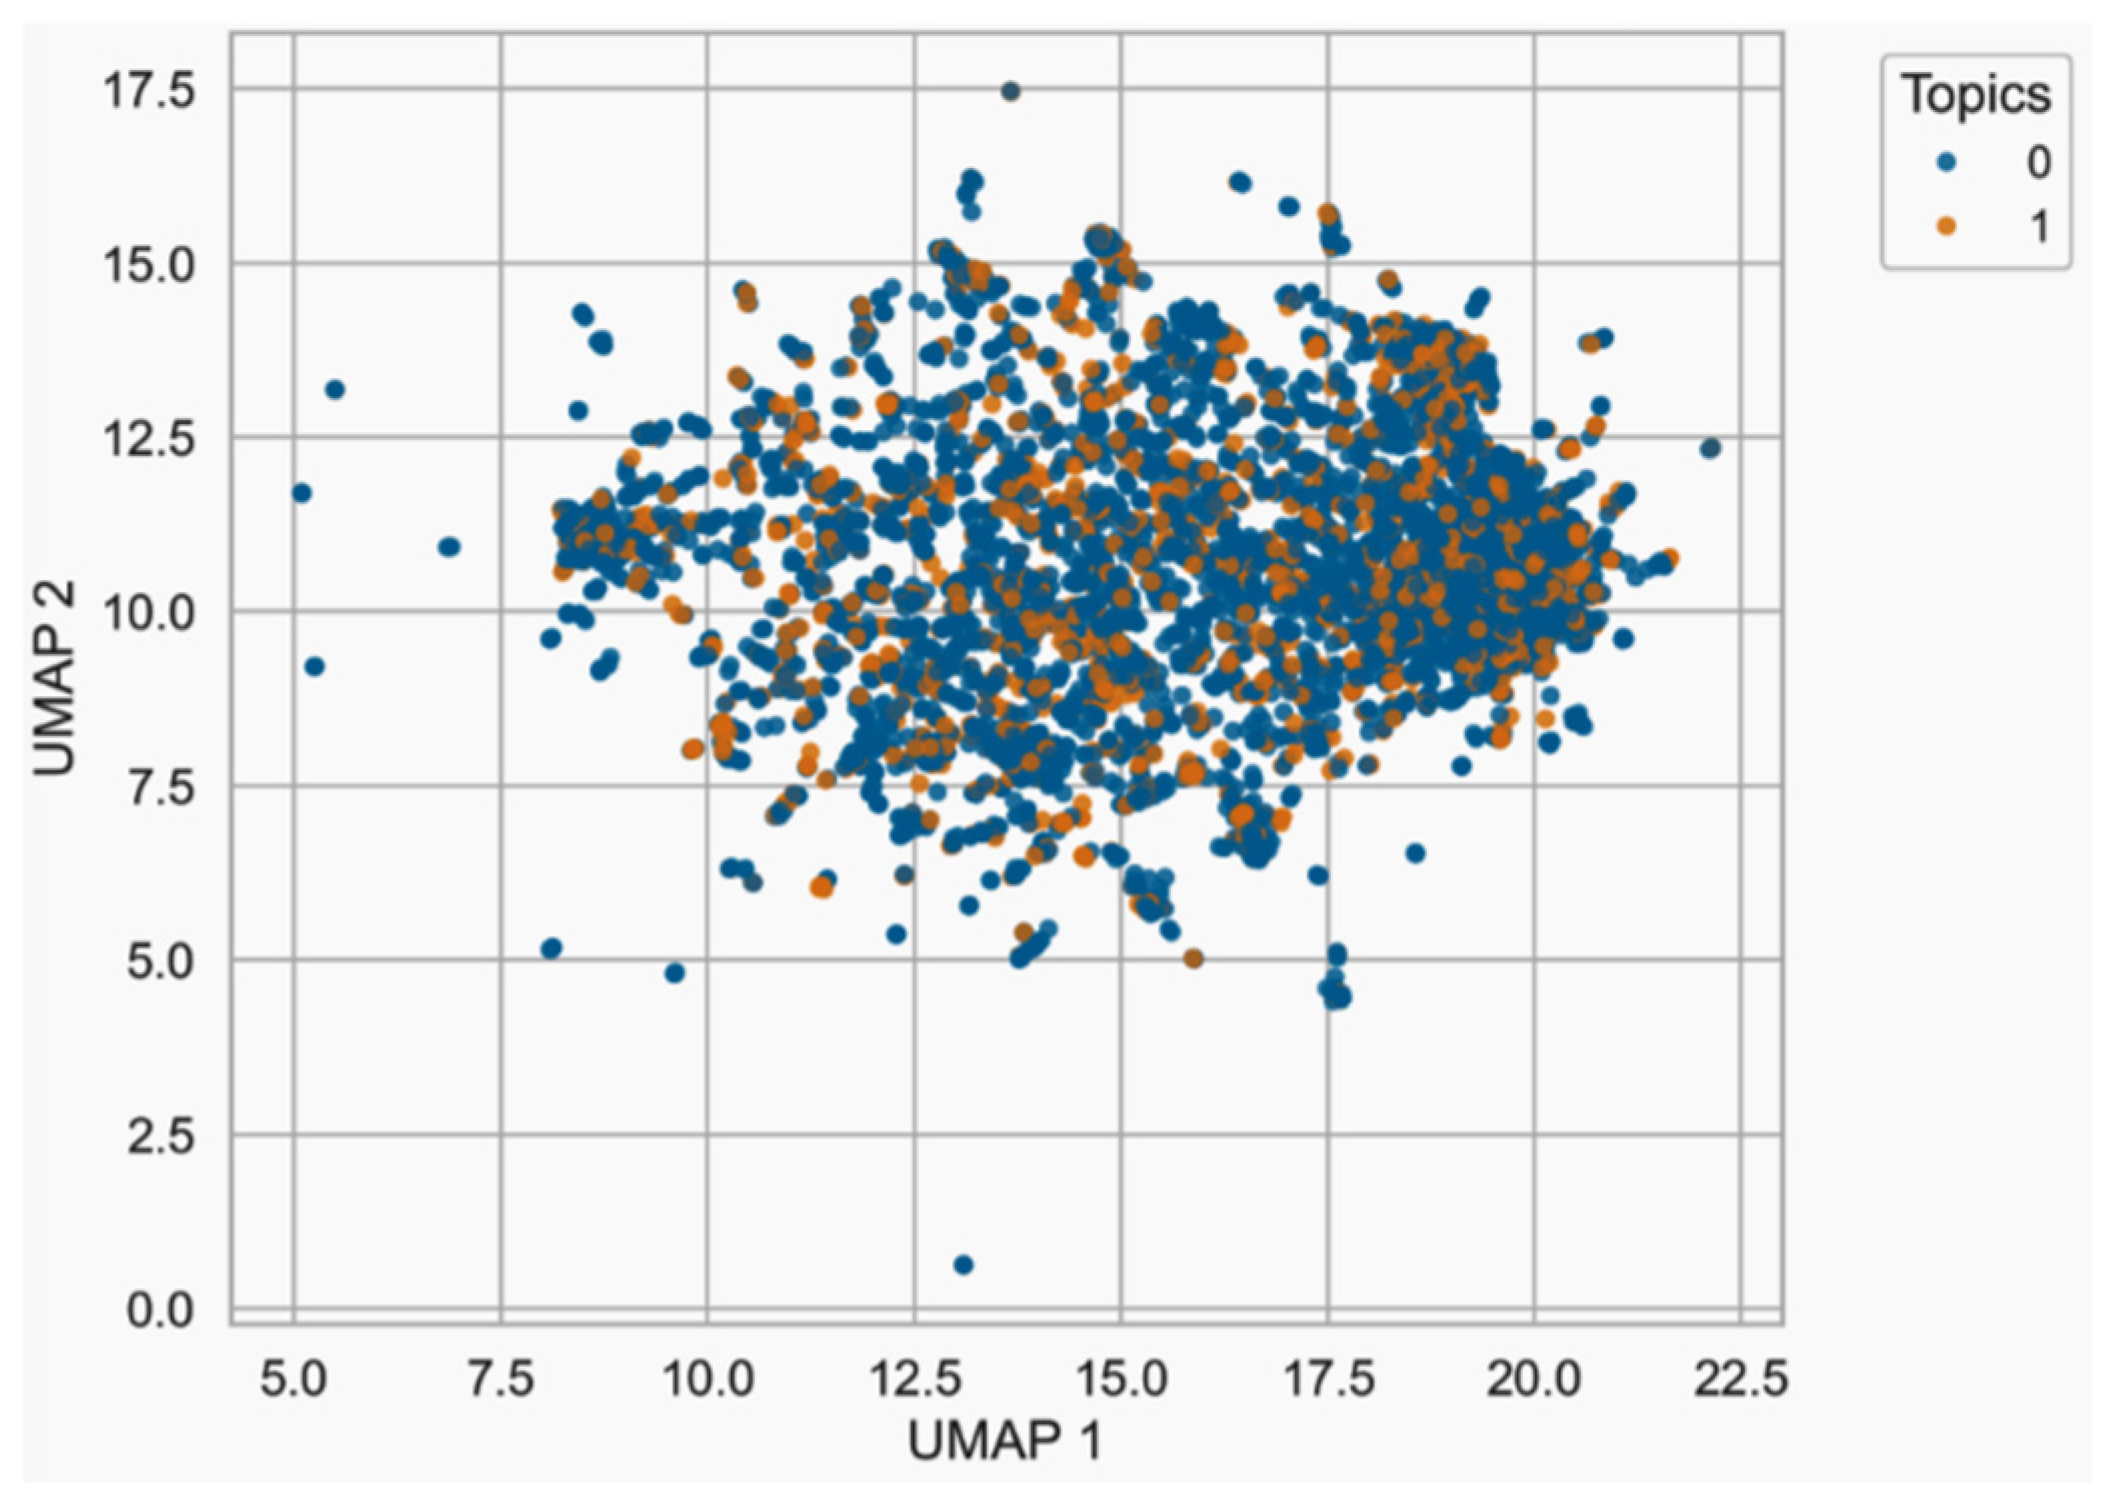
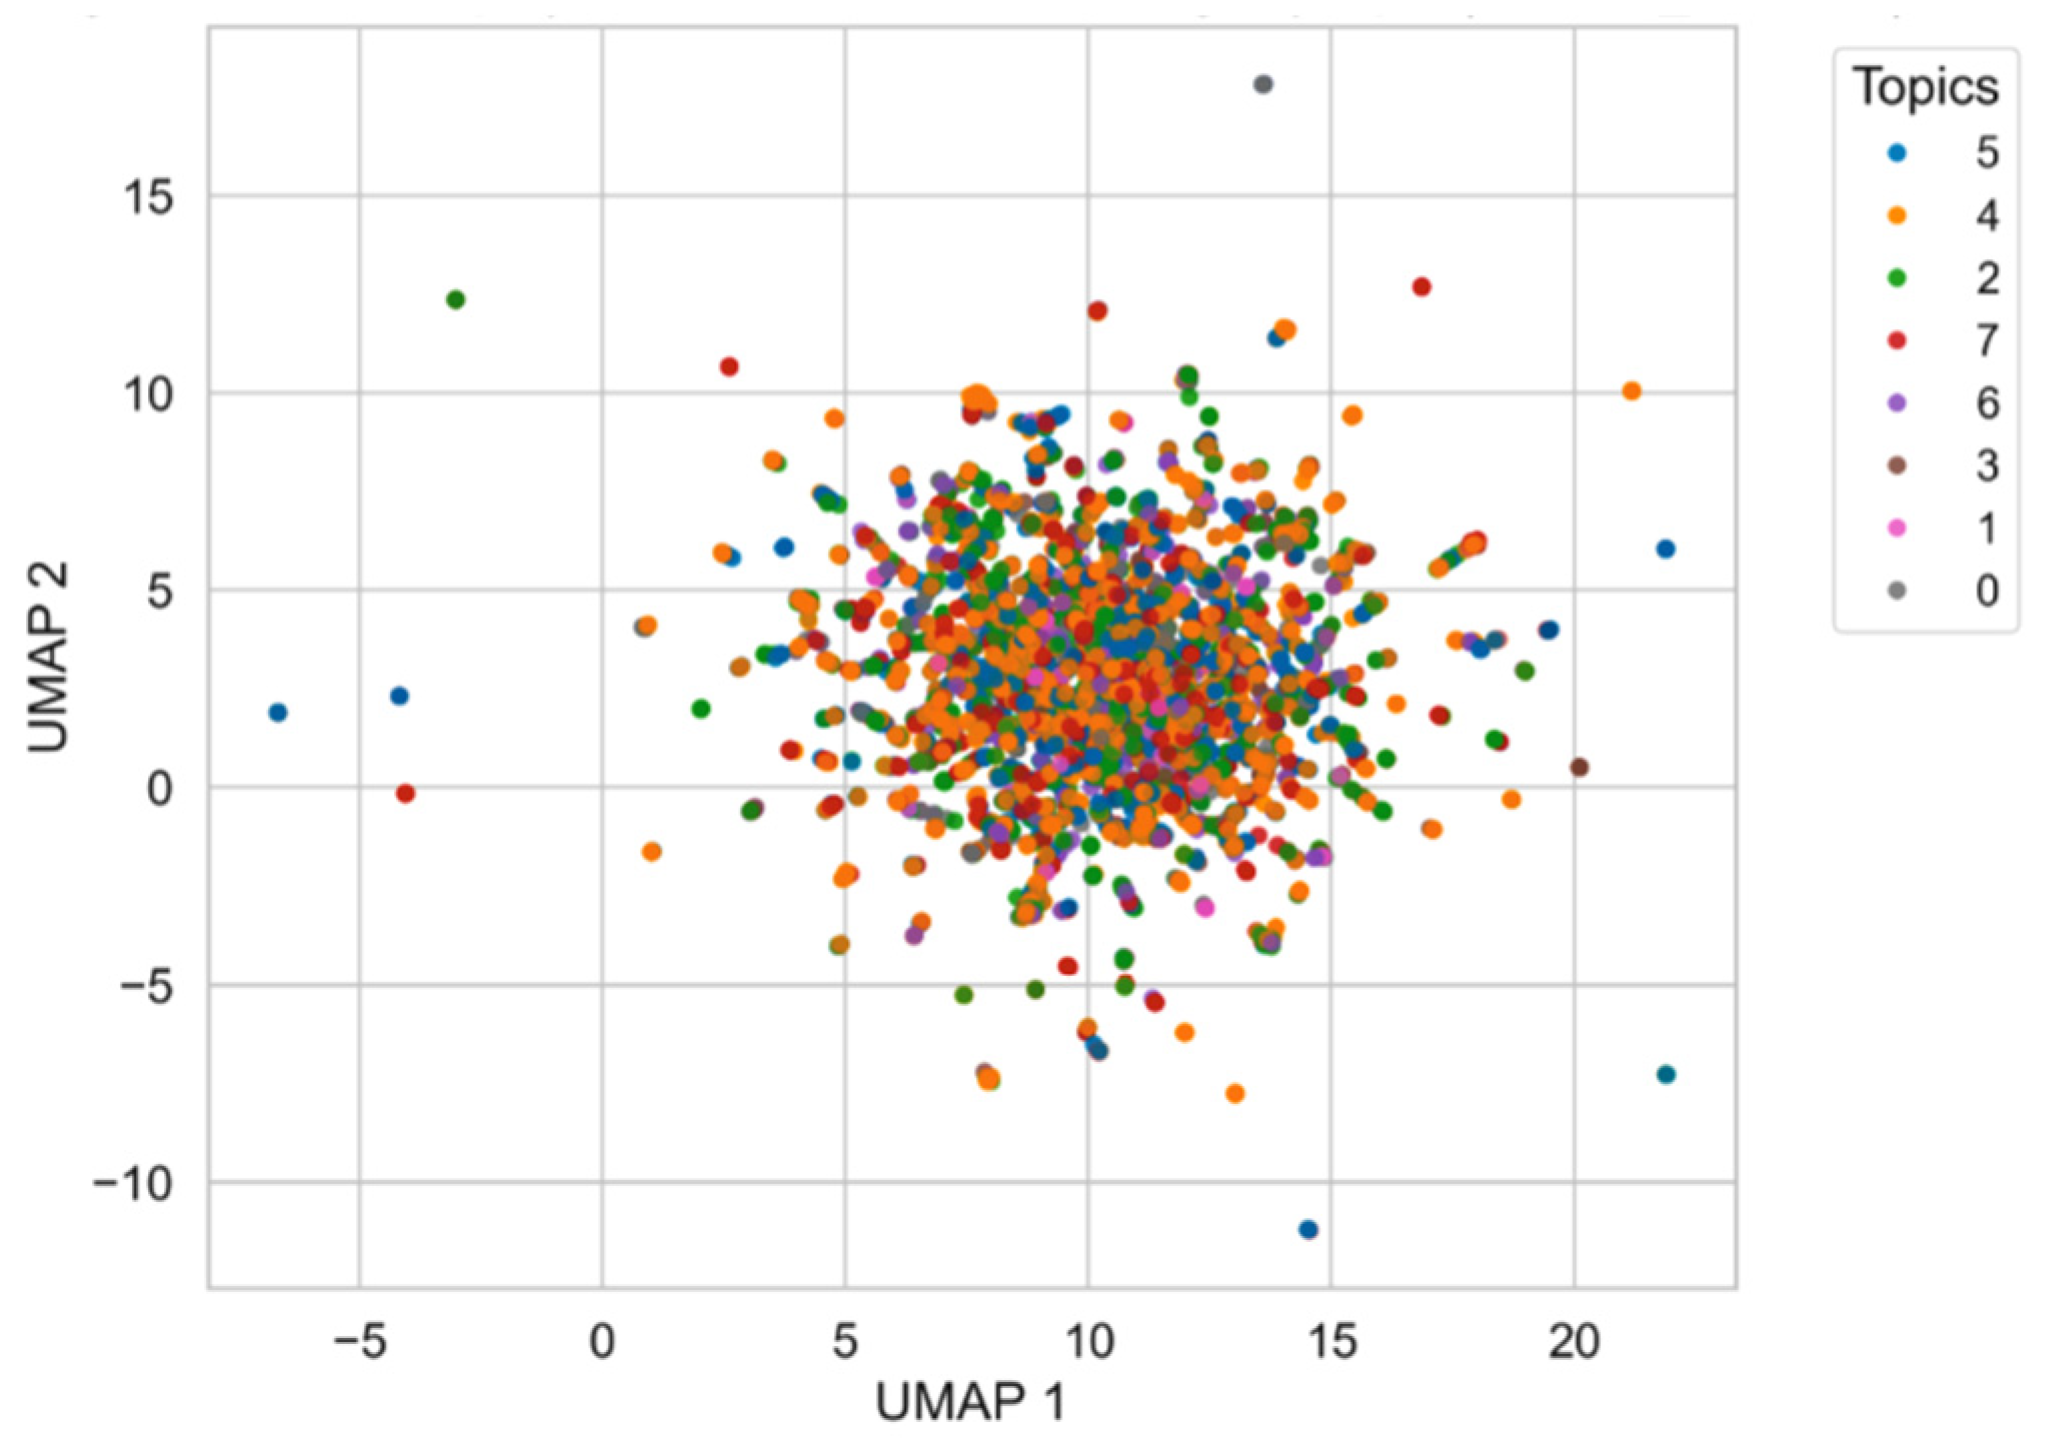
Although the UMAP projections (Figure A1) do not show a clear separation between topics, the classification results (Table A1) confirm that the TransE representations contain sufficient structural information to discriminate among classes. XGBoost captures complex non-linear interactions among features that are not visible in 2D unsupervised projections. This suggests that topic separability occurs in a higher-dimensional space, which cannot be captured by unsupervised reductions such as UMAP. Previous works [72,73] have shown that class separability in embedding spaces may be present even when low-dimensional visualisations (such as UMAP) do not exhibit clear clustering.
Figure A1. UMAP two-dimensional projection of the TransE embeddings for (a) Amazon dataset. Each point represents an embedded entity colored by its assigned topic. The projections illustrate that topics appear visually overlapped, indicating that TransE embeddings capture relational rather than explicit topical separability.
Applsci 15 12231 g0a1
Figure A2. UMAP two-dimensional projection of the TransE embeddings BBC dataset. Each point represents an embedded entity colored by its assigned topic. The projections illustrate that topics appear visually overlapped, indicating that TransE embeddings capture relational rather than explicit topical separability.
Applsci 15 12231 g0a2
Figure A3. UMAP two-dimensional projection of the TransE embeddings Reuters dataset. Each point represents an embedded entity colored by its assigned topic. The projections illustrate that topics appear visually overlapped, indicating that TransE embeddings capture relational rather than explicit topical separability.
Applsci 15 12231 g0a3

Appendix C. BBC Topic 3: Hierarchical Clustering and Spectral Visualization Results

Figure A4. Silhouette Index Evolution for BBC Hierarchical Clustering of Topic 3.
Applsci 15 12231 g0a4
Figure A5. Dendrogram of BBC Hierarchical Clustering of Topic 3.
Applsci 15 12231 g0a5
Figure A6. UMAP projection of BBC Spectral Clustering of Topic 3.
Applsci 15 12231 g0a6

Appendix D. Executive Report Example

============================================================
TOPIC ANALYSIS - EXECUTIVE REPORT
============================================================
ANALYSIS CONFIGURATION
Repository: amazon
Topic ID: 0
Selected vocabulary: 20 terms
Number of identified clusters: 2
Automatic optimal number: 2
Number selected by user: 2
Clustering quality (Silhouette): 0.305
Method: Hierarchical clustering + Explanatory LLM
VOCABULARY STATISTICS
• Total terms used: 20
• Available LDA terms: 30
• Available NER entities: 0
• Available DBPedia entities: 0
SUMMARY BY CLUSTER:
----------------------------------------
CLUSTER 0:
Key terms: quantity, nutriment, quality, substance, work, product, achiever, use, usage, time
Explanation: The cluster revolves around the concept of evaluating and utilizing resources or entities based on their quality, efficiency, and temporal aspects within a technological context.
Scores:
• Coherence: 4/5
• Relevance: 4/5
• Coverage: 3/5
Strengths: Captures the essence of the cluster with key phrases, Relevant to technology domain
Weaknesses: Limited coverage of the cluster’s aspects, Could benefit from more specific terms
Justification: The explanation is coherent and relevant to the technology domain, focusing on quality, efficiency, and time. However, it could be more comprehensive by including more specific concepts like‘resource allocation’ or ‘performance metrics’.
Detailed analysis:
• Extracted key phrases: 1. “Nutrient Quality”
            2. “Work Product”
            3. “Time Usage”
• Verification passed: True
 
----------------------------------------
CLUSTER 1:
Key terms: cat, felid, dog, toy, canine, small_indefinite_amount 
Explanation: The cluster revolves around the concept of ‘Pet Accessories’, encompassing both domesticated animals and their items. 
Scores:
• Coherence: 4/5
• Relevance: 3/5
• Coverage: 4/5
Strengths: Clear thematic link between terms, Good coverage of cluster
Weaknesses: Lack of precision in domain relevance, Potential for more detailed connections within the cluster
Justification: The explanation is coherent in linking the terms to a common theme (‘Pet Accessories’), but could be more precise in its connections. It is relevant to the domain of pet technology, though it might not fully capture the technological aspect. The coverage is good, addressing the main aspects of the cluster.
Detailed analysis:
• Extracted key phrases: 1. “Felid family”
                      2. “Toy for canine”
                      3. “Small amount of technology”
EXPLANATION:
1. “Felid family” connects “cat” and “felid” as they both belong to the same biological classification.
2. “Toy for canine” links “toy” with “dog” (represented by “canine”) as it is a specific item intended for dogs.
3. “Small amount of technology” represents the context of the
• Verification passed: True
GLOBAL STATISTICS:
Average coherence: 4.00/5
Average relevance: 3.50/5
Average coverage: 3.50/5
Clustering quality: 0.305
GENERATED FILES:
• clusters.json - Cluster information
• explanations.json - Generated explanations
• evaluations.json - XAI evaluations
• detailed_analysis.json - Detailed analysis
• silhouette_evolution.png - Optimization graph
• dendrogram_with_cut.png - Dendrogram
• config_topic_0.json – Configuration

Appendix E. Topic by Topic Comparison of Hierarchical and Spectral Clustering Metrics Across Corpora (Amazon, BBC, and Reuters)
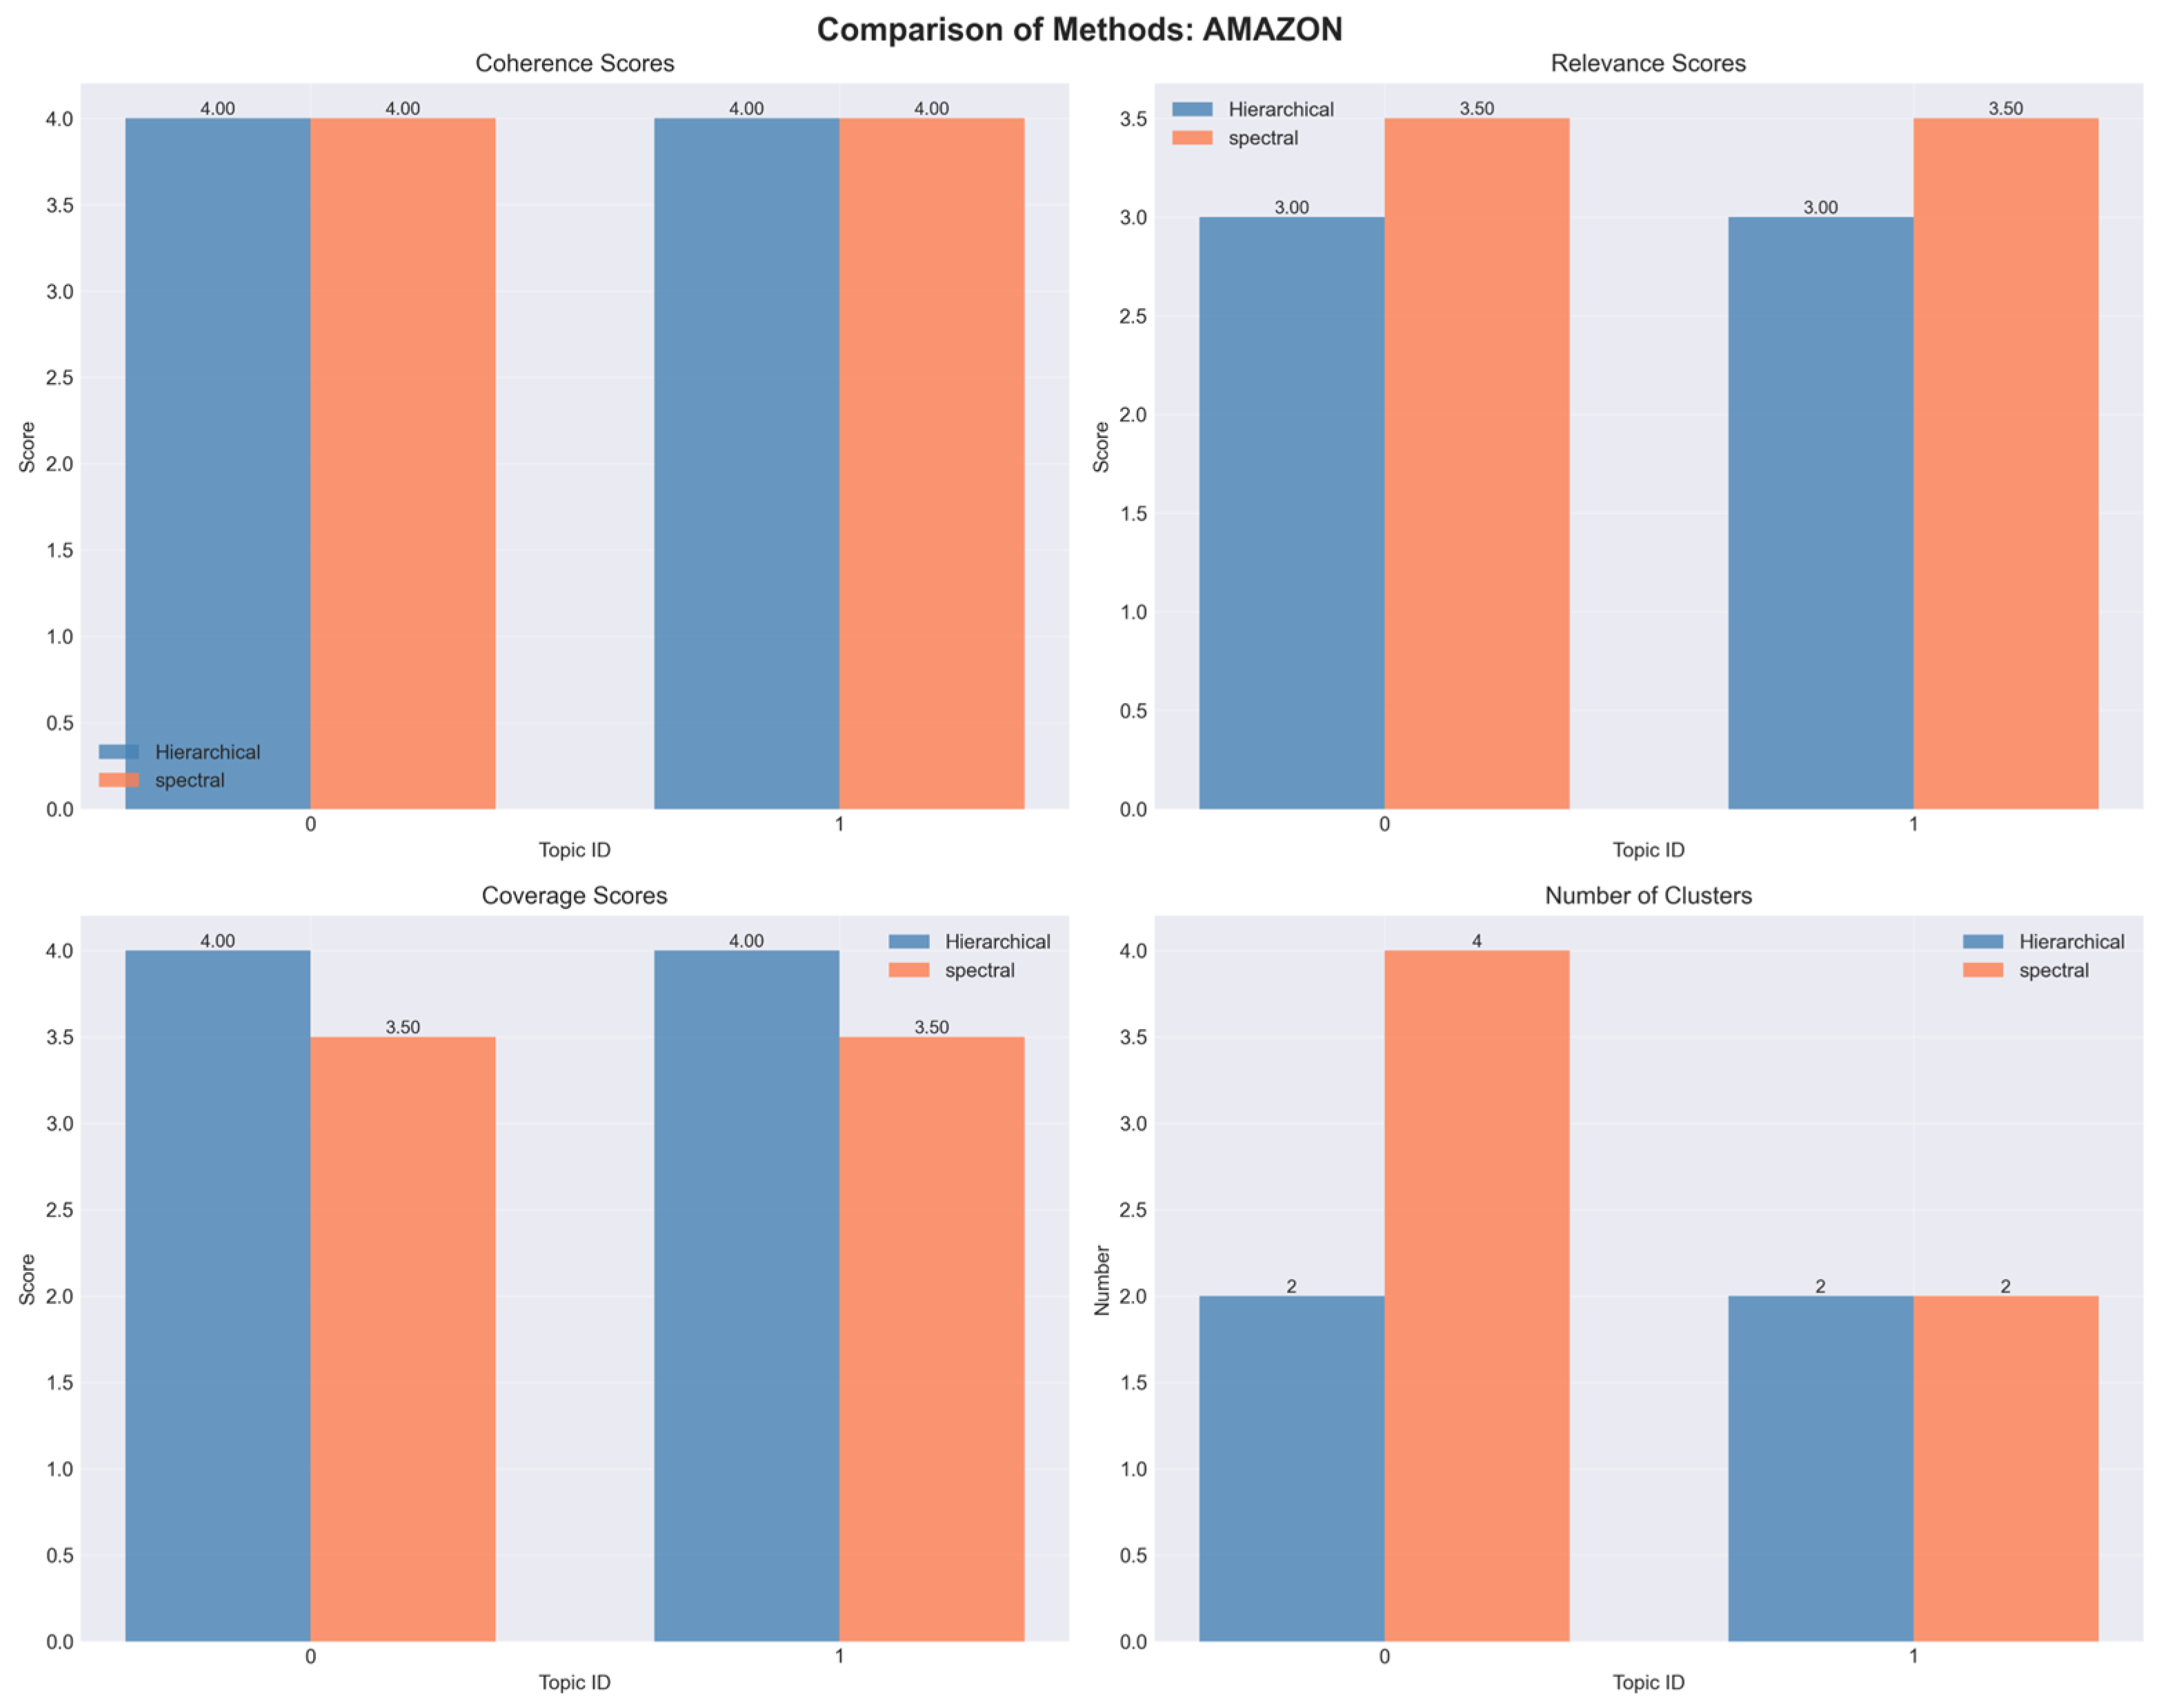
Figure A7. Topic-level comparison of hierarchical and spectral clustering metrics for the Amazon corpus.
Applsci 15 12231 g0a7
Figure A8. Topic-level comparison of hierarchical and spectral clustering metrics for the BBC corpus.
Applsci 15 12231 g0a8
Figure A9. Topic-level comparison of hierarchical and spectral clustering metrics for the Reuters corpus.
Applsci 15 12231 g0a9

References

  1. Adadi, A.; Berrada, M. Peeking inside the Black-Box: A Survey on Explainable Artificial Intelligence (XAI). IEEE Access Pract. Innov. Open Solut. 2018, 6, 52138–52160. [Google Scholar] [CrossRef]
  2. Arrieta, A.B.; Díaz-Rodríguez, N.; Del Ser, J.; Bennetot, A.; Tabik, S.; Barbado, A.; García, S.; Gil-López, S.; Molina, D.; Benjamins, R.; et al. Explainable Artificial Intelligence (XAI): Concepts, Taxonomies, Opportunities and Challenges toward Responsible AI. Inf. Fusion 2019, 58, 82–115. [Google Scholar] [CrossRef]
  3. Meske, C.; Bunde, E.; Schneider, J.; Gersch, M. Explainable Artificial Intelligence: Objectives, Stakeholders, and Future Research Opportunities. Inf. Syst. Manag. 2022, 39, 53–63. [Google Scholar] [CrossRef]
  4. Danilevsky, M.; Qian, K.; Aharonov, R.; Katsis, Y.; Kawas, B.; Sen, P. A Survey of the State of Explainable AI for Natural Language Processing. arXiv 2020, arXiv:2010.00711. [Google Scholar] [CrossRef]
  5. Ribeiro, M.T.; Singh, S.; Guestrin, C. “Why Should I Trust You?”: Explaining the Predictions of Any Classifier. In Proceedings of the 22nd ACM SIGKDD International Conference on Knowledge Discovery and Data Mining—KDD ’16, San Francisco, CA, USA, 13–17 August 2016; ACM Press: San Francisco, CA, USA, 2016; pp. 1135–1144. [Google Scholar]
  6. Lundberg, S.; Lee, S.-I. A Unified Approach to Interpreting Model Predictions. Adv. Neural Inf. Process. Syst. 2017, 30. [Google Scholar] [CrossRef]
  7. Lu, Q.; Dou, D.; Nguyen, T. ClinicalT5: A Generative Language Model for Clinical Text. In Proceedings of the Findings of the Association for Computational Linguistics: EMNLP 2022, Abu Dhabi, United Arab Emirates, 7–11 December 2022; Goldberg, Y., Kozareva, Z., Zhang, Y., Eds.; Association for Computational Linguistics: Abu Dhabi, United Arab Emirates, 2022; pp. 5436–5443. [Google Scholar]
  8. Wu, T.; Ribeiro, M.; Heer, J.; Singh, S. Polyjuice: Generating Counterfactuals for Explaining Predictions in NLP. In Proceedings of the ACL, Austin, TX, USA, 2–11 October 2021. [Google Scholar]
  9. Novak, J.D.; Cañas, A.J. The Theory Underlying Concept Maps and How to Construct Them. Fla. Inst. Hum. Mach. Cogn. 2006, 1, 1–31. [Google Scholar]
  10. Navarro-Almanza, R.; Juárez-Ramírez, R.; Licea, G.; Castro, J.R. Automated Ontology Extraction from Unstructured Texts Using Deep Learning. In Intuitionistic and Type-2 Fuzzy Logic Enhancements in Neural and Optimization Algorithms: Theory and Applications; Castillo, O., Melin, P., Kacprzyk, J., Eds.; Springer International Publishing: Cham, Switzerland, 2020; pp. 727–755. ISBN 978-3-030-35445-9. [Google Scholar]
  11. Hogan, A.; Blomqvist, E.; Cochez, M. Knowledge Graphs. ACM Comput. Surv. 2021, 54, 71. [Google Scholar] [CrossRef]
  12. Auer, S.; Bizer, C.; Kobilarov, G.; Lehmann, J.; Cyganiak, R.; Ives, Z. DBpedia: A Nucleus for a Web of Open Data. In Semantic Web; Aberer, K., Choi, K.-S., Noy, N., Allemang, D., Lee, K.-I., Nixon, L., Golbeck, J., Mika, P., Maynard, D., Mizoguchi, R., et al., Eds.; Springer: Berlin/Heidelberg, Germany, 2007; pp. 722–735. [Google Scholar]
  13. Suchanek, F.M.; Kasneci, G.; Weikum, G. Yago: A Core of Semantic Knowledge. In Proceedings of the 16th International Conference on World Wide Web, Banff, AB, Canada, 8–12 May 2007; ACM: New York, NY, USA, 2007; pp. 697–706. [Google Scholar]
  14. Medelyan, O.; Manion, S.; Broekstra, J.; Divoli, A.; Huang, A.-L.; Witten, I.H. Constructing a Focused Taxonomy from a Document Collection. In The Semantic Web: Semantics and Big Data; Cimiano, P., Corcho, O., Presutti, V., Hollink, L., Rudolph, S., Eds.; Lecture Notes in Computer Science; Springer: Berlin/Heidelberg, Germany, 2013; Volume 7882, pp. 367–381. ISBN 978-3-642-38287-1. [Google Scholar]
  15. Qasim, I.; Jeong, J.-W.; Heu, J.-U.; Lee, D.-H. Concept Map Construction from Text Documents Using Affinity Propagation. J. Inf. Sci. 2013, 39, 719–736. [Google Scholar] [CrossRef]
  16. Bilal, A.; Ebert, D.; Lin, B. LLMs for Explainable AI: A Comprehensive Survey 2025. arXiv 2025, arXiv:2504.00125. [Google Scholar]
  17. Cambria, E.; Malandri, L.; Mercorio, F.; Nobani, N.; Seveso, A. XAI Meets LLMs: A Survey of the Relation between Explainable AI and Large Language Models. arXiv 2024, arXiv:2407.15248. [Google Scholar] [CrossRef]
  18. Rahimi, H.; Mimno, D.; Hoover, J.; Naacke, H.; Constantin, C.; Amann, B. Contextualized Topic Coherence Metrics. In Proceedings of the Findings of the Association for Computational Linguistics: EACL 2024, St. Julian’s, Malta, 17–22 March 2024; Graham, Y., Purver, M., Eds.; Association for Computational Linguistics: St. Julian’s, Malta, 2024; pp. 1760–1773. [Google Scholar]
  19. Bhaduri, S.; Kapoor, S.; Gil, A.; Mittal, A.; Mulkar, R. Qualitative Insights Tool (QualIT): LLM Enhanced Topic Modeling. arXiv 2024, arXiv:2409.15626. [Google Scholar] [CrossRef]
  20. Nauta, M.; Trienes, J.; Pathak, S.; Nguyen, E.; Peters, M.; Schmitt, Y.; Schlötterer, J.; van Keulen, M.; Seifert, C. From Anecdotal Evidence to Quantitative Evaluation Methods: A Systematic Review on Evaluating Explainable AI 2022. ACM Comput. Surv. 2023, 55, 295. [Google Scholar] [CrossRef]
  21. Del Águila Escobar, R.; Suárez-Figueroa, M.d.C.; Fernández-López, M. OBOE: An Explainable Text Classification Framework. Int. J. Interact. Multimed. Artif. Intell. 2022; in press. 1–14. [Google Scholar] [CrossRef]
  22. Ribeiro, M.T.; Singh, S.; Guestrin, C. Anchors: High-Precision Model-Agnostic Explanations. In Proceedings of the AAAI Conference on Artificial Intelligence, New Orleans, LA, USA, 2–7 February 2018; Volume 32. [Google Scholar] [CrossRef]
  23. Mehta, H.; Passi, K. Social Media Hate Speech Detection Using Explainable Artificial Intelligence (XAI). Algorithms 2022, 15, 291. [Google Scholar] [CrossRef]
  24. Ilias, L.; Askounis, D. Explainable Identification of Dementia from Transcripts Using Transformer Networks. IEEE J. Biomed. Health Inform. 2022, 26, 4153–4164. [Google Scholar] [CrossRef] [PubMed]
  25. Liu, H.; Yin, Q.; Wang, W.Y. Towards Explainable NLP: A Generative Explanation Framework for Text Classification. In Proceedings of the 57th Annual Meeting of the Association for Computational Linguistics, Florence, Italy, 28 July–2 August 2019. [Google Scholar]
  26. Arous, I.; Dolamic, L.; Yang, J.; Bhardwaj, A.; Cuccu, G.; Cudré-Mauroux, P. MARTA: Leveraging Human Rationales for Explainable Text Classification. Proc. AAAI Conf. Artif. Intell. 2021, 35, 5868–5876. [Google Scholar] [CrossRef]
  27. Karen Simonyan, A.Z. Andrea Vedaldi Deep Inside Convolutional Networks: Visualising Image Classification Models and Saliency Maps. In Proceedings of the Workshop at International Conference on Learning Representations, Banff, AB, Canada, 14–16 April 2014. [Google Scholar]
  28. Augasta, M.G.; Kathirvalavakumar, T. Reverse Engineering the Neural Networks for Rule Extraction in Classification Problems. Neural Process. Lett. 2012, 35, 131–150. [Google Scholar] [CrossRef]
  29. Bologna, G. A Simple Convolutional Neural Network with Rule Extraction. Appl. Sci. 2019, 9, 2411. [Google Scholar] [CrossRef]
  30. Zhao, H.; Chen, H.; Yang, F.; Liu, N.; Deng, H.; Cai, H.; Wang, S.; Yin, D.; Du, M. Explainability for Large Language Models: A Survey. ACM Trans. Intell. Syst. Technol. 2024, 15, 20. [Google Scholar] [CrossRef]
  31. Lecue, F. Semantic Web Journal; IOS Press: Amsterdam, The Netherlands, 2018; p. 9. [Google Scholar]
  32. Rožanec, J.M.; Fortuna, B.; Mladenić, D. Knowledge Graph-Based Rich and Confidentiality Preserving Explainable Artificial Intelligence (XAI). Inf. Fusion 2022, 81, 91–102. [Google Scholar] [CrossRef]
  33. Flisar, J.; Podgorelec, V. Document Enrichment Using Dbpedia Ontology for Short Text Classification. In Proceedings of the 8th International Conference on Web Intelligence, Mining and Semantics, Novi Sad, Serbia, 25–27 June 2018. [Google Scholar]
  34. Frayling, E.; Macdonald, C.; McDonald, G.; Ounis, I. Using Entities in Knowledge Graph Hierarchies to Classify Sensitive Information. In Experimental IR Meets Multilinguality, Multimodality, and Interaction; Lecture Notes in Computer Science; Springer: Cham, Switzerland, 2022; Volume 13390, pp. 125–132. [Google Scholar]
  35. Okebukola, P.A. Can Good Concept Mappers Be Good Problem Solvers in Science? Educ. Psychol. 1992, 12, 113–129. [Google Scholar] [CrossRef]
  36. Aguiar, C.; Zouaq, A.; Cury, D. Automatic Construction of Concept Maps from Texts. In Proceedings of the 7th International Conference on Concept Mapping, Tallinn, Estonia, 5–9 September 2016. [Google Scholar]
  37. Atapattu, T.; Falkner, K.; Falkner, N. A Comprehensive Text Analysis of Lecture Slides to Generate Concept Maps. Comput. Educ. 2017, 115, 96–113. [Google Scholar] [CrossRef]
  38. Falke, T.; Gurevych, I. Fast Concept Mention Grouping for Concept Map-Based Multi-Document Summarization. In Proceedings of the 2019 Conference of the North American Chapter of the Association for Computational Linguistics: Human Language Technologies, Volume 1 (Long and Short Papers), Minneapolis, MN, USA, 2–7 June 2019; Association for Computational Linguistics: Minneapolis, MN, USA, 2019; pp. 695–700. [Google Scholar]
  39. Shao, Z.; Li, Y.; Wang, X.; Zhao, X.; Guo, Y. Research on a New Automatic Generation Algorithm of Concept Map Based on Text Analysis and Association Rules Mining. J. Ambient Intell. Humaniz. Comput. 2020, 11, 539–551. [Google Scholar] [CrossRef]
  40. Bordes, A.; Usunier, N.; Garcia-Duran, A.; Weston, J.; Yakhnenko, O. Translating Embeddings for Modeling Multi-Relational Data. In Advances in Neural Information Processing Systems; Burges, C.J., Bottou, L., Welling, M., Ghahramani, Z., Weinberger, K.Q., Eds.; Curran Associates, Inc.: New York, NY, USA, 2013; Volume 26. [Google Scholar]
  41. Wang, C.; Nulty, P.; Lillis, D. A Comparative Study on Word Embeddings in Deep Learning for Text Classification. In Proceedings of the 4th International Conference on Natural Language Processing and Information Retrieval, Toronto, ON, Canada, 23–24 September 2021; Association for Computing Machinery: New York, NY, USA, 2021; pp. 37–46, ISBN 978-1-4503-7760-7. [Google Scholar]
  42. Chen, Q.; Wang, W.; Huang, K.; Coenen, F. Zero-Shot Text Classification via Knowledge Graph Embedding for Social Media Data. IEEE Internet Things J. 2022, 9, 9205–9213. [Google Scholar] [CrossRef]
  43. Ennajari, H.; Bouguila, N.; Bentahar, J. Knowledge-Enhanced Spherical Representation Learning for Text Classification. In Proceedings of the 2022 SIAM international conference on data mining (SDM), Alexandria, WV, USA, 28–30 April 2022; pp. 639–647. [Google Scholar]
  44. Spinner, T.; Schlegel, U.; Schäfer, H.; El-Assady, M. explAIner: A Visual Analytics Framework for Interactive and Explainable Machine Learning. IEEE Trans. Vis. Comput. Graph. 2019, 26, 1064–1074. [Google Scholar] [CrossRef]
  45. Mahoney, C.J.; Zhang, J.; Huber-Fliflet, N.; Gronvall, P.; Zhao, H. A Framework for Explainable Text Classification in Legal Document Review. In 2019 IEEE International Conference on Big Data (Big Data); IEEE Xplore: Los Angeles, CA, USA, 2019. [Google Scholar]
  46. Donadello, I.; Dragoni, M. SeXAI: A Semantic Explainable Artificial Intelligence Framework. In AIxIA 2020—Advances in Artificial Intelligence; Baldoni, M., Bandini, S., Eds.; Springer International Publishing: Cham, Switzerland, 2021; pp. 51–66. [Google Scholar]
  47. Billi, M. Hybrid Symbolic–LLM Explanations in Legal Text Classification. arXiv 2023. [Google Scholar] [CrossRef]
  48. Bhattacharjee, A.; Moraffah, R.; Garland, J.; Liu, H. Zero-shot LLM-guided Counterfactual Generation: A Case Study on NLP Model Evaluation. In Proceedings of the IEEE International Conference on Big Data, Washington, DC, USA, 15–18 December 2024; pp. 1243–1248. [Google Scholar] [CrossRef]
  49. Hong, D.; Wang, T.; Baek, S. ProtoryNet: Prototype Trajectories for Interpretable Text Classification. J. Mach. Learn. Res. 2023, 24. [Google Scholar]
  50. Wei, B.; Zhu, Z. ProtoLens: Advancing Prototype Learning for Fine-Grained Interpretability in Text Classification. In Proceedings of the 63rd Annual Meeting of the Association for Computational Linguistics, Toronto, ON, Canada, 9–14 July 2023; Volume 1, pp. 4503–4523. [Google Scholar]
  51. Zhang, D.; Sen, C.; Thadajarassiri, J.; Hartvigsen, T.; Kong, X.; Rundensteiner, E. Human-like Explanation for Text Classification with Limited Attention Supervision. In 2021 IEEE International Conference on Big Data (Big Data); IEEE Xplore: Los Angeles, CA, USA, 2021; pp. 957–967. [Google Scholar]
  52. Chrysostomou, G.; Aletras, N. Improving Attention-Based Explanations with Task Scaling (TaSc). In Proceedings of the 2021 Conference on Empirical Methods in Natural Language Processing (EMNLP), Punta Cana, Dominican Republic, 7–11 November 2021. [Google Scholar]
  53. Zhao, Z.; Vydiswaran, V.G.V. LIREx: Label-Specific Rationale Generation for Multi-Label Classification. In Proceedings of the 59th Annual Meeting of the Association for Computational Linguistics (ACL), Bangkok, Thailand, 1–6 August 2021. [Google Scholar]
  54. Ribeiro, M. SLIME: Statistical and Linguistic Insights for Model Explanation. arXiv 2024. [Google Scholar] [CrossRef]
  55. Rahulamathavan, Y. PLEX: Perturbation-Free Local Explanations for Transformer-Based Classifiers. arXiv 2023. [Google Scholar] [CrossRef]
  56. McAuley, J.; Targett, C.; Shi, Q.; van den Hengel, A. Image-Based Recommendations on Styles and Substitutes. arXiv 2015, arXiv:150604757. [Google Scholar]
  57. Greene, D.; Cunningham, P. Practical Solutions to the Problem of Diagonal Dominance in Kernel Document Clustering. In Proceedings of the 23rd International Conference on Machine Learning, Pittsburgh, PA, USA, 25–29 June 2006; Association for Computing Machinery: New York, NY, USA, 2006; pp. 377–384. [Google Scholar]
  58. Lewis, D.D.; Yang, Y.; Rose, T.G.; Li, F. RCV1: A New Benchmark Collection for Text Categorization Research. J. Mach. Learn. Res. 2004, 5, 361–397. [Google Scholar]
  59. Fellbaum, C. (Ed.) WordNet: An Electronic Lexical Database; Language, Speech, and Communication; MIT Press: Cambridge, MA, USA, 1998; ISBN 978-0-262-06197-1. [Google Scholar]
  60. Mendes, P.N.; Jakob, M.; García-Silva, A.; Bizer, C. DBpedia Spotlight: Shedding Light on the Web of Documents. In Proceedings of the 7th International Conference on Semantic Systems—I-Semantics ’11; ACM Press: Graz, Austria, 2011; pp. 1–8. [Google Scholar]
  61. Blei, D.M.; Ng, A.Y.; Jordan, M.I. Latent Dirichlet Allocation. J. Mach. Learn. Res. 2003, 3, 993–1022. [Google Scholar]
  62. Nguyen, D.Q.; Nguyen, T.D.; Nguyen, D.Q.; Phung, D. A Novel Embedding Model for Knowledge Base Completion Based on Convolutional Neural Network. In Proceedings of the 16th Annual Conference of the North American Chapter of the Association for Computational Linguistics: Human Language Technologies (NAACL-HLT), New Orleans, LA, USA, 1–6 June 2018; pp. 327–333. [Google Scholar]
  63. Trouillon, T.; Welbl, J.; Riedel, S.; Gaussier, E.; Bouchard, G. Complex Embeddings for Simple Link Prediction. In Proceedings of the 33rd International Conference on Machine Learning, New York, NY, USA, 19–24 June 2016; Balcan, M.F., Weinberger, K.Q., Eds.; PMLR: New York, NY, USA, 2016; Volume 48, pp. 2071–2080. [Google Scholar]
  64. Yang, B.; Yih, S.W.; He, X.; Gao, J.; Deng, L. Embedding Entities and Relations for Learning and Inference in Knowledge Bases. In Proceedings of the International Conference on Learning Representations 2015, San Diego, CA, USA, 7–9 May 2015. [Google Scholar]
  65. Chen, T.; Guestrin, C. XGBoost: A Scalable Tree Boosting System. In Proceedings of the 22nd ACM SIGKDD International Conference on Knowledge Discovery and Data Mining, San Francisco, CA, USA, 13–17 August 2016; pp. 785–794. [Google Scholar] [CrossRef]
  66. Rousseeuw, P.J. Silhouettes: A Graphical Aid to the Interpretation and Validation of Cluster Analysis. J. Comput. Appl. Math. 1987, 20, 53–65. [Google Scholar] [CrossRef]
  67. Ke, G.; Meng, Q.; Finley, T.; Wang, T.; Chen, W.; Ma, W.; Ye, Q.; Liu, T.-Y. LightGBM: A Highly Efficient Gradient Boosting Decision Tree. In Proceedings of the Advances in Neural Information Processing Systems (NeurIPS 2017), Long Beach, CA, USA, 4–9 December 2017; pp. 3146–3154. [Google Scholar]
  68. Prokhorenkova, L.; Gusev, G.; Vorobev, A.; Dorogush, A.V.; Gulin, A. CatBoost: Unbiased Boosting with Categorical Features. In Proceedings of the Advances in Neural Information Processing Systems (NeurIPS 2018), Montréal, QC, Canada, 3–8 December 2018; pp. 6638–6648. [Google Scholar]
  69. Newman, D.; Lau, J.H.; Grieser, K.; Baldwin, T. Automatic Evaluation of Topic Coherence. In Proceedings of the Human Language Technologies: The 2010 Annual Conference of the North American Chapter of the Association for Computational Linguistics, Los Angeles, CA, USA, 2–4 June 2010; Association for Computational Linguistics: Stroudsburg, PA, USA, 2010; pp. 100–108. [Google Scholar]
  70. Aletras, N.; Stevenson, M. Evaluating Topic Coherence Using Distributional Semantics. In Proceedings of the 10th International Conference on Computational Semantics (IWCS 2013), Potsdam, Germany, 19–22 March 2013; pp. 13–22. [Google Scholar]
  71. Röder, M.; Both, A.; Hinneburg, A. Exploring the Space of Topic Coherence Measures. In Proceedings of the Eighth ACM International Conference on Web Search and Data Mining, Shanghai, China, 2–6 February 2015; Association for Computing Machinery: New York, NY, USA, 2015; pp. 399–408. [Google Scholar]
  72. Gourgoulias, K.; Ghalyan, N.; Labonne, M.; Satsangi, Y.; Moran, S.; Sabelja, J. Estimating Class Separability of Text Embeddings with Persistent Homology. arXiv 2023, arXiv:2305.15016. [Google Scholar]
  73. Schilling, A.; Maier, A.; Gerum, R.; Metzner, C.; Krauß, P. Quantifying the Separability of Data Classes in Neural Networks. Neural Netw. 2021, 139, 278–293. [Google Scholar] [CrossRef] [PubMed]
Figure 1. OBOE pipeline implementation for explainable concept-map classification. Components: (A) Topic Modeling to identify topics; (B) Representation via triple extraction to form a knowledge graph; (C) Classification through KGE and predictive modeling; (D) Explanation generation by clustering triples into domains and using LLMs to produce natural language explanations.
Applsci 15 12231 g001
Figure 2. Cross validation variance.
Applsci 15 12231 g002
Figure 3. Comparison of topic modeling metrics (coherence, relevance, and coverage) for the amazon corpora and hierarchical and spectral strategies.
Applsci 15 12231 g003
Figure 4. Comparison of topic modeling metrics (coherence, relevance, and coverage) for the BBC corpora and hierarchical and spectral strategies.
Applsci 15 12231 g004
Figure 5. Comparison of topic modeling metrics (coherence, relevance, and coverage) for the Reuters corpora.
Applsci 15 12231 g005
Table 1. Comparative overview of recent explainable text classification frameworks.
Framework Task ScopeLLM
Use
Data
Representation
Customizable
Components
Model
Independent
Legal Document
Review
Explanations as examplesNoneText
explAInerInteractive classification explanationNoneText
MARTAPrototype based classificationNoneText
GEFFeature-based global explanationNoneText
SEXAISemantic enrichment of explanationsNoneText
TaScAttention-based explanationNoneText
HELASAttention-based hierarchical explanationNoneText
LIRExRationale extraction for classificationNoneText tokens
ClinicalT5Supervised explanation generationGenerationText
PLEXCounterfactual explanationGenerationText features
SLIMELocal counterfactual explanationsGenerationText features
ProtoryNetPrototype-based rationale explanationNoneText
ProtoLensVisual prototype inspectionNoneText
PolyjuiceCounterfactual generationGenerationText
FIZLECounterfactual generationGenerationText
Hybrid Symbolic-LLMSymbolic + generative explanationGenerationText + Rule templates
Ours (OBOE extension)Structure Domain discovery and explanationGeneration
Validation
Evaluation
Knowledge Graph
Embeddings
✓ yes, ✗ no, ⭘ partially.
Table 2. Classification results for (A) Reordering.
Corpus 1MetricResult
AmazonAUC0.99
AmazonMean per class error0.01
BBCLogLoss0.23
BBCMean per class error0.06
ReutersLogLoss0.26
ReutersMean per class error0.09
Table 3. Results for (C) Classification.
DatasetKGE ModelDim.CV AccuracyCV Macro AUCCV LogLoss (±SD)CV MPCE (±SD)
Reuters TransE320.901 ± 0.0040.8890.966 ± 0.0030.236 ± 0.013
BBCTransE320.897 ± 0.0060.8880.985 ± 0.0020.342 ± 0.018
AmazonTransE320.880 ± 0.0080.870.985 ± 0.0020.395 ± 0.020
Table 4. Coherence values obtained for component (A) Reordering.
Corpus 1Coherence
Amazon0.42
BBC0.59
Reuters0.55
Table 5. Summary of Topic 0 Report from the Amazon Dataset.
Cluster Key ConceptCoherenceRelevanceCoverageSummary
0Resource Quality & Usage443Focused on the evaluation and utilization of resources or products by quality and efficiency.
1Pet accessories434Describes domesticated animals and related items; clear theme but limited technological specificity.
Table 6. Evaluation of semanic domains based on coherence, relevance, and coverage metrics derived from LLM-generated explanation.
DatasetMethodCoherence (±SD)Relevance (±SD)Coverage (±SD)Avg. ClustersTotal ClustersOverall ScoreRelative Δ vs. Hierarchical
AmazonHierarchical4.000 ± 0.0003.000 ± 0.0004.000 ± 0.000243.66
Spectral4.000 ± 0.0003.500 ± 0.0003.500 ± 0.000363.66Relevance +16.7%; Coverage −12.5%
BBCHierarchical4.000 ± 0.0004.039 ± 0.3793.505 ± 0.1596.3443.85
Spectral4.000 ± 0.0003.843 ± 0.5473.590 ± 0.3133.1223.81Relevance −4.9%; Coverage +2.4%
ReutersHierarchical4.000 ± 0.0004.098 ± 0.4383.395 ± 0.2285.5443.83
Spectral4.000 ± 0.0003.719 ± 0.3643.453 ± 0.4222.9233.72Relevance −9.2%; Coverage +1.7%
Global Mean4.000 ± 0.03.80 ± 0.33.57 ± 0.23.77 ± 0.1Hierarchical slightly superior
Table 7. Evaluation of LLM-generated explanations based on coherence, relevance, and coverage metrics.
DatasetMethodCoherence (±SD)Relevance (±SD)Coverage (±SD)LLM Mean ScoreObservations
AmazonHierarchical4.00 ± 0.003.00 ± 0.004.00 ± 0.003.67Broader topical scope; coherent but less domain-focused.
Spectral4.00 ± 0.003.50 ± 0.003.50 ± 0.003.67Compact, highly coherent explanations.
BBCHierarchical4.00 ± 0.004.04 ± 0.383.51 ± 0.163.85Balanced and semantically rich explanations.
Spectral4.00 ± 0.003.84 ± 0.553.59 ± 0.313.81Slightly better coverage but lower relevance.
ReutersHierarchical4.00 ± 0.004.10 ± 0.443.40 ± 0.233.83Domain fidelity and semantic stability.
Spectral4.00 ± 0.003.72 ± 0.363.45 ± 0.423.72Good local coherence; narrower topical scope.
Global Mean4.00 ± 0.03.70 ± 0.33.55 ± 0.23.76 ± 0.1High semantic consistency across methods.
Disclaimer/Publisher’s Note: The statements, opinions and data contained in all publications are solely those of the individual author(s) and contributor(s) and not of MDPI and/or the editor(s). MDPI and/or the editor(s) disclaim responsibility for any injury to people or property resulting from any ideas, methods, instructions or products referred to in the content.