Article

Experimental Research on the Strength Characteristics of Artificial Freeze–Thaw Cement-Improved Soft Clay

School of Civil and Architectural Engineering, East China University of Technology, Nanchang 330013, China
*
Author to whom correspondence should be addressed.
Appl. Sci. 2025, 15(22), 12233; https://doi.org/10.3390/app152212233
Submission received: 14 October 2025 / Revised: 3 November 2025 / Accepted: 12 November 2025 / Published: 18 November 2025

Abstract

To investigate the variations in the strength of cement-improved soft clay under artificial freeze–thaw action, laboratory freeze–thaw and unconfined compressive strength tests were conducted on specimens with different cement dosages, initial moisture contents, and curing ages. The strength changes and damage patterns of the soil were quantitatively analyzed before and after the freeze–thaw process. The results indicated that while a higher cement content and longer curing ages enhanced strength, they also promoted a more brittle failure mode. Conversely, freeze–thaw action was found to weaken this brittleness, enhance ductility, and lead to significant strength deterioration. The strength was also observed to decrease with increasing moisture content. A strength growth rate (η) was introduced to quantify these changes, revealing that freeze–thaw cycles consistently suppressed the strength growth capacity. Based on the above-mentioned influencing factors, a strength prediction model for cement-improved soft clay that undergoes freeze–thaw cycles was developed. In water-rich areas, the research results can provide a reference for the changes in the strength of cement-improved soft clay under artificial freeze–thaw cycles.

1. Introduction

Engineering challenges including inadequate soil strength, high permeability, and liquefaction potential often emerge during shield tunneling in water-rich soft clay strata [1,2]. To mitigate these issues, artificially frozen cement-improved soil has been widely adopted as a temporary support solution [3,4]. This approach capitalizes on the synergistic reinforcement provided by cement hydration and cementation, combined with ice crystal formation during the freezing process, to enhance ground stability and ensure construction safety [5,6]. However, freeze–thaw action degrades the strength and deformation properties of cement-stabilized clay [7,8]. It is thus critical to identify the factors governing its strength and to specifically investigate the effects of freeze–thaw action. Therefore, clarifying the factors influencing the strength of cement-improved soil and exploring the influence of freeze–thaw action on changes in its strength are particularly important.
The strength of cement-improved soil is mainly affected by the cement content, moisture content, soil type, dry density, and curing age [9,10,11,12]. Research has shown that increasing the cement dosage usually increases the strength [13,14]. Within specific dosage ranges (e.g., 5–20%), the increase in strength typically follows a power function relationship. There is an optimal moisture content range; too little or too much moisture weakens the material, and the effect is controlled by the dosage of cement. The curing age is positively correlated with the strength, which initially increases faster and then slows down, and is generally approximately linearly correlated with the logarithm of the curing age [15,16,17]. Several theoretical models have been proposed to quantify these effects. Horpibulsuk and Lorenzo et al. [18,19] established prediction models based on systematic experiments, while Yao et al. [16] incorporated cement content, total moisture, and curing time into a framework for predicting long-term stiffness. Cao and Zhang [20] introduced a unified parameter that integrates the influences of cement content, curing age, and porosity on unconfined compressive strength. Several studies have developed predictive models accounting for fiber reinforcement, cement dosage, and freeze–thaw cycles [21], or applied Abrams’ law to strength variation post freezing [22]. Moreover, after freezing and thawing in artificial freezing construction, the strength of the cement-improved soil was generally reduced. For freeze-improved cement-stabilized soil, Ding et al. and De Jesús Arrieta et al. both reported a progressive decline in unconfined compressive strength with an increasing number of cycles, with the most significant loss occurring within the initial five cycles [6,23]. Lu et al. [24] discovered that soil temperature changes during freeze–thaw cycles exhibit a three-stage characteristic. The freezing temperature decreases with increasing cement content. Lu et al. [25] reported that although increasing the cement content (3–7%) can effectively improve the initial strength of the improved soil, the intensity of the attenuation rate under freeze–thaw cycles may accelerate with increasing dosage. This indicates that there is a complex non-monotonic relationship between the doping amount and freeze–thaw deterioration.
Most previous studies focused on the effects of different factors on the freeze–thaw and strength characteristics of general clay, pulverized clay, or expansive soils. The strength of soft clay with unique engineering characteristics before and after freeze–thaw action has not been well studied. In particular, there is a lack of quantitative analysis of the multi-factor coupling effect of the moisture content, cement dosage, and curing age. Accordingly, in this study, we investigated the effects of the moisture content, cement dosage, and curing age on the unconfined compressive strength (UCS) of cement-improved soft clay before and after freeze–thaw action. A strength prediction model that accounts for multivariate coupling mechanisms was developed to enable the reliable prediction of the UCS based on limited experimental data.

2. Materials and Methods

2.1. Experiment Materials

The soil samples used in the experiments were collected from a water-rich soft clay stratum (burial depth: 10–30 m) traversed during the construction of a metro tunnel. In its natural state, the soil appeared grayish-brown and had a low organic matter content. After field collection, the samples were transported to the laboratory, oven-dried at a constant temperature of 105 °C for 12 h in accordance with the Standard for soil test method (GB/T 50123-2019) [26], mechanically pulverized, and sieved through a 2 mm standard sieve to prepare homogenized dry soil. The basic physical properties of the clay were also tested. The specific gravity was determined using the pycnometer method, the liquid and plastic limits were obtained by the liquid–plastic limit combined method, and the permeability coefficient was measured via the falling head permeability test. The basic physical parameters are presented in Table 1. As shown, the soil has a plasticity index (Ip) of 20.9 (>17) and a liquid limit below 50%. According to the Standard for Engineering Classification of Soil (GB/T 50145-2007) [27], the soil is classified as low-liquid-limit clay (CL) and can be defined as a soft clay.
A BT9300LD laser particle analyzer (Bettersize Instruments Ltd., Dandong, China) was used to assess the soft clay’s grain size distribution (measurable range: 0.1–1000.0 μm). Figure 1 shows the particle size distribution curve, which was produced using the wet dispersion method. The test results show that the soil is well graded, with a coefficient of uniformity (Cu) of 7.29 and a coefficient of curvature (Cc) of 1.67. According to the Standard for Engineering Classification of Soil (GB/T 50145-2007) [27], it can be determined to have good gradation.

2.2. Experimental Methods

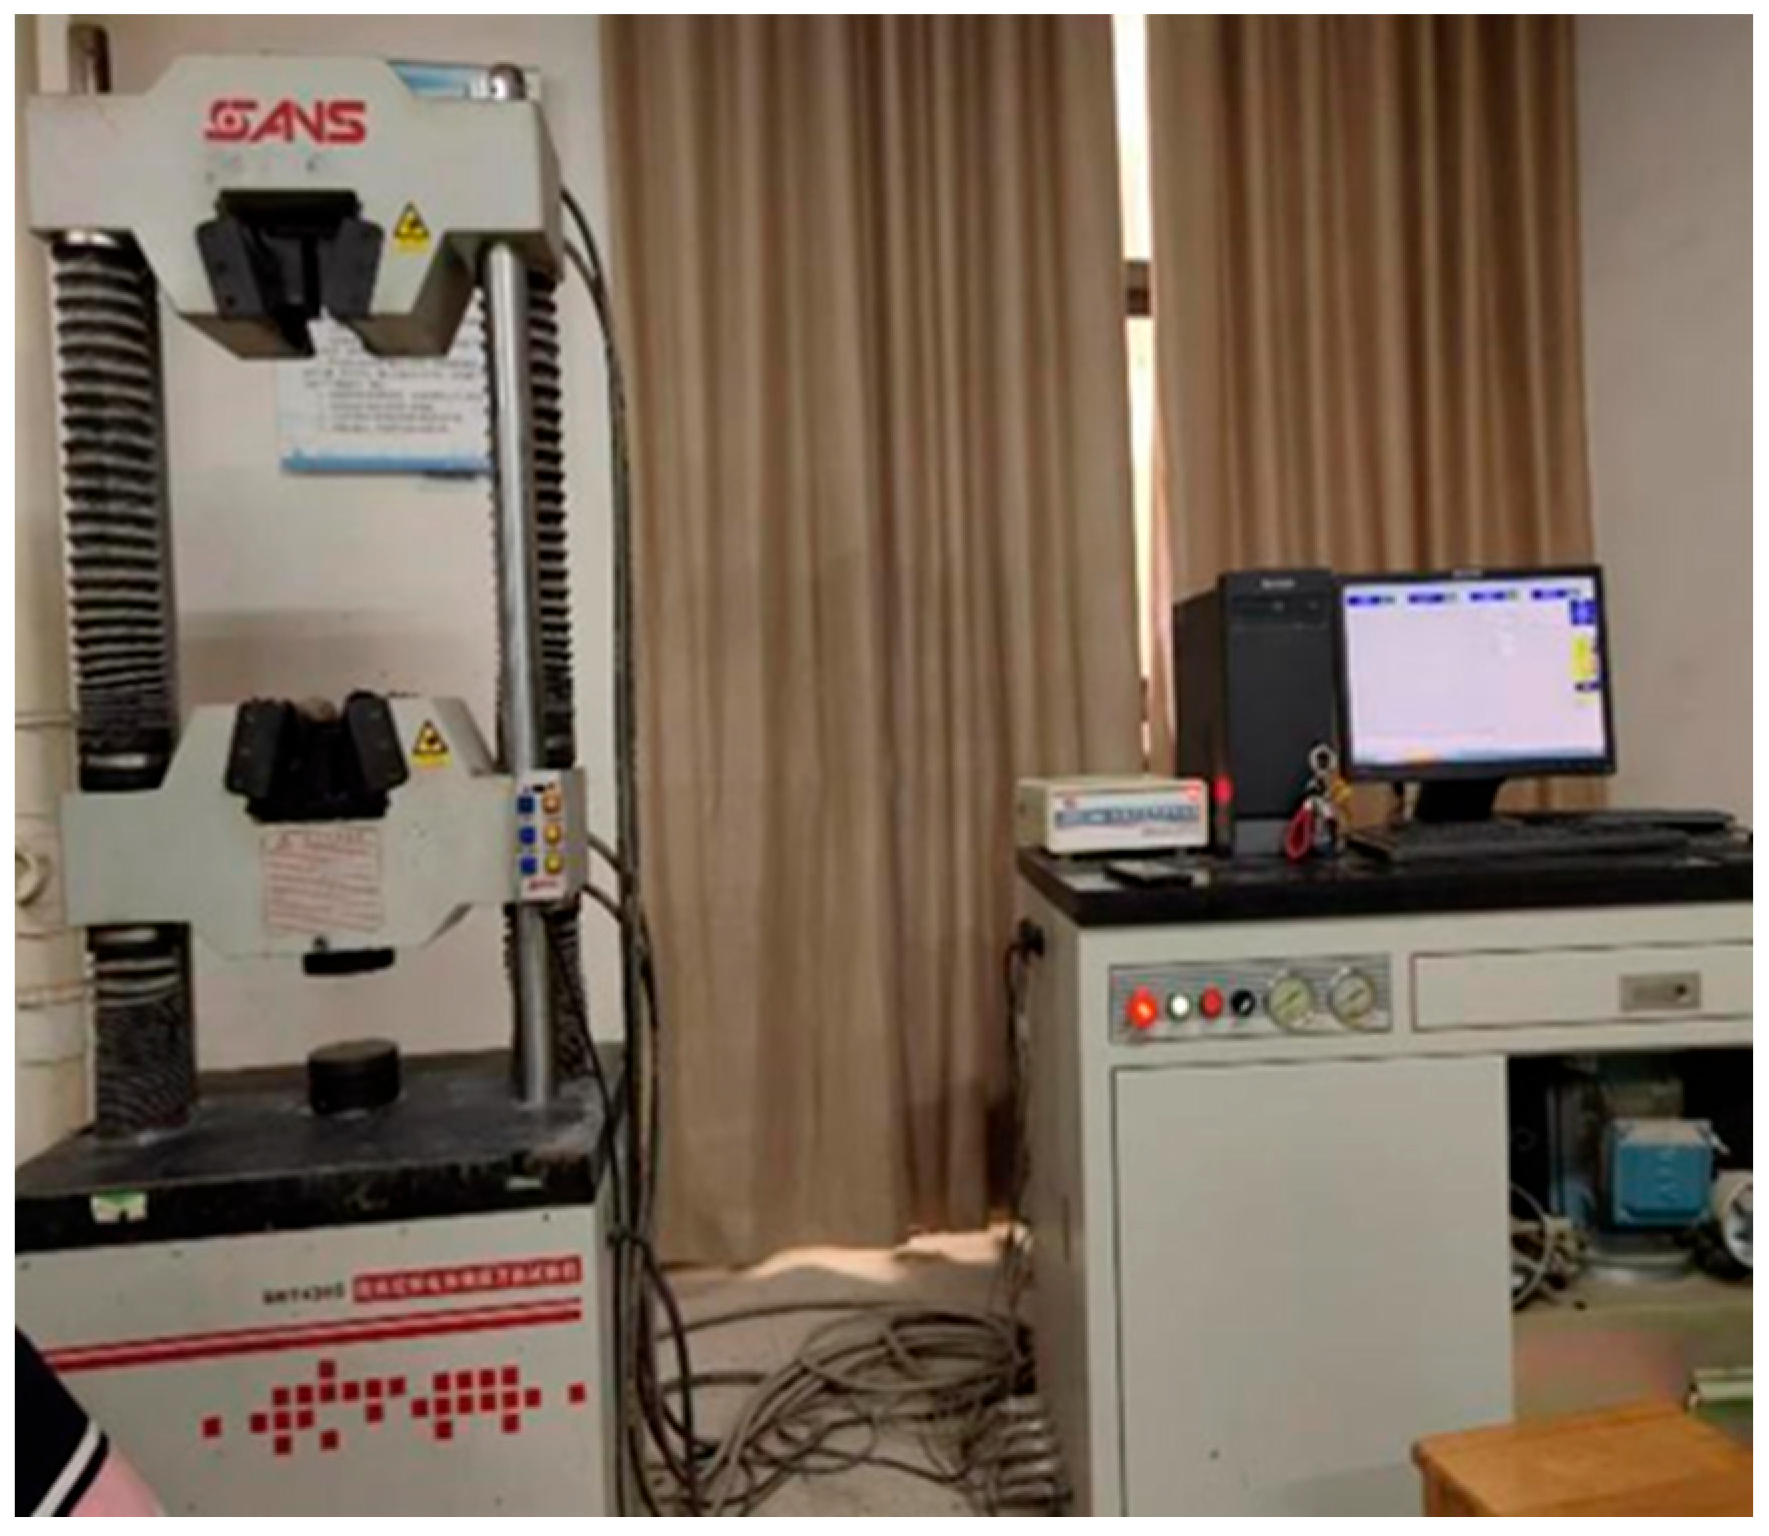
In this study, the effects of the cement dosage (1%, 3%, 5%, 7%, and 9%), moisture content (24%, 28%, and 32%), and curing age (3, 7, 14, and 28 d) on the UCS of cement-modified soft clay both before freeze–thaw action and after freeze–thaw action were investigated using an orthogonal experimental design system. For the cement dosage variable group, the moisture content was fixed at 28%, the age was fixed at 28 d, and the UCS was determined before and after freeze–thaw action at five dosage gradients. For the moisture content variable group, the cement dosage was fixed at 5%, the age was fixed at 28 d, and the UCS was determined before and after freeze–thaw action at three moisture contents. For the age variable group, the cement dosage was fixed at 5%, the moisture content was fixed at 28%, and the UCS was determined before and after freeze–thaw action at four ages. A total of 20 sets of specimens (10 sets each before and after freeze–thaw action) were tested. An SHT4305 microcomputer-controlled electro-hydraulic servo universal testing machine (Figure 2) was used to conduct the tests. This instrument has a 300 kN maximum load capacity, a ±1% load accuracy, and a 0.001 mm displacement resolution. The system supports full-range, equal-resolution data acquisition (1/500,000). The loading was executed in displacement-controlled mode at a constant rate of 1 mm/min, and the real-time synchronous monitoring of the axial pressure, displacement, and deformation was conducted.
To ensure uniform homogeneity during the mixing of the soil and cement, the cement–soil mixture was prepared by first thoroughly homogenizing dry soil with dry cement before adding water. The cement dosage (ac) is defined as the ratio of the mass of the cement (mc) to the mass of the dry soil (ms), and it is given by
a c = m c m s .
First, soft clay that had been oven-dried and sieved through a 2 mm screen was obtained. Specific masses of the soft clay and cement were weighed following the intended cement dosage, which was determined using a water-to-cement ratio of 0.5 in compliance with the Chinese industry standard JGJ/T 233-2011 Specification for the mix proportion design of cement soil [28]. After thorough homogenization of the soil and cement, water was added and mixed to prepare the cement–soil mixture. The cement soil material was sealed and simmered for 24 h and then fully moistened to make the cement soil samples. The freeze–thaw samples were frozen at −10 °C for 48 h and then thawed at 20 °C for 24 h (simulating natural thawing). This regime follows the established methodology for assessing freeze–thaw durability in geotechnical research, which employs controlled sub-zero temperatures and sufficient durations to ensure complete phase change, as demonstrated in studies of cement-treated soils [25,29]. An unconfined compression test was performed, i.e., the samples were in full contact with the press. When the axial force reached the peak value or stabilized, the pressing was continued until 3–5% strain was reached, at which time the test was terminated. If the axial force did not reach a stable value, the test was carried out until the axial strain reached 15%, at which time the test was terminated. The stress (longitudinal)–strain (transverse) curves were plotted, and the peak stress was taken as the UCS of the cement-improved soft clay, q. When there was no peak value, the stress value corresponding to 15% axial strain was taken as the UCS of the hydraulic clay [26].

2.3. Experimental Results

UCS tests of the cement-improved soft clay before and after freeze–thaw action were carried out to analyze the UCS of the cement-improved soft clay under different influencing factors before and after freeze–thaw action.

2.3.1. Influence of Cement Dosage

The impact of the cement dosage (1–9%) on the uniaxial compressive damage pattern of the cemented soil before freeze–thaw action is depicted in Figure 3. The test results revealed that the damage pattern was significantly correlated with the cement dosage: When the dosage was 1%, the specimens exhibited typical plastic damage characteristics, i.e., 45° diagonal cracks and compression bulging. When the dosage was 3%, the diagonal Y-shaped cracks were accompanied by localized bulging, indicating that the material began to transition to brittleness. When the dosage was 5%, the bulging was lessened, and Y-shaped cracks were visible, indicating the development of brittle damage features. When the dosage was 7%, the cracks developed into a vertical penetration form. When the dosage was 9%, through cracks were completely formed, exhibiting a brittle damage pattern. The changes demonstrated the process of the specimen’s evolution from plasticity to brittleness as the cement content increased.
The variations in the stress–strain relationship curve with increasing cement dosage for the cement soil before and after freeze–thaw action are shown in Figure 4. Before freeze–thaw action, the peak stresses of the cemented soil increased with increasing cement dosage before freeze–thaw action. The curve was relatively flat at a dosage of 1%, and the strain reached 15% without a significant peak, exhibiting a strain-hardening type curve. The curve steepened at dosages of 3–9%, the peak stress began to appear, and the curve morphology changed to a strain-softening type. The peak stress increased linearly with increasing dosage, indicating that the sample became more brittle. After freeze–thaw action, the shapes of the individual dosage curves after freeze–thaw action were comparable to those of the curves before freeze–thaw action; however, the slopes of the hardening and softening phases were generally less steep. This was specifically demonstrated by the following key change: the attenuation of the peak stresses in all of the doped samples. These results confirmed the deteriorating effect of freeze–thaw action on the strength of the cement-improved soils. The material’s enhanced ductility and decreased brittleness were reflected in the increase in the peak strain and the reduction in the slope of the curve. Comparative analysis revealed that the rate of the strength loss due to freeze–thaw action was positively correlated with the cement dosage, and the degradation of the mechanical properties was more significant in the high-dosage samples. This shift in damage mode from brittle to plastic was essentially a macroscopic manifestation of the weakening of the material’s internal structure caused by freeze–thaw damage.

2.3.2. Influence of Moisture Content

The uniaxial compressive test conducted on the soil samples with different moisture contents before freeze–thaw action resulted in different damage morphologies. The samples with a moisture content of 24% developed 45° penetration cracks accompanied by uniform vertical cracks, and the damage pattern was predominantly brittle. The samples with a moisture content of 28% exhibited several 45° cracks with an increased crack width, as well as a few transverse cracks, representing a transition between brittle and plastic damage. The sample with a moisture content of 32% exhibited the widest diagonal fissures, while the transverse cracks were highly developed and followed by bulging, indicating characteristics of plastic damage. It was evident that as the moisture content increased, the damage mode of the cement samples shifted from brittle to plastic. The uniaxial compressive strength tested damaged samples of cement with different moisture contents are shown in Figure 5.
Figure 6 shows the stress–strain curves of the cement-improved soil at an age of 28 days, with a 5% cement dosage, and with varying moisture contents (24%, 28%, and 32%) before and after freeze–thaw action. The freeze–thaw action altered the stress–strain behavior of the cement soils with different initial moisture contents. Before the freeze–thaw action, all of the moisture content samples exhibited typical strain-softening characteristics; the stress peaked and then decreased gently with increasing strain, and the peak stress decreased with increasing moisture content. After the freeze–thaw action, the stress–strain curve still maintained the strain-softening mode. However, the peak stress was lower compared with that before the freeze–thaw action, and the decrease was positively correlated with the moisture content. In addition, the freeze–thaw action led to a significant deterioration of the curve morphology: the smoothness was reduced, the nonlinear characteristics were enhanced, and the rate of post-peak stress decay was intensified (steepening of the curve). The volatility of the descending section increased. These findings suggest that by impairing the soil body’s structural integrity, the freeze–thaw action caused strength loss, ductility degradation, and increased brittleness. A high initial moisture content exacerbated this deterioration effect.

2.3.3. Influence of Aging

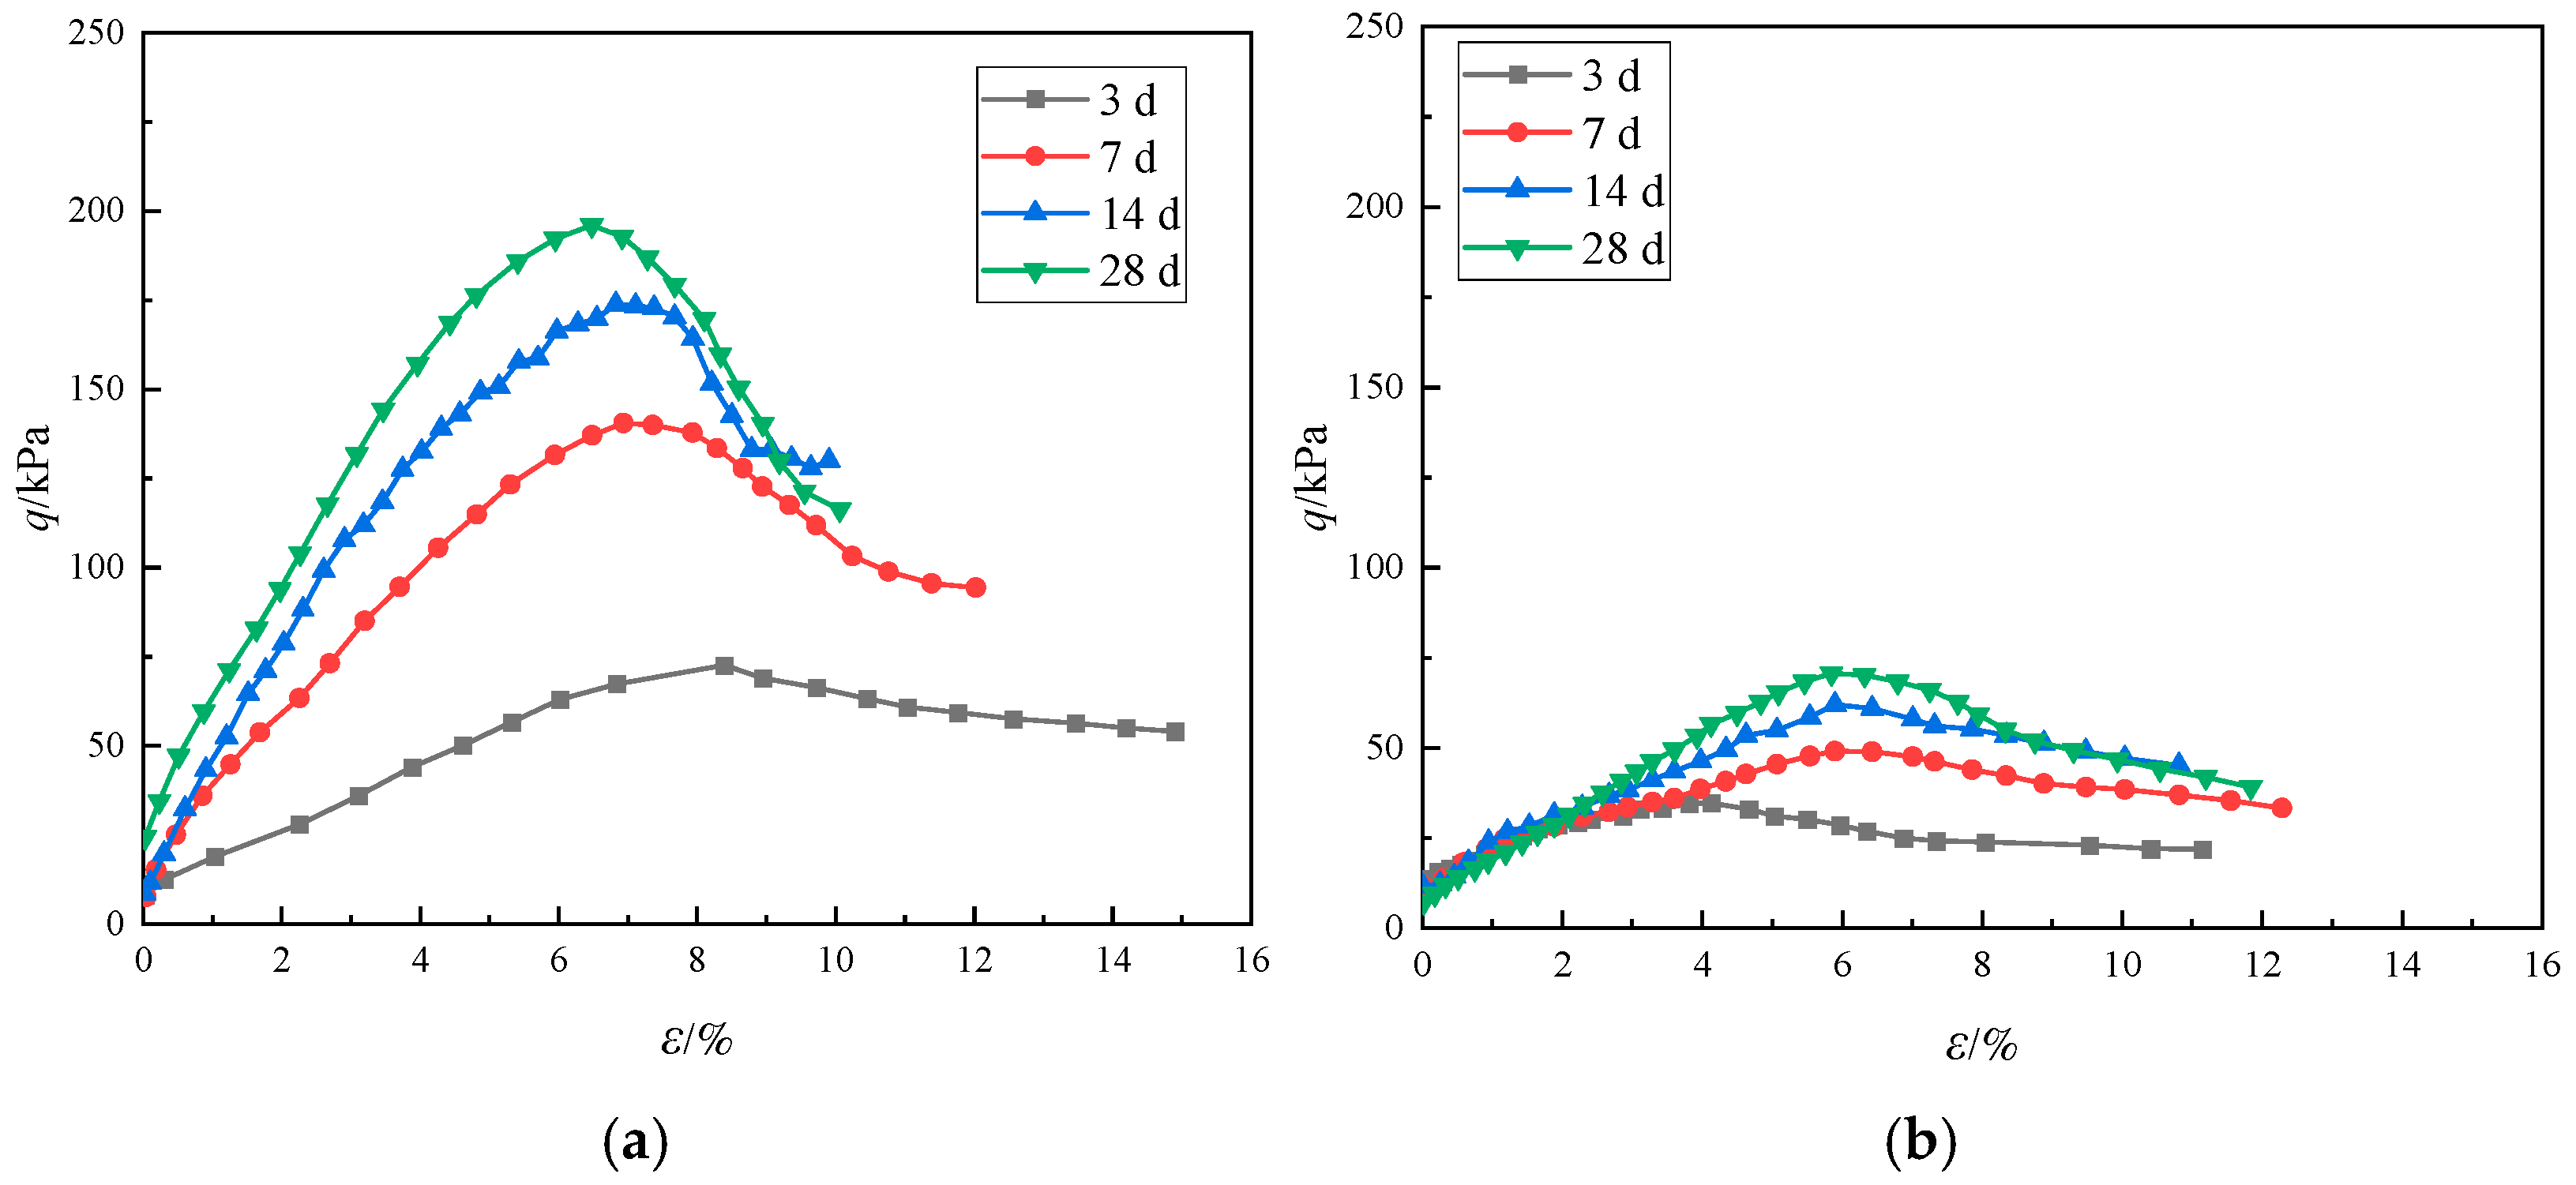
The stress–strain relationship characteristics of the cemented soils at different ages before and after freeze–thaw action are shown in Figure 7. Before freeze–thaw action, the samples of all ages exhibited typical strain-softening behavior, which was characterized by an increase in stress with increasing strain until it reached its peak, followed by a subsequent decay. The peak stress increased as the aging period lengthened, and the 28-day samples (i.e., cured for 28 days) reached the highest value of 200 kPa. After freeze–thaw action, the curves maintained the softening pattern but exhibited systematic deterioration: the peak stress decreased at all ages, and the magnitude of the decrease increased with increasing age. The peak stress of the 28-day samples after freeze–thaw action was 65% lower compared with that before freeze–thaw action at the same age. Regarding the shape of the curve, it was steeper during the hardening stage before freeze–thaw action and tended to flatten after freeze–thaw action, with the hardening characteristics fading and the rate of stress decrease slowing after the peak. This was attributed to the delayed crack expansion caused by ice crystal cementation [30]. In addition, the freeze–thaw action led to a reduction in the ultimate strain and weakened the effect of age on the deformability. This revealed that the freeze–thaw cycles exacerbated the loss of strength in older samples by simultaneously destroying the structure of the cement hydration products and impairing the deformation coordination capacity of the soil.

3. Analysis of Strength Variation Patterns

3.1. Factors Influencing the Compressive Strength

The effects of the cement dosage, moisture content, and curing age on the strength characteristics of cement-improved soft clay before and after freeze–thaw action were systematically investigated by means of UCS tests. The growth rate of the strength was defined as η = q/q0 to measure the relative change in strength under the influence of each factor. The baseline sample’s parameters were as follows: moisture content w = 28%, cement dosage ac = 5%, curing age T = 28 d, and water–cement ratio 0.5.

3.2. Variations in the Growth Rate of Strength

The effect of the cement dosage on the compressive strength and its growth rate is shown in Figure 8. Before and after freeze–thaw action, the compressive strength of the samples increased with increasing cement dosage (from 1% to 9%). The strength increased from 91.71 kPa to 345.98 kPa before freeze–thaw action and from 21.91 kPa to 202.29 kPa after freeze–thaw action. This demonstrated that increasing the cement dosage effectively enhanced the strength. This was mainly because the hydration products filled the soil pores and formed a stabilizing network structure, which improved the strength and stiffness of the material [31,32]. Correspondingly, the growth rate of the strength before and after freeze–thaw action increased with increasing cement dosage. This indicates that the cement dosage not only increased the absolute strength values but also accelerated the growth rate of the strength. The strength was always less after freeze–thaw action than before freeze–thaw action. For a cement dosage of 9%, the strength decreased from 345.98 kPa to 202.29 kPa, a decrease of 41.5%. This was attributed to the water phase change inducing microfissure expansion during the freeze–thaw process, which weakened the structural integrity [6,25]. Notably, the strength differential before and after freeze–thaw action decreased as the dosage increased, indicating that a high cement dosage may have helped to partially offset the strength loss caused by the freeze–thaw action. A similar pattern was observed for the strength growth rate curves before and after freeze–thaw action, and the growth rate after freeze–thaw action was slightly higher than that before freeze–thaw action at larger cement dosages. This indicates that the freeze–thaw action may have contributed to the strength growth under the high-cement-dosage conditions.
Before and after freeze–thaw action, the cement soil’s compressive strength and strength growth rate both declined as a power function of the moisture content (Figure 9). Before freeze–thaw action, the compressive strengths of the samples with moisture contents of 24%, 28%, and 32% decreased successively, and the strength of the sample with a moisture content of 32% was 63.5% lower than that of the sample with a moisture content of 24%. After freezing and thawing, the strength attenuation was more severe, and the strength loss reached 65.2% under the same increase in moisture content. This attenuation was caused by the increase in the moisture content, which resulted in a higher proportion of free water in the soil. This water diluted the concentration of the cement hydration products, reduced the proportion of cured material in the total volume, and weakened the cement strength. It also promoted the formation of a well-developed porous structure in the cement-improved clay, which further impaired the compactness and bearing capacity [15]. Before and after freeze–thaw action, the structural damage was exacerbated by the ice expansion stresses generated by the phase change in the moisture, which dilated the pores and induced microcracks [25]. It should be noted that the strength growth rate also decreased with increasing moisture content. The strength growth rate was about 1.3 when the moisture content was 24% before freeze–thaw action, and it decreased to 0.6 when the moisture content was 32%. Although it increased to 1.9 at a moisture content of 24% after freeze–thaw action, it decreased sharply to 0.7 at a moisture content of 32%. This phenomenon confirms that the volume expansion and pore coalescence effect caused by the phase change in the free water becomes the main failure mechanism under high-moisture-content conditions [6].
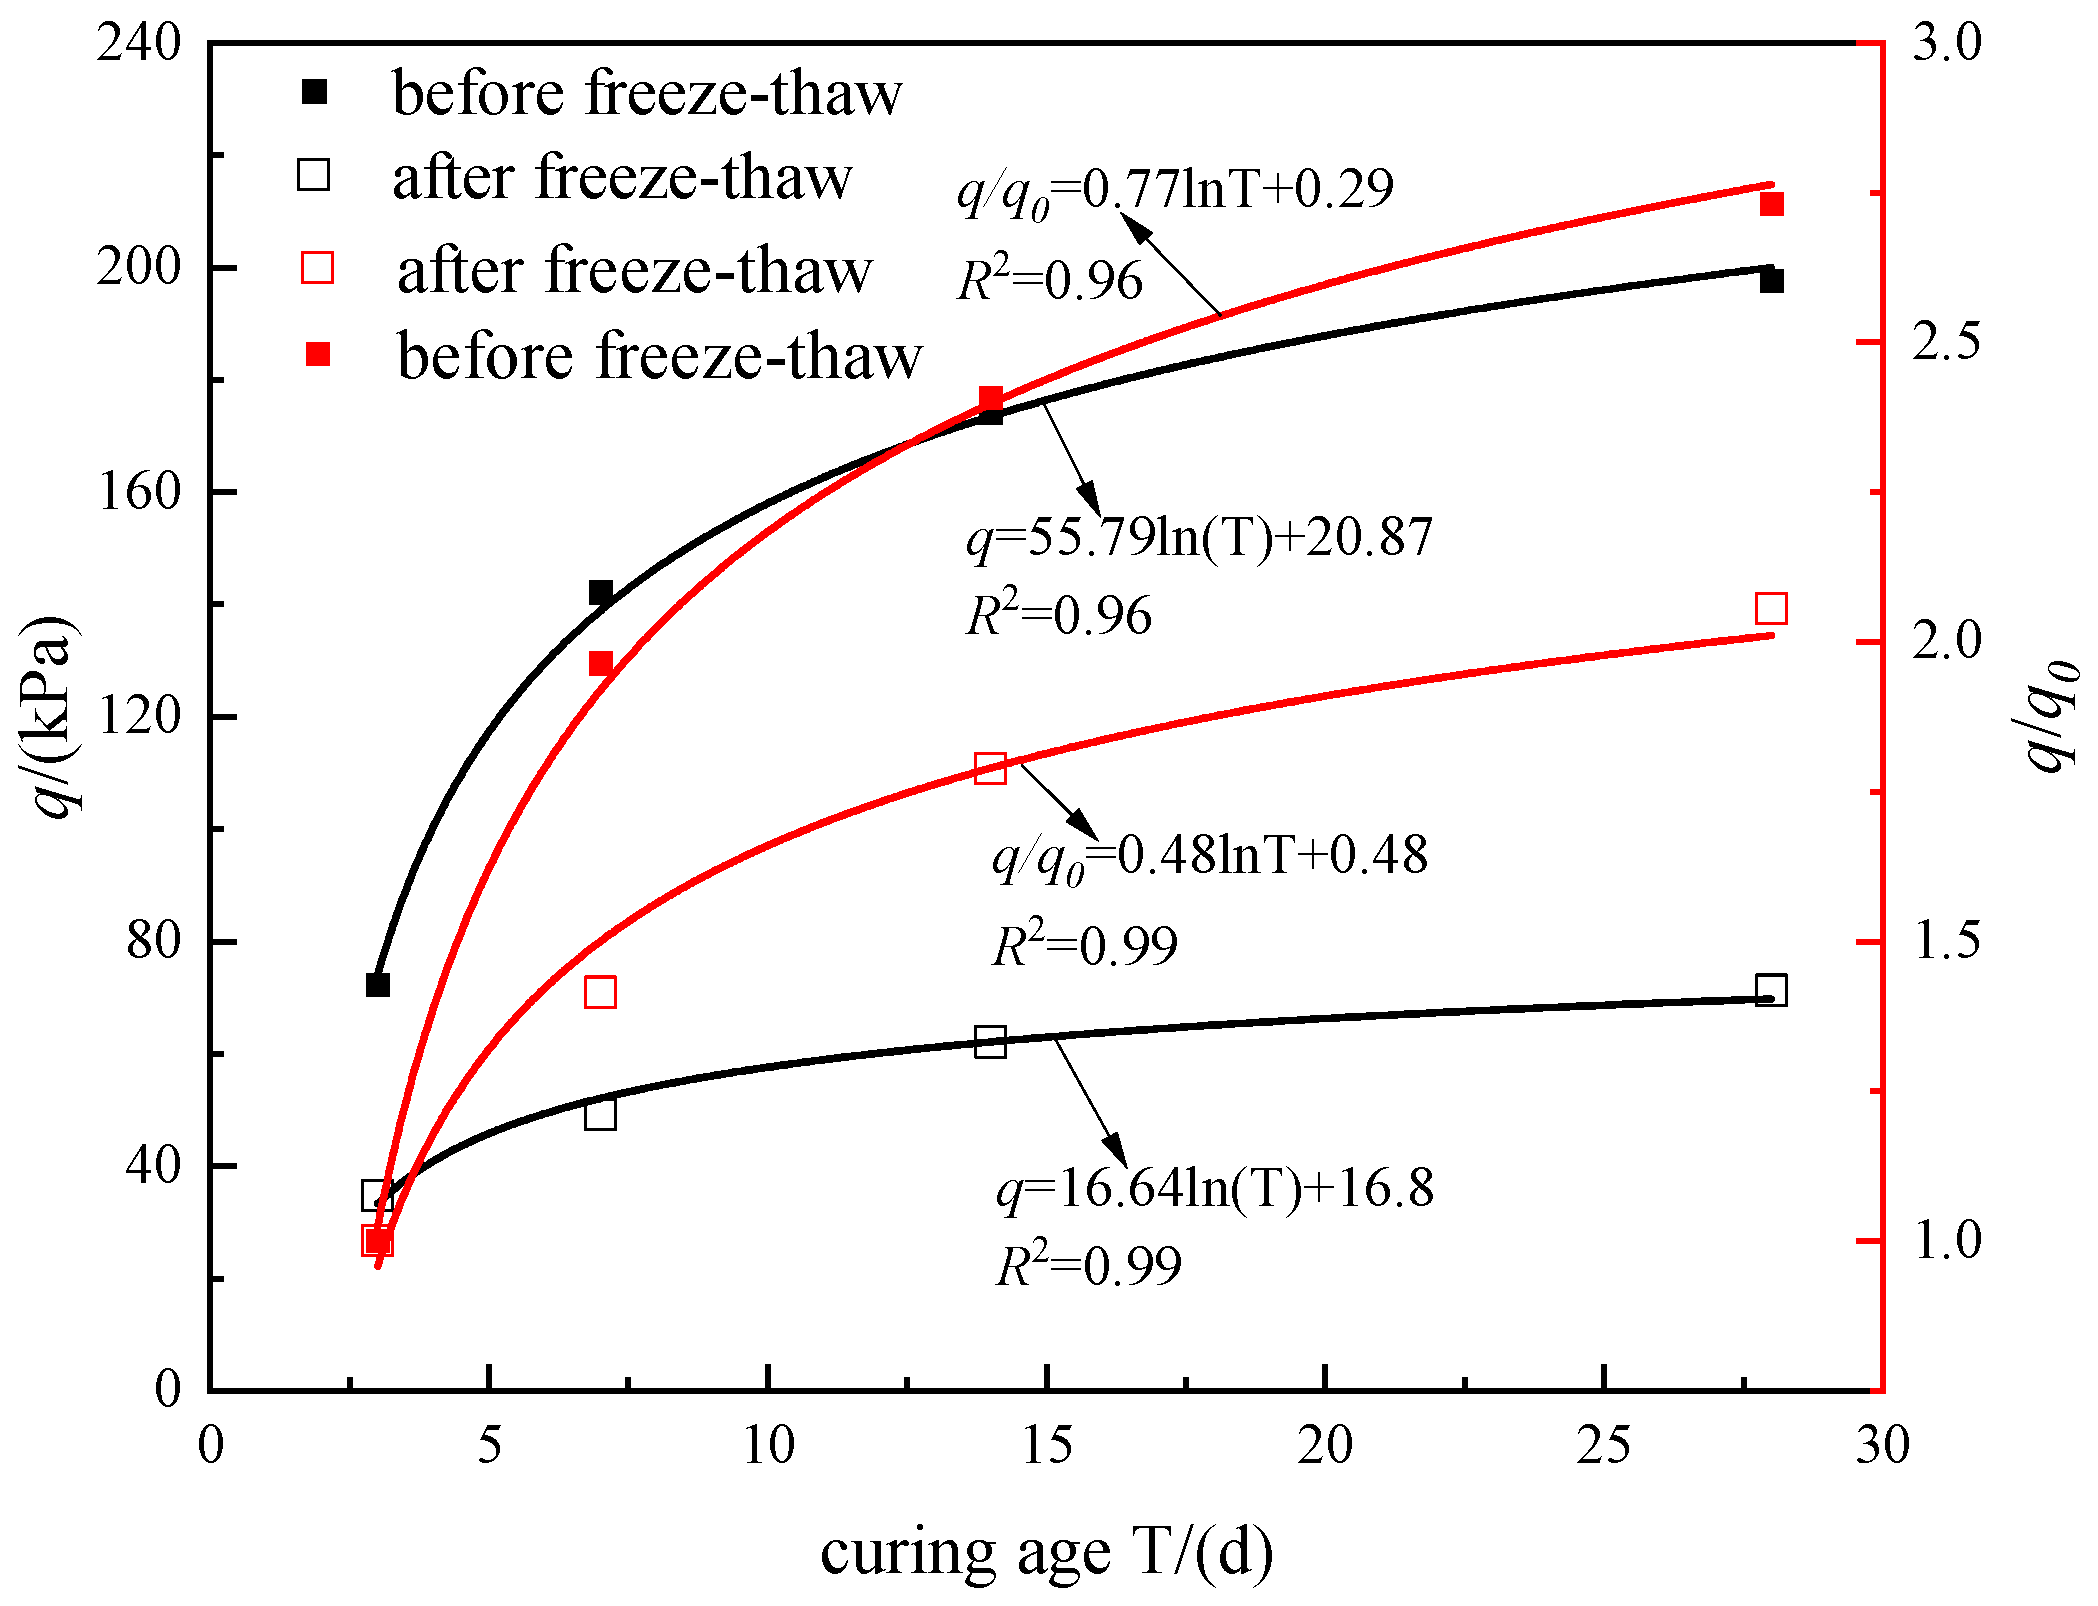
Both before and after freeze–thaw action, the compressive strength of the cement increased logarithmically with age, but the growth rate gradually slowed down (Figure 10) [33]. The freeze–thaw action weakened the capacity for strength development. Before the freeze–thaw action, the strength of the 28-day sample reached 197.71 kPa, which was 2.73 times higher than that of the 3-day sample. After freeze–thaw action, the strength of the 28-day sample decreased to 71.34 kPa, which was only 36.18% of the strength before freeze–thaw action, and it was 2.05 times higher than that of the 3-day sample. This difference stemmed from the dual action of the cement hydration advancement and freeze–thaw damage. The hydration products generated in the early stages of normal hydration filled the pores and formed a dense structure, which promoted stable strength growth. However, the freeze–thaw process destroyed the cementitious skeleton, induced the formation of microcracks, and inhibited the diffusion of water and ions through the internal stresses generated by the expansion of the pore water as it froze, which hindered the subsequent hydration reactions [25]. As a result, the strength growth factor of 16.64 after freeze–thaw action was only 29.8% of the value before freeze–thaw action (55.79). There was a stage-specific difference in the age sensitivity. In the early stage (T < 15 d), the growth rate was higher before freeze–thaw action because the structure was not fully hydrated and was susceptible to damage caused by freezing and expansion forces. With increasing age (T > 28 d), the difference between the strength growth rates before and after freeze–thaw action narrowed. The analysis revealed that the later hydration reaction generated new products that could partially fill and bridge the microcracks, thereby achieving structural repair.

4. Strength Prediction Model

The compressive strength test data for the cement soil were analyzed to establish a strength prediction model. It was discovered that the unconfined compressive strength exhibited a positive correlation with the curing age (T) and cement dosage (ac), and a negative correlation with the moisture content (w). Its strength was also correlated with the cement slurry’s water-to-cement ratio. The total ash–water ratio ε = C/W was defined to describe the relative concentration of the cement hydration products (effective cementing chemicals) per unit volume of hydraulic soil. This ratio essentially represents the degree of enrichment of the cementing phase in the system, making it more suitable for modeling the strength of cement soil. It is given by
C / W = a c a c W c + w ,
where W/c is the water–cement ratio of the cement slurry (set as 0.5 in this study). A regression analysis was conducted to examine the relationship between the cement strength q and the total ash–water ratio both before and after freeze–thaw action (Figure 11). Equation (3) shows the relationship before freeze–thaw action:
q = 0.41 q 0 e 0.83 C / W / 0.164 .
The relationship between the total ash–water ratio and cement strength q under freeze–thaw conditions is as follows:
q = 0.26 q 0 e 1.46 C / W / 0.164 ,
where q0 is the baseline strength for water content w = 28%, cement dosage ac = 5%, and age T = 28 d. (C/W)/0.164 is the coefficient of the ash–water ratio. It refers to the ratio of the total ash–water ratio of the cemented soil with different moisture contents and cement dosages to the total ash–water ratio of the reference sample. The cement strength q and the total ash–water ratio both increased exponentially before and after freeze–thaw action, and when the total ash–water ratio exceeded 0.5, the strength growth rate after freeze–thaw action was higher than that before freeze–thaw action.
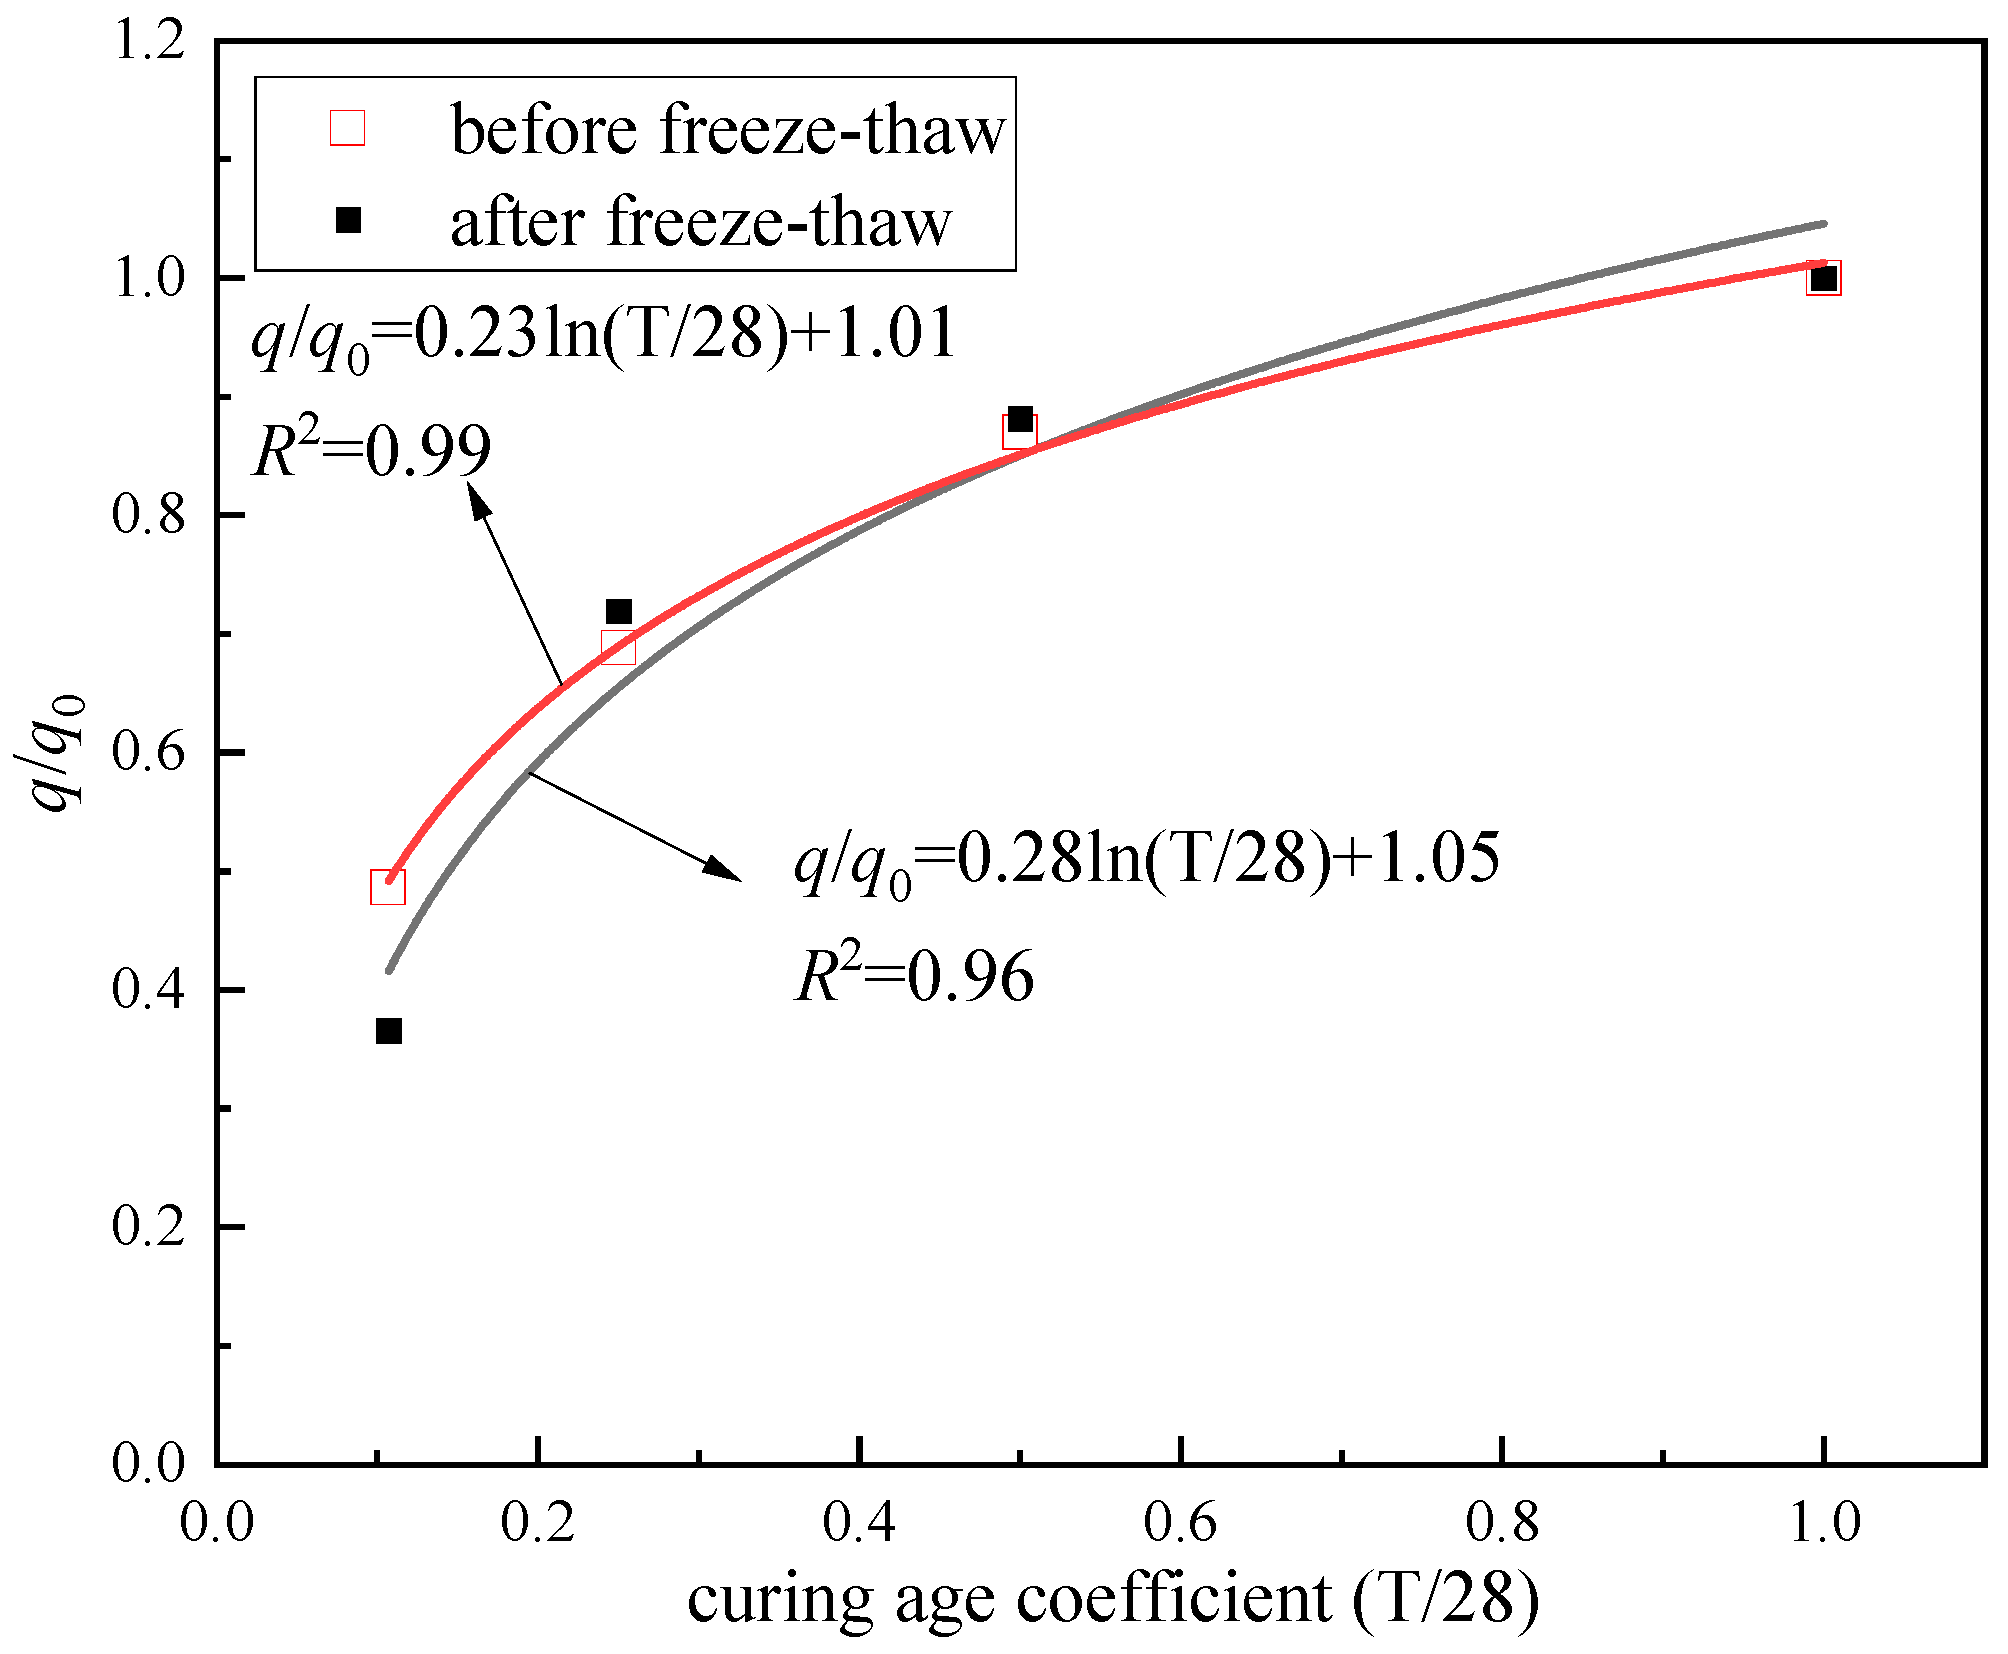
In addition, the strength growth rate of the cement before and after freeze–thaw action increased as a logarithmic function with increasing age (Figure 12). Through regression analysis, Equations (3) and (4) were further modified to obtain Equations (5) and (6), respectively:
q = 0.41 q 0 e 0.83 C / W / 0.164 · 0.28 ln T / 28 + 1.05 ,
q = 0.26 q 0 e 1.46 C / W / 0.164 · 0.23 ln T / 28 + 1.01 ,
where T/28 is expressed as the age coefficient relative to the 28-day age under a moisture content of w = 28% and a cement dosage of ac = 5%, which refers to the ratio of each age to the 28-day reference age. The statistical significance and validity of these developed logarithmic regression models were thoroughly evaluated using analysis of variance (ANOVA). The complete statistical outputs are summarized in Table 2 and Table 3.
We found that the model can effectively characterize the influences of the cement dosage, moisture content, and age on the strength of the cement soil before and after freeze–thaw action with satisfactory accuracy.

5. Conclusions

In this study, we investigated the influences of the cement dosage, moisture content, and curing age on the compressive strength of cement-improved soft clay before and after freeze–thaw action. The main conclusions of this paper are summarized below.
  • Increasing the cement dosage promoted a shift in the failure mode of the cement soil from plastic to brittle; conversely, freeze–thaw action induced the reverse effect, weakening the brittleness of the material while enhancing its ductility, leading to strength deterioration.
  • The strength of the improved soil increased with the increasing dosage of cement, but the strength was always lower after freeze–thaw action than before freeze–thaw action. The strength decreased by 41.5% at a dosage of 9%. The strength decreased with increasing moisture content. The strength of the sample with a moisture content of 32% was 63.5% lower than that of the sample with a moisture content of 24% before freeze–thaw action, and the reduction reached 65.2% after freeze–thaw action. The strength increased with increasing curing age, but the freeze–thaw action slowed its growth rate. The increase in strength during 28 days of curing was 2.73 times before freeze–thaw action, but it decreased to 2.05 times after freeze–thaw action. The strength was always lower after freeze–thaw action than before freeze–thaw action. A high cement dosage decreased the strength difference, a high moisture content exacerbated the decay after freeze–thaw action, and freeze–thaw action slowed the rate of strength growth with age.
  • The strength growth rate η before and after freeze–thaw action increased with increasing cement dosage, with slightly higher growth rates after freeze–thaw action for the higher dosages. The growth rate decreased as a power function as the moisture content increased. As the age increased, the rate of strength growth decreased, and the strength growth coefficient after freeze–thaw action was only 29.8% of the value of 55.79 before freeze–thaw action. Freezing–thawing prevented strength growth, particularly in the early ages and at high moisture contents, but it may have accelerated the strength growth at high cement dosages.
  • Based on the above-mentioned influencing factors, a strength prediction model for cement-improved soft clay that undergoes freeze–thaw cycles was developed.

6. Discussion

Through indoor tests, this work created a strength prediction model and demonstrated the effects of cement content, moisture content, and age on the strength characteristics of cement-improved soft clay before and after freeze–thaw cycles. The studies did not take into account the impacts of salt corrosion, dynamic load coupling, or complex temperature routes (such as progressive freeze–thaw cycles) in real engineering projects, and they only replicated typical freeze–thaw settings (−10 °C to 20 °C). Field-measured data from frozen soil engineering projects did not support the model’s validation, which was dependent on laboratory-prepared specimens. There have not been any microscopic examinations of the processes that underlie the brittle–ductile reversal brought on by a high cement content, such as interactions between cement hydration products and ice crystal surfaces. In order to increase the model’s applicability, future studies should employ multi-field coupling experiments involving saline soils, freeze–thaw cycles, and dynamic stresses. They should also combine CT scanning or electron microscopy techniques to quantify the patterns of the evolution of soil pore structure and cementation networks during these cycles. Shield tunneling projects in water-rich strata should implement long-term monitoring to confirm the predictive model’s accuracy under actual freeze–thaw boundary circumstances.

Author Contributions

Conceptualization, F.L. and S.W.; methodology, L.L.; validation, C.T., Y.H. and S.W.; formal analysis, S.W.; investigation, L.L.; resources, S.W.; data curation, C.T. and T.W.; writing—original draft preparation, F.L.; writing—review and editing, F.L.; visualization, T.W.; supervision, S.W.; project administration, Y.H. and T.W.; funding acquisition, S.W. All authors have read and agreed to the published version of the manuscript.

Funding

This research was funded by the National Natural Science Foundation of China (grant numbers 12562039 and 42167024 ), the Natural Science Foundation of Jiangxi Province (grant numbers 20252BAC200338 and 20224BAB204068), and the Key Research and Development Program of Jiangxi Provincial Science and Technology Plan (grant number S2024ZPYFB0078), and was supported by the Graduate Innovation Fund of East China University of Technology (grant number DHYC-2025063).

Data Availability Statement

The data presented in this study are available upon request from the authors.

Conflicts of Interest

The authors declare no conflict of interest.

References

  1. Li, L.; Qiao, Y.; Chai, J.; Ding, W. Effects of Confined Aquifer on Water-Sand Gushing Disasters in Soft Soil. J. Rock Mech. Geotech. Eng. 2025, in press. [Google Scholar] [CrossRef]
  2. Peng, S.; Huang, W.; Luo, G.; Cao, H.; Pan, H.; Mo, N. Failure Mechanisms of Ground Collapse Caused by Shield Tunnelling in Water-Rich Composite Sandy Stratum: A Case Study. Eng. Fail. Anal. 2023, 146, 107100. [Google Scholar] [CrossRef]
  3. Go, G.-H.; Le, V.D. Optimization Study on Artificial Ground Freezing in Elliptical Tunnel Construction: A Comprehensive Analysis of Groundwater Flow and Thermodynamic Parameters of Soil. Tunn. Undergr. Space Technol. 2025, 163, 106774. [Google Scholar] [CrossRef]
  4. Huang, J.; Yan, G.; Yang, L. Analysis of Freezing Temperature Field of Cement-Improved Soil in Connecting Channels. J. Civ. Eng. 2021, 54, 108–116. (In Chinese) [Google Scholar]
  5. Xu, X.; Yao, Z.; Chang, Y. Study on a Fractional-Order Constitutive Model for Frozen Cement-Modified Peat Soil. KSCE J. Civ. Eng. 2026, 30, 100331. [Google Scholar] [CrossRef]
  6. De Jesús Arrieta Baldovino, J.; Dos Santos Izzo, R.L.; Rose, J.L. Effects of Freeze–Thaw Cycles and Porosity/Cement Index on Durability, Strength and Capillary Rise of a Stabilized Silty Soil Under Optimal Compaction Conditions. Geotech. Geol. Eng. 2021, 39, 481–498. [Google Scholar] [CrossRef]
  7. Yang, X.; Hu, Z.; Li, H.; Wang, Y.; Zhang, Y.; She, H.; Wang, X. Effect of Freeze-Thaw Cycles on Mechanical Properties and Microstructure of Artificially Prepared Site Soil. Constr. Build. Mater. 2025, 485, 141878. [Google Scholar] [CrossRef]
  8. Yaqin, Z.; Ping, Y.; Ting, Z.; Linliang, H. Experimental Evaluation on Dynamic Strength Characteristics of Saline Clay Subjected to Freeze-Thaw. Appl. Ocean Res. 2025, 160, 104633. [Google Scholar] [CrossRef]
  9. Consoli, N.; DallaRosa, A. Porosity-Cement Ratio Controlling Strength of Artificially Cemented Clays. J. Mater. Civ. Eng. 2021, 23, 1249–1254. [Google Scholar] [CrossRef]
  10. Consoli, N.; Rosa, D.; Cruz, R. Water Content, Porosity and Cement Content as Parameters Controlling Strength of Artificially Cemented Silty Soil. Eng. Geol. 2011, 122, 328–333. [Google Scholar] [CrossRef]
  11. Consoli, N. Voids/Cement Ratio Controlling Tensile Strength of Cement-Treated Soils. J. Geotech. Geoenviron. Eng. 2011, 137, 1126–1131. [Google Scholar] [CrossRef]
  12. Wang, F.; Li, K.; Liu, Y. Optimal Water-Cement Ratio of Cement-Stabilized Soil. Constr. Build. Mater. 2022, 320, 126211. [Google Scholar] [CrossRef]
  13. Li, X.; Yang, Y.; Zhang, H.; Yi, Y. Mechanical Properties and Failure Mechanism of Cemented Red Clay under Chemical Erosion Environment. Int. J. Environ. Pollut. 2016, 59, 156–168. [Google Scholar] [CrossRef]
  14. Shi, X.; Yang, P.; Li, L.; Wu, F. Investigating Mechanical Properties of Cemented Soil under Static and Dynamic Loading after a Freeze-Thaw Cycle. KSCE J. Civ. Eng. 2023, 27, 978–991. [Google Scholar] [CrossRef]
  15. Yao, K.; Pan, Y.; Jia, L.; Yi, J.T.; Hu, J.; Wu, C. Strength Evaluation of Marine Clay Stabilized by Cementitious Binder. Mar. Georesources Geotechnol. 2020, 38, 730–743. [Google Scholar] [CrossRef]
  16. Yao, K.; Xiao, H.; Chen, D.-H.; Liu, Y. A Direct Assessment for the Stiffness Development of Artificially Cemented Clay. Géotechnique 2019, 69, 741–747. [Google Scholar] [CrossRef]
  17. Zhang, R.J.; Santoso, A.M.; Tan, T.S.; Phoon, K.K. Strength of High Water-Content Marine Clay Stabilized by Low Amount of Cement. J. Geotech. Geoenviron. Eng. 2013, 139, 2170–2181. [Google Scholar] [CrossRef]
  18. Horpibulsk, S.; Rachan, R.; Suddeepong, A.; Chinkulkijniwat, A. Strength Development in Cement Admixed Bangkok Clay: Laboratory and Field Investigations. Soils Found. 2011, 51, 239–251. [Google Scholar] [CrossRef]
  19. Lorenzo, G.A.; Bergado, D.T. Fundamental Characteristics of Cement-Admixed Clay in Deep Mixing. J. Mater. Civ. Eng. 2006, 18, 161–174. [Google Scholar] [CrossRef]
  20. Cao, Z.; Zhang, D. Study on characterization parameters of unconfined compressive strength of cement soil. Chin. J. Rock Mech. Eng. 2015, 34, 3446–3454. (In Chinese) [Google Scholar]
  21. Sahlabadi, S.H.; Bayat, M.; Mousivand, M.; Saadat, M. Freeze-Thaw Durability of Cement-Stabilized Soil Reinforced with Polypropylene/Basalt Fibers. J. Mater. Civ. Eng. 2021, 33, 04021232. [Google Scholar] [CrossRef]
  22. Eskişar, T.; Altun, S.; Kalıpcılar, İ. Assessment of Strength Development and Freeze–Thaw Performance of Cement Treated Clays at Different Water Contents. Cold Reg. Sci. Technol. 2015, 111, 50–59. [Google Scholar] [CrossRef]
  23. Ding, M.; Zhang, F.; Ling, X.; Lin, B. Effects of Freeze-Thaw Cycles on Mechanical Properties of Polypropylene Fiber and Cement Stabilized Clay. Cold Reg. Sci. Technol. 2018, 154, 155–165. [Google Scholar] [CrossRef]
  24. Lu, J.; Tan, L.; Yang, H.; Wan, X.; Wang, Y.; Yan, Z. Experimental Study on the Hydro-Thermal-Deformation Characteristics of Cement-Stabilized Soil Exposed to Freeze-Thaw Cycles. Front. Earth Sci. 2023, 10, 1041249. [Google Scholar] [CrossRef]
  25. Lu, Y.; Liu, S.; Zhang, Y.; Li, Z.; Xu, L. Freeze-Thaw Performance of a Cement-Treated Expansive Soil. Cold Reg. Sci. Technol. 2020, 170, 102926. [Google Scholar] [CrossRef]
  26. GB/T 50123-2019; Standard for Soil Test Method. National Standards Compilation Group of People’s Republic of China: Beijing, China, 2019. (In Chinese)
  27. GB/T 50145-2007; Standard for Engineering Classification of Soil. National Standards Compilation Group of People’s Republic of China: Beijing, China, 2007. (In Chinese)
  28. JGJ/T 233-2011; Specification for Mix Proportion Design of Cement Soil. Ministry of Housing and Urban-Rural Development of the People’s Republic of China: Beijing, China, 2011. (In Chinese)
  29. Ma, Z.; Xing, Z.; Zhao, Y.; Hu, Y. Dynamic Strength Characteristics of Cement-Improved Silty Clay under the Effect of Freeze-Thaw Cycles. Sustainability 2023, 15, 3333. [Google Scholar] [CrossRef]
  30. Ding, F.; Song, L.; Yue, F. Study on Mechanical Properties of Cement-Improved Frozen Soil under Uniaxial Compression Based on Discrete Element Method. Processes 2022, 10, 324. [Google Scholar] [CrossRef]
  31. Peethamparan, S.; Olek, J.; Diamond, S. Mechanism of Stabilization of Na-Montmorillonite Clay with Cement Kiln Dust. Cem. Concr. Res. 2009, 39, 580–589. [Google Scholar] [CrossRef]
  32. Lemaire, K.; Deneele, D.; Bonnet, S.; Legret, M. Effects of Lime and Cement Treatment on the Physicochemical, Microstructural and Mechanical Characteristics of a Plastic Silt. Eng. Geol. 2013, 166, 255–261. [Google Scholar] [CrossRef]
  33. Saadeldin, R.; Siddiqua, S. Geotechnical Characterization of a Clay–Cement Mix. Bull. Eng. Geol. Environ. 2013, 72, 601–608. [Google Scholar] [CrossRef]
Figure 1. Particle grading curve.
Applsci 15 12233 g001
Figure 2. SHT4305 microcomputer-controlled electro-hydraulic servo universal testing machine.
Applsci 15 12233 g002
Figure 3. Damaged samples of cement soil with different cement dosages before freeze–thaw action: (a) 1%; (b) 3%; (c) 5%; (d) 7%; and (e) 9%.
Applsci 15 12233 g003
Figure 4. Stress–strain relationship curves of cement soil with different cement dosages before and after freeze–thaw: (a) before freeze–thaw action; (b) after freeze–thaw action.
Applsci 15 12233 g004
Figure 5. Uniaxial compressive strength-tested damaged samples of cement soil with different moisture contents before freeze–thaw action: (a) 24%, (b) 28%, (c) 32%.
Applsci 15 12233 g005
Figure 6. Stress–strain relationship curves of cement soil with different moisture contents before and after freeze–thaw: (a) before freeze–thaw action; (b) after freeze–thaw action.
Applsci 15 12233 g006
Figure 7. Stress–strain relationship curves of cement soil at different ages before and after freeze–thaw: (a) before freeze–thaw action; (b) after freeze–thaw action.
Applsci 15 12233 g007
Figure 8. Changes in the strength and strength growth rate with cement dosage before and after freezing–thawing of cement soil.
Applsci 15 12233 g008
Figure 9. Changes in the strength and strength growth rate with moisture content before and after freezing–thawing of cement soil.
Applsci 15 12233 g009
Figure 10. Changes in the strength and strength growth rate with age before and after freezing–thawing of cement soil.
Applsci 15 12233 g010
Figure 11. Relationship between strength growth rate and cement–water ratio coefficient of cement-improved soil before and after freeze–thaw action.
Applsci 15 12233 g011
Figure 12. Relationship between the strength growth rate and age of cement-improved soil before and after freeze–thaw action.
Applsci 15 12233 g012
Table 1. Fundamental physical parameters of soil samples.
Natural Moisture Content
(%)
Specific GravityMaximum Dry Density
(g/cm3)
Liquid Limit
(%)
Plastic Limit
(%)
Permeability Coefficient
(cm/s)
27.732.691.6923.844.72.13 × 10−7
Table 2. Analysis of variance (ANOVA) and goodness-of-fit statistics.
ConditionR2Adj. R2F-Valuep-ValueReduced Chi-Sqr
before freeze–thaw0.95750.9363249.750.003980.00484
after freeze–thaw0.99630.99454463.29<0.0012.76 × 10−4
Table 3. Parameter estimates and their statistical significance.
ConditionParameterValueStd Errort-Valuep-Value
before freeze–thawA0.282190.042036.710.0215
B1.04590.0571318.310.0030
after freeze–thawA0.233260.0100423.230.0019
B1.012730.0136574.19<0.001
Disclaimer/Publisher’s Note: The statements, opinions and data contained in all publications are solely those of the individual author(s) and contributor(s) and not of MDPI and/or the editor(s). MDPI and/or the editor(s) disclaim responsibility for any injury to people or property resulting from any ideas, methods, instructions or products referred to in the content.