Article

Diagnosis of Sarcoidosis Through Supervised Ensemble Method and GenAI-Based Data Augmentation: An Intelligent Diagnostic Tool

1
Manipal Institute of Technology, Manipal Academy of Higher Education, Manipal 576104, Karnataka, India
2
Department of Electronics and Communication Engineering, Manipal Institute of Technology, Manipal Academy of Higher Education, Manipal 576104, Karnataka, India
*
Authors to whom correspondence should be addressed.
Appl. Sci. 2025, 15(22), 12213; https://doi.org/10.3390/app152212213
Submission received: 13 September 2025 / Revised: 9 October 2025 / Accepted: 21 October 2025 / Published: 18 November 2025
(This article belongs to the Special Issue Exploring AI: Methods and Applications for Data Mining)

Abstract

Sarcoidosis, one of the rarest diseases, is challenging to diagnose as it mimics the symptoms of other diseases. Machine learning algorithms identify hidden patterns among symptoms, making them suitable for early diagnosis of Sarcoidosis. In this study, four ensemble models are developed using baseline classifiers and applied to a symptom-based secondary dataset to explore the hidden information. The dataset comprises 189 patient records with 14 attributes: 2 serum markers, 10 symptoms, the patient’s gender, and 1 target variable. An exploratory data analysis is carried out using necessary preprocessing techniques, including missing value imputation and data scaling. The features are selected using PCA, and the relevance of the features is analyzed using the Chi-Square Test, Mutual Information, Sequential Feature Selection, and Tree-Based Selection methods. CTGAN, a GenAI technique, is used to augment the dataset, as it contains only 189 records. CTGAN preserves the clinical fidelity of all the features pertaining to the diagnosis of Sarcoidosis, ensuring synthetic data retains meaningful diagnostic patterns. The performance of the models developed is evaluated by applying them to both the original and synthetic data. Results demonstrate that proposed ensemble methods, Model Combinations 1, 3, and 4, showed 99.47% accuracy on the original dataset, whereas Model Combination 1 and Random Forest classifier showed 85.19% and 60.78% accuracies on a combination of the original with 81 synthetic and 1000 synthetic data, respectively. This highlights the combined advantage of CTGAN-based augmentation and ensemble learning in enhancing diagnostic modeling for rare diseases like Sarcoidosis where the datasets are available with limited data points.

1. Introduction

The modern medical system and facilities have paved the way for research leading to the development of advanced drugs for the diseases which were thought to be incurable [1]. Drug development is easier if there are a large number of patient records available to perform the study in order to understand the natural history of the disease or if there is an understanding of the basic mechanisms that cause the disease [2]. If both are unavailable, then it is called a rare disease, and there are challenges faced in the drug development for these diseases.
Sarcoidosis is a rare inflammatory disease that can affect multiple organs in the body; however, in most cases, it affects the lungs and lymph glands in the chest. It can also affect other organs such as the skin, eyes, and lymph nodes [3]. Further, the symptoms of Sarcoidosis mimic the symptoms of other diseases such as mumps and tuberculosis. The diagnosis of Sarcoidosis can be challenging as there is no single test for its diagnosis, leading to frequent misdiagnosis or delayed diagnosis. Rather, the diagnosis relies on a combination of clinical evaluation, imaging studies, laboratory investigations, and thorough tissue biopsy. A systematic treatment becomes essential if organs such as the lungs, heart, or central nervous systems are involved [4]. Hence, early detection of the disease through technological interventions may help reduce the complications associated with Sarcoidosis [5].
Emerging machine learning (ML) technologies have shown their efficacy in the medicine and healthcare field, and they could also improve the diagnosis and treatment of rare diseases. The rare diseases that are usually misdiagnosed or not taken into consideration can be better identified using ML approaches. ML can take into consideration things that are often missed by medical professionals and provide valuable insights that can be used alongside traditional methods to provide more accurate diagnoses and better treatment for patients [6].
Rare diseases have limited patient records, and it is inconvenient to check the correctness of the ML model to predict the diseases. Data augmentation is a method to create a synthetic dataset that mimics the original dataset, providing hypothetical scenarios and enhancing the unbalanced data [7]. Healthcare researchers using ML have used Generative Artificial Intelligence (GenAI) tools such as the Synthetic Minority Oversampling Technique (SMOTE) and Conditional Tabular Generative Adversarial Network (CTGAN) to overcome the limitation on the size of the dataset to test the efficacy of the models.
The main goal of this study is to develop and evaluate different ML models for the accurate detection of Sarcoidosis. However, a major problem when trying to develop any ML model for rare diseases like Sarcoidosis is the limited availability of data. To overcome this problem, synthetic data is created and used along with the original data. The synthetic data is generated using the CTGAN, a collection of Deep Learning-based synthetic data generators, which can learn from the original data and generate synthetic data with high fidelity [8].
Symptom-based diagnosis of Sarcoidosis including clinical features and serum biomarkers offers several benefits over image-based methods, especially in the context of early and accurate detection. Unlike CT or PET imaging, which are costly, less accessible, and expose patients to radiation and often ambiguous findings mimicking conditions such as lymphoma or tuberculosis, symptom-based approaches can be deployed rapidly and at low cost, making them especially valuable in resource-limited or primary care settings [9].
The existing research work on Sarcoidosis focuses on images, and there is limited work on the classification of Sarcoidosis using ML based on its symptoms, populated in a CSV file. Further, the publicly available Sarcoidosis dataset is a small dataset with 189 patient records. Consequently, the synthetic dataset is generated using CTGAN, a Gen-AI data synthesizer that uses generative adversarial networks to generate synthetic tabular data. Hence, in this study, using the combination of synthetic and original data, different models including Logistic Regression (LR) [10], Decision Tree (DT) [11], Support Vector Machine (SVM) [12], K-Nearest Neighbor (K-NN) [13], Random Forest (RF) [14], and ensemble methods [15] are compared with the proposed ensemble methods that combine different baseline models in different configurations to get the best performing model.

2. Literature Review

The diagnosis of diseases traditionally involves the use of various clinical assessments, biopsy, and imaging, which can be time-consuming and require expertise from medical professionals. These methods can be combined with the use of ML techniques to give insights that help improve the accuracy and reduce the time taken for diagnosis. Various ML algorithms have been successfully applied in diagnosing various diseases [16]. The patients who suffer from rare diseases are more frequently hospitalized and suffer long-term consequences as the treatment may not work effectively [17]. Artificial Intelligence (AI) has already been used in oncology to predict survival time, recurrence risks, metastasis, and therapy response, which influence prognosis, and also to create diagnosis systems and screen health records [18].
In the cohort study conducted at Erasmus University Medical Center [19], the authors evaluated whether SIL-2R levels could reliably distinguish Sarcoidosis from other related conditions in patients suspected of the disease. Among 983 screened individuals, 189 met inclusion criteria, out of which 101 were diagnosed with Sarcoidosis (79 biopsy-confirmed). The results prove that the median sIL-2R levels were significantly elevated in Sarcoidosis patients (6100 pg/mL) compared to those with other conditions (2600 pg/mL) and healthy controls (1515 pg/mL).
Sánchez Fernández et al. used a Deep Learning (DL) approach for detecting cortical tubers in patients with tuberous sclerosis complex (TSC) using magnetic resonance imaging (MRI). The study used a DL approach to develop a diagnostic tool for rare diseases, where available data was limited. T2 and FLAIR axial MRI images, with and without tubers, from 114 patients with TSC and 114 control subjects, were used to train and validate different Convolutional Neural Network (CNN) architectures. The InceptionV3 CNN architecture showed the best performance on the testing set with the following results: F1-score (0.95), accuracy (0.95), and Area Under the Curve (0.99). The study’s generalizability is limited because it was based on a single collaborative effort and used a rather small dataset. The model’s performance in a real-world clinical situation may be impacted by bias as a result of the manual selection of data for training and testing [20].
Osipov et. al. [21] applied a machine learning-based symbolic regression model to identify immunological parameters that distinguish pulmonary Sarcoidosis from pulmonary tuberculosis and healthy controls. Their analysis revealed that the difference between naïve B-cell subset Bm2 and CD5-CD27- concentrations provided a highly significant discriminant (p < 0.00001), with an AUC of 0.823. Incorporating naïve T-regulatory cell levels into the model enhanced diagnostic accuracy, yielding sensitivities of 90.5% for Sarcoidosis and 88.5% for tuberculosis, while classifying 16–27% of cases as “dubious.” The resulting algorithm offers a parsimonious yet effective method to guide differential diagnosis between these granulomatous lung diseases based on immunological profiling.
Dai et al. conducted a study in which the National Inpatient Sample (NIS) database was used. In this study, the details of 4659 patients (attributes including age, gender, race, and comorbidities) who were hospitalized with a primary diagnosis of heart failure and a secondary diagnosis of Sarcoidosis were analyzed. The Least Absolute Shrinkage and Selection Operator (LASSO) regression was used to select variables. Three ML models, LR, RF, and XGBoost, were trained and validated. The RF model showed the best performance with an Area Under the Curve (AUC) score of 0.71 and sensitivity of 60%. The study showed the usefulness of ML models in medicine but faced limitations, including limited data and difficulty in model interpretation. Further investigation is required to improve model performance [22].
A study conducted by Van der Sar et al. used various dimensionality reduction methods and classifiers to diagnose Sarcoidosis using Electronic Nose (eNose) technology, which involved analyzing the breath patterns to detect Sarcoidosis. The study used breath samples from 224 Sarcoidosis patients and 317 patients with interstitial lung diseases. The study used different classifiers and dimensionality reduction methods and cross-validated them to find the best model. The model combining Feature Selection with RF showed the best performance with an accuracy of 87.1% and an AUC of 91.2%. The study, however, was conducted on a small dataset, so the results may not be generalizable, and the practical application of eNose-based diagnosis was not investigated [23].
Eckstein et al. used various ML algorithms, including logistic regression, KNN, DT, RF, SVM, Gradient Boosting (GBoost), Extreme Gradient Boosting (XGBoost), and voting classifiers for diagnosing Cardiac Sarcoidosis (CS). The study used multi-chamber Cardiac Magnetic Resonance (CMR) imaging data. The data included 45 CMR-negative, 18 CMR-positive Sarcoidosis patients, and 44 healthy individuals. The results showed that GBoost and XGBoost achieved the highest accuracy of 68% in distinguishing between CMR-positive and CMR-negative patients. This accuracy, however, improved when Feature Selection was applied and trained on a LR model, which achieved an accuracy of 89.47% [24].
A study conducted by Bobbio et al. analyzed the relationship between different clinical manifestations with CS outcomes and aimed to find the relative importance of clinical features influencing the overall survival of patients. A retrospective cohort of 141 patients with CS enrolled at two Swedish university hospitals was studied. The presentation, imaging studies, and outcomes of de novo CS and known extracardiac Sarcoidosis were compared. The RF was used to study the relative importance of clinical features in predicting outcome. The study found that the top predictors of worse event-free survival were impaired tricuspid annular plane systolic excursion, de novo CS, reduced right ventricular ejection fraction, absence of β -blockers, and lower left ventricular ejection fraction [25].
Attar et al. [26] proposed a method using Computer-Aided Detection for distinguishing Sarcoid cases from chest X-ray (CXR) images and distinguishing between Sarcoidosis, COVID-19, and normal cases. The study used a refined collection of Gray-Level Co-occurrence Matrix-based texture features to represent the segmented lung tissue accurately in every CXR image. The collected features were normalized and subsequently fed into a discriminative KNN model to classify the CXR image as Sarcoidosis, COVID-19, or normal. The study demonstrated a mean accuracy of 93.50% and precision and recall of 98% and 90.50%, respectively.
The effectiveness of features from 18F-fluorodeoxyglucose positron emission tomography (18F-FDG PET) and CMR in differentiating CS from cardiac-related clinical symptoms following COVID-19 was evaluated in the study that used 35 post-COVID-19 (PC) and 40 CS datasets. Regions of interest were manually delineated for the datasets, and radiomic features were extracted. Then the usefulness of individual features in the classification of CS vs. PC was tested using Mann–Whitney U-tests and LR. Maximum Target-to-Background Ratio showed high accuracy (0.91) for 18F-FDG PET, while gldm_Dependence Non-Uniformity had an accuracy of 0.75 for LGE-CMR. The study found that using a combination of PET and CMR features could lead to improved accuracy in differentiating cardiac Sarcoidosis from cardiac-related clinical symptoms [27].
The literature review revealed a significant gap in existing studies, which mainly focus on image-based data sets for the diagnosis of Sarcoidosis. The diagnosis based on imaging techniques is expensive and can be detected only when the lesions appear on the affected organs. However, other symptoms are detected first, and they could be used to identify and classify the disease based on the symptoms. Further, Sarcoidosis is a rare disease, due to which the number of patient records is also limited. The datasets in the study are limited, and there is a lack of research that focuses on symptom-based datasets, which motivates this study to address the identified gaps. The limitation in the number of patient records available for analysis further motivated us to use GenAI-based data augmentation techniques and understand its significance in classifying Sarcoidosis data effectively.

3. Materials and Methods

An exploratory data analysis is carried out to understand the dataset features, and accordingly, five data pre-processing techniques are applied to the original dataset. Since the size of the original dataset is small, with 189 patient records, the data augmentation is carried out by generating a synthetic dataset using CTGAN. Further, the performance of eight ML models and four proposed ensemble models is analysed to find the best model for classifying the Sarcoidosis data. The methodology followed in this study is shown in the Figure 1.

3.1. Data Wrangling

The Sarcoidosis dataset used in this study is provided as supplementary data in the base study [19], in which statistical analysis was carried out, and it is publicly available [28]. The dataset contains 189 patient records with 13 features and one target. The detailed dataset description is given in Table 1. A notable strength of the base study is the inclusion of a control group of non-Sarcoidosis patients. All participants were initially suspected of having Sarcoidosis, thereby covering a broad range of conditions that can mimic its presentation, from tuberculosis to psoriatic arthritis. This approach is considered to closely reflect real-world clinical practice. The results of the base study have limited applicability to clinical practice, as the study population does not represent the general population but rather a specialized cohort. To address this limitation, the dataset was augmented using generative AI. A synthetic dataset is generated using CTGAN, a GenAI-based data augmentation tool, since the secondary dataset is small with only 189 patient records. However, data wrangling methods are not employed because it is not a raw dataset. Nonetheless, exploratory data analysis is carried out to understand the characteristics of the Sarcoidosis dataset.

3.2. Exploratory Data Analysis (EDA)

EDA is one of the important steps in data analysis, which is used to understand the dataset and its characteristics, discover patterns, detect anomalies, and identify relationships between the different variables.
The dataset distribution has a significant impact on the outcome of the analysis made through ML. It gives an overview of how the data points are spread across the dataset. In the Sarcoidosis dataset, it is found that class 1 (has sarcoid) has 101 patient records and class 0 (does not have sarcoid) has 88 records, making the dataset 6.88% imbalanced. Since the difference is small, sampling methods are not employed.
The dataset contains missing values, and the number of missing values in each attribute is calculated. The results are shown in Table 2, and it is observed that 188 out of 189 values are missing in the attribute SRS. The attribute with the second maximum missing values is SPECT, followed by PET, which has more than 79% of missing data. Further, attributes indicating the involvement of organs such as lung, eye, neurological, and skin have 45.5% of data missing, and other attributes have less than 45% missing values, including histology, which contains 43.9% missing values, CT with 39.6% missing records, and thorax does not have 17.4% of its data.
A logistic regression is performed to determine whether missing values were Missing Completely at Random (MCAR) or Missing at Random (MAR). Histology, X-Thorax, CT, SPECT, and PET show missingness that depends on other observed features and therefore are MAR. Hence, multiple imputation (MI) is used to replace missing values while accounting for uncertainty, whereas SRS, Lung Involvement, Eye Involvement, Neurological Involvement, and Skin Involvement show missingness independent of observed variables, and therefore are MCAR. This implies that the missing values are random with respect to the measured features and imputations will not introduce bias.
A boxplot is one of the best ways to display the distribution of the data. It is useful in identifying outliers and the data distribution. The boxplot for the numerical features of the dataset is shown in Figure 2. The dataset has outliers that need to be dealt with. The number of outliers is counted and noted using the Interquartile range (IQR) method. The feature SIL 2R has 20 outliers, and ACE has 5 outliers. The outliers detected using the IQR method are statistically validated using Rosner’s test, which identified 19 outliers for the SIL 2R feature and 5 for ACE. The findings from Rosner’s test showed strong agreement with the IQR-based results.

3.3. Data Preprocessing

Data preprocessing involves cleaning, transforming, and integrating data to make it suitable for analysis. The preprocessing techniques used in this study are discussed in the following subsections.

3.3.1. Handling Missing Values

The Sarcoidosis dataset has more than 79% missing values in the three attributes, viz., SRS, SPECT, and PET. These features are dropped because of the volume of missing data. Moreover, the other attributes also have null values, and these are handled using the MI method. MI is used to handle the null values because simple methods of imputation, like replacing the null values with median or mode, result in oversimplification and lead to biased output [29].

3.3.2. Handling Outliers

The presence of outliers in the dataset during analysis leads to a distorted output, and two attributes, ‘SIL 2R’ and ‘ACE’, have outliers in the dataset. The outliers can be either removed from the dataset, capped, or left as is in the dataset. The different ways of handling outliers have different impacts on the analysis [30]. To analyze the effect of the outlier treatment, a subset of data is created where the outliers are removed, and another subset of data is created where the outlier is capped and brought within range (the range is calculated using the Inter-Quartile Range (IQR) method). The accuracy of the LR model is evaluated based on the original dataset, the dataset where the outliers are removed, and the dataset where the outliers are capped.
Based on this experimentation, the results showed that the model has the highest accuracy when the data is capped. Hence, for a reliable output, the Sarcoidosis dataset is capped and then used for further analysis.

3.3.3. Feature Scaling

Feature scaling is used to normalize the range of features of the data. The standardization and normalization methods are applied to the features ‘SIL 2R (in pg/mL)’ and ‘ACE (in U/mL)’ to see how it impacts the logistic regression model. A subset of data is standardized using the standard scaler approach, which removes the mean and scales each feature/attribute to unit variance. Another subset of data is normalized using min–max normalization, which scales the feature in a fixed range [0, 1]. The performance of the logistic regression model on both data subsets is noted.
The model trained on standardized data achieved an accuracy of 84.2% while the model trained on normalized data achieved an accuracy of 80.7 %. The standardized data performed 3.5% better than the normalized data. Hence, the data is standardized for further analysis.

3.3.4. Feature Selection

Feature selection is used to select the most relevant features to use in the model. To check the relevance of each feature, the Chi-Square Test, Mutual Information, SFS, and Tree-Based Selection (TBS) methods are used. The Chi-Square Test is a statistical tool used to check if two categorical variables are related or independent. It helps us understand if the observed data differs significantly from the expected data [31]. MI is a measure of the amount of information obtained about one variable through the other variable [32]. SFS is a greedy algorithm that iteratively adds or removes features from a dataset to improve the performance of a predictive model [33]. Tree-based Feature Selection methods use Tree-Based algorithms, Random Forest, to determine the importance of each feature [34]. These methods give the relevance of each feature, and based on the result, the features are selected. The Feature Selection methods are applied on ten features retained after dropping symptoms SPECT, SRS, and PET due to a large number of missing values, as mentioned in Section 3.3.1, and removing the target variable, Diagnosis. It is observed that, except for the Chi-Square method, the MI, SFS, and TBS methods showed the significance of the SIL 2R attribute in the detection of Sarcoidosis. This observation is further validated based on the findings in the work carried out in [19].
Table 3 summarizes the results of Principal Component Analysis (PCA), highlighting the first seven Principal Components (PCs), their corresponding Explained Variance (EV), and the top contributing clinical features. PC1 accounts for the highest variance (36.08%) and is predominantly influenced by features such as histology, CT, SIL 2R, and lung and eye involvement. Subsequent components (PC2–PC7) explain progressively less variance, with PC2 and PC3 contributing 13.13% and 12.09%, respectively. Across the components, certain features such as eye involvement, ACE levels, X-thorax, and neurological or skin involvement recur frequently, indicating their broad influence on the data’s underlying structure. It is observed from the PCA results that no single feature dominates all components, suggesting a complex, multi-dimensional interplay among clinical variables in the dataset.
After the analysis of results obtained from PCA, feature importance techniques such as Chi-Square, RFE, Tree-Based, Mutual Information, and SFS are applied to identify the most important features that influence the target value significantly.
The Chi-Square technique calculates a Chi-Square score and RFE generates a ranking for each feature or symptom, as shown in Table 4. It can be observed that SIL 2R and ACE have a high Chi-Square value, indicating a biased output. Further, except for X-thorax value, the first five features are marked important by both Chi-Square and RFE ranking techniques. The contribution of the sex parameter is negligible based on the Chi-Square score in the detection of Sarcoidosis.
The Tree-Based selection technique highlights the importance of Histology, CT, SIL 2R, X-thorax, and lung involvement. It can be observed that both Chi-Square and Tree-Based Selection give importance to X-thorax, whereas RFE ranking pushed it to the 6th position.
The feature importance analysis from the Tree-Based selection method shown in Table 5 indicates that Histology (0.432) is the most influential feature in diagnosing Sarcoidosis when using symptom-based data, followed by CT (0.252) and SIL 2R (0.129). Imaging-related variables such as X-thorax (0.095) also contribute significantly, while organ-specific involvement features (lung, eye, skin, neurological) and demographic factors (sex) show comparatively lower importance. This suggests that a combination of histological findings, imaging results, and certain serum markers plays a pivotal role in accurate diagnosis, whereas demographic and less commonly affected organ involvements have minimal predictive value in this dataset. The results highlight the potential of symptom-driven models, enriched with key diagnostic markers, to effectively supplement conventional image-based diagnostic procedures.
Mutual Information (MI) is a non-parametric metric which quantifies the amount of information that is shared between every feature in the dataset and the target variable, and it captures both linear and non-linear dependencies. MI helps to identify which clinical and diagnostic features carry the most informative value about Sarcoidosis, independent of model assumptions. Table 6 gives the MI scores for all the features considered and it can be observed that Histology has a highest MI score of 0.6224, showing a strong dependency to the target, followed by CT (0.468) and SIL 2R (0.332). Other features like the involvement of lung, eye, skin, and any other neurological symptoms do not exhibit any positive dependency in the diagnosis of Sarcoidosis.
Sequential Feature Selection is a wrapper method of Feature Selection, which is a step-by-step selection of the features based on their role in the performance of the model. Instead of ranking features individually, like Mutual Information or Tree-Based importance, SFS evaluates features in combination by training a model repeatedly and checking which combination results in the best performance. Table 7 gives the top five features selected through Sequential Forward Selection of features, which initially takes a null set of variables and in every iteration, a feature that is more significant with respect to the model is added to the feature set.
After the analysis of results obtained from PCA using various feature importance techniques such as Chi-Square, RFE, Tree-Based, Mutual Information, and Sequential Feature Selection given in Table 4, Table 5, Table 6 and Table 7, ‘Histology’, ‘CT’, ‘lung involvement’, ‘eye involvement’, ‘skin involvement’, ‘X-thorax’, ‘SIL 2R (in pg/mL)’ features are chosen based on their importance.

3.3.5. Synthetic Data Generation Using CTGAN

CTGAN is a collection of Deep Learning-based synthetic data generators for single-table data, which can learn from real data and generate synthetic data with high fidelity. The CTGAN model is trained on the original data and is used to generate new synthetic data. This dataset is used alongside the original data during model training and evaluation. The CTGAN model is used in two cases. In the first case, 81 synthetic data points are generated and combined with the original data. In the second case, 1000 synthetic data points are generated and combined with the original data. In the dataset where the 189 original data are combined with 89 synthetic data, there are 148 records for class 1 and 122 records for class 0. The dataset is 9.63% imbalanced. In the dataset where 1000 synthetic data are combined with the 189 original data, there are 604 records for class 1 and 585 records for class 0. The dataset is 1.60% imbalanced. In both cases, since the percentage of imbalance between the classes is small, sampling methods are not employed.

3.3.6. Splitting Dataset

If the size of the dataset is greater than 1000, the dataset is split into training and testing sets with a ratio of 70 to 30, where 70% is used to train the model and 30% to evaluate the model’s performance; otherwise, k-fold validation is used to evaluate the model.

3.4. Data Analysis

Data analysis involves using algorithms to analyze the data, identify patterns, and build models used to predict outcomes on new data. The following algorithms are used: Logistic Regression, Decision Tree, SVM (Support Vector Machine), k-NN (k-Nearest Neighbors), and Random Forest. Along with this, ensemble models are also used, where different models are combined to get better-performing models. The various combinations used are as follows:
  • Model Combination 1:
    Base Estimators: Decision Tree, Support Vector Machine, k-Nearest Neighbors
    Final predictor: Logistic Regression
  • Model Combination 2:
    Base Estimators: Logistic Regression, Support Vector Machine, k-Nearest Neighbors
    Final predictor: Decision Tree Classifier
  • Model Combination 3:
    Base Estimators: Logistic Regression, Decision Tree, k-Nearest Neighbors
    Final predictor: Support Vector Classifier
  • Model Combination 4:
    Base Estimators: Logistic Regression, Decision Tree, Support Vector Machine
    Final predictor: k-Nearest Neighbors
The model is trained on the training dataset and evaluated on the test dataset. The accuracy, sensitivity, specificity, and confusion matrix of each model are noted. K-fold validation is also performed on the models.

4. Results and Discussion

The performance of the proposed models is assessed through three distinct evaluations:
  • Evaluation on the Original Dataset: Performance validation under authentic real-world conditions.
  • Supplementary Experiments on Synthetic Data (81 data points): Analysis of model robustness and adaptability across diverse synthetic datasets in addition to the original dataset.
  • Extended Experiments on Large-scale Synthetic Data (1000 data points): Examination of scalability, consistency, and generalization in extensive simulated environments.

4.1. Evaluation on the Original Dataset

The Sarcoidosis dataset used in this study consisted of 189 records with 13 features. Exploratory Data Analysis showed that the dataset has 6.88% class imbalance. Since the imbalance is small, sampling methods are not employed. The dataset also had a significant number of missing values in several attributes. Attributes with more than 79% missing records are dropped, and missing values in other attributes are handled through multiple imputation. The features are standardized using Standard Scaler, after which the mean and standard deviation of the standardized features are as follows:
  • SIL 2R (in pg/mL): Mean = 7.52 × 10 17 , Standard Deviation = 1.00
  • ACE (in U/mL): Mean = 3.76 × 10 17 , Standard Deviation = 1.00
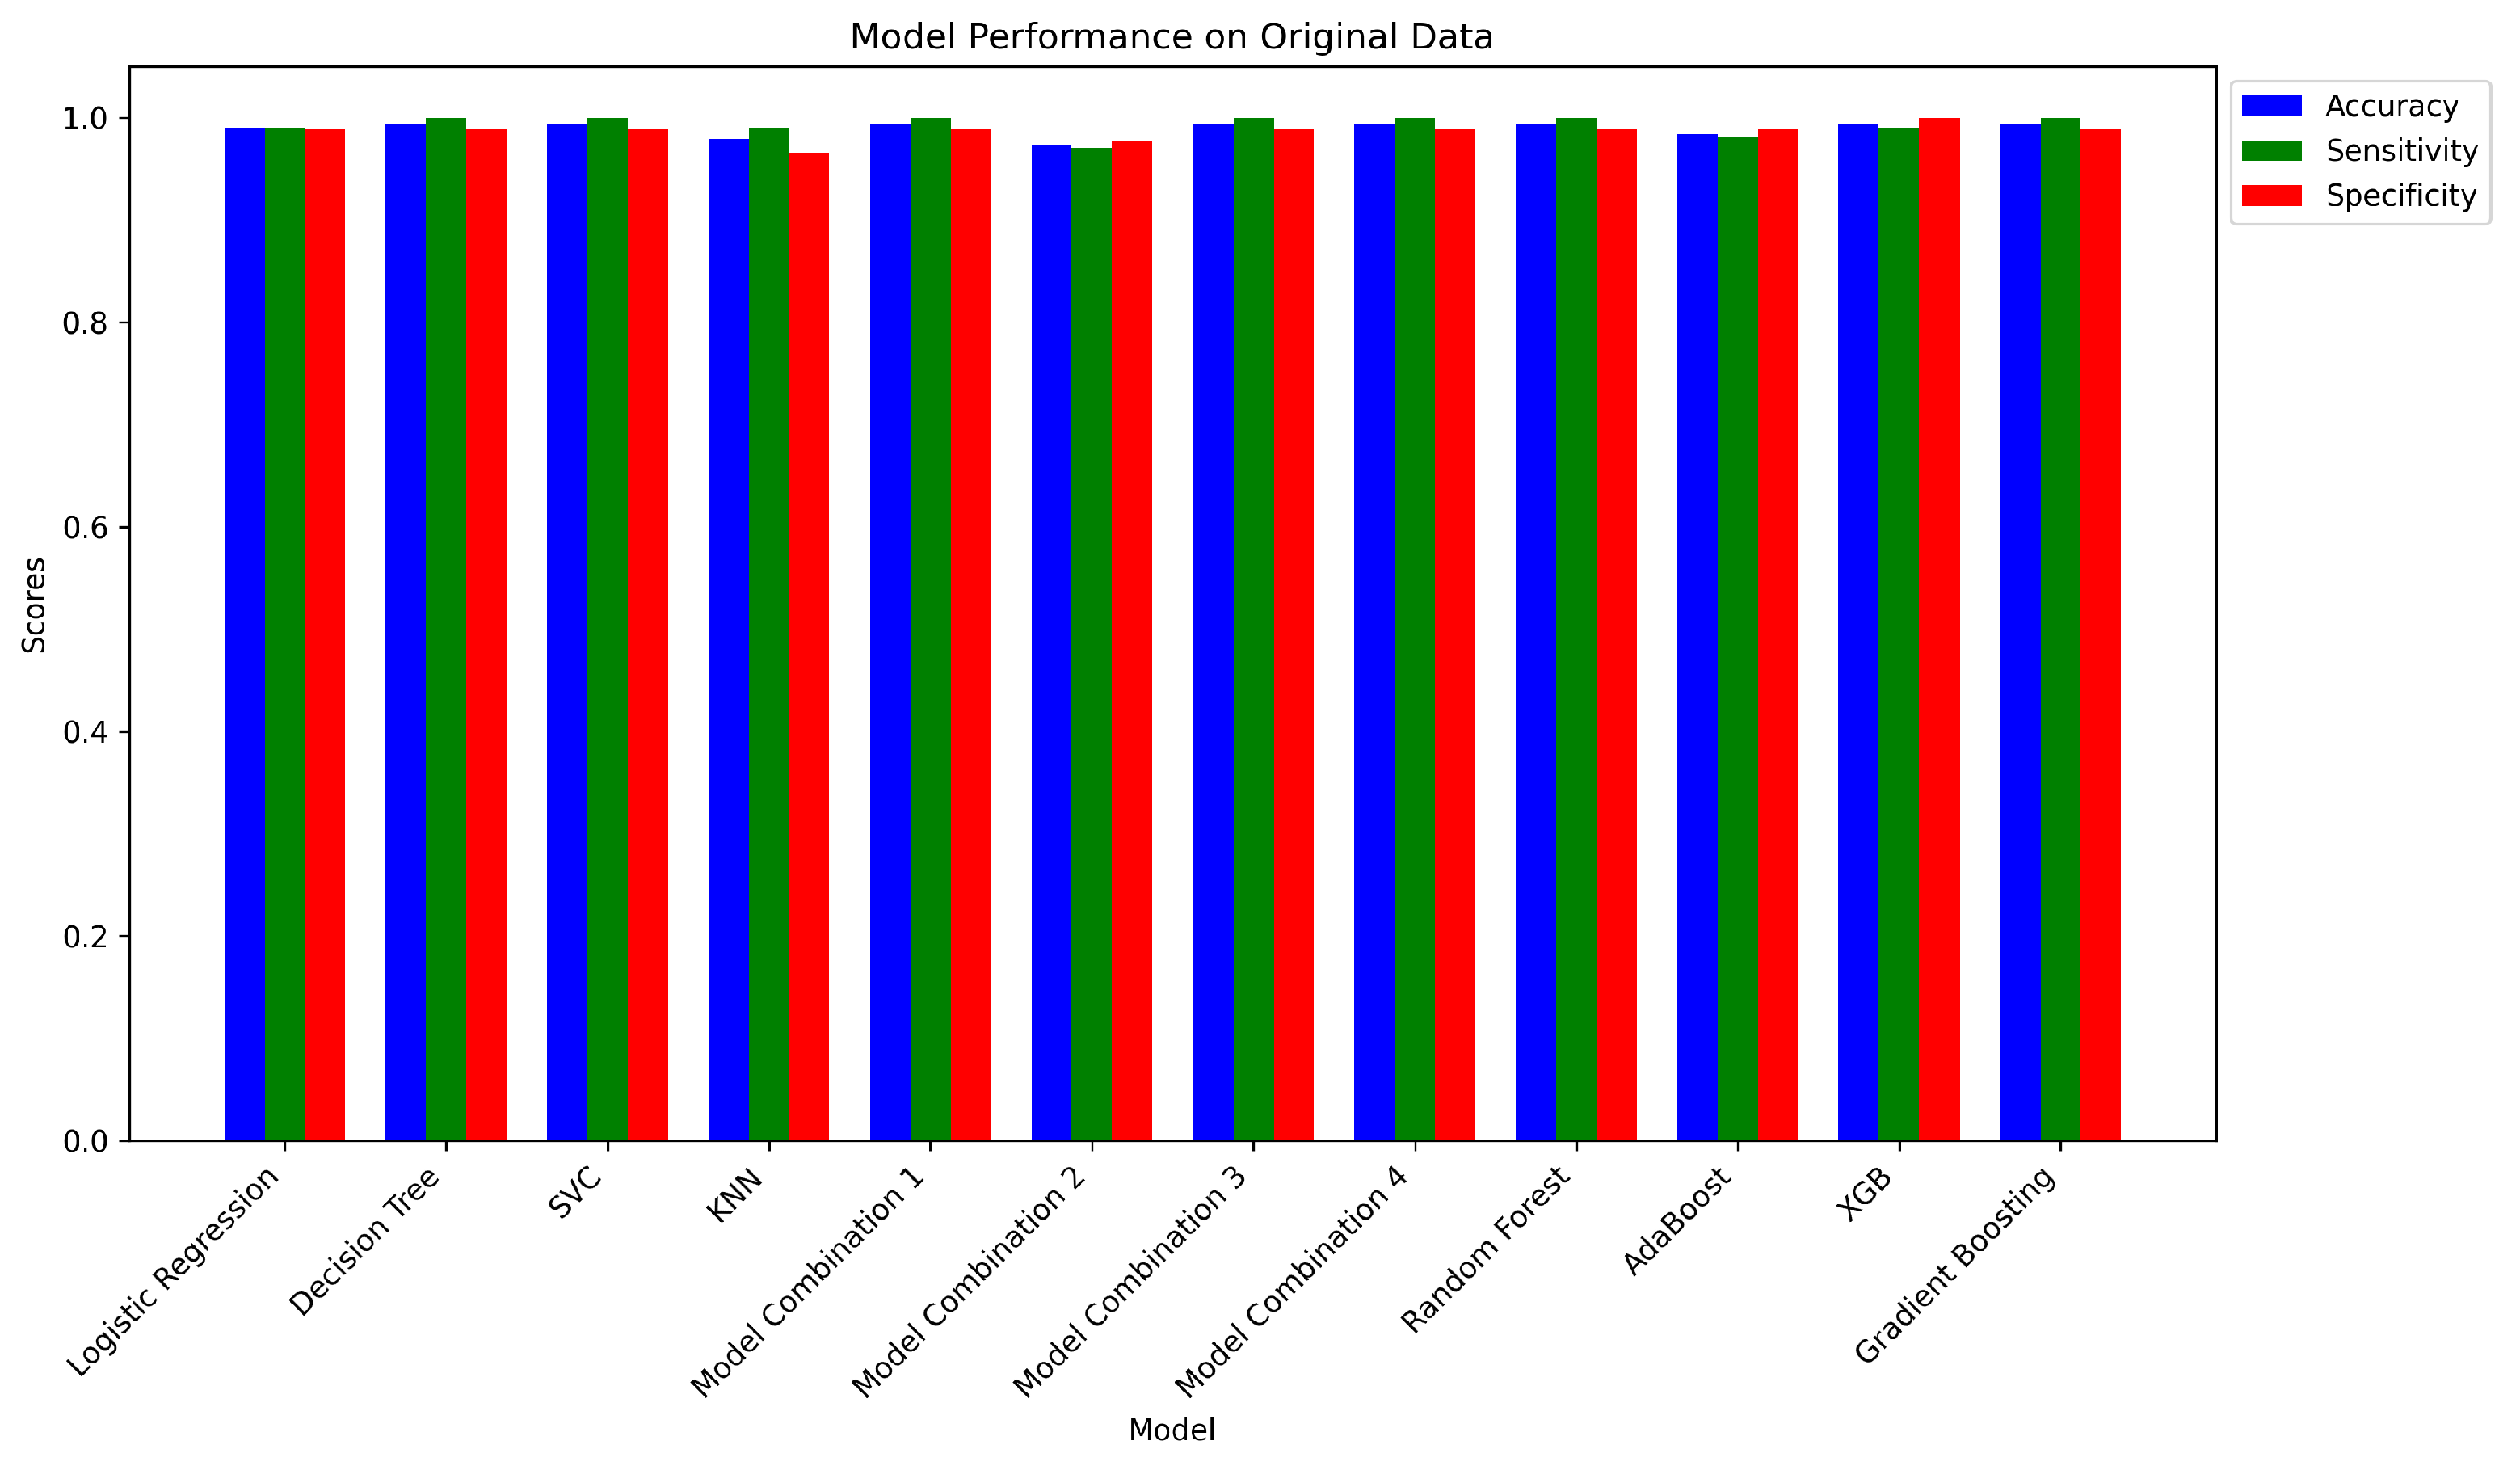
The features ‘SIL 2R’ and ‘ACE’ had outliers, which are handled through capping. Feature selection is done using various methods, including the Chi-Square Test, Mutual Information, Sequential Feature Selection, Tree-Based Selection, and Principal Component Analysis, to identify the most useful and relevant features. Based on the results, ‘Histology’, ‘CT’, ‘Lung Involvement’, ‘Eye Involvement’, ‘Skin Involvement’, ‘X-Thorax’, and ‘SIL 2R (in pg/mL)’ are chosen for further processing. After this, different ML models are applied to the data, and the performance of each is evaluated as shown in Figure 3. Further, the detailed numerical results presented in the figure are available in Table 8 and Table 9.

4.1.1. Independent Models on Original Dataset

The performance of different independent ML models is evaluated using five-fold cross-validation as the dataset is small, and the results are shown in Table 8. Logistic Regression achieved an accuracy of 98.94%, with a sensitivity of 99.01% and a specificity of 98.86%. Decision Tree Classifier and SVC both showed the highest performance with an accuracy, sensitivity, and specificity of 99.47%, 100%, and 98.86%, respectively. k-NN demonstrated slightly lower performance compared to the other models, with an accuracy of 97.88%. It has a sensitivity of 99.01% and a specificity of 96.59%. It can be observed from Table 8 that DT and SVC models can correctly classify the positive classes, and only one negative data is classified as positive. This shows the efficacy of DT and SVC models on real life data.

4.1.2. Ensemble Model on Original Dataset

The performance of the XgBoost, Gradient Boosting, Random Forest, and proposed ensemble models is shown in Table 9. Model Combination 1, Model Combination 3, Model Combination 4, Random Forest, XgBoost, and Gradient Boosting demonstrated the highest overall performance, achieving an accuracy of 99.47%, sensitivity of 100%, and specificity of 98.86%. It can be noted that these models correctly classify the positive classes, whereas only 1.14% of the negative classes are incorrectly classified. Model Combination 2 performed slightly lower with an accuracy of 97.35%, a sensitivity of 97.03%, and a specificity of 97.73%, and the AdaBoost classifier achieved an accuracy of 98.4%.

4.2. Supplementary Experiments on Synthetic Data (81 Data Points)

CTGAN is used to generate 81 synthetic data points, which are combined with the original dataset to validate the model, out of which 70% of the data, the original dataset, is used for training, and the remaining 30%, the augmented dataset, for testing.

4.2.1. Independent Models on Synthetic Data (81 Data Points)

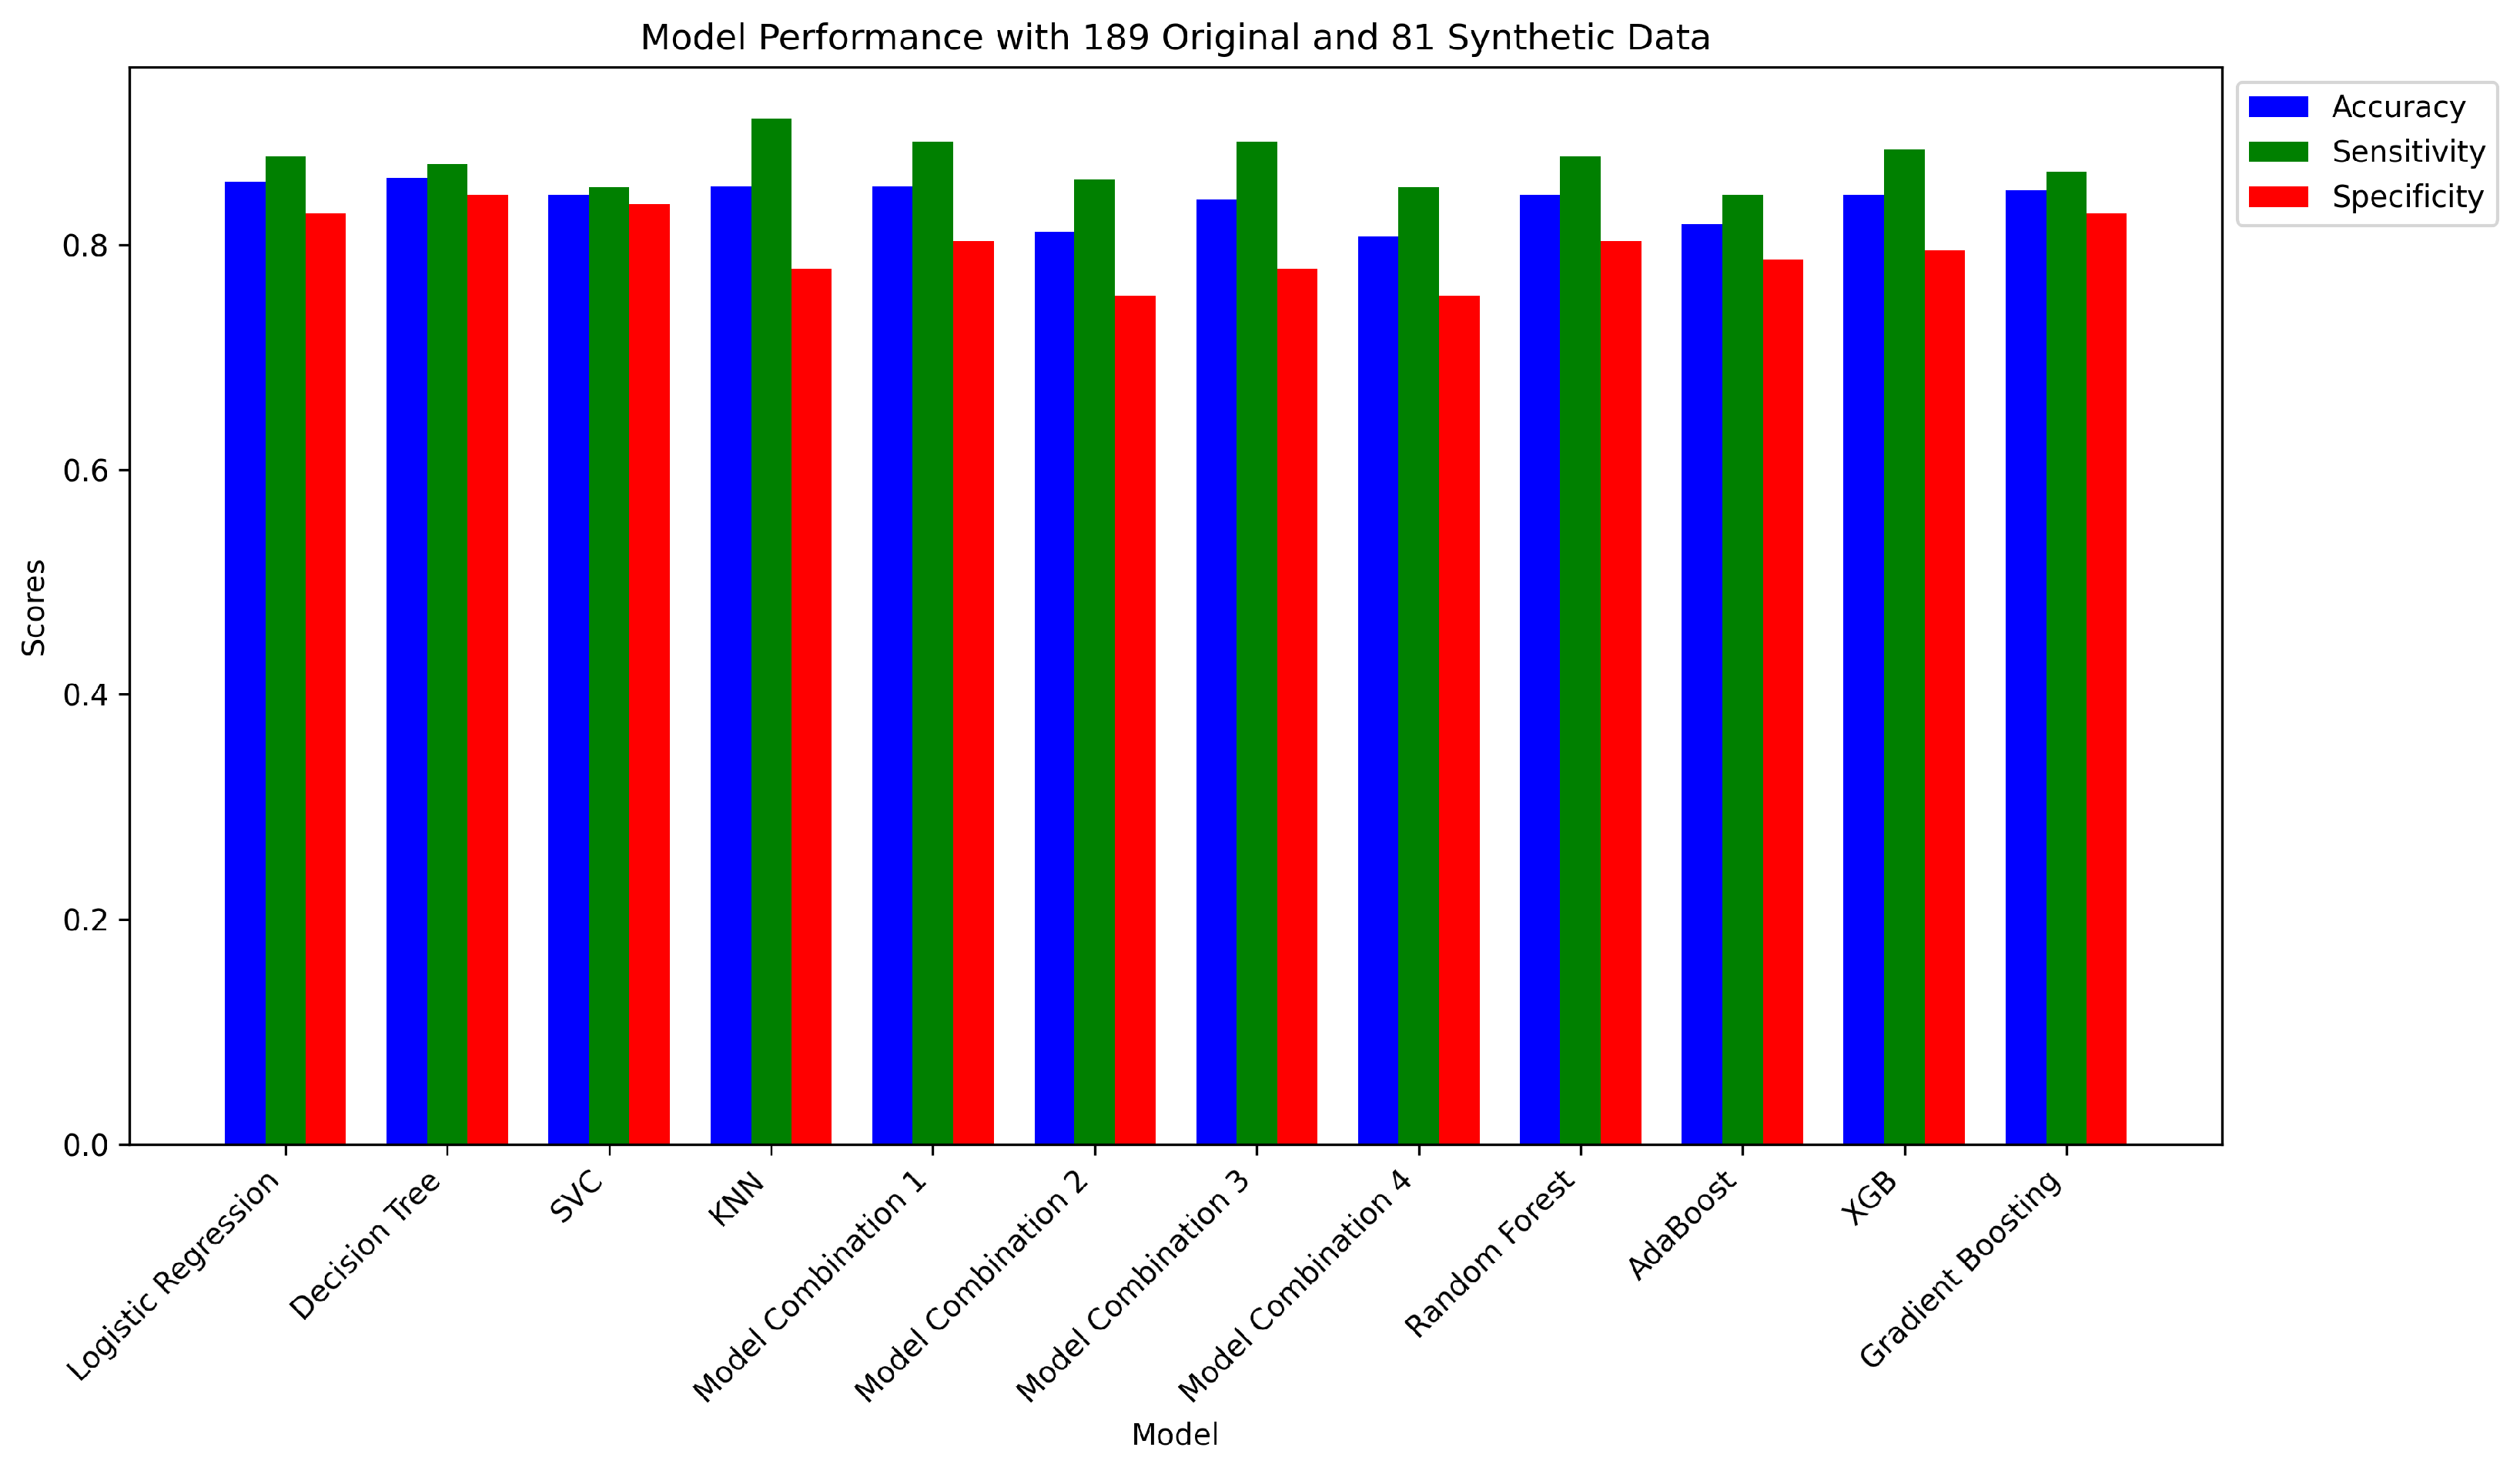
The performance of different independent ML models on the synthetic data with 80 data points is evaluated using five-fold cross-validation, and the result is shown in Table 10 and is visualized in Figure 4. Logistic Regression achieved an accuracy of 85.56%, with a sensitivity of 87.84% and a specificity of 82.79%. Decision Tree Classifier achieved a maximum accuracy of 85.93% with 87.16% sensitivity and 84.43% specificity. SVC model achieved a slight drop in terms of accuracy to 84.44%, with an acceptable sensitivity and specificity of 85.14% and 83.61%, respectively. KNN demonstrated a better performance with an accuracy of 85.19%. It achieved a sensitivity of 99.22% and a lowest specificity of 77.87%.

4.2.2. Ensemble Method on Synthetic Data (81 Data Points)

The performance of various proposed ensemble models and Random Forest on the synthetic data with 80 data points is shown in Table 11. Model Combination 1 achieved a highest accuracy of 85.19% compared to Model Combination 2 (81.11%), Model Combination 3 (84.07%), Model Combination 4 (80.74%), Random Forest (84.44%), AdaBoost (81.85%), XgB (84.44%), and Gradient Boosting (84.81%).
The results shown in Table 10 and Table 11 based on the experiments conducted on the real and augmented dataset reveal that the DT model plays an important role in classifying the positive classes correctly. The DT model is one of the baseline classifiers in Model Combination 1, proving its efficacy in classifying the dataset.

4.3. Extended Experiments on Large-Scale Synthetic Data (1000 Data Points)

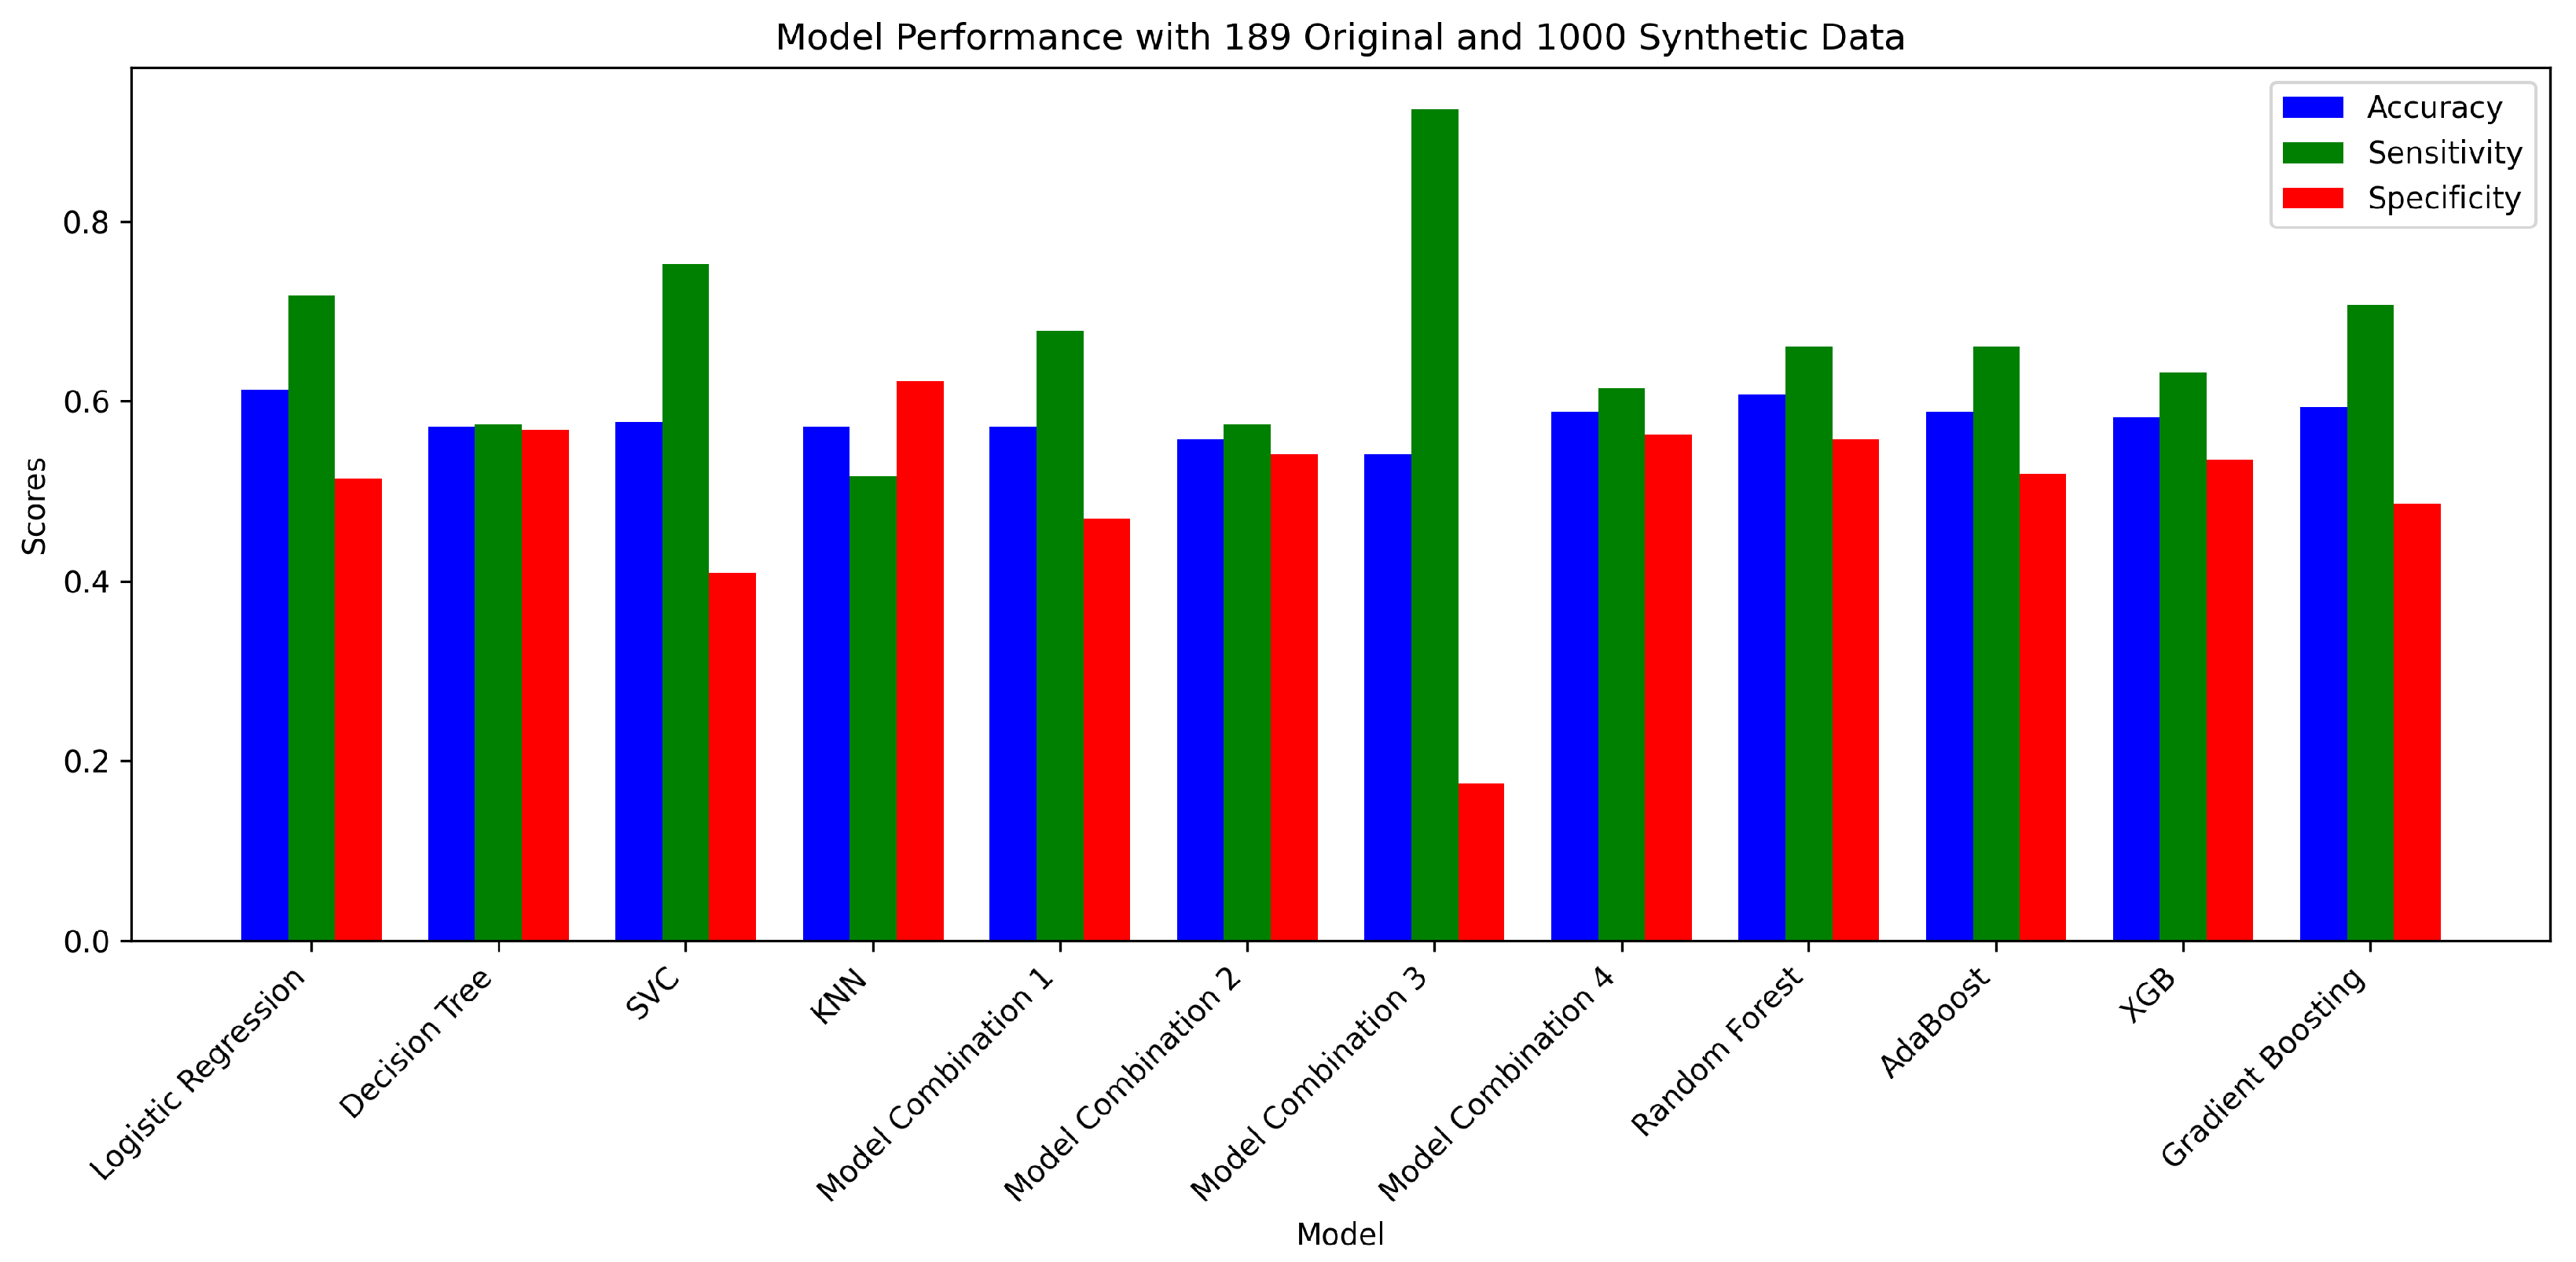
The experiments on Large-scale Synthetic Data are carried out by generating 1000 synthetic data points using CTGAN and combining them with 189 original data points. The combined 1189 data are split into a 70-30 part, where 70% is used for training and 30% is used for testing. the overall performance of the models on the large scale synthetic data is shown in Figure 5.

4.3.1. Independent Models on Large-Scale Synthetic Data (1000 Data Points)

The performance of different independent ML models on 1000 synthetic data points generated and combined with 189 original data is evaluated using five-fold cross-validation, and the result is shown in Table 12. Logistic Regression achieved the comparatively highest accuracy of 61.34%, whereas Decision Tree Classifier, SVC, and KNN models achieved accuracies of 57.15%, 57.7%, and 57.14% respectively.

4.3.2. Ensemble Method on Large-Scale Synthetic Data (1000 Data Points)

The performance of various proposed ensemble models and Random Forest on the synthetic data of 1000 points combined with the original data points is shown in Table 13. Random Forest achieved the highest accuracy of 60.78% compared to Model Combination 1 (57.14%), Model Combination 2 (55.74%), Model Combination 3 (54.06%), Model Combination 4 (58.82%), AdaBoost (58.82%), XgB (58.26%), and Gradient Boosting (59.38%)
The experiments on large-scale synthetic datasets proved the efficacy of existing state-of-the-art models such as LR and RF classifiers. However, the accuracy dropped drastically in all independent and ensemble models. Nonetheless, Model Combination 3 could classify 92.53% of the positive classes correctly, which is the highest when compared to all other models.

4.3.3. Discussion

The findings of the study by Eurelings et al. [19] on evaluating the diagnostic value of the sIL-2R biomarker demonstrated significantly higher median sIL-2R levels in Sarcoidosis patients compared to both non-Sarcoidosis patients and healthy controls based on 189 eligible cases, establishing sIL-2R as a clinically important biomarker. In contrast, this study extends beyond a single biomarker approach by incorporating a broader set of 14 symptom-based features, including serum markers and multiple organ involvement symptoms. Furthermore, multiple Feature Selection techniques and ensemble machine learning models are applied to identify the most diagnostically relevant features. Additionally, CTGAN-based data augmentation is used to address the small sample limitations, enabling the evaluation of model robustness on both original and synthetic datasets. While Eurelings et al. confirm the individual diagnostic power of sIL-2R, this work positions this biomarker within a multi-feature framework, showing how it interacts with other clinical features to enhance prediction in symptom-based diagnosis.
Further, in the base paper from which the dataset is derived, the control group consists of patients who were all initially suspected of Sarcoidosis but were later diagnosed with other conditions, including those that can present with sarcoid-like symptoms such as tuberculosis, arthritis, and other differential diagnoses. However, this stratification is not provided in the dataset, and it is represented as a non-sarcoid group. Thus, the non-Sarcoidosis group does not represent healthy controls, but rather a clinically relevant and heterogeneous group, which closely reflects real-world clinical practice. In this regard, as a future enhancement, the models used in this study may be applied on the rare disease data with all the information on the control group.
In this study, missing values are addressed using multiple imputation, a method supported by the existing literature as mentioned in Section 3.3.1, even with a relatively high rate of missing data. Further, the missingness type is tested for MCAR and MAR using Logistic Regression, and hence, MI was considered to be a suitable approach for imputing the missing values.
Outliers are datapoints that deviate from the normal population. These datapoints could be errors, or they could be some elements that do not follow the normal trends. If the outliers are retained, it might distort the model prediction and the corresponding results, whereas removing the outliers may lead to a loss of information. To overcome these issues, outliers are capped to a threshold such that the information is preserved while ensuring unbiased model prediction. This is confirmed by the experimentation results, which showed that capping minimized distortion improves the model performance and stability while preserving the extreme values that may hold clinical significance. Future research with larger and more diverse cohorts should consider alternative approaches, such as model-based outlier handling or subgroup analyses of patients with extreme values, to balance predictive performance with clinical interpretability.

5. Conclusions

In this study, a novel framework for the diagnosis of Sarcoidosis is proposed that integrates Supervised Ensemble Learning Methods with GenAI-based data augmentation to address the challenges of limited and imbalanced rare clinical datasets. Sarcoidosis, being a rare and complex multisystem granulomatous disorder, often presents with nonspecific symptoms and heterogeneous manifestations, making early diagnosis difficult. This approach focuses on enhancing diagnostic accuracy by augmenting the limited available data with synthetic data generated using advanced generative techniques and applying baseline and ensemble classifiers for robust and reliable predictions.
The GenAI-based data augmentation helped to overcome the issues of data scarcity and class imbalance, which are prevalent in Sarcoidosis datasets, especially when rare subtypes or early-stage cases are considered. The synthetic data generated preserved the critical clinical features while introducing variability, thereby enhancing the generalization capacity of the learning models.
Various baseline classifiers are stacked to classify the Sarcoidosis dataset and compared with existing ensemble models such as Random Forest, XGBoost, AdaBoost, and Gradient Boosting. It is deduced from the results that the proposed stacking model combination 2 with DT as the final predictor is 2.12% less accurate when compared to model combinations 1, 3, and 4 on the original 189 data. Further, the accuracy drastically dropped by 14.28% when the ensemble model was trained on the original 189 data and tested on 81 synthetic data. This reduction in performance on synthetic data, as expected, indicates that synthetic samples are not a replacement for real patients. Nevertheless, the augmented dataset improved overall model performance when tested on original patient data, indicating the importance of synthetic data in mitigating the issues of data scarcity. The performance of stacking ensemble models trained with a combination of original and synthetic data showed the importance of augmentation in Sarcoidosis without compromising the clinical validity of predictions.

Author Contributions

Conceptualization, S.R. and R.S.; methodology, S.R., R.S. and A.A.A.; software, A.A.A. and G.B.; validation, S.R., R.S. and N.K.S.; formal analysis, S.R., R.S. and A.A.A.; investigation, S.R., R.S. and A.A.A.; resources, S.R., R.S. and A.A.A.; data curation, S.R. and A.A.A.; writing—original draft preparation, S.R., R.S. and A.A.A.; writing—review and editing, N.K.S., A.P.K. and G.B.; visualization, N.K.S., A.P.K. and G.B.; supervision, S.R. and R.S.; project administration, S.R. and R.S. All authors have read and agreed to the published version of the manuscript.

Funding

This research received no external funding.

Institutional Review Board Statement

Not applicable.

Informed Consent Statement

Not applicable.

Data Availability Statement

Acknowledgments

The authors would like to thank the School of Computer Engineering, Manipal Institute of Technology, Manipal Academy of Higher Education, Manipal, for providing the laboratory facilities to conduct the experiments.

Conflicts of Interest

The authors declare no conflicts of interest.

References

  1. Carreras-Puigvert, J.; Spjuth, O. Artificial intelligence for high content imaging in drug discovery. Curr. Opin. Struct. Biol. 2024, 87, 102842. [Google Scholar] [CrossRef]
  2. Pariser, A.R.; Gahl, W.A. Important role of translational science in rare disease innovation, discovery, and drug development. J. Gen. Intern. Med. 2014, 29, 804–807. [Google Scholar] [CrossRef]
  3. Bargagli, E.; Prasse, A. Sarcoidosis: A review for the internist. Intern. Emerg. Med. 2018, 13, 325–331. [Google Scholar] [CrossRef] [PubMed]
  4. Fernández-Ramón, R.; Gaitán-Valdizán, J.J.; González-Mazón, I.; Sánchez-Bilbao, L.; Martín-Varillas, J.L.; Martínez-López, D.; Demetrio-Pablo, R.; González-Vela, M.C.; Ferraz-Amaro, I.; Castañeda, S.; et al. Systemic treatment in sarcoidosis: Experience over two decades. Eur. J. Intern. Med. 2023, 108, 60–67. [Google Scholar] [CrossRef] [PubMed]
  5. Sève, P.; Pacheco, Y.; Durupt, F.; Jamilloux, Y.; Gerfaud-Valentin, M.; Isaac, S.; Boussel, L.; Calender, A.; Androdias, G.; Valeyre, D.; et al. Sarcoidosis: A clinical overview from symptoms to diagnosis. Cells 2021, 10, 766. [Google Scholar] [CrossRef]
  6. Decherchi, S.; Pedrini, E.; Mordenti, M.; Cavalli, A.; Sangiorgi, L. Opportunities and challenges for machine learning in rare diseases. Front. Med. 2021, 8, 747612. [Google Scholar] [CrossRef]
  7. Figueira, A.; Vaz, B. Survey on synthetic data generation, evaluation methods and GANs. Mathematics 2022, 10, 2733. [Google Scholar] [CrossRef]
  8. Livieris, I.E.; Alimpertis, N.; Domalis, G.; Tsakalidis, D. An evaluation framework for synthetic data generation models. In Proceedings of the IFIP International Conference on Artificial Intelligence Applications and Innovations, Corfu, Greece, 27–30 June 2024; Springer: Cham, Switherland, 2024; pp. 320–335. [Google Scholar]
  9. Cao, L.; Wu, H.; Liu, Y. Value of CT spectral imaging in the differential diagnosis of sarcoidosis and Hodgkin’s lymphoma based on mediastinal enlarged lymph node: A STARD compliant article. Medicine 2022, 101, e31502. [Google Scholar] [CrossRef]
  10. LaValley, M.P. Logistic regression. Circulation 2008, 117, 2395–2399. [Google Scholar] [CrossRef] [PubMed]
  11. Song, Y.Y.; Ying, L. Decision tree methods: Applications for classification and prediction. Shanghai Arch. Psychiatry 2015, 27, 130. [Google Scholar]
  12. Abdullah, D.M.; Abdulazeez, A.M. Machine learning applications based on SVM classification a review. Qubahan Acad. J. 2021, 1, 81–90. [Google Scholar] [CrossRef]
  13. Guo, G.; Wang, H.; Bell, D.; Bi, Y.; Greer, K. KNN model-based approach in classification. In Proceedings of the On The Move to Meaningful Internet Systems 2003: CoopIS, DOA, and ODBASE: OTM Confederated International Conferences, CoopIS, DOA, and ODBASE 2003, Catania, Sicily, Italy, 3–7 November 2003; Proceedings. Springer: Berlin/Heidelberg, Germany, 2003; pp. 986–996. [Google Scholar]
  14. Biau, G.; Scornet, E. A random forest guided tour. Test 2016, 25, 197–227. [Google Scholar] [CrossRef]
  15. Zounemat-Kermani, M.; Batelaan, O.; Fadaee, M.; Hinkelmann, R. Ensemble machine learning paradigms in hydrology: A review. J. Hydrol. 2021, 598, 126266. [Google Scholar] [CrossRef]
  16. Poudel, S. A study of disease diagnosis using machine learning. Med. Sci. Forum 2022, 10, 8. [Google Scholar]
  17. Hurvitz, N.; Azmanov, H.; Kesler, A.; Ilan, Y. Establishing a second-generation artificial intelligence-based system for improving diagnosis, treatment, and monitoring of patients with rare diseases. Eur. J. Hum. Genet. 2021, 29, 1485–1490. [Google Scholar] [CrossRef] [PubMed]
  18. Huang, B.; Huang, H.; Zhang, S.; Zhang, D.; Shi, Q.; Liu, J.; Guo, J. Artificial intelligence in pancreatic cancer. Theranostics 2022, 12, 6931. [Google Scholar] [CrossRef] [PubMed]
  19. Eurelings, L.E.; Miedema, J.R.; Dalm, V.A.; van Daele, P.L.; van Hagen, P.M.; van Laar, J.A.; Dik, W.A. Sensitivity and specificity of serum soluble interleukin-2 receptor for diagnosing sarcoidosis in a population of patients suspected of sarcoidosis. PLoS ONE 2019, 14, e0223897. [Google Scholar] [CrossRef]
  20. Sánchez Fernández, I.; Yang, E.; Calvachi, P.; Amengual-Gual, M.; Wu, J.Y.; Krueger, D.; Northrup, H.; Bebin, M.E.; Sahin, M.; Yu, K.H.; et al. Deep learning in rare disease. Detection of tubers in tuberous sclerosis complex. PLoS ONE 2020, 15, e0232376. [Google Scholar] [CrossRef]
  21. Osipov, N.; Kudryavtsev, I.; Spelnikov, D.; Rubinstein, A.; Belyaeva, E.; Kulpina, A.; Kudlay, D.; Starshinova, A. Differential diagnosis of tuberculosis and sarcoidosis by immunological features using machine learning. Diagnostics 2024, 14, 2188. [Google Scholar] [CrossRef]
  22. Dai, Q.; Sherif, A.A.; Jin, C.; Chen, Y.; Cai, P.; Li, P. Machine learning predicting mortality in sarcoidosis patients admitted for acute heart failure. Cardiovasc. Digit. Health J. 2022, 3, 297–304. [Google Scholar] [CrossRef]
  23. van der Sar, I.G.; van Jaarsveld, N.; Spiekerman, I.A.; Toxopeus, F.J.; Langens, Q.L.; Wijsenbeek, M.S.; Dauwels, J.; Moor, C.C. Evaluation of different classification methods using electronic nose data to diagnose sarcoidosis. J. Breath Res. 2023, 17, 047104. [Google Scholar] [CrossRef]
  24. Eckstein, J.; Moghadasi, N.; Körperich, H.; Akkuzu, R.; Sciacca, V.; Sohns, C.; Sommer, P.; Berg, J.; Paluszkiewicz, J.; Burchert, W.; et al. Machine-learning-based diagnostics of cardiac sarcoidosis using multi-chamber wall motion analyses. Diagnostics 2023, 13, 2426. [Google Scholar] [CrossRef]
  25. Bobbio, E.; Eldhagen, P.; Polte, C.L.; Hjalmarsson, C.; Karason, K.; Rawshani, A.; Darlington, P.; Kullberg, S.; Sörensson, P.; Bergh, N.; et al. Clinical Outcomes and Predictors of Long-Term Survival in Patients With and Without Previously Known Extracardiac Sarcoidosis Using Machine Learning: A Swedish Multicenter Study. J. Am. Heart Assoc. 2023, 12, e029481. [Google Scholar] [CrossRef] [PubMed]
  26. Attar, H.; Solyman, A.; Deif, M.A.; Hafez, M.; Kasem, H.M.; Mohamed, A.E.F. Machine Learning Model Based on Gary-Level Co-occurrence Matrix for Chest Sarcoidosis Diagnosis. In Proceedings of the 2023 2nd International Engineering Conference on Electrical, Energy, and Artificial Intelligence (EICEEAI), Zarqa, Jordan, 27–28 December 2023; pp. 1–8. [Google Scholar]
  27. Mushari, N.A.; Soultanidis, G.; Duff, L.; Trivieri, M.G.; Fayad, Z.A.; Robson, P.; Tsoumpas, C. An assessment of PET and CMR radiomic features for detection of cardiac sarcoidosis. Front. Nucl. Med. 2024, 4, 1324698. [Google Scholar] [CrossRef]
  28. Eurelings, L.E.M.; Miedema, J.R.; Dalm, V.A.S.H.; van Daele, P.L.A.; van Hagen, P.M.; van Laar, J.A.M.; Dik, W.A. Dataset of Sarcoidosis and Non-Sarcoidosis Patients. 2019. Available online: https://figshare.com/articles/dataset/Sensitivity_and_specificity_of_serum_soluble_interleukin-2_receptor_for_diagnosing_sarcoidosis_in_a_population_of_patients_suspected_of_sarcoidosis/9996461?file=18029612 (accessed on 20 October 2024).
  29. Templ, M. Enhancing precision in large-scale data analysis: An innovative robust imputation algorithm for managing outliers and missing values. Mathematics 2023, 11, 2729. [Google Scholar] [CrossRef]
  30. Aguinis, H.; Gottfredson, R.K.; Joo, H. Best-practice recommendations for defining, identifying, and handling outliers. Organ. Res. Methods 2013, 16, 270–301. [Google Scholar] [CrossRef]
  31. McHugh, M.L. The chi-square test of independence. Biochem. Medica 2013, 23, 143–149. [Google Scholar] [CrossRef] [PubMed]
  32. Vergara, J.R.; Estévez, P.A. A review of feature selection methods based on mutual information. Neural Comput. Appl. 2014, 24, 175–186. [Google Scholar] [CrossRef]
  33. Rückstieß, T.; Osendorfer, C.; Van Der Smagt, P. Sequential feature selection for classification. In Proceedings of the AI 2011: Advances in Artificial Intelligence: 24th Australasian Joint Conference, Perth, Australia, 5–8 December 2011; Proceedings 24. Springer: Berlin/Heidelberg, Germany, 2011; pp. 132–141. [Google Scholar]
  34. Jaiswal, J.K.; Samikannu, R. Application of random forest algorithm on feature subset selection and classification and regression. In Proceedings of the 2017 World Congress on Computing and Communication Technologies (WCCCT), Tiruchirappalli, India, 2–4 February 2017; pp. 65–68. [Google Scholar]
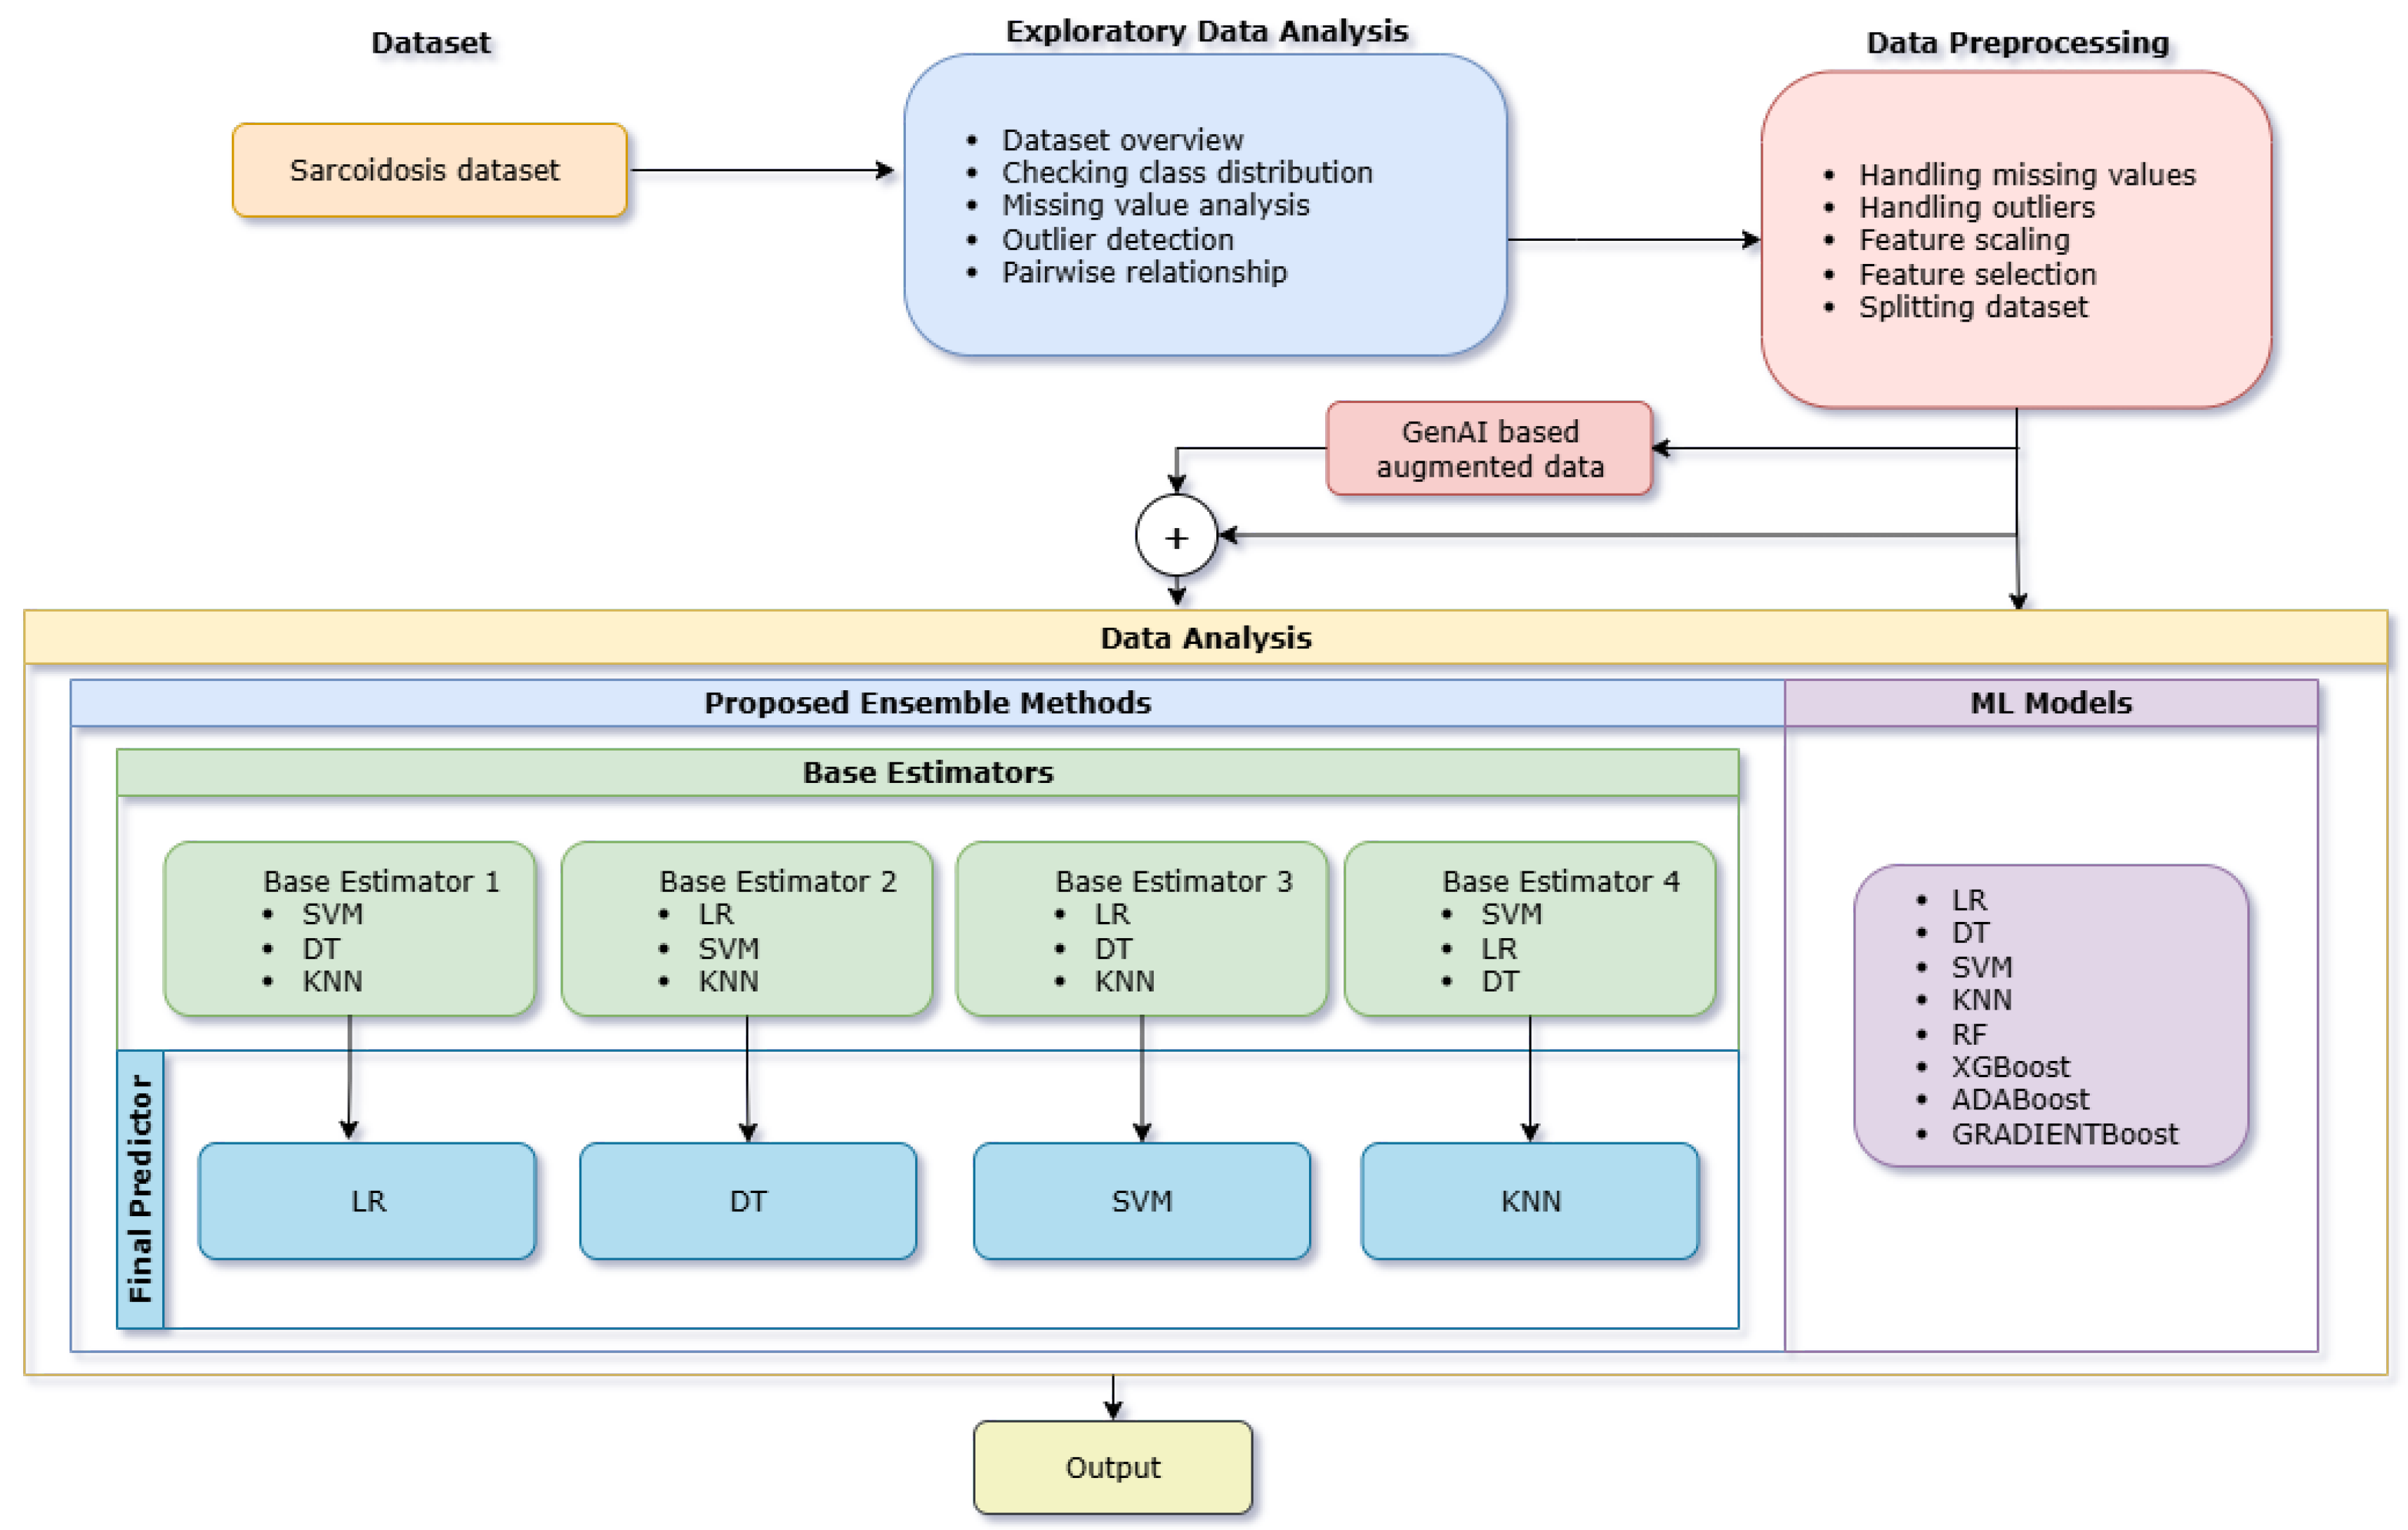
Figure 1. Overall methodology for Sarcoidosis classification.
Applsci 15 12213 g001
Figure 2. Box plot showing the outliers in features SIL 2R and ACE.
Applsci 15 12213 g002
Figure 3. Model performance on the original 189 data.
Applsci 15 12213 g003
Figure 4. Model performance with original dataset and 81 synthetic data points.
Applsci 15 12213 g004
Figure 5. Model performance with original 189 data and 1000 synthetic data.
Applsci 15 12213 g005
Table 1. Sarcoidosis dataset description.
Sl. No.Attribute NameRoleType
1SexFeatureCategorical
2DiagnosisTargetCategorical
3HistologyFeatureCategorical
4X-ThoraxFeatureCategorical
5CTFeatureCategorical
6SPECTFeatureCategorical
7SRSFeatureCategorical
8PETFeatureCategorical
9Lung InvolvementFeatureCategorical
10Eye InvolvementFeatureCategorical
11Neurological InvolvementFeatureCategorical
12Skin InvolvementFeatureCategorical
13SIL 2RFeatureContinuous
14ACEFeatureContinuous
Table 2. Number of missing values in each feature.
Sl. No.Attribute NameMissing ValuesMissing Type
1Sex0NA
2Diagnosis0NA
3Histology83MAR
4X-Thorax33MAR
5CT75MAR
6SPECT157MAR
7SRS188MCAR
8PET150MAR
9Lung Involvement86MCAR
10Eye Involvement86MCAR
11Neurological Involvement86MCAR
12Skin Involvement86MCAR
13SIL 2R0NA
14ACE0NA
Table 3. Principal Components (PCs), Explained Variance (EV), and top contributing features.
PCEVTop Contributing Features
PC10.3608Histology, CT, SIL 2R, X-thorax, lung involvement, ACE, eye involvement
PC20.1313Neurological involvement, sex, skin involvement, eye involvement, SIL 2R, ACE, Histology
PC30.1209Eye involvement, ACE, X-thorax, lung involvement, skin involvement, CT, SIL 2R
PC40.0949Neurological involvement, skin involvement, sex, X-thorax, eye involvement, lung involvement, SIL 2R
PC50.0778Sex, skin involvement, lung involvement, neurological involvement, X-thorax, ACE, eye involvement
PC60.0663ACE, eye involvement, X-thorax, CT, Histology, skin involvement, neurological involvement
PC70.0540Lung involvement, eye involvement, Histology, CT, X-thorax, ACE, neurological involvement
Table 4. Feature importance based on Chi-Square Score and RFE Ranking.
Sl. No.FeatureChi2 ScoreRFE Ranking
1Histology85.3861391
2CT64.8424162
3lung involvement39.0325163
4eye involvement19.9676874
5skin involvement13.9405945
6X-thorax86.7509696
7neurological involvement5.2277237
8sex0.6375968
9ACE677.1983469
10SIL 2R158,436.83048210
Table 5. Feature importance values for various features using Tree-Based selection.
Sl. No.FeatureImportance
1Histology0.432447
2CT0.251656
3SIL 2R0.128611
4X-thorax0.094628
5lung involvement0.045384
6eye involvement0.022870
7ACE0.018926
8skin involvement0.003525
9sex0.001856
10neurological involvement0.000097
Table 6. Mutual information scores for different features.
Sl. No.FeatureMI Score
1Histology0.622457
2CT0.468798
3SIL 2R0.332907
4X-thorax0.262964
5lung involvement0.160474
6eye involvement0.115752
7skin involvement0.074443
8neurological involvement0.041284
9ACE0.000544
10sex0.000000
Table 7. Features selected through SFS.
Sl. No.Feature
1sex
2Histology
3CT
4lung involvement
5neurological involvement
Table 8. Independent model performance on the original 189 data.
ModelAccuracySensitivitySpecificityConfusion Matrix
1Logistic Regression0.98940.99010.9886[[87, 1], [1, 100]]
2Decision Tree Classifier0.99471.00000.9886[[87, 1], [0, 101]]
3SVC0.99471.00000.9886[[87, 1], [0, 101]]
4K-Neighbors Classifier0.97880.99010.9659[[85, 3], [1, 100]]
Table 9. Ensemble model performance on the original 189 data.
ModelAccuracySensitivitySpecificityConfusion Matrix
1Model Combination 10.99471.00000.9886[[87, 1], [0, 101]]
2Model Combination 20.97350.97030.9773[[86, 2], [3, 98]]
3Model Combination 30.99471.00000.9886[[87, 1], [0, 101]]
4Model Combination 40.99471.00000.9886[[87, 1], [0, 101]]
5Random Forest Classifier0.99471.00000.9886[[87, 1], [0, 101]]
6AdaBoost Classifier0.98410.98020.9886[[87, 1], [2, 99]]
7XGB Classifier0.99470.99011.0000[[88, 0], [1, 100]]
8Gradient Boosting Classifier0.99471.00000.9886[[87, 1], [0, 101]]
Table 10. Independent model performance on original dataset and 81 synthetic data points.
No.ModelAccuracySensitivitySpecificityConfusion Matrix
1Logistic Regression0.85560.87840.8279[[101, 21], [18, 130]]
2Decision Tree Classifier0.85930.87160.8443[[103, 19], [19, 129]]
3SVC0.84440.85140.8361[[102, 20], [22, 126]]
4K-Neighbors Classifier0.85190.91220.7787[[95, 27], [13, 135]]
Table 11. Ensemble model performance on original dataset and 81 data points in synthetic dataset.
ModelAccuracySensitivitySpecificityConfusion Matrix
1Model Combination 10.85190.89190.8033[[98, 24], [16, 132]]
2Model Combination 20.81110.85810.7541[[92, 30], [21, 127]]
3Model Combination 30.84070.89190.7787[[95, 27], [16, 132]]
4Model Combination 40.80740.85140.7541[[92, 30], [22, 126]]
5Random Forest Classifier0.84440.87840.8033[[98, 24], [18, 130]]
6AdaBoost Classifier0.81850.84460.7869[[96, 26], [23, 125]]
7XGB Classifier0.84440.88510.7951[[97, 25], [17, 131]]
8Gradient Boosting Classifier0.84810.86490.8279[[101, 21], [20, 128]]
Table 12. Independent model performance on 1189 original and synthetic data points.
No.ModelAccuracySensitivitySpecificityConfusion Matrix
1Logistic Regression0.61340.71840.5137[[94, 89], [49, 125]]
2Decision Tree Classifier0.57140.57470.5683[[104, 79], [74, 100]]
3SVC0.57700.75290.4098[[75, 108], [43, 131]]
4K-Neighbors Classifier0.57140.51720.6230[[114, 69], [84, 90]]
Table 13. Ensemble model performance on 1189 original and synthetic data points.
ModelAccuracySensitivitySpecificityConfusion Matrix
1Model Combination 10.57140.67820.4699[[86, 97], [56, 118]]
2Model Combination 20.55740.57470.5410[[99, 84], [74, 100]]
3Model Combination 30.54060.92530.1749[[32, 151], [13, 161]]
4Model Combination 40.58820.61490.5628[[103, 80], [67, 107]]
5Random Forest Classifier0.60780.66090.5574[[102, 81], [59, 115]]
6AdaBoost Classifier0.58820.66090.5191[[95, 88], [59, 115]]
7XGB Classifier0.58260.63220.5355[[98, 85], [64, 110]]
8Gradient Boosting Classifier0.59380.70690.4863[[89, 94], [51, 123]]
Disclaimer/Publisher’s Note: The statements, opinions and data contained in all publications are solely those of the individual author(s) and contributor(s) and not of MDPI and/or the editor(s). MDPI and/or the editor(s) disclaim responsibility for any injury to people or property resulting from any ideas, methods, instructions or products referred to in the content.