1. Introduction
In recent years, the incidence of wildfires has surged dramatically across various regions worldwide, presenting a significant challenge to ecosystems, communities, and resource management agencies [
1]. According to the Global Wildfire Information System (GWIS) [
2], the year 2019 saw even more staggering figures, with more than 10 million individuals evacuated due to wildfire threats. In 2023 alone, more than 800,000 wildfire incidents were recorded globally, resulting in 263 deaths and the evacuation of over 715,000 people.
The environmental impact of wildfires has been staggering, with an estimated 330 million hectares burned annually worldwide [
2]. Africa alone accounts for over 240 million hectares of wildfire damage each year, underscoring the continent’s vulnerability to these disasters and their far-reaching consequences [
2]. However, wildfires are not limited to developing regions; even highly developed countries suffer immense losses. In California, recent wildfires in January 2025 have once again demonstrated their destructive power, consuming vast areas, displacing thousands, and causing billions of dollars in damages. These events highlight that wildfires remain a global crisis, affecting nations regardless of their economic or technological advancements [
3].
The Mediterranean basin experiences significant wildfire activity. The region has faced devastating events, such as those in Portugal in 2017, which resulted in 109 deaths, and in Greece in 2018, where wildfires claimed 100 lives from a worldwide total of 221 [
4]. In Algeria, the occurrence of wildfires has been a significant concern, particularly in the eastern and central regions containing large forest areas and biodiversity [
4]. From 1963 to 2012, approximately 1.6 million hectares of forests out of 4.6 million hectares were lost to wildfires [
4]. Over the past four years alone, Algeria has witnessed the devastation of approximately 367,000 hectares of land and over 150 fatalities due to wildfires [
5].
The primary drivers behind this alarming increase in wildfires are multifaceted, with climate change playing a pivotal role [
5]. Rising global temperatures and fluctuations in precipitation patterns have created ideal conditions for wildfire ignition and rapid spread. Prolonged periods of drought, higher temperatures, and erratic rainfall contribute to the drying of vegetation, which acts as fuel for wildfires. Additionally, extreme weather events, such as heatwaves and strong winds, further exacerbate wildfire risks [
5].
Furthermore, the European Forest Fire Information System (EFFIS) annual report identifies human activities as the leading cause of wildfire ignitions [
6]. Rural and agricultural practices, deforestation, and industrial activities significantly contribute to the increased occurrence of wildfires. These activities often lead to the accumulation of combustible materials and increase the likelihood of accidental or intentional wildfires.
Given these alarming trends, there is an urgent need for enhanced strategies to prevent and manage wildfires effectively. Wildfire Susceptibility Mapping (WSM) has emerged as a critical solution, offering valuable insights into areas at high risk and aiding in resource allocation, prevention efforts, and strategic planning for firefighting operations [
7].
WSM constitutes a proactive approach aimed at identifying high-risk areas prone to wildfires. This process involves the analysis of various environmental factors, including climate, vegetation, topography, hydrology, and human activities, which collectively contribute to the likelihood of wildfire occurrence [
8]. WSM endeavors to classify geographical areas into different levels of susceptibility to wildfire by establishing correlations between these factors and historical records of wildfire occurrences [
9].
For accurate wildfire risk mapping, it is crucial to use all available environmental data that influence wildfire occurrence and behavior. However, data availability can be limited, particularly in regions with poor infrastructure for data recording and management. Researchers in past studies have addressed this issue by combining data from large-scale organizations with local data sources [
10]. This approach not only leverages the extensive datasets maintained by big data organizations but also incorporates detailed, localized information from regional centers that record various types of data [
10].
In this context, Geographic Information Systems (GIS) tools play a crucial role. They are instrumental in collecting data from various sources, scales, and types, enabling researchers to integrate these diverse datasets into a cohesive analysis [
11]. GIS tools facilitate the visualization of different phenomena and the impact of environmental features on wildfire occurrence and behavior. By providing detailed and spatially accurate representations, GIS tools help researchers and decision-makers understand the complex interactions between various environmental factors and wildfire risks [
12].
Furthermore, analyzing environmental data and mapping wildfire risks requires robust and effective methods. Multi-Criteria Decision Analysis (MCDA) methods, along with others such as frequency ratio, are commonly used due to their simplicity and interpretability [
7,
13]. However, in the context of wildfire susceptibility, involving numerous features and large datasets, traditional statistical methods may not yield optimal results. The complexity of the data and the need to uncover intricate relationships between multiple factors make more advanced approaches, such as machine learning, increasingly necessary.
Many recent studies have turned to machine learning methods for analyzing datasets and mapping wildfire risks [
14]. Techniques such as Random Forest, logistic regression, and deep learning have become increasingly popular. These ML methods are powerful tools capable of handling large and noisy datasets and capturing non-linear relationships within the data. Their ability to manage complex interactions and provide accurate predictions makes them well-suited for WSM, where precision and reliability are crucial for effective wildfire management and mitigation strategies [
15].
This study develops a machine-learning framework for WSM in the province of Jijel, a Mediterranean region in eastern Algeria, with the intention of extending it to other provinces that share similar environmental conditions. The approach is fully data-driven: we first assemble a comprehensive dataset by merging environmental information from large-scale repositories with records from local agencies; we then harmonize, integrate, and visualize these layers using GIS to clarify how conditioning factors relate to wildfire occurrence and behavior; finally, we train and apply machine-learning models to analyze the assembled data and classify areas according to their wildfire risk.
This work fills a clear gap in the southern Mediterranean, where wildfire-susceptibility studies are still scarce even though fire drivers vary markedly by region. In terms of novelty, we highlight this regional specificity by combining locally recorded data with global products so the factor–fire relationships reflect Jijel’s conditions. To curb label noise, we refine low-susceptibility samples using a clustering step before modeling. Finally, we provide operational, GIS-ready outputs—risk maps and explanatory visualizations—that authorities can readily interpret for planning, prevention, and resource allocation.
To ensure the robustness and practical validity of the proposed model, an independent validation step is incorporated. This consists of overlaying newly observed wildfire events from subsequent years (2024 and 2025) on the generated susceptibility map, in order to assess how accurately the model captures real fire occurrences. The outcomes are then compared with previous studies that adopted similar spatial validation approaches, allowing a clear evaluation of the model’s generalization ability and predictive reliability.
The results will assist firefighters and local authorities in urban and land-use planning. Additionally, this study offers result explanations using feature importance and visualization techniques to foster a deeper understanding of wildfire occurrence dynamics. This framework ultimately aims to improve wildfire management strategies, safeguarding both ecosystems and communities.
In the rest of the paper, the first section discusses related work, including the methods used for data collection and analysis. The second section explains our proposed methodology, followed by sections presenting the results, discussion, and conclusion.
3. Materials and Methods
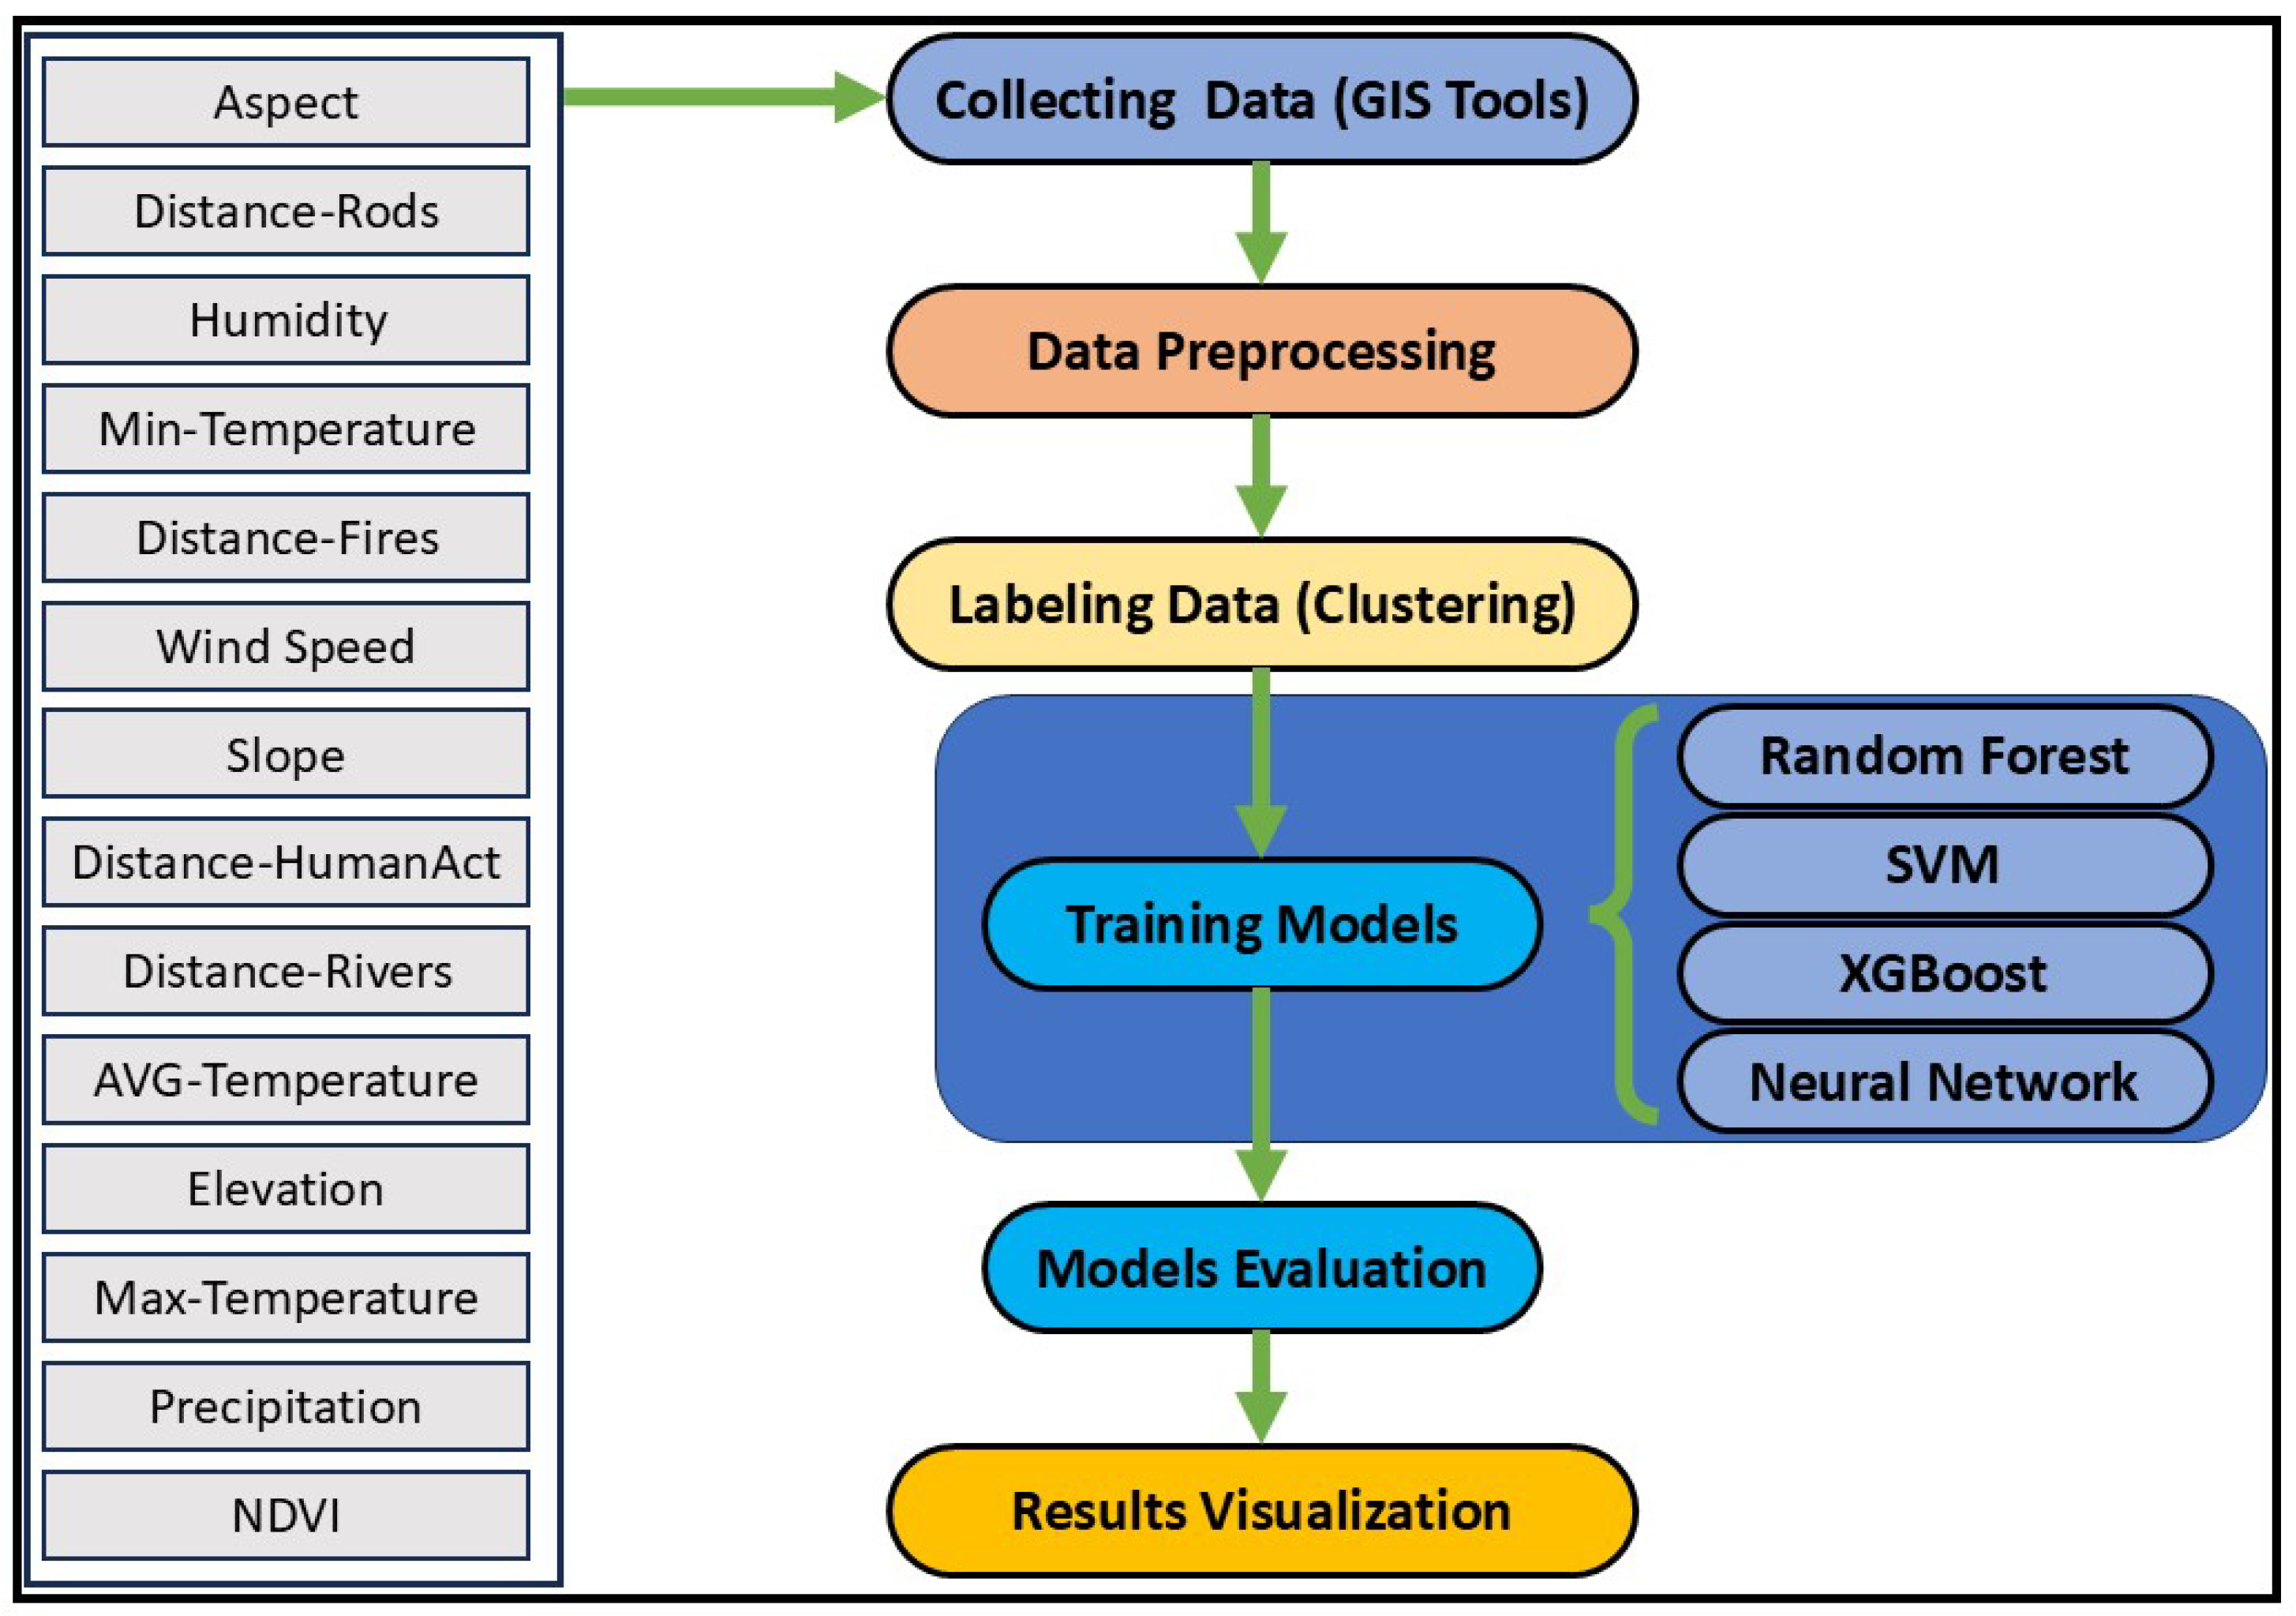
This section outlines the methodology adopted for the proposed framework of WSM. Our framework begins with the collection of data on factors influencing wildfire occurrence, followed by the integration of these factors using GIS tools to construct a comprehensive dataset. The data undergo preprocessing, including cleaning and labeling with historical wildfire records, and clustering methods are applied to enhance classification accuracy. Subsequently, we employ various machine learning techniques to classify areas based on wildfire susceptibility and evaluate model performance using multiple metrics.
In addition to conventional evaluation measures, an independent validation is carried out using wildfire occurrences from 2024 and 2025 to assess the model’s predictive reliability and spatial generalization capability. The last phase of the framework involves visualizing the results as maps using GIS tools, offering valuable insights for effective wildfire management and prevention strategies, as illustrated in
Figure 2.
3.1. Study Area
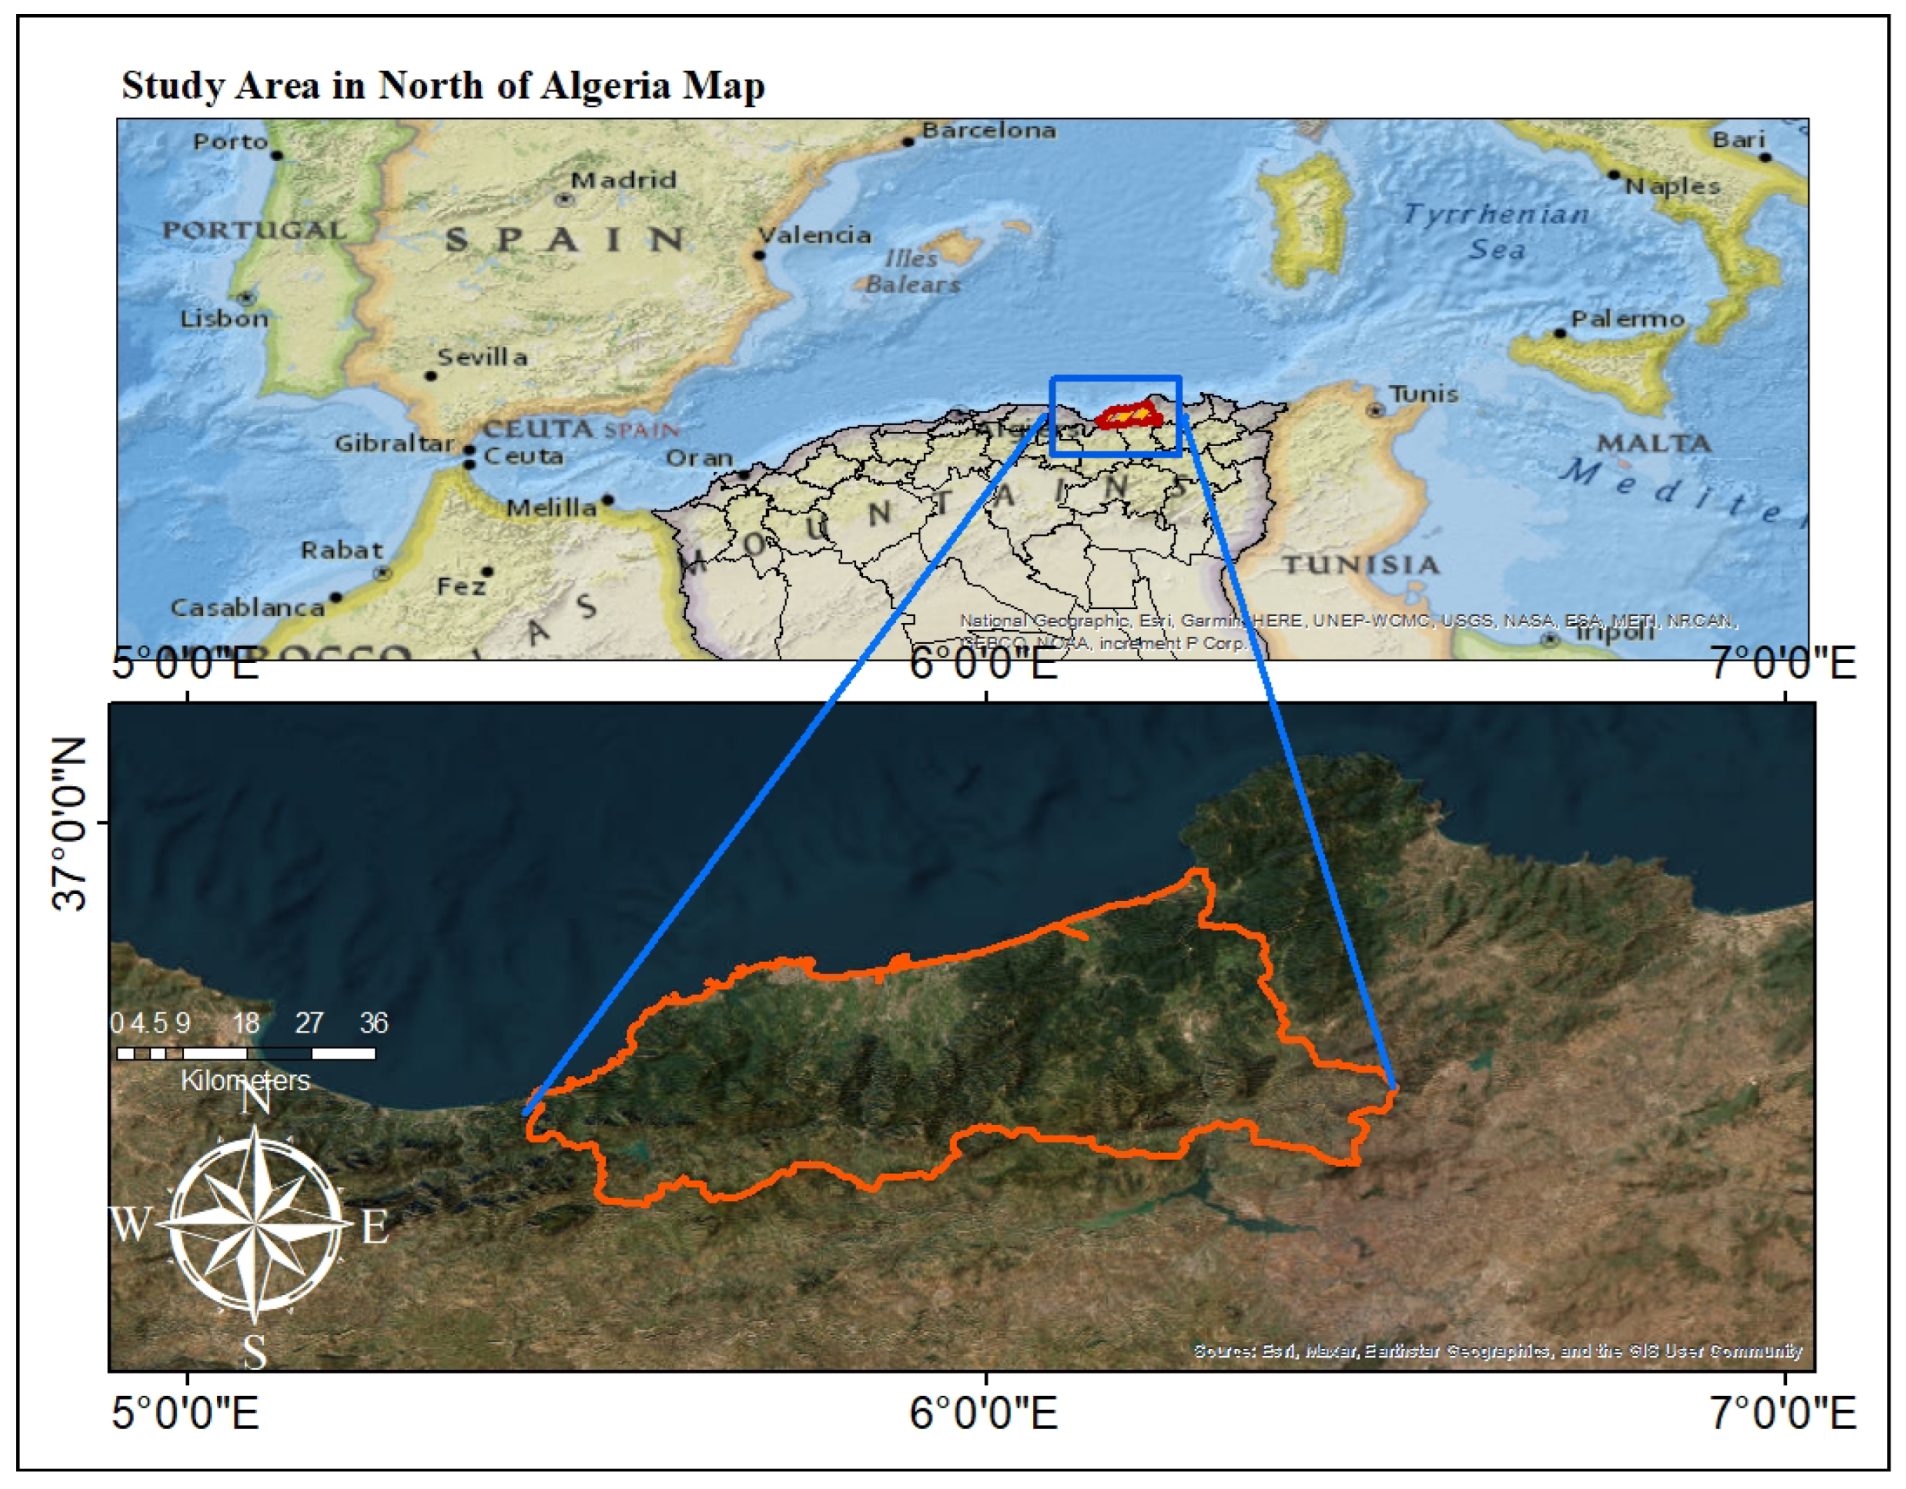
The study area encompasses the province of Jijel as presented in
Figure 3, situated along the coastal region in the east of Algeria, bordering the southern Mediterranean coast. Spanning an area of approximately 2398 km
2, this region is home to a population of 736,201 inhabitants and boasts a coastline stretching over 120 km [
4]. Jijel is renowned for its abundant rainfall, with annual precipitation ranging between 800 and 1200 mm, nurturing lush forests and rich vegetation [
4]. The climate in this area is characterized by moderate rainfall, with cold winters featuring temperatures between 5 °C and 15 °C, and hot summers ranging from moderate to warm, with temperatures typically between 25 °C and 35 °C [
4].
The topography of Jijel is diverse, featuring forested mountain ranges such as the Salma, Bouazza, and Al-Afroun mountains, which dominate 82 percent of the region’s surface area along the Mediterranean coast. These mountain ranges are interspersed with agricultural plains, contributing to the region’s varied landscape and ecological diversity [
38].
Despite this, the average burnt area per wildfire outbreak for forest maquis and scrub remains consistent with historical averages, as shown in
Figure 4, which illustrates the average areas burned per wildfire between 2012 and 2021. The year 2020, in particular, was marked by unprecedented devastation, with a staggering 365 wildfires ravaging vast swathes of forested areas. These wildfires not only pose a severe threat to the region’s natural ecosystems but also endanger lives and livelihoods [
4].
Covering 60% of its area, Jijel is predominantly forested, with rich biodiversity including cedar, oak, pine, and olive trees [
38]. However, the region faces a significant wildfire threat, particularly in recent years. In 2023, Jijel experienced intense heatwaves from the south, causing temperatures to soar above 50 degrees Celsius and creating a progressively drier climate. These conditions significantly elevated the risk of forest wildfires, resulting in frequent outbreaks and rapid wildfire spread [
38].
3.2. Dataset Preparation
The dataset preparation process began with gathering and organizing all relevant environmental, climatic, and anthropogenic information required for WSM. The following subsection details the data collection phase and the specific sources used for each factor.
3.2.1. Data Collection
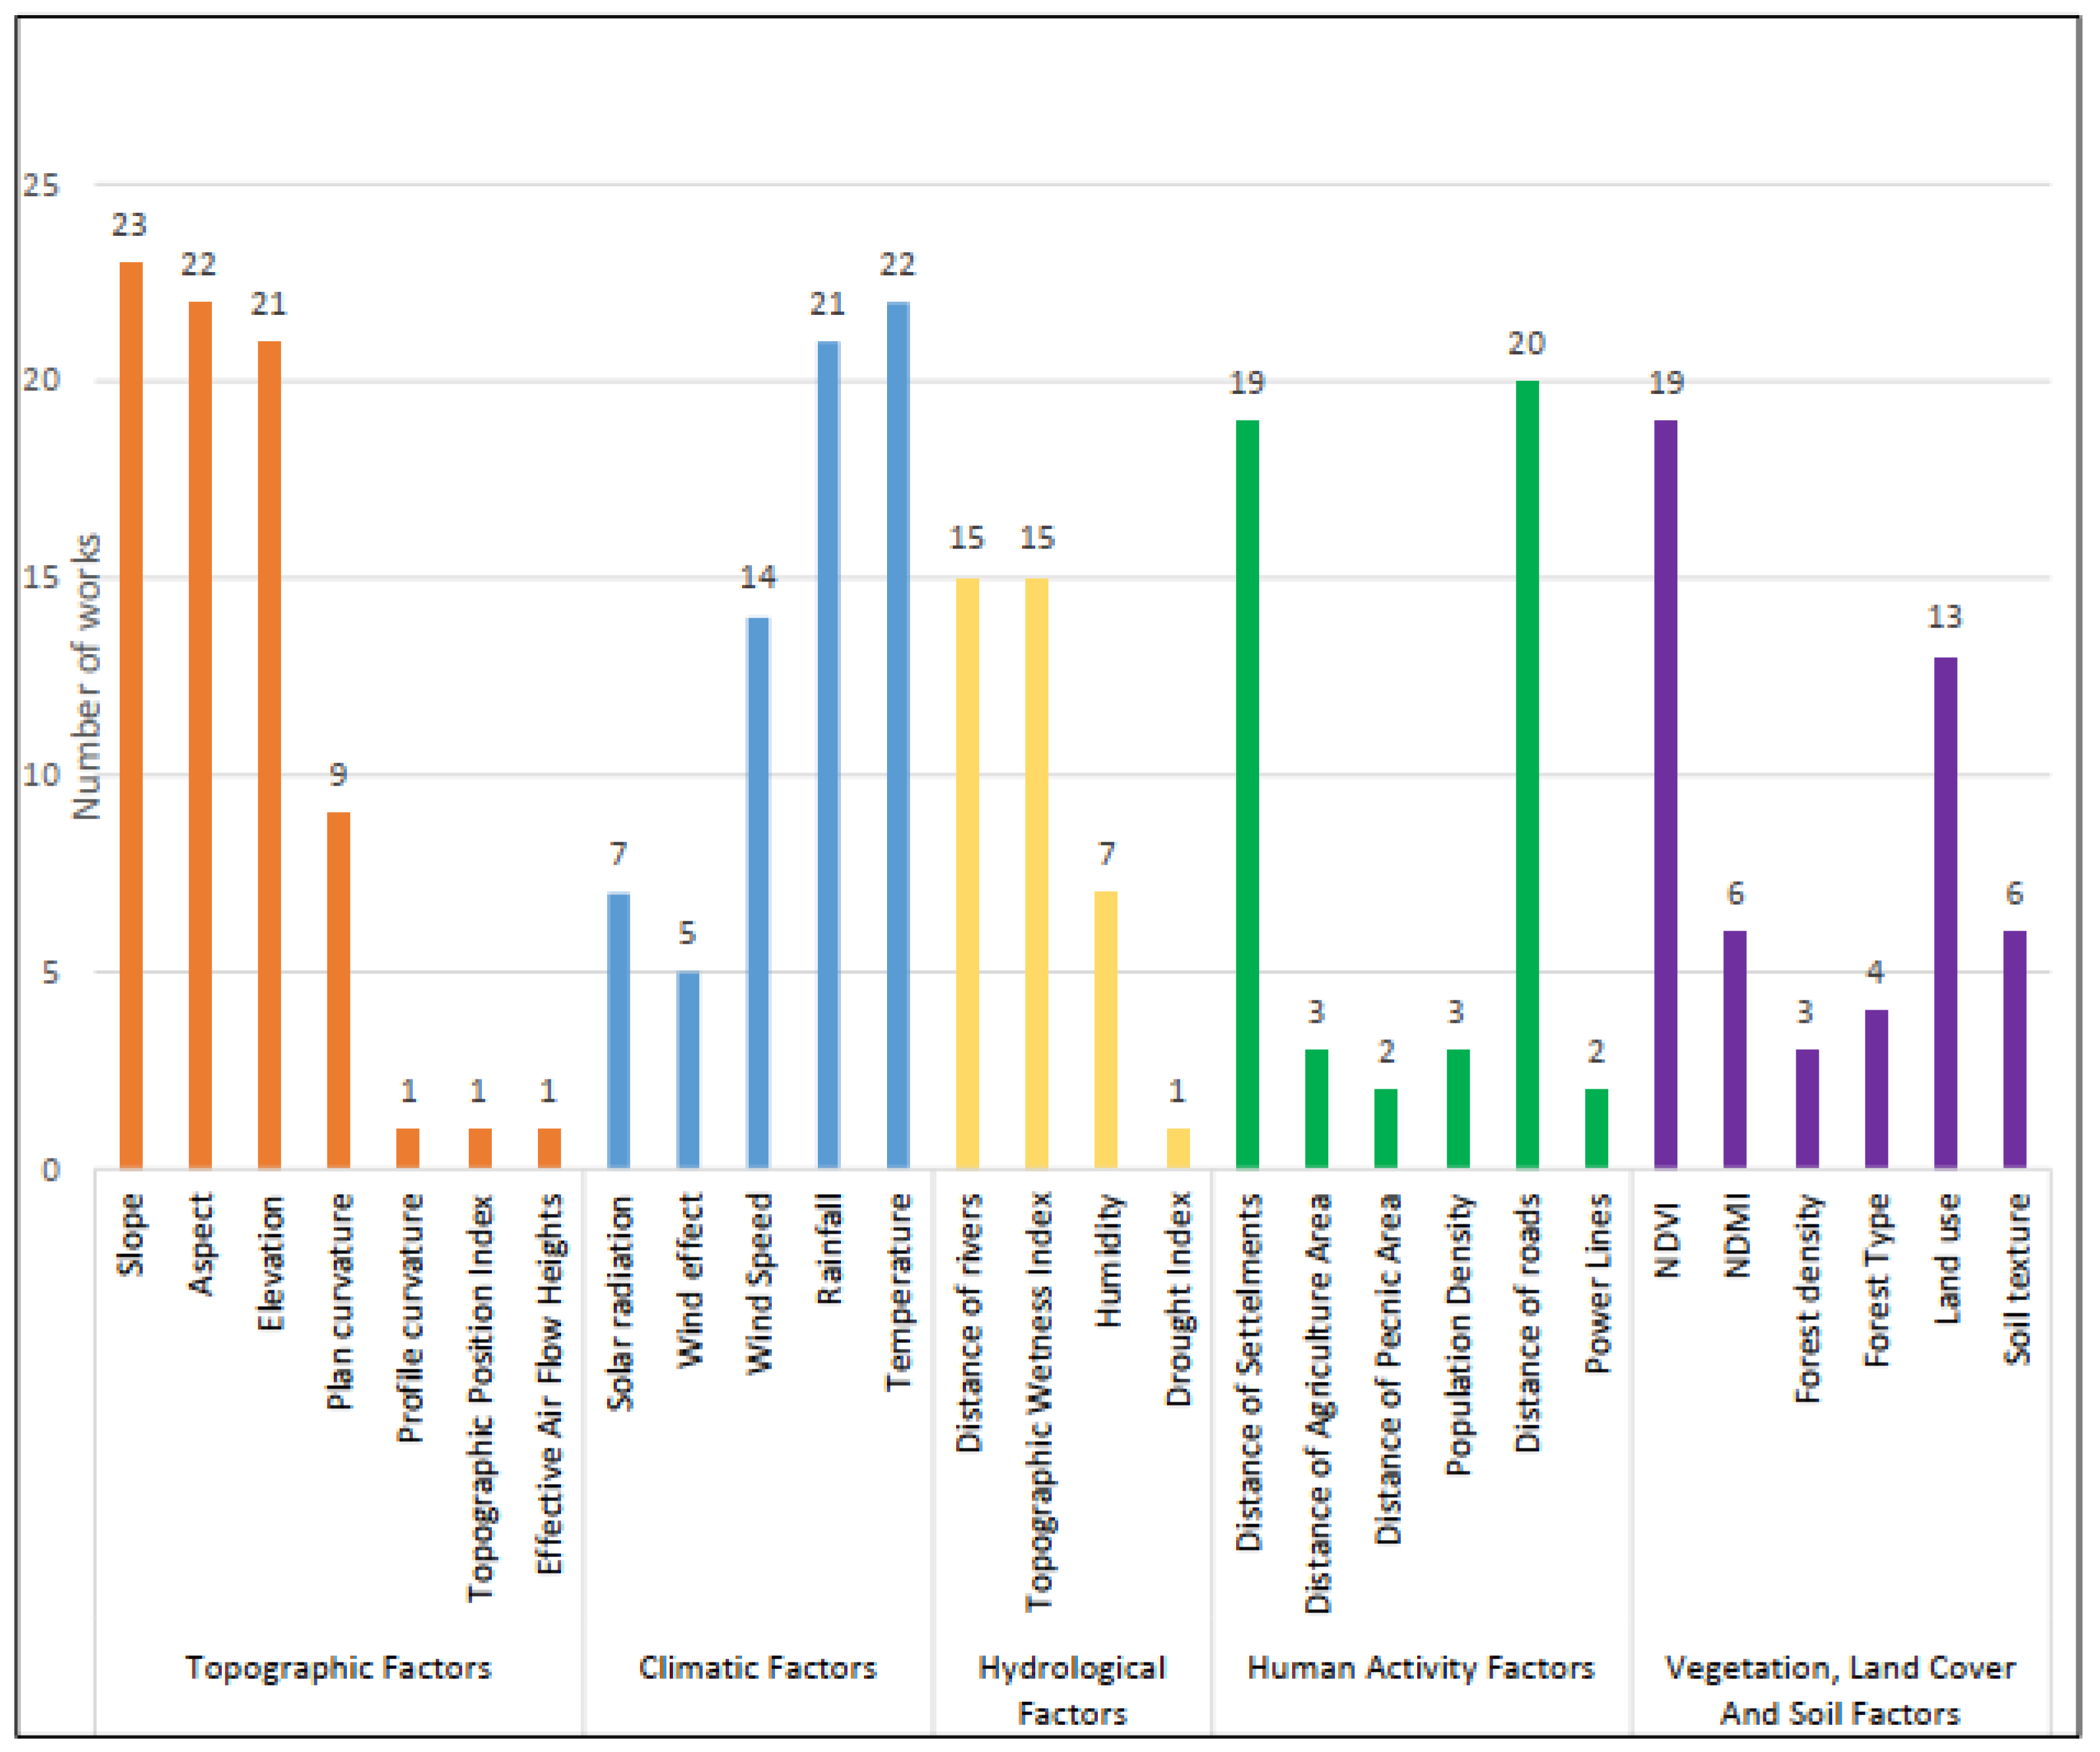
In the data collection phase, we relied on a combination of literature review and data availability to select 14 relevant variables for our study, aimed at mapping wildfire susceptibility.
These variables included topographical factors (aspect, slope, elevation), climatic factors (minimum, maximum, and average temperature; wind speed; humidity; precipitation), vegetation indices (NDVI), and anthropogenic factors (distance from rivers, roads, human activity, and fires).
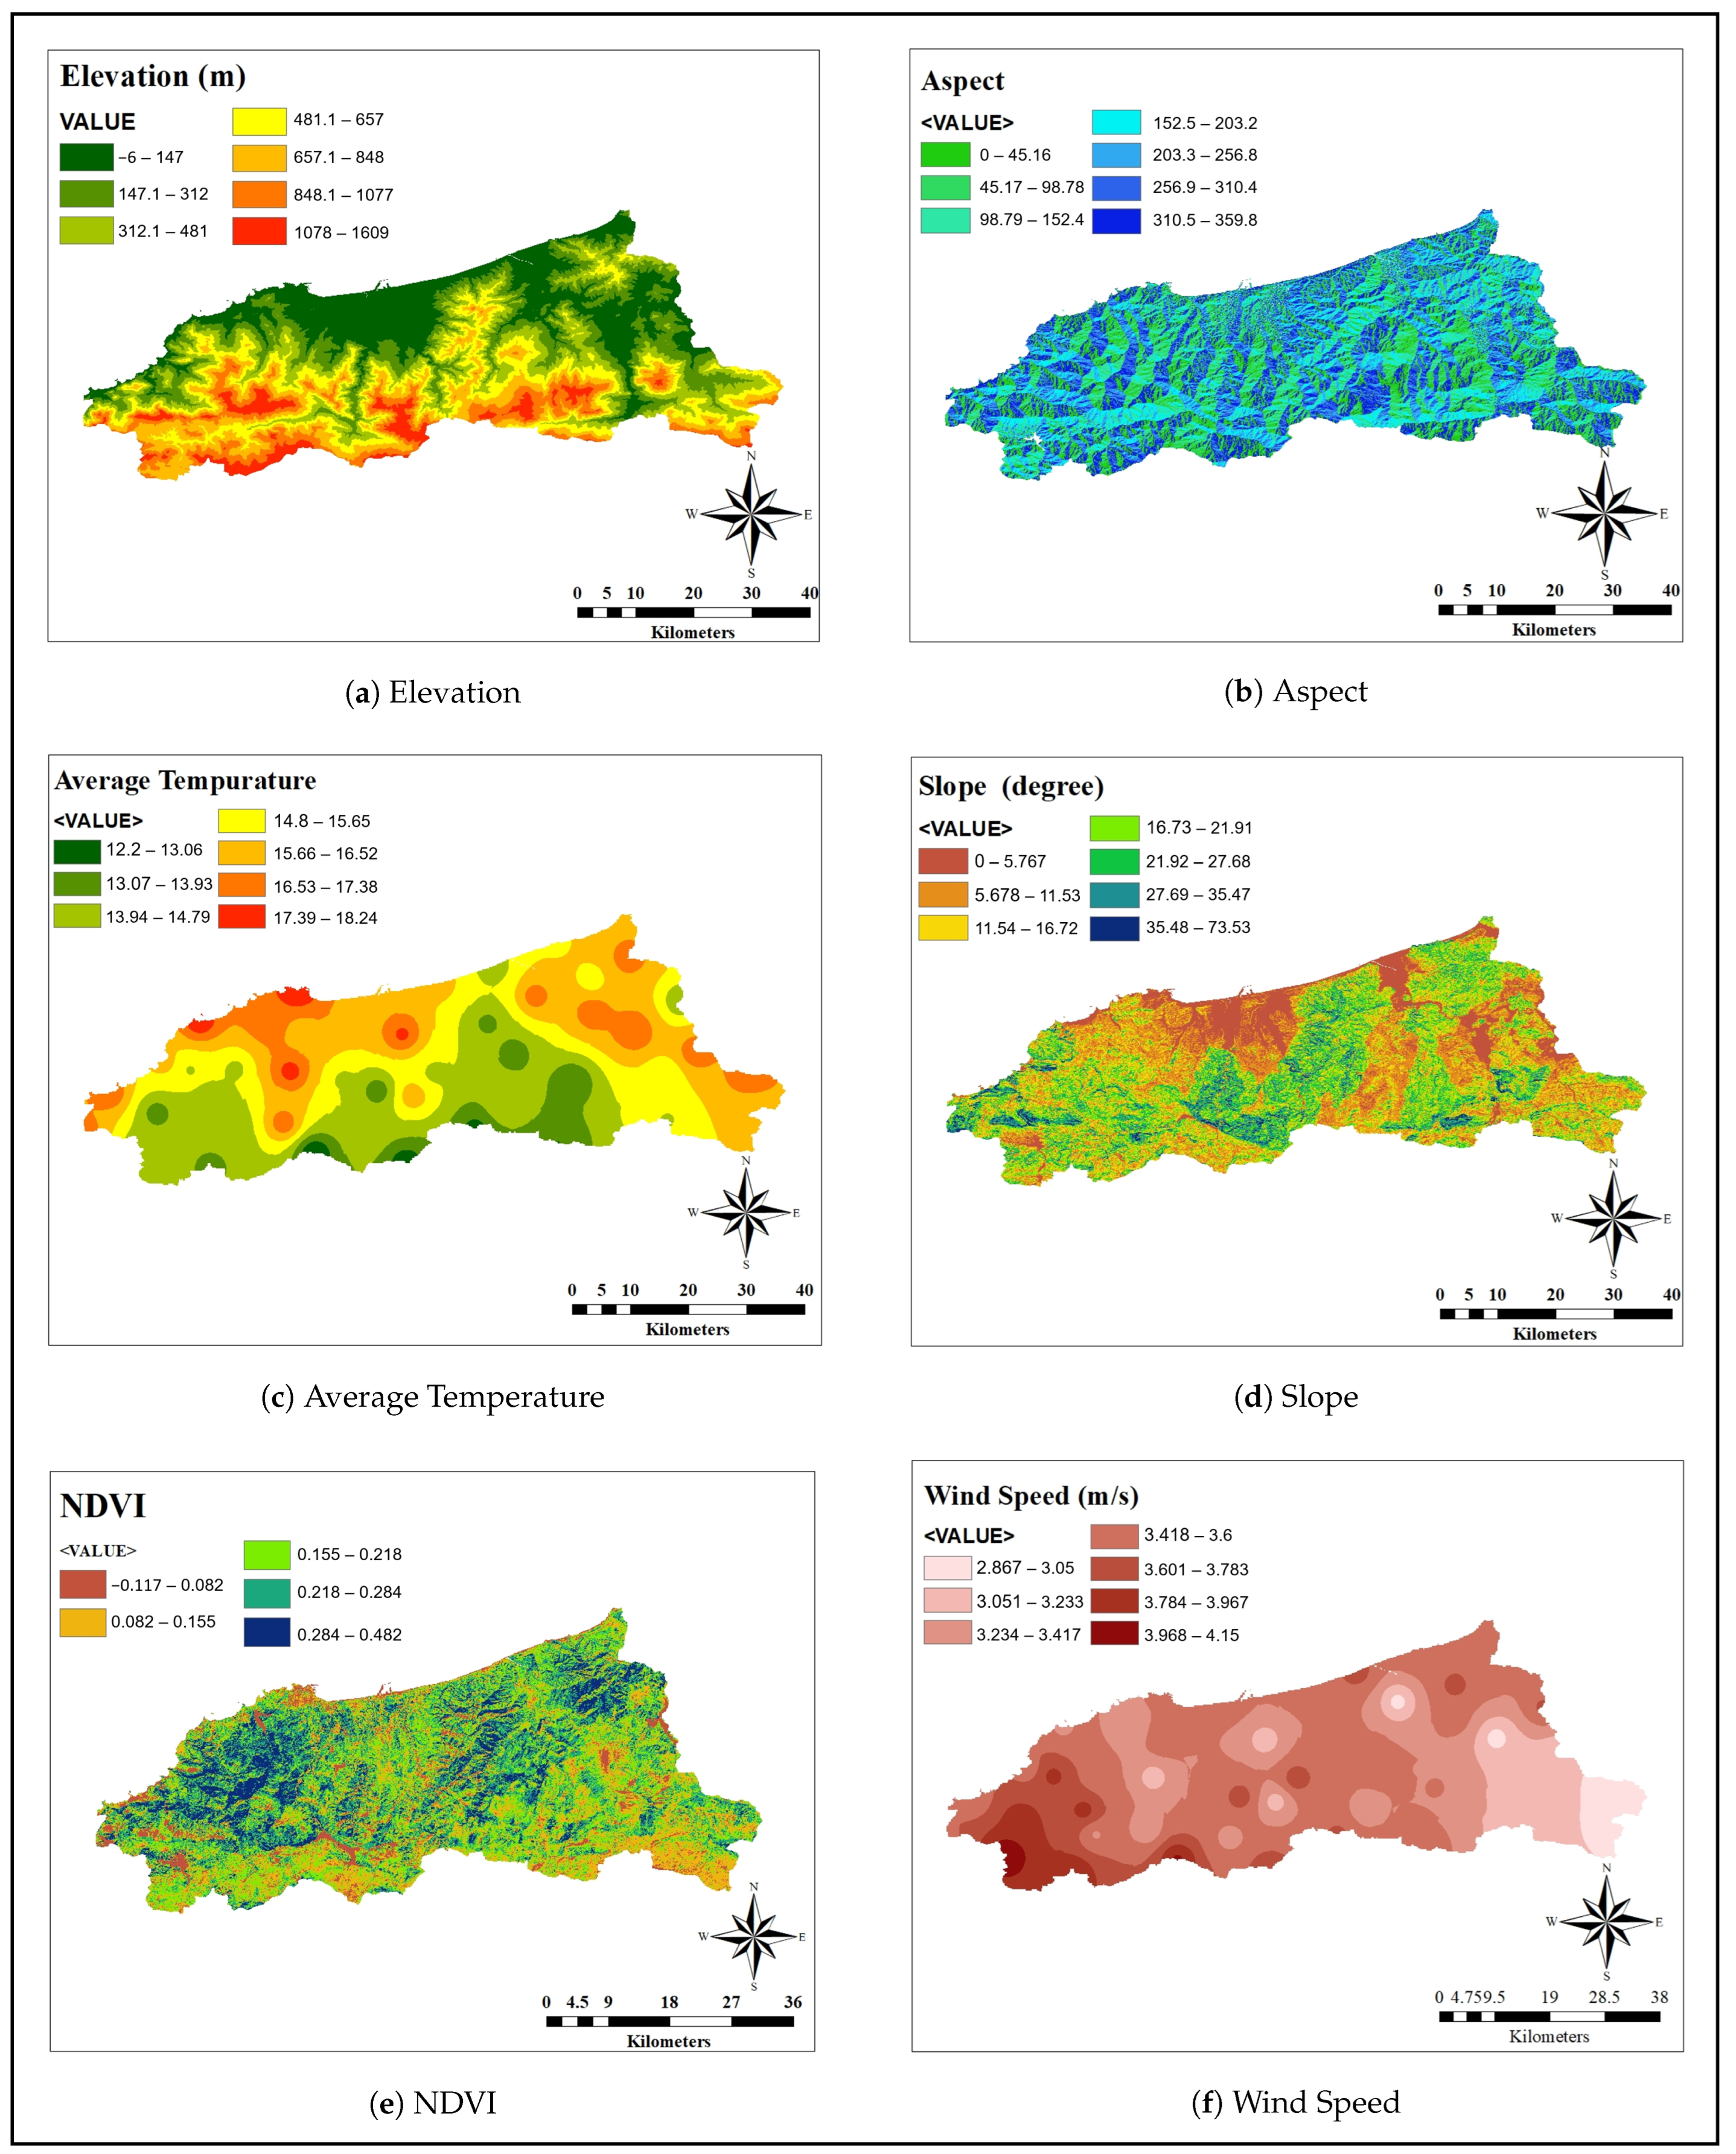
For topographical, slope (
Figure 5a), aspect (
Figure 5b), and elevation (
Figure 5d) factors data were derived from the Digital Elevation Model (DEM), downloaded from EarthExplorer (SRTM data) at a 30-m resolution [
39]. These factors are vital as they influence wildfire behavior by affecting fire spread, direction, and intensity [
16]. Steep slopes, for example, facilitate rapid wildfire movement, while aspect determines solar radiation levels, impacting vegetation distribution and fuel availability [
25].
Climatic factors, including temperature (
Figure 5c), wind speed (
Figure 5f), and humidity (
Figure 6b), were provided by the Algerian National Office of Meteorology from the Jijel meteorological station in Jijel province, with a scale of 1 km. Temperature variables (minimum, maximum, and average) were included to account for variations in extreme heat conditions, which significantly contribute to wildfire ignition and spread [
12]. Maximum temperatures, in particular, indicate the presence of heatwaves, a crucial driver of wildfire activity.
Wind speed influences fire spread, while low humidity accelerates vegetation desiccation, making conditions more conducive to wildfires [
14]. Precipitation (
Figure 5e), also sourced from the National Office of Meteorology, directly impacts fuel moisture and is a critical hydrological factor. Vegetation data (
Figure 6a), represented by the Normalized Difference Vegetation Index (NDVI), were derived from MODIS images downloaded from NASA’s Terra platform at a 30-m resolution [
40]. NDVI is widely regarded as the best indicator of vegetation health and flammability characteristics, as noted in [
8], making it a key variable for WSM.
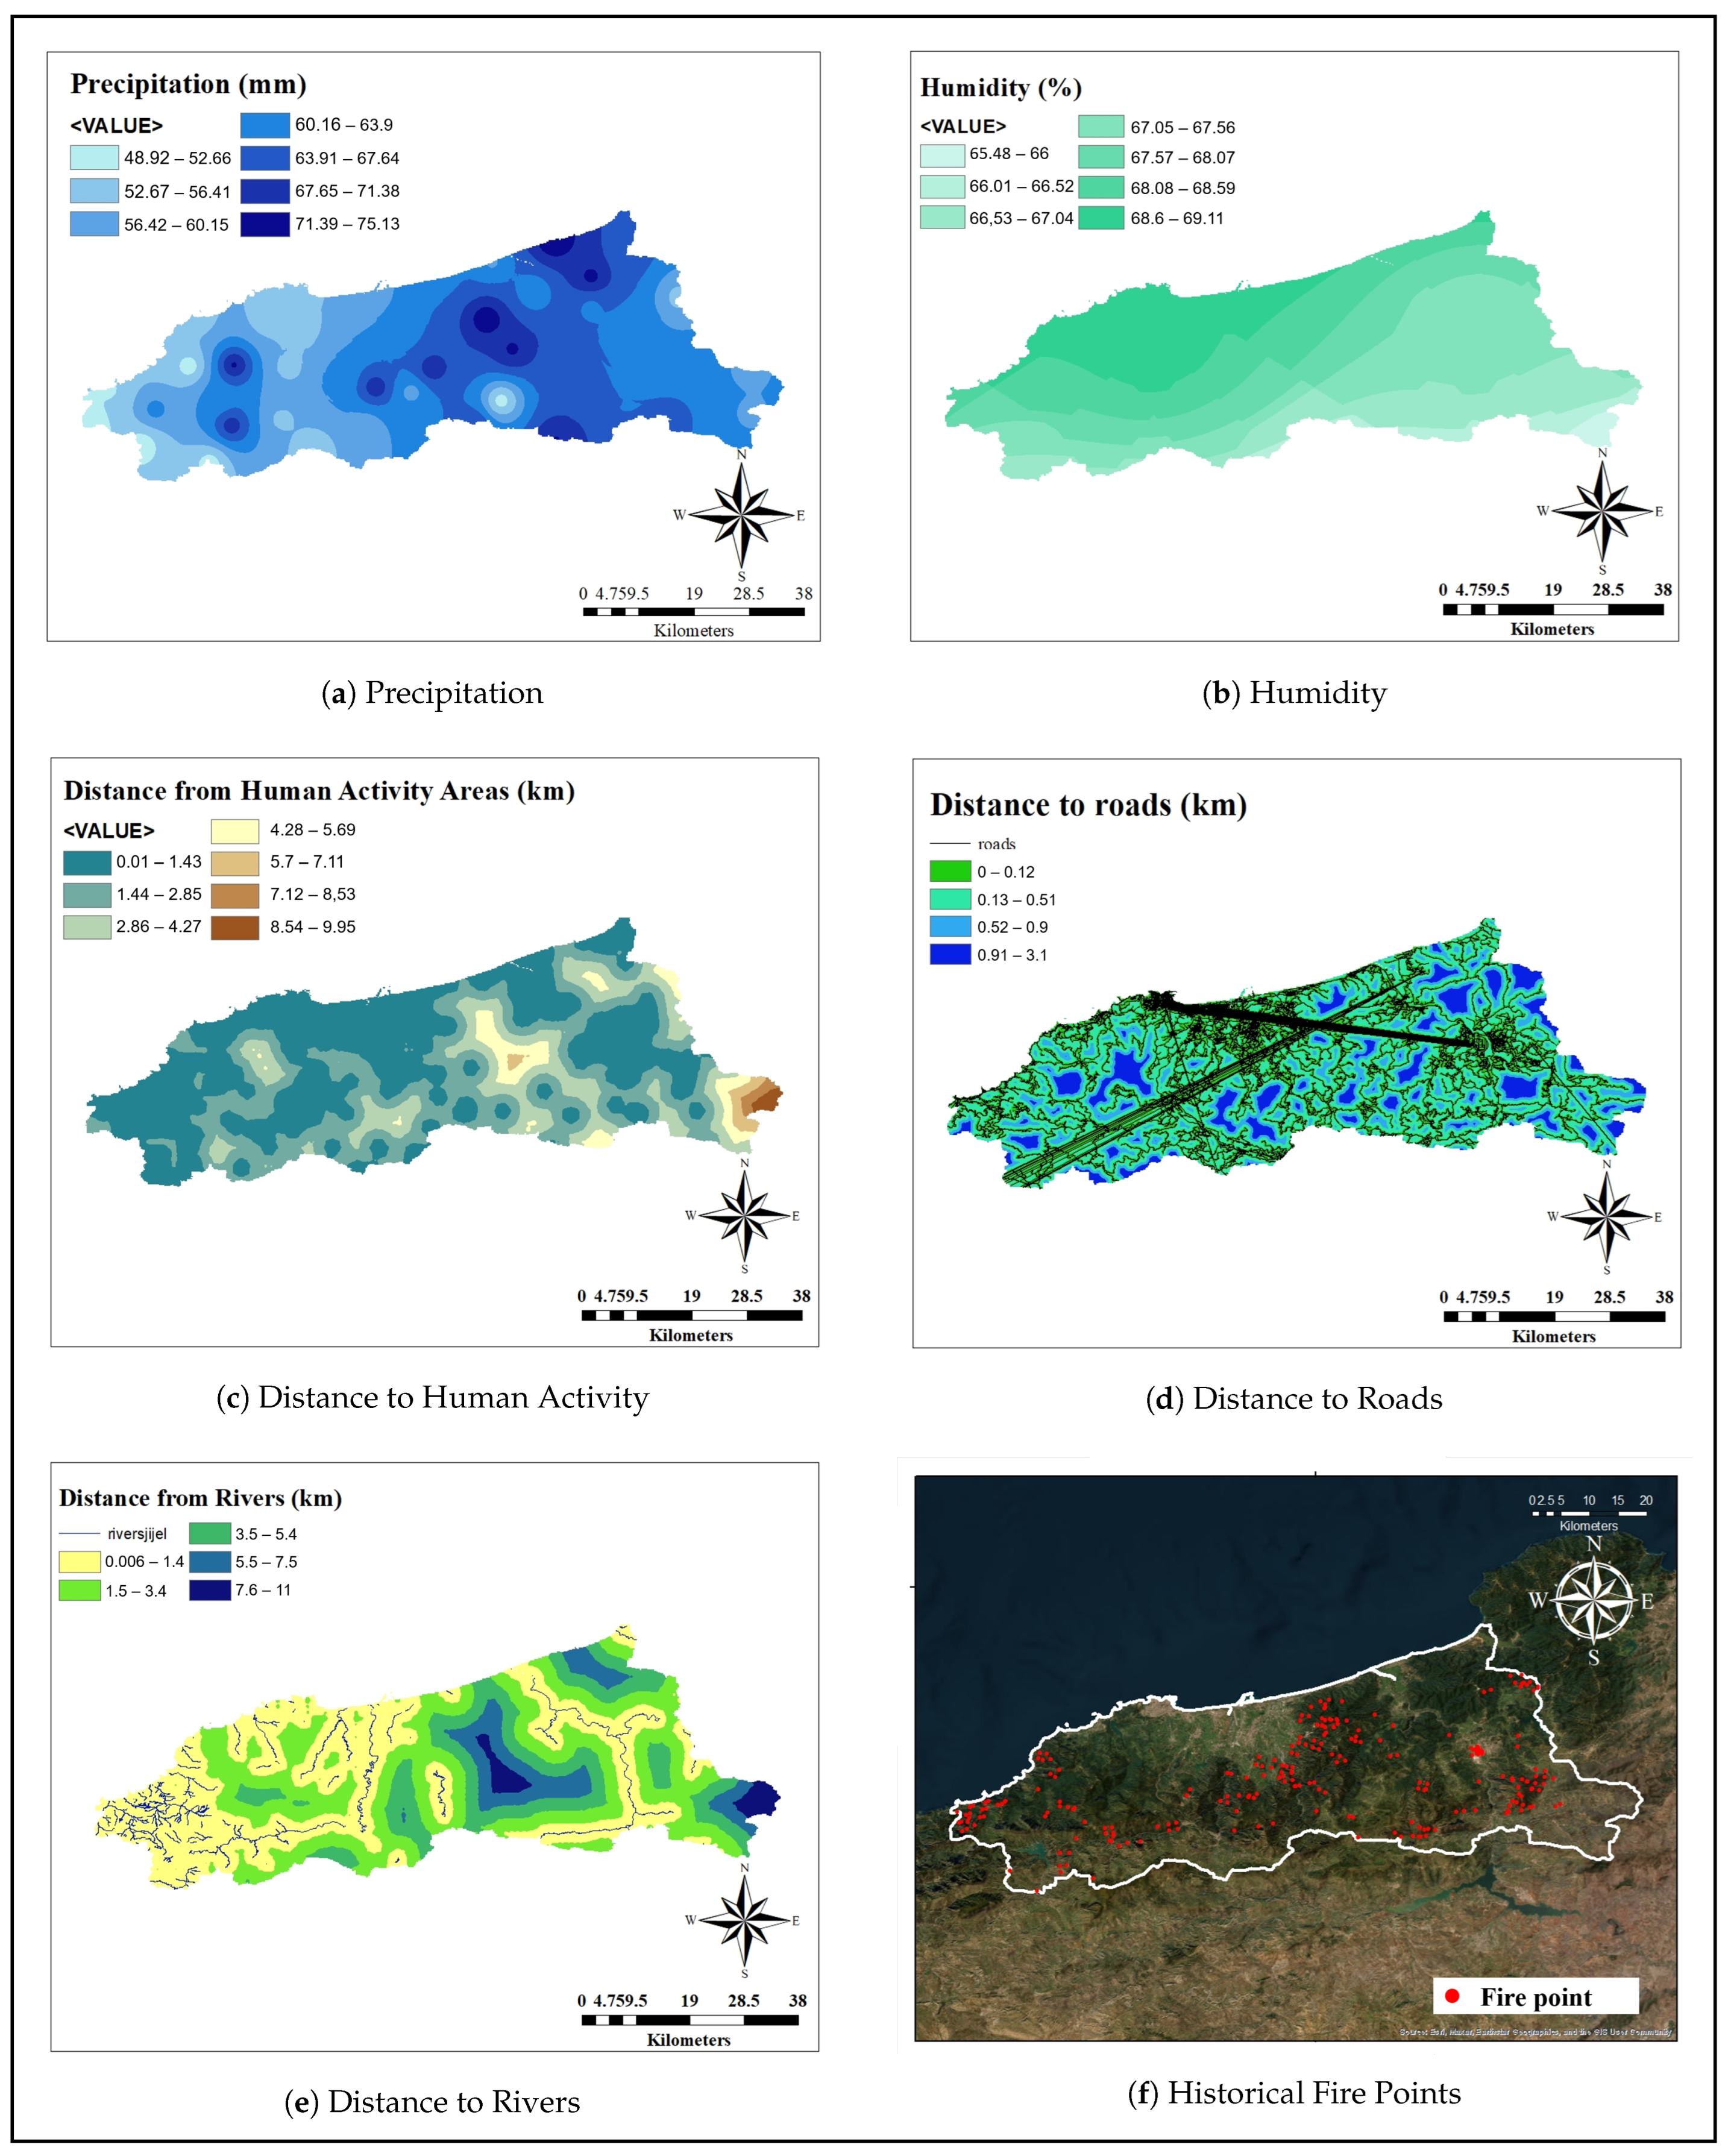
We generated several data layers using GIS tools (ArcGIS 10.8.2) to represent specific environmental and human activity factors required for fire susceptibility analysis. For example, a distance map from rivers (
Figure 6e) was created to reflect river density, which serves as a key hydrological factor influencing fire occurrence. Additionally, distance maps from roads (
Figure 6d) were produced to capture human activity, as proximity to infrastructure often correlates with fire ignition risk. Areas closer to residential or agricultural zones (
Figure 6c) often exhibit higher wildfire incidence rates due to accidental ignitions or deliberate human actions.
These layers were produced at a 30 m scale and were derived from various maps, including those available from Google Earth, such as roads, rivers, settlement areas, industrial zones, and water channels in Jijel.
Figure 6c–e presents the generated maps for these data layers, showcasing the spatial distribution of the identified factors. In addition to the environmental variables collected, historical wildfire data recorded by Algerian civil protection authorities over the past three years will be incorporated into our analysis.
These authorities use different platforms for disaster and emergency recording and control. In Jijel, 244 forest wildfires were recorded in the last three years: 121 wildfires in 2021, 34 wildfires in 2022, and 89 wildfires in 2023. By plotting historical wildfire data on the map (as shown in
Figure 6f) to extract wildfire density data, it will serve as crucial labels to classify our collected environmental data into four susceptibility classes, ranging from low to very high risk of wildfires.
In addition to these historical records, we collected wildfire occurrences from 2024 and 2025 to validate the predictive performance of the proposed model. For these years, Protection Civile records reported 113 fire events in 2024 and 76 in 2025, while additional fire detections were retrieved from the MODIS (Moderate Resolution Imaging Spectroradiometer) satellite products (Terra and Aqua). The MODIS Active Fire datasets provided over 2348 detected fire points, which were cross-referenced with the Protection Civile data to ensure completeness and reliability.
Table 2 represents the data used in our study, their sources, and the range of each one, including maximum and minimum values.
Generated layers were derived from primary GIS inputs (roads, settlements, DEM, land cover) using reproducible workflows in QGIS/ArcGIS: distance-to features (Euclidean), density kernels, slope/aspect from SRTM DEM, and resampling to 30 m in WGS84/UTM 31N. Wildfire occurrence data were provided by Algerian Civil Protection (2015–2025) as incident reports (date/time, coordinates, commune, burned area). We geocoded/verified points, removed duplicates, filtered obvious geolocation errors (>1 km from land), and cross-checked with MODIS/VIIRS hot spots for plausibility.
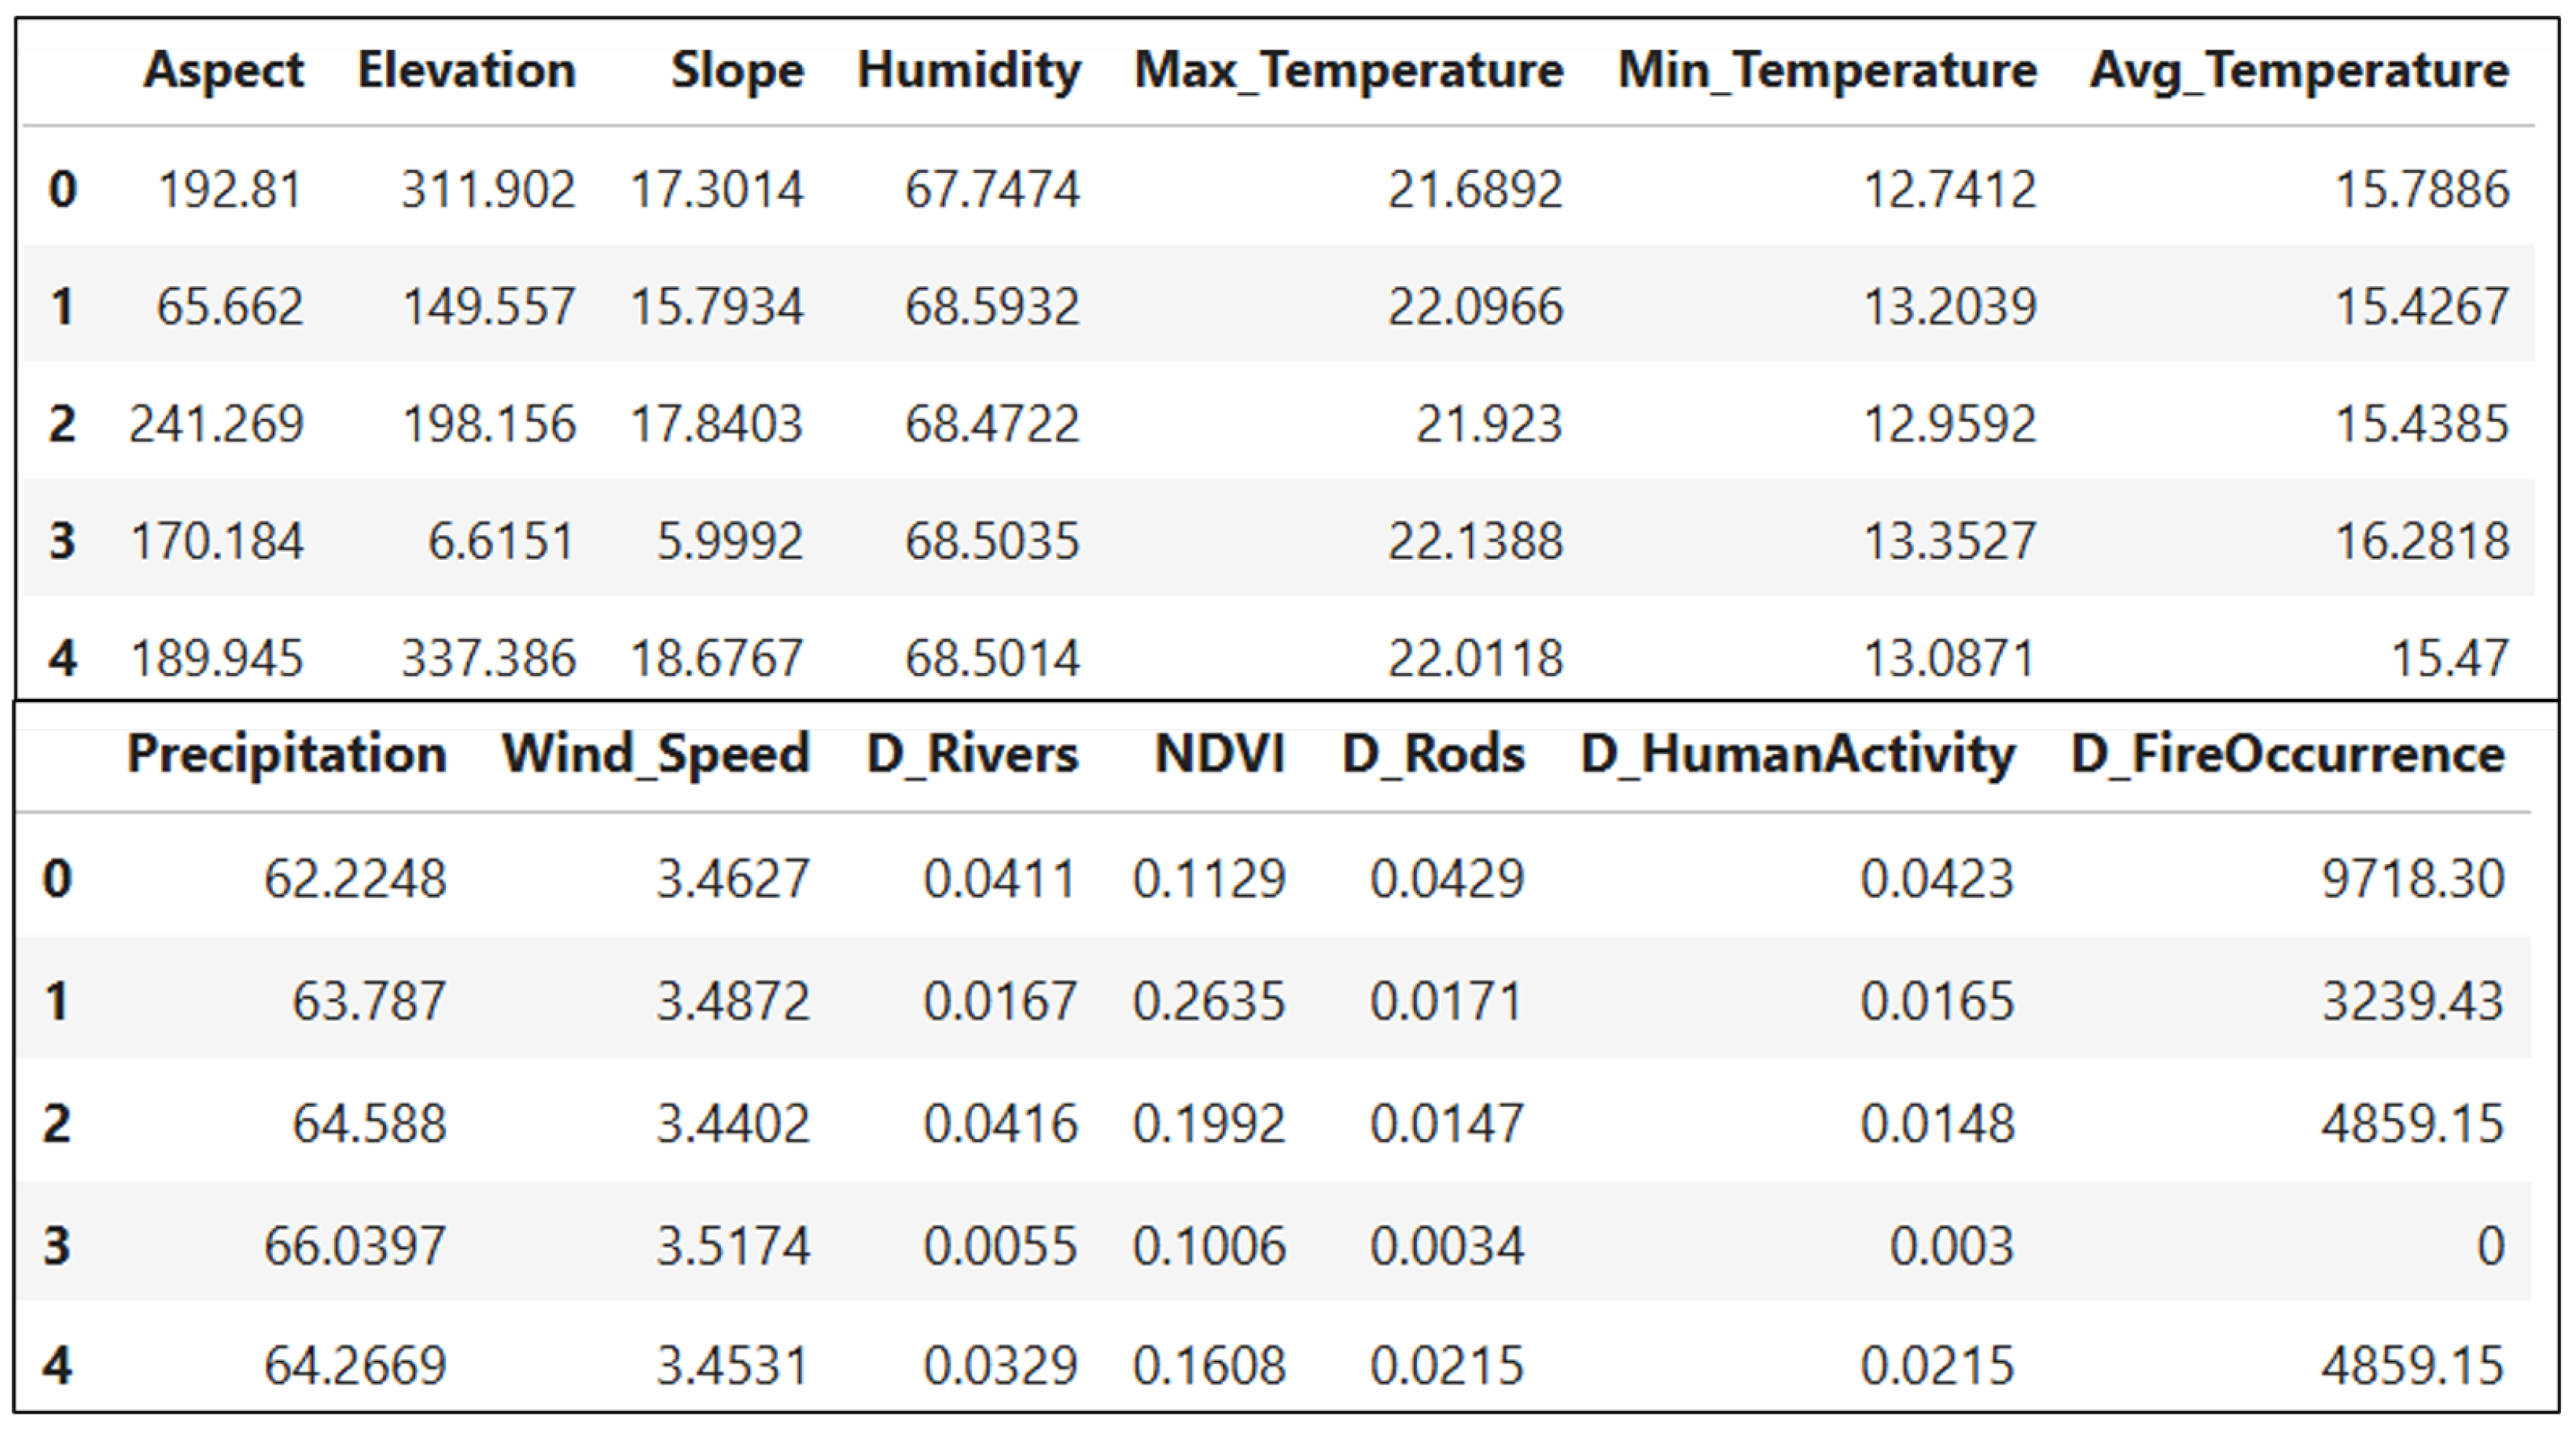
To ensure consistency across multiple data sources, GIS was employed for data scale unification. We standardized the spatial resolution of the dataset to a uniform 30 m × 30 m grid. For data construction, GIS facilitated the transformation of each map into numerical data and the combination of these tables using geographic matrices. This resulted in a comprehensive dataset with over 2.6 million entries and 14 factors, as shown in
Figure 7.
3.2.2. Data Preprocessing
The data preprocessing phase began with applying data cleaning methods. This involved handling missing values by replacing them with the means of neighboring values. We also addressed duplicate values by removing them from the dataset. It is noteworthy that the data extracted using GIS tools exhibited high quality. In our dataset, consisting of 2.6 million entries and 14 factors, we did not find any missing or duplicated values.
Multicollinearity is a common issue in susceptibility modeling, where strong correlations between multiple conditioning factors can lead to inflated coefficients and reduced model accuracy [
14]. To ensure the reliability of our WSM, it is crucial to detect and quantify multicollinearity before establishing the models.
The Variance Inflation Factor (VIF) and tolerance are two widely used methods to evaluate multicollinearity in input datasets.
The VIF quantifies the increase in the variance of the estimated regression coefficients due to the correlation among predictors, while tolerance measures the proportion of variance in a predictor not explained by other predictors. Typically, a VIF value exceeding 10 or a tolerance value below 0.1 indicates high multicollinearity, necessitating further investigation and potential remediation.
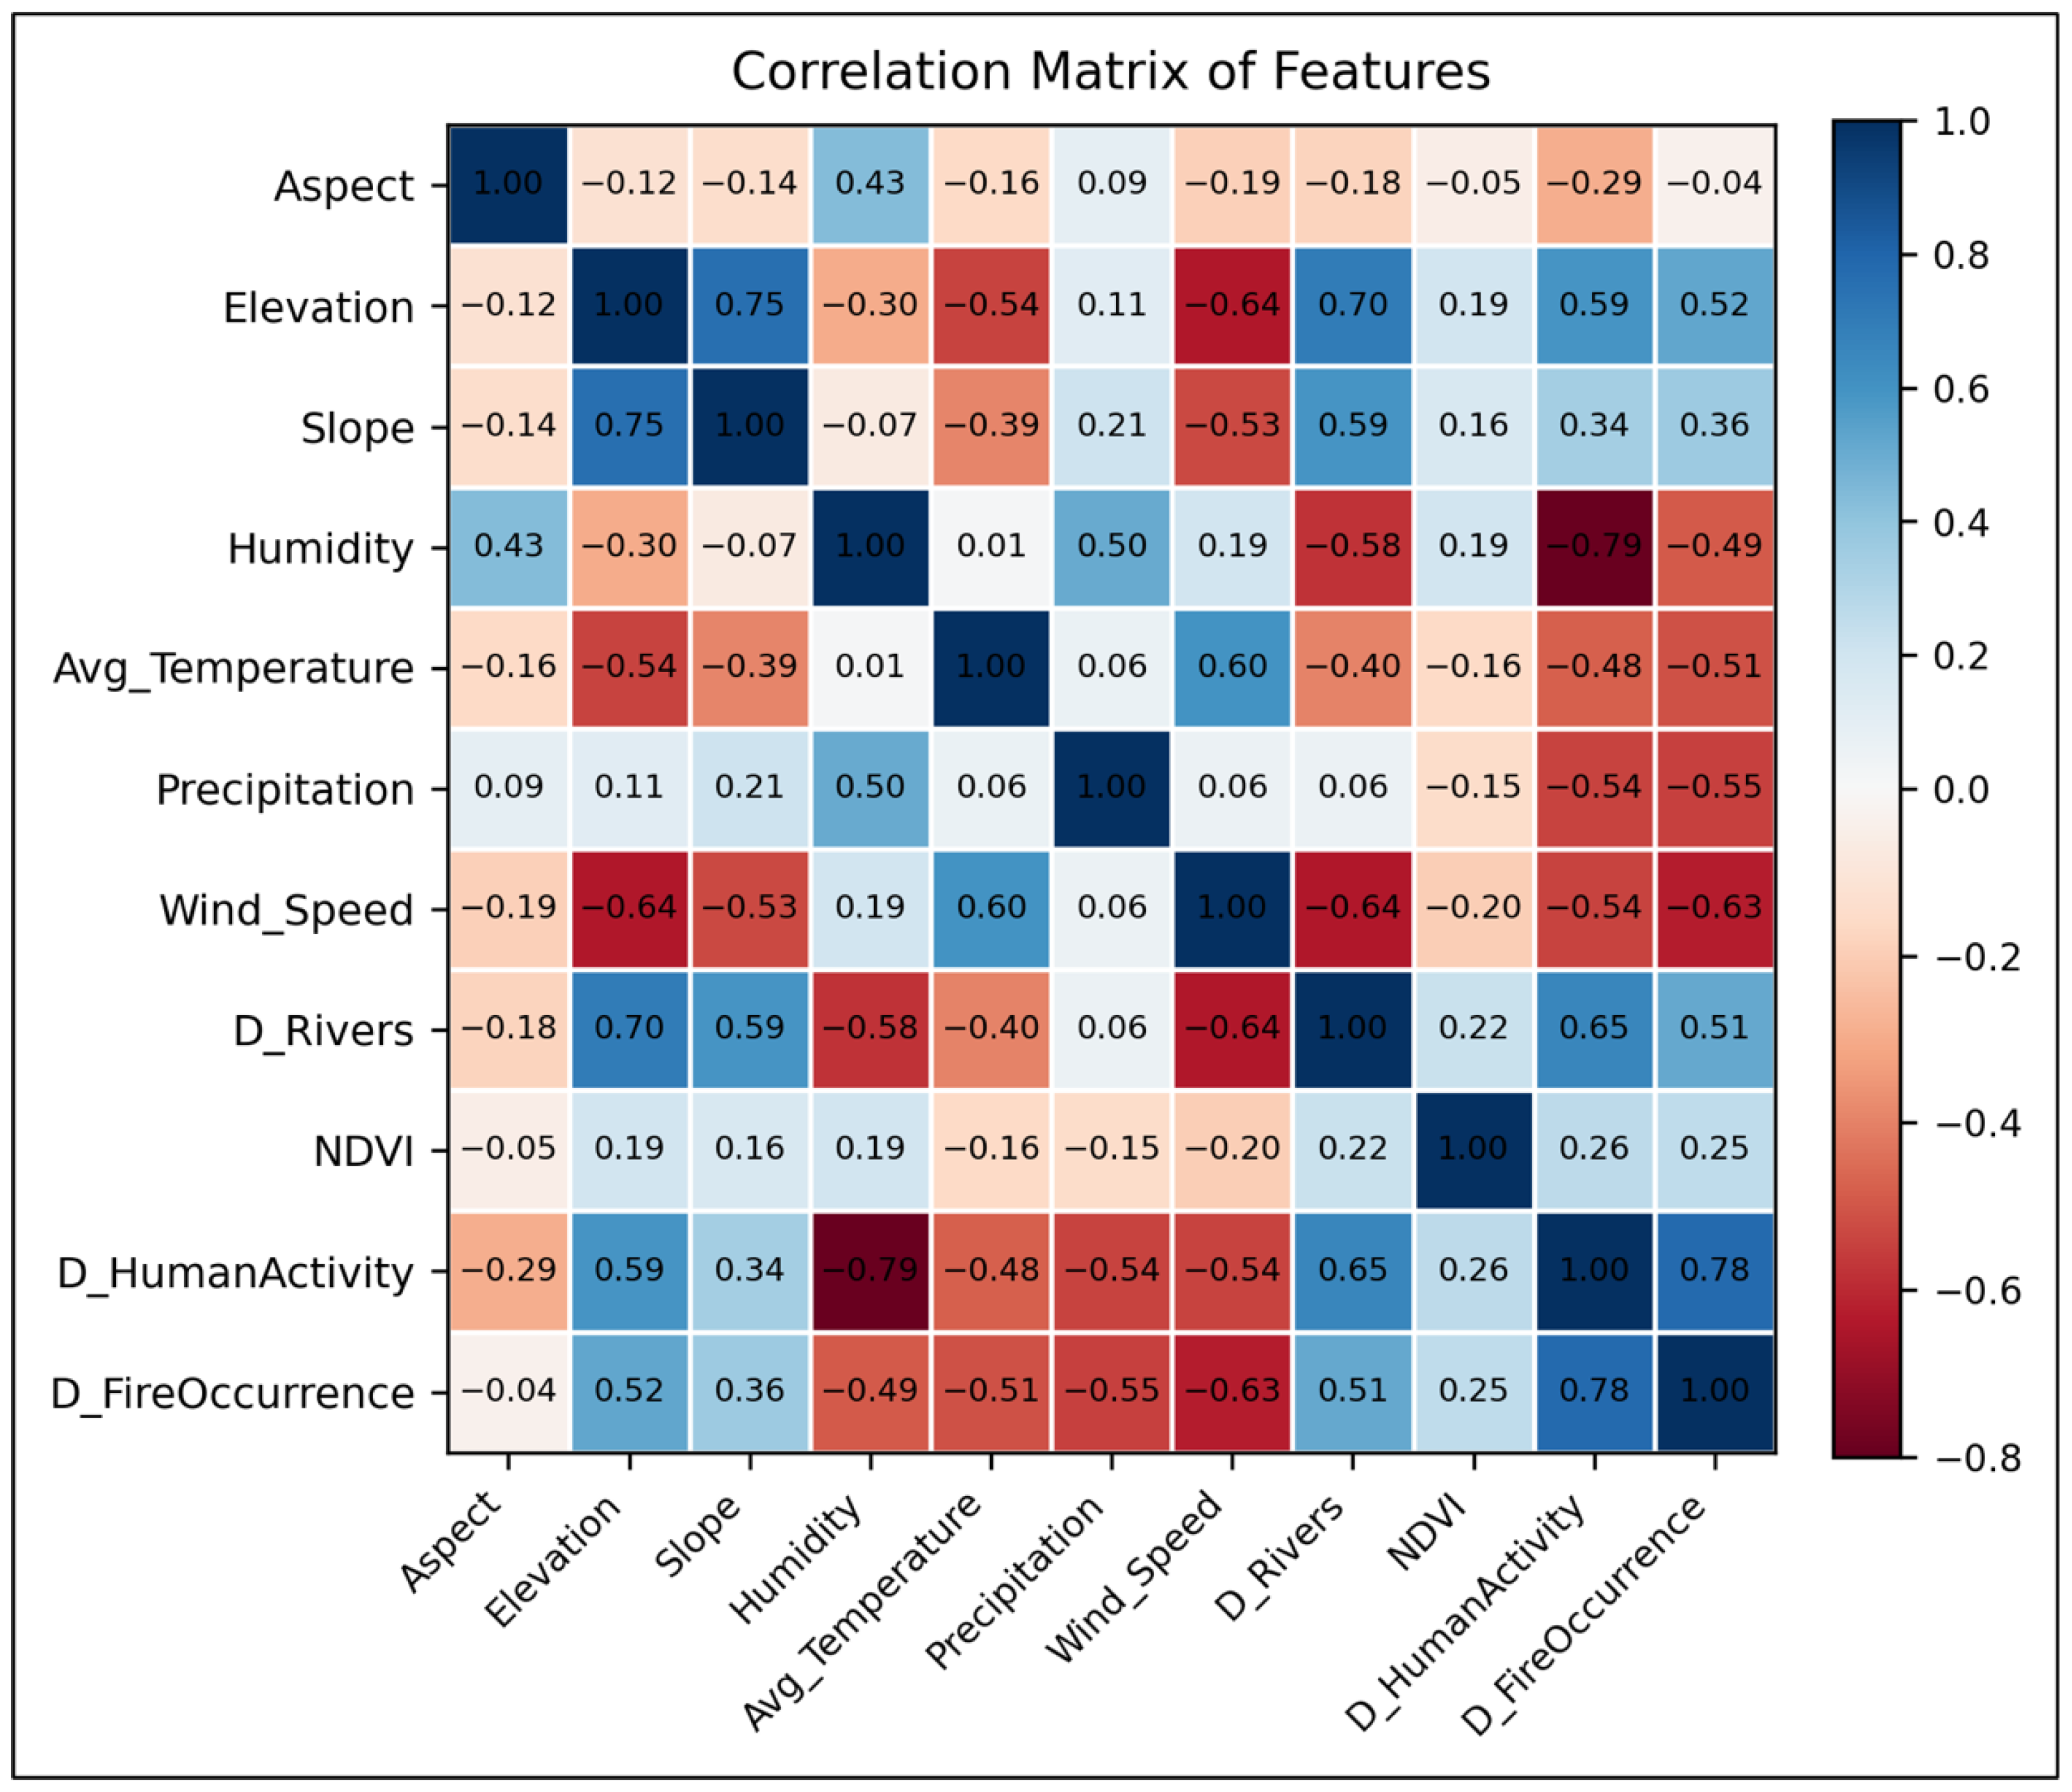
We calculated the VIF and tolerance values for our dataset and plotted the correlation matrix to visualize the relationships between the factors. These steps helped confirm the suitability of the selected factors for our WSM, ensuring that the model would not be compromised by multicollinearity issues.
3.2.3. Dataset Labeling
After data preprocessing, the next step in building our dataset involved labeling the data based on historical wildfire occurrence records. Using GIS tools, we classified the data into four susceptibility classes: low, medium, high, and very high. This classification was determined by the distance to previous wildfire incidents and their density.
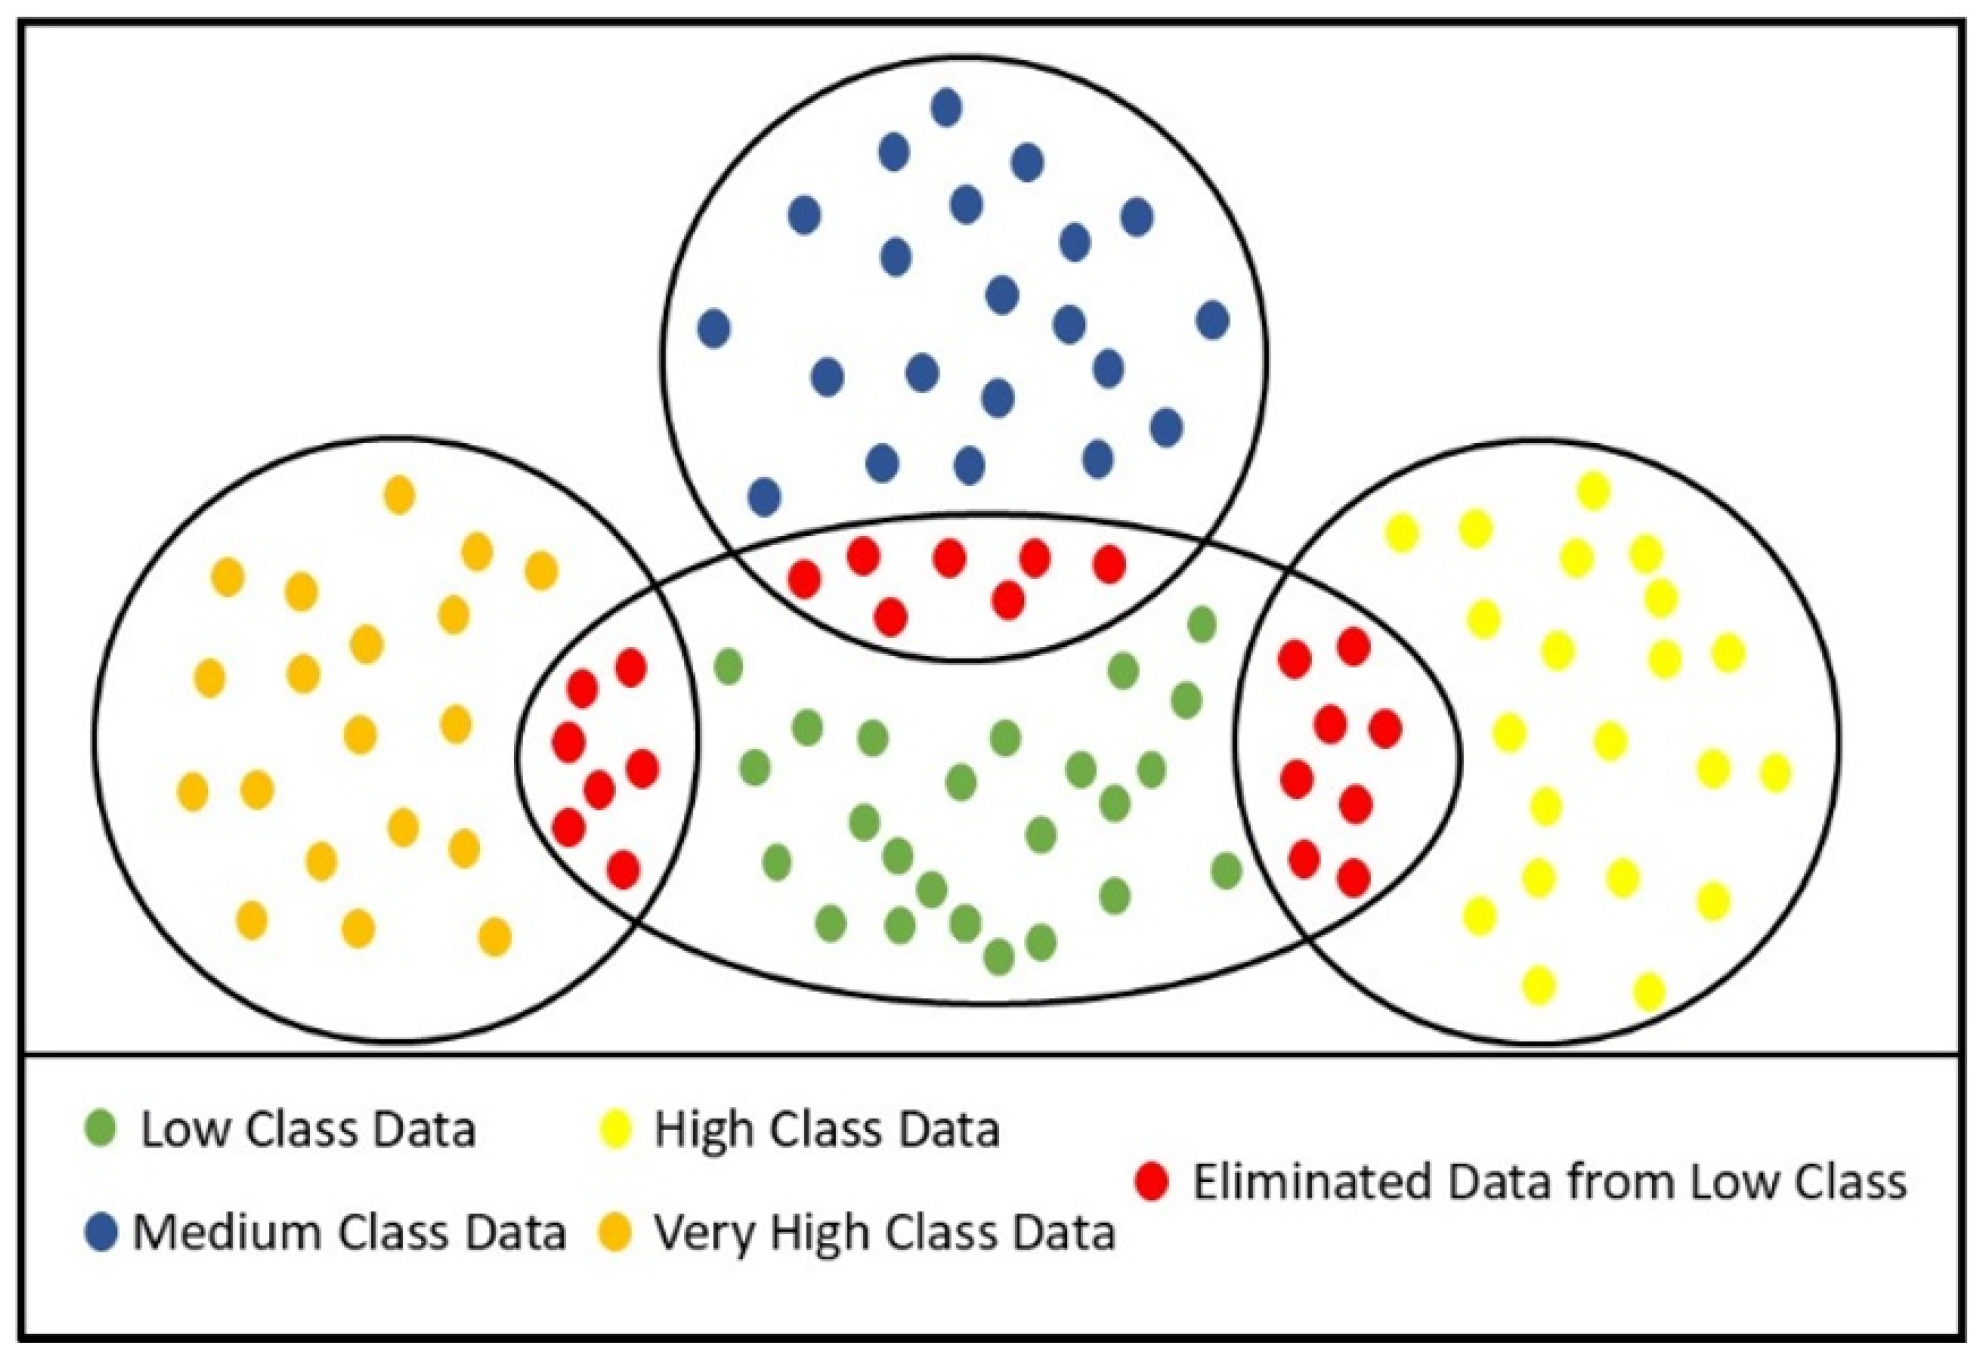
This classification process produced a dataset containing these four classes. We ensured that tuples in the medium, high, and very high classes were accurately classified. However, the tuples in the low susceptibility class posed a challenge. Areas with similar characteristics to high-risk areas might be classified as low susceptibility simply because they have not experienced wildfires before. This misclassification could potentially affect the accuracy of our models.
To reduce noise in Low classes, we ran k-means (k = 2, StandardScaler, Euclidean; n-init = 10; max-iter = 300, random-state = 42) on paired subsets (Very High and Low), (High and Low), and (Medium and Low) in the 14-factor space. Low samples assigned to the higher risk centroid in any pairing were removed (1.9% of Low). Sensitivity checks (n-init in 10, 20, alternative seeds, light feature reweighting) yielded near-identical flags (<0.2% variance).
This step helped to eliminate tuples from the low susceptibility class that had similarities with tuples in the higher risk classes. As a result, we obtained a well-classified dataset that ensured better learning for our models.
Figure 8 illustrates this step in the dataset building process.
3.3. Machine Learning and Evaluation Methods
After collecting data and building our dataset, we proceed to apply machine learning methods for classifying areas based on wildfire susceptibility. We selected four machine learning methods for this task: RF, Support Vector Machine (SVM), Neural Networks (NN), and eXtreme Gradient Boosting (XGBoost). Each of these methods offers distinct advantages in WSM.
We split the labeled dataset into 70% for training and 30% for validation (stratified by class), while final, independent validation relied on newly observed fire points from 2024–2025 overlaid on the generated susceptibility maps. Model development used Python version 3.13.5 libraries: scikit-learn for classical ML, TensorFlow for NNs, and XGBoost, with data preprocessing and analysis in pandas and NumPy, and GIS preprocessing and cartography performed in ArcGIS 10.8.2.
Before applying the ML methods, we assessed multicollinearity among predictors. To this end, we computed the Variance Inflation Factor (VIF) and its reciprocal, Tolerance, for each factor. For a given predictor
, we regress
on all remaining predictors and obtain the coefficient of determination
. Then
Following common practice, we consider
(equivalently,
) as indicative of problematic multicollinearity. To make computation tractable for the large dataset (2.6 million rows), VIF was computed on a stratified random sample after standardizing continuous predictors [
19].
Random Forest is an ensemble learning method that constructs multiple decision trees during training and outputs the mode of the classes (classification) of the individual trees [
41]. It is particularly useful in WSM due to its ability to handle large datasets with higher dimensionality and its robustness against overfitting [
19].
The prediction
for a sample in RF is given by:
where
is the prediction from the
i-th tree.
Support Vector Machine (SVM) is a supervised learning model that analyzes data for classification by finding the hyperplane that best separates the classes [
42]. SVM is advantageous in WSM for its effectiveness in high-dimensional spaces and its capability to handle non-linear boundaries through kernel functions [
42].
The decision function for SVM is given by:
where
w is the weight vector,
x is the input vector, and
b is the bias term.
Neural Networks are computing systems inspired by the biological NNs that constitute animal brains [
43]. They are capable of recognizing patterns and learning from complex and non-linear data, making them suitable for WSM [
43]. NNs consist of layers of interconnected nodes (neurons) that process the input data.
The output of a neuron in a NN is given by:
where
is the activation function,
are the weights,
are the input features, and
b is the bias term.
Extreme Gradient Boosting (XGBoost) is an advanced implementation of gradient boosting that is efficient and scalable [
41]. It combines the predictions of multiple weak learners (usually decision trees) to produce a strong learner. XGBoost is particularly effective in WSM due to its ability to handle missing data and overfitting through regularization [
42].
The prediction for XGBoost is given by:
where
is the
k-th tree in the ensemble, and
K is the total number of trees [
7].
To evaluate the performance of each machine learning model, we use three different metrics: AUC, F1 Score, and Cross-Validation.
Area Under the Curve (AUC) measures the ability of the model to distinguish between classes and is used as a summary of the Receiver Operating Characteristic (ROC) curve. It ranges from 0 to 1, with a higher value indicating better performance [
30].
The AUC is calculated as:
where
is the True Positive Rate and
is the False Positive Rate [
30].
F1 Score is the harmonic mean of precision and recall, providing a single metric to evaluate the balance between these two aspects. It ranges from 0 to 1, with a higher value indicating better performance [
26].
The F1 Score is given by:
Cross-Validation is a technique for assessing how the results of a statistical analysis generalize to an independent dataset. It involves partitioning the data into subsets, training the model on some subsets, and validating it on the remaining subsets [
44].
The general process of k-fold cross-validation is:
4. Results
The analysis of the multicollinearity for the variables used in this study is demonstrated in the VIF and tolerance values shown in
Table 3. The maximum VIF was 7.58, and the minimum tolerance was 0.11. These results indicate that multicollinearity was not a significant concern in the dataset, as none of the VIF values exceeded 10 and none of the tolerance values fell below the critical threshold of 0.1. Therefore, all the independent variables were retained for building the wildfire susceptibility model.
Furthermore, the correlation matrix, as shown in
Figure 9, reveals that the highest correlation was found between elevation and average temperature, with a correlation coefficient of 0.75.
However, no variables exhibited a Pearson correlation greater than 0.8, which would have necessitated the removal of certain factors. This confirms that the variables included in the model do not suffer from severe multicollinearity issues and can be used effectively for further analysis.
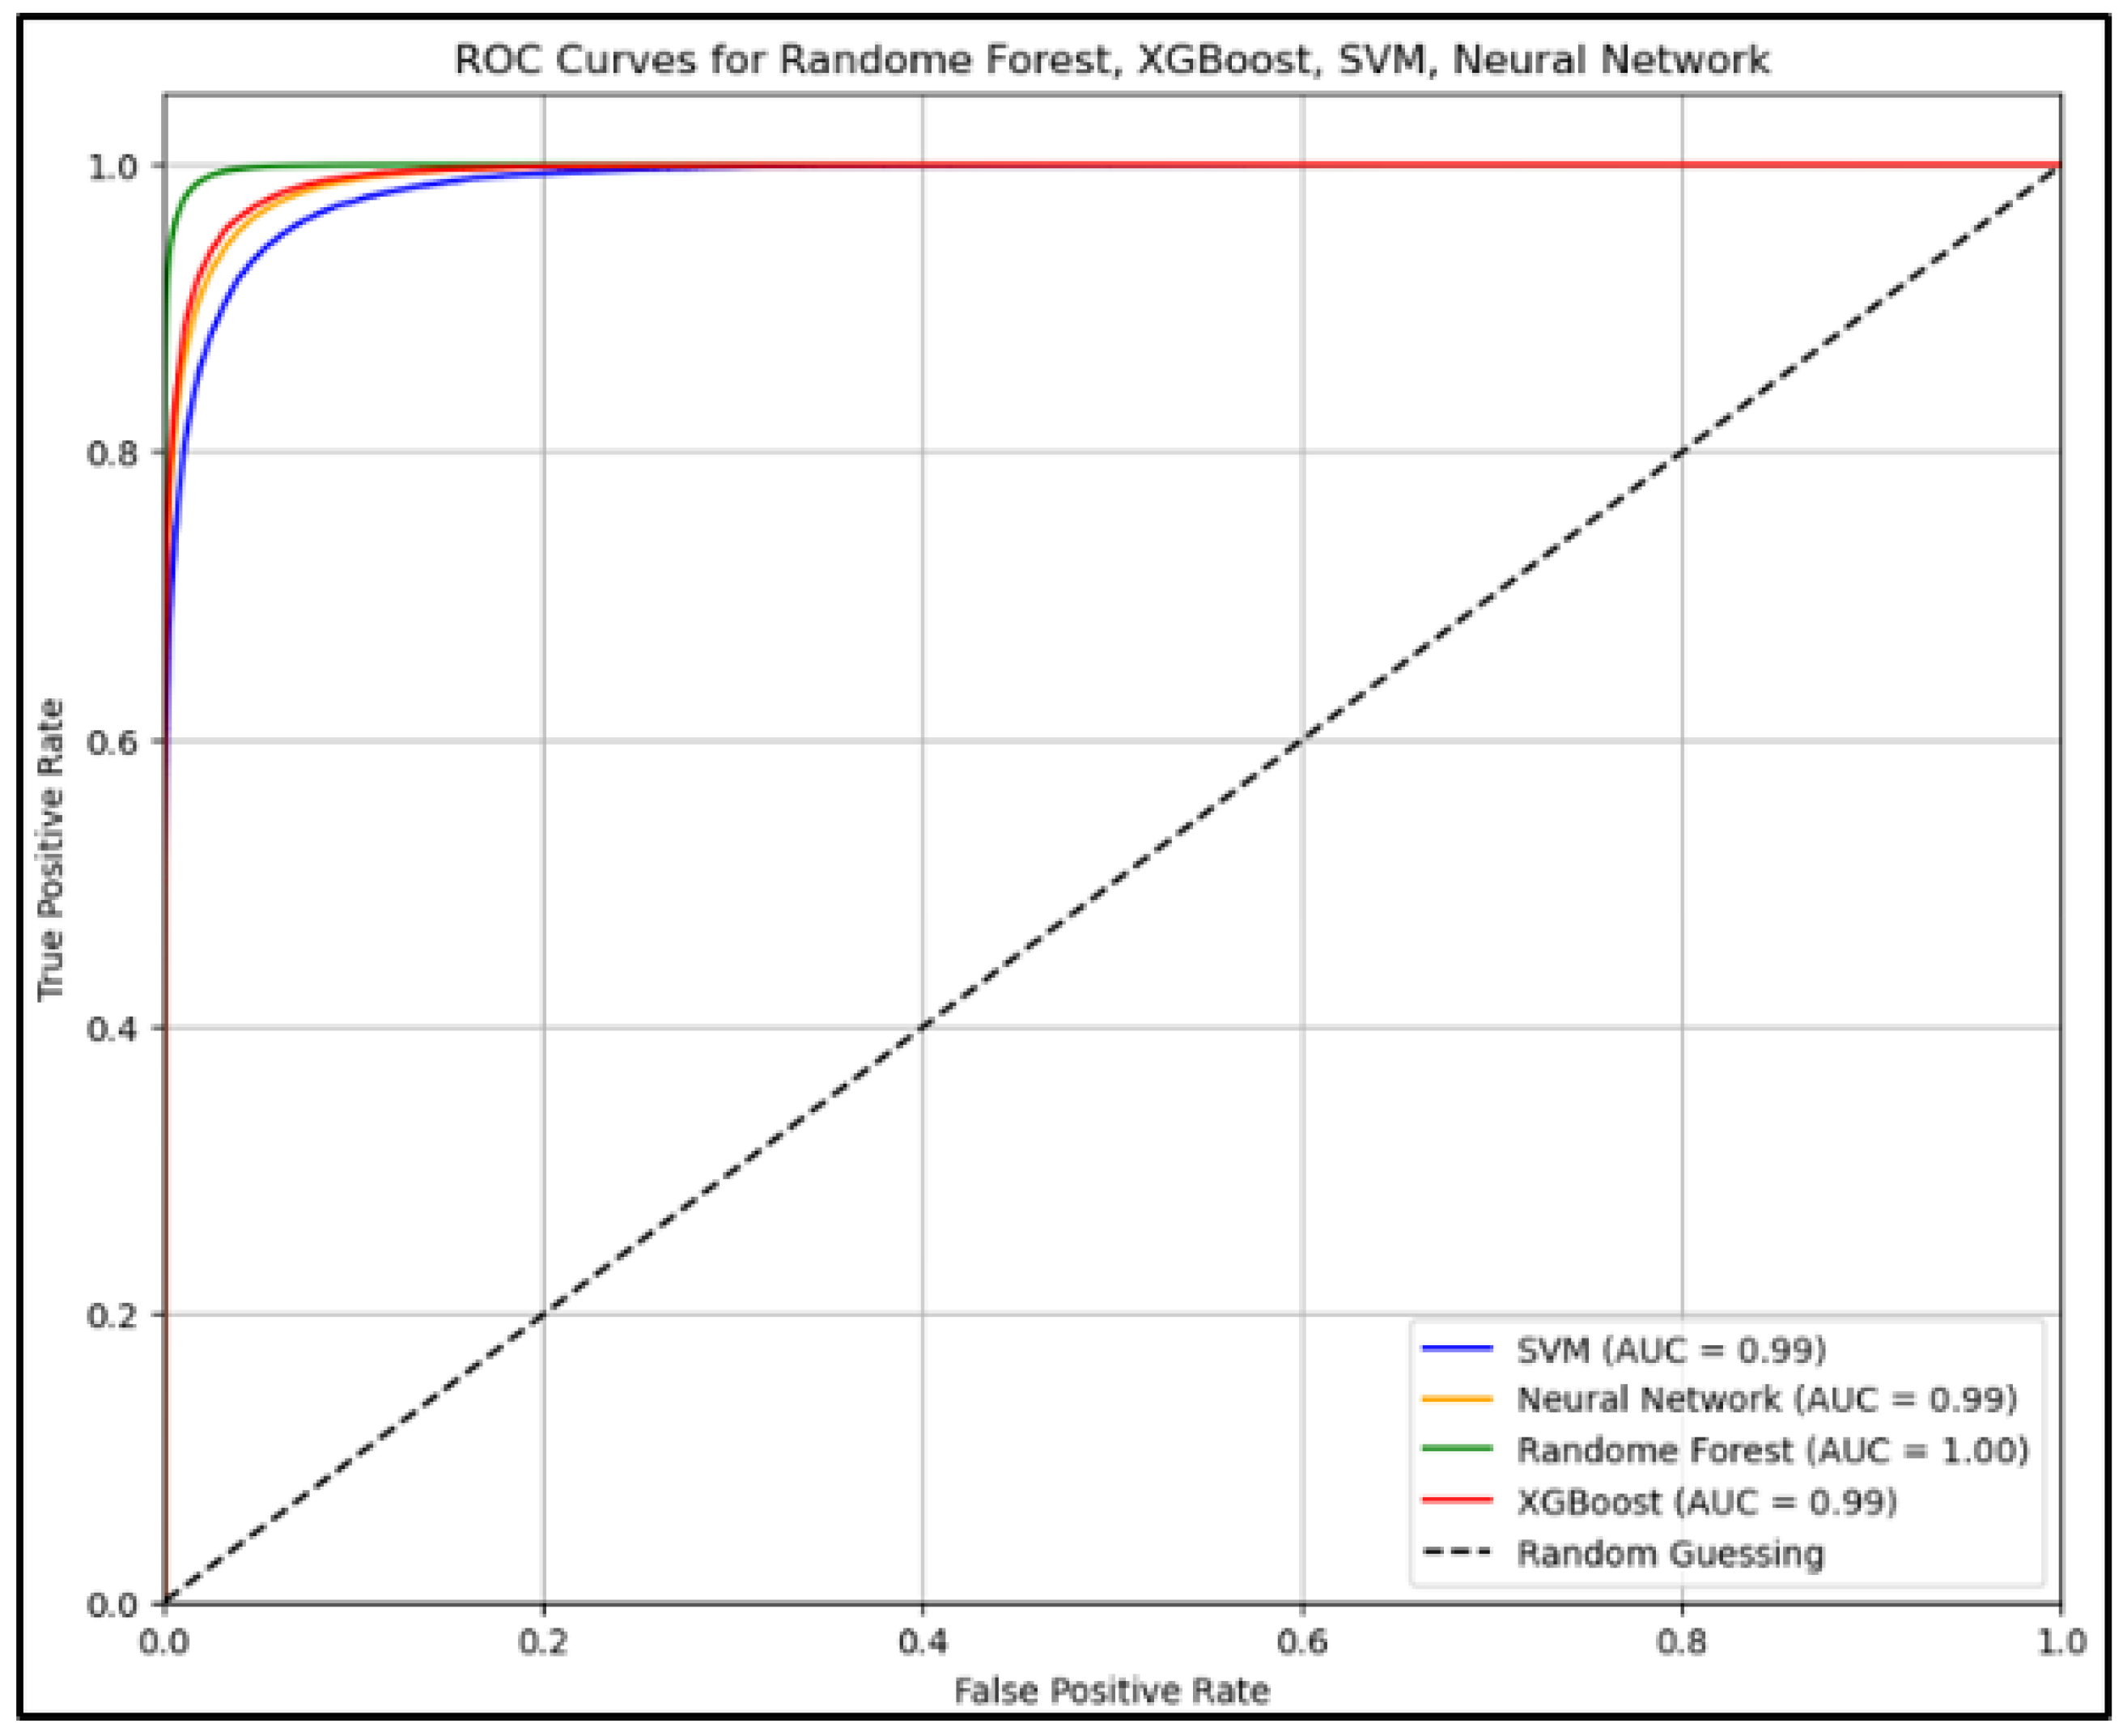
As shown in the ROC curves (
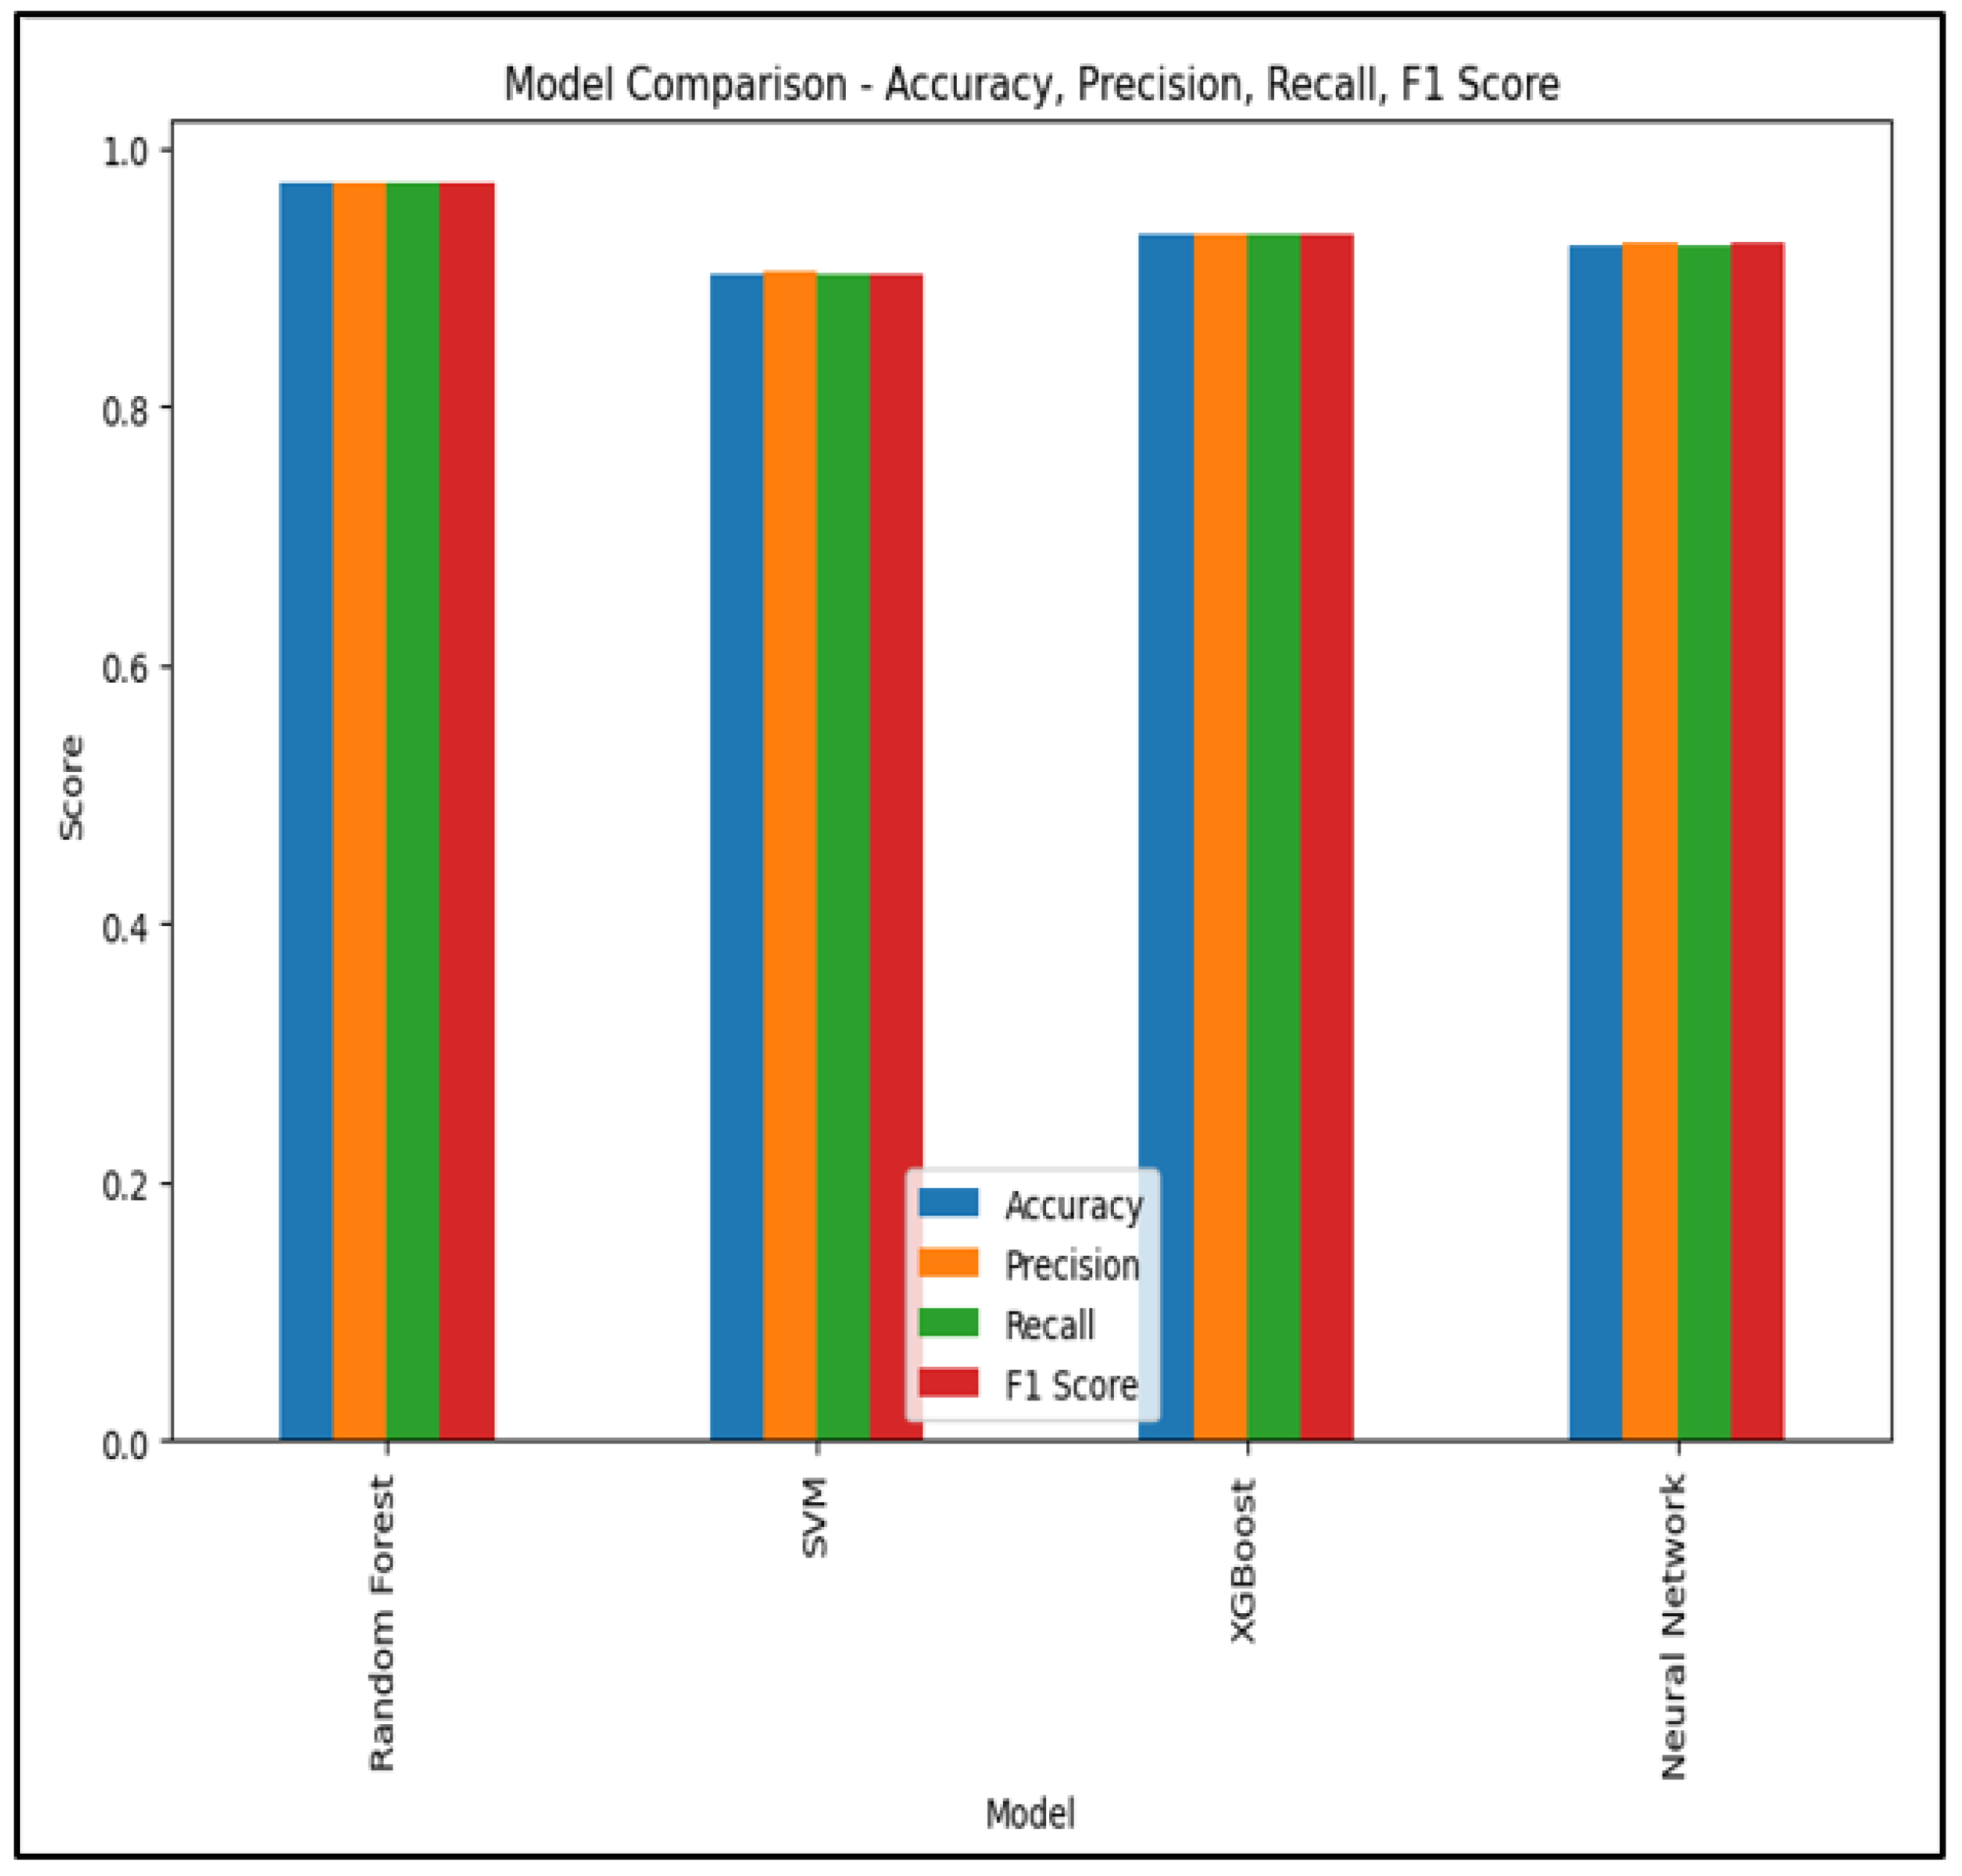
Figure 10) and summarized in the comparison Table, RF achieved the highest AUC of 0.99, indicating an exceptional ability to classify wildfire risk areas, followed closely by XGBoost and the NN with AUC values near 0.99. SVM, though slightly lower with an AUC of 0.94, still performed effectively. In terms of F1 Score, RF again demonstrated superior performance with an F1 Score of 0.98, while XGBoost and NN achieved 0.96 and 0.95, respectively, and SVM scored 0.94 (
Figure 11).
These results suggest that all four models are viable for WSM, with RF showing the greatest accuracy and reliability. The effective application of these models, supported by the feature selection and multicollinearity analysis, provides a solid basis for generating actionable wildfire risk maps. This analysis aids decision-makers in Jijel in identifying high-risk areas, thus supporting targeted prevention measures and optimized resource allocation.
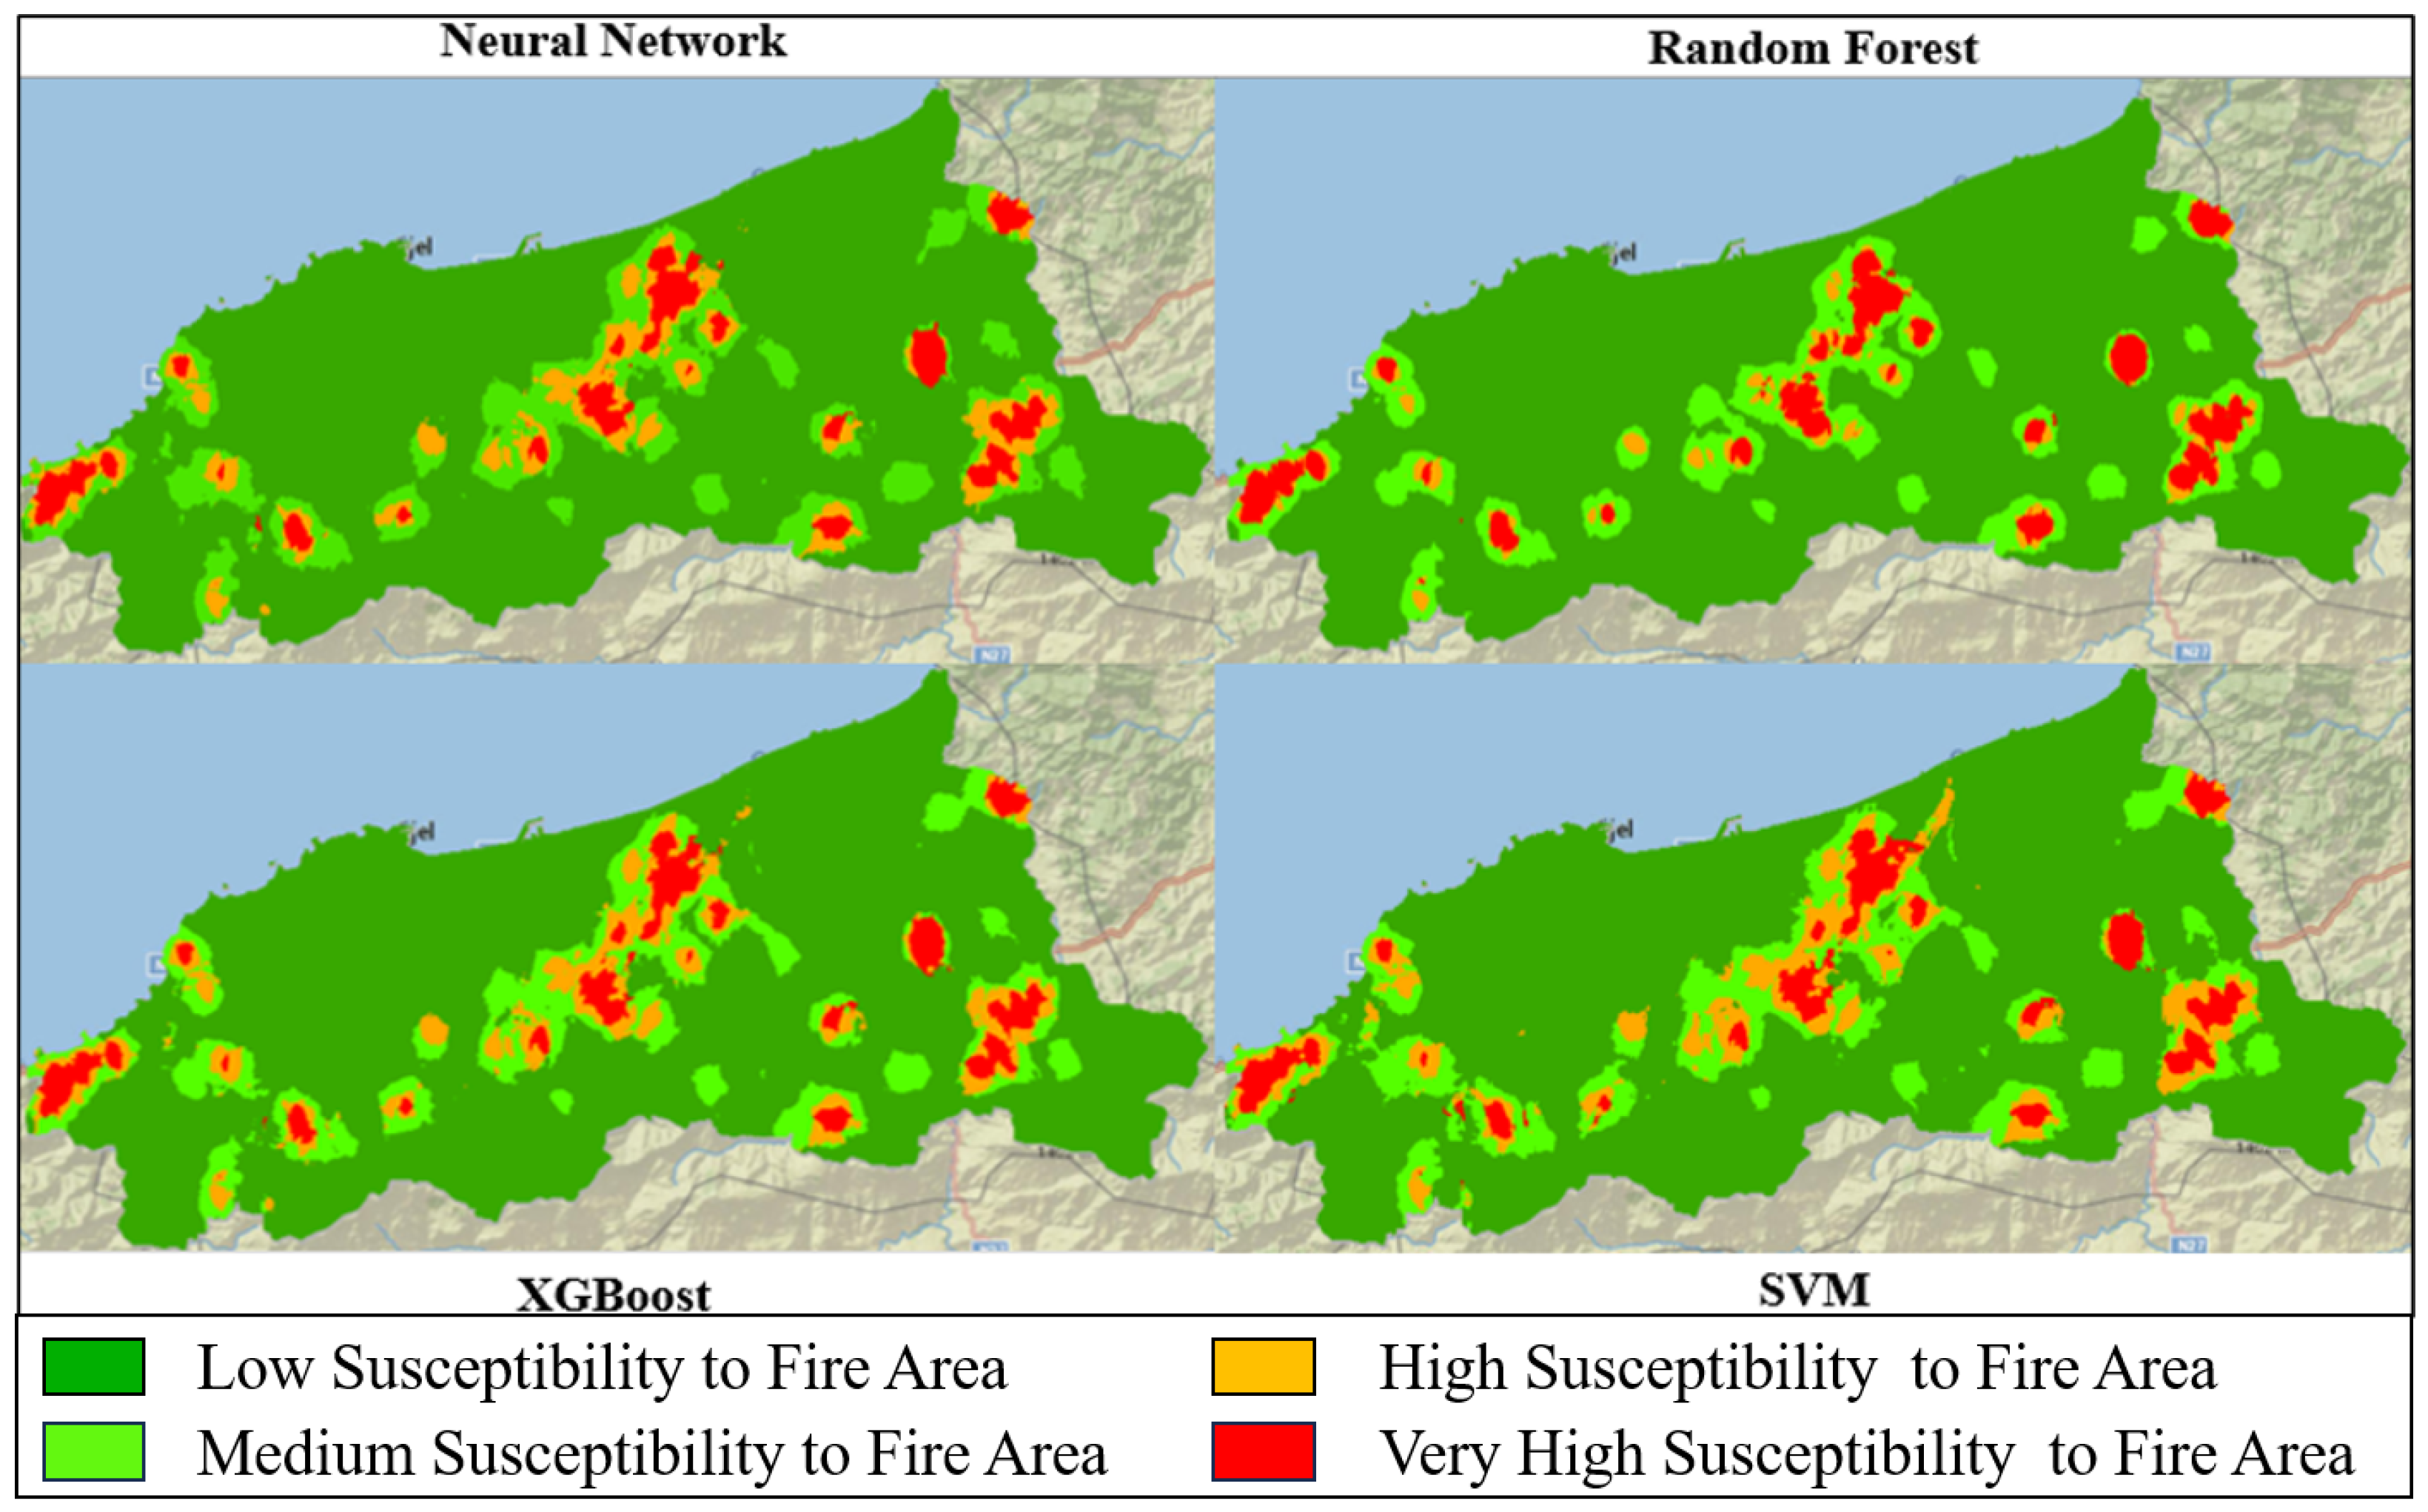
Building on the evaluation metrics and performance comparison of the models, we extended the analysis by applying the trained models to the entire dataset to classify all areas within the study region. The classification results were subsequently visualized using GIS tools, specifically ArcGIS, to generate susceptibility maps.
In these maps, the areas are color-coded based on the classification results, reflecting varying levels of wildfire risk, as shown in the
Figure 12. These visualizations are essential for interpreting the model outcomes in a spatial context, allowing for the identification of high-risk zones that demand immediate attention and targeted preventative measures.
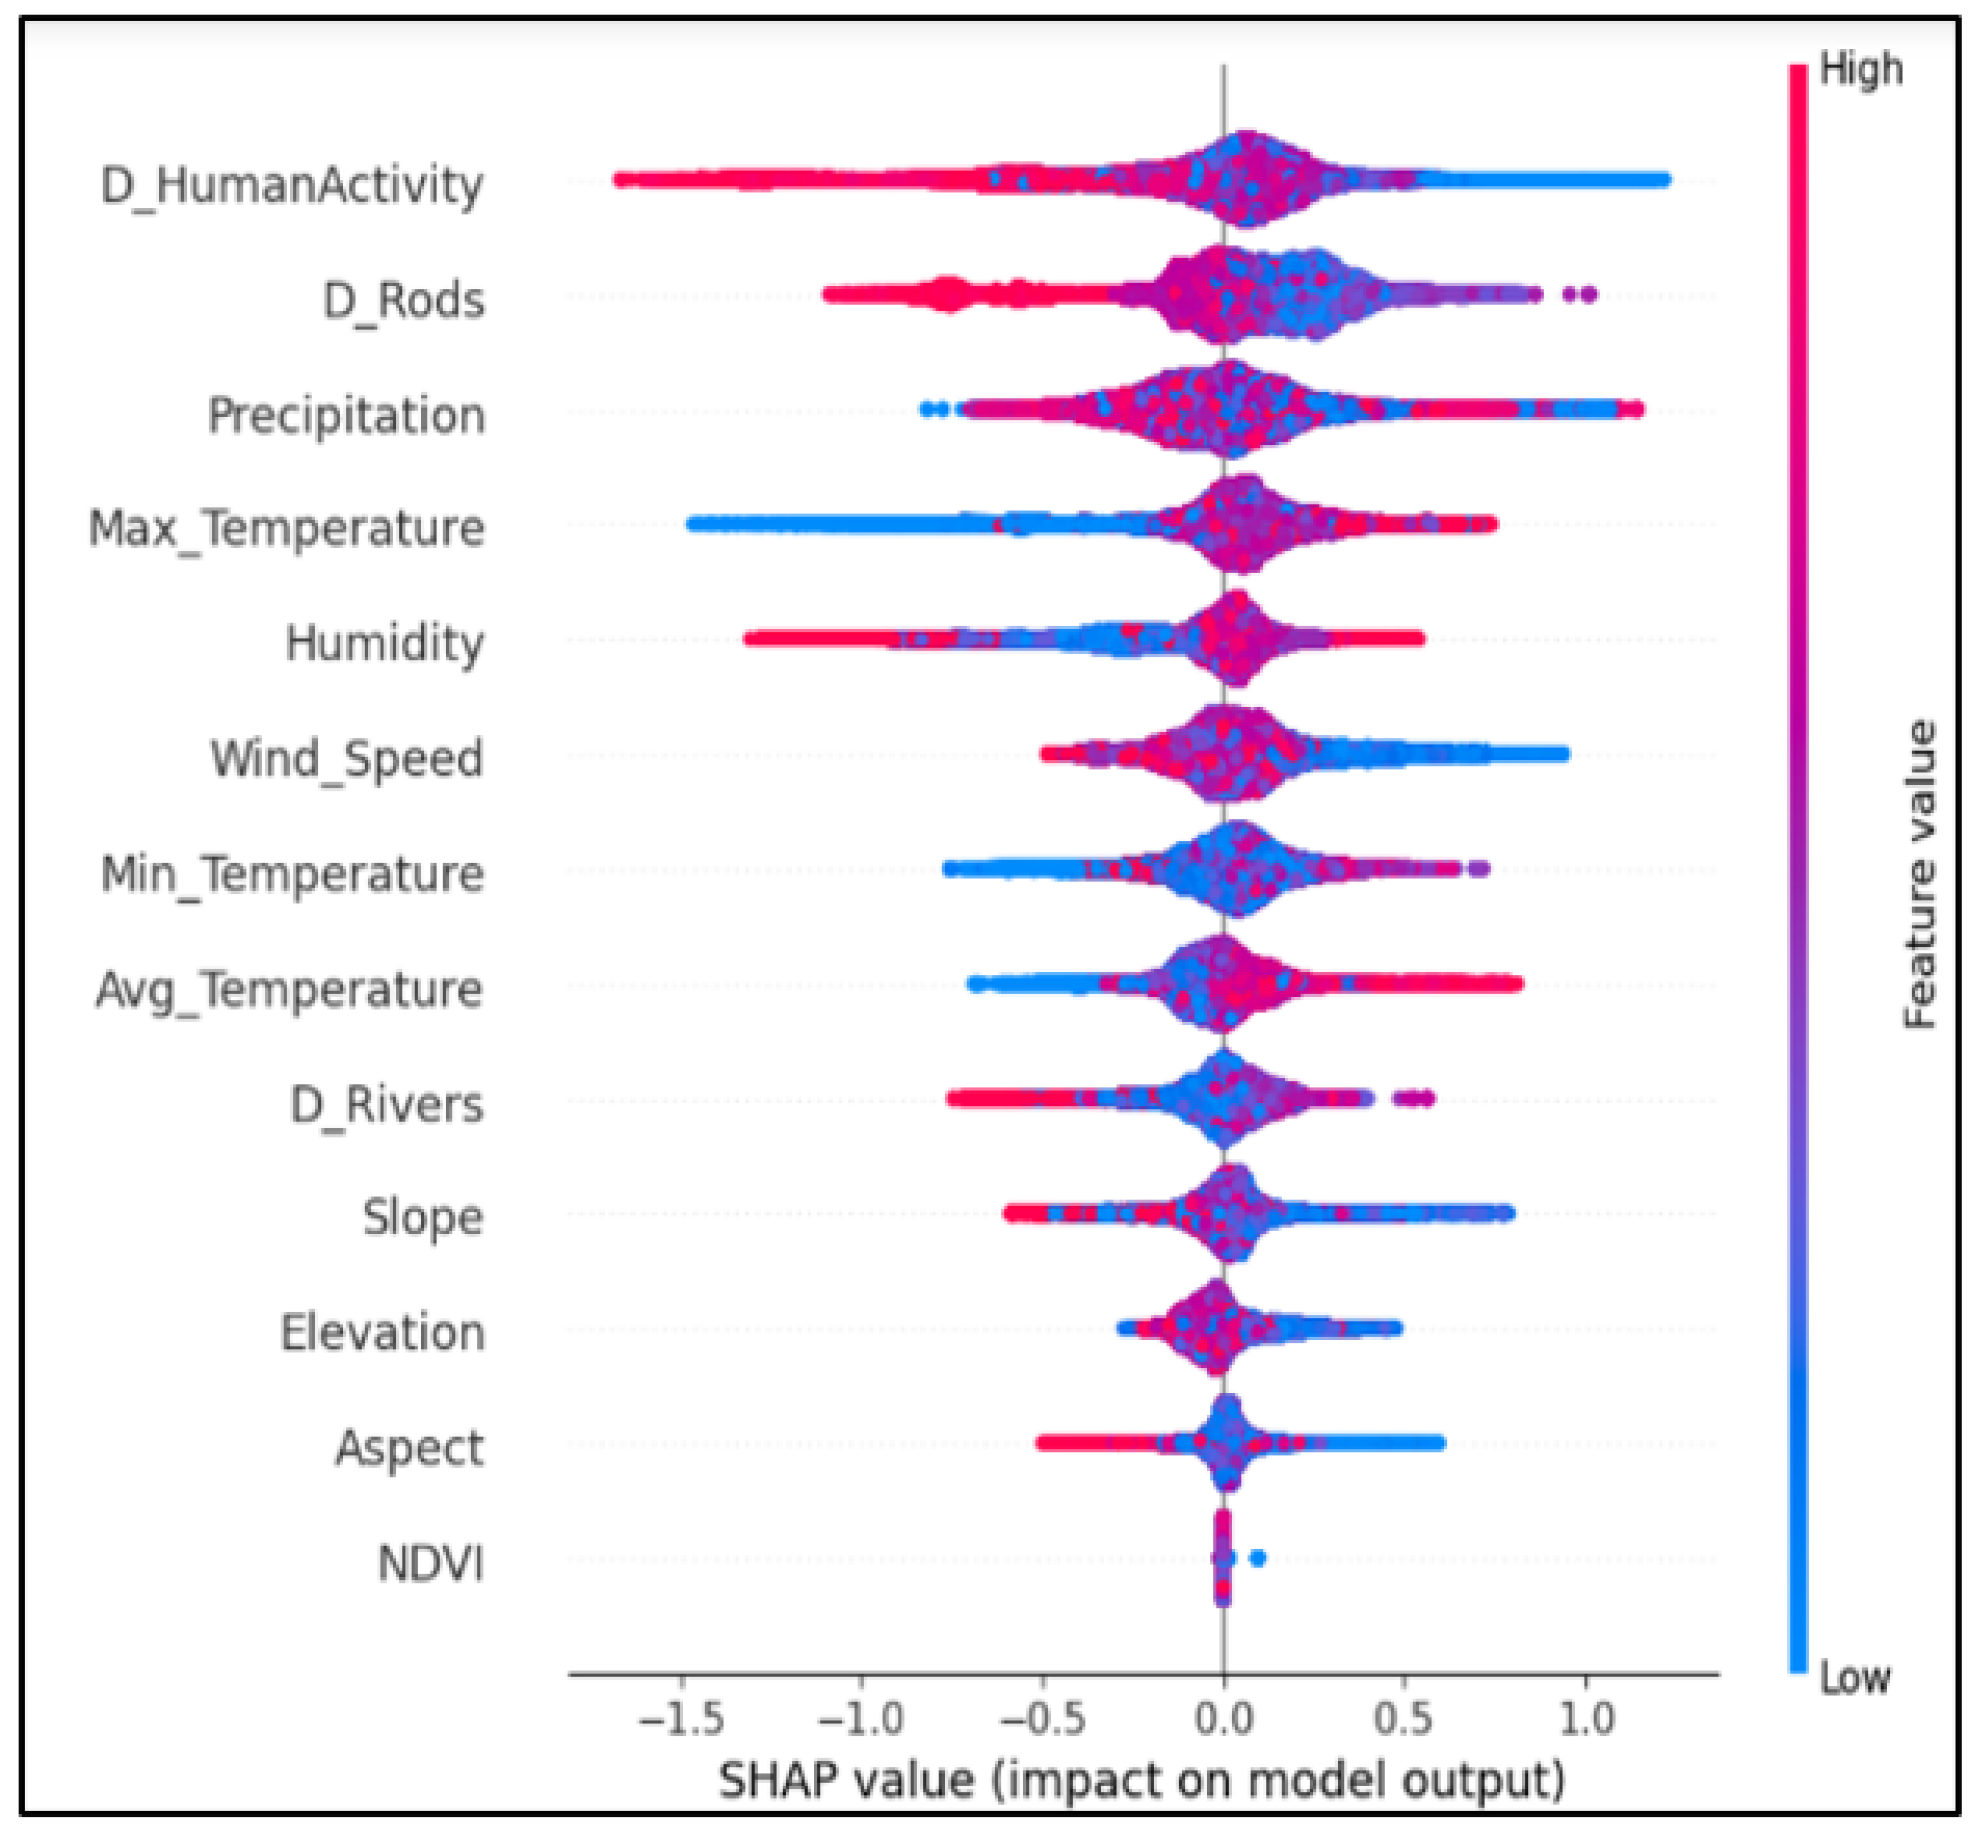
Additionally, to further analyze the contribution of individual variables, we employed a feature importance method using the SHAP (SHapley Additive exPlanations) framework on the XGBoost model. The SHAP summary plot demonstrates the relative importance of each feature in influencing the model’s predictions. From the results, it is evident that human activities have the most significant impact on wildfire susceptibility, followed by meteorological factors, such as temperature and precipitation, and finally, topographical features like slope and elevation. This highlights the critical role of anthropogenic and environmental factors in determining wildfire risk.
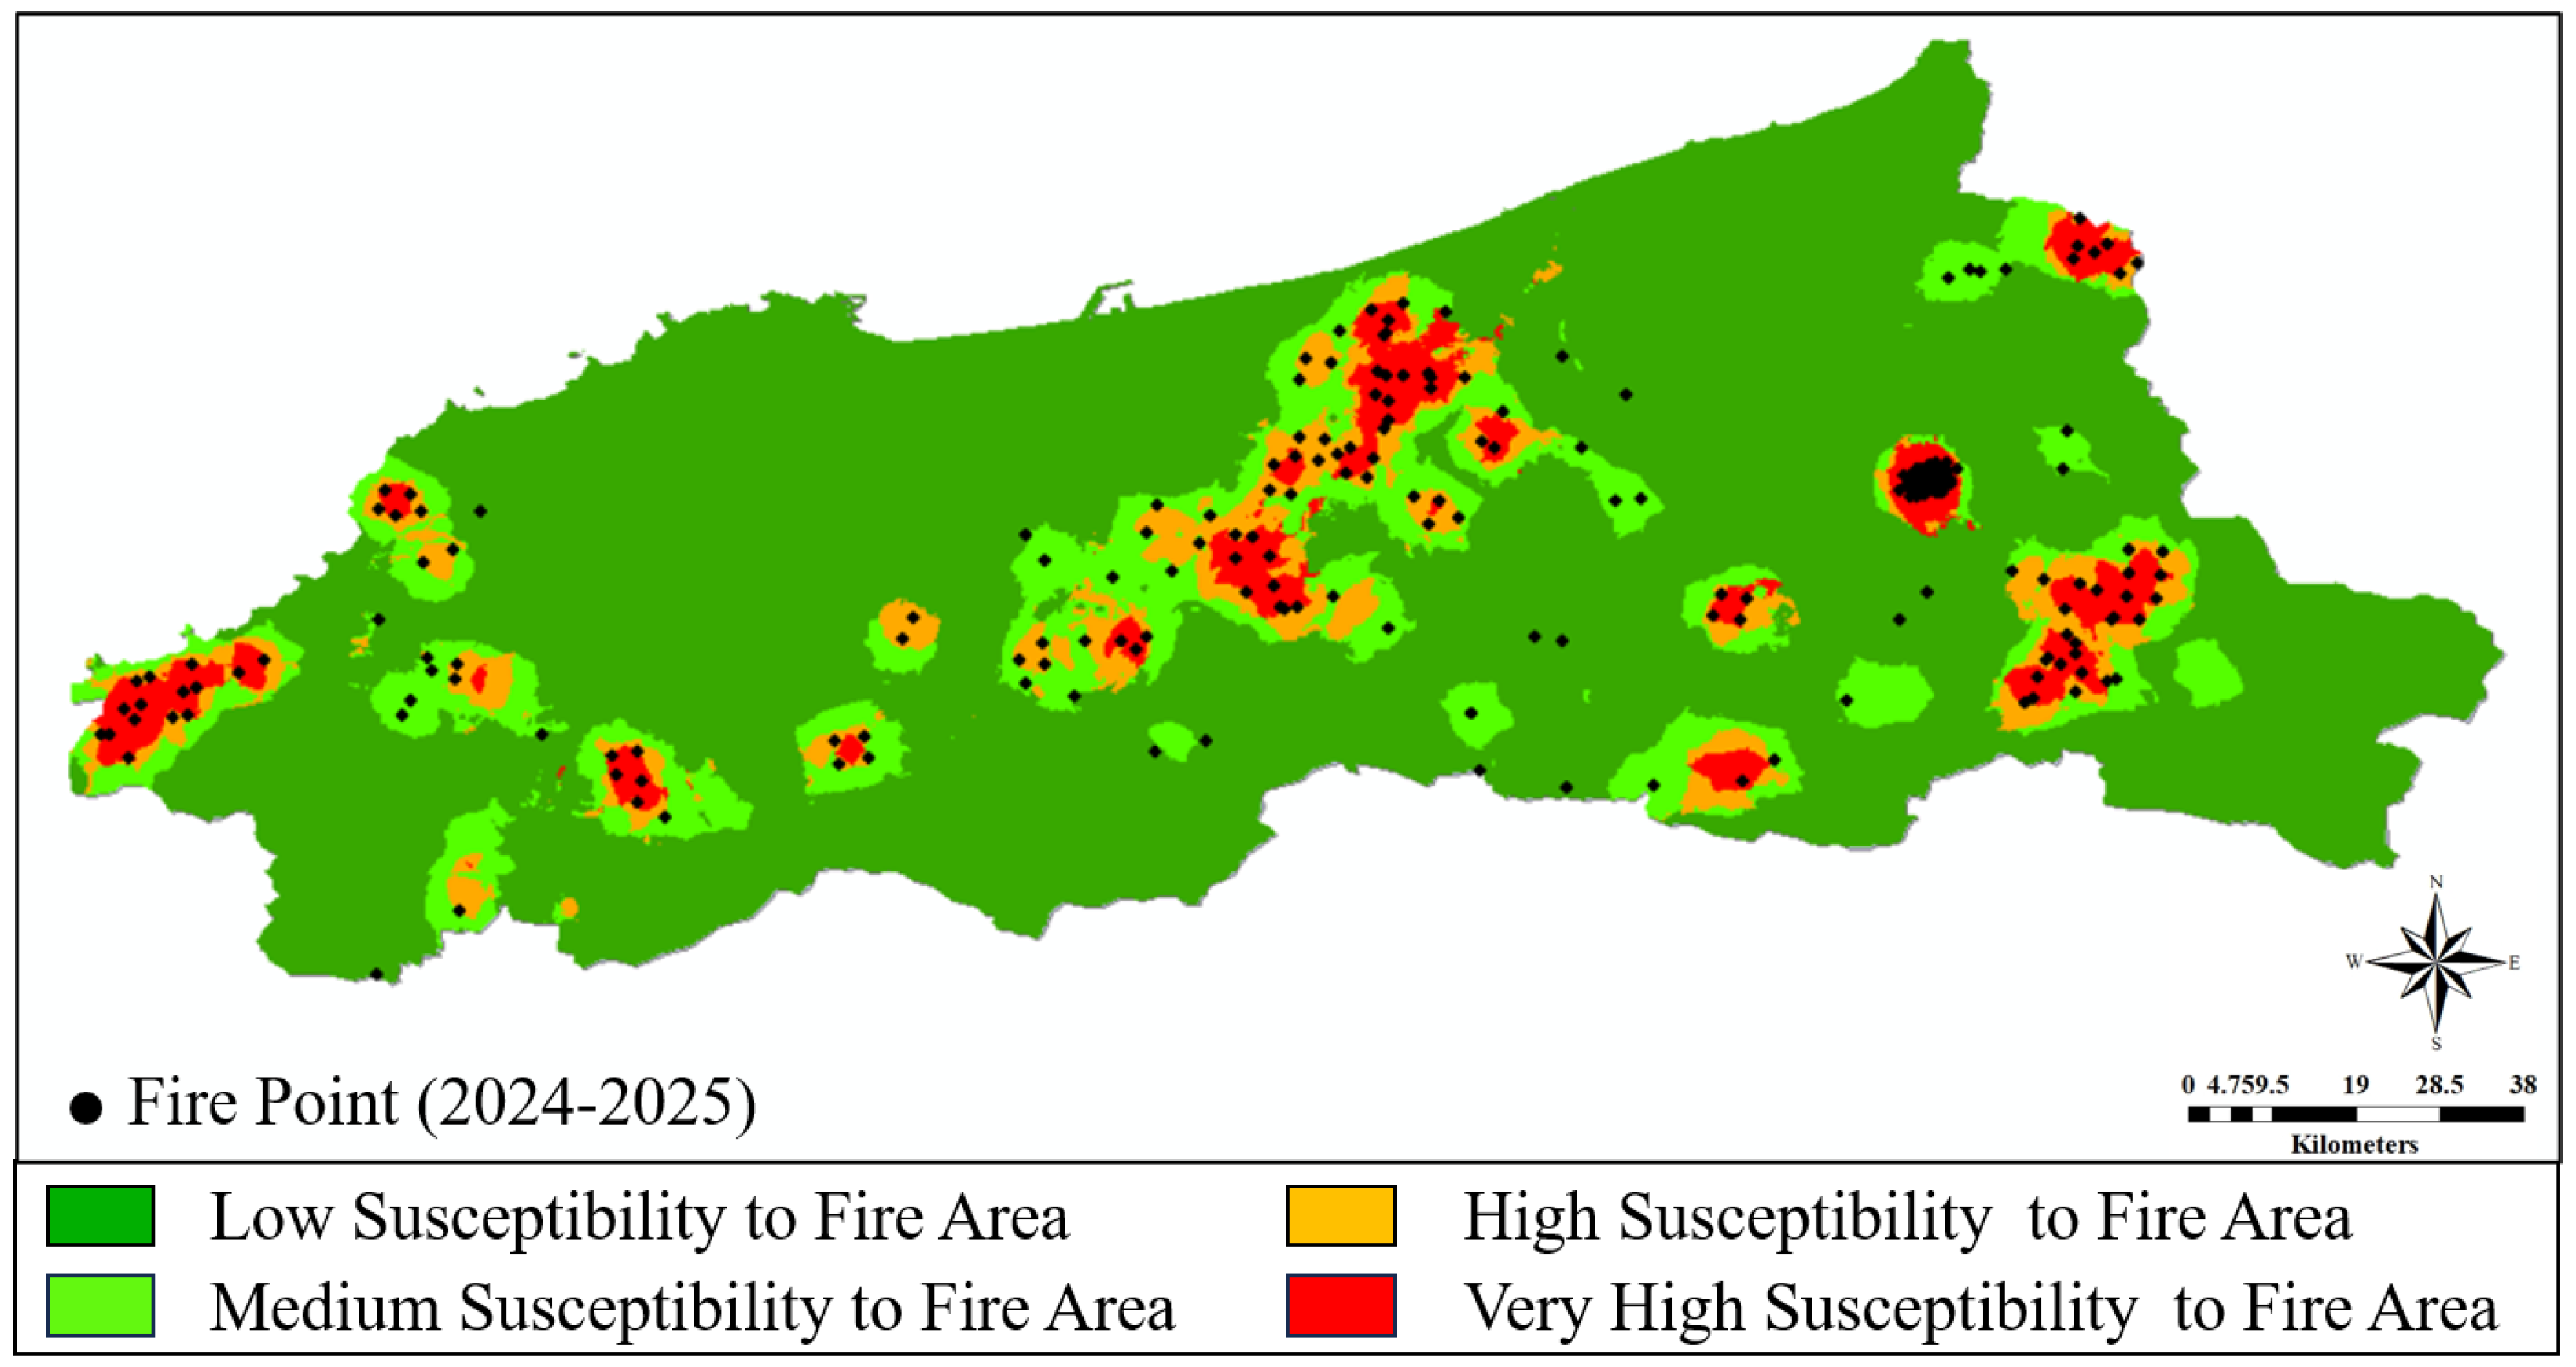
To further validate the model’s predictive capability, wildfire occurrences from 2024 and 2025 were overlaid on the generated susceptibility maps. The analysis revealed that 87.73% of these recent fire events were correctly classified within medium to very high susceptibility zones, confirming the model’s robustness and spatial generalization ability. Specifically, 45.32% of the fires occurred in areas categorized as very high susceptibility, 26.76% in high susceptibility, and 15.65% in medium susceptibility, while only 12.27% of the fires were located outside the predicted risk zones, as shown in
Figure 13.
5. Discussion
To assess wildfire susceptibility, we began by selecting 14 influential factors that impact wildfire occurrence in the study area, based on expert reports and previous studies. Each factor’s impact on wildfire occurrence was briefly justified to ensure validity. To confirm the selection, we applied Variance Inflation Factor (VIF) and correlation analysis methods, as illustrated in
Table 4 and the correlation matrix in
Figure 9. These analyses supported the relevance and independence of the selected factors.
Unlike past studies [
19,
29], which temporally supply their data to address seasonal variations, we focused exclusively on the summer season, as wildfires in the study area occur predominantly during this period. Moreover, while past studies relied solely on wildfire occurrence for data labeling, we employed a clustering method to eliminate more than 20,000 tuples classified in low-risk classes. This step minimized the impact of noisy data, enhancing the accuracy of the machine learning models,
Figure 8.
In the modeling phase, four machine learning models were applied to the dataset to assess wildfire susceptibility: RF, SVM, NN (NN), and XGBoost. To evaluate the performance of these models, various metrics were used, including accuracy, F1 score and cross-validation. The results showed that RF achieved the highest accuracy at 0.99, followed by XGBoost at 0.96, with SVM and NN both reaching 0.93 as mentioned in the table. These models were then applied to the dataset to classify the wildfire susceptibility across the study area.
Subsequently, the four resulting classifications were visualized using GIS tools to generate susceptibility maps,
Figure 13. These maps provided a clear representation of the areas with varying levels of wildfire risk. After consulting with experts in firefighting and land-use planning authorities, the XGBoost model was selected as the preferred method for generating the final wildfire susceptibility map. This decision was based on the principle of safety, as the XGBoost map identified the largest area of risk compared to the other models, making it the most suitable for guiding resource allocation and strategic planning for wildfire prevention and intervention.
The spatial validation of the proposed wildfire susceptibility model demonstrated a strong predictive capability, with 87.73% of the wildfire occurrences from 2024 and 2025 correctly falling within medium to very high susceptibility zones. This high correspondence between predicted high-risk areas and actual fire events confirms the model’s robustness and spatial generalization potential.
Such performance indicates that the model can reliably anticipate future ignition patterns, offering a practical decision-support tool for local authorities and firefighters. By identifying and mapping the most fire-prone zones, this model can effectively guide the allocation of firefighting resources, planning of prevention campaigns, and prioritization of high-risk areas, ultimately improving wildfire preparedness and mitigation strategies across the Jijel province and similar Mediterranean environments.
Only a limited number of previous studies have integrated real and independent fire occurrences for post-model validation, highlighting the originality and strength of this work. For instance, Study [
26] performed a qualitative validation by visually comparing fire locations with susceptibility zones but without providing quantitative accuracy measures, while Study [
15] conducted a similar analysis and achieved 76% of correctly classified fire events. In contrast, the proposed framework achieved a substantially higher validation accuracy (87.73%), demonstrating its enhanced capability to capture spatial and temporal fire dynamics. This improvement can be attributed to the integration of a large number of environmental and anthropogenic predictors, a refined data preprocessing workflow, and the use of advanced machine learning techniques supported by explainable AI tools. The consistent performance of the model, both in traditional evaluation metrics and real-world validation, confirms its potential for operational implementation in wildfire risk assessment and management systems.
As context, prior work [
30] reported >0.93 AUC on similar WSM tasks, showing that high internal scores are now common [
45]. Time forward validation on unseen 2024–2025 events captures 87.73% of fires within Medium–Very-High zones, evidencing real out-of-sample skill. Susceptibility maps from RF, XGBoost, NN, and SVM show strong cross-model agreement, with differences limited to a few boundary cells between adjacent classes. Spatial patterns are physically coherent (e.g., agriculture–forest interfaces, proximity to settlements/roads), and SHAP rankings (human activity proxies, hydro-meteorological variables, topography) match regional ignition mechanisms. Performance is consistent across metrics (AUC, F1) and models, indicating that the high internal AUC reflects true signal rather than overfitting.
For interpretability, two critical points were addressed. First, SHAP analysis (
Figure 14) revealed that human activities had the most significant impact on wildfire susceptibility, followed by precipitation, maximum temperature, and humidity. These results are in contrast with previous studies, such as [
21], which identified wind speed and land use as the most impactful factors in their respective regions. This variability underscores the area-specific nature of wildfire influencing factors.
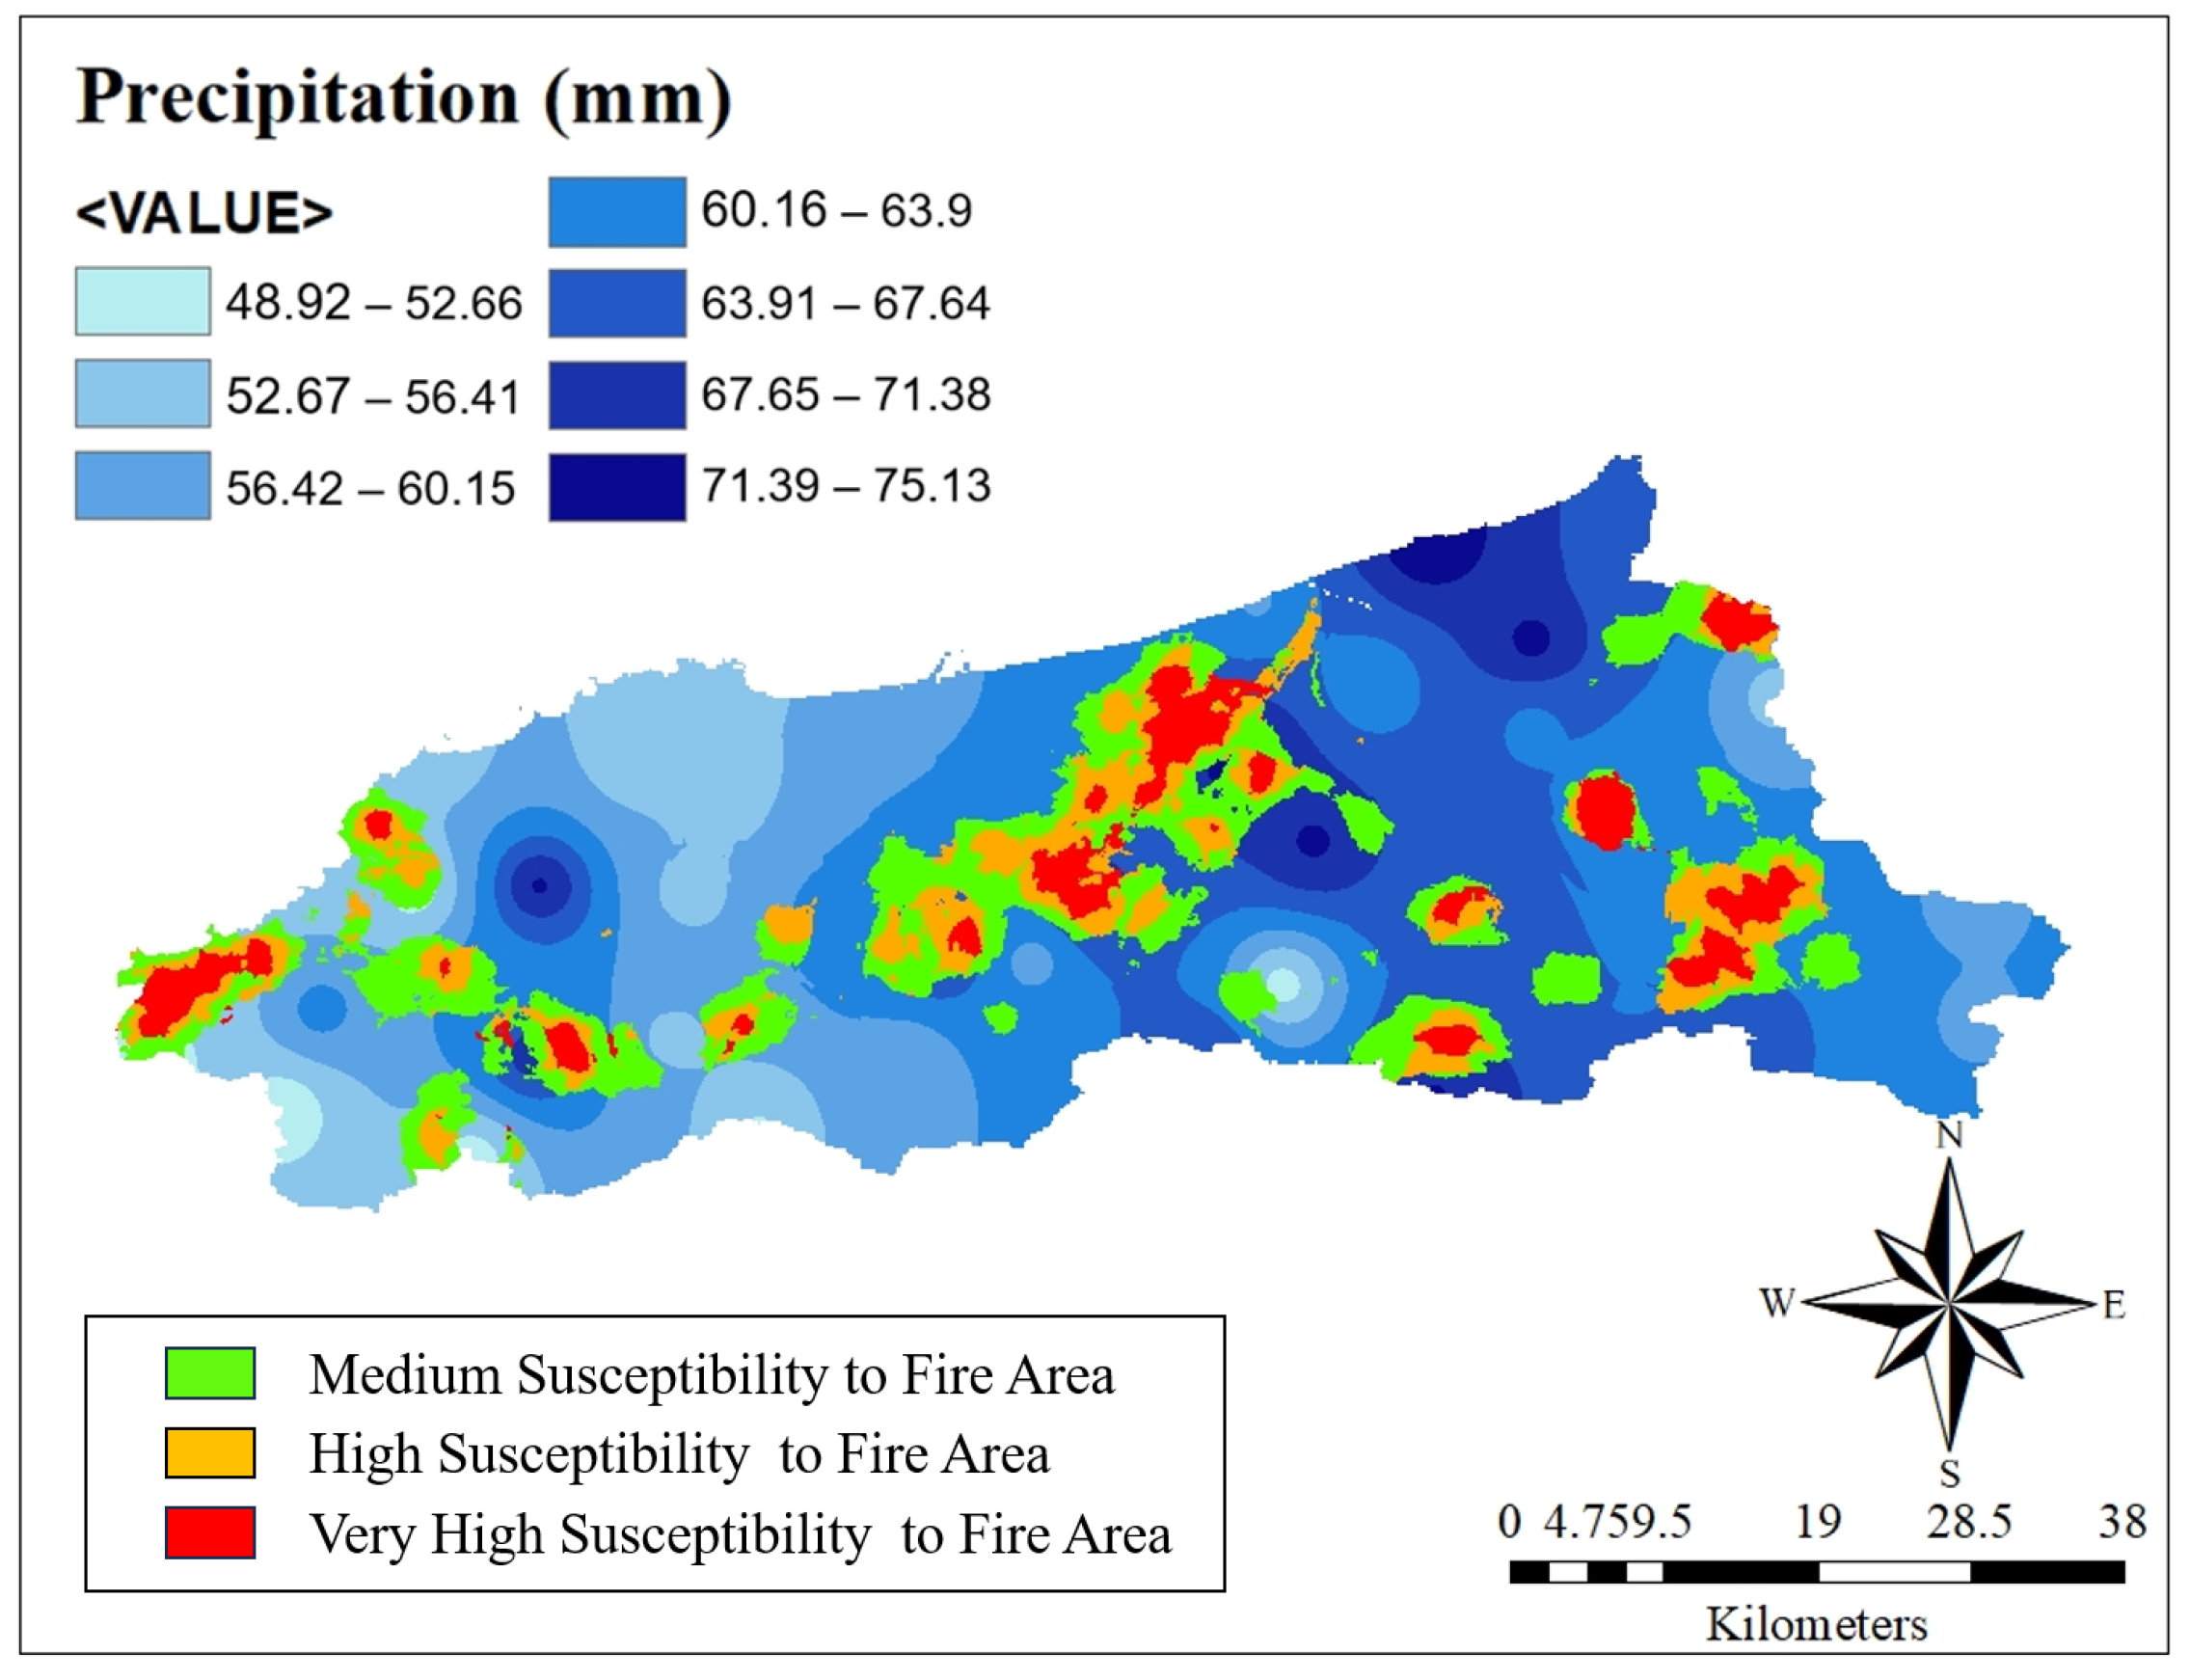
Second, to enhance understanding, we provided supplementary maps showing how changes in factors influence wildfire susceptibility across different areas
Figure 15. For example, when examining human activity zones alongside wildfire susceptibility maps, it was evident that high-risk areas were located in transitional zones—such as agricultural lands near forests—where human activity ignites wildfires, and vegetation serves as fuel,
Figure 16. This insight highlights the need for targeted prevention strategies in these specific zones.
Compared with recent studies from Mediterranean and North African settings using tree ensembles or hybrid ML, our models achieve comparable or higher discrimination while preserving interpretability via SHAP. More importantly, the ordering of influential factors differs from several Mediterranean reports that emphasize wind regime and land use: in Jijel, human-activity proxies (proximity to roads/settlements) and hydro-meteorological variables (precipitation, temperature, humidity) emerge as primary drivers, with topography secondary. This divergence likely reflects the local ignition context—dense wildland–agriculture interfaces and limited moisture during heat episodes—underscoring that factor–fire relationships are region-specific and that WSM models benefit from locally recorded inputs rather than relying solely on global proxies.
Harmonizing to 30 m may smooth fine-scale features; sparse meteorological stations can blur local gradients; ignition labels and satellite detections carry positional/reporting errors; and spatial autocorrelation may inflate skill. We mitigated these via stratified splits and an independent time-forward validation, but denser met data, multi-temporal predictors, and spatially blocked CV are priorities for future work.
6. Conclusions
In this study, we developed a robust wildfire susceptibility mapping (WSM) framework by integrating Geographic Information Systems (GIS) and machine learning (ML) methods. By leveraging diverse environmental and human activity factors within a high-resolution dataset, GIS facilitated spatial coherence and visualization, while ML techniques identified the most effective approach for WSM. Our methodology, combining clustering methods, ML models, and interpretability techniques, produced not only wildfire susceptibility maps but also actionable insights into key contributing factors. These findings provide essential tools for wildfire prevention, resource allocation, and land-use planning, helping authorities implement effective mitigation strategies.
Local authorities can operationalize these maps by pre-positioning crews along high-risk agriculture–forest interfaces, prioritizing fuel treatments near settlements and roads, routing patrols through very-high zones during heatwaves, and screening proposed developments against susceptibility layers. Looking ahead, we will integrate near-real-time meteorological feeds and active-fire detections, and incorporate multi-temporal learning (e.g., transformer-based models) to update risk dynamically across seasons. Future work will also leverage high-resolution streams—satellite imagery, IoT sensor networks, and drone-collected data—and focus on adapting the model to diverse climatic regions to strengthen generalizability and operational impact.
