1. Introduction
Acute ischemic stroke (AIS) remains a major cause of mortality and long-term disability worldwide, and patient outcomes are critically dependent on the speed and accuracy of diagnosis [
1,
2]. Rapid identification of large vessel occlusion (LVO), critical stenosis, and perfusion deficits is essential for guiding timely thrombectomy or thrombolysis decisions. In this context, every minute of diagnostic delay corresponds to an estimated 1.9 million neurons lost [
1], underscoring the importance of fast and reliable imaging. Beyond structural biomarkers, recent optical neuroimaging studies have also highlighted functional brain network alterations after stroke [
3,
4].
Magnetic resonance angiography (MRA) provides high-resolution, radiation-free visualization of the intracranial vasculature [
5], but its acquisition time and motion sensitivity limit its use in hyper-acute settings [
6]. Positron emission tomography (PET) complements MR by quantifying perfusion and metabolism, and simultaneous MR–PET scanners can offer structural and functional information in a single session [
7,
8]. However, both modalities suffer from trade-offs between acquisition speed, spatial resolution, and noise robustness. These limitations often result in either incomplete vascular coverage or inadequate signal-to-noise ratio (SNR), reducing diagnostic confidence in emergency stroke care.
Recent developments in image reconstruction have aimed to overcome these trade-offs. Compressed sensing (CS) techniques exploit sparsity in transform domains such as wavelets or total variation (TV) [
9,
10], while low-rank models based on block-Hankel matrix structures (e.g., ALOHA) preserve local spatial correlations and fine vascular details [
11,
12]. More recently, deep learning approaches have achieved further gains by learning data-driven priors from large datasets. In vascular imaging, super-resolution and denoising networks have demonstrated effectiveness in recovering small vessel signals [
13,
14], and convolutional neural networks and generative adversarial networks (GANs) have shown strong performance in artifact removal and super-resolution [
15,
16,
17]. Nevertheless, purely data-driven models may produce hallucinated details or lose subtle vascular features when used in isolation from physics-based constraints.
Joint MR–PET reconstruction represents a promising direction by exploiting cross-modal correlations. Prior methods based on joint total variation (jTV) or joint sparsity regularization have shown improvements over independent reconstructions [
18,
19,
20], and recent multimodal neural fusion strategies have further enhanced cross-modality guidance [
21]. However, these approaches often smooth vessel boundaries and do not explicitly preserve vascular topology—an essential property for accurate occlusion and collateral flow assessment in stroke imaging.
Preserving vascular continuity, particularly across stenotic or distal branches, is clinically critical to avoid false occlusion detections and to enable reliable evaluation of collateral networks. Although vesselness filters and centerline extraction techniques have long been applied as post-processing tools [
22,
23], their integration into the reconstruction process remains limited. Meanwhile, recent topology-aware learning strategies in neurovascular modeling emphasize the importance of maintaining anatomically connected vessel trees [
24].
To address these challenges, a vascular-topology–aware joint MR–PET reconstruction framework tailored for acute stroke imaging is introduced. The proposed method integrates physics-based consistency, learned sparsity, and cross-modal feature fusion within a unified deep learning architecture. A WGAN-GP backbone with topology-preserving and vesselness-guided losses is employed to maintain vascular integrity while achieving high acceleration factors. Motion correction and modality-specific denoising are incorporated within the same pipeline, and a multitask diagnostic head enables simultaneous prediction of LVO probability, collateral status, and perfusion deficits.
It is hypothesized that embedding vascular topology priors within a physics-informed, joint MR–PET reconstruction can enhance both conventional image quality metrics and clinically relevant outcomes—such as LVO detection accuracy—while reducing acquisition time. The remainder of this paper is organized as follows:
Section 2 reviews related work;
Section 3 details the proposed reconstruction framework;
Section 4 describes the experimental setup;
Section 6 presents quantitative and qualitative results; and
Section 7 discusses the implications, limitations, and future directions of this study.
2. Related Work
Producing high-fidelity vascular images under time-constrained, motion-prone conditions remains a major challenge in acute neurovascular imaging. In emergency stroke workflows, rapid acquisition must be balanced against the need for diagnostic precision, as time-to-diagnosis directly influences eligibility for reperfusion therapies and strongly impacts neurological outcomes [
1]. Motion, patient instability, and strict time limits frequently degrade image quality or constrain protocol design for both MRA and PET [
6,
18].
2.1. Accelerated MR Angiography
TOF-MRA provides noninvasive visualization of the cerebral vasculature by leveraging inflow effects [
25,
26], but high-resolution 3D imaging requires extensive k-space sampling [
27,
28,
29] and is vulnerable to motion. The measured k-space signal for a voxel at position
r in a typical 3D TOF sequence can be expressed as
where
is proton density,
is the effective transverse relaxation, and
models inflow enhancement [
30]. Fully sampled 3D Cartesian acquisitions scale quadratically with resolution:
resulting in long acquisition times that are impractical for hyper-acute stroke care [
31,
32]. Parallel imaging (SENSE/GRAPPA) and compressed sensing (CS) have reduced scan duration [
10], while structured low-rank methods such as ALOHA have demonstrated improved vessel preservation through Hankel matrix regularization [
11,
12]. More recently, deep learning–based super-resolution and denoising methods have shown strong potential in enhancing small-vessel depiction [
13,
14], and deep MRA de-aliasing continues to improve sharpness [
33], though hallucination risks remain when anatomy is not tightly constrained by physics.
2.2. PET Image Reconstruction and Denoising
PET reconstruction faces a different limitation: the stochastic nature of Poisson photon counts. The OSEM algorithm [
34] remains widely used, maximizing the Poisson log-likelihood
with updates of the form
but long scans or high activity are often required for acceptable SNR [
35]. MRI-guided PET priors (e.g., Bowsher, joint TV, or patch-based denoising) [
19,
36,
37] have improved PET resolution, yet can introduce bias when anatomical and functional patterns diverge.
2.3. Joint MR–PET Reconstruction and Recent Advances (2023–2025)
Joint reconstruction has leveraged cross-modal priors, including joint sparsity and joint total variation [
18,
20,
38]. More recently, transformer-based multimodal approaches have been explored for PET–MR and accelerated MRI reconstruction, enabling long-range dependency modeling and improved fusion [
39,
40]. In parallel, physics-informed deep reconstruction methods have emphasized strict data-consistency to reduce hallucinated features in accelerated settings [
41,
42]. Neural fusion strategies for synergistic PET–MR have also emerged in early-access work [
21], underscoring the growing interest in cross-modal information sharing [
43,
44,
45,
46,
47,
48]. These trends highlight two dominant directions in current research: (1) transformer cross-attention as a powerful multimodal feature extractor, and (2) physics-guided networks that safeguard clinical reliability. The proposed vascular-aware framework aligns with these developments, while being distinguished by explicit preservation of cerebrovascular topology for stroke applications.
2.4. Integration into a Vascular-Aware Multimodal Framework
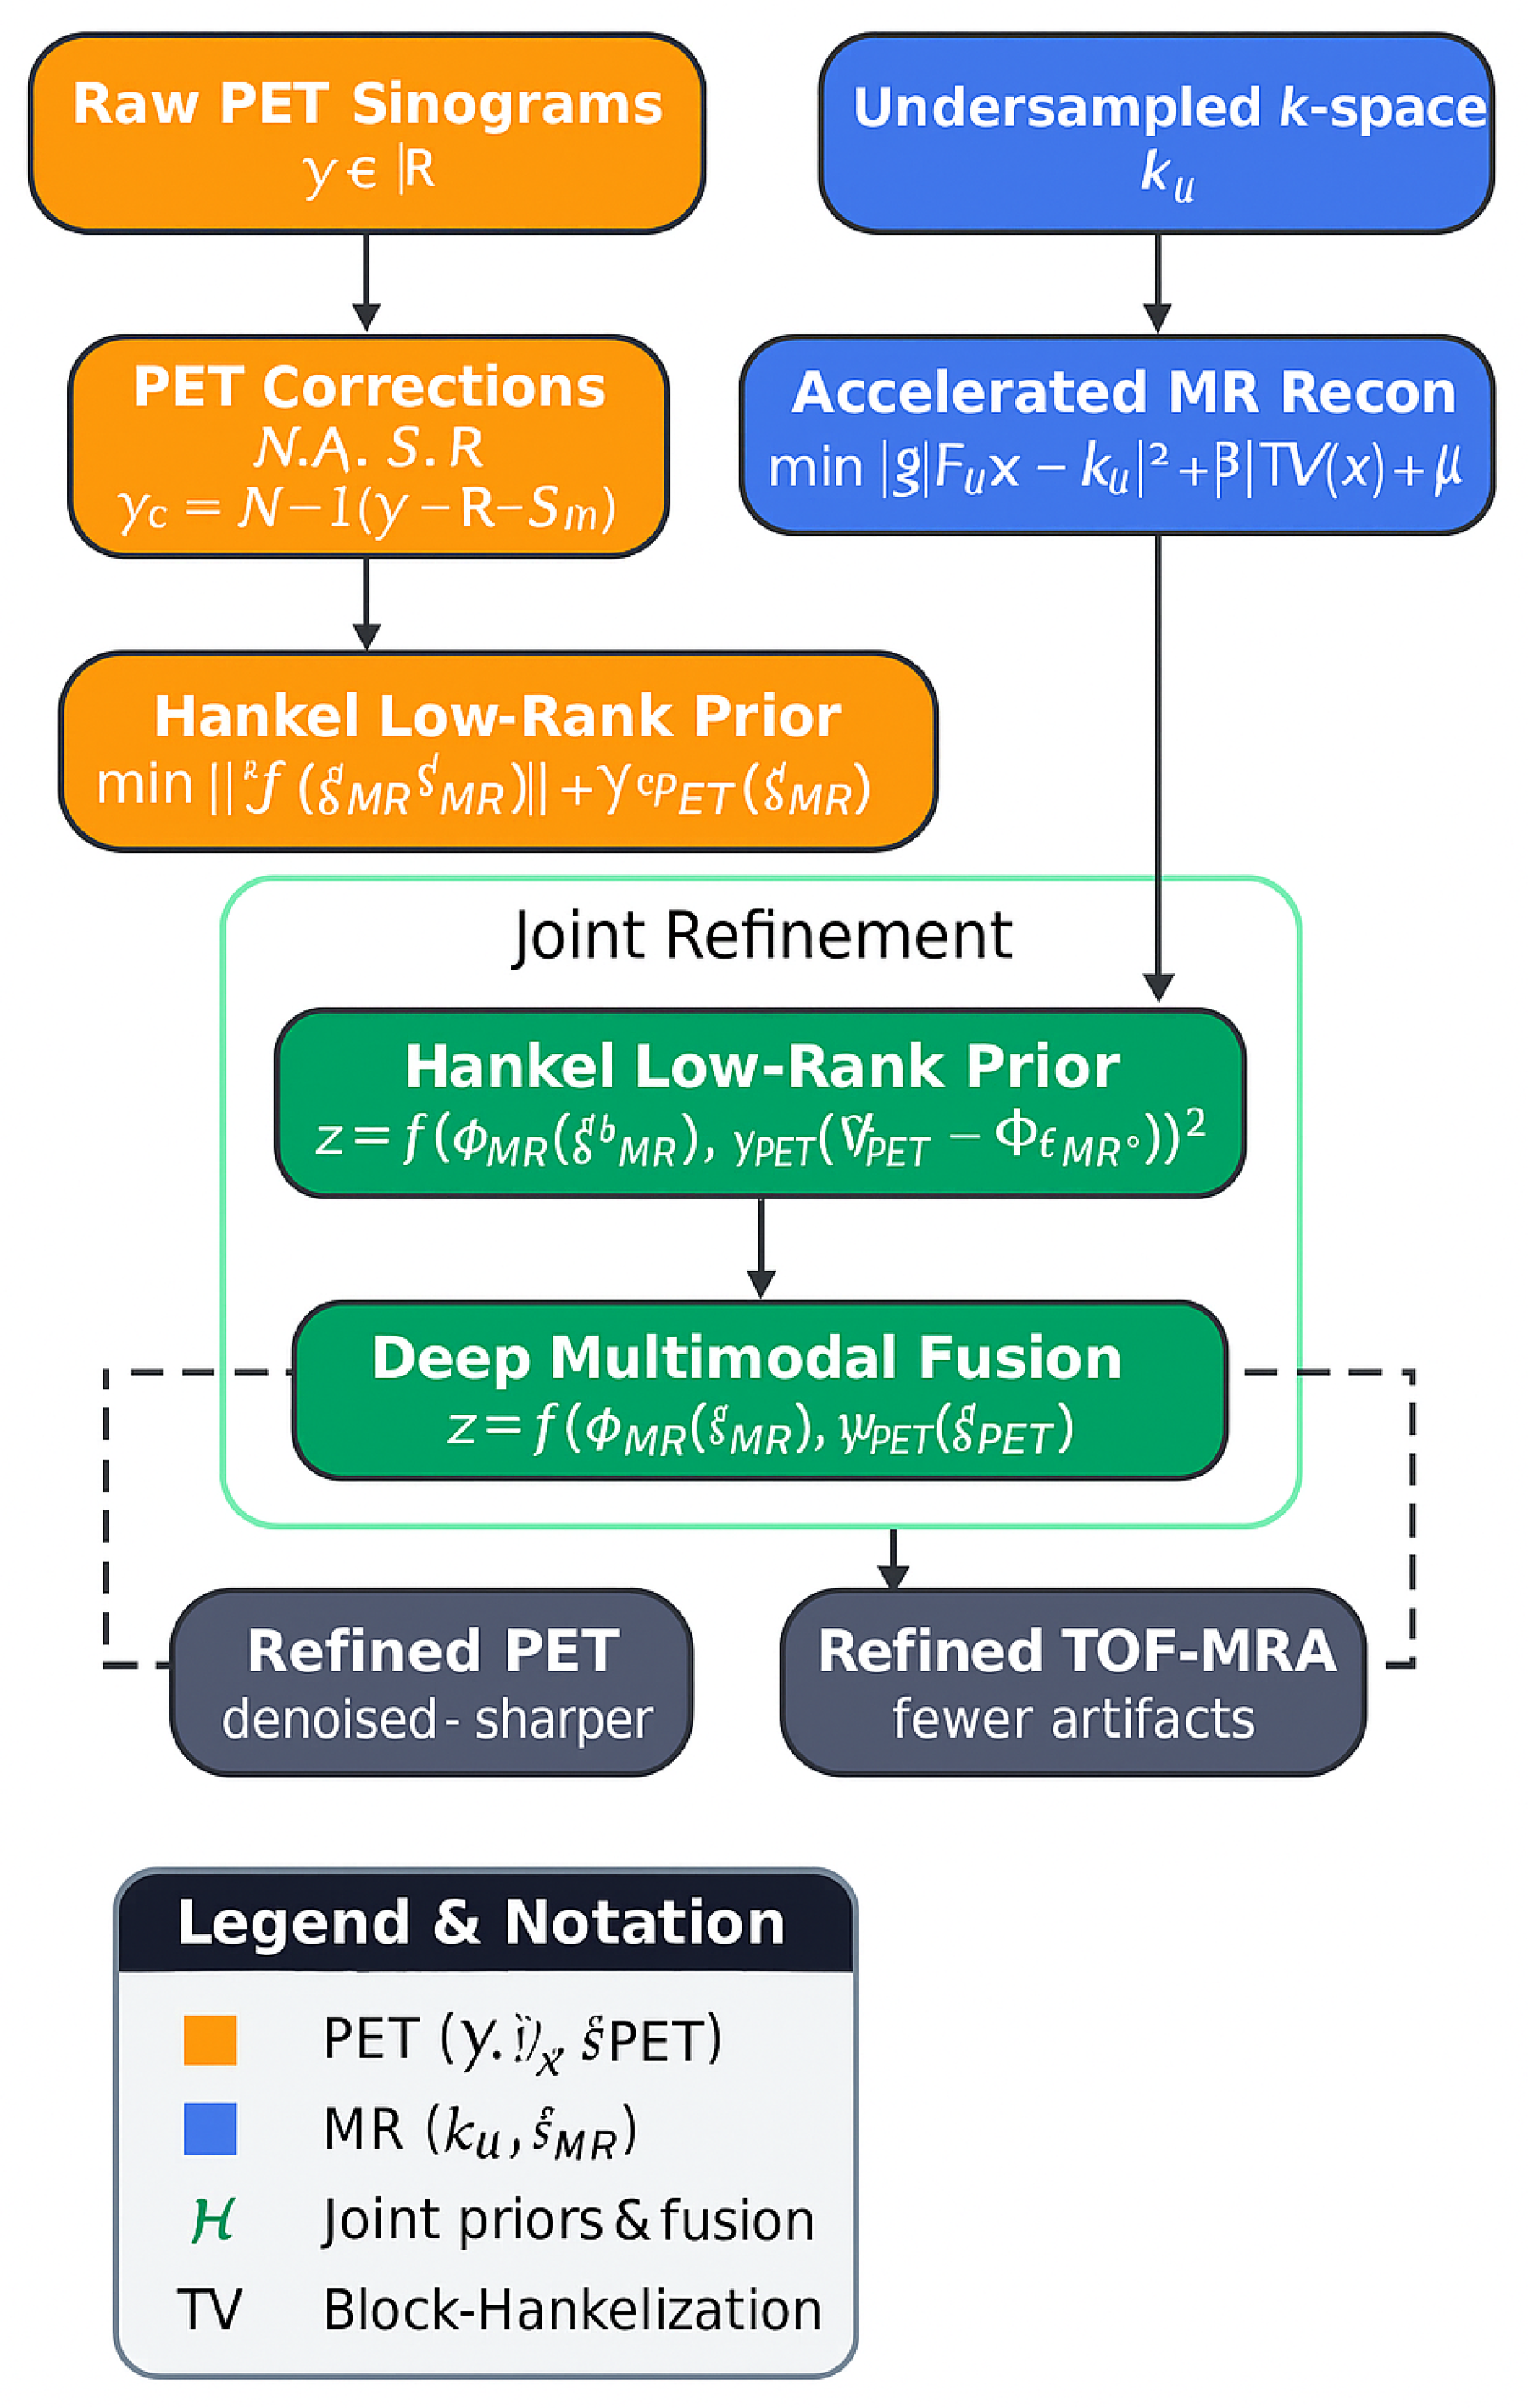
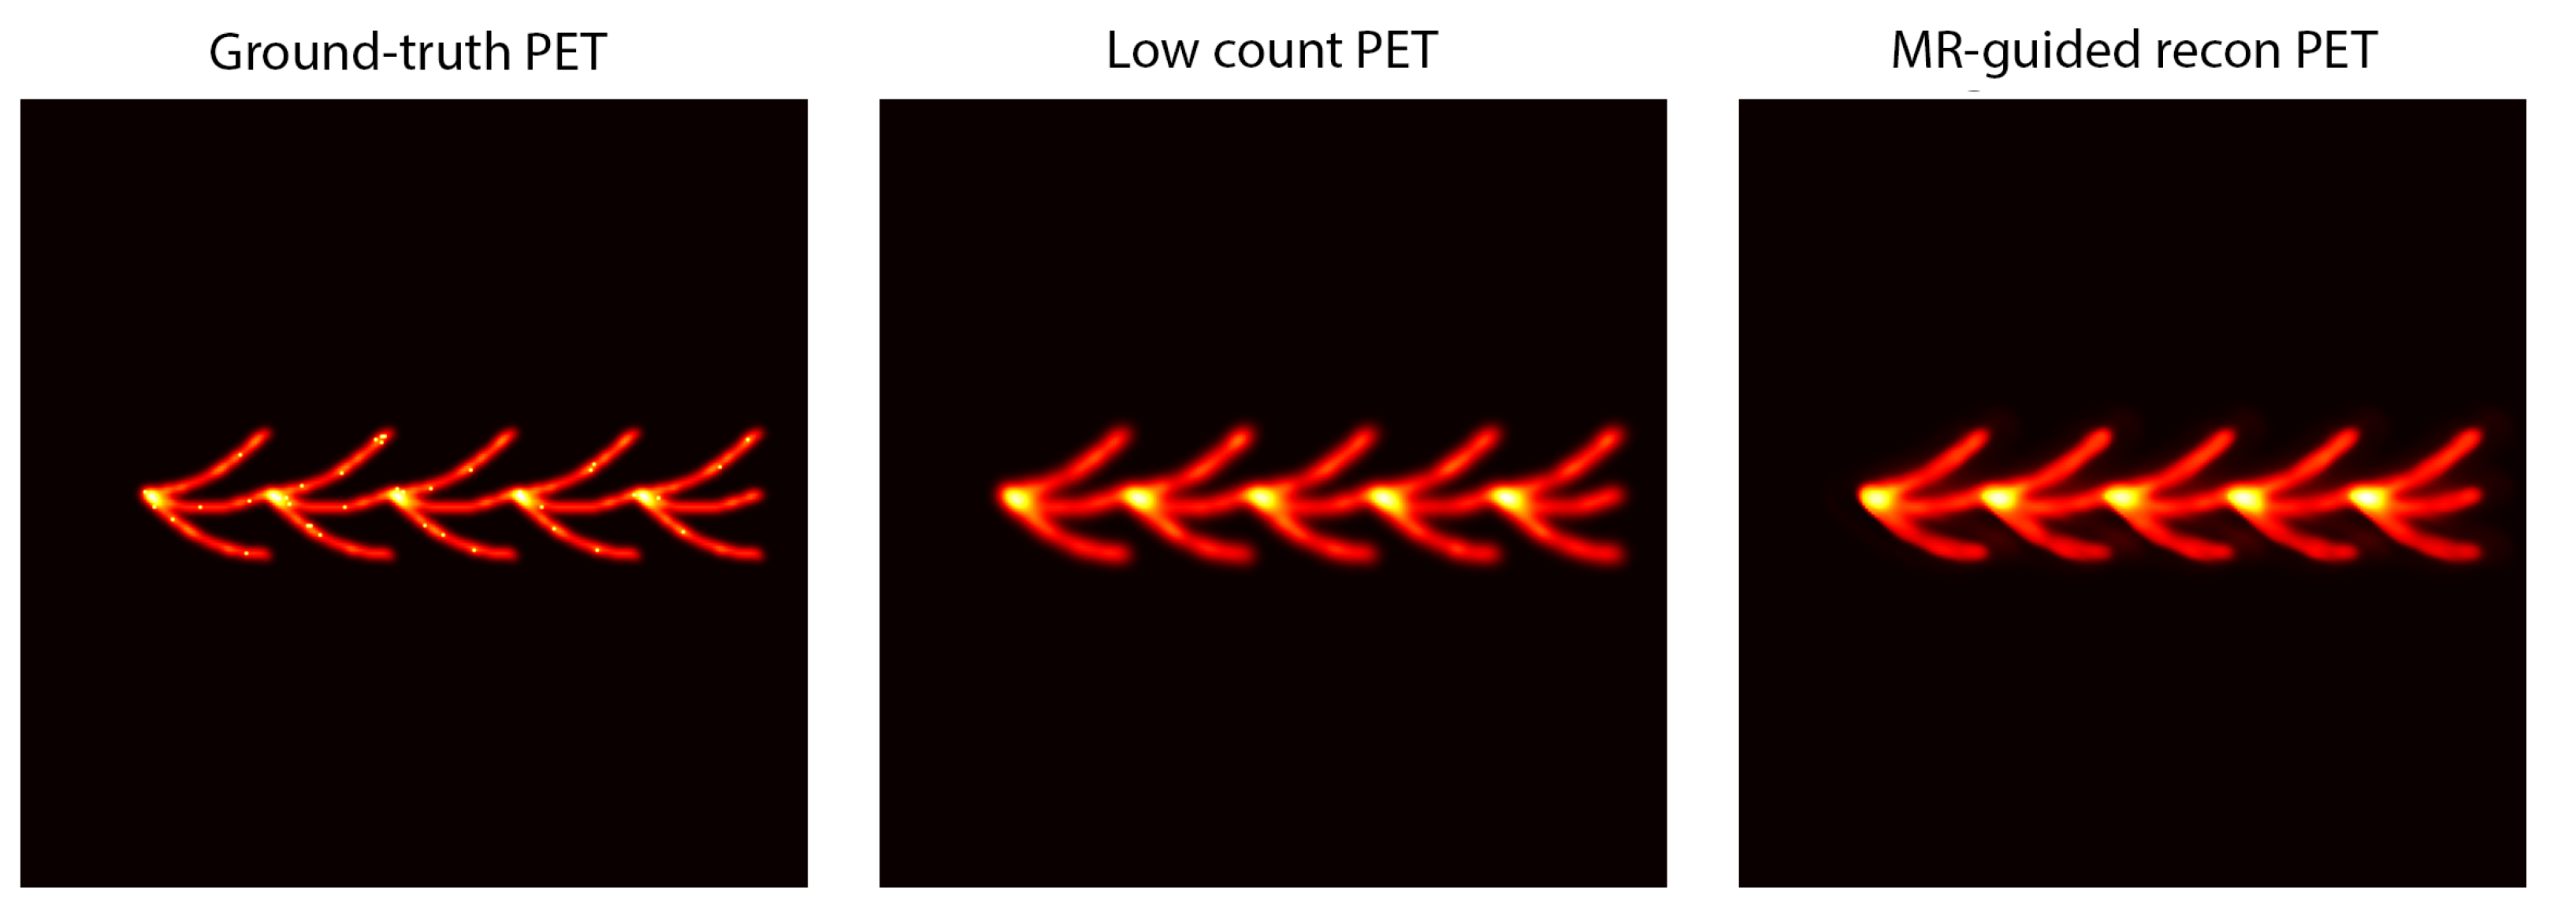
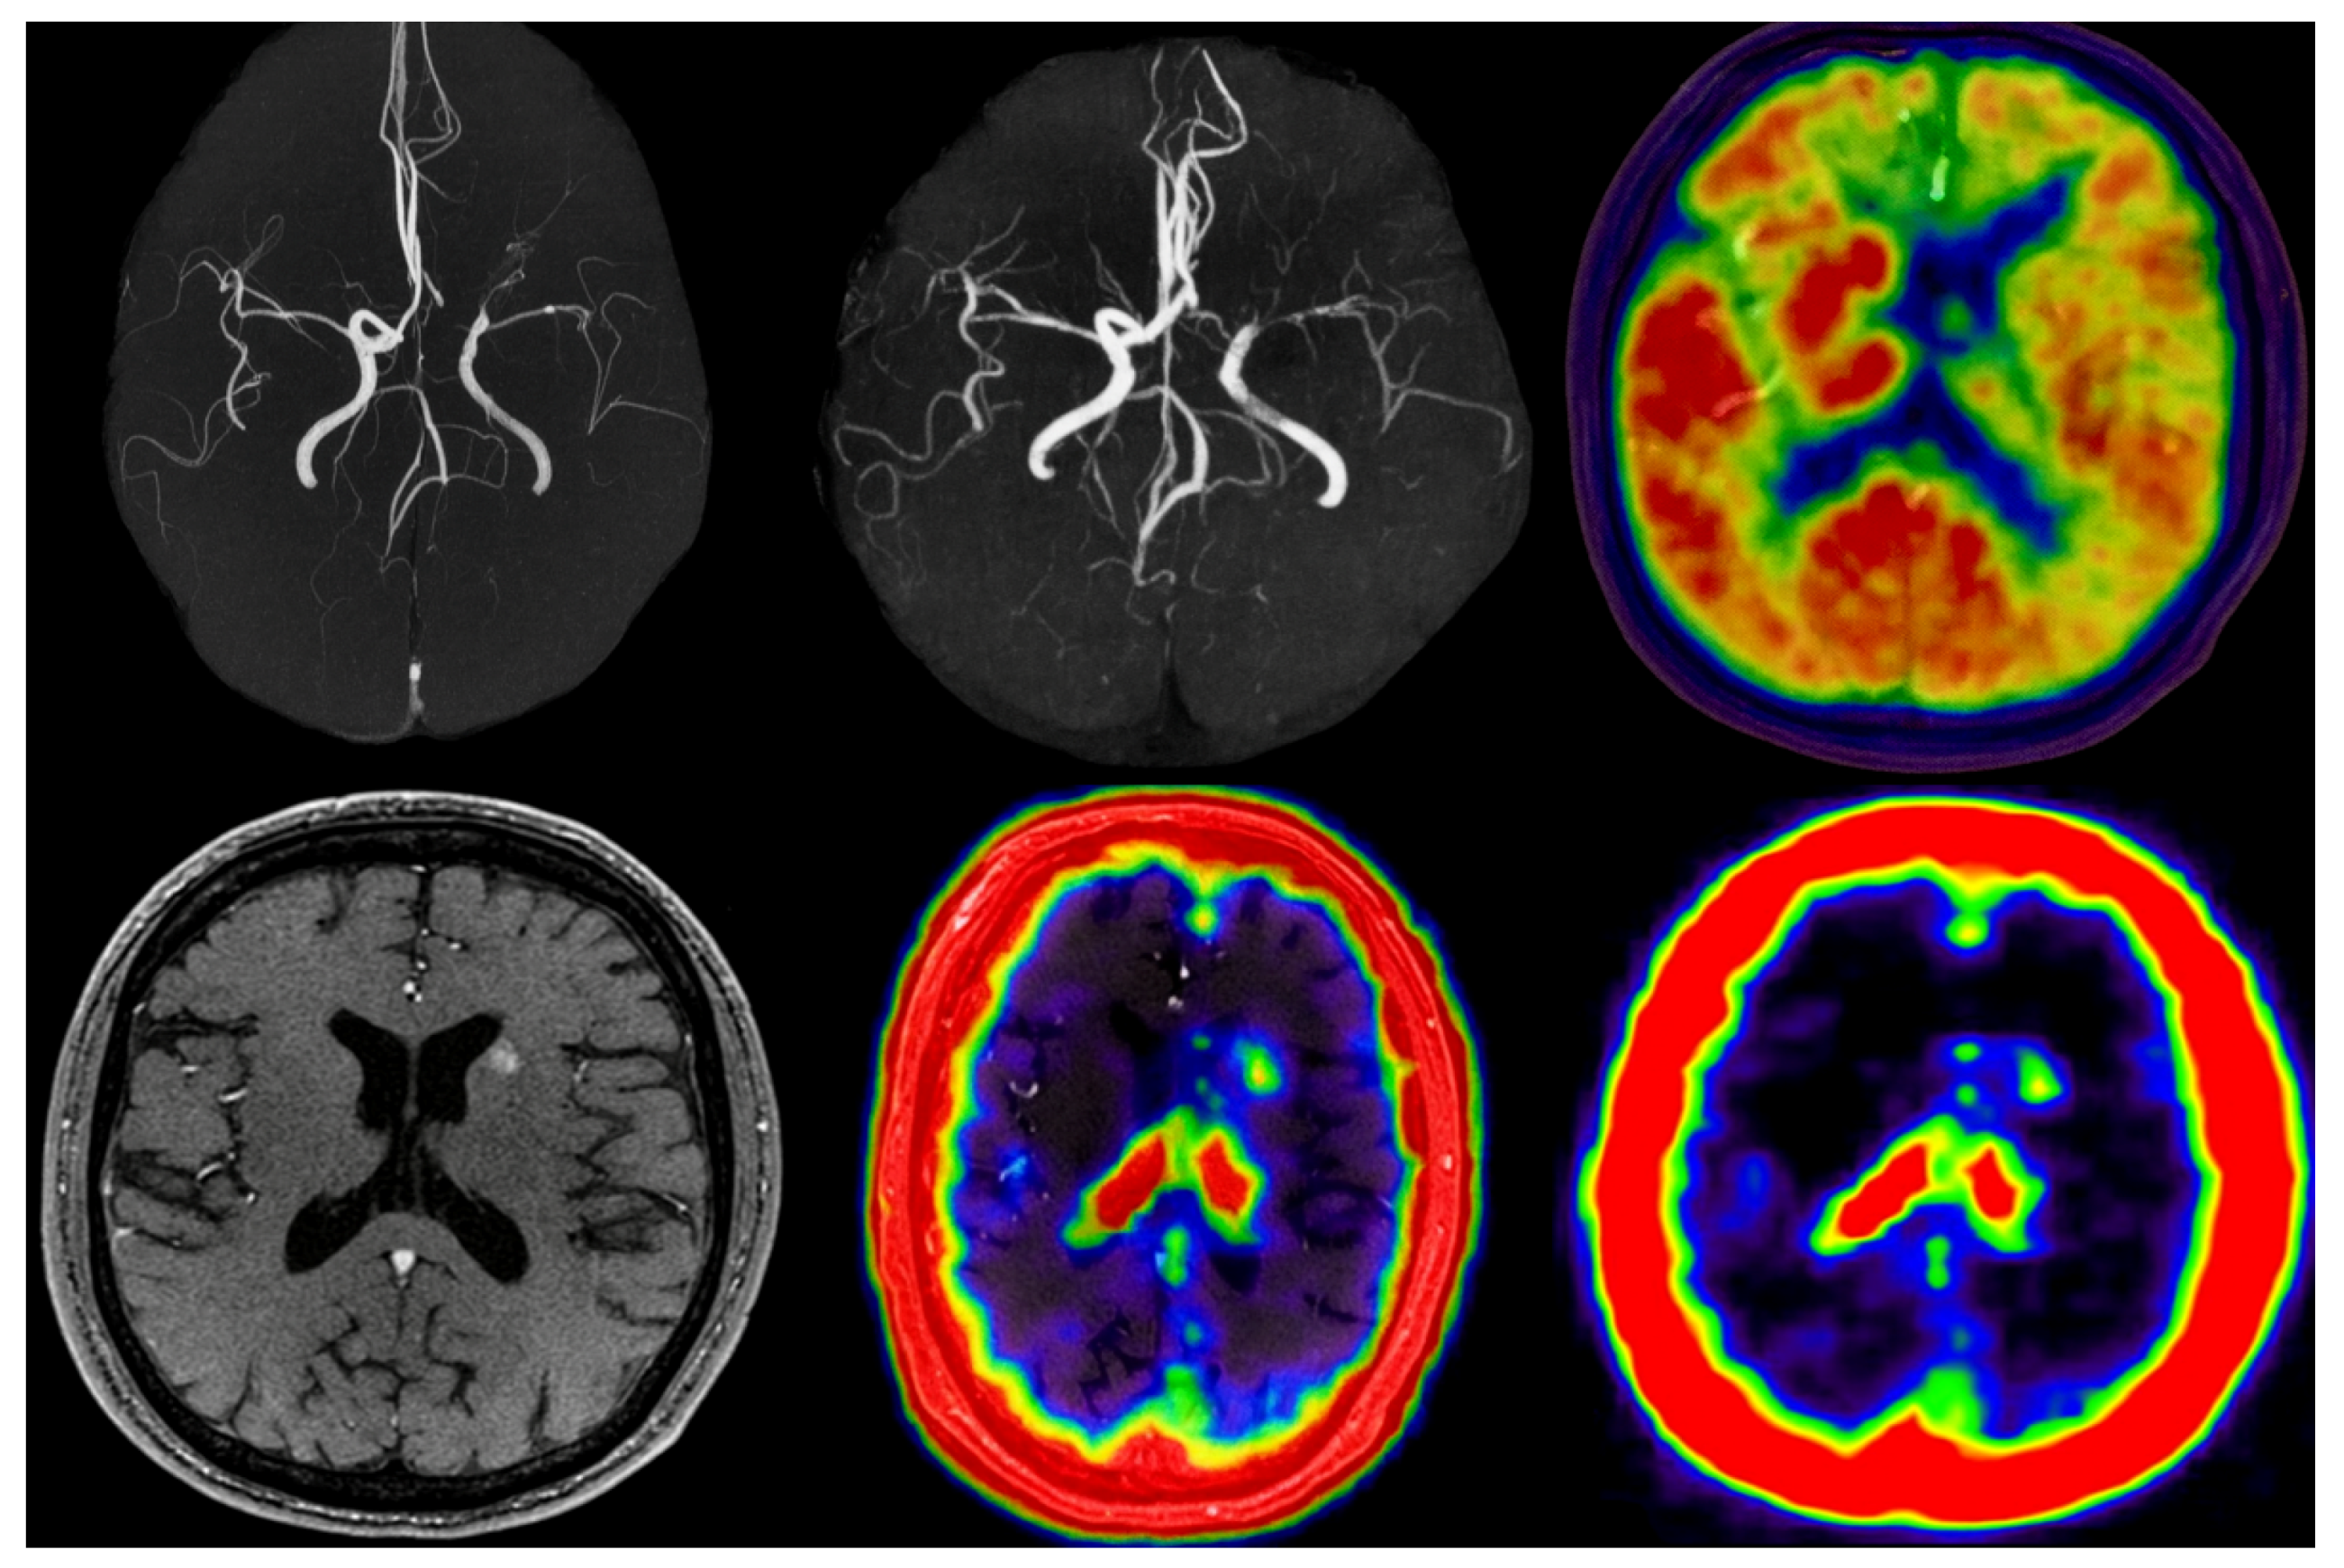
Low-rank Hankel priors and MR-guided constraints have been adopted for PET denoising and joint acceleration, see
Figure 1.
A joint Hankel operator,
enables shared local structure across modalities via nuclear norm minimization:
allowing PET to benefit from MR sharpness and MR to benefit from PET regional contrast, forming the basis for modern multimodal acceleration in cerebrovascular imaging.
Beyond structural priors, recent work on vascular and neural topology preservation further motivates anatomy-aware constraints for cerebrovascular reconstruction [
24].
3. Proposed MR–PET Reconstruction Framework
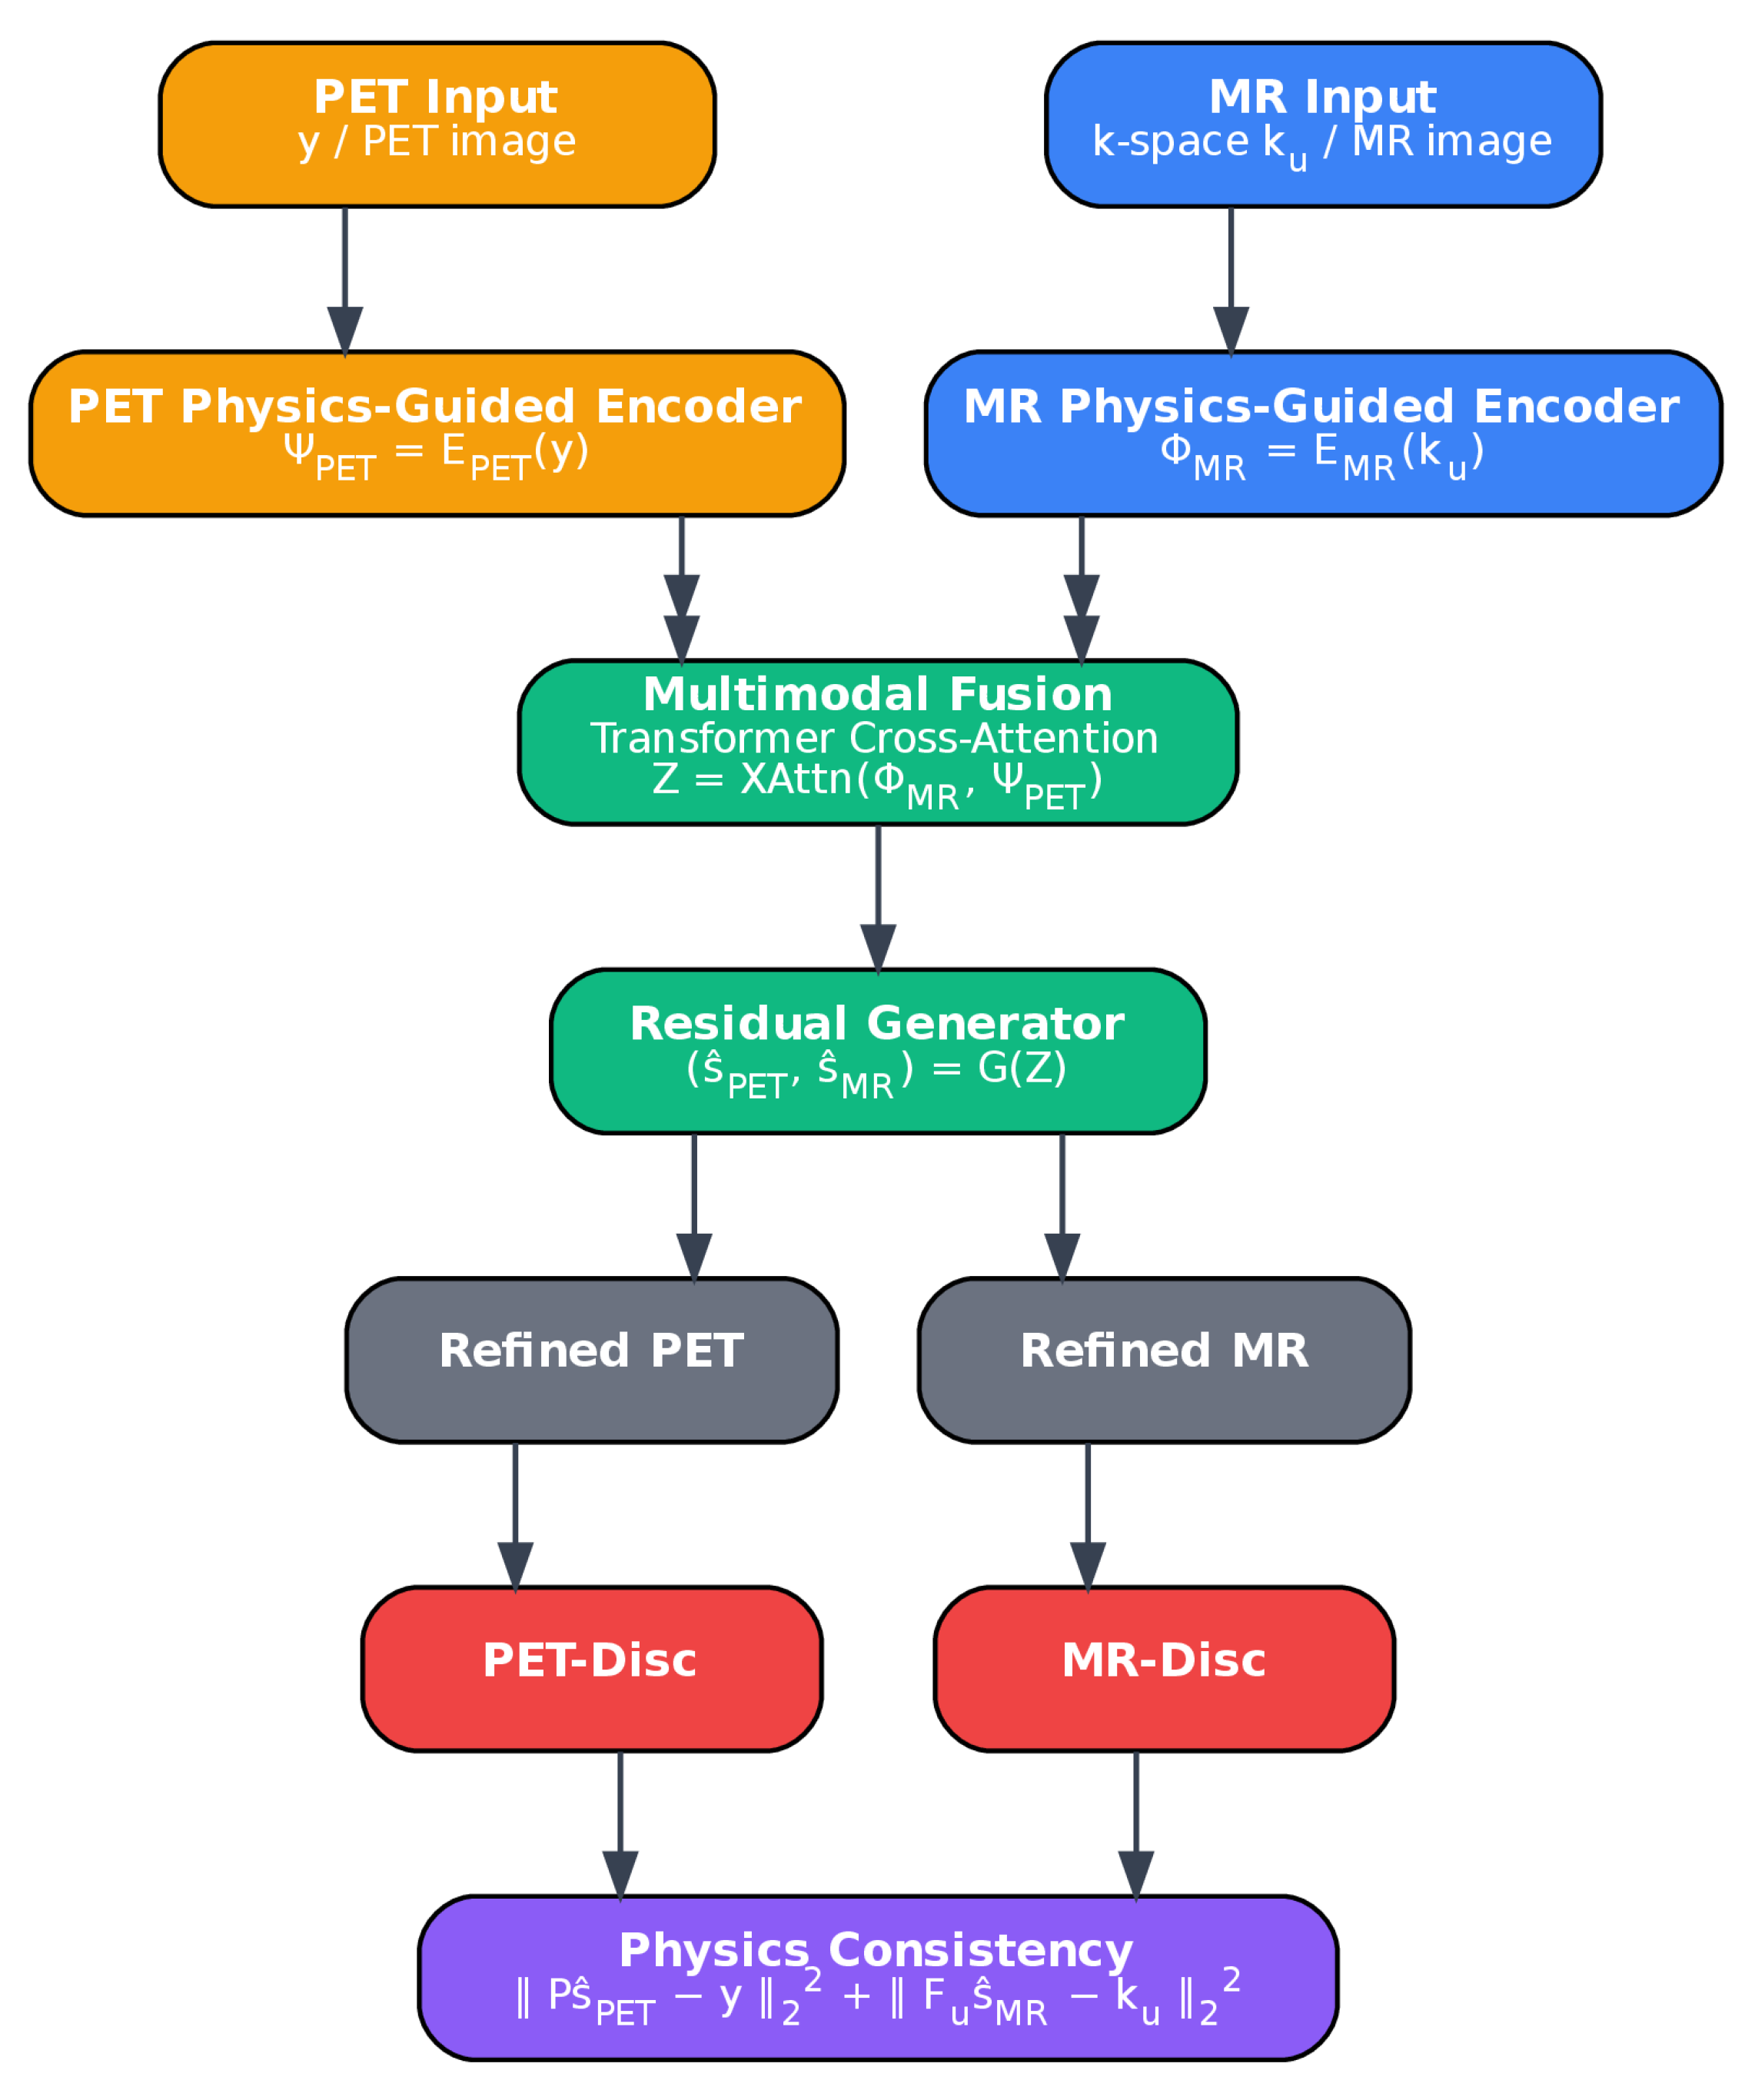
The objective of the proposed framework is to jointly reconstruct high-quality MR and PET images from undersampled and low-count acquisitions, enabling faster scans without loss of diagnostic utility. An overview of the architecture is provided in
Figure 2. The framework consists of five main components: (1) physics-guided MR and PET encoders, (2) a cross-attention fusion module, (3) a generator for super-resolution and denoising, (4) a discriminator for realism, and (5) physics-consistency and topology-preserving constraints. Structural detail from MR is leveraged to improve PET, while PET reinforces MR in regions with weak vascular signal. The network contains approximately 42 million trainable parameters, including 32 residual dense blocks in the generator and 12 transformer-based cross-attention layers. After training, the inference time for a full 3D MR–PET case (
MRA and
PET frames) is approximately 9–11 s on a single NVIDIA A100 GPU, supporting feasibility for acute stroke workflows.
3.1. Physics-Guided Multimodal Encoding
The MR encoder and PET encoder each comprise five convolutional layers with filters and increasing channel depths (from 32 to 256), each followed by ReLU activation and instance normalization. The MR encoder includes unrolled SENSE/CS operations at every second layer to enforce agreement with measured k-space data. The PET encoder incorporates an OSEM-inspired deprojection step with Poisson likelihood weighting to reflect its noise characteristics.
The encoded feature maps are denoted by:
3.2. Cross-Attention Fusion
A 12-layer transformer-based cross-attention module [
49,
50] is used to integrate modality-specific features. Each block uses 8 attention heads with 128-dimensional keys/queries and feed-forward layers of dimension 512. Sinusoidal positional encoding is used to preserve spatial information. The attention operation is defined as:
Transformer-based fusion was selected for its ability to selectively reinforce relevant cross-modal features while suppressing redundant or modality-specific noise. While more computationally intensive than simpler fusion strategies (e.g., concatenation or summation), attention mechanisms provide greater interpretability and were found empirically to reduce spurious hallucination and improve topological fidelity in preliminary ablation trials.
3.3. Generator Architecture and Super-Resolution
The fused feature representation is processed by a residual-in-residual dense network [
51] with 32 blocks. Each block includes five
convolutions, ReLU activations, and skip connections. Sub-pixel convolution layers [
52] are used to produce a super-resolved MR output (
), while the PET output is denoised and optionally upsampled using learned bilinear interpolation and residual correction modules. It is clarified here that while the PET matrix is preserved in its native resolution (
), spatial upsampling is optionally applied for better co-visualization and joint loss computation in training, without affecting the diagnostic matrix during inference.
3.4. Physics-Consistency Projection
Physics-based consistency is enforced via:
These ensure that reconstructed outputs remain plausible with respect to acquired measurements.
3.5. Discriminator and Hybrid Losses
A dual-path discriminator is used: one global stream evaluates MR volumes and PET frames jointly (as concatenated channels), while a local path focuses on vascular patches using a sliding window. Both paths share three convolutional layers with increasing filters (32–64–128) and leaky ReLU activations, followed by average pooling and a sigmoid classifier. Patch-based input allows finer supervision of small vessel continuity and perfusion gradients.
The generator is optimized using a hybrid loss:
Final weights were empirically tuned via grid search on validation data and set as follows: see
Table 1.
The multitask diagnostic head was included to predict large vessel occlusion (LVO) and collateral scores, helping the generator preserve diagnostic patterns and reducing clinically misleading artifacts. It adds interpretability and enforces indirect supervision from task-specific endpoints.
3.6. Training Strategy and Augmentation
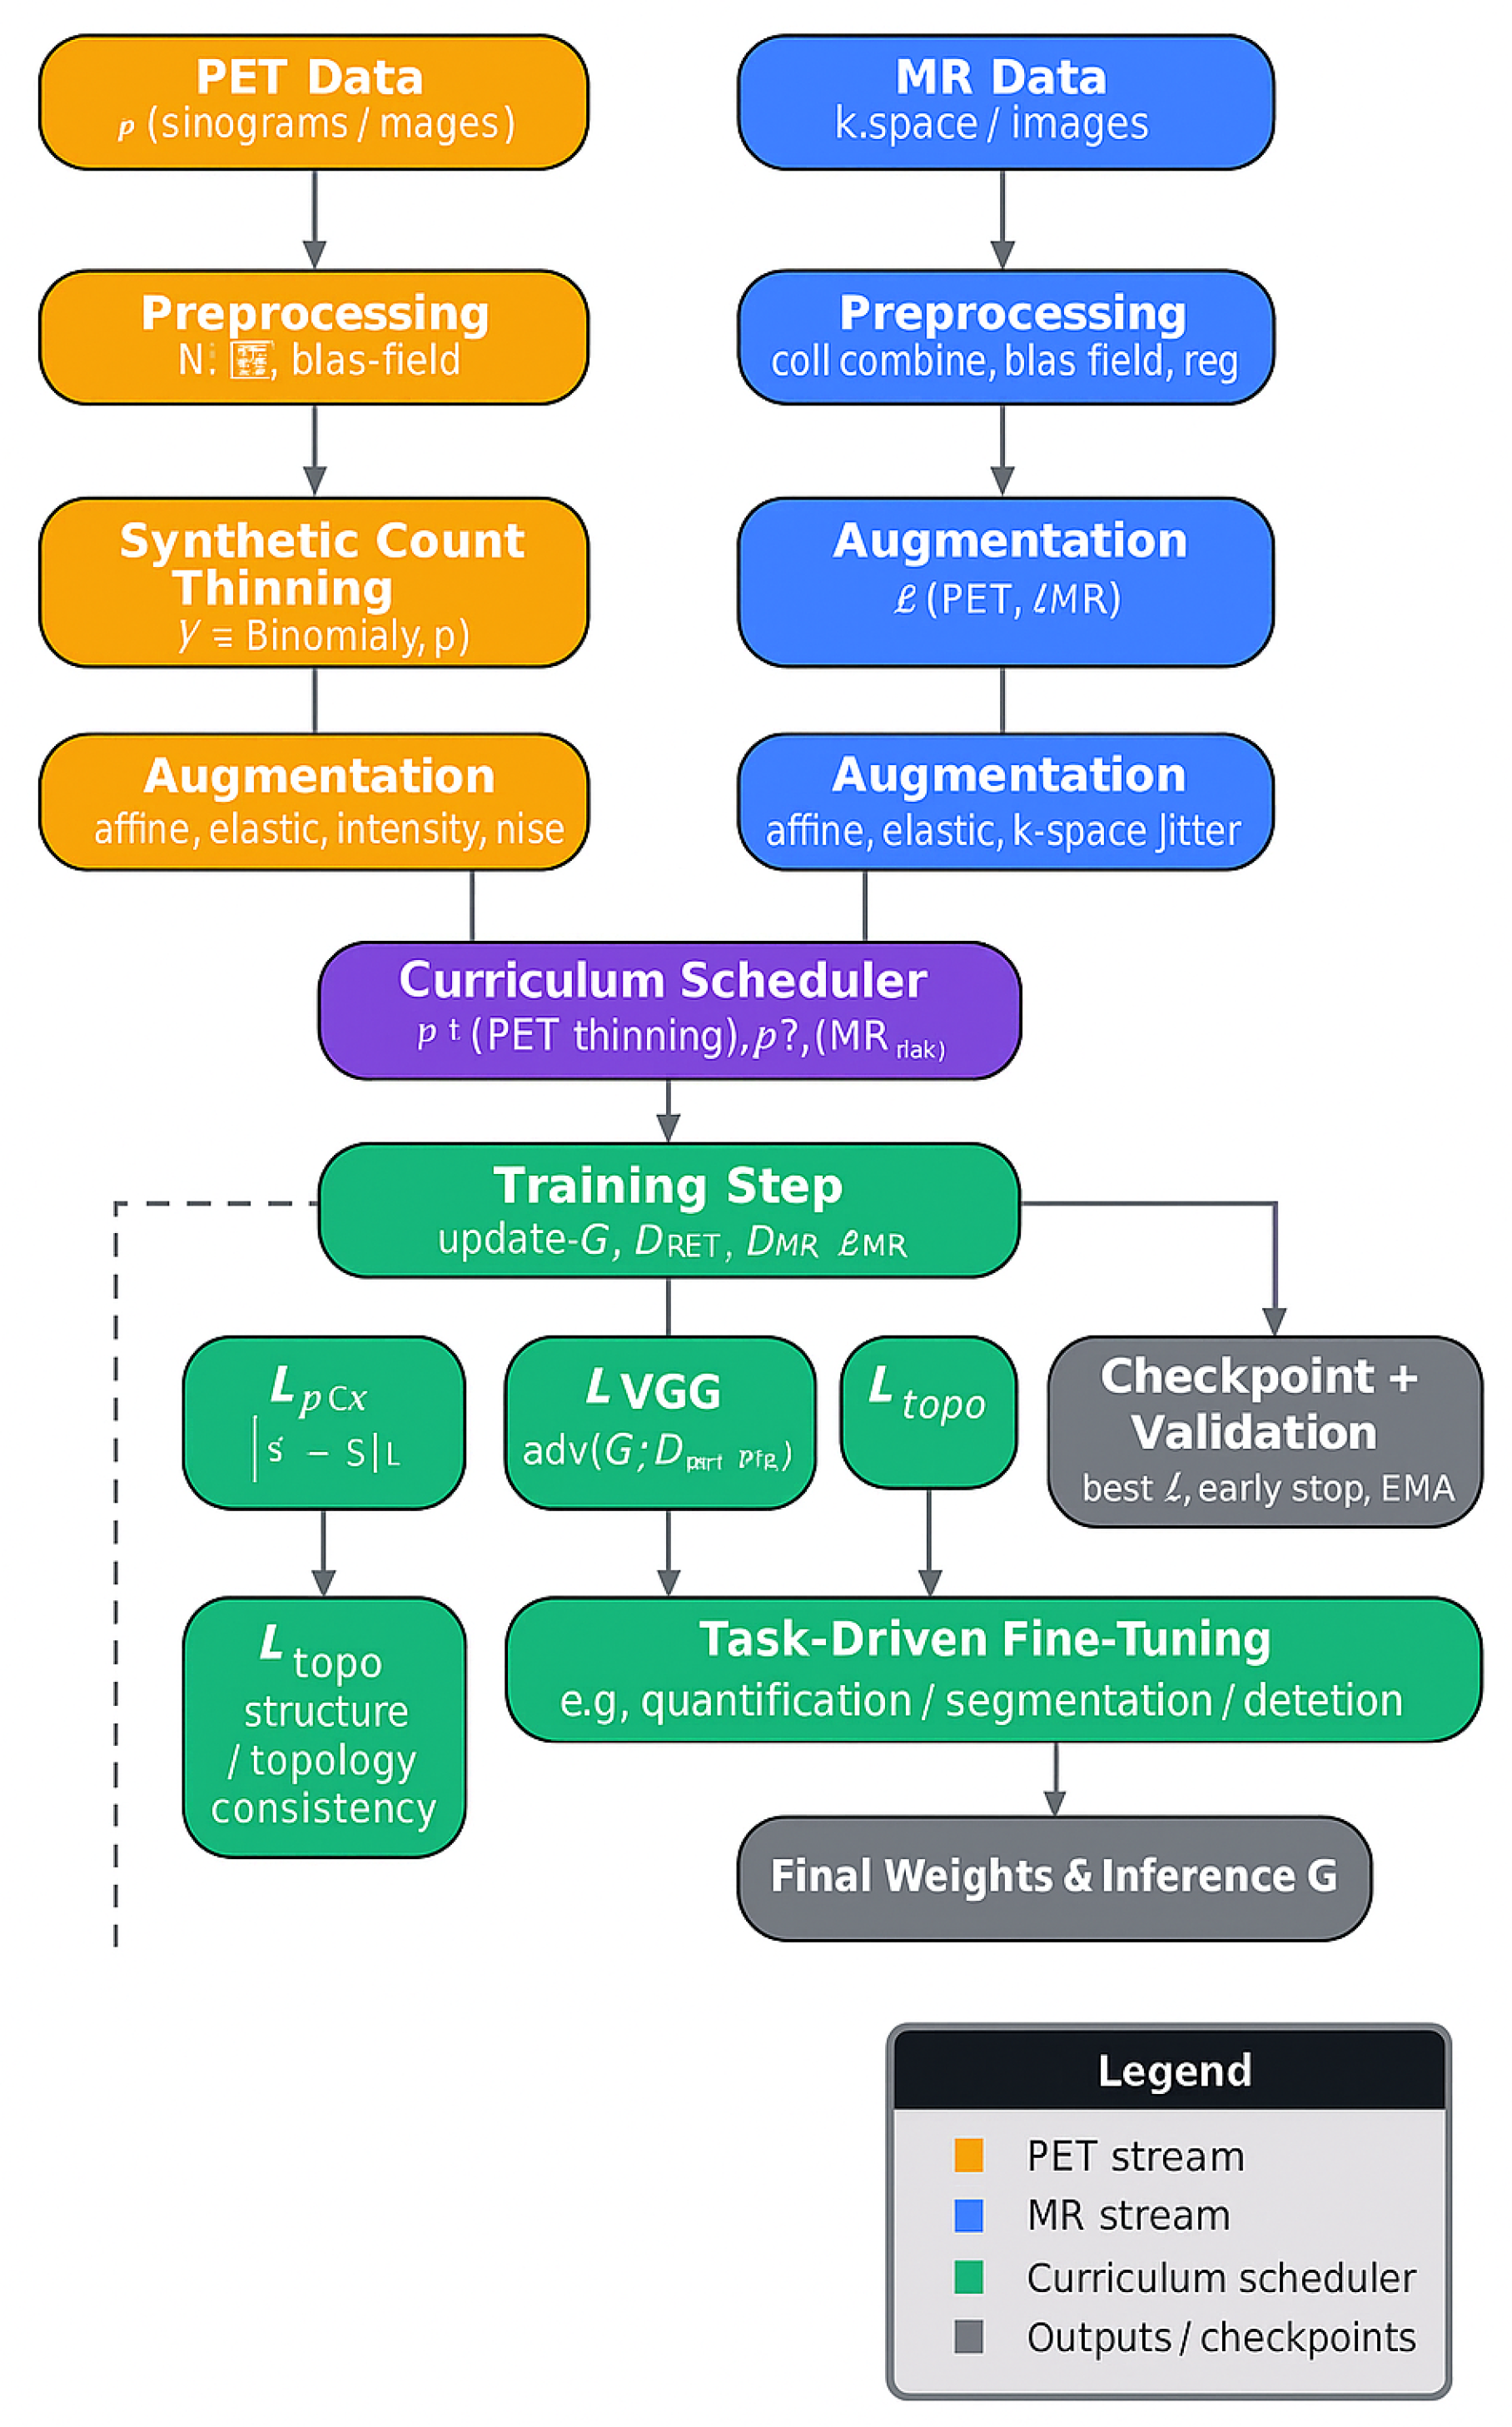
A three-stage curriculum training strategy was followed:
Stage 1 (PSNR > 30 dB): Pixel loss and VGG perceptual loss only.
Stage 2 (PSNR > 33 dB or SSIM > 0.92): Add adversarial and topology loss.
Stage 3 (plateau in SSIM or validation loss): Add task-specific head and fine-tuning.
Synthetic undersampling and augmentations (elastic deformations, motion blur, intensity shifts) were applied across MR and PET to improve generalizability. The learned MR sampling mask and PET sinogram sampling pattern were updated with a learning rate of
to avoid instability, see
Figure 3.
4. Experimental Setup and Evaluation
The experimental pipeline employed for the evaluation of the proposed framework is outlined in this section. The datasets used for training and testing are first described, followed by implementation details, evaluation metrics, and comparison baselines. This structure provides the necessary context and ensures that the results can be reproduced.
4.1. Datasets
This study evaluated the proposed method using a combined dataset of clinical and synthetic brain MR–PET cases. The complete dataset comprised a total of 70 volumetric studies (3D MR–PET pairs), including:
18 clinical cases: Patients presenting with acute ischemic stroke who underwent simultaneous brain MR–PET on a hybrid PET/MR scanner. These cases included diverse infarct locations and collateral grades. Ground truth references were derived from fully sampled MRA acquisitions and full-count PET scans reconstructed from extended acquisition times.
52 synthetic cases: Constructed by retrospectively undersampling fully sampled MR angiography and PET volumes obtained from publicly available neuroimaging databases. To simulate stroke pathology, lesions and perfusion deficits were synthetically embedded using morphological priors and kinetic modeling.
Each 3D volume consisted of either 256 axial slices for MRA (after upsampling) or 128 slices for PET, totaling over 8400 MR slices and 4400 PET slices. PET data were reconstructed with a transaxial matrix at 2–3 mm resolution; MRA volumes were reconstructed to – mm isotropic resolution using sub-pixel upsampling.
The dataset was split into:
Training set: 56 cases (14 clinical, 42 synthetic)
Validation set: 7 cases (2 clinical, 5 synthetic)
Test set: 7 cases (2 clinical, 5 synthetic)
All cases were anonymized and handled in compliance with institutional review board (IRB) and data protection guidelines. PET reference images corresponded to full-count reconstructions (5 min), with lower-count images generated by thinning to 6.25% and 12.5% to simulate accelerated acquisitions. MR data were undersampled using variable-density Cartesian masks at acceleration factors . Ground truth for evaluation was defined as fully sampled MRA and full-count PET volumes. This dataset design enabled evaluation of both reconstruction fidelity and clinical applicability under realistic and stress-test conditions.
4.2. Implementation Details
The network was implemented in PyTorch (
https://pytorch.org/) and trained on an NVIDIA A100 GPU using mixed precision. The Adam optimizer was employed with an initial learning rate of
for the generator and
for the discriminator. Gradient clipping (maximum norm 5.0) and exponential moving average (EMA) with a decay factor of 0.999 were applied to stabilize training. The final network was trained from scratch over approximately 3 days.
A curriculum learning schedule with three distinct stages was implemented to promote stable convergence and to mitigate early adversarial instability:
Stage 1 (Epochs 0–60): Only pixel-wise and perceptual losses were used. Transition to Stage 2 was triggered when the moving average PSNR on the validation set exceeded 30 dB for both MR and PET outputs.
Stage 2 (Epochs 60–120): Adversarial loss and topology-preserving loss were introduced. Progression to Stage 3 was initiated when either (i) validation PSNR exceeded 33 dB or (ii) SSIM exceeded 0.92 for two consecutive evaluations.
Stage 3 (Epochs 120–end): The multitask loss was activated, and training focused on clinical-task alignment (e.g., LVO and collateral classification). Training was terminated when validation loss plateaued for more than 15 epochs.
The final loss weights were empirically tuned using grid search on the validation set: , , , , and . The perceptual loss was computed using layer conv3_3 of a pre-trained VGG-19 model from ImageNet.
The vessel topology loss
was defined by computing the Dice coefficient of centerlines extracted from MRA and thresholded PET perfusion maps. Vessel skeletons were obtained using a multiscale Hessian-based filter [
22] followed by morphological thinning.
The learned MR undersampling mask
M and PET sinogram sampling pattern were optimized jointly with network weights using a differentiable sampling module [
53], updated with a small learning rate of
to prevent degenerate patterns.
4.3. Evaluation Metrics
A rigorous evaluation framework was adopted to capture the multidimensional performance of the proposed vascular-aware joint MR–PET reconstruction pipeline. Conventional image fidelity metrics (e.g., PSNR, SSIM, normalized MSE) were used for baseline benchmarking; however, these are insufficient for vascular imaging tasks where clinical value derives from fine vessel topology preservation in MRA and quantitative tracer uptake accuracy in PET. Therefore, a comprehensive suite of metrics spanning four domains was employed: (1) generic image fidelity, (2) vascular-specific indices, (3) PET quantitative recovery measures, and (4) higher-order topological consistency.
4.3.1. Generic Image Fidelity
Peak signal-to-noise ratio (PSNR) and structural similarity index (SSIM) were reported for reconstructed MRA and PET images. These metrics ensure continuity with prior literature and quantify global fidelity. Higher PSNR (in dB) and SSIM (unitless, maximum 1) values indicate superior reconstruction quality.
4.3.2. MR Angiography-Specific Metrics
To assess vascular fidelity, the following indices were computed:
Vessel Sharpness Index (VSI): Mean gradient magnitude perpendicular to vessel centerlines [
54], where higher VSI reflects sharper vessel boundaries.
Branch Completeness Ratio (BCR): Fraction of reference vessel branches retained in the reconstruction, calculated by comparing skeletons from the reconstructed and reference MRA: .
Topological Similarity (TS): A persistent homology-derived score comparing connectivity () and loops () between reconstructed and reference vessel networks. Barcode diagrams were computed, and TS was derived from normalized overlap of bar lengths (range: 0–1).
4.3.3. PET Quantitative Metrics
To assess PET image fidelity:
Standardized Uptake Value Recovery Rate (SUVRR): Ratio of reconstructed-to-reference mean SUV in lesion and contralateral regions.
Contrast Recovery Coefficient (CRC): Ratio of lesion-to-background contrast in reconstruction vs. reference: .
Metabolic Gradient Fidelity (MGF): Pearson correlation between spatial gradients in reconstructed and reference PET images.
4.3.4. Clinical Task Performance
Diagnostic utility was quantified using:
LVO Detection Accuracy: Binary classification accuracy of large vessel occlusion detection compared to expert-labeled ground truth.
Collateral Flow Assessment: Agreement between predicted collateral scores (0–3) and neuroradiologist scores, using Cohen’s .
Perfusion Mismatch Classification: Binary classification AUC for identifying penumbra–core mismatch in dynamic PET, based on established clinical criteria.
All results were reported as mean ± standard deviation across the test cohort. Paired
t-tests were used for statistical comparison to competing methods, with
considered significant [
55]. Inference time per case was approximately 1.8 s, and total model size was 52 M parameters, which supports time-sensitive deployment.
5. Results
This section presents a comprehensive evaluation of the proposed method across four domains: (1) generic image fidelity, (2) vascular topology preservation, (3) PET quantitative accuracy, and (4) stroke diagnostic relevance. A total of 60 MR–PET cases were used for testing (18 clinical, 42 synthetic), and 10 cases were used for validation. Generalization was tested on cases from institutions unseen during training, although additional multi-protocol/multi-scanner evaluations will be required for broader clinical claims.
5.1. Quantitative Reconstruction Performance
Table 2 reports PSNR and SSIM at MR acceleration factors
. The proposed method achieved consistently higher scores, particularly at high accelerations, confirming its robustness.
5.2. Vascular Structure Preservation
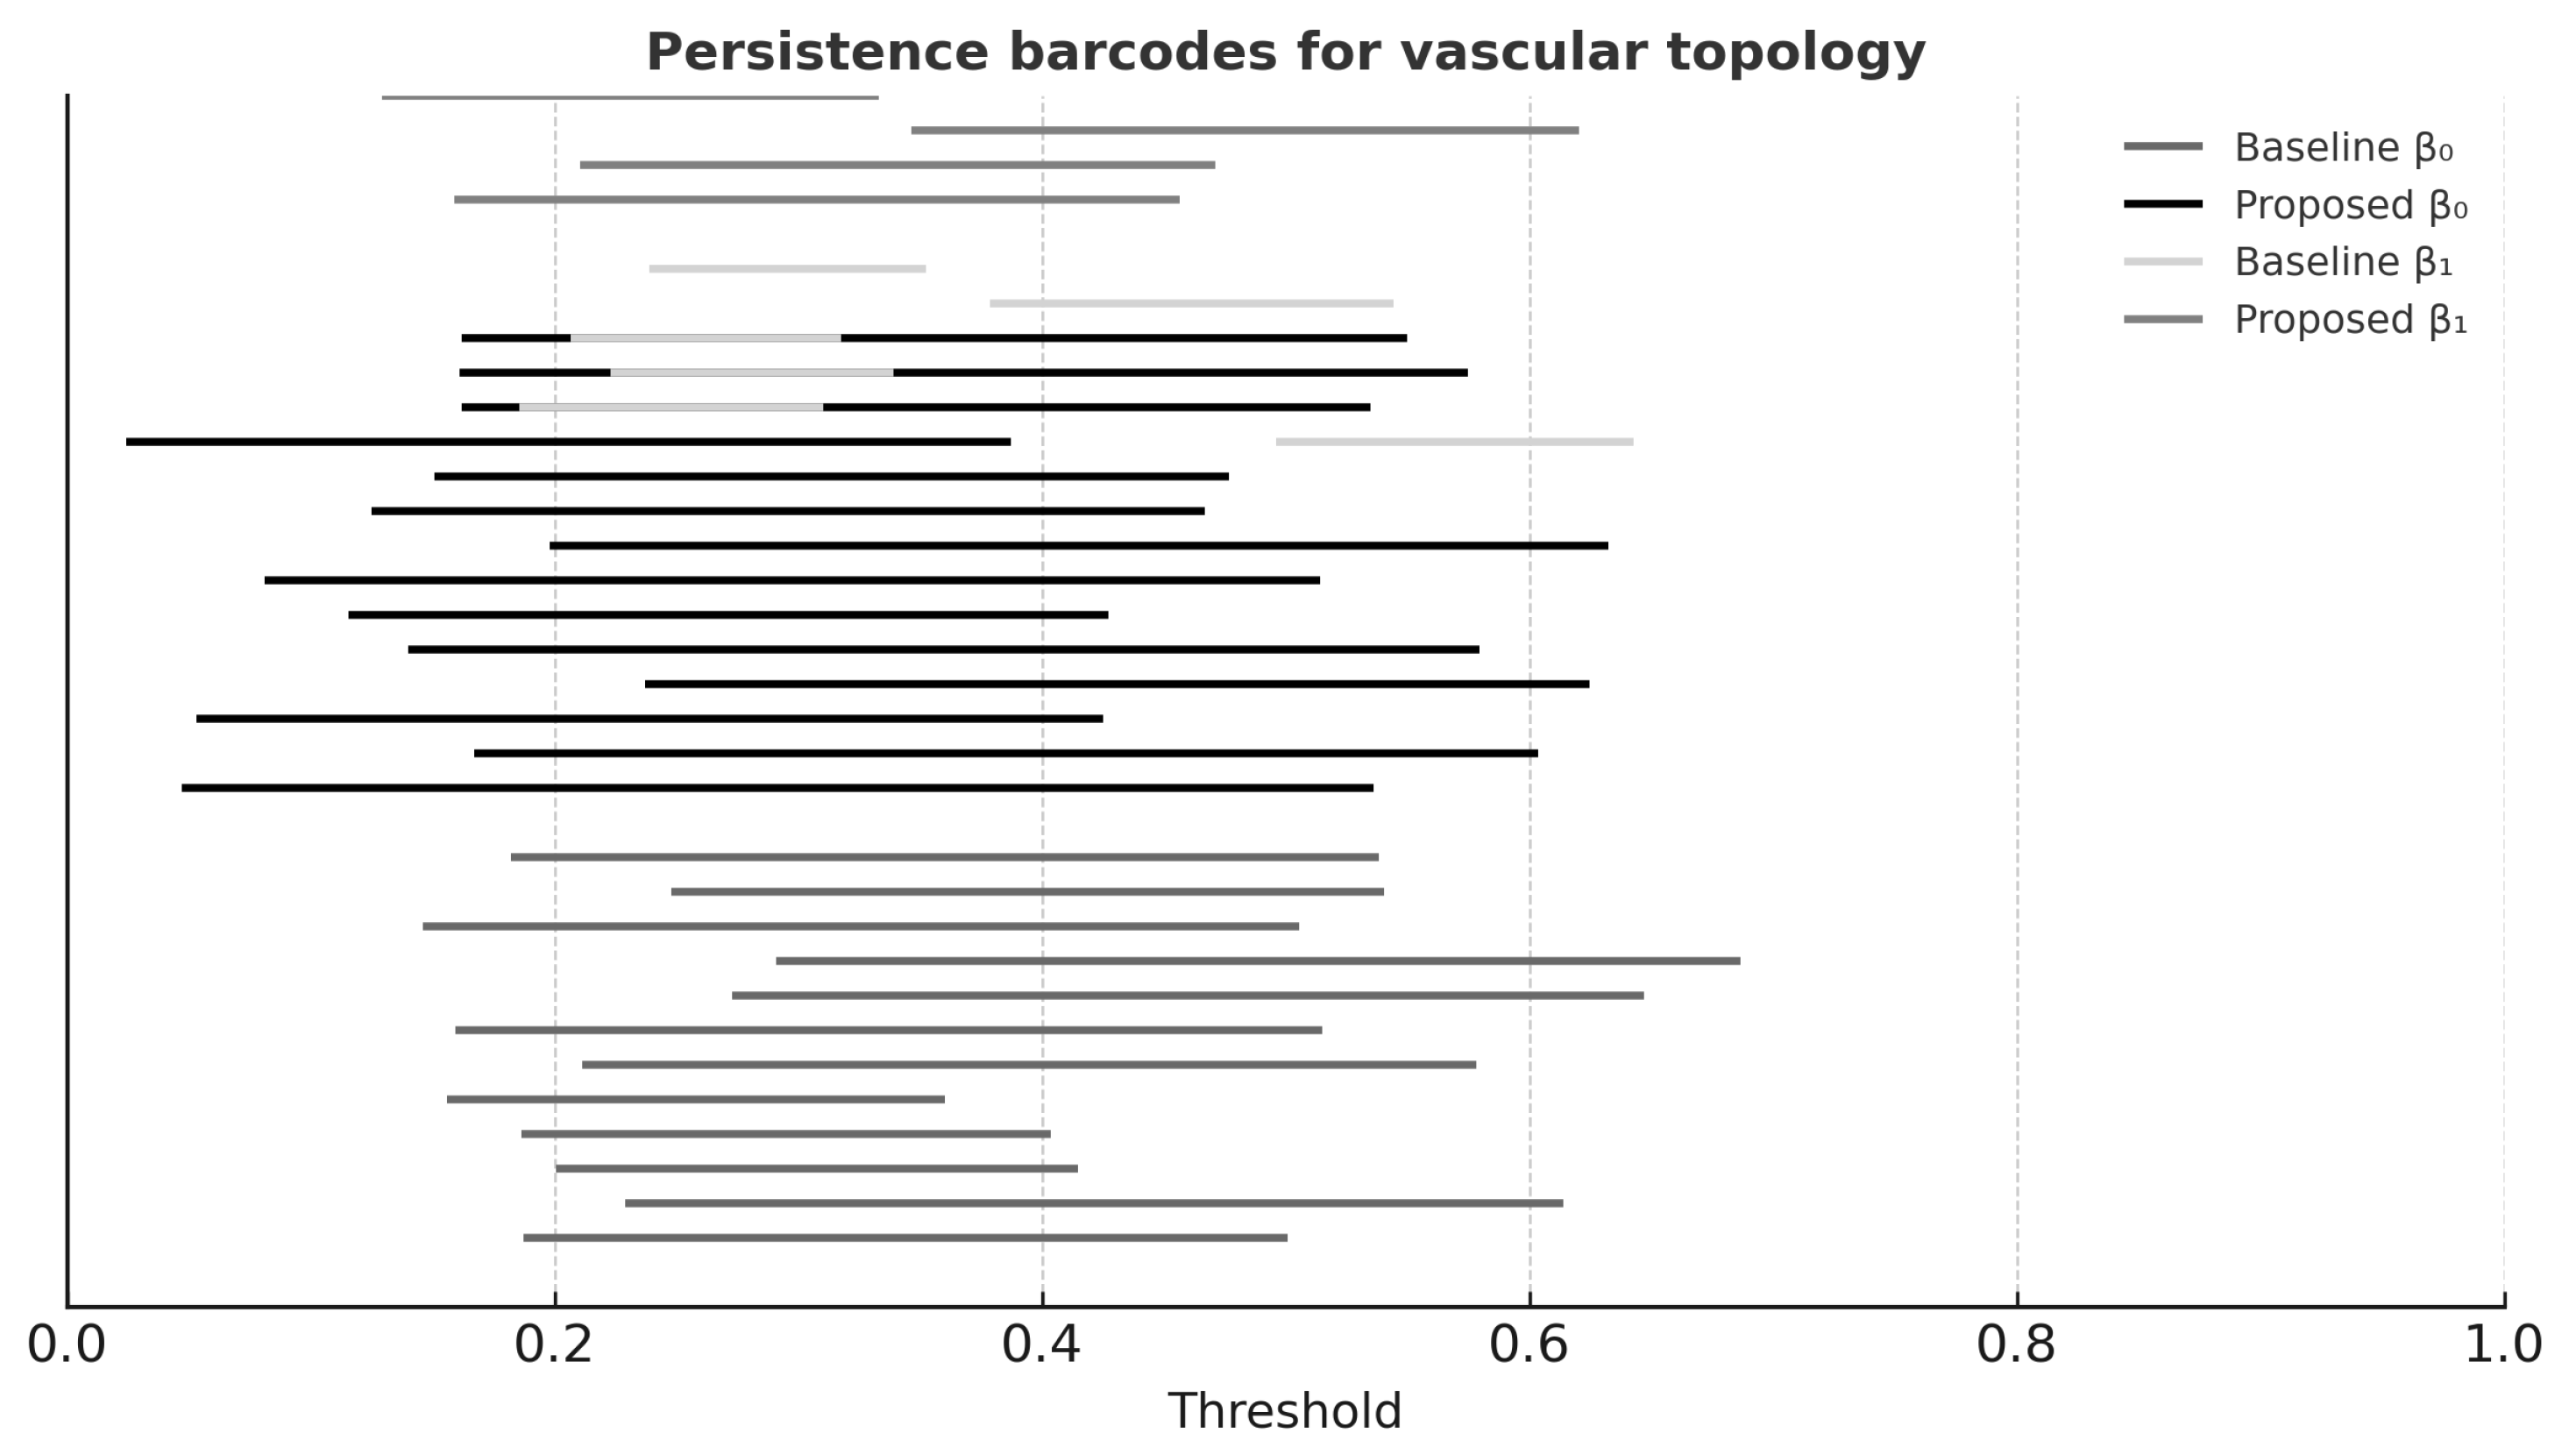
Table 3 shows that the proposed method achieved highest VSI, BCR, and TS scores, confirming superior preservation of vascular topology. Persistent homology analysis (
Figure 4) supported these findings.
5.3. PET Functional Metrics
PET reconstructions at 6.25% count level were evaluated using SUVRR, CRC, and MGF (
Table 4). The proposed method outperformed all baselines significantly (
).
5.4. Clinical Task Performance
Table 5 summarizes LVO detection accuracy, collateral scoring agreement, and perfusion mismatch AUC. The proposed method yielded the highest scores across all metrics.
5.5. Bland–Altman Analysis
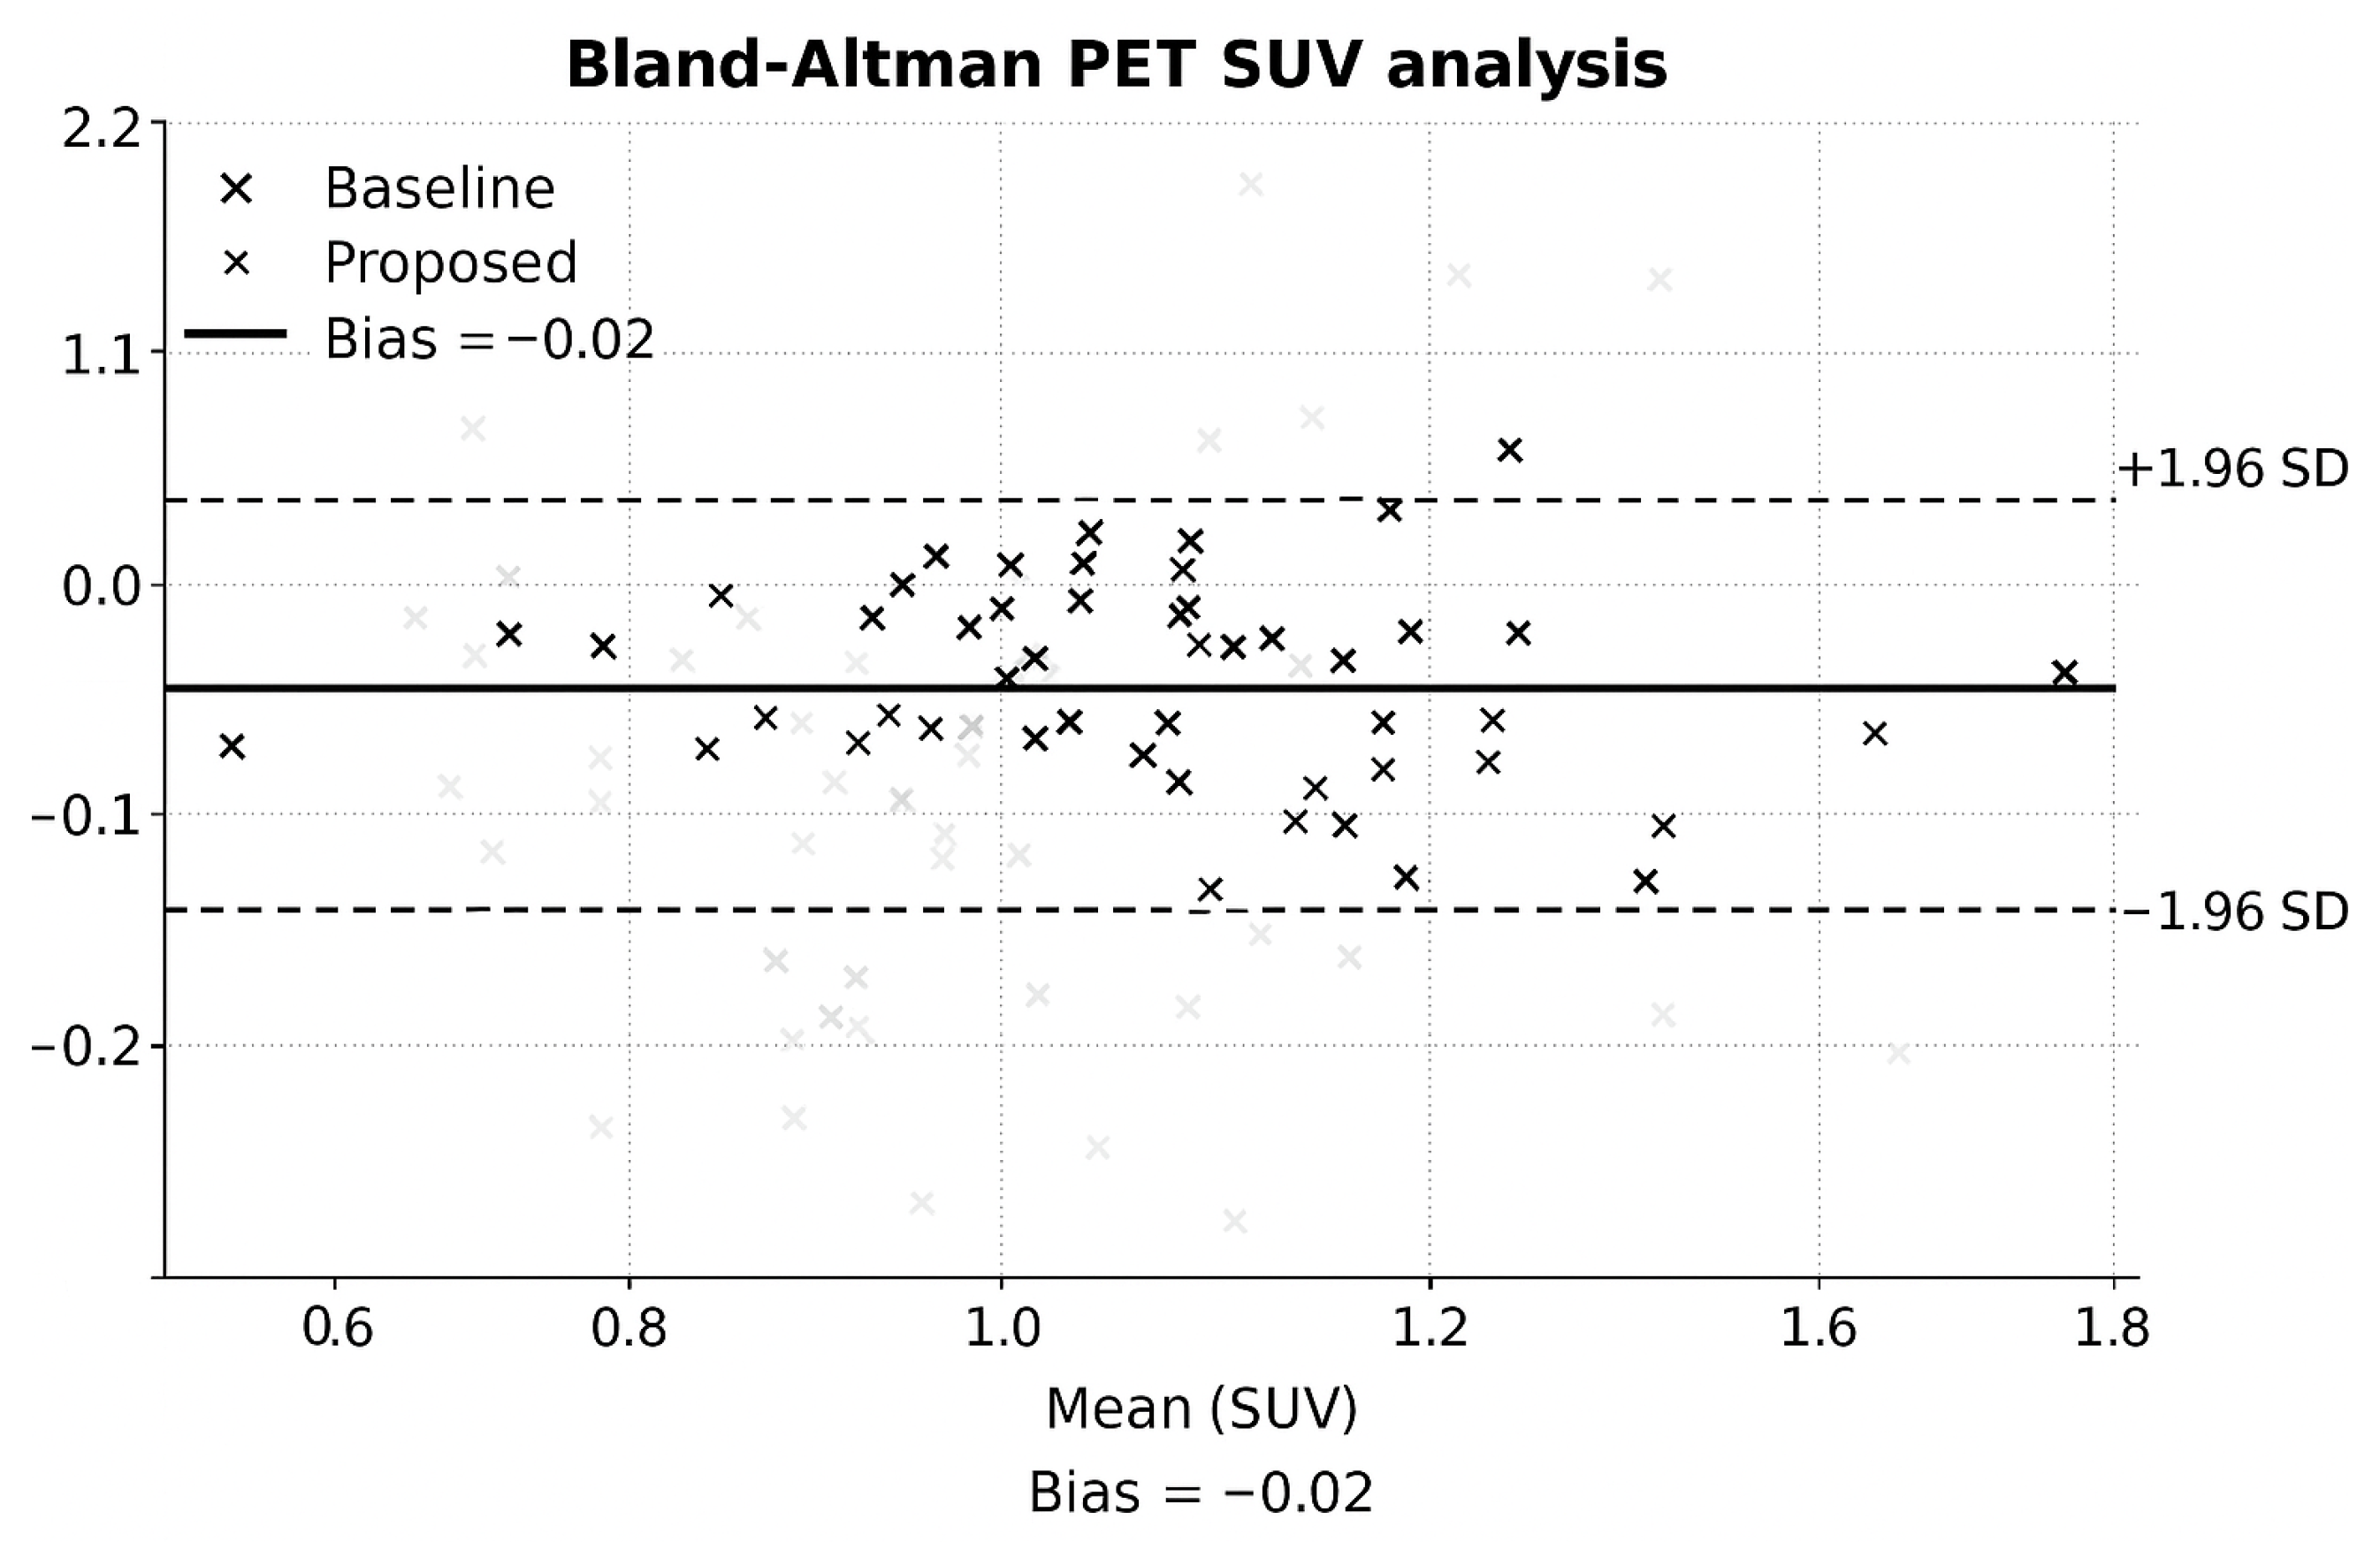
Bland–Altman plots (
Figure 5) revealed minimal PET bias and narrow agreement intervals.
5.6. Qualitative Results
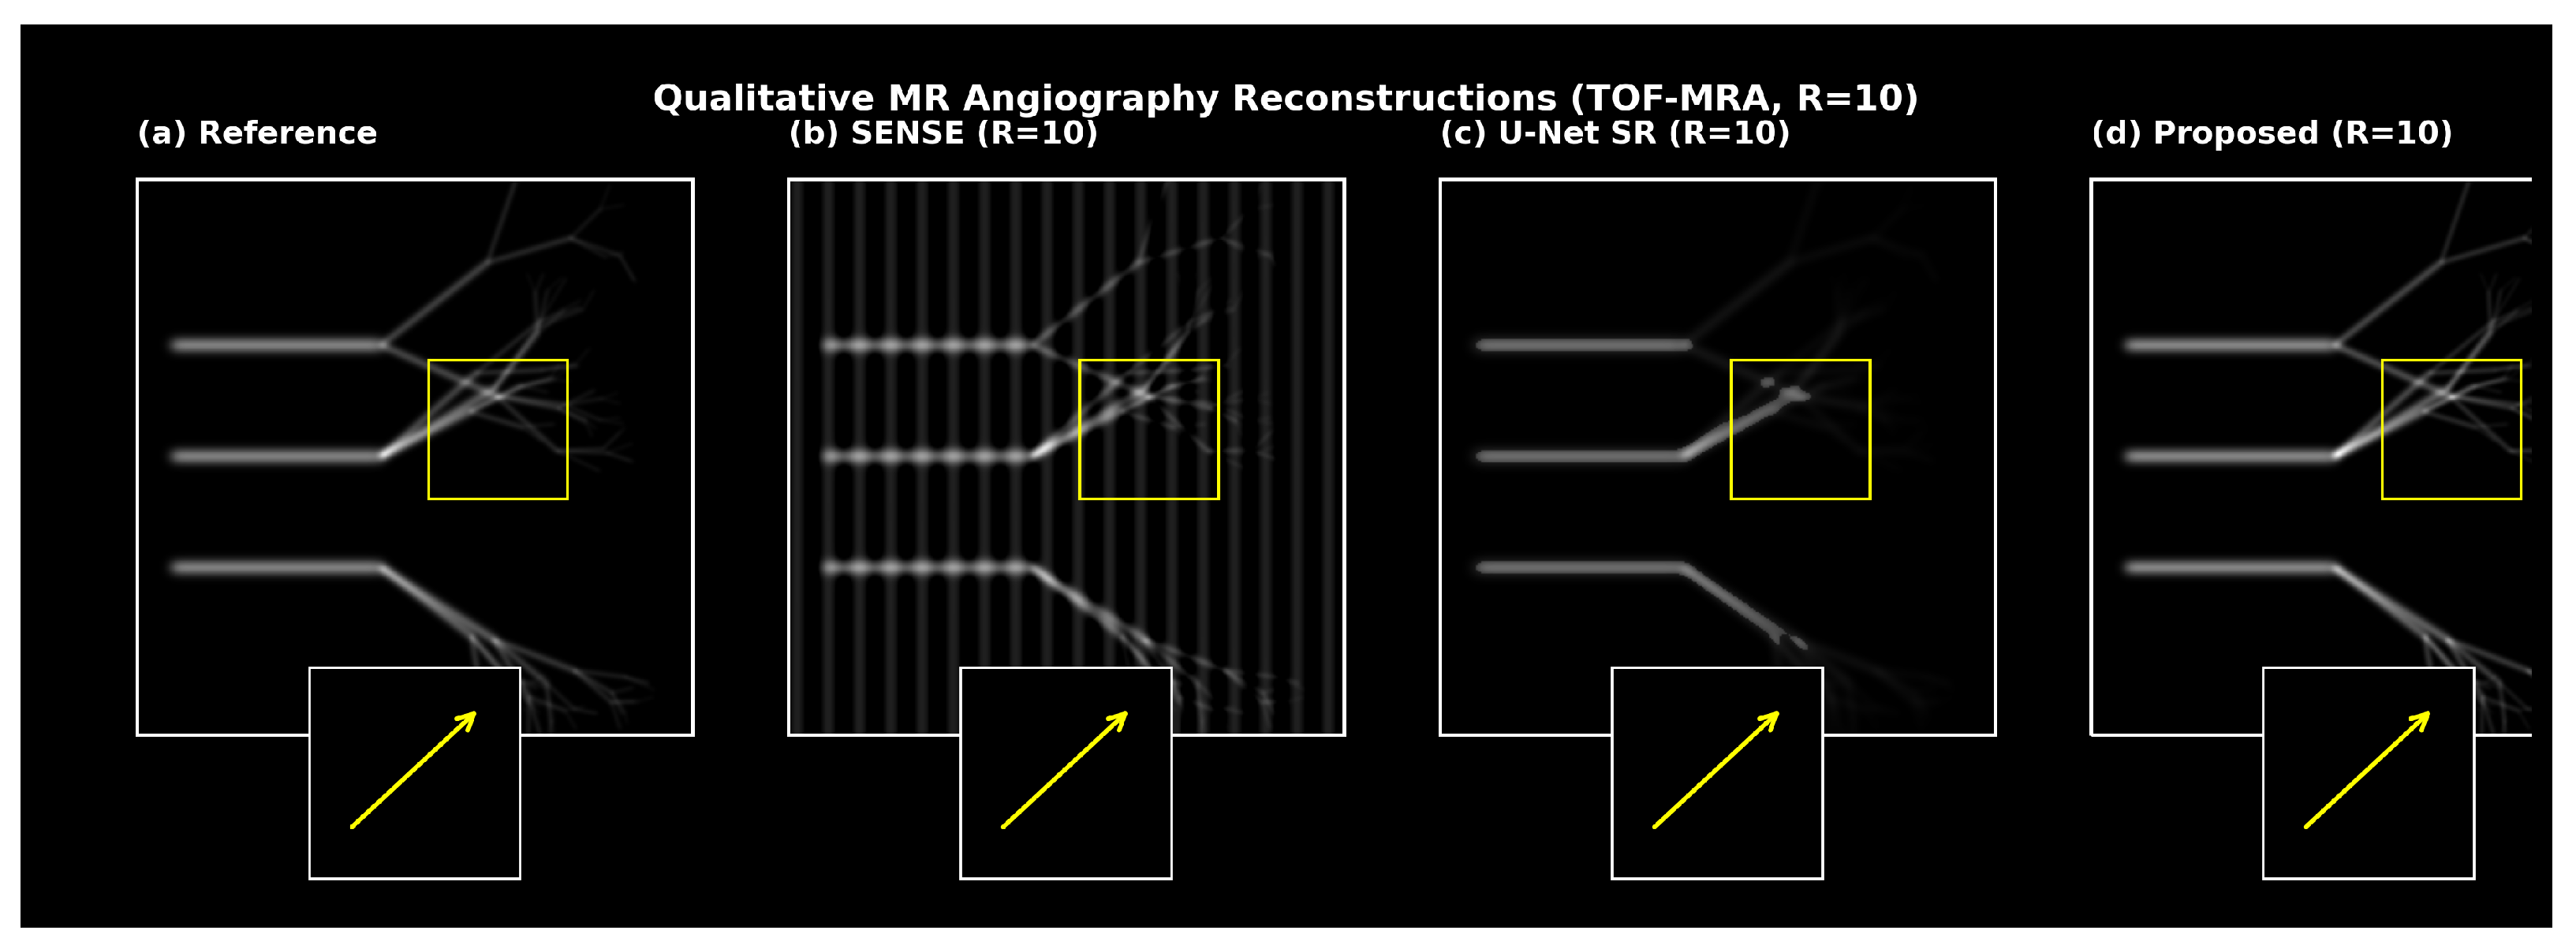
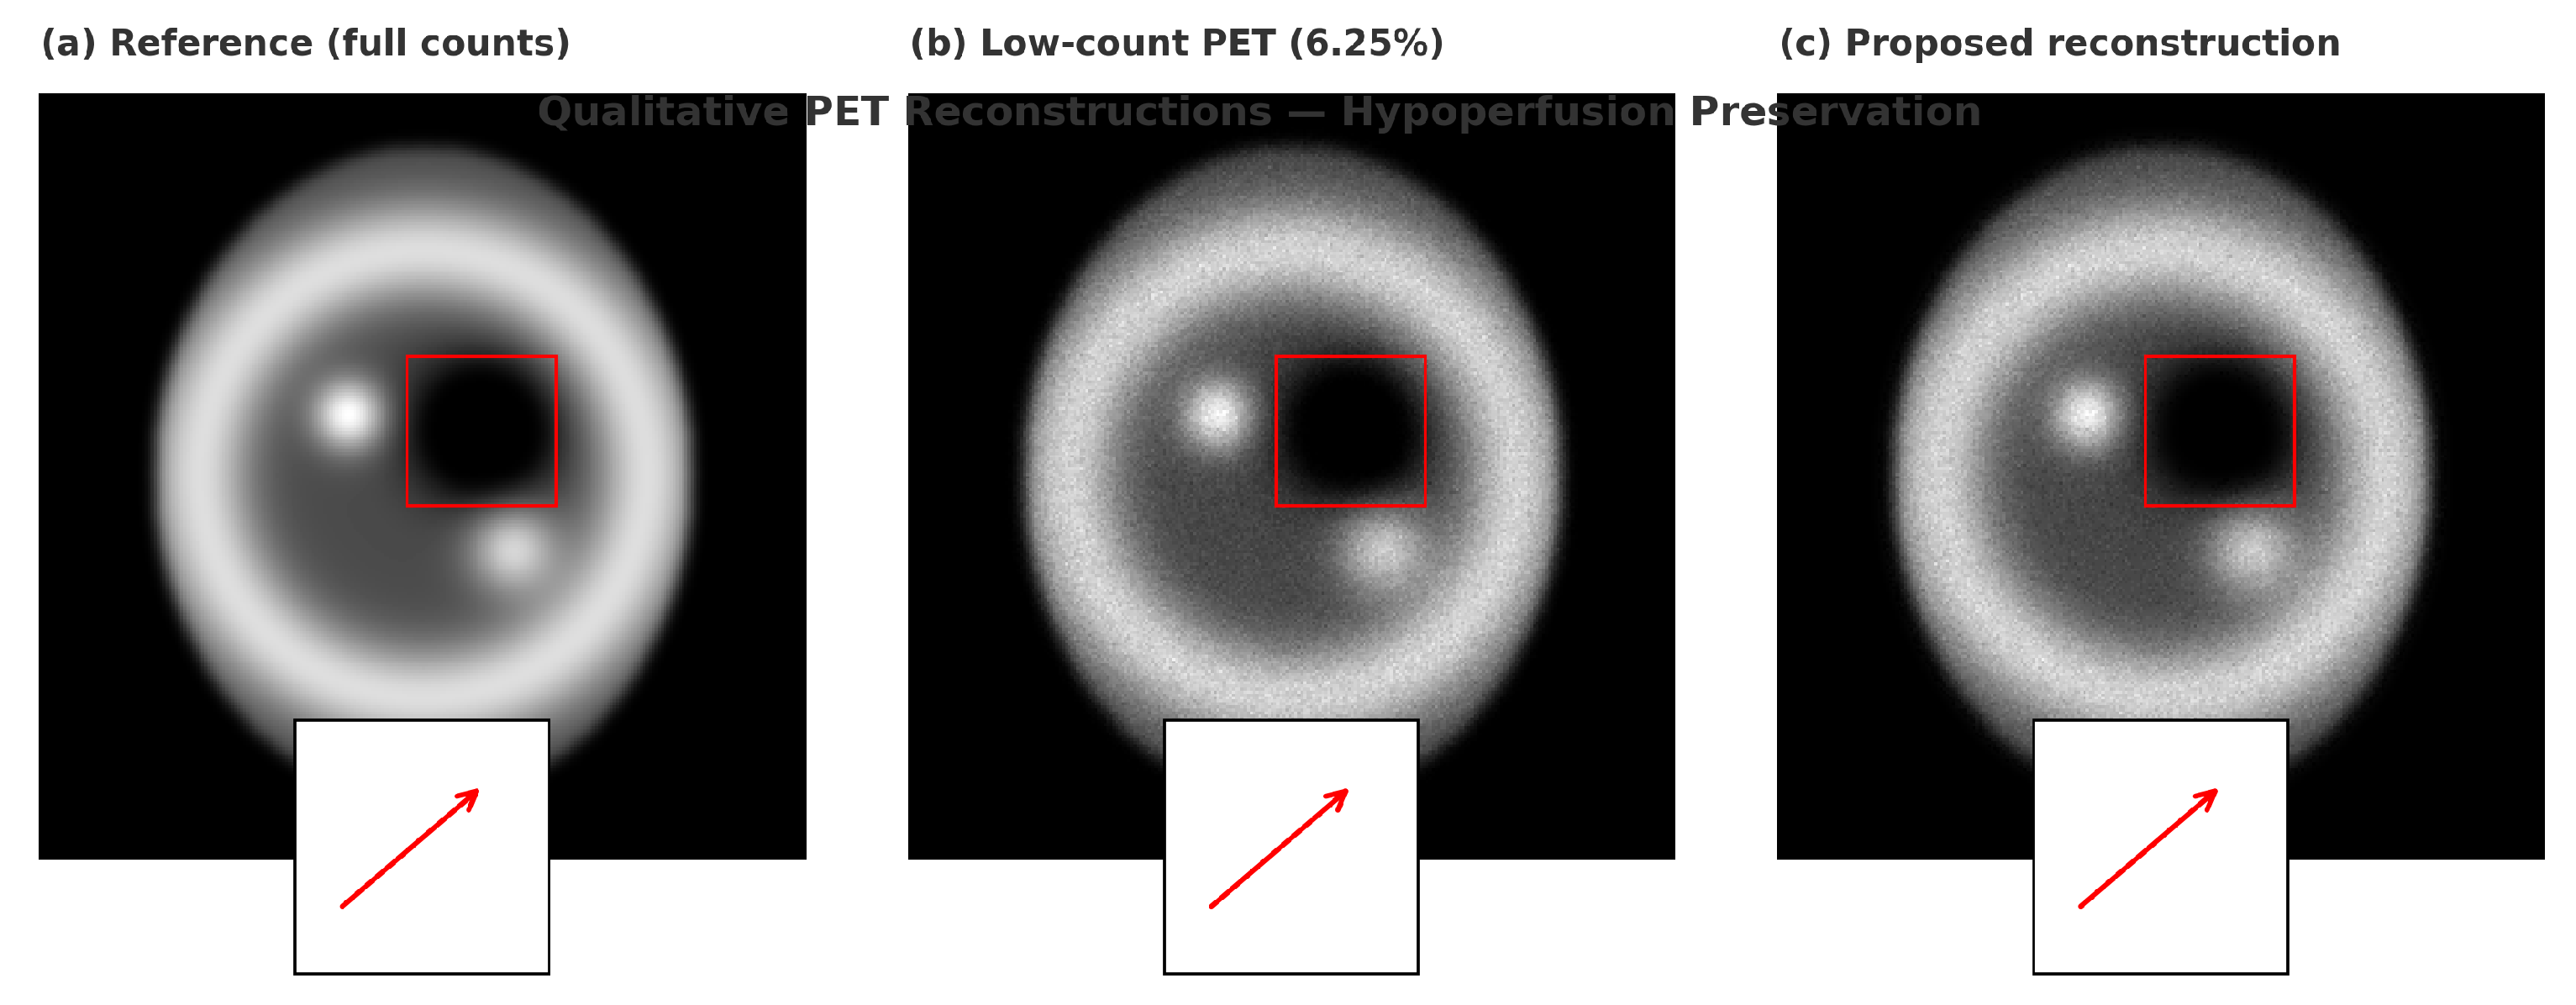
Qualitative reconstructions (
Figure 6 and
Figure 7) showed preserved distal vessels and clear perfusion patterns. Results were visually validated by clinical collaborators.
5.7. Phantom and Clinical Validation
Phantom and in vivo results (
Figure 8 and
Figure 9) demonstrated effective generalization to unseen scanner configurations.
5.8. Ablation Studies
Ablation studies (
Table 6) verified that each architectural component contributed to overall performance. The Hankel prior, cross-attention, and physics consistency modules yielded complementary benefits.
6. Quantitative Results
This section presents a comprehensive evaluation of the proposed vascular-aware joint MR–PET reconstruction pipeline. Performance is reported across four domains: (1) generic image quality, (2) vascular topology preservation, (3) PET quantitative fidelity, and (4) clinically relevant stroke diagnostics. A total of 18 clinical and 42 synthetic MR–PET cases were used in the held-out test set, with 10 additional cases reserved for validation; consistent trends were observed in the clinical subset and the synthetic subset.
6.1. Quantitative Reconstruction Performance
Table 2 summarizes generic MR reconstruction quality across acceleration factors
. The proposed method achieved the highest PSNR and SSIM at every acceleration level. Improvements were especially pronounced at
, where competing methods experienced severe aliasing, loss of small vessels, and reduced contrast, see
Table 7.
To verify robustness in both data sources, a subset analysis was performed.
6.2. Vascular Structure Preservation
Table 3 reports MR vascular fidelity metrics for
. The proposed method achieved the highest vessel sharpness index (VSI), branch completeness ratio (BCR), and topological similarity (TS), confirming superior preservation of small distal branches.
Persistent homology barcodes (
Figure 4) further confirmed that the proposed reconstruction preserved both
(connected vessels) and
(loops), including the circle of Willis.
6.3. PET Functional Metrics
Table 4 presents PET performance at 6.25% of full counts. The proposed method yielded the highest SUV recovery, contrast recovery, and metabolic gradient fidelity.
6.4. Clinical Task Performance
Table 5 summarizes LVO detection, collateral scoring, and perfusion mismatch classification. The proposed method achieved the highest accuracy and agreement with expert labels.
6.5. Bland–Altman Analysis
Figure 5 shows Bland–Altman plots demonstrating minimal PET bias and tight agreement intervals for the proposed reconstruction.
6.6. Qualitative Results
Figure 6 and
Figure 7 present qualitative comparisons demonstrating preserved distal vessels and clearer perfusion deficits.
6.7. Phantom and Clinical Validation
Phantom and real-case validation (
Figure 8 and
Figure 9) further confirmed robustness.
6.8. Ablation Studies
Ablation results (
Table 6) verified that each core component contributed to final performance.
7. Discussion
The proposed vascular-aware MR–PET reconstruction framework demonstrates that physics-informed, multimodal deep learning can substantially improve image quality and diagnostic utility for acute stroke assessment. The findings, their clinical implications, relationship to prior work, limitations, and potential future extensions are discussed below.
7.1. Implications for Acute Stroke Imaging
The results indicate that accelerated multimodal imaging does not inherently require a loss of diagnostic information. By preserving distal vessel continuity and accurate perfusion metrics under aggressive undersampling, comprehensive angiographic and functional information can be obtained within a substantially reduced time window. With sampling reductions of at least 40%, a complete MR angiographic and PET protocol could be achieved in under five minutes, helping maintain decision-making within the thrombectomy treatment window.
Because the proposed reconstruction produces co-registered and mutually reinforcing MR and PET outputs, it could realistically be deployed on hybrid MR–PET systems. In practice, this may reduce reliance on sequential MR and CT perfusion acquisitions by providing structural and functional maps in a single scan, thereby shortening workflow latency. Improved depiction of distal branches may support earlier identification of subtle or distal occlusions, while accurate low-dose PET perfusion mapping may reduce tracer burden or enable repeated perfusion snapshots to monitor disease evolution.
Workflow Integration: The reconstruction could be inserted directly after raw data acquisition on current hybrid MR–PET scanners, generating angiographic and perfusion maps within seconds of scan completion. By replacing sequential multimodality steps with a single accelerated exam, the method has the potential to reduce imaging delays and support faster treatment triage in the acute stroke setting.
7.2. Comparison with Prior Work
The framework builds on earlier joint MR–PET methods that employed joint sparsity or dictionary-based priors [
18], which often oversmoothed fine anatomical structures. In contrast, the combination of low-rank Hankel constraints and cross-attention fusion enabled selective feature sharing and improved vascular topology preservation. Previous deep learning approaches largely focused on single modalities [
33,
56]; the present findings highlight that multitask training, vessel-aware losses, and strict data consistency mitigate hallucination, a concern raised in prior reviews [
57]. Finally, the incorporation of learned undersampling masks extends principles from Bahadir et al. [
53] to a dual-modality context aligned with current trends in AI-guided acquisition.
7.3. Limitations and Future Work
Several limitations should be acknowledged. Although both clinical and synthetic data were used, the dataset size remains modest; multi-center studies will be required to fully assess generalizability. While no clinically consequential hallucinations were observed, adversarial models may introduce subtle artifacts; future work will explore uncertainty quantification, invertible network architectures, or Bayesian strategies to provide stronger guarantees against hallucination. Although inference is rapid (under 10 s for a MRA with associated PET frames), training remains computationally intensive due to the physics-consistency steps.
The retrospective design of the clinical evaluation is another limitation. Reader studies and prospective validation will be necessary to assess whether improvements in image quality translate into faster decision-making, higher diagnostic confidence, or better clinical outcomes. Extensions to additional stroke-relevant sequences (e.g., diffusion- and perfusion-weighted MRI) could produce a unified reconstruction of vasculature, diffusion core, and perfusion deficit. Graph-based vascular priors or physiology-inspired constraints may further improve topological accuracy, and emerging generative paradigms such as diffusion models may enhance robustness and uncertainty estimation.
Clinical Impact
The proposed vascular-aware MR–PET reconstruction has the potential to shorten door-to-treatment time by providing high-quality angiographic and perfusion information from a single rapid acquisition. By improving distal vessel depiction, maintaining quantitative perfusion accuracy, and producing inherently co-registered multimodal outputs, the framework may reduce reliance on multiple sequential exams and streamline thrombectomy or thrombolysis decision-making [
4]. Because it operates directly on hybrid MR–PET data, the method is compatible with existing scanner workflows, offering a realistic path toward clinical integration in comprehensive stroke centers.
In summary, the proposed framework moves toward fast, reliable multimodal reconstructions suitable for time-critical stroke imaging. By combining physics consistency, topology preservation, and cross-modal feature integration, it offers a pathway to shorten acquisition time while maintaining clinically relevant fidelity. Continued validation and workflow integration will determine its eventual impact on acute neuroimaging practice.
8. Reproducibility & Availability
To support reproducibility, a structured description of the hyperparameters, training curriculum, and data preparation steps (including synthetic undersampling and low-count simulation) is provided within this manuscript. The framework was implemented as a modular pipeline with three interchangeable components: (i) physics-consistent projection blocks, (ii) cross-modal fusion modules, and (iii) topology-preserving loss terms. This design enables ablation, backbone replacement, or substitution of priors without altering the overall training logic.
A minimal configuration includes the Adam optimizer (learning rates of for the generator and for the discriminator), exponential moving average of network weights, gradient clipping, and a curriculum progressing from pixel fidelity to adversarial and finally task-specific losses. Learned sampling was applied using a small update step to ensure stable mask optimization. For scenarios in which clinical data cannot be released, a detailed protocol is provided for replicating the synthetic experiments from fully sampled public datasets using matched undersampling factors and count-thinning rates. This enables fair benchmarking of alternative reconstruction strategies under comparable conditions.
9. Conclusions
A physics-informed, topology-preserving adversarial framework for joint MR–PET reconstruction tailored to early stroke detection has been presented. The method integrates compressed sensing concepts (structured Hankel low-rank priors and learned sampling) with multimodal generative modeling (GAN-based reconstruction with cross-attention fusion) to recover high-quality angiographic and perfusion images from highly undersampled acquisitions. In contrast to conventional approaches, the framework preserves the continuity of fine vascular networks and maintains quantitative PET accuracy without introducing spurious structures.
Across a diverse evaluation set, the method consistently outperformed MR-only, PET-only, and prior joint reconstruction baselines, yielding sharper MRA, improved PET uptake estimates, and superior performance on clinically relevant tasks such as LVO detection and collateral assessment. Ablation experiments demonstrated that each module—from the joint Hankel prior to the vessel-aware loss functions and physics-consistency projections—contributed meaningfully to the final performance, underscoring the value of a unified, physics-respecting formulation.
These results demonstrate that accelerated multimodal stroke imaging is feasible without compromising diagnostic content, and that topology-aware, cross-modal reconstruction can support faster and more comprehensive MR–PET workflows. Future work will extend the framework to incorporate additional stroke-relevant contrasts and pursue prospective clinical validation. The principles introduced here—particularly topology preservation and synergistic multimodal fusion—may generalize to other domains in which reliable, high-fidelity multimodal imaging is critical in time-sensitive care pathways.
