1. Introduction
Road safety relies heavily on clear information provided to drivers through traffic signs and road markings. These visual cues regulate traffic flow, support navigation, and prevent accidents. Modern advanced driver assistance systems (ADASs) also require accurate recognition of such elements in order to support safe driving. According to the SAE classification of driving automation, there are six levels (0–5) [
1]. Current vehicles typically reach only level 3, while levels 4 and 5 represent true autonomy. Reliable perception of road markings is therefore essential for further progress toward higher levels of automation. Among the various types of road signs, horizontal markings such as arrows, pedestrian crossings, and stop lines play a particularly direct role in guiding driver maneuvers. Despite their importance, horizontal markings have attracted less research attention than vertical signs and lane boundaries.
Current ADAS solutions and autonomous driving prototypes rely on a combination of sensors including radar sensors, cameras, and LiDAR instruments [
2,
3,
4,
5,
6]. Cameras are the most common and cost-effective option, as they capture high-resolution visual information that can be processed using computer vision methods. Classical image processing was widely used in earlier systems, but in recent years, deep learning methods have become dominant for tasks such as object detection and semantic segmentation [
7,
8,
9,
10,
11]. These approaches enable the recognition of a wide range of objects relevant for traffic safety, including pedestrians, vehicles, traffic lights, and traffic signs.
Traffic sign recognition has been extensively studied, but the emphasis has largely been on vertical signs [
12,
13,
14,
15]. Datasets and benchmarks exist for many categories of vertical signs, and numerous models have been evaluated in this area. In contrast, horizontal markings have received far less attention. Existing works mostly focus on lane markings, motivated by lane-keeping assistance [
16,
17] and automated parking scenarios [
18,
19]. Other contributions address the quality and maintenance of markings [
20,
21,
22]. It is difficult to find publications that address the automatic detection of arrows and other directional symbols painted on the road surface, even though they provide essential information for safe maneuvering in both urban and highway environments.
The recognition of horizontal markings presents unique challenges. Markings vary widely in appearance, depending on paint material, traffic load, and weather exposure. They may be new and reflective, or faded, dirty, and partially erased. Their visibility also depends on distance and perspective: markings that are far ahead in the driving scene appear small and difficult to distinguish, while those closer to the vehicle are large and clearly visible. Our dataset includes images covering the full scene, with annotations for markings not only on the lane of travel but also on adjacent lanes and on entry or side roads. This diversity requires models to detect markings across different scales and positions within the image. These factors make the task more complex than standard object detection of well-defined vertical signs.
Deep learning detectors of the YOLO family [
15,
23,
24,
25,
26,
27,
28,
29,
30,
31] have become a standard solution for real-time object recognition. Each version of YOLO introduces improvements in speed, accuracy, or model efficiency. Earlier research applied YOLOv4 to horizontal marking recognition [
20], but more recent models have not yet been systematically assessed for this application. Establishing baseline performance for YOLOv7, YOLOv8, and YOLOv9 on challenging data is therefore a necessary step.
Horizontal road markings play a critical role in supporting lane guidance, maneuver planning, and driver navigation, particularly in situations where vertical signs are absent, obstructed, or ambiguous. Therefore, reliable detection of such markings is essential for the maintenance of consistent perception in advanced driver assistance systems.
The aim of this study is to address this research gap. We introduce a dataset of 13,360 annotated images collected on Polish roads, including urban streets, rural roads, and highways, recorded under both sunny and cloudy conditions. The dataset covers nine classes of markings and contains many challenging cases, including small markings and surfaces with varying degrees of wear. Based on this dataset, we train and evaluate three YOLO models (YOLOv7, YOLOv8n, and YOLOv9t) and report their performance in terms of precision, recall, and mean average precision. The results provide baseline values for horizontal marking recognition and indicate the feasibility of robust horizontal marking detection for intelligent transportation systems.
2. Dataset
The dataset used in this study originates from the same collection of road images that was employed in our previous research on the visibility of horizontal road markings [
20]. The dataset has not been publicly released. In the present work, it was reused with a new division into training, validation, and test subsets and with updated annotations adapted to the object detection task. In the previous publication, only a few example images were presented for illustration purposes, whereas the complete dataset is used here for comprehensive training and evaluation of the YOLOv7, YOLOv8n, and YOLOv9t models.
The collection contains 6250 color images captured on Polish roads under real traffic conditions using a front-mounted camera. The images were recorded under diverse lighting conditions (sunny, cloudy, and partially shaded) and on both urban and rural roads. The image resolution is 1920 × 1080 pixels. Although no quantitative analysis of degradation levels was performed, the dataset includes road markings representing the full range of real-world visibility conditions—from newly painted and clearly visible markings to moderately worn, faded, or dirty markings, as well as heavily degraded markings requiring maintenance. This diversity ensures that the models are exposed to various appearance conditions during training and testing. The dataset also contains images in which markings are partially occluded by the vehicle’s hood or other road users. Although the frequency of such cases was not analyzed quantitatively, they provide valuable examples for evaluation of the robustness of detection under partial visibility.
The dataset consists of nine classes of horizontal road markings: a pedestrian crossing and eight types of directional arrows.
Figure 1 presents one example object from each class. Each image was manually annotated using the LabelImg tool following the YOLO annotation format [
32].
Figure 2 shows an example image with labeled objects, illustrating the annotation process used in the dataset.
In total, 13,360 objects were annotated and assigned to the nine classes. The detailed distribution of the number of annotated objects per class and their division into the training, validation, and test subsets are presented in
Table 1.
For model training, the dataset was divided into three subsets: 5000 images for training, 750 images for validation, and 500 images for testing. This division ensures a balanced representation of all classes and enables a reliable evaluation of the performance of the tested YOLO architectures.
The reuse of this dataset guarantees consistency in image acquisition parameters, such as camera position, perspective, and resolution, and allows for a fair comparison of the YOLO models under identical environmental conditions.
3. Convolutional Neural Networks
For the task of detecting and classifying objects in color images, three models were selected: YOLOv7, YOLOv8n, and YOLOv9t. These are pre-trained CNN models based on the COCO dataset, which includes 80 object classes. However, none of those classes corresponds to the specific objects analyzed in this study. As a result, it was necessary to modify the models to better suit the research objectives. The number of classes was reduced to nine, and their categories were adapted accordingly. Each model now predicts the probability that an object belongs to one of the nine classes shown in
Table 1. For this purpose, the models were fine-tuned on our own annotated dataset of horizontal road markings to maximize detection performance under local conditions.
The models—YOLOv7, YOLOv8n, and YOLOv9t—were trained over the course of 300 epochs. For each epoch, 5000 images from the training set were used. After completing every epoch, global parameters were fine-tuned using a validation set consisting of 750 images. To achieve robust training results, random image distortions were introduced, including mosaic augmentation applied in the initial phase. Additionally, the models were trained using a set of probabilistic augmentation techniques provided by the Albumentations library. These included blur, median blur, grayscale conversion, and CLAHE, each applied with a low probability (p = 0.01) to support robustness and generalization. This helped ensure that object detection and identification were not dependent on the object’s position within the image.
In the supervised learning process, two previously prepared image sets were used: the training set and the validation set. Each image was scaled to a size of 416 × 416 pixels during loading. Each of the selected models was implemented and trained according to its architecture and the corresponding default values of training parameters.
The YOLOv7 model consists of 314 layers, the majority of which are convolutional. As the network deepens, the number of feature maps—and, consequently, the number of parameters—increases progressively. Concatenation operations are also applied at various stages. In total, the model contains 36,524,924 parameters.
The YOLOv8n model comprises 225 layers and contains 3,012,603 parameters. Training was carried out using the SGD optimizer with the following values: lr = 0.01 and momentum = 0.9. The same optimizer was used for the third model, YOLOv9t, which consists of 917 layers and has 2,007,163 parameters. The YOLOv7 model was implemented in Python 3.10. The YOLOv8n and YOLOv9t models were developed using Python 3.11.11 and PyTorch 2.2.2+cu121. Training and testing processes were conducted on a workstation, belonging to the Czestochowa University of Technology, equipped with a 16-core AMD Ryzen 9 3950X processor running at 3.5 GHz with 32 GB of RAM and an NVIDIA GeForce RTX 3080 graphics card.
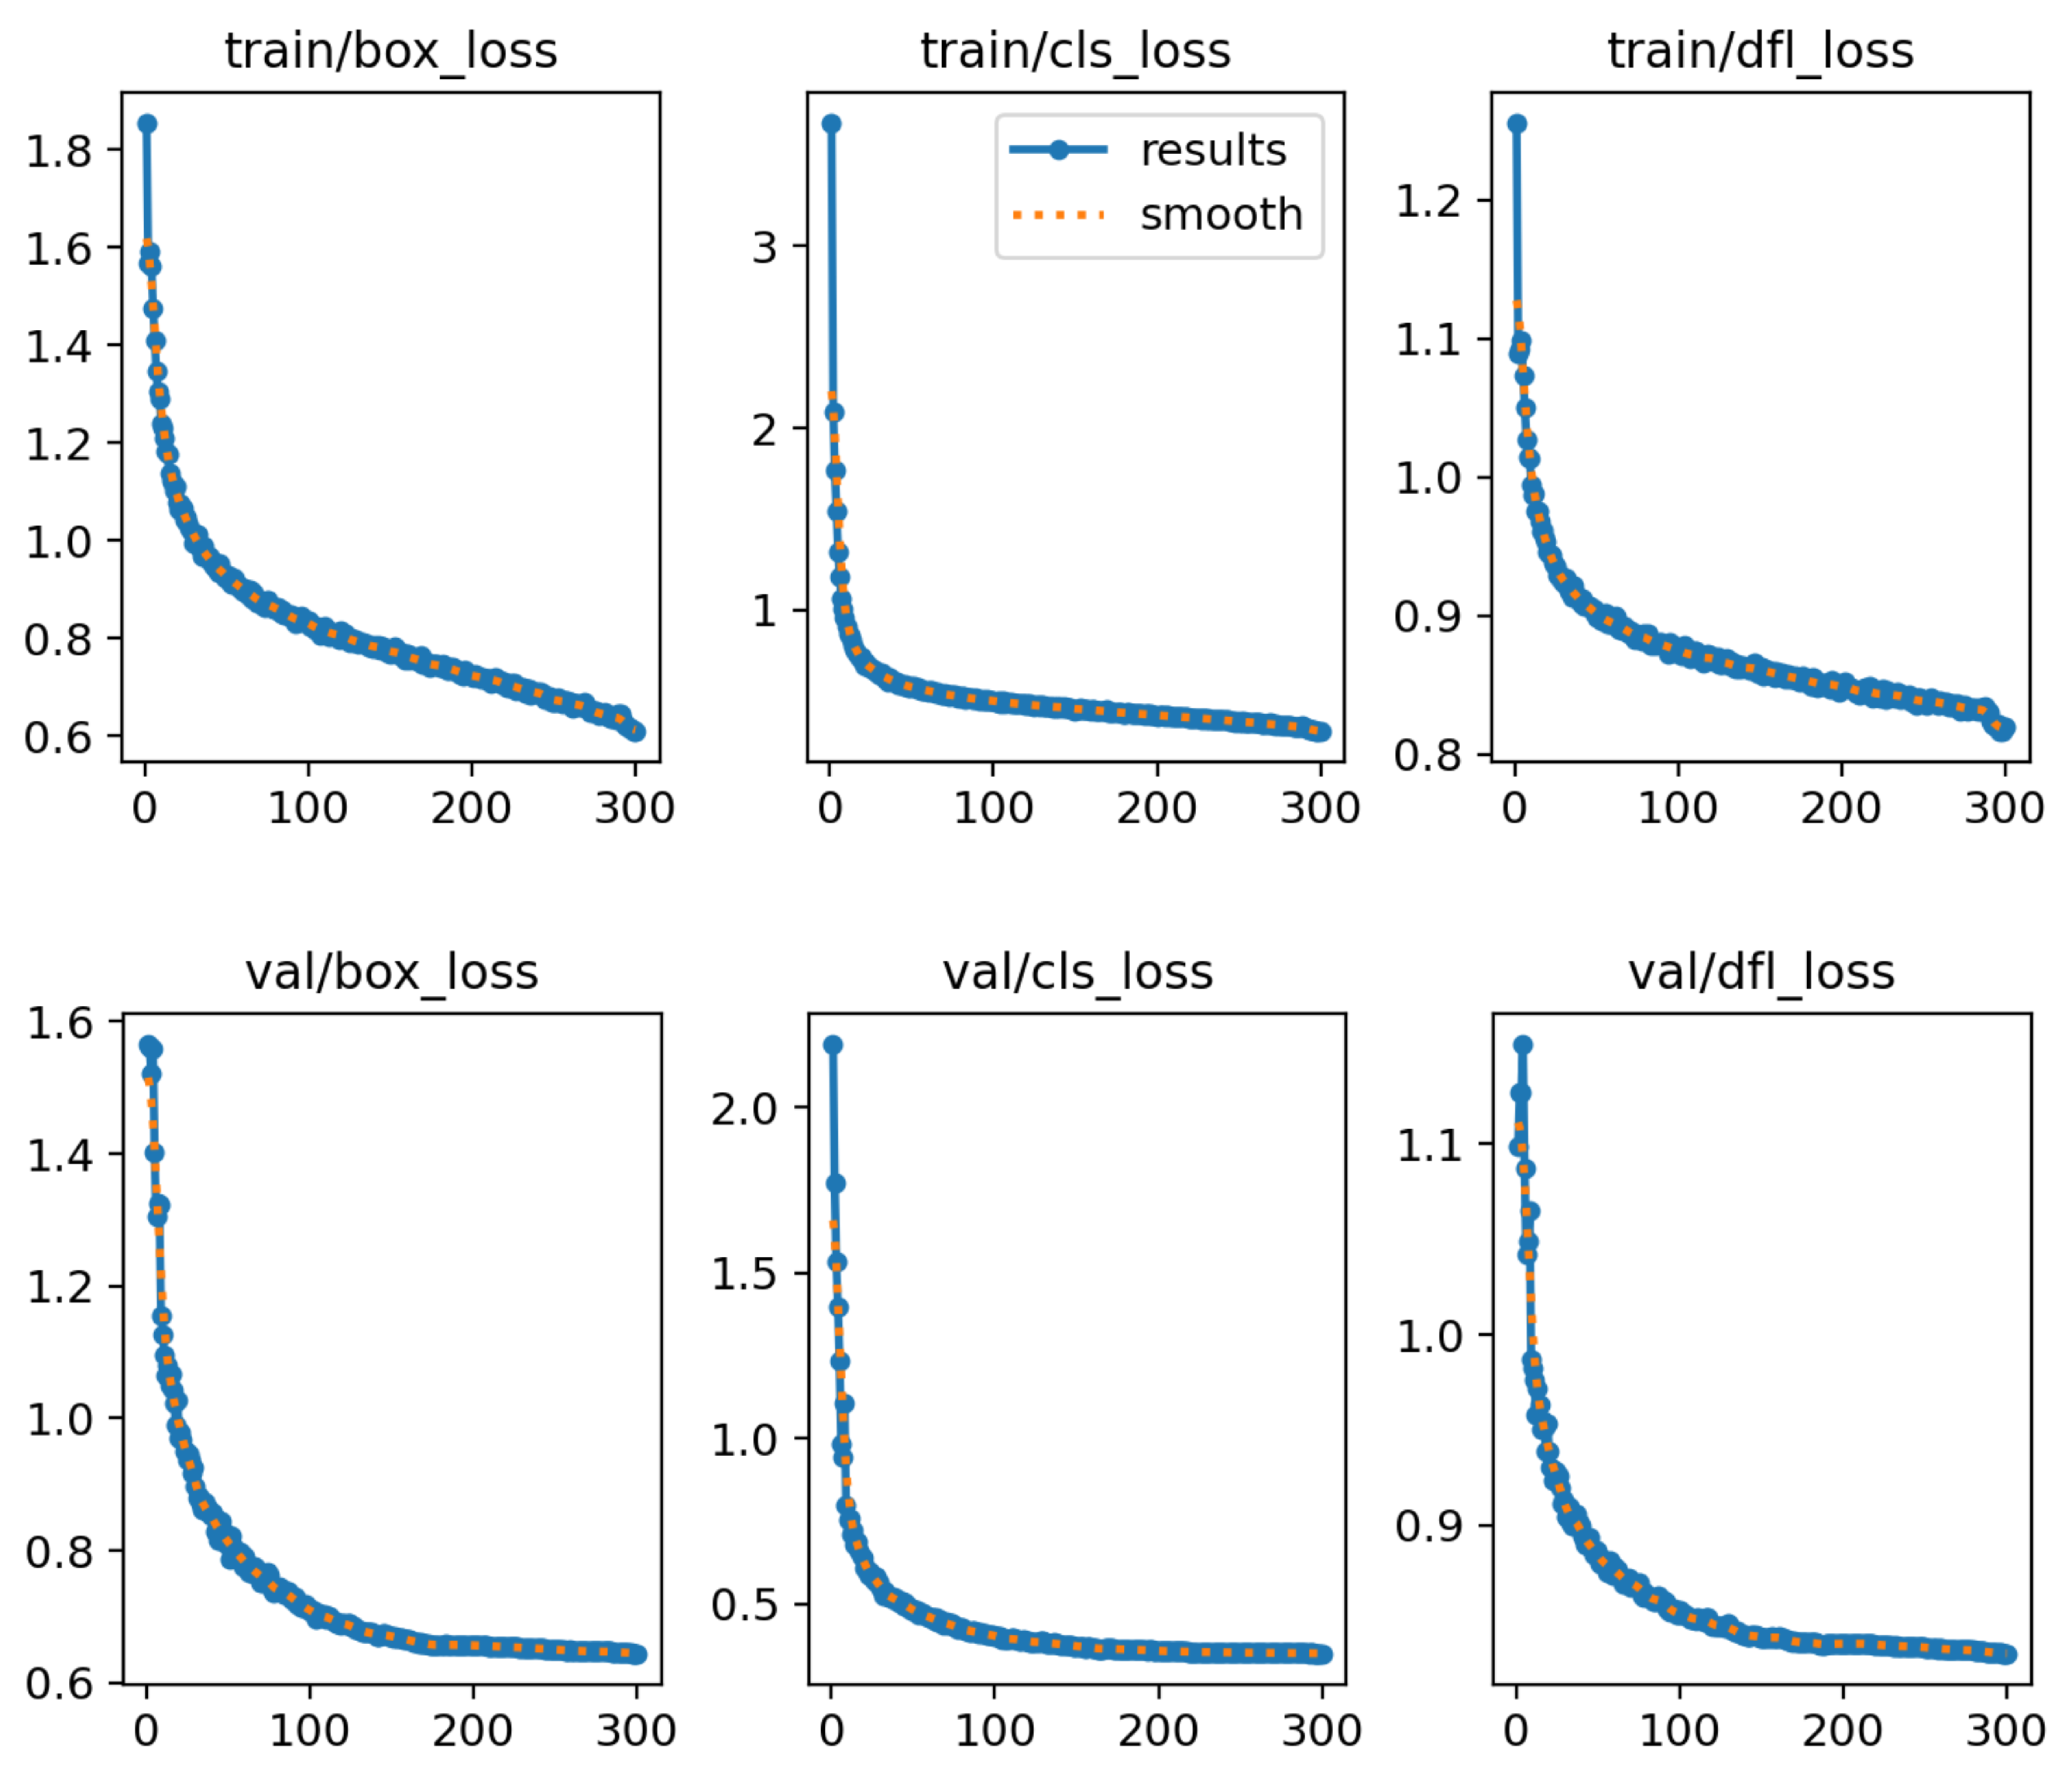
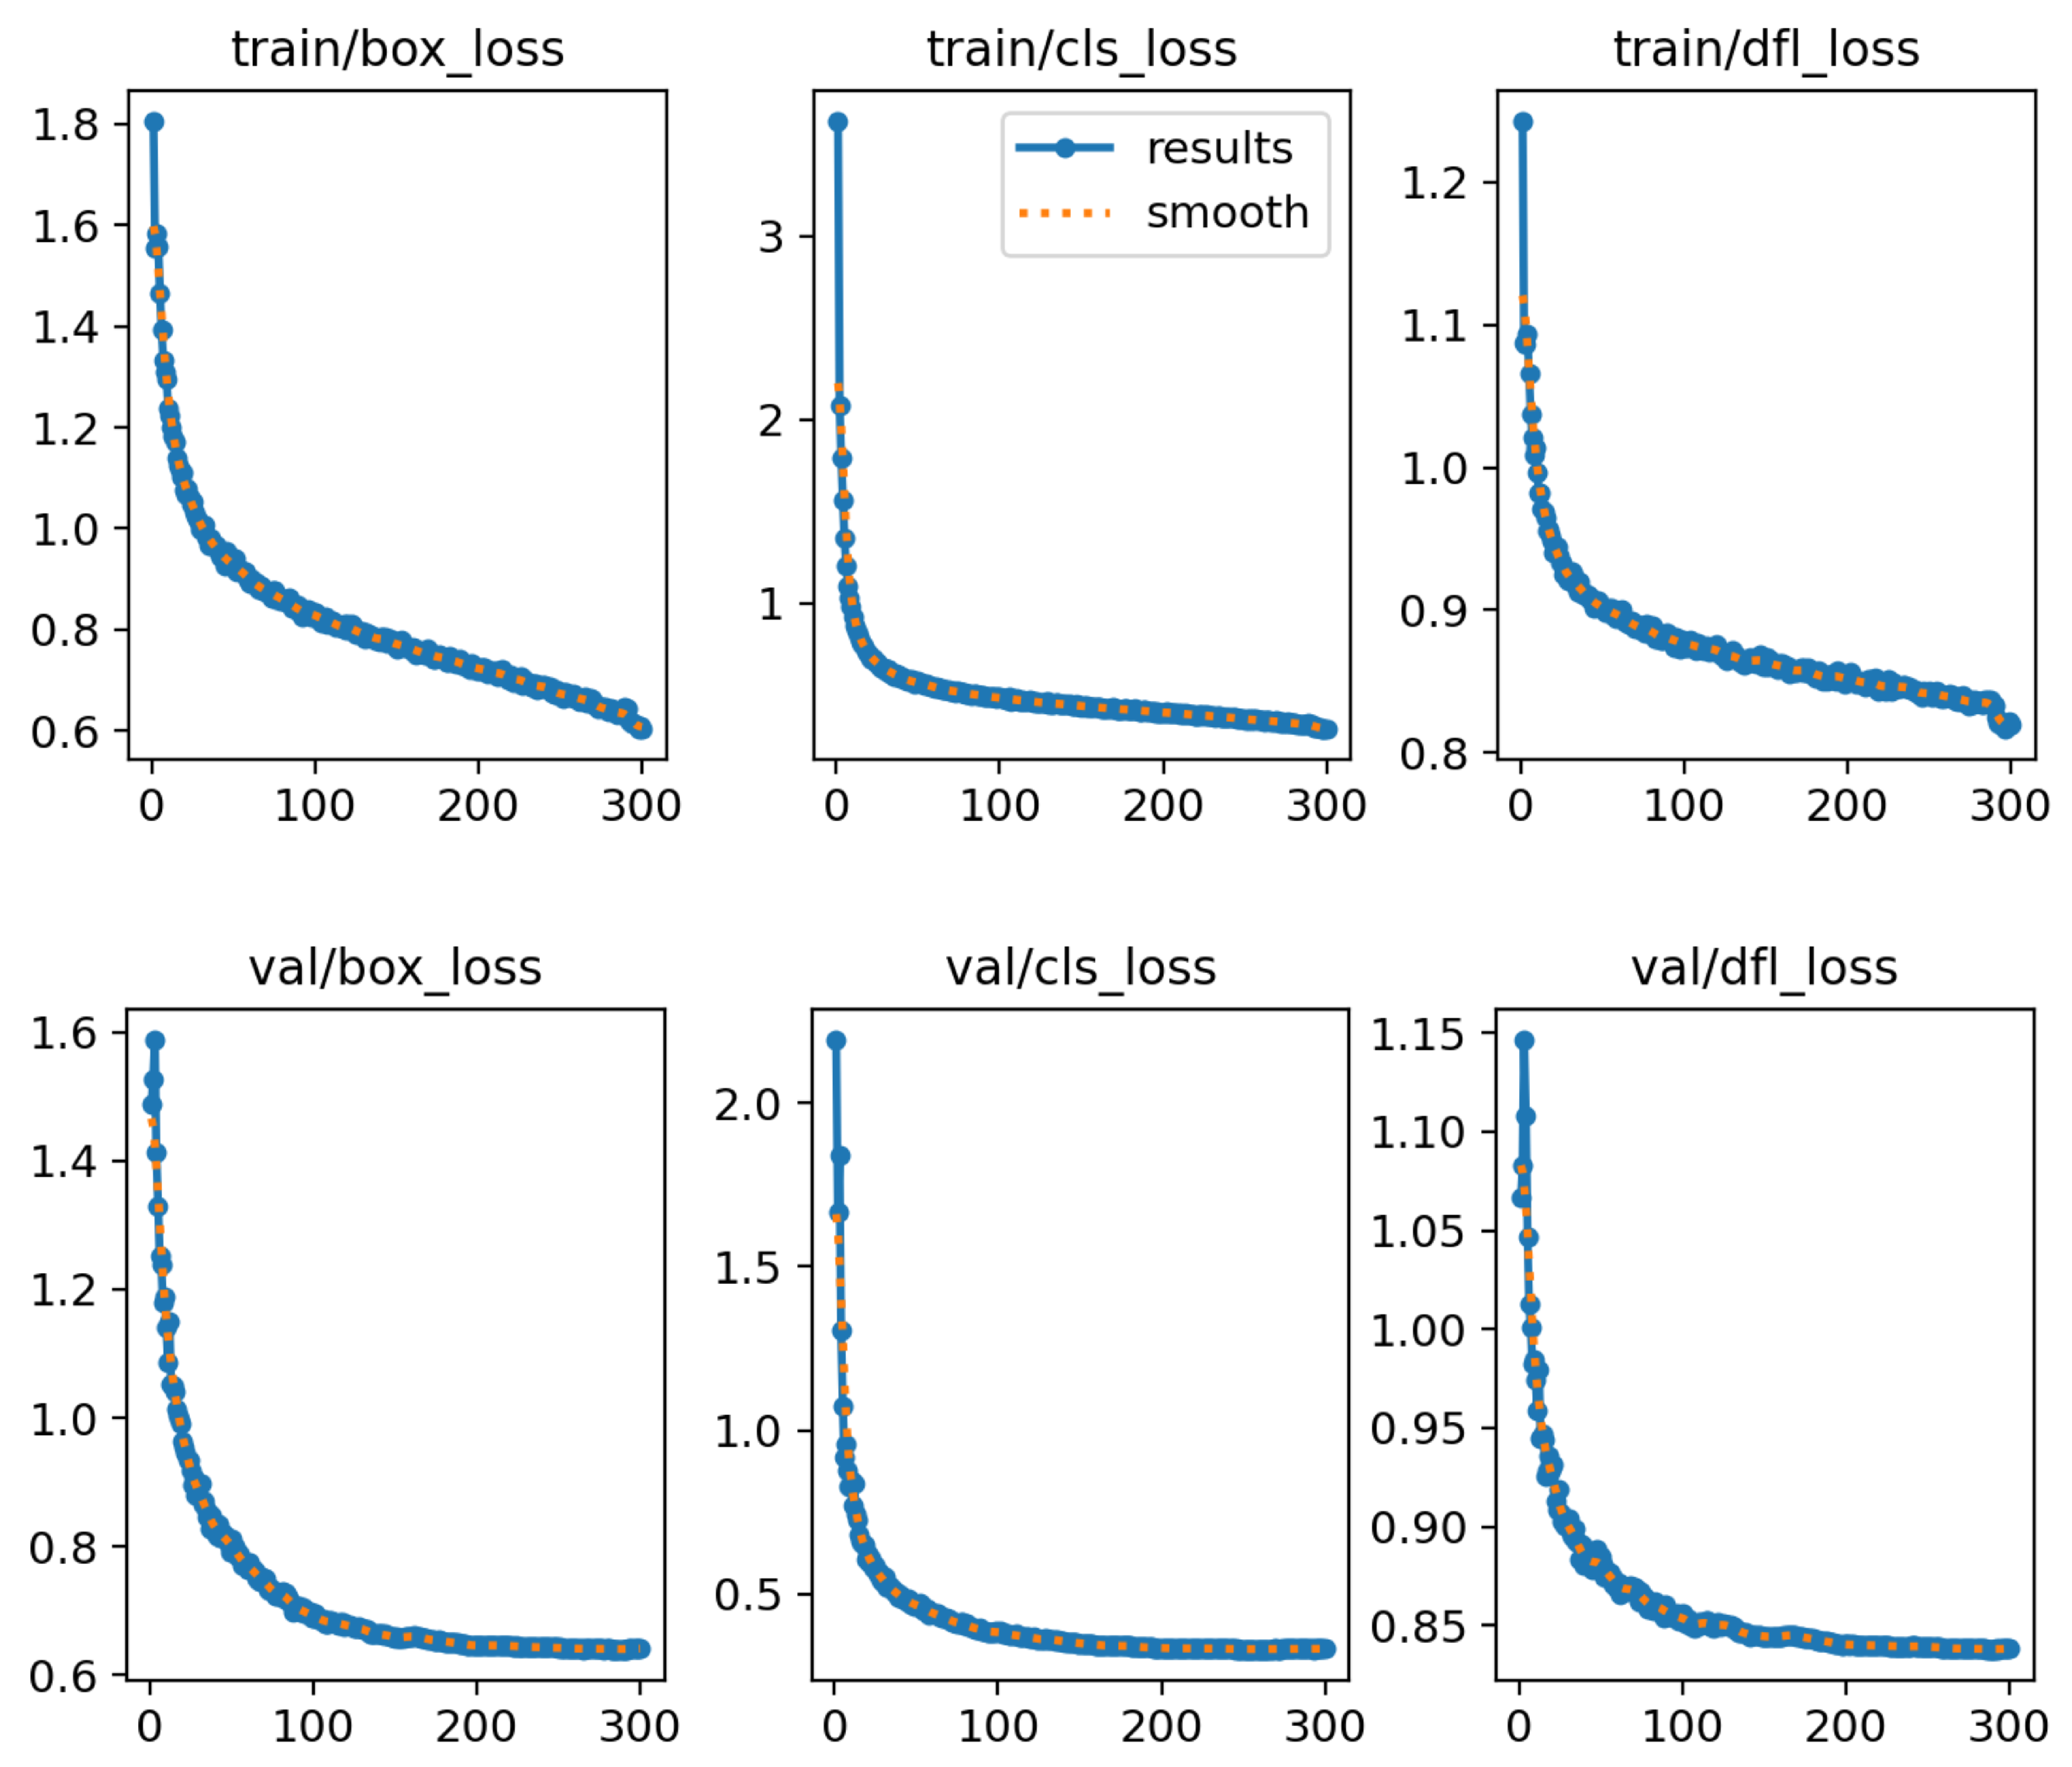
The results of the training and validation process are shown in
Figure 3 (YOLOv7),
Figure 4 (YOLOv8n), and
Figure 5 (YOLOv9t). These figures contain several plots showing the data collected during the training process for each epoch for each of the three models. It can be seen that there was some fluctuation in the early stages of training. However, as training progressed, the results began to converge more consistently. This is a typical phenomenon that occurs when using a model pre-trained on a different set of classes.
Figure 4 and
Figure 5 contain two additional plots showing the loss function with the DFL (Distribution Focal Loss) component used. This is a new component that tunes the coordinate accuracy (at the subpixel level) that was introduced after YOLOv8n. Overall, the training process went smoothly, and the plots in
Figure 3,
Figure 4 and
Figure 5 are very promising.
4. Testing and Analysis of the Obtained Results
Each of the trained models—YOLOv7, YOLOv8n, and YOLOv9t—performs detection and classification on both video streams and digital color images. Testing on video streams captured at 30 frames per second confirms that detection runs smoothly, indicating real-time capability. To ensure a fair comparison of accuracy, the three trained models were evaluated on the same test image set. None of the samples in this set was used during the training or validation phases.
The values in these tables represent absolute counts. Each diagonal entry contains the number of objects correctly classified into the respective class. Off-diagonal values indicate the number of detected objects that were assigned to incorrect classes. It is important to note that each of the three models made only two such misclassifications at the object level. This is a very good classification result for the objects detected by all three tested models.
Each matrix includes an additional column labeled FP (false positives) and a row labeled FN (false negatives). The FP column contains the number of objects wrongly assigned to a given class. These are objects that do not belong to any of the known classes, which is evident from their absence in other matrix columns. This suggests that these objects were detected by the model but not annotated in the ground truth. Such cases likely occurred because some small horizontal road markings were not labeled. These markings, although visible in the image, may have been too small to assign confidently to a class, even by a human annotator. Thus, the presence of nonzero FP values is more indicative of strong detection capability than weak classification accuracy.
The FN row contains the number of false negatives. These are objects visible in the images and labeled in the ground truth but not detected by the CNN model. This does not imply a classification error but, rather, a shortfall in detection.
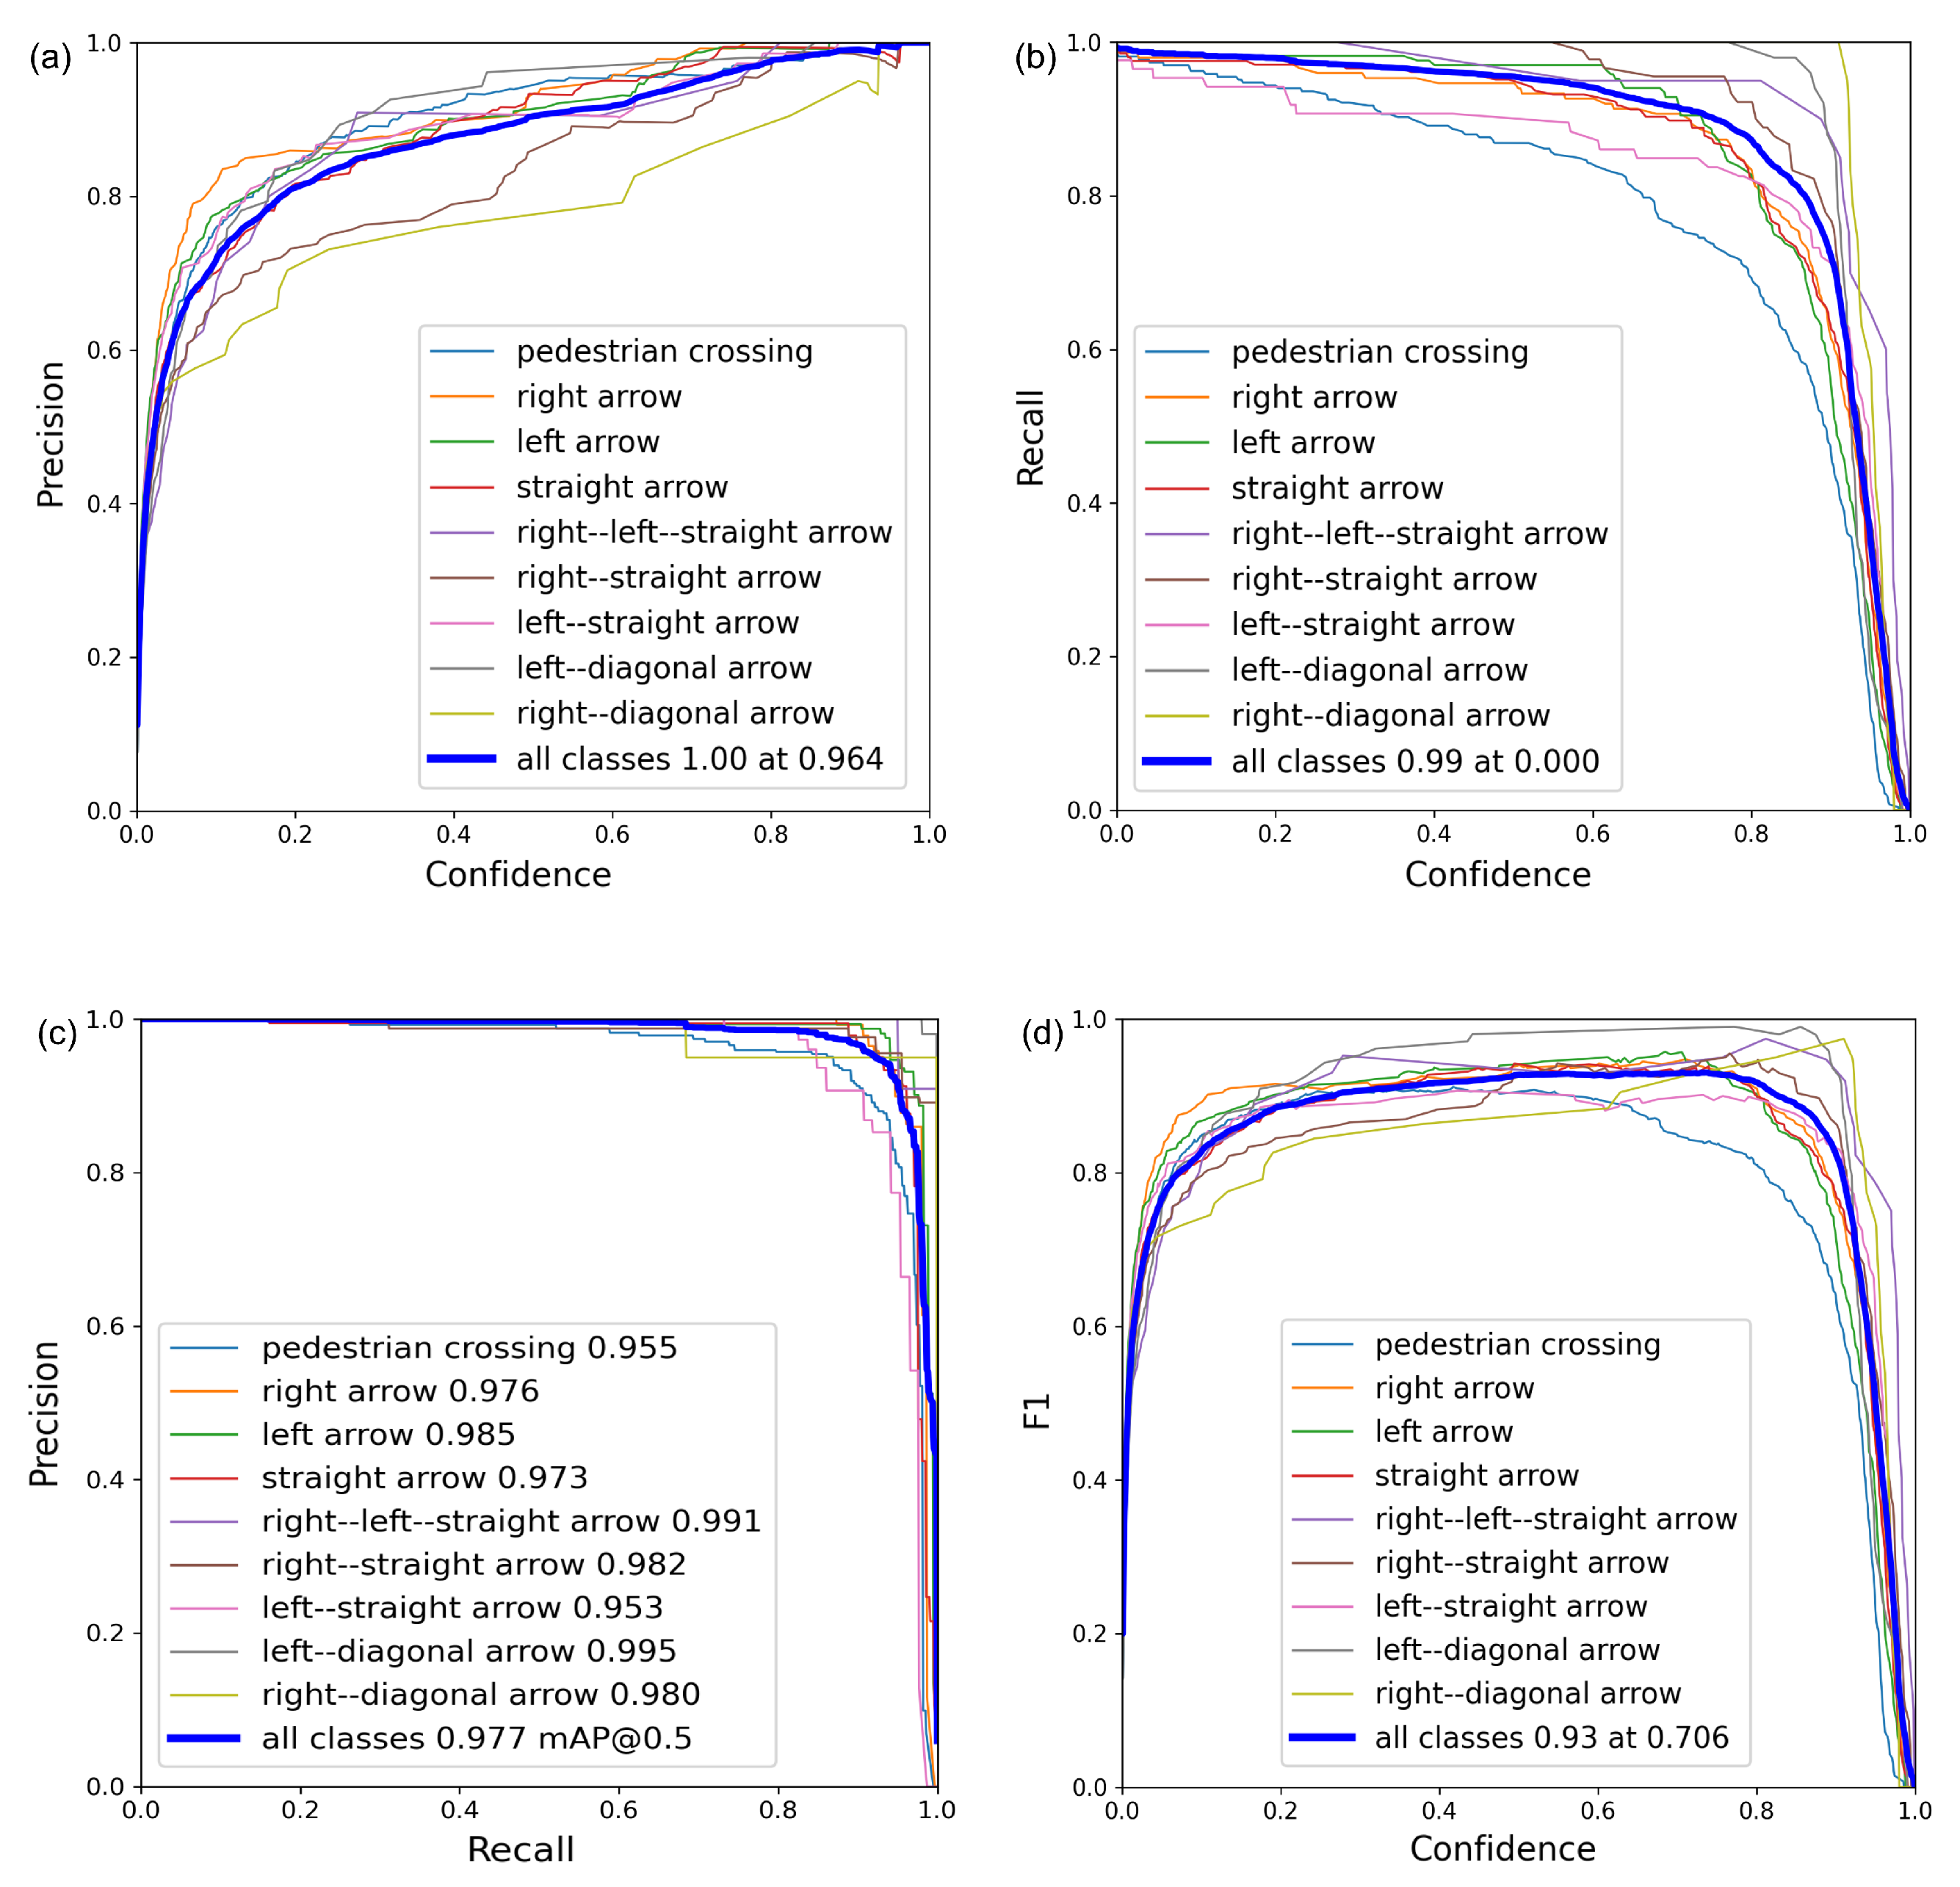
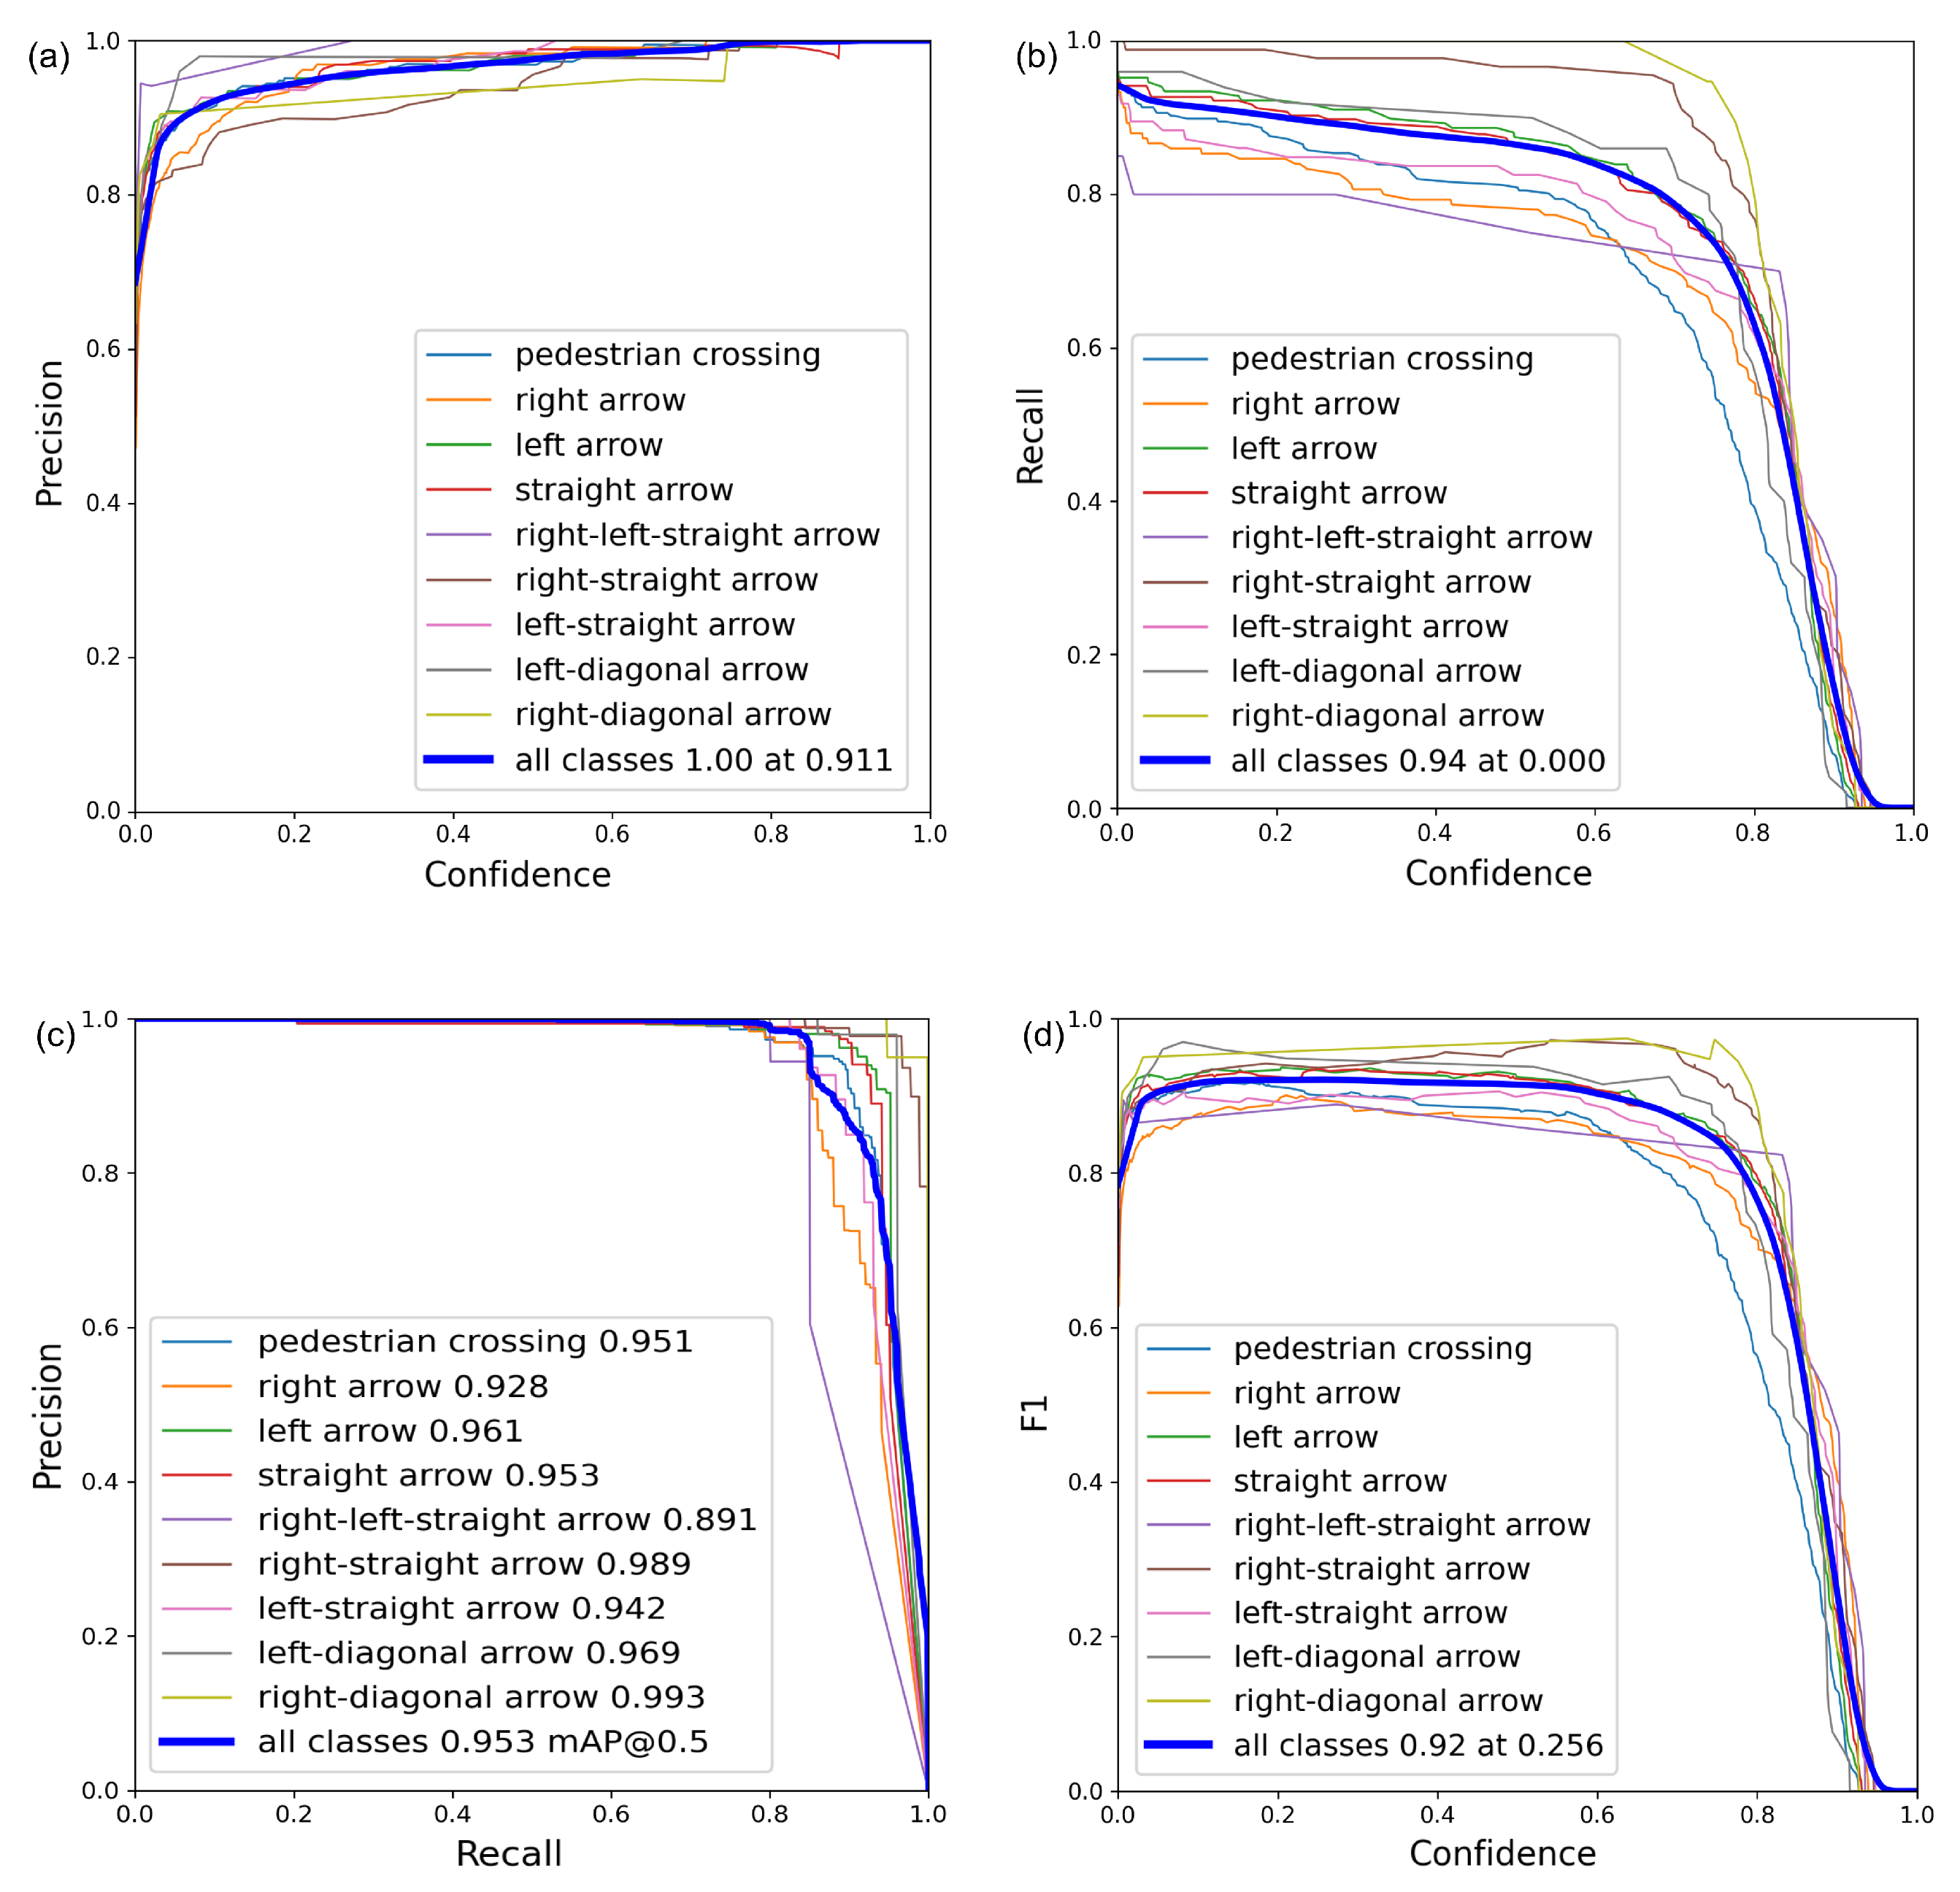
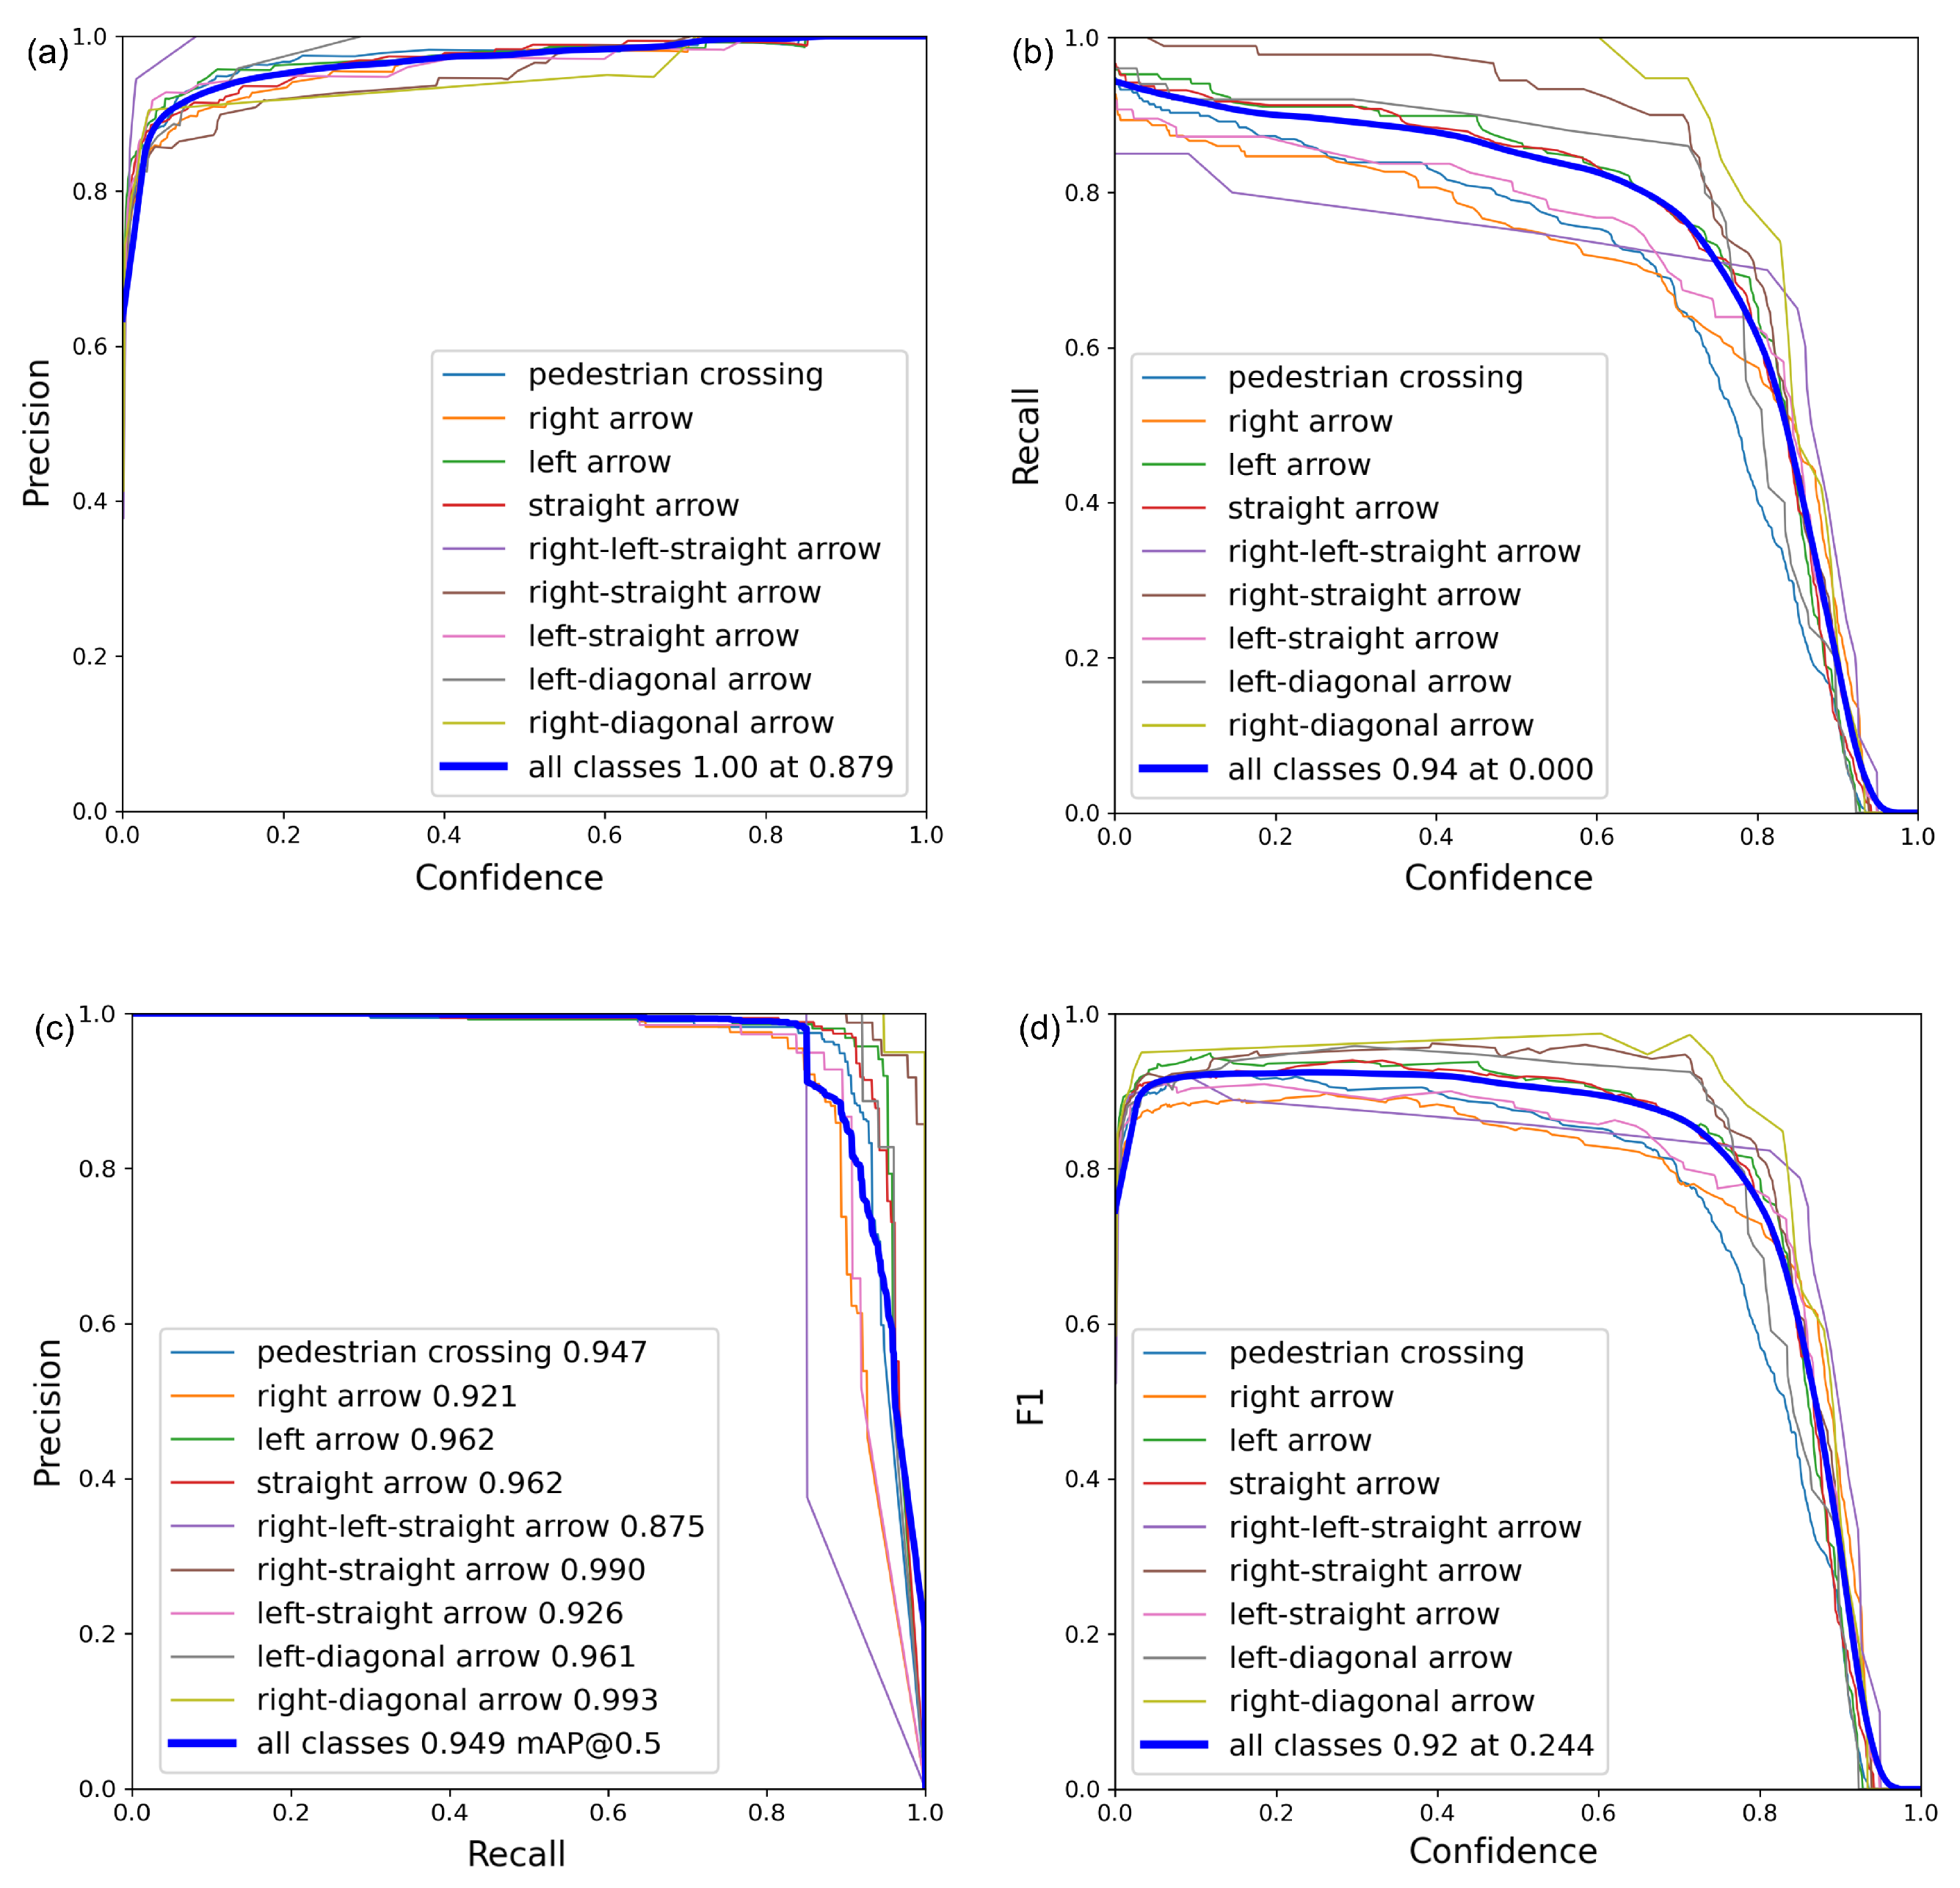
To assess the performance and accuracy of the network models, the relevant metrics were calculated separately for each class. The most important metrics were considered to be precision and recall. Precision quantifies the value of an optimistic forecast; the higher its value, the greater the precision of the network model. The closer to 1 the value of the recall metric is, the more sensitive the model is. For each model, plots were generated to illustrate the behavior of the recall and precision metrics as a function of the confidence threshold. In addition, the relationship between recall and precision was presented, along with the F1 score plotted against confidence. A set of four such plots was created for each model individually:
Figure 6 for YOLOv7,
Figure 7 for YOLOv8n, and
Figure 8 for YOLOv9t.
The optimal values of the precision and recall metrics were computed using the
mechanism. This procedure was introduced by the authors of YOLOv5 and has been retained in subsequent versions of the model. It leverages the curves shown in
Figure 6,
Figure 7 and
Figure 8 to determine the confidence threshold that jointly optimizes both recall and precision. As a result, both metrics are evaluated at a shared, optimal threshold.
According to the classification results obtained by the network model, each object was assigned to one of four sets named as follows:
The TP, FP, TN, and FN symbols used in the following formulas correspond to the counts of these sets in the context of the respective classes.
To perform an analysis of the efficiency and accuracy of the network model, four selected metrics were calculated for each class. One of the most important metrics was considered to be “precision”, which is calculated according to Equation (
1). Precision (
P), quantifies the value of an optimistic forecast; the higher its value, the greater the precision of the network model.
Equation (
2) enables the calculation of Recall (
R). The closer its value is to 1, the more sensitive the model is.
Additionally, two Mean Average Precision (mAP)metrics were calculated: mAP@0.5 and mAP@0.5:0.95. Both metrics analyze the accuracy of the network model’s response in the context of the precision of an object’s position within the image plane. The model’s response for a given sample is interpreted as positive or negative based on the fulfillment of a required threshold known as the Intersection over Union (IoU). Its value determines whether a given object was detected correctly.
The mAP@0.5 metric is calculated by considering a single threshold of 0.5. In this case, detected objects whose bounding box overlaps at least fifty percent are treated as correctly detected, and the metric value is one; otherwise, it is zero. In contrast, the mAP@0.5:0.95 metric considers ten thresholds ranging from 0.5 to 0.95 in steps of 0.05. For each threshold, detection accuracy is determined (similarly to the mAP@.5 metric); then, an average is calculated for the given sample. It should be emphasized that the higher the threshold, the higher the difficulty in achieving correct object position detection (for a 0.95 threshold, the bounding box of the object’s position must overlap at least 95 percent with the bounding box of the actual position of the object in the image). Therefore, the value of this metric is usually a fractional number. A comprehensive comparison of detection metrics for all object classes and YOLO models is presented in
Table 5. This overview makes it possible to identify which classes are most reliably recognized and where the differences between models are most pronounced.
Analysis of the confusion matrix shows that YOLOv7 achieved the highest classification accuracy (1017 of 1056 labels correct, only two misclassifications, and 37 FNs). These figures agree with the averages in
Table 5, where Precision = 0.950, Recall = 0.916, and mAP@0.5 attains a record 0.977. YOLOv8n and YOLOv9t correctly classified 932 and 938 objects, respectively; the lower totals correlate with larger numbers of missed markings (122 and 116), driving recall down to about 0.896. However, both newer models exhibit higher precision (up to 0.959) and superior mAP@0.5:0.95 (0.779 for YOLOv8n and 0.773 for YOLOv9t), indicating better behavior under stricter IoU thresholds. For rare classes (Class 5 and Class 9), YOLOv9t retains perfect precision but sacrifices recall, whereas YOLOv7 preserves the greatest sensitivity. Hence, YOLOv8n and YOLOv9t deliver more conservative thresholding, while YOLOv7 offers the most exhaustive detection.
Figure 9 presents an example of the output predicted by the trained YOLOv7, YOLOv8n, and YOLOv9t models on randomly selected images from the test set.
In addition to detection accuracy, the inference speed of the models was also evaluated to assess their suitability for real-time applications. All tests were performed on an NVIDIA GeForce RTX 3080 GPU using the same set of 500 test images at 416 × 416 resolution. The results are summarized in
Table 6.
The results show that all models operate well above real-time requirements. YOLOv7 and YOLOv8n achieved nearly identical inference times (about 2.3–2.4 ms per image), while YOLOv9t was slightly slower (2.8 ms per image). These speeds correspond to more than 350 frames per second, confirming that all tested models are suitable for real-time driver assistance applications.
In addition to the quantitative evaluation presented above, a qualitative verification was also carried out to assess the performance of the models under difficult visibility conditions, such as partially occluded objects.
Figure 10 presents an example of a partially occluded road marking. In the original image (a), a “straight arrow” marking is partly covered by a vehicle driving ahead. The enlarged fragment (b) shows the visible part of the marking. Despite the partial occlusion, all three tested YOLO models correctly detected and classified the marking: YOLOv7 (c), YOLOv8 (d), and YOLOv9 (e). This confirms that the models can also recognize horizontal markings under partial visibility.
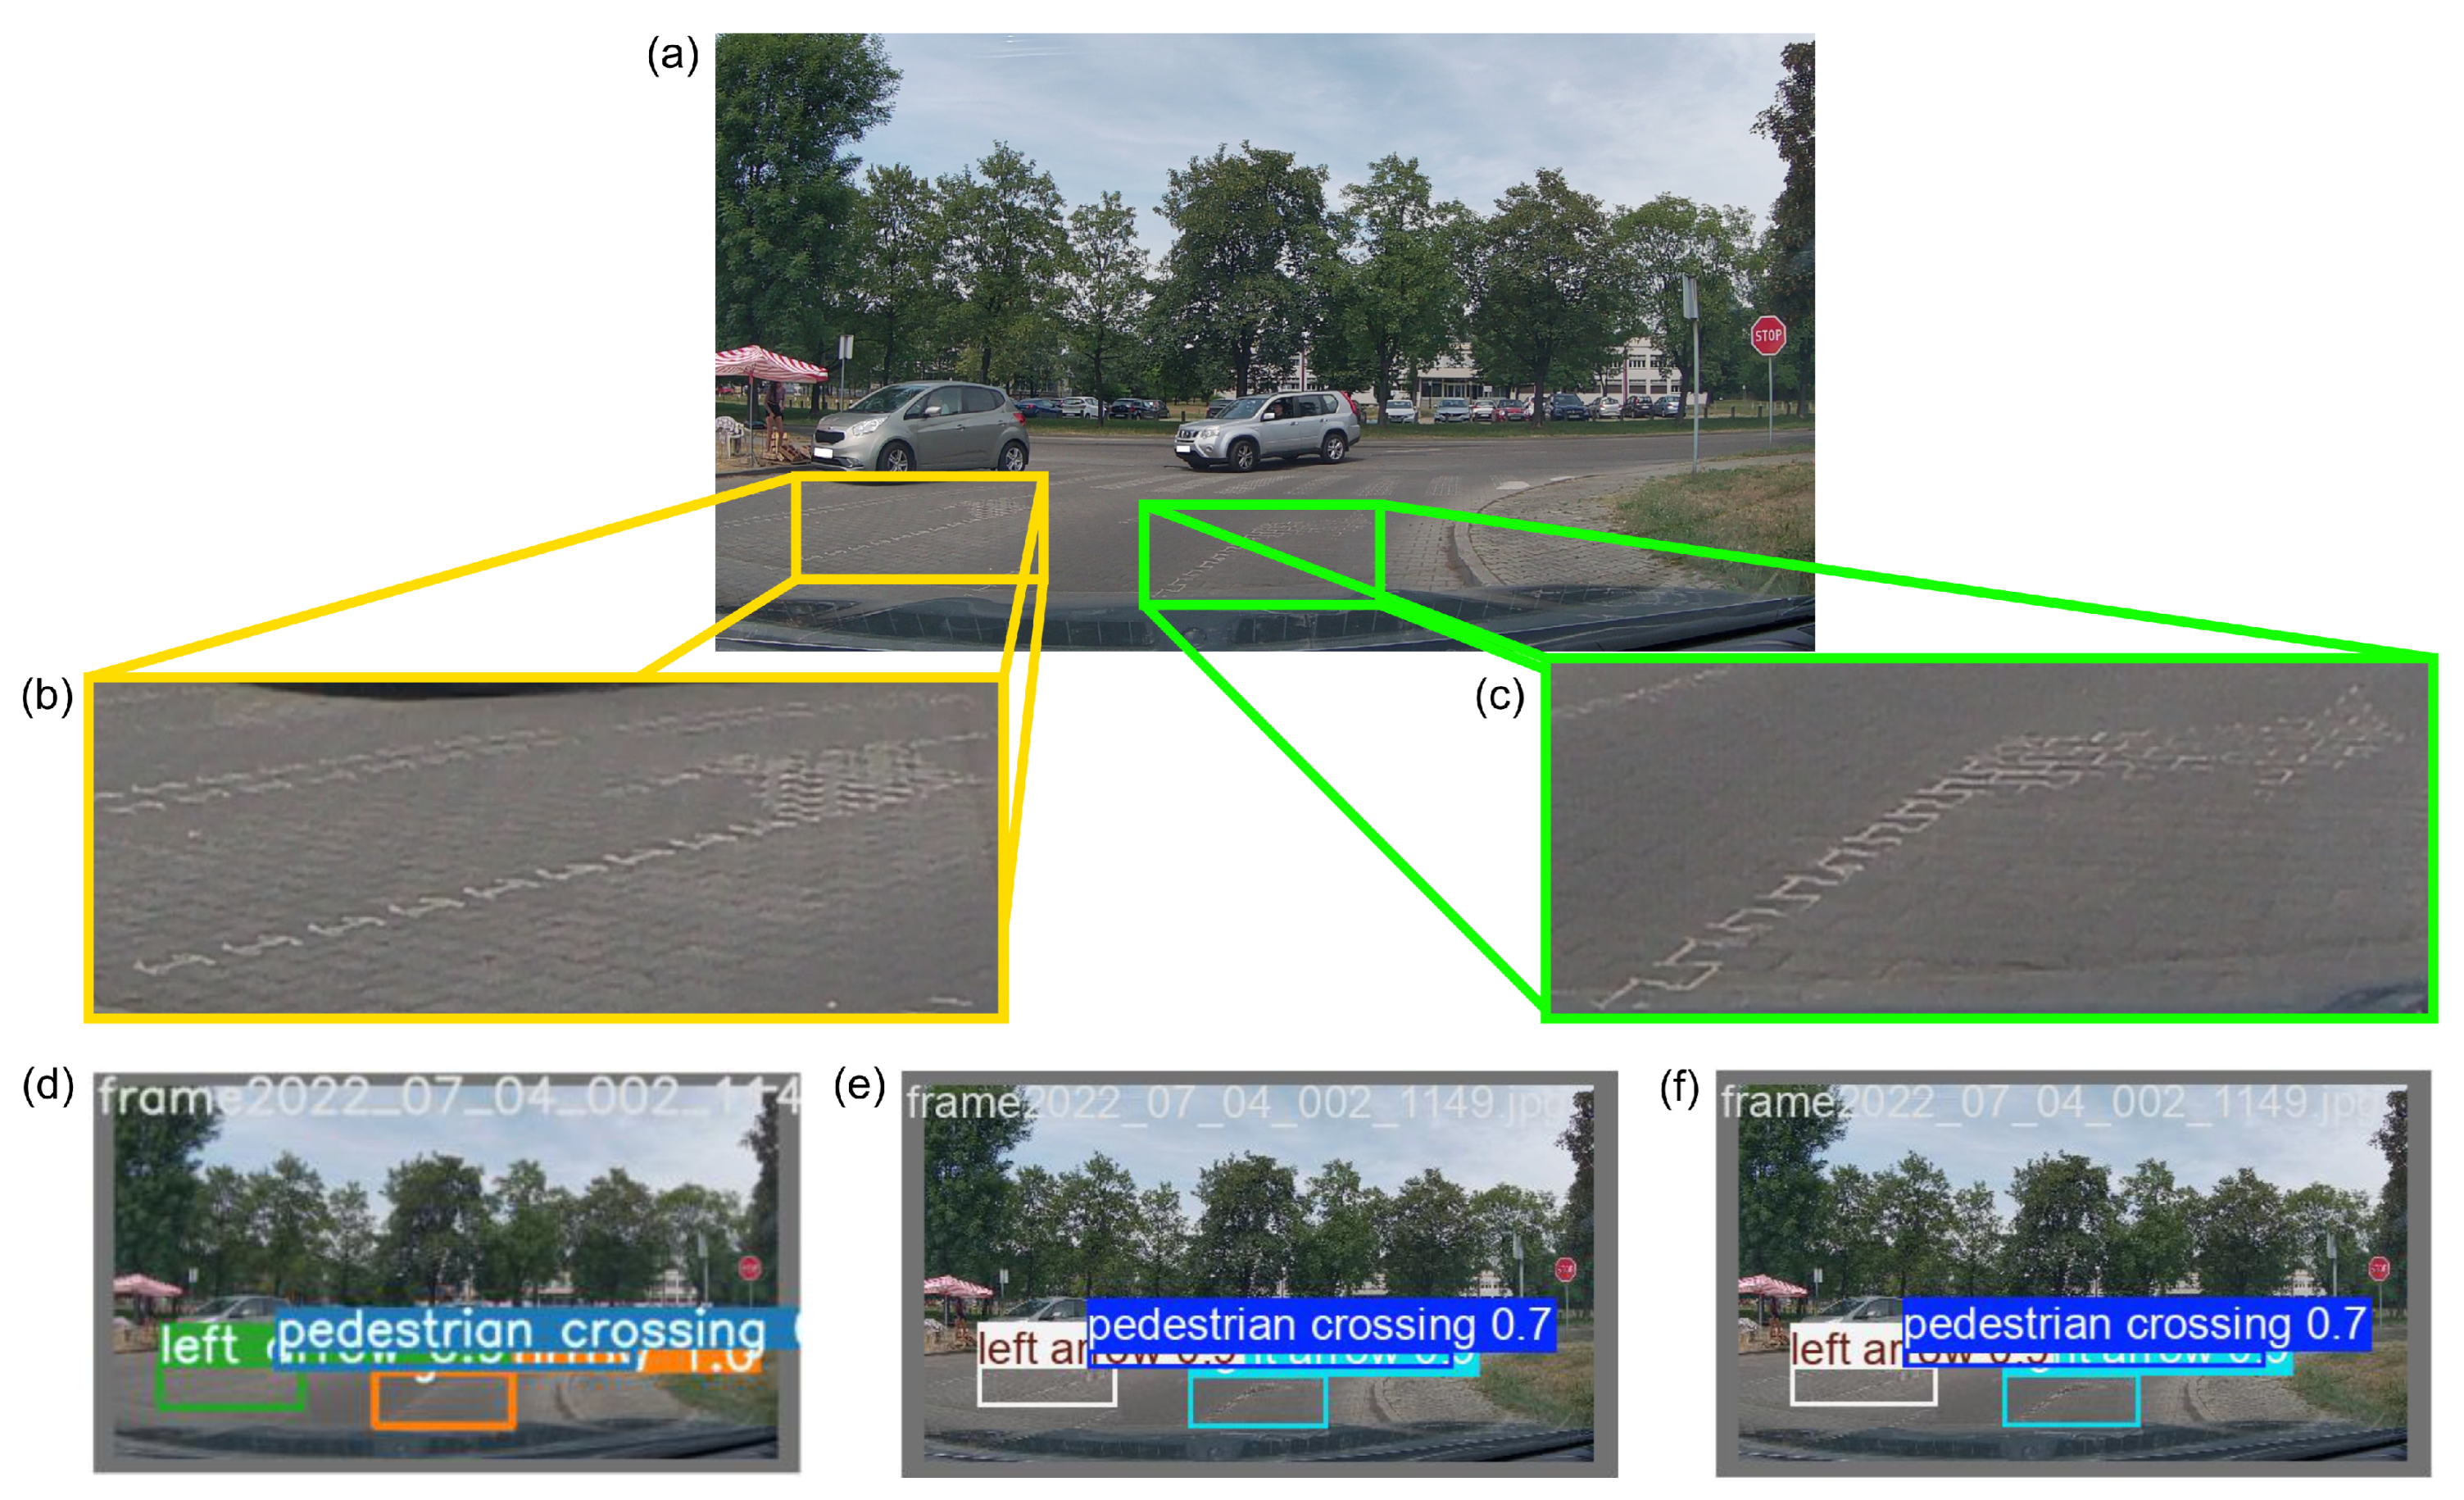
Another qualitative example is shown in
Figure 11. The original image (a) contains two horizontal markings (“left arrow” and “right arrow”) that are heavily faded and exhibit very low contrast against the road surface. The enlarged fragments ((b) and (c)) show the visible parts of the markings. Despite the difficult visibility conditions, all three tested models—YOLOv7 (d), YOLOv8n (e), and YOLOv9t (f)—correctly detected and classified both markings. This confirms that the models are able to recognize horizontal road markings, even in cases of significant wear and low contrast.
5. Discussion
The results obtained in this study show that convolutional neural networks, especially YOLO-based architectures, are effective in detecting and classifying horizontal road markings under real-world conditions. The high values of precision, recall, and mAP confirm the robustness of this approach, but several important aspects should be discussed.
Previous research on road environment perception has mainly focused on vertical traffic signs [
13,
14,
15] and lane detection [
16,
17]. Studies dedicated to horizontal markings, particularly arrows and pedestrian crossings, are less common. Earlier research employing the YOLOv4-Tiny network for horizontal road marking detection on Polish roads reported a promising overall accuracy of 96.79% on a test set of 1250 images [
20]. A direct comparison of the obtained metrics with those presented in the cited work would not be reliable, as there are differences in the dataset division, as well as in the selected training parameters and the duration. The present study investigates newer YOLO architectures (YOLOv7, YOLOv8n, and YOLOv9t) using standardized evaluation metrics, which allows for a more comprehensive assessment of performance. The high precision and recall values obtained in this study confirm that the newer YOLO architectures maintain high detection accuracy while improving localization robustness. The presented models can be directly integrated into ADAS pipelines to enhance lane-level navigation and road condition monitoring. Moreover, the proposed dataset can support automated assessment of road marking quality for maintenance scheduling.
The experiments show that YOLOv7 achieved the highest recall, which means it is more sensitive to partially degraded markings. YOLOv8n and YOLOv9t reached slightly higher precision and mAP@0.5:0.95 values, indicating better localization accuracy under stricter IoU thresholds. This difference reflects the balance between broader detection (YOLOv7) and more selective classification (YOLOv8n and YOLOv9t). Such distinctions are useful when selecting a model for a specific task. YOLOv7 may be suitable for general ADAS applications, while YOLOv8n and YOLOv9t are preferred when minimizing false detections is more important.
The qualitative results presented in
Figure 10 and
Figure 11 further demonstrate that the tested YOLO models can correctly detect and classify road markings, even under challenging conditions such as partial occlusion or low contrast, confirming their robustness in realistic road environments.
In addition to detection accuracy, computational performance was also evaluated to determine the models’ suitability for real-time operation. The measured inference times ranged from 2.3 to 2.8 ms per image, corresponding to over 350 frames per second on an NVIDIA RTX 3080 GPU. These results confirm that all three models meet real-time processing requirements, making them feasible for integration into embedded perception modules or advanced driver assistance systems, where low latency is essential. Considering that newer and more energy-efficient hardware platforms, such as NVIDIA Jetson devices, offer dedicated inference acceleration, the tested models can be expected to achieve even higher processing speeds when deployed on optimized edge systems.
Some limitations should also be noted. The dataset was collected only on Polish roads, which may reduce the generalization ability of the models to other regions with different marking colors or styles. Although the dataset includes recordings taken on sunny and cloudy days, it does not cover adverse weather conditions such as heavy rain, snow, or fog. These situations are important for autonomous driving and should be included in future datasets. The models were evaluated mainly in terms of accuracy. Model speed depends on hardware performance; therefore, inference latency should be verified on the target device to confirm real-time feasibility.
Another issue is related to data privacy. Some recordings may contain sensitive visual information, and anonymization should be performed before making the dataset public. After this step, publishing the dataset would support other researchers and improve reproducibility.
Future work will focus on extending the dataset to include extreme weather conditions and less common marking types. Further evaluation of computational performance, including energy efficiency and behavior on embedded devices such as NVIDIA Jetson platforms, will provide additional insights into the models’ readiness for real-time applications. Making the dataset and trained models publicly available would also increase transparency and encourage further research in intelligent transportation systems.
Overall, the findings highlight the potential of YOLO-based detectors as reliable tools for next-generation intelligent driving systems.
6. Conclusions
Among the tested architectures, YOLOv7 provided the most comprehensive detection, while YOLOv8n and YOLOv9t achieved higher localization accuracy under stricter IoU thresholds. All models also demonstrated real-time performance, achieving inference speeds between 2.3 and 2.8 ms per image (corresponding to over 350 frames per second). This confirms their suitability for real-time driver assistance and perception systems.
In addition to the quantitative evaluation, qualitative verification confirmed that all tested YOLO models were able to correctly detect and classify horizontal markings, even in difficult cases, such as partially occluded or heavily worn markings with low contrast. These results indicate that the proposed models are robust and applicable to real-world driving conditions.
The results emphasize the importance of maintaining proper horizontal road markings to support both human drivers and semi-autonomous vehicles operating at automation level 4. Future work will focus on extending the dataset with additional weather conditions and marking types to enhance model robustness and applicability to various driving environments.


