Article

Aerosol Spraying of Carbon Nanofiber-Based Films for NO2 Detection: The Role of the Spraying Technique

by
Artyom Shishin
1,
Valeriy Golovakhin
1,
Eugene Maksimovskiy
2,
Ekaterina Vostretsova
1,
Vladimir Timofeev
1 and
Alexander Bannov
1,*
1
Department of Chemistry and Chemical Technology, Novosibirsk State Technical University, 20 K. Marx Ave., Novosibirsk 630073, Russia
2
Nikolaev Institute of Inorganic Chemistry, Siberian Branch of Russian Academy of Science, 3 Acad. Lavrentiev Ave., Novosibirsk 630090, Russia
*
Author to whom correspondence should be addressed.
Appl. Sci. 2025, 15(22), 12110; https://doi.org/10.3390/app152212110
Submission received: 28 October 2025 / Revised: 6 November 2025 / Accepted: 10 November 2025 / Published: 14 November 2025

Abstract

This study is devoted to the determination of the role of aerosol spraying in the formation of NO2 sensor properties of carbon nanofiber (CNF)-based films. This is the first paper to systematically apply the aerosol spraying technique to CNF-based films and link the spraying parameters directly to sensor performance metrics (response, signal-to-noise ratio, response times, etc.). Chemiresistive gas sensors were created based on CNFs and tested at room temperature (25 ± 1 °C). It has been shown that the increase in the concentration of the CNF/ethanol mixture used for spraying from 3 to 30 mg/mL led to a growth in sensor response from 1.2% to 12.0% at 2 ppm NO2. The increase in the thickness of the CNF film of the sensor induced a growth in ΔR/R0 to NO2 that is attributed to the formation of a porous film. With increased film thickness, the response improves (from 7.0% to 10.6% at 2 ppm NO2) as does the signal-to-noise ratio (from 735:1 to 1892:1). The creation of hybrid all-carbon composites based on CNFs and multi-walled carbon nanotubes (MWCNTs) resulted in a decrease in both sensor response and signal-to-noise ratio; however, the response time and recovery degree improved. Two types of hybrid materials based on CNFs and MWCNTs were created using aerosol spraying to enhance the sensor behavior of CNFs. The obtained data confirm the dominant role of the thickness of CNF-based films and their density (in terms of distance between nearest carbon inclusions within the film) in sensor characteristics. The machine learning data used to describe the sensing behavior of two gases with opposite resistance changes when in contact with CNFs, namely NO2 and NH3, showed final accuracies of 92.13% on training data and 91.98% on validation data.

1. Introduction

The detection of hazardous and toxic gases in industry is of great importance for environmental protection as well as occupational health and safety. Even at low concentrations, toxic gases can cause respiratory, digestive, and other health problems.
There are many types of sensors for gas detection, including electrochemical [1], fiber optic [2], piezoelectric [3], and capacitive [4] sensors. However, they have some disadvantages, such as low sensitivity, lack of selectivity, and high cost [5,6]. Therefore, there is interest in new detection methods, such as chemiresistive gas sensors. One of the dangerous gases that chemiresistive sensors are designed to detect is nitrogen dioxide (NO2) [7]. NO2 is one of the gases that cause respiratory problems, such as asthma and bronchitis [8,9]. The prolonged exposure may increase the risk of respiratory infections [10]. Therefore, NO2 detection in air is a crucial task, not only in terms of public health but also for chemical engineering, medicine, and other fields [11,12].
Semiconductor sensors based on metal oxides with high sensitivity are the most common among chemiresistive gas sensors [13,14]. Nonetheless, a major drawback is their requirement for high operating temperatures (typically above 300–350 °C), which results in high energy consumption and prevents their incorporation into mobile or portable devices [15]. The use of nanomaterials offers a pathway to overcome this limitation, enabling the development of sensing layers that function effectively at room temperature [16,17].
Recently, various types of carbon nanomaterials have been utilized as active materials for gas sensors [18] because of their unique characteristics and distinctive properties. Such nanomaterials include single-walled carbon nanotubes, multi-walled carbon nanotubes, carbon nanofibers (CNFs), graphene oxide, reduced graphene oxide, etc., which can be applied to the sensor in the form of a film, for example, through spray coating. Composites based on carbon nanomaterials and ZnO [19,20], In2O3 [21], CuWO4 [22], CuO [23] are used. CNFs (nanofibers obtained using the chemical vapor deposition (CVD) technique through the decomposition of C1–C4 hydrocarbons with diameters below 100 nm) can be considered one of the carbon nanomaterials that are cheaper compared to carbon nanotubes and can be obtained with significantly higher yields through catalytic decomposition of methane or associated petroleum gas [24]. There are only a few studies that have explored CVD-grown CNF-based NO2 gas sensors [25].
A significant number of papers in the field of gas sensing focus on selecting the type of material [26]. Currently, there are no works dedicated to studying the effects of aerosol spraying technique conditions on sensor properties. However, some articles are devoted to studying the impact of deposition conditions on sensing behavior. For example, Orlando et al. [27] reported the effect of surfactants on the influence of surfactants on the deposition and performance of single-walled carbon nanotube-based gas sensors for NO2 and NH3 detection. The coatings based on sodium dodecyl sulfate and carboxymethyl cellulose showed the highest response. Despite the numerous papers devoted to gas sensors, the impact of the deposition technique remains poorly understood, especially for materials used as rarely as CNFs.
Therefore, this work is devoted to investigating the NO2 gas sensing properties of CNFs. The main parameter used to increase the response is the concentration of the CNF/ethanol mixture used for spraying. This is the first paper systematically applying the aerosol spraying technique to CNF-based films and linking the spraying parameters directly to sensor performance metrics (response, signal-to-noise ratio, response times, etc.).

2. Materials and Methods

2.1. Sensing Material

Carbon nanofibers were synthesized via the catalytic decomposition of methane in a vibrofluidized bed reactor at 550 °C and a pressure of 1 atm. A catalyst composition of 90% Ni/10% Al2O3 was used for the growth of CNFs. The detailed synthesis procedure is described elsewhere [28]. High loading of the active metal component led to the formation of granulated material (1–5 mm in diameter), consisting of intertwined CNFs. The material was subsequently ground in an agate mortar and sieved to obtain particles smaller than 100 μm.
In order to carry out the comparison of sensor behavior and to enhance the response, the hybrid films based on CNF and multi-walled carbon nanotubes (MWCNTs) were prepared. There are two MWCNT samples used. Multi-walled carbon nanotubes marked as MWCNTs#1 are a commercial material produced by Shenzhen Nanotechport Co. (Shenzhen, China). Multi-walled carbon nanotubes of labeling MWCNTs#2 were obtained by the CVD method using a Fe-Co/Al2O3 catalyst (obtained by co-precipitation) in a fixed-bed reactor (750 °C, 1 L/min CH4, 1 atm). The synthesis was completed within 15 h until complete deactivation of the catalyst had occurred.
The idea of applying two types of MWCNTs is based on their different specific surface areas and diameters, which provide varying morphologies in hybrid composites with CNFs.

2.2. Aerosol Spraying of CNF-Based Films

CNF-based films were obtained by aerosol spraying (Figure 1).
Textolite (Resurs Ltd., Penza, Russia) substrates (dielectrics made of several layers of glass cloth impregnated with phenolic resin) covered with copper contacts, cut from the middle part of the substrate, were used. A suspension of carbon nanomaterials (30–300 mg) with a particle size of less than 80 μm was prepared by ultrasonication in 10 mL of solvent (96% ethanol; Reaktiv, Moscow, Russia) using an ultrasonic bath “UZV3/200” (RELTEK, Yekaterinburg, Russia) with a power of 85 W at a frequency of 22 kHz for 20 min. A square film of carbon nanomaterials (top) that partially covered the copper contacts (bottom) was formed by aerosol spraying of the suspension through a mask onto the substrate heated to 80 °C for evaporation of ethanol. For a solvent comparison study, additional suspensions were prepared using acetone (chemically pure grade; Reaktiv, Russia) and isopropanol (2-propanol; chemically pure grade; Reaktiv, Russia) instead of ethanol.
For the enhancement of sensor properties, all-carbon films based on CNFs and MWCNTs were prepared by aerosol spraying. Films based on CNF/MWCNT composites of various carbon nanomaterials in a 1:1 wt. ratio, with a total mass of 300 mg (per 10 mL of ethanol), were created using layer-by-layer deposition or spraying of CNFs/MWCNTs suspension (Figure 2).
The layer-by-layer method involves the sequential spraying of CNFs (bottom) and MWCNTs (top), while the suspension method involves the deposition of a suspension already prepared by the sonication of CNFs and MWCNTs in ethanol.
All carbon samples used for sensors were used for NO2 detection without any chemical treatment or any other type of treatment in order to estimate the pure impact of spraying parameters on the sensor behavior.

2.3. Testing of Sensors

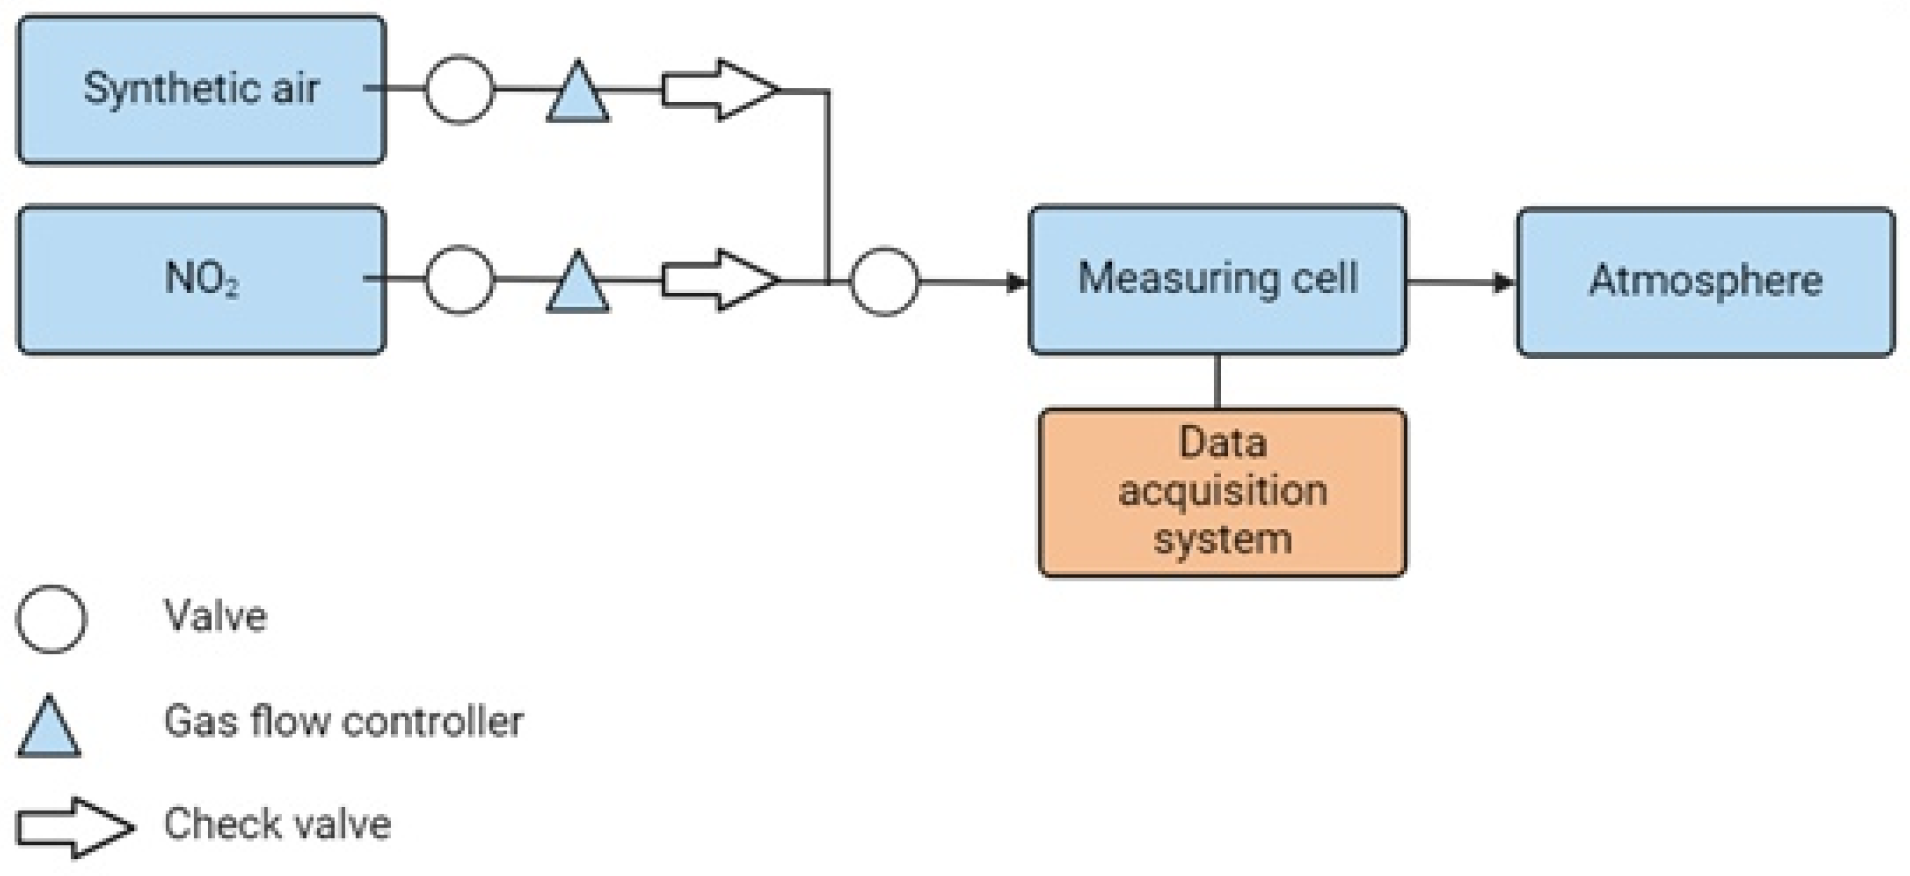
The resulting films based on carbon nanomaterials on the substrate were tested for the detection of nitrogen dioxide. The gas sensor testing setup includes lines for carrier gas and analyte (Figure 3). The dynamic regime of testing was used. Synthetic air (a mixture of 21% O2 and 79% N2) was used as the carrier gas.
The total flow rate of the gas mixture supplied to the measurement cell was 100 mL/min for measuring the response to NO2. The concentration of the analyte in the system was achieved by adjusting the ratio of gas flows from the cylinders. The gas vessel with the analyte was a mixture of air with NO2 (concentration of the latter in the vessel was 0.05 vol.%).
The methodology for measuring gas-sensing properties involved several steps. The first step was to establish a baseline for 45 min with a synthetic air supply at a rate of 100 mL/min. This step is necessary to determine the initial resistance of the sensor in the air atmosphere and to subtract its contribution from the data when adding NO2 into the air. In such sensors, the change in the electrical resistance of the active material in contact with air cannot be neglected, as the sensor resistance increases in contact with air and changes over time. The main task is to reach the area where R(τ) can be described by a linear function and to extrapolate data over the entire measurement interval with the subsequent subtraction of this baseline. Cycles of 10 min are used for the determination of sensor response to NO2, which are alternated with 10 min pure air purge cycles.
The gas sensor (14 × 14 mm substrate; copper contacts with a gap of 4 mm; 9 × 9 mm carbon deposition area) was placed in the measurement chamber. The sensor resistance was measured using the two-point method between two electrodes at room temperature (25 ± 2 °C). The chemiresistive response was measured by a source meter, Keithley 2401 (Keithley Instruments Inc., Cleveland, OH, USA) at a voltage of 0.1 V. Data acquisition was performed using the specialized software.
The response ΔR/R0 [29] of the gas sensors was defined using Equation (1).
ΔR/R0 = (R − R0)/R,
where R represents the sensor resistance to the analyte gas, Ω; R0 represents the initial sensor resistance in a synthetic air atmosphere. The sensor response (as well as sensitivity) is presented moduli in this paper, taking into account the contact with NO2 induced the drop in resistance.
Testing of the gas sensors was carried out at different values of relative humidity (2–75%). The actual humidity inside the measuring chamber was determined directly by a humidity sensor placed within it. The relative humidity (φ) level was adjusted by varying the flow rate ratio (by mass flow controllers) between dry synthetic air and air saturated with water vapor by passing it through a bubbler.
Response time, recovery degree, and signal-to-noise ratio were also calculated. Response time is the time it takes for the sensor to reach 90% [30] of the final response during 10 min contact with the analyte with a specific concentration (for higher precision, only the first cycle used for NO2 detection was used for response time calculation). Recovery degree is a value indicating the ratio of the final response to the initial response when the carrier gas is applied after the analyte gas (the first cycle of contact with NO2 was also used for calculation). Signal-to-noise ratio (SNR) is a value equal to the ratio of the average signal value to its standard deviation. It is calculated using Equation (2).
SNR = μ/σ,
where μ is the mean of the signal; σ is the standard deviation of the signal.

2.4. Characterization

The morphology of carbon nanomaterials was studied by scanning electron microscopy (SEM) on an S-3400N electron microscope (Hitachi High-Tech Corporation, Ibaraki, Japan) with an add-on for energy dispersive X-ray spectroscopy (EDX). Transmission electron microscopy (TEM) of carbon nanomaterials was performed on a JEM 2010 electron microscope (JEOL, Tokyo, Japan) with a grating resolution of 0.14 nm at an accelerating voltage of 200 kV. The change in the defectiveness of carbon nanomaterials was estimated by Raman spectroscopy (Horiba Jobin Yvon T64000, HORIBA Europe Research Center, Palaiseau, France) with a 532 nm excitation laser. The disorder degree was estimated from the ratio of the intensities of the D and G modes, I(D)/I(G) [31,32].
The specific surface area was determined from low-temperature nitrogen adsorption isotherms (77 K) using a Quantachrome NOVA 1000e (Nova, Boynton Beach, FL, USA) installation. The samples were preliminarily degassed under vacuum at 300 °C for 6 h. The Brunauer–Emmett–Teller (BET) method was used to determine the surface area.

3. Results and Discussion

3.1. Carbon Nanomaterials

TEM images of CNFs (Figure 4a,d) show that the sample is composed of carbon nanofibers with lengths ranging from 150 nm to 1.5 μm, which are strongly intertwined. The “nested cone” structure is clearly visible (Figure 4a), which is the main structure usually formed over Ni-containing catalysts via catalytic decomposition of methane.
The samples MWCNF#1 and MWCNT#2 used for the preparation of hybrid materials based on CNFs consist of multi-walled carbon nanotubes intermixed with bamboo-like nanofibers (Figure 4b,c). The properties of the carbon nanomaterials are summarized in Table 1.
The average diameter of MWCNTs (Table 1) is different, showing the lower one for MWCNTs#2 compared to MWCNTs#1, whereas the CNFs possessed values in between the MWCNT values, but with a wider distribution (for CNFs, the error bars are 14.3 nm). The CNFs showed a higher specific surface area and disorder degree (as indicated by Raman spectroscopy, I(D)/I(G)) compared to MWCNTs.

3.2. Effect of Concentration of Sprayed CNF/Ethanol Mixture

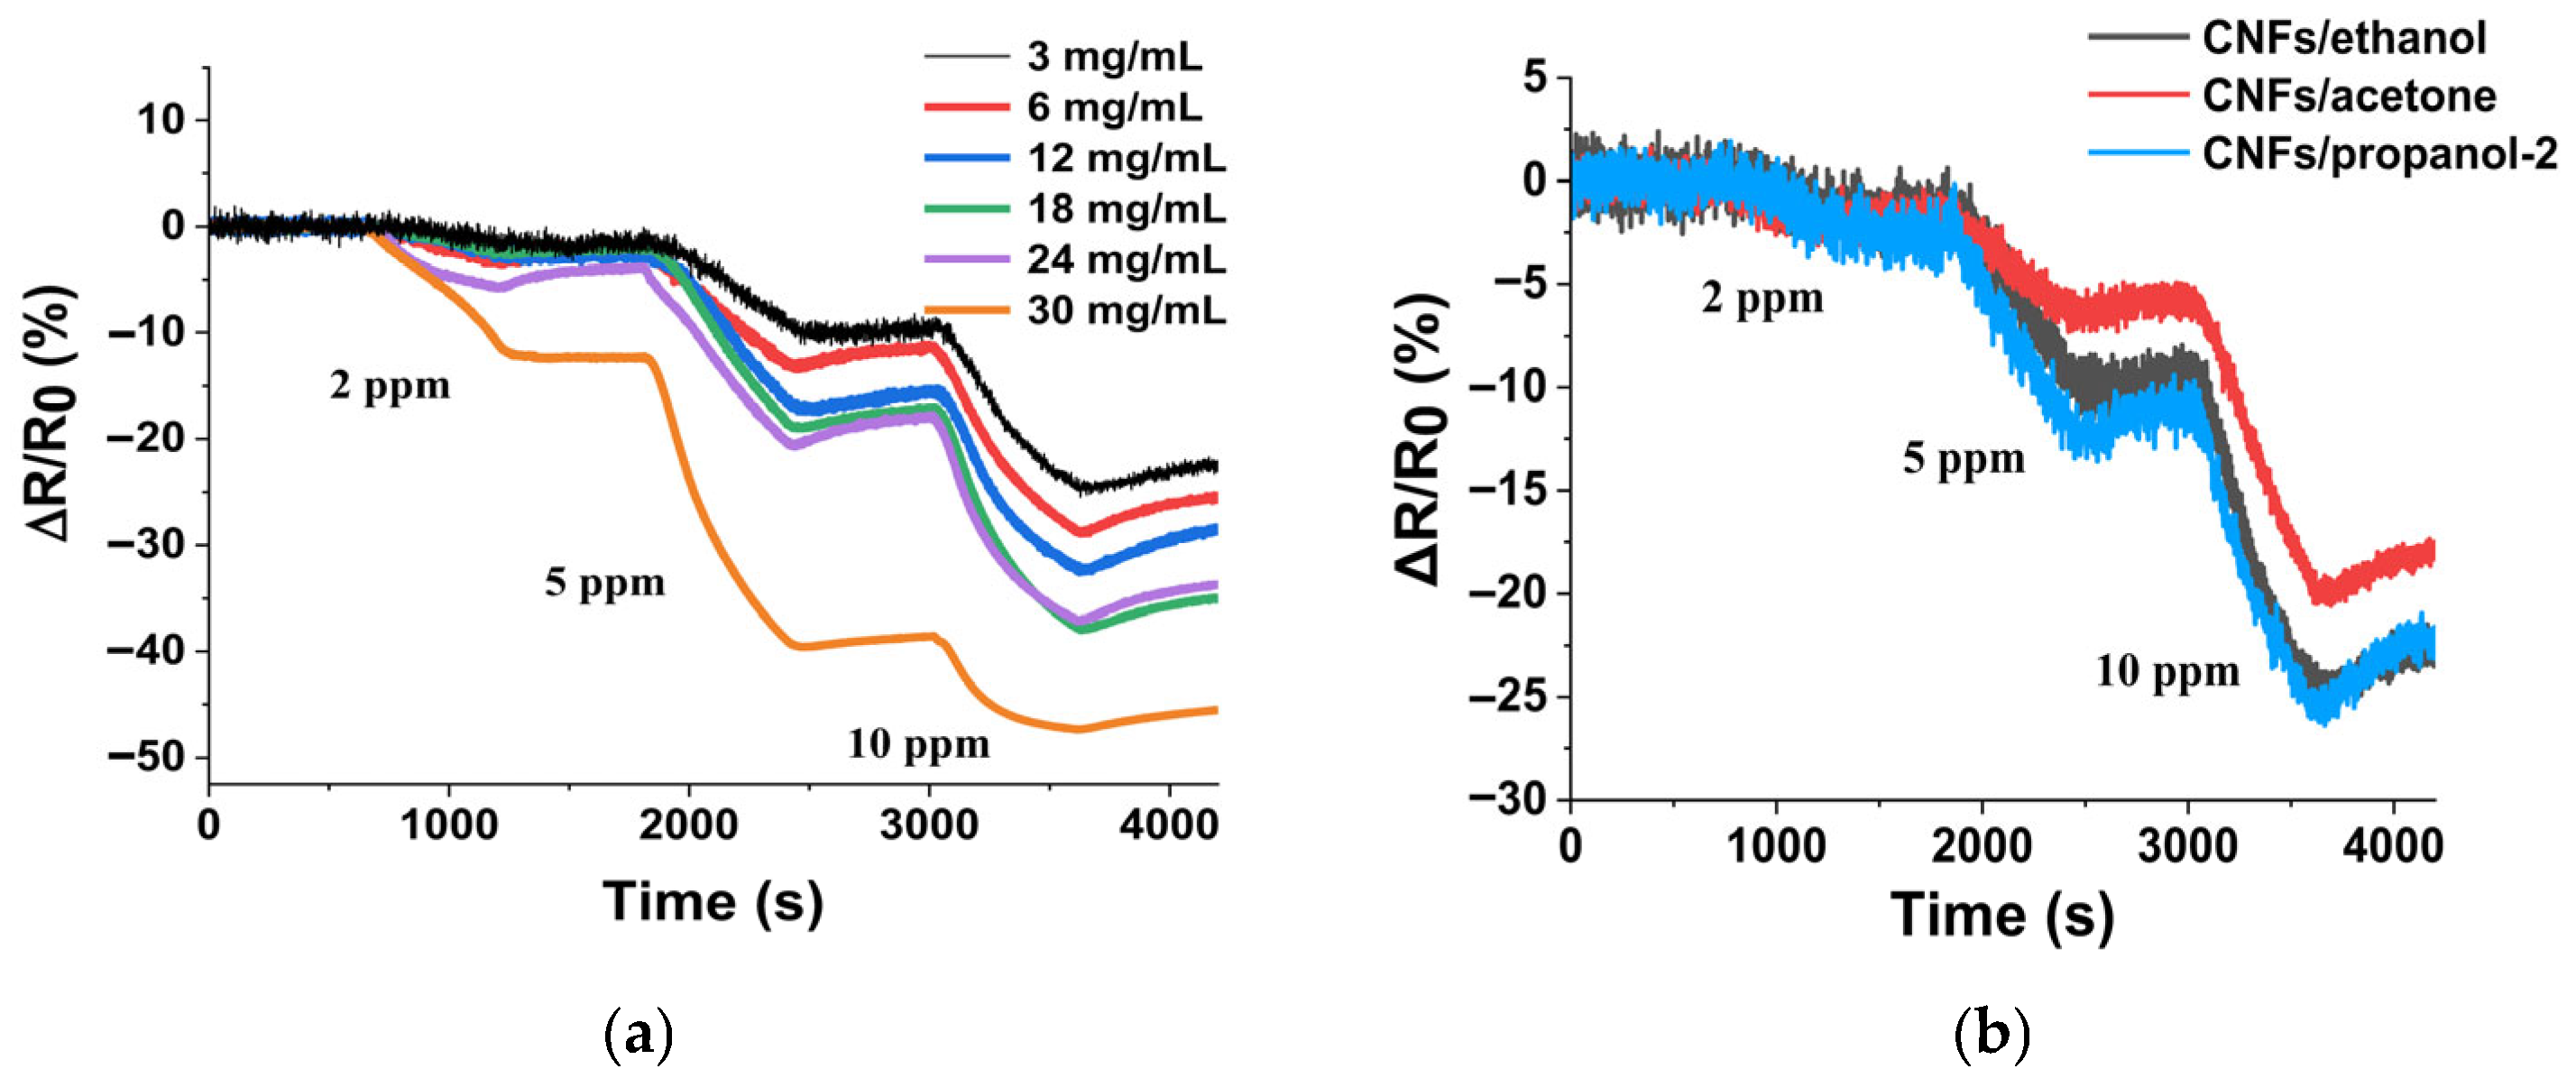
The CNF-based sensors created using the aerosol spraying technique are the primary objects of investigation. The samples were sprayed from the CNF/ethanol suspension with concentrations ranging from 3 to 30 mg/mL and tested for NO2 at room temperature (Figure 5a). It has been shown that the increase in the concentration of the suspension led to a growth in sensor response to NO2. The highest response (47%) was obtained for the sensor sprayed with a concentration of 30 mg/mL (at 10 ppm NO2).
The behavior of sensor resistance upon contact with nitrogen dioxide is typical for the majority of carbon nanomaterials, which experience a decrease in sensor resistance when interacting with this analyte. NO2 is an electron-accepting gas, and its adsorption induces an increase in the concentration of charge carriers (holes; CNFs can be considered p-type semiconductors) [30,33]. Taking into account that the CNFs were not subjected to any chemical treatment and contain only 3.3% oxygen (Figure S1 in Supplementary Materials). The mechanism of NO2 adsorption on the surface of CNFs is given below and includes the adsorption of oxygen from air (3), its ionization (4), the adsorption of NO2 on the surface of CNFs (5), and the acceptance of electrons from the material (6) [26,34,35]:
O2 (gas) <–> O2 (ads),
O2 (ads) <–> O2 (ads),
NO2 (gas) <–> NO2 (ads),
NO2 (ads) + e <–> NO2 (ads),
However, the change in sensor response when increasing the deposition concentration is caused by a more complex effect. Since the deposition was carried out for the same duration, changes in the concentration of CNF aggregates in the substrate affect the “density” of the coating and actually induce a change in the distance between the nearest carbon “islands”. A clear dependence can be observed, as the sensor response increases with a decrease in electrical resistance (R0), leading to a reduction in the number of contacts in the conductive network of the CNFs (Table 2). Despite the fact that CNFs, as a porous material, exhibit the same specific surface area, depositing more CNFs on the porous substrate increases the total contact surface area between the gas phase and the solid conductive material, allowing more NO2 molecules to absorb electrons.
The range of concentrations studied was determined based on preliminary experiments, which indicated strong noise and an extremely low signal-to-noise ratio when using concentrations below 3 mg/mL. Concentrations above approximately 30 mg/mL led to obstruction of the airbrush nozzle. Increasing the concentration of CNFs in the suspension resulted in a decrease in electrical resistance from 20.4 kΩ to 0.375 kΩ and an increase in SNR. The significant growth of sensor resistance with increasing concentrations of CNFs in dispersion demonstrates the typical percolation effect, where the increase in the concentration of CNFs led to an increase in the number of contacts within the percolation network [36,37]. Similar percolation-based effects have also been reported in gas sensors [38,39].
Additionally, an inverse relationship was found between the response time and the response ΔR/R0, indicating that the sensor became slower as its response increased. A similar relationship was observed with the recovery degree, which tended to zero when ΔR/R0 reached 12.0%.
A comparison of the sensor behavior of the CNF-based film when in contact with gases exhibiting different adsorption behaviors, specifically NH3 as a reducing gas, was carried out for the sample sprayed at 30 mg/mL. Ammonia is an electron-donating compound that induces an increase in sensor resistance [40]. The response curve for NH3 is presented in Figure S2 (Supplementary Materials). However, the sensor showed a low response value to 100–500 ppm NH3 at room temperature compared to its response to NO2. This indicates that CNFs, which were not subjected to any chemical treatment and contain a low number of oxygen-containing functional groups on the surface, play a significant role in capturing NH3 molecules, making their application for ammonia detection less appropriate.
The impact of relative humidity on the operation of such a sensor for NO2 detection is illustrated in Figure S3 and Table S1 (Supplementary Materials). It can be stated that the increase in humidity leads to a decrease in ΔR/R0 (Figure S3), and it is typical for chemiresistive sensors [41]. However, some sensor materials showed the opposite behavior [42]. Most likely, the decrease in response is due to the fact that water molecules occupy the adsorption centers, thereby preventing the adsorption of NO2 molecules. At the same time, the impact of humidity is reversible. The increase in relative humidity from 2% to a certain value induces the appearance of a minimum in ΔR/R0 and further increases in relative humidity induce a reversible growth in sensor response.
At the same time, relative humidity improves the recovery of the sensor, making it 10–30% higher compared to dry air. The response time of the sensor improved from 541 s to 463 s (at 2 ppm NO2) in a humid environment. The sensitivity decreased when increasing the relative humidity φ level (from ~4%/ppm to 1.9–2.0%/ppm).
The effect of the solvent used for spraying was also investigated. Sensors based on CNFs were dispersed in different solvents: ethanol, acetone, and propanol-2. The concentration of the suspensions was chosen to be the lowest, at 3 mg/mL, since this concentration produced the lowest response, and it was necessary to enhance ΔR/R0 using various solvents. Figure 5b shows the dependence of sensor response on the solvent used for spraying. It can be noted that the highest response was observed in the sensors where CNFs were dispersed in ethanol (ε25°C = 24), followed by propanol-2 (ε25°C = 22) and acetone (ε25°C = 21). This is most likely due to the distribution of CNF particles in the solvent. It can be concluded that sensor response increases in concentrations above 5 ppm NO2, while the solvent has almost no effect at lower concentrations. Additionally, dimethyl sulfoxide (DMSO) was tested as a solvent; however, the silicone tube through which the suspension was passed degraded and eventually dissolved, preventing further tests with DMSO-containing mixtures.
Table 3 summarizes the gas sensor test results as a function of the solvent used for spraying.
The sample with the highest SNR is the sensor in which the CNFs were dispersed in propanol-2. Additionally, this sample has a lower recovery degree (6%). The fastest response time is observed in the CNF/ethanol-based sample. Sensors based on CNFs dispersed in ethanol and acetone exhibited a better recovery degree compared to the sensor based on the CNFs/propanol-2 suspension.

3.3. Effect of CNF Film Thickness

The previous section was devoted to onetime spraying, which means that the thickness of the coating was uniform. The concentration of the CNF/ethanol suspension affects the “density” of the coating. An increase in concentration brought the carbon inclusions closer together. The next stage of the research is to modify the thickness of the CNF film.
The aerosol deposition method involved the periodic application of the suspension onto the substrate (6 mg/mL). A different number of CNF layers was sprayed. As a result, gas sensors with varying layer thicknesses of 15 ± 5 μm (one layer), 55 ± 15 μm (five layers), and 80 ± 13 μm (ten layers) were obtained.
SEM images of such layers are shown in Figure 6. It can be seen that there is a relatively uniform distribution of particles deposited by aerosol spraying. The boundary between the substrate and the carbon material is shown in Figure 6d–f. It is also clear that a higher number of particles is detected as the layer thickness increases.
The impact of sensor thickness on response is shown in Figure 7a.
It is clearly seen that thickness affects the response in the concentration region below 5 ppm NO2. It has the opposite effect compared to the influence of the solvent used for spraying (Figure 5b). At an NO2 concentration of 10 ppm, the responses of all three samples are the same (45%). Interestingly, the increase in thickness induced the growth of ΔR/R0, indicating that the adsorption capacity for thicker films is higher compared to that of thinner films.
As the film thickness increases, the resistance decreases from 2.76 kΩ to 1.14 kΩ (Table 4). This difference is smaller compared to the effect of the concentration of the suspension, which allows for a change in resistance from 0.375 kΩ to 20.4 kΩ. This is because, as the film thickness increases, the number of CNF particles also increases, leading to improved conductivity. Additionally, the increase in film thickness has a positive effect on the signal-to-noise ratio; however, the response time and recovery degrade. These sensors exhibited a response time of 300–350 s lower (at 2 ppm NO2), which is mainly attributed to the relatively thick layer of CNFs.

3.4. All-Carbon Hybrid Films Based on CNFs and MWCNTs

Since the response of sensors based on CNFs needs to be optimized to improve the gas-sensitive properties, we created composites based on CNFs and two types of MWCNTs. The application of MWCNTs was aimed at increasing the CNF-based sensor response, as the combination of the two carbon materials could enhance sensor performance. In order to increase the sensor behavior, the sensor with the lowest ΔR/R0 was taken for the creation of a hybrid sensing material, i.e., 3 mg/mL. The sensor responses of pure CNFs and MWCNTs are shown in Figure 7b, indicating that the sensor response (at 2 ppm, for example) increases in the order CNFs < MWCNTs#1 < MWCNTs#2. Interestingly, this response does not show a clear correlation with I(D)/I(G) or specific surface area, suggesting that morphology and the availability of active sites for NO2 have a significant impact. The MWCNTs#2 sample exhibited the smallest average diameter and produced a response of approximately 4.9% at 2 ppm NO2. Despite CNFs (2.8%/ppm) having a lower sensor response compared to MWCNTs#1 (1.65%/ppm), their sensitivity is different and higher than the latter.
Figure 7c,d show the response curves of gas sensors based on CNFs/MWCNTs#1 and CNFs/MWCNTs#2, with a suspension concentration of 3 mg/mL. Tests of the gas sensors indicated that the sensor based on MWCNTs#2 exhibited the highest response (8.5% at 2 ppm NO2) when created using layer-by-layer spraying (Figure 7d). When considering the hybrids, the layer-by-layer deposition technique displayed higher efficiency compared to the suspension-based technique. The full sensor characteristics are summarized in Tables S2 and S3 (Supplementary Materials). The method of spraying CNFs/MWCNTs hybrids had minimal impact on the response time (at 2 ppm NO2), which was within the range of 453–497 s. The recovery rate was not significantly enhanced, remaining within 10–20%. The effect of φ on the sensing behavior of hybrids is illustrated in Figures S4 and S5, and Tables S2 and S3 in the Supplementary Materials. The relation between the sensor response and φ is with a pronounced maximum at φ = 20–50% (depending on the type of hybrid, CNFs/MWCNTS#1 or CNFs/MWCNTs#2).
Based on the obtained results, it can be stated that the created composites have better recovery and response times compared to the single-material CNF- or MWCNT-based sensors (Table S4 in Supplementary Materials). Comparing the sensing behavior of the CNFs/MWCNTs hybrid sensor to pristine CNFs and MWCNTs, it can be noted that only the response time and SNR were increased in the hybrid, whereas the rest of the characteristics deteriorated. However, the signal-to-noise ratio of all samples decreased noticeably, except for the CNFs/MWCNTs#2-based sensor obtained by the layer-by-layer method. All samples exhibit low resistivity and, hence, good conductivity. The composites obtained by mixing them into a single suspension show the lowest resistance values. When comparing the composites with each other, it can be observed that the recovery degree is higher when applied using the layer-by-layer method than for the composites obtained by mixing them into a suspension. The response time is approximately the same for the composites made of CNFs/MWCNTs#1, regardless of the method used for their preparation. In the case of the composite of CNFs/MWCNTs#2, the sensor made using the layer-by-layer method exhibited a longer response time compared to the composite obtained by mixing the two types of carbon nanomaterials.
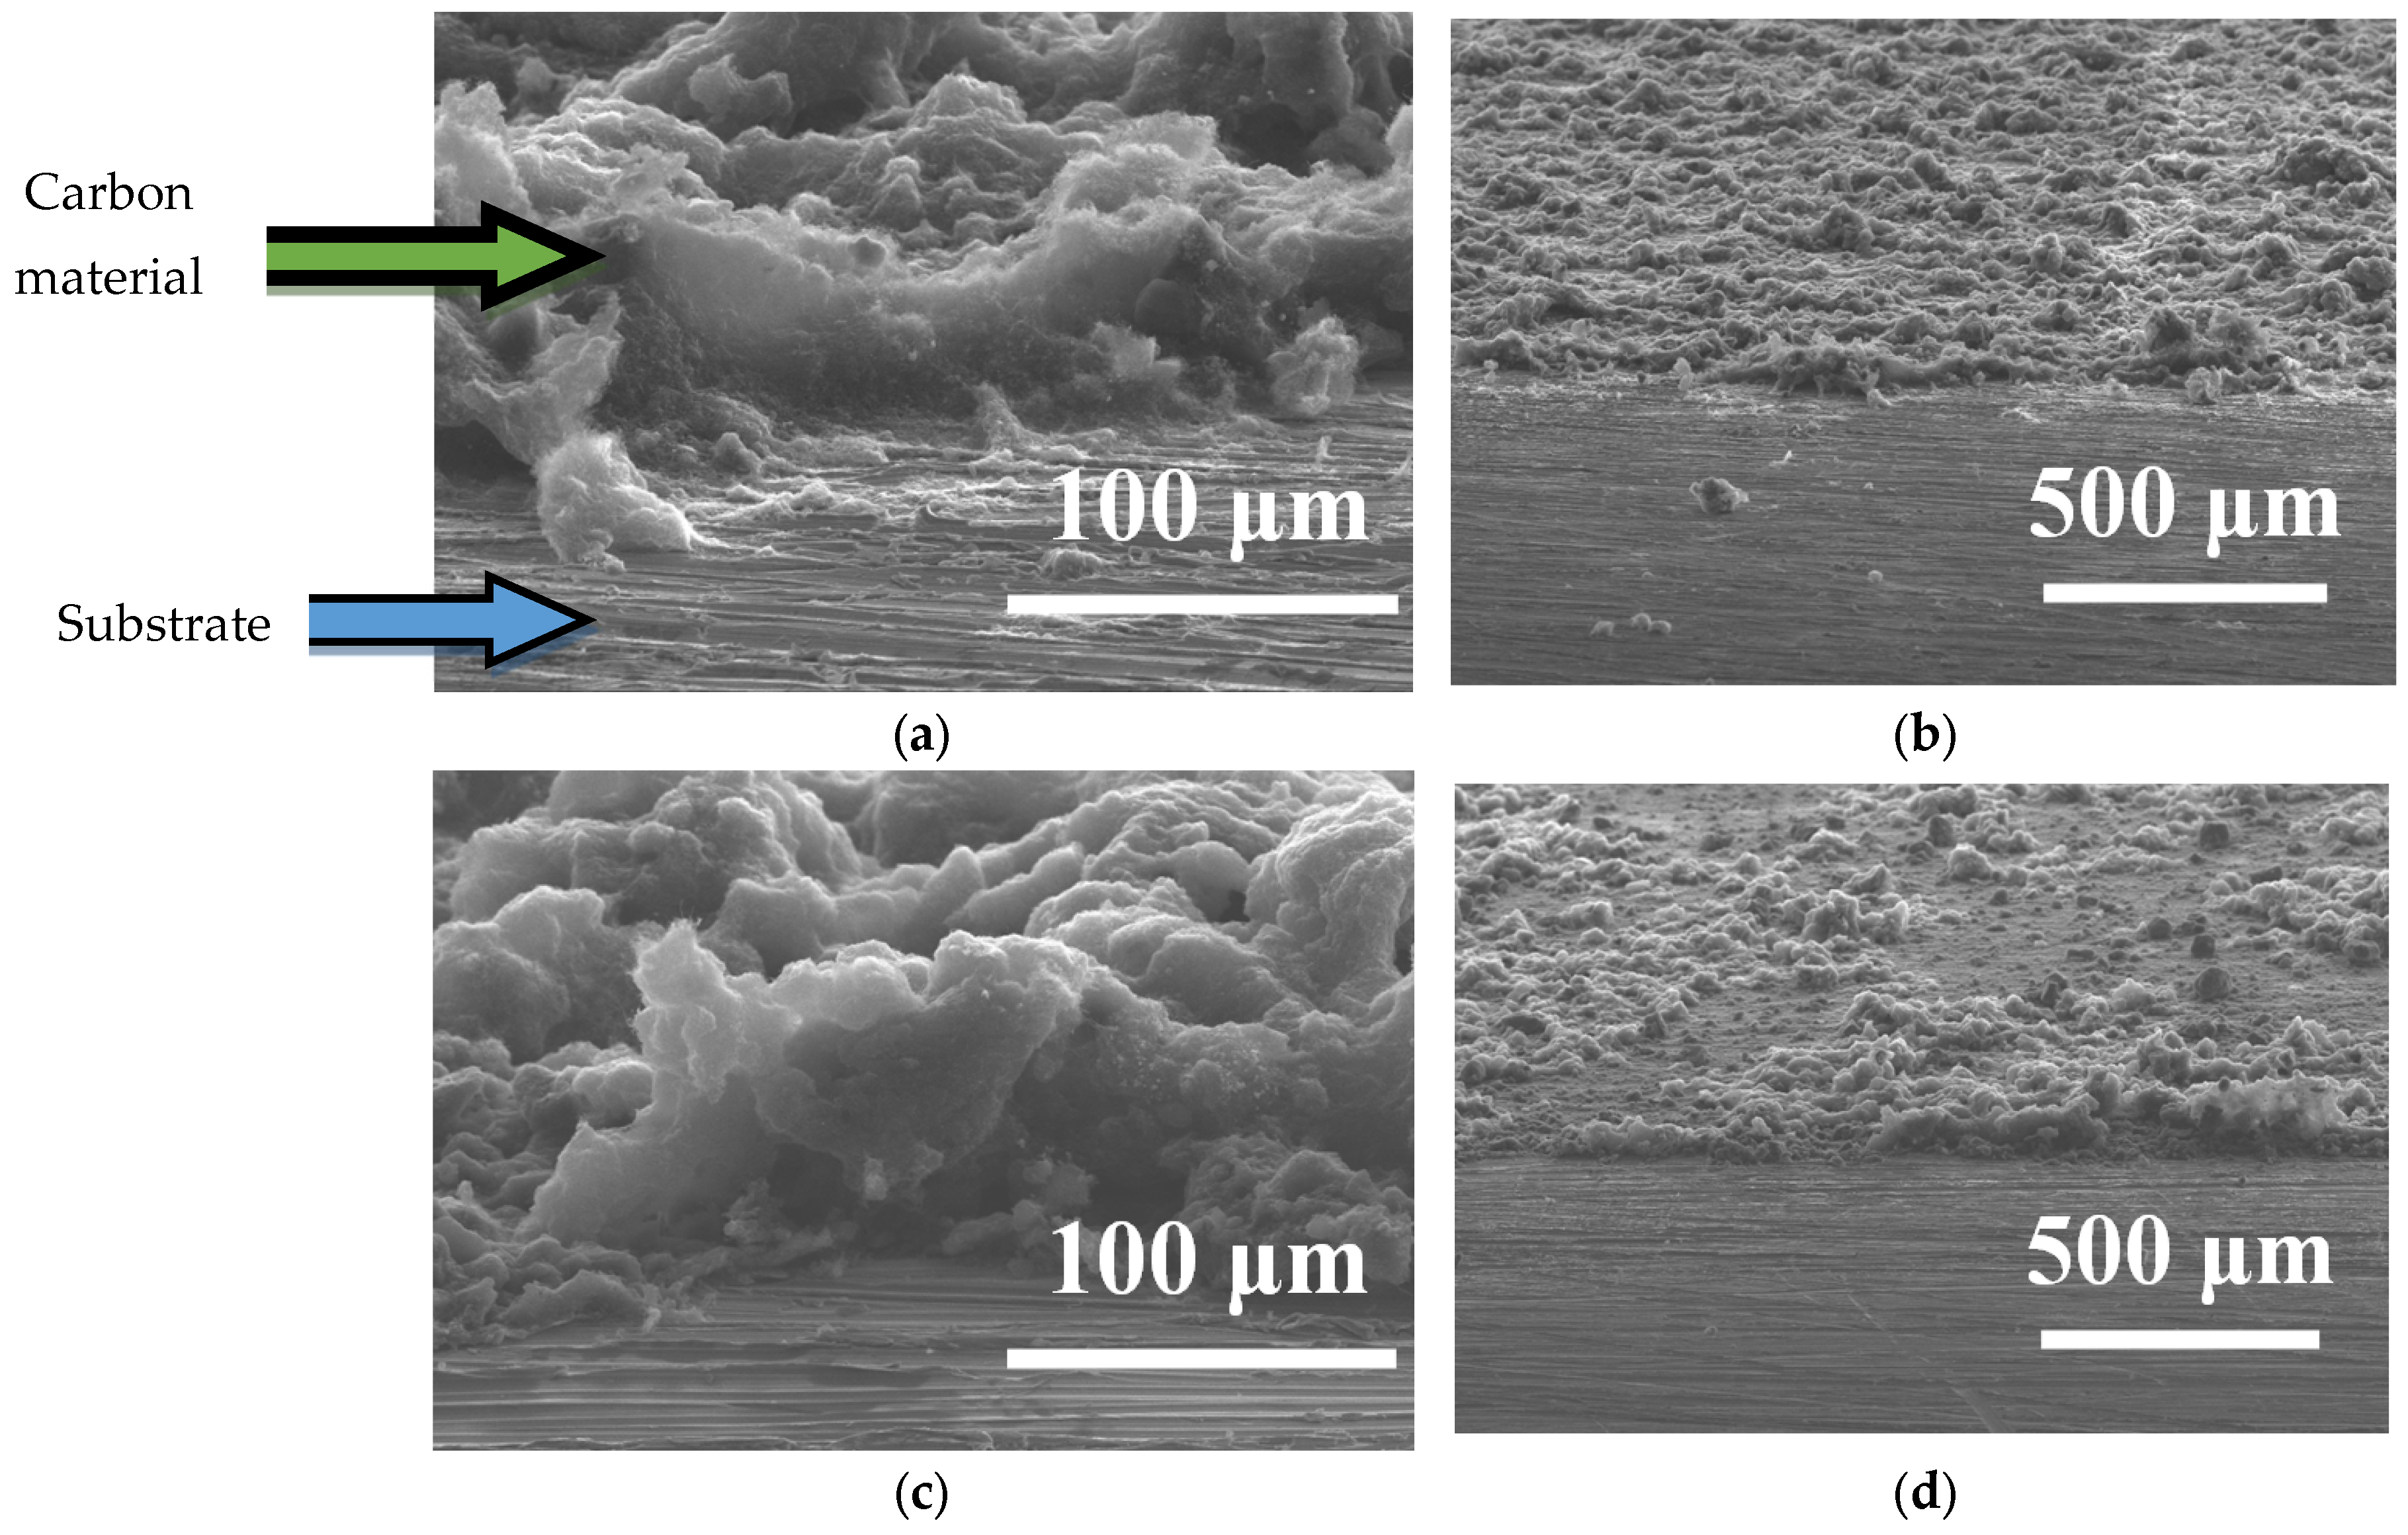
SEM images of the layer made of CNFs and MWCNTs#1, deposited by the suspension method, are shown in Figure 8a,b. The thickness ranged from 20 to 70 μm. Figure 8c,d show the layer of CNFs/MWCNTs#1 hybrid material deposited by the layer-by-layer method, where separate areas of CNFs and MWCNTs#1 can be observed. It can be noted that when MWCNTs#1 were deposited on top of the CNFs, the carbon nanotubes stuck together into distinct agglomerates. The thickness of this layer ranged from 20 to 80 μm. SEM images of CNFs/MWCNTs#2 sensor are given in Figure S6 (Supplementary Materials).
When comparing the best CNF-based sensor (30 mg/mL) and hybrid-based sensors, it can be seen that the composites show a poorer response compared to the CNFs alone. However, when comparing the composites with each other, it can be noted that the composite of CNFs and MWCNTs#2 demonstrated a better response (32%) than that of CNFs and MWCNTs#1 (28.7%). It can also be observed that the composites applied using the layer-by-layer method exhibited a better response than those in which a suspension of a mixture of carbon nanomaterials was applied, whereas the type of MWCNTs applied for the sensor film played not so much role in the formation of sensor characteristics. Probably, MWCNTs in CNFs/MWCNTs act as a bridge connecting CNF inclusions, since the resistance of hybrids reached 60–255 Ω compared to the kΩ-level of CNF-based sensors.
The higher sensor response of CNFs compared to hybrid-based sensors (Figure 7c,d) is mainly related to the porous structure of the CNF-based film, where the entire space is available for NO2 adsorption. The difference in response between composites produced by layer-by-layer and suspension methods arises because, in the layer-by-layer deposition with two types of MWCNTs, the sensor surface contains homogeneously distributed layers of each component. SEM images show that the top layer (i.e., MWCNTs) agglomerated into separate areas, so the adsorption sites of CNFs and MWCNTs remain largely accessible compared to composites obtained by the suspension method. The problem with composites produced by the suspension method is that when a mixed suspension of MWCNTs and CNFs is applied, a surface with uniform relief is formed (as shown by SEM), where the sorption centers of MWCNTs and CNFs overlap, resulting in a decreased response. The two types of composites form a film morphology in which the MWCNTs “shield” the penetration of NO2 molecules into the depth of the film, preventing enhancement of the sensor response. It can be suggested that not all the film volume based on the CNFs/MWCNTs system is available to adsorb the gas, whereas the morphology of a single CNF-based film is more porous compared to the hybrid-based films. Overall, the composites (CNFs/MWCNTs) form a structure in which the inner space of the film (which is sufficiently thick) is not available for NO2 adsorption, whereas the morphology of a single CNF-based film is more porous compared to that of the hybrid-based films. Probably, the surface area of a hybrid material-based film is lower compared to that of CNFs, but this is not a typical BET surface area. Rather, it refers to the area of the film in terms of the availability of adsorption sites throughout the thickness of the film.
Assuming that the specific surface area of CNFs is higher than that of both MWCNT types, it can also be noted that the partial substitution of CNF material (which had higher I(D)/I(G) ratio and surface area) with them could decrease the number of active sites for NO2 adsorption. However, we have suggested that the availability of these active adsorption sites has a dominating effect compared to porosity or defectiveness of the sensing material (especially in terms of thickness-dependent response in CNF-based films obtained by aerosol spraying).
Finally, a comparison of the sensing behavior of the studied material with that already reported can be made (Table 5).

3.5. Machine Learning

The treatment of experimental data on a sprayed CNF-based sensor (30 mg/mL) was carried out using machine learning. It has been made to describe the sensing behavior of two gases with an opposite change in resistance when in contact with CNFs, namely NO2 and NH3.
First, the initial data processing was performed. Since the resistance measurements were made over time, these data represented a time series. To study the dynamics of each time series, charts were constructed showing the dependence of resistance on time. Based on the nature of the dynamics, four types can be distinguished:
  • NH3 with a sharply increasing resistance;
  • NH3 with a long and strong decrease in resistance before the onset of growth;
  • NO2 with an initial rise in resistance followed by a decline;
  • NO2 with a continuous decrease in resistance.
For example, Figure S7 (Supplementary Materials) shows the dynamics of the third type. The data series exhibited quite complex dynamics, the nature of which depends on the gas type and measurement conditions. Furthermore, even within a single time series, sections with trends in opposite directions (for example, NO2 detection or NH3 detection, possessing different mechanisms) can be distinguished.
Before searching for points of structural change, it was decided to perform smoothing. This procedure will help reduce the influence of random measurement errors and improve the quality of subsequent analysis. The Savitzky–Golay filter was chosen for smoothing. It should be noted that the data were collected at a sampling rate of two measurements per second. This filter involves fitting an approximating polynomial of order in the neighborhood of each point using the least squares method [47]. To construct the polynomial, a set of l (an odd number) neighboring data points, located within an interval of width c, should be formed. For the selected elements, a variable substitution is performed:
z = q q ¯ c ,
where q ¯ —The value of the central time point of the time series, q—the current time point of the time series.
As a result of this substitution, the new variable z will take on the values 1 l 2 ,   ,   0 ,   , l 1 2 . A polynomial of degree s is defined as follows:
Γ = γ 0 + γ 1 z + γ 2 z 2 + + γ s z s ,
Coefficients of γ = γ 0 ,   γ 1 ,   ,   γ s vectors are determined using:
γ =   ( J T J ) 1 J T y ,
where J(l × s + 1)—the Vandermonde matrix, that is, the i-th row of J takes the values 1 , z i , z i 2 z i s .
The following algorithm is proposed for finding the trend change point. In the description of the algorithm, it is assumed that xi is the i-th element of the time series.
5.
Initialization of initial values: i = 0, m—number of shifts, m = 0, width of window is w = 1500 data points. Window will be moved through the range [l0,lmax], where l0 = 0, lmax = 7000 with a step of Δl = 200 datapoints; initial range [a0,b0], where a0 = l0, b0 = w.
6.
A linear regression is used to determine the slope of the time series, which is constructed on the segment [am,bm]. The sign and magnitude of the estimated slope coefficient φm allow us to infer the direction and intensity of data change over time.
7.
m = m + 1, am = am−1 + Δl, bm = bm−1 + Δl.
8.
If bm = lmax, then the algorithm terminates and returns to i = 0.
9.
A linear regression is constructed on the segment [am,bm] and φ ^ m is determined.
10.
If the sign of φ ^ m H has not changed compared to φ ^ m 1 , then proceed to step 3; otherwise, the algorithm terminates and returns i = (am + bm)/2.
To verify the accuracy of the trend change point detection, the Chow test [48] was applied. Afterward, the task of gas identification was addressed, for which a recurrent neural network was built and trained. The neural network received input values corresponding to the time points after the detected structural change. The input factors included temperature and relative humidity.
Next, for each resistance value, the values of sin_time and cos_time were computed as follows:
sin _ time =   s i n ( 2 π t T ) ,
cos _ time = c o s ( 2 π t T ) ,
where the current period was T = x i x i 1 . If, for some time points, the period T equals zero, then the value from the previous time point should be retained. The sin_time and cos_time values were also used as input factors to the neural network.
As an output feature, the neural network received the values of the following variables:
target   =   1 ,   i f     N H 3 0 ,   i f   N O 2 .
All time series were concatenated into a single vector. The total size was 110,708 elements. The resulting vector was then divided into three parts:
  • Training set, accounting for 80% of the total size, i.e., 88,566 elements;
  • Validation set, accounting for 10% of the total size, i.e., 11,071 elements;
  • Test set, accounting for 10% of the total size, i.e., 11,071 elements.
The splitting was performed using the “train_test_split” tool from the “sklearn” library. For the final assessment of classification quality, the number of elements in the test sample belonging to each class was obtained. Class 0 (related to NO2) corresponds to 6425 elements, and class 1 (related to NH3) to 4646 elements.
Due to the binary classification, a sigmoid activation function was used. Training was conducted over 500 epochs, as further increases did not lead to a significant improvement in classification quality. The Adam optimizer [49] was used to minimize the loss function.
The binary cross-entropy was used as the loss function:
L B C E ( y , y ^ ) = 1 n i = 1 n y i log ( y ^ i ) + ( 1 y i ) log ( 1 y ^ i ) ,
where n is the number of samples in the dataset, yi is the true class label for element i, and y ^ i is the predicted probability of class 1 for element i.
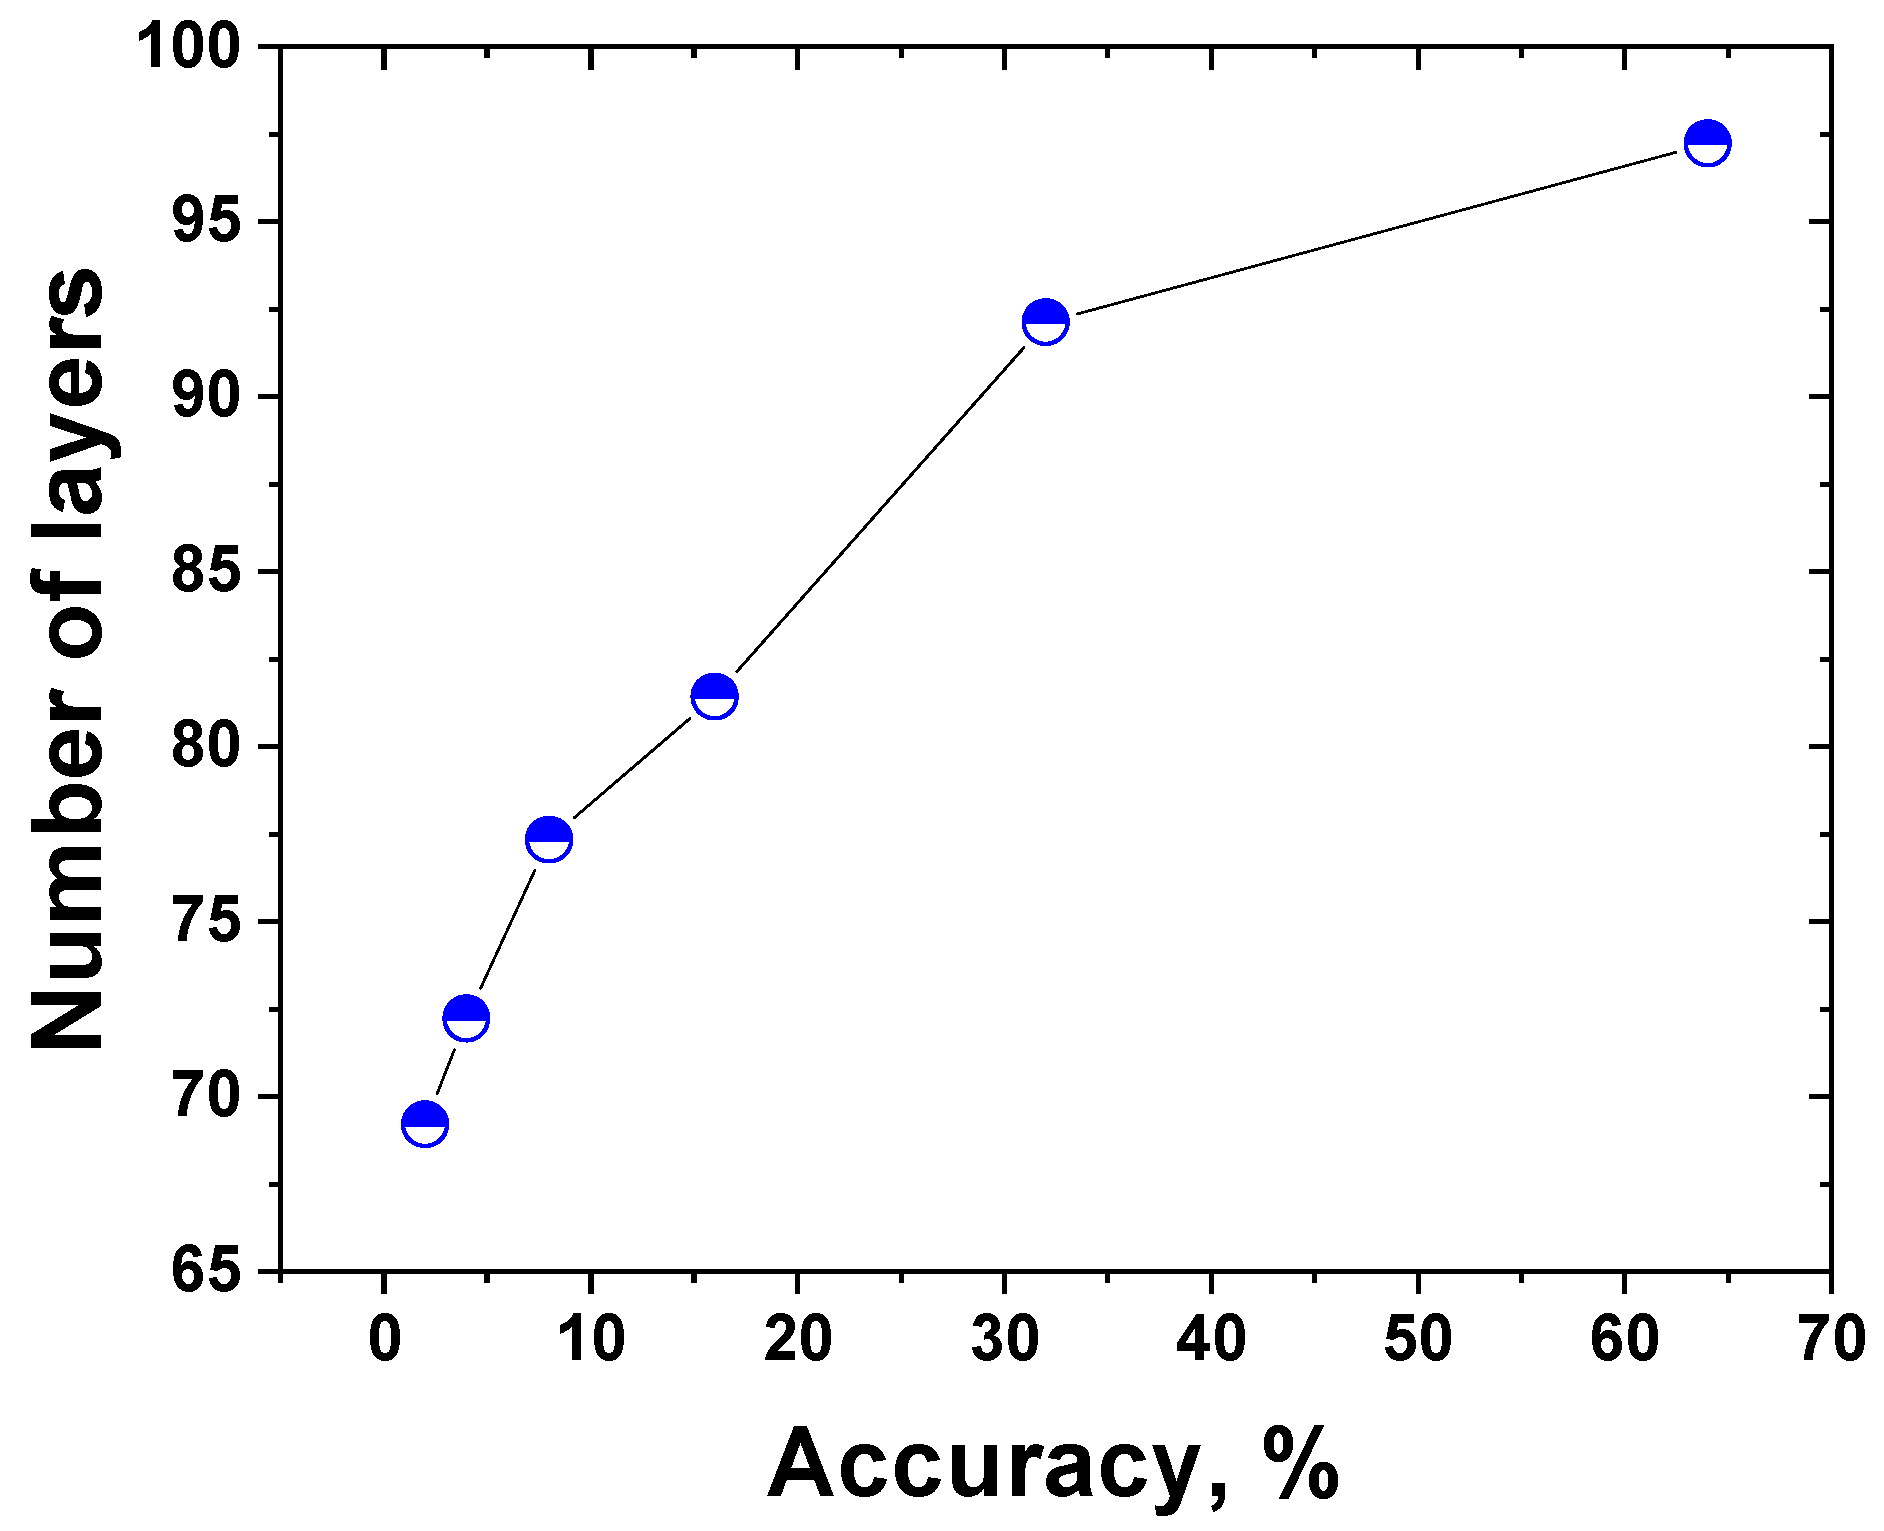
To determine the optimal neural network architecture, additional research was conducted. A series of neural networks with varying numbers of hidden layers was trained; the configurations considered are presented in Figure 9. The best option is a neural network with a single hidden layer of 32 neurons, as further increases could lead to overfitting.
The final accuracy on training data was 92.13%, and on validation data, it was 91.98%.

4. Conclusions

This research highlights the significant role of the sensing film creation technique, which can be considered one of the ways to control the characteristics of the NO2 gas sensor. The data obtained demonstrate that the concentration of CNF/ethanol suspension used for spraying the sensor films is one of the factors that can affect the behavior of the NO2 sensor at room temperature (25 ± 1 °C). It was found that increasing the concentration of the CNF suspension improves the gas sensor response (from 24.5% to 47.3% at 10 ppm NO2) and the signal-to-noise ratio (from 144:1 to 1577:1); however, the response time deteriorates (from 387 s to 541 s). The deposition of more CNFs results in a greater number of NO2 molecules absorbing more electrons. The film thickness also affects the response of the gas sensor at NO2 concentrations of 2–5 ppm. As the film thickness increases, the number of CNF aggregates rises, impacting the response at low NO2 concentrations. With increased film thickness, the response improves (from 7% to 10.6% at 2 ppm NO2) as does the signal-to-noise ratio (from 735:1 to 1892:1). The creation of hybrid all-carbon composites based on CNFs and MWCNTs resulted in a decrease in both sensor response and signal-to-noise ratio; however, the response time and recovery degree improved. The layer-by-layer method of applying the active layer of the sensor demonstrated better values for all gas-sensitive characteristics compared to the method based on spraying a CNFs/MWCNTs suspension. The machine learning data used to describe the sensing behavior of two gases with opposite resistance changes when in contact with CNFs, namely NO2 and NH3, showed final accuracies of 92.13% on the training data and 91.98% on the validation data.

Supplementary Materials

The following supporting information can be downloaded at: https://www.mdpi.com/article/10.3390/app152212110/s1, Figure S1: XPS spectrum of CNFs; Figure S2: Response of CNFs-based gas sensor to NH3 at room temperature; Figure S3: Response of the CNF-based gas sensor as a function of relative humidity (2–75%) for 2 ppm NO2 (a) and sensing curves vs. relative humidity (b) (25 ± 1 °C); Figure S4: Response of CNFs and MWCNTs#1 based gas sensor as a function of air humidity (2–75%) for NO2 concentrations of 2 ppm (a) and 2–10 ppm (b); Figure S5: Characteristics of gas sensors based on CNFs and MWCNTs#2 as a function of air humidity (2–75%) for NO2 concentrations of 2 ppm (a) and 2–10 ppm (b); Figure S6: SEM images of CNFs/MWCNTs#2 sensors fabricated by suspension (a,b) and layer-by-layer (c,d) spraying methods; Figure S7: Typical resistance change curve of CNF-based sensor (30 mg/mL, NO2, 25 °C). Table S1: Characteristics of sensor (CNFs, 30 mg/mL) as a function of relative humidity in relation to 2–10 ppm NO2 (25 ± 1 °C); Table S2: Characteristics of gas sensors based on CNFs and MWCNTs#1 composite at different relative humidity with respect to 2–10 ppm NO2 (25 ± 1 °C); Table S3: Test results of gas sensors based on CNFs and MWCNTs#2 composite at different relative humidity with respect to 2–10 ppm NO2 (25 ± 1 °C); Table S4: Test results of CNFs based gas sensors, MWCNTs#1 and MWCNTs#2 in relation to 2–10 ppm NO2 (25 ± 1 °C); Table S5: Test results of gas sensors based on composites.

Author Contributions

Conceptualization—A.S., V.G., and A.B.; Data curation—A.S., V.G., E.V., V.T., and A.B.; Formal analysis—E.V. and V.T.; Funding acquisition—A.B.; Investigation—A.S., E.M., V.G., E.V., and V.T.; Methodology—A.S., V.G., and A.B.; Project administration—A.B.; Resources—V.G., E.V., V.T., E.M., and A.B.; Software—E.V. and V.T.; Supervision—A.B.; Writing—original draft—A.S., V.G., and A.B.; Writing—review and editing—A.S., V.G., and A.B. All authors have read and agreed to the published version of the manuscript.

Funding

This work was partially supported by the State task of the Ministry of Higher Education and Science (code no. FSUN-2023-0008).

Institutional Review Board Statement

Not applicable.

Informed Consent Statement

Not applicable.

Data Availability Statement

Data are available on request.

Conflicts of Interest

The authors declare no conflicts of interest.

References

  1. Yoo, Y.-S.; Bhardwaj, A.; Hong, J.-W.; Im, H.-N.; Song, S.-J. Sensing Performance of a YSZ-Based Electrochemical NO2 Sensor Using Nanocomposite Electrodes. J. Electrochem. Soc. 2019, 166, B799–B804. [Google Scholar] [CrossRef]
  2. Yu, C.; Wu, Y.; Liu, X.; Fu, F.; Gong, Y.; Rao, Y.J.; Chen, Y. Miniature Fiber-Optic NH3 Gas Sensor Based on Pt Nanoparticle-Incorporated Graphene Oxide. Sens. Actuators B Chem. 2017, 244, 107–113. [Google Scholar] [CrossRef]
  3. Pasupuleti, K.S.; Reddeppa, M.; Chougule, S.S.; Bak, N.-H.; Nam, D.J.; Jung, N.; Cho, H.D.; Kim, S.G.; Kim, M.D. High Performance Langasite Based SAW NO2 Gas Sensor Using 2D g-C3N4@TiO2 Hybrid Nanocomposite. J. Hazard. Mater. 2022, 427, 128174. [Google Scholar] [CrossRef]
  4. Zamani, C.; Shimanoe, K.; Yamazoe, N. A New Capacitive-Type NO2 Gas Sensor Combining an MIS with a Solid Electrolyte. Sens. Actuators B Chem. 2005, 109, 216–220. [Google Scholar] [CrossRef]
  5. Gao, X.; Zhang, T. An Overview: Facet-Dependent Metal Oxide Semiconductor Gas Sensors. Sens. Actuators B Chem. 2018, 277, 604–633. [Google Scholar] [CrossRef]
  6. Nasri, A.; Pétrissans, M.; Fierro, V.; Celzard, A. Gas Sensing Based on Organic Composite Materials: Review of Sensor Types, Progresses and Challenges. Mater. Sci. Semicond. Process. 2021, 128, 105744. [Google Scholar] [CrossRef]
  7. Ma, D.; Su, Y.; Tian, T.; Yin, H.; Huo, T.; Shao, F.; Yang, Z.; Hu, N.; Zhang, Y. Highly Sensitive Room-Temperature NO2Gas Sensors Based on Three-Dimensional Multiwalled Carbon Nanotube Networks on SiO2 Nanospheres. ACS Sustain. Chem. Eng. 2020, 8, 13915–13923. [Google Scholar] [CrossRef]
  8. Yi, N.; Cheng, Z.; Li, H.; Yang, L.; Zhu, J.; Zheng, X.; Chen, Y.; Liu, Z.; Zhu, H.; Cheng, H. Stretchable, Ultrasensitive, and Low-Temperature NO2 Sensors Based on MoS2@rGO Nanocomposites. Mater. Today Phys. 2020, 15, 100265. [Google Scholar] [CrossRef]
  9. Salih, E.; Ayesh, A.I. First Principle Study of Transition Metals Codoped MoS2 as a Gas Sensor for the Detection of NO and NO2 Gases. Phys. E Low-Dimens. Syst. Nanostruct. 2021, 131, 114736. [Google Scholar] [CrossRef]
  10. Kumar, R.; Singh, R.; Kumar, A.; Kashyap, R.; Kumar, D.; Kumar, M. Chemically Functionalized Graphene Oxide Thin Films for Selective Ammonia Gas Sensing. Mater. Res. Express 2020, 7, 015612. [Google Scholar] [CrossRef]
  11. Xu, Y.; Xie, J.; Zhang, Y.; Tian, F.H.; Yang, C.; Zheng, W.; Liu, X.; Zhang, J.; Pinna, N. Edge-Enriched WS2 Nanosheets on Carbon Nanofibers Boosts NO2 Detection at Room Temperature. J. Hazard. Mater. 2021, 411, 125120. [Google Scholar] [CrossRef] [PubMed]
  12. Valdés-Madrigal, M.A.; Montejo-Alvaro, F.; Cernas-Ruiz, A.S.; Rojas-Chávez, H.; Román-Doval, R.; Cruz-Martinez, H.; Medina, D.I. Role of Defect Engineering and Surface Functionalization in the Design of Carbon Nanotube-Based Nitrogen Oxide Sensors. Int. J. Mol. Sci. 2021, 22, 12968. [Google Scholar] [CrossRef] [PubMed]
  13. Zhang, D.; Liu, J.; Jiang, C.; Liu, A.; Xia, B. Quantitative Detection of Formaldehyde and Ammonia Gas via Metal Oxide-Modified Graphene-Based Sensor Array Combining with Neural Network Model. Sens. Actuators B Chem. 2017, 240, 55–65. [Google Scholar] [CrossRef]
  14. Bielecki, Z.; Stacewicz, T.; Smulko, J.; Wojtas, J. Ammonia Gas Sensors: Comparison of Solid-State and Optical Methods. Appl. Sci. 2020, 10, 5111. [Google Scholar] [CrossRef]
  15. Zhou, T.; Zhang, T. Recent Progress of Nanostructured Sensing Materials from 0D to 3D: Overview of Structure–Property-Application Relationship for Gas Sensors. Small Methods 2021, 5, 1–32. [Google Scholar] [CrossRef]
  16. Zhao, Q.; Zhou, W.; Zhang, M.; Wang, Y.; Duan, Z.; Tan, C.; Liu, B.; Ouyang, F.; Yuan, Z.; Tai, H.; et al. Edge-Enriched Mo2TiC2Tx/MoS2 Heterostructure with Coupling Interface for Selective NO2 Monitoring. Adv. Funct. Mater. 2022, 32, 2203528. [Google Scholar] [CrossRef]
  17. Lee, K.; Yoo, Y.K.; Chae, M.S.; Hwang, K.S.; Lee, J.; Kim, H.; Hur, D.; Lee, J.H. Highly Selective Reduced Graphene Oxide (RGO) Sensor Based on a Peptide Aptamer Receptor for Detecting Explosives. Sci. Rep. 2019, 9, 10297. [Google Scholar] [CrossRef]
  18. Valentini, L.; Armentano, I.; Kenny, J.M.; Cantalini, C.; Lozzi, L.; Santucci, S. Sensors for Sub-Ppm NO2 Gas Detection Based on Carbon Nanotube Thin Films. Appl. Phys. Lett. 2003, 82, 961–963. [Google Scholar] [CrossRef]
  19. Barthwal, S.; Singh, B.; Singh, N.B. ZnO-SWCNT Nanocomposite as NO2 Gas Sensor. Mater. Today Proc. 2018, 5, 15439–15444. [Google Scholar] [CrossRef]
  20. Oweis, R.J.; Albiss, B.A.; Al-Widyan, M.I.; Al-Akhras, M.A. Hybrid Zinc Oxide Nanorods/Carbon Nanotubes Composite for Nitrogen Dioxide Gas Sensing. J. Electron. Mater. 2014, 43, 3222–3228. [Google Scholar] [CrossRef]
  21. Huang, M.; Cui, Z.; Yang, X.; Zhu, S.; Li, Z.; Liang, Y. Pd-Loaded In2O3 Nanowire-like Network Synthesized Using Carbon Nanotube Templates for Enhancing NO2 Sensing Performance. RSC Adv. 2015, 5, 30038–30045. [Google Scholar] [CrossRef]
  22. Zhang, W.; Zhang, D.; Zhang, Y. High-Performance NO2 Gas Sensor Based on Bimetallic Oxide CuWO4 Decorated with Reduced Graphene Oxide. J. Mater. Sci. Mater. Electron. 2020, 31, 6706–6715. [Google Scholar] [CrossRef]
  23. Kim, J.H.; Mirzaei, A.; Zheng, Y.; Lee, J.H.; Kim, J.Y.; Kim, H.W.; Kim, S.S. Enhancement of H2S Sensing Performance of P-CuO Nanofibers by Loading p-Reduced Graphene Oxide Nanosheets. Sens. Actuators B Chem. 2019, 281, 453–461. [Google Scholar] [CrossRef]
  24. Lumbers, B.; Agar, D.W.; Gebel, J.; Platte, F. Mathematical Modelling and Simulation of the Thermo-Catalytic Decomposition of Methane for Economically Improved Hydrogen Production. Int. J. Hydrogen Energy 2022, 47, 4265–4283. [Google Scholar] [CrossRef]
  25. Bannov, A.G.; Lapekin, N.I.; Kurmashov, P.B.; Ukhina, A.V.; Manakhov, A. Room-Temperature NO2 Gas Sensors Based on Granulated Carbon Nanofiber Material. Chemosensors 2022, 10, 525. [Google Scholar] [CrossRef]
  26. Drewniak, S.; Drewniak, Ł.; Pustelny, T. Mechanisms of NO2 Detection in Hybrid Structures Containing Reduced Graphene Oxide: A Review. Sensors 2022, 22, 5316. [Google Scholar] [CrossRef]
  27. Orlando, A.; Mushtaq, A.; Gaiardo, A.; Valt, M.; Vanzetti, L.; Costa Angeli, M.A.; Avancini, E.; Shkodra, B.; Petrelli, M.; Tosato, P.; et al. The Influence of Surfactants on the Deposition and Performance of Single-Walled Carbon Nanotube-Based Gas Sensors for NO2 and NH3 Detection. Chemosensors 2023, 11, 127. [Google Scholar] [CrossRef]
  28. Kuvshinov, G.G.; Mogilnykh, Y.I.; Kuvshinov, D.G.; Yermakov, D.Y.; Yermakova, M.A.; Salanov, A.N.; Rudina, N.A. Mechanism of Porous Filamentous Carbon Granule Formation on Catalytic Hydrocarbon Decomposition. Carbon 1999, 37, 1239–1246. [Google Scholar] [CrossRef]
  29. Han, D.; Zhai, L.; Gu, F.; Wang, Z. Highly Sensitive NO2 Gas Sensor of Ppb-Level Detection Based on In2O3 Nanobricks at Low Temperature. Sens. Actuators B Chem. 2018, 262, 655–663. [Google Scholar] [CrossRef]
  30. Choi, S.W.; Kim, J.; Byun, Y.T. Highly Sensitive and Selective NO2 Detection by Pt Nanoparticles-Decorated Single-Walled Carbon Nanotubes and the Underlying Sensing Mechanism. Sens. Actuators B Chem. 2017, 238, 1032–1042. [Google Scholar] [CrossRef]
  31. Ferrari, A.C.; Robertson, J. Interpretation of Raman spectra of disordered and amorphous carbon. Phys. Rev. B 2000, 61, 14095–14107. [Google Scholar] [CrossRef]
  32. Ferrari, A.C. Raman Spectroscopy of Graphene and Graphite: Disorder, Electron-Phonon Coupling, Doping and Nonadiabatic Effects. Solid State Commun. 2007, 143, 47–57. [Google Scholar] [CrossRef]
  33. Sivakumar, R.; Krishnamoorthi, K.; Vadivel, S.; Govindasamy, S. Progress towards a Novel NO2 Gas Sensor Based on SnO2/RGO Hybrid Sensors by a Facial Hydrothermal Approach. Diam. Relat. Mater. 2021, 116, 108418. [Google Scholar] [CrossRef]
  34. Yang, Z.; Zhang, D.; Chen, H. MOF-Derived Indium Oxide Hollow Microtubes/MoS2 Nanoparticles for NO2 Gas Sensing. Sens. Actuators B Chem. 2019, 300, 127037. [Google Scholar] [CrossRef]
  35. Chu, S.-Y.; Wu, M.-J.; Yeh, T.-H.; Lee, C.-T.; Lee, H.-Y. Sensing Mechanism and Characterization of NO2 Gas Sensors Using Gold-Black NP-Decorated Ga2O3 Nanorod Sensing Membranes. ACS Sens. 2024, 9, 118–125. [Google Scholar] [CrossRef] [PubMed]
  36. Martin, C.A.; Sandler, J.K.W.; Shaffer, M.S.P.; Schwarz, M.K.; Bauhofer, W.; Schulte, K.; Windle, A.H. Formation of Percolating Networks in Multi-Wall Carbon-Nanotube-Epoxy Composites. Compos. Sci. Technol. 2004, 64, 2309–2316. [Google Scholar] [CrossRef]
  37. Heaney, M. Complex Ac Conductivity of a Carbon Black Composite as a Function of Frequency, Composition, and Temperature. Phys. Rev. B-Condens. Matter Mater. Phys. 1999, 60, 12746–12751. [Google Scholar] [CrossRef]
  38. Li, W.; Lefferts, M.J.; Armitage, B.I.; Murugappan, K.; Castell, M.R. Polypyrrole Percolation Network Gas Sensors: Improved Reproducibility through Conductance Monitoring during Polymer Growth. ACS Appl. Polym. Mater. 2022, 4, 2536–2543. [Google Scholar] [CrossRef]
  39. Armitage, B.I.; Murugappan, K.; Lefferts, M.J.; Cowsik, A.; Castell, M.R. Conducting Polymer Percolation Gas Sensor on a Flexible Substrate. J. Mater. Chem. C 2020, 8, 12669–12676. [Google Scholar] [CrossRef]
  40. Mukherjee, A.; Jaidev, L.R.; Chatterjee, K.; Misra, A. Nanoscale Heterojunctions of RGO-MoS2 composites for Nitrogen Dioxide Sensing at Room Temperature. Nano Express 2020, 1, 010003. [Google Scholar] [CrossRef]
  41. Nasriddinov, A.; Rumyantseva, M.; Konstantinova, E.; Marikutsa, A.; Tokarev, S.; Yaltseva, P.; Fedorova, O.; Gaskov, A. Effect of Humidity on Light-Activated No and No2 Gas Sensing by Hybrid Materials. Nanomaterials 2020, 10, 915. [Google Scholar] [CrossRef] [PubMed]
  42. Yan, W.; Worsley, M.A.; Pham, T.; Zettl, A.; Carraro, C.; Maboudian, R. Effects of Ambient Humidity and Temperature on the NO2 Sensing Characteristics of WS2/Graphene Aerogel. Appl. Surf. Sci. 2018, 450, 372–379. [Google Scholar] [CrossRef]
  43. Zhang, F.; Lin, Q.; Han, F.; Wang, Z.; Tian, B.; Zhao, L.; Dong, T.; Jiang, Z. A Flexible and Wearable NO2 Gas Detection and Early Warning Device Based on a Spraying Process and an Interdigital Electrode at Room Temperature. Microsyst. Nanoeng. 2022, 8, 40. [Google Scholar] [CrossRef] [PubMed]
  44. Mane, A.T.; Navale, S.T.; Patil, V.B. Room Temperature NO2 Gas Sensing Properties of DBSA Doped PPy-WO3 Hybrid Nanocomposite Sensor. Org. Electron. 2015, 19, 15–25. [Google Scholar] [CrossRef]
  45. Jeong, H.Y.; Lee, D.S.; Choi, H.K.; Lee, D.H.; Kim, J.E.; Lee, J.Y.; Lee, W.J.; Kim, S.O.; Choi, S.Y. Flexible Room-Temperature NO2 Gas Sensors Based on Carbon Nanotubes/Reduced Graphene Hybrid Films. Appl. Phys. Lett. 2010, 96, 2–5. [Google Scholar] [CrossRef]
  46. Xie, T.; Sullivan, N.; Steffens, K.; Wen, B.; Liu, G.; Debnath, R.; Davydov, A.; Gomez, R.; Motayed, A. UV-Assisted Room-Temperature Chemiresistive NO2 Sensor Based on TiO2 Thin Film. J. Alloys Compd. 2015, 653, 255–259. [Google Scholar] [CrossRef]
  47. Ochieng, P.J.; Maróti, Z.; Dombi, J.; Krész, M.; Békési, J.; Kalmár, T. Adaptive Savitzky–Golay Filters for Analysis of Copy Number Variation Peaks from Whole-Exome Sequencing Data. Information 2023, 14, 128. [Google Scholar] [CrossRef]
  48. Chow, G.C. Tests of Equality Between Sets of Coefficients in Two Linear Regressions. Econometrica 1960, 28, 591–605. [Google Scholar] [CrossRef]
  49. Kingma, D.P.; Ba, J.L. Adam: A Method for Stochastic Optimization. In Proceedings of the 3rd International Conference for Learning Representations, San Diego, CA, USA, 7–9 May 2015; pp. 1–15. [Google Scholar]
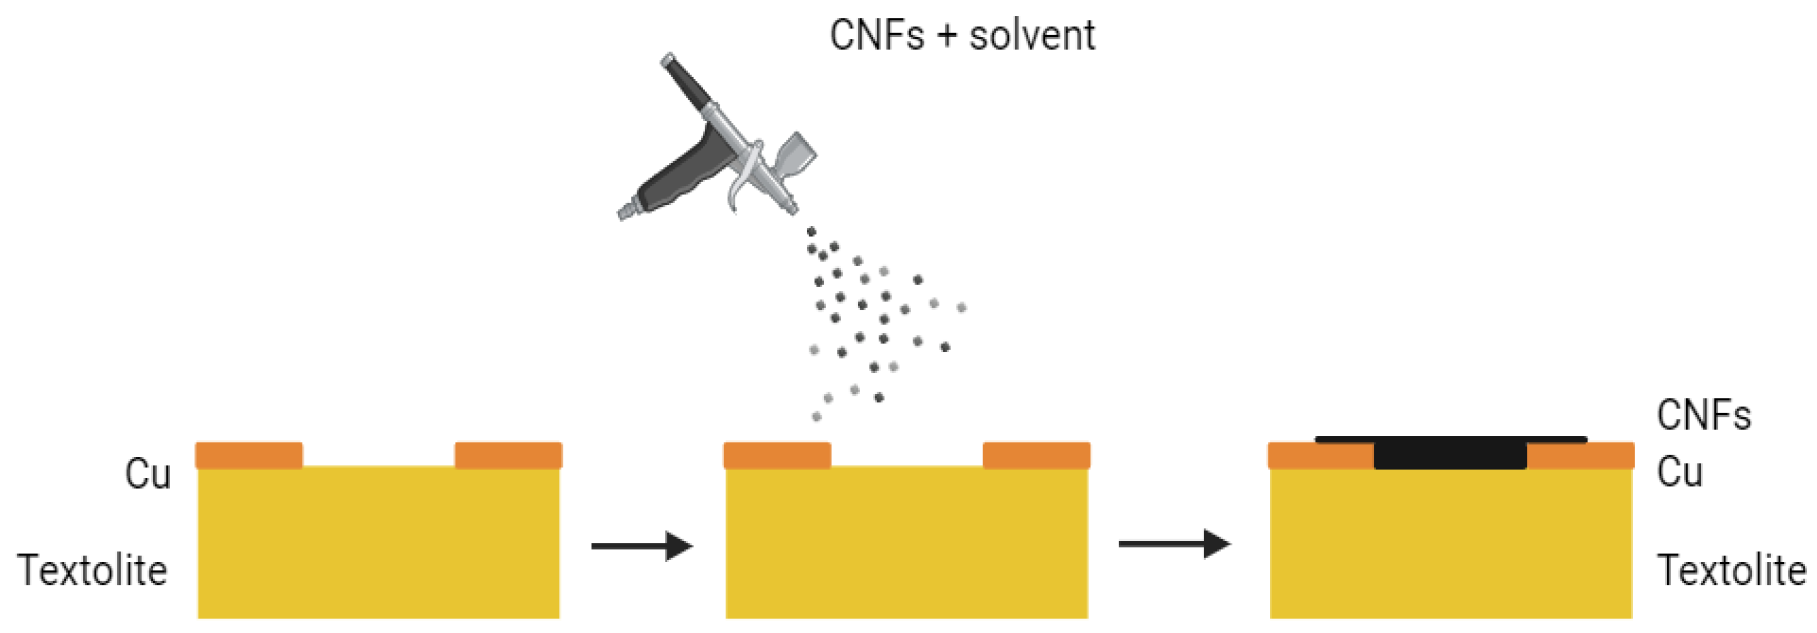
Figure 1. Scheme for spraying the CNFs onto the sensor substrate.
Applsci 15 12110 g001
Figure 2. Scheme for the spraying of hybrid films using layer-by-layer (a) and suspension (b) techniques.
Applsci 15 12110 g002aApplsci 15 12110 g002b
Figure 3. Setup for testing gas sensors.
Applsci 15 12110 g003
Figure 4. TEM images of CNFs (a,d), MWCNTs#1 (b,e), and MWCNTs#2 (c,f).
Applsci 15 12110 g004
Figure 5. Response to NO2 (25 ± 1 °C; φ = 2 ± 0.5%) of CNF-based gas sensors sprayed using a CNF/ethanol mixture at various concentrations (3–30 mg/mL) (a) and those sprayed with various solvents at a concentration of 3 mg/mL (b).
Applsci 15 12110 g005
Figure 6. SEM images of CNF-based samples with layer thicknesses of 15 ± 5 μm (a,d), 55 ± 15 μm (b,e), and 80 ± 13 μm (c,f).
Applsci 15 12110 g006
Figure 7. Response of various types of sensing materials: CNF-based gas sensors to NO2 as a function of film thickness (a); comparison of sensor response of carbon nanomaterials used creation of hybrids (b); response of gas sensors based on the CNFs/MWCNTs#1 (c) and CNFs/MWCNTs#2 (d) hybrid material sprayed using two approaches (25 ± 1 °C and φ = 2 ± 0.5%).
Applsci 15 12110 g007
Figure 8. SEM images of CNFs and MWCNTs#1-based sensors fabricated by suspension (a,b) and layer-by-layer (c,d) deposition methods.
Applsci 15 12110 g008
Figure 9. Dependence of the number of layers on accuracy.
Applsci 15 12110 g009
Table 1. Properties of the carbon nanomaterials used for NO2 sensor preparation.
PropertiesCNFsMWCNTs#1MWCNTs#2
Average diameter 1, nm31.2 ± 14.335.0 ± 3.026.8 ± 9.0
I(D)/I(G) 21.00.560.64
Specific surface area 3, m2/g1196882
1 According to TEM; 2 Calculated, using Raman spectroscopy data; 3 According to low-temperature nitrogen adsorption.
Table 2. Extended results of testing of gas sensors (25 ± 1 °C; φ = 2 ± 0.5%).
Concentration, mg/mLΔR/R0, %Response Time at 2 ppm, sRecovery Degree at 2 ppm, %R0, kΩSNR
2 ppm5 ppm10 ppm
31.239.8724.538724.520.4144:1
62.71228.545225.37.5782:1
122.716.5324563.73.4825:1
182.718.537.746820.83879:1
245.6203747131.22.471106:1
30123947.354100.3751577:1
Table 3. Effect of solvent on the NO2 gas sensing (25 ± 1 °C; φ = 2 ± 0.5%) characteristics of CNF-based films obtained by aerosol spraying.
SolventΔR/R0, %Response Time at 2 ppm, sRecovery Degree at 2 ppm, %R0, kΩSNR
2 ppm5 ppm10 ppm
Ethanol1.239.8724.538724.520.4144:1
Acetone1.946.419.943825.713.4250:1
Propanol-21.82122544464288.5:1
Table 4. Effect of average thickness of the film on the NO2 gas sensing (25 ± 1 °C; φ = 2 ± 0.5%) characteristics of CNF-based films obtained by aerosol spraying.
Average Thickness of the Film, μmΔR/R0, %Response Time at 2 ppm, sRecovery Degree at 2 ppm, %R0, kΩSNR
2 ppm5 ppm10 ppm
15 ± 5732.946.273119.72.76735:1
40 ± 79.43545.776211.61.621583:1
55 ± 1510.635.546.375410.51.141892:1
Table 5. Comparison of CNF-based sensor response with already reported data.
SampleOperating Temperature, °CNO2 Concentration, ppmSensor Response ΔR/R0, %Ref.
11.1 wt% rGO/SnO22510026[43]
PPy-WO338515[44]
CNTs/rGO201020[45]
CNFs (drop casting)25105.1[25]
TiO2n/a (room temperature)1002.4[46]
CNFs (aerosol spraying; 30 mg/mL)25212This work
Disclaimer/Publisher’s Note: The statements, opinions and data contained in all publications are solely those of the individual author(s) and contributor(s) and not of MDPI and/or the editor(s). MDPI and/or the editor(s) disclaim responsibility for any injury to people or property resulting from any ideas, methods, instructions or products referred to in the content.