Bridging Signal Intelligence and Clinical Insight: A Comprehensive Review of Feature Engineering, Model Interpretability, and Machine Learning in Biomedical Signal Analysis
Abstract
1. Introduction
Novel Conceptual Framework & Critical Synthesis
2. Methodology and Bibliometric Analysis
2.1. Search Databases
2.2. Inclusion Criteria
- Proposed or applied traditional machine learning (ML) techniques to biomedical signals (e.g., ECG, EEG, EMG, EVestG, PPG, respiratory sounds, tracheal breathing sounds, TBS).
- Addressed significant research gaps, such as novel feature engineering approaches, interpretability tools, or clinical validation of traditional ML models.
- Contributed to the theoretical frameworks or practical implementations of traditional ML in biomedical signal analysis.
2.3. Search Keywords and Queries
- Core ML Terms: Machine learning, ML, Support Vector Machine (SVM), K-Nearest Neighbors (KNN), Artificial Neural Network (ANN), explainable AI, PCA, ICA, UMAP, and t-SNE.
- Signal Types: biomedical signals, physiological signals, ECG, EEG, EMG, PPG, respiratory sounds, tracheal breathing sounds.
- Applications: Diagnosis, classification, anomaly detection, real-time monitoring, prognosis, personalized medicine.
- An example of a search query combining these keywords is: (“machine learning” OR “ML”) AND (“biomedical signals” OR “physiological signals” OR “Biomedical signals” OR “respiratory sounds”) AND (“diagnosis” OR “classification”).
2.4. Study Selection Process
- Initial Screening: Articles were initially assessed based on their titles and abstracts. This stage aimed to filter out irrelevant studies and identify potential candidates for full-text review.
- Full-Text Review: The full texts of the selected articles from the initial screening were thoroughly analyzed to ensure they met all the predefined inclusion criteria. This stage also involved identifying and excluding any duplicate publications or studies that did not align with the focus on traditional ML.
2.5. Bibliometric Analysis
3. ML vs. Deep Learning: Which One Does Serve Better Biomedical Signals?
3.1. Superior Interpretability and Transparency for Clinical Trust
3.2. Effectiveness with Limited and Imbalanced Data
3.3. Computational and Operational Efficiency
3.4. The Strategic Advantage of Feature Engineering and Clinical Insight
3.5. Alignment with Regulatory and Ethical Requirements
3.6. Evidence-Based Comparison of ML and DL for Biomedical Signals
3.6.1. Accuracy and Dataset Size
3.6.2. Interpretability
3.6.3. Computational Efficiency
3.6.4. Meta-Analytic Evidence
3.7. Research Questions and Identified Gaps
- RQ1: Which biomedical signal modalities and feature types are most effectively analyzed using traditional ML versus deep learning, and under what dataset conditions?
- RQ2: How do current ML methodologies balance predictive performance, interpretability, and clinical applicability, and what are the prevailing gaps in model transparency and regulatory compliance?
- RQ3: What methodological and validation shortcomings exist in current studies, and how can future research address these gaps to enhance trustworthy and clinically actionable ML solutions?
4. Feature Extraction in Biomedical Signal Analysis
4.1. Time-Domain Features
- Amplitude-based features: These include maximum, minimum, mean, root mean square (RMS), variance, and standard deviation of the signal. For instance, in EMG signals, RMS is a widely used feature to quantify muscle activity [26]. In tracheal breathing sounds, RMS reflects the power of the signal and is often correlated with the intensity of breathing [27].
- Morphological features: These describe the shape and characteristics of specific signal components. For ECG, features like P-wave duration, QRS complex duration, ST-segment elevation/depression, and T-wave amplitude are crucial for diagnosing cardiac conditions [28]. In surface EMG, Willison’s Amplitude Algorithm (WAMP) is used to detect muscular activity based on amplitude changes [13].
- Statistical features: Skewness and kurtosis provide information about the distribution of signal amplitudes. Zero-crossing rate, which counts the number of times the signal crosses the zero axis, can indicate the frequency content or periodicity of the signal and is particularly useful in respiratory sound analysis [29].
4.2. Frequency and Time-Frequency Domains Features
- Power Spectral Density (PSD): This measures the signal’s power distribution as a function of frequency. Features derived from PSD include total power in specific frequency bands (e.g., alpha, beta, theta, delta bands in EEG), peak frequency, and spectral edge frequency [30]. In respiratory sounds, specific frequency bands are analyzed for (100–250 Hz) and (300–500 Hz) [31].
- Spectral Centroid: Represents the center of mass of the spectrum, indicating where the bulk of the frequency content is located [30].
- Band Power Ratios: Ratios of power in different frequency bands can be highly discriminative, e.g., alpha/beta ratio in EEG for cognitive states [31].
- Mel-Frequency Cepstral Coefficients (MFCCs): While more common in speech processing, MFCCs have been successfully applied to tracheal breathing sounds for their ability to capture the spectral envelope, which is robust to variations in recording conditions [32].
- Wavelet Transform (WT): The Discrete Wavelet Transform (DWT) and Continuous Wavelet Transform (CWT) decompose a signal into different frequency components at various resolutions [33]. Features can be extracted from the wavelet coefficients, such as energy, entropy, and statistical moments within specific wavelet sub-bands [30]. Wavelet analysis is effective for capturing both transient and oscillatory phenomena in signals like ECG and EEG.
- Short-Time Fourier Transform (STFT): While less flexible than wavelets, STFT provides a spectrogram, which is a visual representation of the signal’s frequency content over time. Features can be extracted from the spectrogram, such as changes in power or dominant frequencies over specific time windows [34].
4.3. Advanced Time-Frequency Representations
4.4. Multi-Scale Feature Extraction
4.5. Non-Linear Features
- Chaos Theory Features: Measures like Lyapunov exponents, correlation dimension, and fractal dimension can characterize the chaotic dynamics of signals such as heart rate variability (HRV) and electroencephalogram (EEG). These features provide insights into the regularity and predictability of the system [39,40].
- Entropy Measures: Various entropy measures (e.g., Sample Entropy, Approximate Entropy, Permutation Entropy) quantify the regularity or irregularity of a time series. Lower entropy often indicates more predictable or regular patterns, while higher entropy suggests greater complexity or randomness. These are widely used in EEG for seizure detection and sleep stage classification, and in ECG for assessing cardiac health [16,36].
4.6. Higher-Order Statistics (HOS)
4.7. Automated Feature Engineering via Bio-Inspired Algorithms
4.8. Other Feature Extraction Techniques
- Statistical Features: Higher-order statistics (e.g., bispectrum, trispectrum) can capture non-linear relationships and non-Gaussian properties in signals that are not evident from second-order statistics (like power spectrum).
- Non-linear Dynamics and Chaos Features: For signals exhibiting chaotic or fractal properties, features like Lyapunov exponents, correlation dimension, and fractal dimension can be extracted. These are particularly relevant in EEG analysis for understanding brain states [48].
- Principal Component Analysis (PCA) and Independent Component Analysis (ICA): While primarily dimensionality reduction techniques, PCA and ICA can also be used for feature extraction by transforming the original signal into a new set of uncorrelated (PCA) or statistically independent (ICA) components, which can then serve as features [49]. ICA is effective for removing artifacts from EEG signals.
5. Feature Selection for Enhanced Model Performance
5.1. Filter Methods
- Variance Threshold: Removes features with very low variance, as they carry little information.
- Correlation-based Feature Selection (CFS): Selects features that are highly correlated with the class but lowly correlated with each other [52].
- Statistical Tests: Uses statistical measures like the Chi-squared test, the ANOVA F-value, or mutual information to assess the relationship between each feature and the target variable. Features with higher statistical scores are preferred [53].
5.2. Wrapper Methods
- Forward Selection: This starts with no features and adds at each step the feature that results in the highest model performance increase.
- Backward Elimination: It starts with all available features and removes the least important in a systematic way until the performance of the model begins to degrade.
- Recursive Feature Elimination (RFE): recursively trains the model, at each iteration removing features with the lowest importance score to get a subset of desired features [54].
5.3. Embedded Methods
- Lasso (L1 Regularization): Adds a penalty term to the loss function that forces some feature coefficients to become exactly zero, effectively performing feature selection [55].
- Tree-based Methods: Algorithms like Decision Trees, Random Forests, and Gradient Boosting Machines inherently perform feature selection by assigning importance scores to features based on how much they contribute to reducing impurity or error in the tree construction [56]. For instance, in the context of surface EMG signal classification, Random Forests and Decision Trees are suitable for feature selection and classification tasks, aiding in identifying key respiratory signal characteristics [13].
6. Machine Learning Algorithms for Biomedical Signals Classification
6.1. Linear Classifiers
6.1.1. Logistic Regression
- Applications: Used for disease prediction based on biomedical signals, such as ECG-based arrhythmia detection and classification of normal versus abnormal respiratory sounds [60].
- Performance: Performs well when the relationship between predictors and targets is approximately linear but may underperform on complex, non-linear datasets without appropriate feature transformations.
6.1.2. Linear Discriminant Analysis (LDA)
- Performance: Highly interpretable and practical for low-dimensional, linearly separable data but performance decreases when class distributions deviate from Gaussian assumptions.
6.1.3. Perceptron
- Applications: Early biomedical uses include binary classifications such as abnormal ECG beat detection and differentiation of breathing states [64].
- Performance: Effective for linearly separable data but inadequate for complex, non-linear problems. Modern extensions, such as Multi-Layer Perceptrons, address these limitations.
6.2. Probabilistic Classifiers
6.2.1. Naïve Bayes
- Applications: Naïve Bayes has been applied to real-time disease detection systems, EEG-based emotion recognition, and classification of respiratory and cardiovascular abnormalities in high-dimensional biomedical datasets [60].
- Performance: Performs efficiently even with limited training data and high-dimensional inputs, but its independence assumption may reduce accuracy when features are strongly correlated.
6.2.2. Gaussian Mixture Models (GMMs)
- Applications: GMMs have been used for speaker and breathing sound classification, sleep stage identification, and modeling variability in ECG and PPG signal patterns [65].
- Performance: Provide flexible modeling of non-linear and multi-modal data distributions but can be sensitive to initialization and may converge to local optima without proper parameter tuning.
6.3. Support Vector Machines (SVMs)
- Applications: SVMs have been successfully applied in various biomedical signal processing tasks, including:
- ECG Classification: Detecting cardiac arrhythmias [66].
- EEG Classification: Identifying different brain states or detecting epileptic seizures [67].
- EMG Classification: Recognizing muscle movements or diagnosing neuromuscular disorders [24].
- Respiratory Sound Classification: Classifying normal and abnormal breathing patterns in tracheal sounds [68].
- Performance: SVMs often achieve high accuracy, especially when combined with appropriate kernel functions (e.g., Radial Basis Function (RBF) kernel) that can capture non-linear relationships in the data. Their performance is highly dependent on the quality of the extracted features.
6.4. Instance-Based Classifiers
K-Nearest Neighbors (KNN)
- Applications: KNN has been used for:
- Performance: KNN’s performance is sensitive to the choice of ‘k’ and the distance metric used. It can be computationally expensive for large datasets during the prediction phase, as it requires calculating distances to all training samples. It is also sensitive to irrelevant features, highlighting the importance of effective feature selection.
6.5. Tree-Based Classifiers
6.5.1. Decision Trees
- Performance: Highly interpretable but prone to overfitting on noisy data unless pruned or regularized.
6.5.2. Random Forests
- Applications: Common in respiratory pathology classification, sleep disorder analysis, and general biomedical diagnostic systems [75].
- Performance: Offer high accuracy, robustness to noise, and feature-importance measures that enhance interpretability.
6.5.3. Gradient Boosting Machines (GBM)
- Applications: Used in disease prediction, ECG classification, and respiratory sound analysis [79].
- Performance: Achieve strong accuracy on complex datasets but require careful hyperparameter tuning to prevent overfitting.
6.5.4. XGBoost and LightGBM
- Applications: Extensively applied biomedical classification tasks with structured or tabular data [80].
- Performance: Deliver superior computational efficiency and predictive accuracy compared with conventional GBM.
6.6. Ensemble and Boosting Methods
6.6.1. AdaBoost (Adaptive Boosting)
- Performance: Offers high accuracy and robustness to overfitting when tuned properly but can be sensitive to noisy data and outliers since misclassified samples are given higher weights in subsequent rounds.
6.6.2. CatBoost (Categorical Boosting)
- Applications: CatBoost has been used in biomedical contexts such as multimodal disease prediction (combining anthropometric, physiological, and acoustic features) and respiratory sound analysis [82].
- Performance: Demonstrates strong performance even on small and heterogeneous biomedical datasets. Compared to other boosting algorithms like XGBoost and LightGBM, CatBoost provides better handling of categorical data and often superior interpretability through feature importance scores.
6.7. Neural Network-Based Classifiers
Artificial Neural Networks (ANNs)
- Applications: These algorithms are extensively applied in biomedical signal processing for:
- Respiratory Sound Classification: Extracting complex patterns from audio signals to detect wheezing, crackles, and other pathological sounds with high precision [84].
- Sleep Stage Classification: Processing multimodal data (EEG, EOG, EMG) to automatically classify sleep stages with performance rivaling human experts [85].
- Disease Diagnosis: Serving as the foundation for complex deep learning models that analyze images (e.g., MRI, X-ray), signals (e.g., ECG, EEG), and genetic data for diagnostic decision support [86].
- Performance: ANN with many layers can achieve state-of-the-art accuracy on complex tasks by automatically learning relevant features from raw or minimally processed data. However, they often require large amounts of training data, are computationally intensive, and can act as “black boxes,” making their decisions less interpretable than those of tree-based models [57]. Techniques like dropout and regularization are commonly used to mitigate overfitting.
6.8. Hybrid and Meta-Model Approaches
- Applications: Hybrid and meta-model frameworks have been widely adopted in biomedical signal processing, where data are often heterogeneous and non-linear. They have been successfully applied in respiratory sound classification, sleep stage detection, cardiovascular disease diagnosis, and multimodal fusion of anthropometric, physiological, and acoustic features. By combining classifiers optimized for different modalities, these approaches enhance generalizability and reduce bias associated with single-model predictions [87,88].
- Performance: Meta-models consistently outperform individual classifiers in terms of accuracy, sensitivity, and specificity, particularly in complex biomedical datasets. They offer robustness against noise and inter-subject variability while maintaining adaptability to new data distributions. However, their effectiveness depends on careful selection and weighting of base learners, and the interpretability of the final model can be more challenging than that of standalone algorithms.
7. Ensuring Unbiased Testing and Model Validation
7.1. Example of Subject-Independent Data Separation and External Testing
7.2. Data Standardization and Harmonization for Reproducible ML Pipelines
- Apply FAIR (Findable, Accessible, Interoperable and Reusable) data principles: Make your data Findable, Accessible, Interoperable and Reusable. FAIR data practices extend the life of your work and help others build on it.
8. Dimensionality Reduction & Feature Projection Methods
8.1. Principal Component Analysis (PCA)
- Applications: PCA has been extensively used in biomedical signal processing for EEG denoising, ECG beat classification, and feature selection in respiratory sound analysis [90].
- Performance: It enhances classifier performance by removing collinear features and noise but may lose discriminative information when class separability is non-linear.
8.2. Independent Component Analysis (ICA)
- Applications: ICA is commonly applied in EEG artifact removal (e.g., separating eye-blink or muscle noise from neural activity), as well as in respiratory and phonocardiogram signal separation [89].
- Performance: Effective in source separation and artifact removal; however, it may suffer from instability if the number of sources is unknown or when applied to small datasets.
8.3. Linear Discriminant Analysis (LDA) for Feature Projection
- Applications: LDA-based projection has been used for feature extraction in voice pathology detection, EEG-based emotion recognition, and sleep stage classification [95].
- Performance: More effective than PCA when class labels are available but assumes Gaussian-distributed classes with equal covariance matrices.
8.4. Non-Linear Manifold Learning Methods
- t-Distributed Stochastic Neighbor Embedding (t-SNE): Focuses on preserving local relationships between data points, making it highly effective for visualization of clusters (e.g., disease vs. healthy subjects) [96].
- Uniform Manifold Approximation and Projection (UMAP): Provides faster computation and better preservation of both local and global data structures compared to t-SNE [97].
- Performance: Excellent for exploration data analysis and visualization, but generally unsuitable as preprocessing for traditional classifiers due to non-deterministic mappings.
8.5. Autoencoders for Non-Linear Feature Compression
- Performance: Capable of learning complex, non-linear representations; however, they require sufficient data and careful regularization to avoid overfitting.
9. Interpretation of Traditional Machine Learning Models
9.1. Model-Specific Interpretability
- Decision Trees: These models are inherently interpretable as they represent a series of explicit rules. The path from the root to a leaf node provides a clear explanation for a specific prediction. Feature importance can also be directly derived from how often and how early a feature is used to split the data [100]. In biomedical applications, decision trees can provide clinically meaningful rules, such as “if RMS > 0.5 and spectral centroid < 800 Hz, then classify as abnormal breathing.”
- Random Forests: While an ensemble of many decision trees can be less straightforward to visualize than a single tree, Random Forests still provide feature importance scores. These scores indicate the relative contribution of each feature to the overall predictive power of the model, often calculated based on the decrease in impurity (e.g., Gini impurity) or accuracy when a feature is used for splitting [61].
- Support Vector Machines (SVMs): For linear SVMs, the weights assigned to each feature can indicate their importance. Features with larger absolute weights have a greater influence on the decision boundary. For non-linear SVMs with kernel tricks, direct interpretation of feature weights is more challenging, but techniques like examining support vectors can provide some insight into critical data points [64].
- Logistic Regression: As a linear model, logistic regression provides coefficients for each feature. The sign and magnitude of these coefficients indicate the direction and strength of the relationship between the feature and the log-odds of the target variable, making it highly interpretable [59].
9.2. Post Hoc Interpretability Methods
- Permutation Feature Importance: This model-agnostic technique measures the importance of a feature by calculating the increase in the model’s prediction error after permuting the feature’s values. A significant increase in error indicates that the feature is essential [101]. This method is beneficial for comparing feature importance across different model types. Figure 16 shows a sample feature of the importance of plot.
- Partial Dependence Plots (PDPs): PDPs show the marginal effect of one or two features on the predicted outcome of a machine learning model. They illustrate how the prediction changes as the feature value varies, while other features are averaged out [102,103]. In biomedical signal analysis, PDPs can show how changes in specific signal characteristics (e.g., spectral centroid) affect the probability of a particular diagnosis. Figure 17 shows a sample partial dependence plot.
- SHAP (SHapley Additive exPlanations): SHAP values quantify the contribution of each feature to a model’s prediction using concepts from cooperative game theory. They provide both global and local interpretability, showing how individual features drive predictions for specific instances and across the entire dataset [105,106]. SHAP is particularly useful in biomedical signal analysis to understand which signal characteristics most strongly influence diagnostic outcomes. Figure 19 shows a sample of the SHAP values plot.
- LIME (Local Interpretable Model-agnostic Explanations): LIME approximates complex models locally with interpretable surrogate models (e.g., linear models) to explain individual predictions. By perturbing input features and observing the changes in predictions, LIME identifies which features are most influential for a specific instance [107]. This method helps clinicians understand model decisions for individual patients without requiring complete model transparency. Figure 20 shows a sample LIME plot.
9.3. Visualization for Interpretation
- Feature Distribution Plots: Histograms, box plots, and violin plots can show the distribution of individual features and how they differ across classes. These visualizations can reveal which features are most discriminative and whether there are clear separations between different conditions [108].
- Scatter Plots and Pair Plots: These can reveal relationships between pairs of features and their correlation with the target variable. In biomedical signal analysis, scatter plots might show the relationship between time-domain and frequency-domain features [109].
- Confusion Matrices: For classification tasks, a confusion matrix provides a detailed breakdown of correct and incorrect predictions for each class, highlighting where the model is performing well and where it struggles [110].
- ROC Curves and Precision-Recall Curves: These plots are essential for evaluating classifier performance across different thresholds and understanding the trade-off between sensitivity and specificity or precision and recall [111].
9.4. Clinical Interpretation Considerations
- Feature Clinical Significance: The importance of a feature in the model should align with known clinical understanding. For example, if a model identifies spectral features related to wheezing as significant for respiratory disease classification, this aligns with clinical knowledge [112].
- Model Validation with Clinical Experts: Involving clinicians in the interpretation process can help validate whether the model’s decisions make clinical sense and identify potential biases or limitations [113].
- Uncertainty Quantification: Understanding confidence or uncertainty in model predictions is crucial for clinical decision-making. Traditional ML models can provide probability estimates or confidence intervals that help clinicians assess the reliability of forecasts [114].
9.5. Comparative Evaluation of Explainability Methods
10. Linking Feature Engineering to Clinical Interpretation
10.1. Clinical Mapping of Feature Categories
10.2. Model Interpretation in the Clinical Context
10.3. Integrative Perspective
10.4. Validation Against Clinical Gold Standards
11. Methods Performance Comparison of Traditional ML Algorithms
11.1. Performance Metrics
- Accuracy: The proportion of correctly classified instances. While intuitive, accuracy can be misleading in the presence of class imbalance, a common issue in medical datasets, where typical cases often outnumber abnormal ones [4].
- Precision: The proportion of accurate positive predictions among all optimistic predictions. It measures the model’s accuracy, which is crucial when false positives are costly (e.g., unnecessary medical procedures or patient anxiety) [52].
- Recall (Sensitivity): The ratio of correctly identified positive cases to the total number of actual positive instances. It reflects the model’s capability in terms of catching all the relevant cases and is especially critical when false negatives have high costs, such as in disease diagnosis scenarios [52].
- F1-Score: The harmonic mean of precision and recall, providing a proper balancing in evaluating the performance of a model. It is exceptionally useful in cases where there are class distribution imbalances, which is very common in medical and biomedical datasets [121].
- Specificity: The proportion of accurate pessimistic predictions among all actual negative instances. It measures the model’s ability to correctly identify negative cases, which is essential for avoiding false alarms [60].
- Area Under the Receiver Operating Characteristic Curve (AUC-ROC): It represents a plot of the true positive rate (recall) versus the false positive rate at various classification thresholds. The AUC value tells us about the probability that the model gives a higher score to a randomly chosen positive example than it does to a randomly chosen negative example, which helps in providing a more general and threshold-independent analysis of the overall performance of a classifier [52].
11.2. Algorithmic Comparison
- Support Vector Machines (SVMs): Often perform well on high-dimensional data and are robust to overfitting, especially when the number of features is greater than the number of samples [3]. They are effective when there is a clear margin of separation between classes. However, their performance can degrade with noisy data or when the data is not linearly separable, unless an appropriate kernel is selected [122]. In tracheal breathing sound analysis, SVMs have demonstrated exemplary performance for binary classification tasks [123].
- K-Nearest Neighbors (KNN): Simple and effective for small to medium-sized datasets. Its performance is highly dependent on the choice of ‘k’ and the distance metric used [71]. It can be computationally expensive for large datasets during prediction and is sensitive to irrelevant features and outliers. KNN may struggle with high-dimensional feature spaces, which are common in biomedical signal analysis [74].
- Decision Trees: Highly interpretable and can handle both numerical and categorical data. They are prone to overfitting, especially with complex datasets [124]. Their performance can be unstable, as even slight changes in data can lead to substantial changes in the tree structure. However, they provide clear decision rules that are valuable in clinical settings.
- Random Forests: Generally, offer superior performance compared to single decision trees due to their ensemble nature, which reduces overfitting and improves generalization [125]. They are robust to noise and outliers and can handle a large number of features. They also provide feature importance scores, which aid in interpreting the results [55]. Random Forests have shown consistent performance across various biomedical signal analysis tasks, for example, in OSA detection [126].
11.3. Comparative Studies in Biomedical Signal Analysis
11.4. Cross-Study Benchmarking and Quantitative Overview
11.5. Factors Affecting Performance
12. Case Study
12.1. Tracheal Breathing Sound (TBS) Analysis
12.1.1. Signal Acquisition and Preprocessing in TBS Analysis
- Filtering: Band-pass filters (e.g., 75 Hz to 3000 Hz) are commonly applied to remove low-frequency noise (e.g., heart sounds, body movements) and high-frequency noise [123]. The specific frequency range may be adjusted based on the target respiratory sounds and the clinical context.
- Segmentation: Isolating individual breath cycles is critical. This is achieved using amplitude-based thresholds, energy-based methods, or advanced algorithms that detect inspiratory and expiratory phases [123]. Accurate segmentation ensures that features are extracted from relevant respiratory events.
- Stationary part extraction: TBS signals exhibit nonstationarity due to variations in airflow, turbulence, and breathing effort. Identifying and extracting the most stationary portion, typically the mid-phase of inspiration or expiration, enhances the reliability of subsequent feature extraction. This step minimizes variability caused by transitional phases (onset and offset of breaths) and ensures that computed features accurately reflect stable respiratory behavior [123,126].
- Normalization: To minimize variability due to recording conditions or airflow fluctuations, TBS signals were scaled to a standard range to prevent features from being unduly influenced by recording conditions rather than actual physiological differences. This was achieved in two steps: first, through variance envelope normalization using a smoothed moving average over 64 samples, effectively standardizing the local signal amplitude; and second, by energy-based normalization, scaling each cycle by its standard deviation to reduce differences in airflow strength between breathing cycles [123].
12.1.2. Feature Extraction for Tracheal Breathing Sounds
- Time-Domain FeaturesTime-domain features capture the temporal characteristics of the TBS, providing insights into the signal’s intensity and morphology:
- Frequency-Domain FeaturesFrequency-domain features are derived from the spectral representation of TBS, typically obtained using techniques like Fast Fourier Transform (FFT) or Welch’s method. These features are crucial for identifying adventitious sounds:
- Time-Frequency FeaturesTime-frequency analysis provides insights into how the spectral content of TBS changes over time, which is crucial for analyzing non-stationary respiratory sounds:
- Spectrogram Features: Derived from the Short-Time Fourier Transform (STFT), spectrograms visually represent how frequency content evolves. Features can be extracted from spectrograms, such as the presence of horizontal lines (indicating wheezes) or vertical lines (indicating crackles) [84,123,130,131].
12.1.3. Feature Selection and Classification in TBS Analysis
- Classification Algorithms:
12.1.4. Applications and Clinical Relevance of TBS Analysis
- Respiratory Disease Monitoring: Changes in TBS characteristics can indicate the progression or improvement of respiratory diseases such as asthma or COPD [76].
- Post-operative Monitoring: TBS analysis can monitor patients after tracheostomy or other airway procedures, detecting complications such as airway obstruction [132].
- Pediatric Applications: TBS analysis is particularly valuable in pediatric populations where traditional spirometry may be challenging to perform [133].
12.1.5. Framework Validation and Generalization Potential
12.1.6. Interpretation of TBS Models
13. Challenges and Limitations of Traditional ML in Biomedical Signal Analysis
13.1. Reliance on Handcrafted Features
- Limited Generalizability: Features designed for one specific task or dataset may not generalize well to other tasks or diverse patient populations, requiring re-engineering for each new application. For example, features optimized for adult respiratory sounds may not work well for pediatric populations [136].
- Inability to Capture Complex Patterns: Traditional features might struggle to capture subtle, non-linear, or hierarchical patterns that are often present in complex biomedical signals, especially when dealing with high-dimensional data or long-duration recordings [136].
13.2. Sensitivity to Noise and Artifacts
13.3. Scalability Issues with Large Datasets
13.4. Limited Ability to Learn Hierarchical Representations
13.5. Interpretability vs. Performance Trade-Off
13.6. Handling Non-Stationarity
13.7. Feature Engineering Expertise Requirements
13.8. Limited Handling of Temporal Dependencies
14. Future Directions and Open Challenges
14.1. Real-Time Clinical Integration
14.2. Data Quality, Interpretability, and Scalability
14.3. Handling Complex Patterns and Generalizability
14.4. Ethical Considerations and Data Privacy
14.5. Multimodal Data Integration
14.6. Integration of Hybrid Approaches (Deep Learning + Traditional ML)
15. Specific Applications Beyond Diagnosis
15.1. Prognosis and Disease Progression Monitoring
15.2. Personalized Medicine
15.3. Rehabilitation and Assistive Technologies
15.4. Health Monitoring and Anomaly Detection
16. Data Preprocessing and Augmentation
16.1. Data Preprocessing
- Noise Reduction: Biomedical signals are often contaminated by various types of noise (e.g., power line interference, motion artifacts, baseline wander). Techniques such as digital filtering (low-pass, high-pass, band-pass, and notch filters) are commonly employed to remove unwanted frequency components. Wavelet denoising is also effective for preserving signal morphology while removing noise [150,151,152].
- Baseline Wander Removal: Slow, low-frequency fluctuations in the signal baseline can obscure relevant information. Methods such as polynomial fitting, median filtering, or wavelet decomposition can be used to correct baseline drift [150].
- Artifact Removal: Physiological artifacts (e.g., electromyographic (EMG) interference in electroencephalographic (EEG) signals, eye blinks (EOG), cardiac artifacts (ECG) in EEG) are a significant challenge. Techniques like Independent Component Analysis (ICA) are powerful for separating independent sources, allowing for the removal of artifactual components while preserving brain activity [150]. Regression-based methods and adaptive filtering are also used.
- Normalization and Standardization: Scaling signal amplitudes to a standard range (normalization) or transforming them to have zero mean and unit variance (standardization) can prevent features with larger magnitudes from dominating the learning process and improve algorithm convergence [150].
16.2. Data Augmentation
- Frequency-Domain Transformations: Modifying the spectral characteristics of the signal, for instance, by altering specific frequency bands or adding spectral noise. While less common for traditional ML than deep learning, it can still introduce functional variability [154].
- Synthetic Data Generation: More advanced methods might involve generating entirely new synthetic signals or features based on statistical models of the original data. However, this is more complex and less frequently applied in traditional ML compared to deep learning [155].
17. Benchmarking and Public Datasets
17.1. Importance of Benchmarking
- Performance Comparison: Allowing researchers to objectively compare the effectiveness of new algorithms against existing state-of-the-art methods [110].
- Reproducibility: Ensuring that research findings can be independently verified and replicated by others, which is vital for building trust and accelerating scientific progress. The lack of reproducibility is a significant concern in many scientific fields, including biomedical ML [156].
- Identifying Gaps: Highlighting areas where current methods fall short, thereby guiding future research efforts.
- Fair Evaluation: Providing a standardized framework that minimizes bias in reporting results and promotes fair competition among different approaches.
17.2. Public Datasets
- PhysioNet: A comprehensive online resource offering a wide range of physiological signals and related data, including ECG, EEG, EMG, and respiratory sounds. Notable datasets include MIMIC-III (Multiparameter Intelligent Monitoring in Intensive Care), Fantasia (for heart rate variability), and various sleep EEG databases [34].
- UCI Machine Learning Repository: While not exclusively for biomedical signals, it hosts several datasets relevant to the field, such as those for arrhythmia detection or sleep stage classification [157].
- BCI Competition Datasets: Specifically designed for brain–computer interface research, these datasets provide EEG and ECoG (electrocorticography) signals for various motor imagery or P300-based tasks [158].
- OpenECG: A large-scale benchmark dataset comprising millions of 12-lead ECG recordings, designed to facilitate the development and evaluation of ECG analysis models [159].
17.3. Challenges in Benchmarking and Data Utilization
- Data Quality and Annotation: Even public datasets can suffer from noise, artifacts, or inconsistencies in annotation, requiring careful preprocessing and validation [134].
- Data Heterogeneity: Signals from different devices, patient populations, or clinical settings can vary significantly, making it challenging to develop models that generalize well across diverse data sources [134].
- Class Imbalance: Many biomedical datasets exhibit severe class imbalance (e.g., rare disease detection), which can lead to models that perform well in the majority class but poorly on the minority class [134].
- Ethical and Privacy Concerns: While public datasets are often anonymized, ensuring patient privacy and ethical data use remains a continuous challenge, especially with the increasing complexity of data sharing and analysis [134].
17.4. Open-Source Toolboxes for Biomedical Signal Analysis
- BioSPPy: Provides implementations of time-frequency features (e.g., wavelets, Hjorth parameters) and physiological signal preprocessing (e.g., ECG denoising, HRV analysis) [160].
- NeuroKit2: Supports feature extraction for EEG (e.g., entropy, fractal dimensions) and ECG (e.g., R-peak detection, HRV metrics), compatible with scikit-learn for ML integration [161].
- PyWavelets: Enables customizable wavelet transformations for time-frequency analysis of respiratory sounds and EMG [162].
18. Considerations and Regulatory Aspects
18.1. Data Privacy and Security
18.2. Algorithmic Bias and Fairness
18.3. Transparency and Interpretability
18.4. Regulatory Oversight and Clinical Validation
18.5. Federated Learning for Privacy-Preserving Model Training
19. Multi-Modal Biomedical Signal Integration
19.1. Rationale and Importance
- ECG measures the electrical activity of the heart and is critical for arrhythmia and cardiac event detection.
- EEG records brain activity and is indispensable in diagnosing seizures, sleep disorders, and encephalopathies.
- PPG reflects blood perfusion and is widely used in heart rate and oxygen saturation monitoring.
- Respiratory sounds/TBS provides non-invasive measures for obstructive diseases or airway monitoring.
19.2. Levels and Methods of Integration
19.2.1. Feature-Level Fusion
19.2.2. Decision-Level Fusion
19.2.3. Hybrid Methods
19.3. Applications and Advances
- Sleep Stage Classification: Combined EEG, EOG, and EMG signals lead to superior sleep staging performance versus single-modality approaches [32].
- Arrhythmia Detection: Multimodal integration of ECG, PPG, and blood pressure yields more reliable detection of arrhythmic events [166].
- Obstructive Sleep Apnea (OSA) Screening: Joint analysis of tracheal breathing sounds and anthropometric data outperforms unimodal models [123].
19.4. Challenges and Open Problems
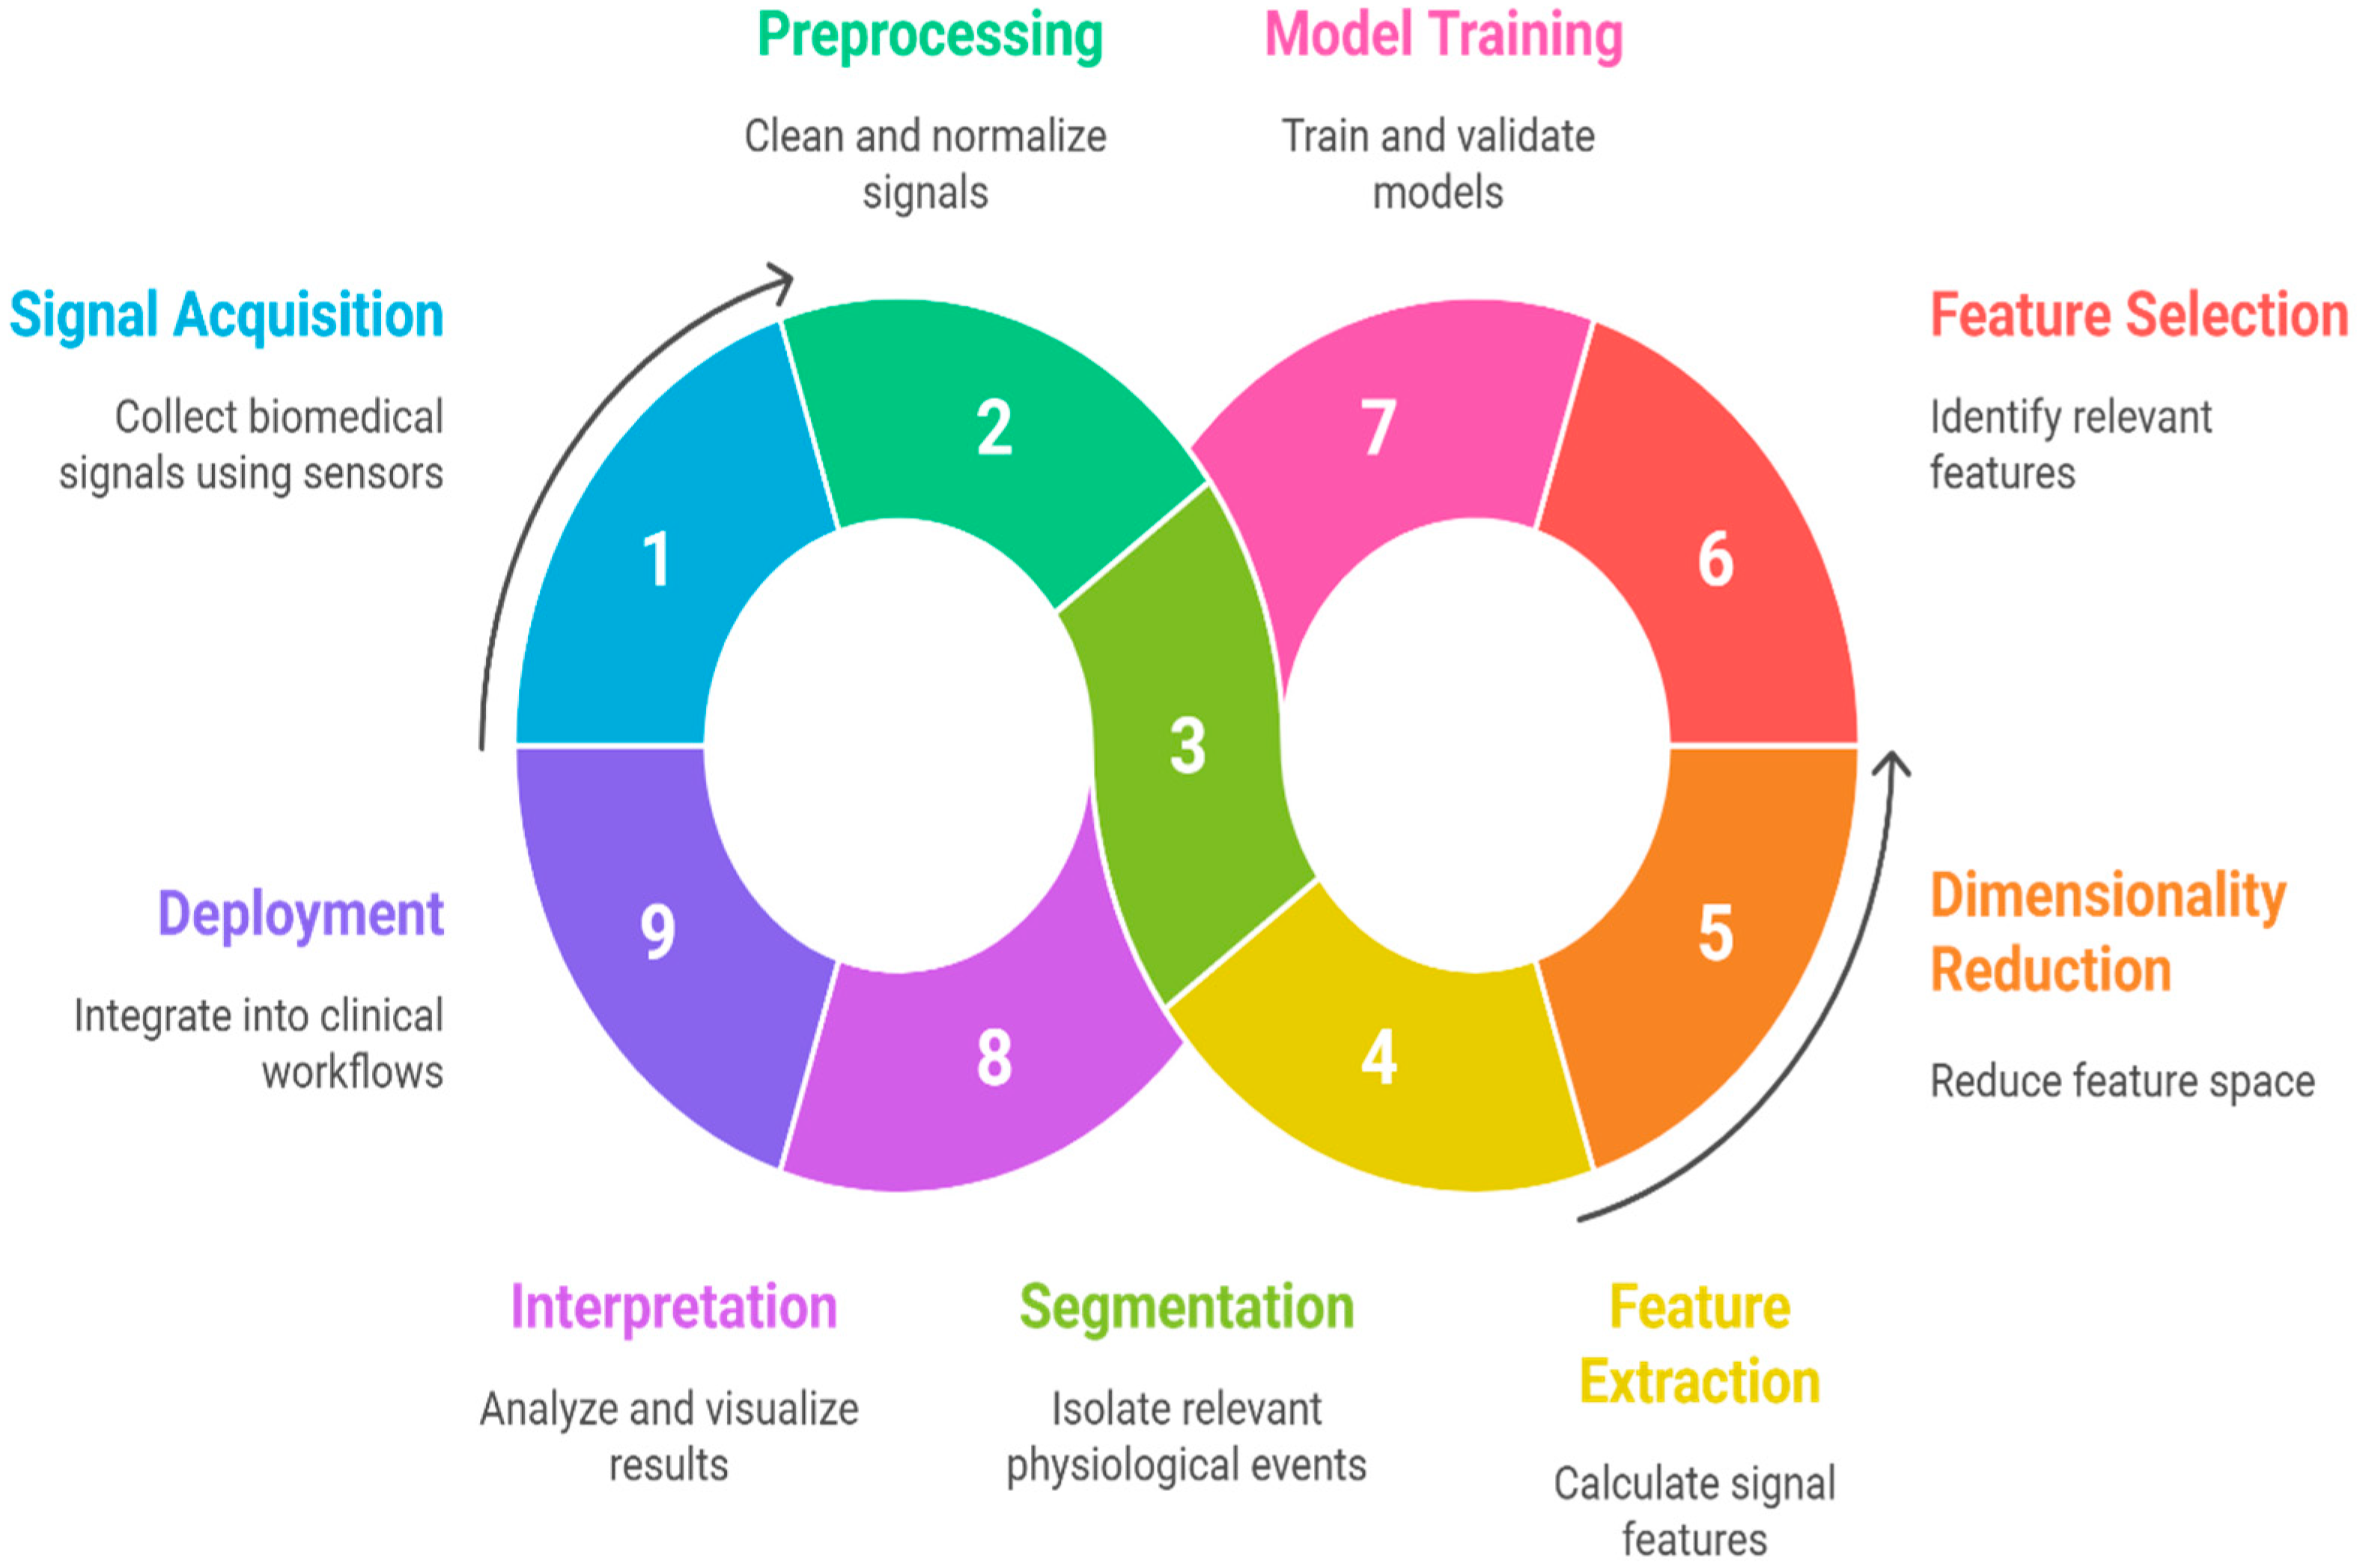
20. End-to-End Machine Learning Workflow for Biomedical Signal Analysis
- Signal Acquisition
- Collection of biomedical signals using appropriate sensors or devices (e.g., ECG electrodes, EMG pads, microphones for TBS).
- Data integrity checks and device calibration take place here.
- Preprocessing
- Segmentation
- Feature Extraction and Engineering
- Calculation of time-domain, frequency-domain, and time-frequency features; non-linear measures; and higher-order statistics tailored to the signal and task [167].
- Recent works promote automated or bio-inspired feature engineering for large datasets.
- Dimensionality reduction (e.g., PCA, ICA) is often used to address the curse of dimensionality [30].
- Dimensionality Reduction/Feature Projection
- Techniques such as Principal Component Analysis (PCA), Independent Component Analysis (ICA), Linear Discriminant Analysis (LDA), t-SNE, or UMAP reduce feature space dimensionality while preserving the most informative patterns [98].
- This step mitigates the “curse of dimensionality,” decreases computational burden, and can improve model generalization.
- It can be applied as a preprocessing step before feature selection or directly before model training if feature interpretability is not critical.
- Feature Selection
- Identification of the most relevant and non-redundant features using filter, wrapper, or embedded methods to improve classifier accuracy, reduce overfitting, and enhance interpretability [45].
- Model Training and Validation
- Application of traditional ML algorithms (SVM, Random Forest, KNN, Logistic Regression) or hybrid ML-DL pipelines.
- Rigorous cross-validation, hyperparameter tuning, and use of well-established performance metrics (accuracy, recall, specificity, F1, AUC-ROC) are required for robust benchmarking.
- Interpretation and Visualization
- Deployment and Feedback Integration
- Integration into clinical workflows, including real-time monitoring or decision support systems.
- Continuous data acquisition enables model updating and adaptation to evolving patient populations and sensor technologies.
- Minimizes information loss between stages,
- Ensures best practices in both signal processing and machine learning,
- Supports reproducible science by providing traceable data transformations,
- Facilitates transparent decision-making, critical for clinical validation and regulatory compliance,
- Eases transition to multi-modal or hybrid (ML-DL) approaches by defining modular interfaces at each stage.
21. Empirical Results/Benchmarks
21.1. Benchmarking Protocols
21.2. Comparative Algorithmic Performance
21.3. Reproducibility and Open Toolboxes
22. Discussion and Research Directions
23. Limitations of This Review
24. Conclusions
Author Contributions
Funding
Institutional Review Board Statement
Informed Consent Statement
Data Availability Statement
Acknowledgments
Conflicts of Interest
Abbreviations
| AI | Artificial Intelligence |
| ANN | Artificial Neural Network |
| ANOVA | Analysis of Variance |
| AUC | Area Under the Curve |
| AUC-ROC | Area Under the Receiver Operating Characteristic Curve |
| AUPRC | Area Under the Precision–Recall Curve |
| BCI | Brain–Computer Interface |
| CFS | Correlation-based Feature Selection |
| CNN | Convolutional Neural Network |
| COPD | Chronic Obstructive Pulmonary Disease |
| CPU | Central Processing Unit |
| CV | Cross Validation |
| CWT | Continuous Wavelet Transform |
| DL | Deep Learning |
| DWT | Discrete Wavelet Transform |
| ECG | Electrocardiogram |
| ECoG | Electrocorticography |
| EEG | Electroencephalogram |
| EHR | Electronic Health Record |
| EMG | Electromyogram |
| EMR | Electronic Medical Record (if mentioned; check consistency with EHR) |
| EMA | European Medicines Agency |
| EOG | Electrooculogram |
| EVestG | Electrovestibulography |
| FAIR | Findable, Accessible, Interoperable and Reusable |
| FFT | Fast Fourier Transform |
| FL | Federated Learning |
| FN | False Negative |
| FP | False Positive |
| FDA | Food and Drug Administration (U.S.) |
| Grad-CAM | Gradient-weighted Class Activation Mapping |
| GPU | Graphics Processing Unit |
| HHT | Hilbert-Huang Transform |
| HIPAA | Health Insurance Portability and Accountability Act |
| HOS | Higher-Order Statistics |
| HRV | Heart Rate Variability |
| ICA | Independent Component Analysis |
| ICE | Individual Conditional Expectation |
| ICBHI | International Conference on Biomedical Health Informatics |
| KNN | K-Nearest Neighbors |
| LDA | Linear Discriminant Analysis |
| LIME | Local Interpretable Model-Agnostic Explanations |
| LOSO | Leave-One-Subject-Out |
| LOSO-CV | Leave-One-Subject-Out Cross Validation |
| LSTM | Long Short-Term Memory |
| MAE | Mean Absolute Error |
| MFCC | Mel-Frequency Cepstral Coefficients |
| MIT-BIH | Massachusetts Institute of Technology–Beth Israel Hospital (ECG dataset) |
| ML | Machine Learning |
| MSE | Mean Squared Error |
| Ninapro | Non-Invasive Adaptive Prosthetics (EMG dataset) |
| Ninapro EMG | Ninapro EMG dataset |
| OSA | Obstructive Sleep Apnea |
| PCA | Principal Component Analysis |
| PDP | Partial Dependence Plot |
| PPG | Photoplethysmogram |
| PSD | Power Spectral Density |
| QRS | QRS Complex (ECG feature) |
| RBF | Radial Basis Function |
| RFE | Recursive Feature Elimination |
| RNN | Recurrent Neural Network |
| RMSE | Root Mean Squared Error |
| RMS | Root Mean Square |
| SVM | Support Vector Machine |
| STFT | Short-Time Fourier Transform |
| σ | Standard Deviation (used symbolically in quantitative analysis) |
| TBS | Tracheal Breathing Sound |
| TP | True Positive |
| TN | True Negative |
| TUH | Temple University Hospital (EEG dataset) |
| TUH-EEG | Temple University Hospital EEG dataset (used in benchmarking) |
| WT | Wavelet Transform |
| XAI | Explainable Artificial Intelligence |
| XGB or XGBoost | Extreme Gradient Boosting |
| ZCR | Zero-Crossing Rate |
References
- Alqudah, A.M.; Moussavi, Z. A Review of Deep Learning for Biomedical Signals: Current Applications, Advancements, Future Prospects, Interpretation, and Challenges. Comput. Mater. Contin. 2025, 83, 3753–3841. [Google Scholar] [CrossRef]
- Faust, O.; Hagiwara, Y.; Hong, T.J.; Lih, O.S.; Acharya, U.R. Deep learning for healthcare applications based on physiological signals: A review. Comput. Methods Programs Biomed. 2018, 161, 1–13. [Google Scholar] [CrossRef]
- Lal, T.N.; Schröder, M.; Hinterberger, T.; Weston, J.; Bogdan, M.; Birbaumer, N.; Schölkopf, B. Support Vector Channel Selection in BCI. IEEE Trans. Biomed. Eng. 2004, 51, 1003–1010. [Google Scholar] [CrossRef]
- Domingos, P. A Few Useful Things to Know about Machine Learning. Commun. ACM 2012, 55, 78–87. [Google Scholar] [CrossRef]
- Guyon, I.; Elisseeff, A. An Introduction to Variable and Feature Selection. J. Mach. Learn. Res. 2003, 3, 1157–1182. [Google Scholar]
- Lipton, Z.C. The Mythos of Model Interpretability. Queue 2018, 16, 31–57. [Google Scholar] [CrossRef]
- Dobson, A.J.; Barnett, A.G. An Introduction to Generalized Linear Models, 3rd ed.; Chapman and Hall/CRC: Boca Raton, FL, USA, 2008. [Google Scholar]
- Hosmer, D.W., Jr.; Lemeshow, S.; Sturdivant, R.X. Applied Logistic Regression, 3rd ed.; Wiley: Hoboken, NJ, USA, 2013. [Google Scholar]
- Adadi, A.; Berrada, M. Peeking inside the Black-Box: A Survey on Explainable Artificial Intelligence (XAI). IEEE Access 2018, 6, 52138–52160. [Google Scholar] [CrossRef]
- Molnar, C. Interpretable Machine Learning: A Guide for Making Black Box Models Explainable, 2nd ed.; Chapman & Hall/CRC: Boca Raton, FL, USA, 2022. [Google Scholar]
- Mahmood, F. A Benchmarking Crisis in Biomedical Machine Learning. Nat. Med. 2025, 31, 1060. [Google Scholar] [CrossRef]
- Piirilä, P.; Sovijärvi, A.R.A. Crackles: Recording, Analysis and Clinical Significance. Eur. Respir. J. 1995, 8, 2139–2148. [Google Scholar] [CrossRef] [PubMed]
- Gallón, V.M.; Vélez, S.M.; Ramírez, J.; Bolaños, F. Comparison of Machine Learning Algorithms and Feature Extraction Techniques for the Automatic Detection of Surface EMG Activation Timing. Biomed. Signal Process. Control. 2024, 94, 106266. [Google Scholar] [CrossRef]
- Wang, S.; Jiang, Y.; Li, Q.; Zhang, W. Timely ICU Outcome Prediction Utilizing Stochastic Signal Analysis and Machine Learning Techniques with Readily Available Vital Sign Data. IEEE J. Biomed. Health Inform. 2024, 28, 4123–4134. [Google Scholar] [CrossRef] [PubMed]
- Bohadana, A.; Izbicki, G.; Kraman, S.S. Fundamentals of Lung Auscultation. N. Engl. J. Med. 2014, 370, 744–751. [Google Scholar] [CrossRef] [PubMed]
- Richman, J.S.; Moorman, J.R. Physiological Time-Series Analysis Using Approximate Entropy and Sample Entropy. Am. J. Physiol.-Heart Circ. Physiol. 2000, 278, H2039–H2049. [Google Scholar] [CrossRef] [PubMed]
- Huang, N.E.; Shen, Z.; Long, S.R.; Wu, M.C.; Shih, H.H.; Zheng, Q.; Yen, N.C.; Tung, C.C.; Liu, H.H. The Empirical Mode Decomposition and the Hilbert Spectrum for Nonlinear and Non-Stationary Time Series Analysis. Proc. R. Soc. London Ser. A Math. Phys. Eng. Sci. 1998, 454, 903–995. [Google Scholar] [CrossRef]
- Subasi, A.; Qaisar, S.M. Signal Acquisition Preprocessing and Feature Extraction Techniques for Biomedical Signals. In Advances in Non-Invasive Biomedical Signal Processing; Springer: Berlin/Heidelberg, Germany, 2023; pp. 11–34. [Google Scholar]
- Rangayyan, R.M. Biomedical Signal Analysis: A Case-Study Approach, 2nd ed.; Wiley-IEEE Press: Hoboken, NJ, USA, 2015. [Google Scholar]
- U.S. Food and Drug Administration. Artificial Intelligence/Machine Learning (AI/ML)-Based Software as a Medical Device (SaMD) Action Plan. 2021. Available online: https://www.fda.gov/medical-devices/software-medical-device-samd/artificial-intelligence-software-medical-device (accessed on 1 May 2025).
- European Medicines Agency. Reflection Paper on Artificial Intelligence (AI) in Medicines. 2022. Available online: https://www.ema.europa.eu/en/news/reflection-paper-use-artificial-intelligence-lifecycle-medicines#:~:text=The%20reflection%20paper%20highlights%20that,due%20respect%20of%20fundamental%20rights (accessed on 1 May 2025).
- Cascarano, A.; Mur-Petit, J.; Hernández-González, J.; Camacho, M.; De Toro Eadie, N.; Gkontra, P.; Chadeau-Hyam, M.; Vitrià, J.; Lekadir, K. Machine and Deep Learning for Longitudinal Biomedical Data: A Review of Methods and Applications. Artif. Intell. Rev. 2023, 56, 1711–1771. [Google Scholar] [CrossRef]
- Lee, Y.J.; Park, C.; Kim, H.; Cho, S.J.; Yeo, W.-H. Artificial Intelligence on Biomedical Signals: Technologies, Applications, and Future Directions. Med-X 2024, 2, 25. [Google Scholar] [CrossRef]
- Toledo-Pérez, D.C.; Rodríguez-Reséndiz, J.; Gómez-Loenzo, R.A.; Jauregui-Correa, J.C. Support Vector Machine-Based EMG Signal Classification Techniques: A Review. Appl. Sci. 2019, 9, 4402. [Google Scholar] [CrossRef]
- Nguyen, M.T.; Nguyen, T.-H.T.; Le, H.-C. A Review of Progress and an Advanced Method for Shock Advice Algorithms in Automated External Defibrillators. Biomed. Eng. OnLine 2022, 21, 22. [Google Scholar] [CrossRef]
- Zhang, X.; Wang, L.; Chen, Y. A Review of Deep Learning-Based Approaches for EMG Signal Analysis. J. Neural Eng. 2019, 16, 051001. [Google Scholar]
- Azarbarzin, A.; Moussavi, Z.M.K. Automatic and Unsupervised Snore Sound Extraction from Respiratory Sound Signals. IEEE Trans. Biomed. Eng. 2010, 57, 2446–2453. [Google Scholar] [CrossRef]
- Singh, A.K.; Krishnan, S. ECG Signal Feature Extraction Trends in Methods and Applications. Biomed. Eng. OnLine 2023, 22, 22. [Google Scholar] [CrossRef] [PubMed]
- Kim, H.; Kon, D.; Jung, Y.; Han, H.; Kim, J.; Joo, Y. Breathing Sounds Analysis System for Early Detection of Airway Problems in Patients with a Tracheostomy Tube. Sci. Rep. 2023, 13, 21013. [Google Scholar] [CrossRef]
- Subasi, A. Practical Guide for Biomedical Signals Analysis Using Machine Learning Techniques: A MATLAB Based Approach; Academic Press: Cambridge, MA, USA, 2019. [Google Scholar]
- Folland, R.; Hines, E.; Dutta, R.; Boilot, P. Comparison of Neural Network Predictors in the Classification of Tracheal–Bronchial Breath Sounds by Respiratory Auscultation. Artif. Intell. Med. 2004, 31, 211–220. [Google Scholar] [CrossRef] [PubMed]
- Li, X.; Ling, S.H.; Su, S. A Hybrid Feature Selection and Extraction Method for Sleep Apnea Detection Using Bio-Signals. Sensors 2020, 20, 4323. [Google Scholar] [CrossRef]
- Karim, A.; Ryu, S.; Jeong, I.C. Ensemble Learning for Biomedical Signal Classification: A High-Accuracy Framework Using Spectrograms from Percussion and Palpation. Sci. Rep. 2025, 15, 21592. [Google Scholar] [CrossRef]
- Goldberger, A.L.; Amaral, L.A.; Glass, L.; Hausdorff, J.M.; Ivanov, P.C.; Mark, R.G.; Mietus, J.E.; Moody, G.B.; Peng, C.K.; Stanley, H.E. PhysioBank, PhysioToolkit, and PhysioNet: Components of a New Research Resource for Complex Physiologic Signals. Circulation 2000, 101, e215–e220. [Google Scholar] [CrossRef] [PubMed]
- Boronoev, V.V.; Ompokov, V.D. The Hilbert-Huang Transform for Biomedical Signals Processing. In Proceedings of the 2014 International Conference on Computer Technologies in Physical and Engineering Applications (ICCTPEA), Saint-Petersburg, Russia, 24–26 June 2014; pp. 21–22. [Google Scholar]
- Costa, M.; Goldberger, A.L.; Peng, C.K. Multiscale Entropy Analysis of Complex Physiologic Time Series. Phys. Rev. Lett. 2002, 89, 068102. [Google Scholar] [CrossRef]
- Amin, H.U.; Malik, A.S.; Ahmad, R.F.; Badruddin, N.; Kamel, N.; Hussain, M.; Chooi, W.T. Feature Extraction and Classification for EEG Signals Using Wavelet Transform and Machine Learning Techniques. Australas. Phys. Eng. Sci. Med. 2015, 38, 139–149. [Google Scholar] [CrossRef]
- Charlton, P.H.; Harana, J.M.; Vennin, S.; Li, Y.; Chowienczyk, P.; Alastruey, J. Modeling Arterial Pulse Waves in Healthy Aging: A Database for in Silico Evaluation of Hemodynamics and Pulse Wave Indexes. Am. J. Physiol.-Heart Circ. Physiol. 2019, 317, H1062–H1085. [Google Scholar] [CrossRef]
- Rosenstein, M.T.; Collins, J.J.; De Luca, C.J. A Practical Method for Calculating Largest Lyapunov Exponents from Small Data Sets. Phys. D Nonlinear Phenom. 1993, 65, 117–134. [Google Scholar] [CrossRef]
- Abdelhamid, A.A.; El-Kenawy, E.-S.M.; Alotaibi, B.; Amer, G.M.; Abdelkader, M.Y.; Ibrahim, A.; Eid, M.M. Robust Speech Emotion Recognition Using CNN+LSTM Based on Stochastic Fractal Search Optimization Algorithm. IEEE Access 2022, 10, 49265–49284. [Google Scholar] [CrossRef]
- Hajipour, F.; Moussavi, Z. Spectral and Higher Order Statistical Characteristics of Expiratory Tracheal Breathing Sounds During Wakefulness and Sleep in People with Different Levels of Obstructive Sleep Apnea. J. Med. Biol. Eng. 2019, 39, 244–250. [Google Scholar] [CrossRef]
- Mendel, J.M. Tutorial on Higher-Order Statistics (Spectra) in Signal Processing and System Theory: Theoretical Results and Some Applications. Proc. IEEE 1991, 79, 278–305. [Google Scholar] [CrossRef]
- Nikias, C.L.; Petropulu, A.P. Higher-Order Spectra Analysis: A Nonlinear Signal Processing Framework; Prentice Hall: Hoboken, NJ, USA, 1993. [Google Scholar]
- Ashwini, A.; Chirchi, V.; Balasubramaniam, S.; Shah, M.A. Bio Inspired Optimization Techniques for Disease Detection in Deep Learning Systems. Sci. Rep. 2025, 15, 18202. [Google Scholar] [CrossRef]
- Sahu, P.; Singh, B.K.; Nirala, N. An Improved Feature Selection Approach Using Global Best Guided Gaussian Artificial Bee Colony for EMG Classification. Biomed. Signal Process. Control. 2023, 80, 104399. [Google Scholar] [CrossRef]
- Li, H.; Yuan, D.; Ma, X.; Cui, D.; Cao, L. Genetic Algorithm for the Optimization of Features and Neural Networks in ECG Signals Classification. Sci. Rep. 2017, 7, 41011. [Google Scholar] [CrossRef]
- Sultana, A.; Ahmed, F.; Alam, M.S. A Systematic Review on Surface Electromyography-Based Classification System for Identifying Hand and Finger Movements. Healthc. Anal. 2023, 3, 100126. [Google Scholar] [CrossRef]
- Li, Q.; Liu, C.; Oster, J.; Clifford, G.D. Signal Processing and Feature Selection Preprocessing for Classification in Noisy Healthcare Data. In Machine Learning for Healthcare; NIH: Bethesda, MD, USA, 2016. [Google Scholar]
- Remeseiro, B.; Bolón-Canedo, V. A Review of Feature Selection Methods in Medical Applications. Comput. Biol. Med. 2019, 112, 103375. [Google Scholar] [CrossRef]
- Hall, M.A. Correlation-Based Feature Selection for Discrete and Numeric Class Machine Learning. In Proceedings of the Seventeenth International Conference on Machine Learning, San Francisco, CA, USA, 29 June–2 July 2000; pp. 359–366. [Google Scholar]
- Friedman, J.H. Greedy Function Approximation: A Gradient Boosting Machine. Ann. Stat. 2001, 29, 1189–1232. [Google Scholar] [CrossRef]
- Hastie, T.; Tibshirani, R.; Friedman, J. The Elements of Statistical Learning: Data Mining, Inference, and Prediction, 2nd ed.; Springer: Berlin/Heidelberg, Germany, 2009. [Google Scholar]
- Guyon, I.; Weston, J.; Barnhill, S.; Vapnik, V. Gene Selection for Cancer Classification Using Support Vector Machines. Mach. Learn. 2002, 46, 389–422. [Google Scholar] [CrossRef]
- Tibshirani, R. Regression Shrinkage and Selection via the Lasso. J. R. Stat. Soc. Ser. B (Methodol.) 1996, 58, 267–288. [Google Scholar] [CrossRef]
- Breiman, L. Random Forests. Mach. Learn. 2001, 45, 5–32. [Google Scholar] [CrossRef]
- Cortes, C.; Vapnik, V. Support-Vector Networks. Mach. Learn. 1995, 20, 273–297. [Google Scholar] [CrossRef]
- Haykin, S. Neural Networks and Learning Machines, 3rd ed.; Pearson: Hoboken, NJ, USA, 2008. [Google Scholar]
- Qaisar, S.M.; Nisar, H.; Subasi, A. Advances in Non-Invasive Biomedical Signal Sensing and Processing with Machine Learning; Springer: Berlin/Heidelberg, Germany, 2023. [Google Scholar]
- Sperandei, S. Understanding Logistic Regression Analysis. Biochem. Med. 2014, 24, 12–18. [Google Scholar] [CrossRef] [PubMed]
- Wasimuddin, M.; Elleithy, K.; Abuzneid, A.S. Stages-Based ECG Signal Analysis from Traditional Signal Processing to Machine Learning Approaches: A Survey. IEEE Access 2020, 8, 177782–177803. [Google Scholar] [CrossRef]
- Lundberg, S.M.; Lee, S.-I. A Unified Approach to Interpreting Model Predictions. In Proceedings of the Advances in Neural Information Processing Systems, Long Beach, CA, USA, 4–9 December 2017; Volume 30. [Google Scholar]
- Suleiman, A.; Lithgow, B.; Mansouri, B.; Moussavi, Z. Investigating the Validity and Reliability of Electrovestibulography (EVestG) for Detecting Post-Concussion Syndrome (PCS) with and without Comorbid Depression. Sci. Rep. 2018, 8, 14495. [Google Scholar] [CrossRef]
- Dastgheib, Z.A.; Kumaragamage, C.; Lithgow, B.J.; Moussavi, Z.K. The Evolution of Electrovestibulography Technique and Safety Considerations. Biomed. Eng. Adv. 2025, 9, 100157. [Google Scholar] [CrossRef]
- Ribeiro, M.T.; Singh, S.; Guestrin, C. Why Should I Trust You?: Explaining the Predictions of Any Classifier. In Proceedings of the 22nd ACM SIGKDD International Conference on Knowledge Discovery and Data Mining, San Francisco, CA, USA, 13–17 August 2016; pp. 1135–1144. [Google Scholar]
- Sahoo, R.R.; Bhowmick, S.; Mandal, D.; Kumar Kundu, P. A Novel Approach of Gaussian Mixture Model-Based Data Compression of ECG and PPG Signals for Various Cardiovascular Diseases. Biomed. Signal Process. Control. 2024, 96, 106581. [Google Scholar] [CrossRef]
- Dhyani, S.; Kumar, A.; Choudhury, S. Analysis of ECG-Based Arrhythmia Detection System Using Machine Learning. MethodsX 2023, 10, 102195. [Google Scholar] [CrossRef] [PubMed]
- Richhariya, B.; Tanveer, M. EEG Signal Classification Using Universum Support Vector Machine. Expert Syst. Appl. 2018, 106, 169–182. [Google Scholar] [CrossRef]
- Cinyol, F.; Baysal, U.; Köksal, D.; Babaoğlu, E.; Ulaşlı, S.S. Incorporating Support Vector Machine to the Classification of Respiratory Sounds by Convolutional Neural Network. Biomed. Signal Process. Control. 2023, 79, 104093. [Google Scholar] [CrossRef]
- Ashiri, M.; Lithgow, B.; Suleiman, A.; Mansouri, B.; Moussavi, Z. Electrovestibulography (EVestG) Application for Measuring Vestibular Response to Horizontal Pursuit and Saccadic Eye Movements. Biocybern. Biomed. Eng. 2021, 41, 527–539. [Google Scholar] [CrossRef]
- Dastgheib, Z.A.; Lithgow, B.J.; Moussavi, Z.K. Evaluating the Diagnostic Value of Electrovestibulography (EVestG) in Alzheimer’s Patients with Mixed Pathology: A Pilot Study. Medicina 2023, 59, 2091. [Google Scholar] [CrossRef]
- Sha’abani, M.N.A.H.; Fuad, N.; Jamal, N.; Ismail, M.F. kNN and SVM Classification for EEG: A Review. In InECCE2019; Lecture Notes in Electrical Engineering; Kasruddin Nasir, A.N., Ahmad, M.A., Najib, M.S., Abdul Wahab, Y., Othman, N.A., Abd Ghani, N.M., Irawan, A., Khatun, S., Raja Ismail, R.M.T., Saari, M.M., et al., Eds.; Springer: Singapore, 2020; Volume 632, pp. 555–565. ISBN 978-981-15-2316-8. [Google Scholar]
- Hassaballah, M.; Wazery, Y.M.; Ibrahim, I.E.; Farag, A. ECG Heartbeat Classification Using Machine Learning and Metaheuristic Optimization for Smart Healthcare Systems. Bioengineering 2023, 10, 429. [Google Scholar] [CrossRef] [PubMed]
- Satapathy, S.K.; Thakkar, S.; Patel, A.; Patel, D.; Patel, D. An Effective EEG Signal-Based Sleep Staging System Using Machine Learning Techniques. In Proceedings of the 2022 IEEE 6th Conference on Information and Communication Technology (CICT), Gwalior, India, 18 November 2022; pp. 1–6. [Google Scholar]
- Chen, C.-H.; Huang, W.-T.; Tan, T.-H.; Chang, C.-C.; Chang, Y.-J. Using K-Nearest Neighbor Classification to Diagnose Abnormal Lung Sounds. Sensors 2015, 15, 13132–13158. [Google Scholar] [CrossRef]
- Langley, P.; Iba, W.; Thompson, K. An Analysis of Bayesian Classifiers. In Proceedings of the Tenth National Conference on Artificial Intelligence, San Jose, CA, USA, 12–16 July 1992; pp. 223–228. [Google Scholar]
- Sabry, A.H.; Dallal Bashi, O.I.; Nik Ali, N.H.; Mahmood Al Kubaisi, Y. Lung Disease Recognition Methods Using Audio-Based Analysis with Machine Learning. Heliyon 2024, 10, e26218. [Google Scholar] [CrossRef]
- Satapathy, S.K.; Brahma, B.; Panda, B.; Barsocchi, P.; Bhoi, A.K. Machine Learning-Empowered Sleep Staging Classification Using Multi-Modality Signals. BMC Med. Inform. Decis. Mak. 2024, 24, 119. [Google Scholar] [CrossRef] [PubMed]
- Ahsan, M.M.; Luna, S.A.; Siddique, Z. Machine-Learning-Based Disease Diagnosis: A Comprehensive Review. Healthcare 2022, 10, 541. [Google Scholar] [CrossRef]
- Dash, T.K.; Chakraborty, C.; Mahapatra, S.; Panda, G. Gradient Boosting Machine and Efficient Combination of Features for Speech-Based Detection of COVID-19. IEEE J. Biomed. Health Inform. 2022, 26, 5364–5371. [Google Scholar] [CrossRef]
- Türkmen, G.; Sezen, A. A Comparative Analysis of XGBoost and LightGBM Approaches for Human Activity Recognition: Speed and Accuracy Evaluation. IJCESEN 2024, 10, 329. [Google Scholar] [CrossRef]
- Zheng, Y.; Guo, X.; Yang, Y.; Wang, H.; Liao, K.; Qin, J. Phonocardiogram Transfer Learning-Based CatBoost Model for Diastolic Dysfunction Identification Using Multiple Domain-Specific Deep Feature Fusion. Comput. Biol. Med. 2023, 156, 106707. [Google Scholar] [CrossRef]
- Abdullah; Fatima, Z.; Abdullah, J.; Rodríguez, J.L.O.; Sidorov, G. A Multimodal AI Framework for Automated Multiclass Lung Disease Diagnosis from Respiratory Sounds with Simulated Biomarker Fusion and Personalized Medication Recommendation. IJMS 2025, 26, 7135. [Google Scholar] [CrossRef]
- Shamout, F.; Zhu, T.; Clifton, D.A. Machine Learning for Clinical Outcome Prediction. IEEE Rev. Biomed. Eng. 2020, 14, 116–126. [Google Scholar] [CrossRef]
- Sezgin, M.C.; Dokur, Z.; Olmez, T.; Korurek, M. Classification of Respiratory Sounds by Using an Artificial Neural Network. In Proceedings of the 2001 Conference Proceedings of the 23rd Annual International Conference of the IEEE Engineering in Medicine and Biology Society, Istanbul, Turkey, 25–28 October 2001; Volume 1, pp. 697–699. [Google Scholar]
- Venkatesh, K.; Geetha, S. Sleep Stages Classification Using Artificial Neural Network. Indian J. Sci. Technol. 2015, 8, 31. [Google Scholar] [CrossRef][Green Version]
- Anwaitu Fraser, E.; Obikwelu, O.R. Artificial Neural Networks for Medical Diagnosis: A Review of Recent Trends. Int. J. Comput. Sci. Eng. 2020, 11, 1–11. [Google Scholar] [CrossRef]
- Liu, M.; Liu, J.; Xu, M.; Liu, Y.; Li, J.; Nie, W.; Yuan, Q. Combining Meta and Ensemble Learning to Classify EEG for Seizure Detection. Sci. Rep. 2025, 15, 10755. [Google Scholar] [CrossRef] [PubMed]
- Sultan, S.Q.; Javaid, N.; Alrajeh, N.; Aslam, M. Machine Learning-Based Stacking Ensemble Model for Prediction of Heart Disease with Explainable AI and K-Fold Cross-Validation: A Symmetric Approach. Symmetry 2025, 17, 185. [Google Scholar] [CrossRef]
- Dimigen, O. Optimizing the ICA-Based Removal of Ocular EEG Artifacts from Free Viewing Experiments. NeuroImage 2020, 207, 116117. [Google Scholar] [CrossRef]
- Udayana, I.P.A.E.D.; Sudarma, M.; Putra, I.K.G.D.; Sukarsa, I.M.; Jo, M. Comparative Analysis of Denoising Techniques for Optimizing EEG Signal Processing. LKJITI 2025, 15, 124. [Google Scholar] [CrossRef]
- Abreu, M.; Fred, A.; Valente, J.; Wang, C.; Plácido Da Silva, H. Morphological Autoencoders for Apnea Detection in Respiratory Gating Radiotherapy. Comput. Methods Programs Biomed. 2020, 195, 105675. [Google Scholar] [CrossRef] [PubMed]
- Hu, W.; Lv, J.; Liu, D.; Chen, Y. Unsupervised Feature Learning for Heart Sounds Classification Using Autoencoder. J. Phys. Conf. Ser. 2018, 1004, 012002. [Google Scholar] [CrossRef]
- Al-Qazzaz, N.K.; Hamid Bin Mohd Ali, S.; Ahmad, S.A.; Islam, M.S.; Escudero, J. Automatic Artifact Removal in EEG of Normal and Demented Individuals Using ICA-WT during Working Memory Tasks. Sensors 2017, 17, 1326. [Google Scholar] [CrossRef]
- Gu, Q.; Li, Z.; Han, J. Linear Discriminant Dimensionality Reduction. In Machine Learning and Knowledge Discovery in Databases; Lecture Notes in Computer Science; Gunopulos, D., Hofmann, T., Malerba, D., Vazirgiannis, M., Eds.; Springer: Berlin/Heidelberg, Germany, 2011; Volume 6911, pp. 549–564. ISBN 978-3-642-23779-9. [Google Scholar]
- Subasi, A.; Ismail Gursoy, M. EEG Signal Classification Using PCA, ICA, LDA and Support Vector Machines. Expert Syst. Appl. 2010, 37, 8659–8666. [Google Scholar] [CrossRef]
- Tripathy, B.K.; Anveshrithaa, S.; Ghela, S. T-Distributed Stochastic Neighbor Embedding (t-SNE). In Unsupervised Learning Approaches for Dimensionality Reduction and Data Visualization; CRC Press: Boca Raton, FL, USA, 2021. [Google Scholar]
- Yang, Y.; Sun, H.; Zhang, Y.; Zhang, T.; Gong, J.; Wei, Y.; Duan, Y.-G.; Shu, M.; Yang, Y.; Wu, D.; et al. Dimensionality Reduction by UMAP Reinforces Sample Heterogeneity Analysis in Bulk Transcriptomic Data. Cell Rep. 2021, 36, 109442. [Google Scholar] [CrossRef] [PubMed]
- Sadiq, M.T.; Yu, X.; Yuan, Z. Exploiting Dimensionality Reduction and Neural Network Techniques for the Development of Expert Brain–Computer Interfaces. Expert Syst. Appl. 2021, 164, 114031. [Google Scholar] [CrossRef]
- Dadu, A.; Satone, V.K.; Kaur, R.; Koretsky, M.J.; Iwaki, H.; Qi, Y.A.; Ramos, D.M.; Avants, B.; Hesterman, J.; Gunn, R.; et al. Application of Aligned-UMAP to Longitudinal Biomedical Studies. Patterns 2023, 4, 100741. [Google Scholar] [CrossRef]
- Shapley, L.S. A Value for N-Person Games. Contrib. Theory Games 1953, 2, 307–317. [Google Scholar]
- Wei, P.; Lu, Z.; Song, J. Variable Importance Analysis: A Comprehensive Review. Reliab. Eng. Syst. Saf. 2015, 142, 399–432. [Google Scholar] [CrossRef]
- Herbinger, J.; Bischl, B.; Casalicchio, G. REPID: Regional Effect Plots with Implicit Interaction Detection. arXiv 2022, arXiv:2202.07254. [Google Scholar] [CrossRef]
- Herbinger, J.; Wright, M.N.; Nagler, T.; Bischl, B.; Casalicchio, G. Decomposing Global Feature Effects Based on Feature Interactions. J. Mach. Learn. Res. 2024, 25, 1–65. [Google Scholar]
- Goldstein, A.; Kapelner, A.; Bleich, J.; Pitkin, E. Peeking Inside the Black Box: Visualizing Statistical Learning with Plots of Individual Conditional Expectation. J. Comput. Graph. Stat. 2015, 24, 44–65. [Google Scholar] [CrossRef]
- Gramegna, A.; Giudici, P. Shapley Feature Selection. FinTech 2022, 1, 72–80. [Google Scholar] [CrossRef]
- Wang, H.; Liang, Q.; Hancock, J.T.; Khoshgoftaar, T.M. Feature Selection Strategies: A Comparative Analysis of SHAP-Value and Importance-Based Methods. J. Big Data 2024, 11, 44. [Google Scholar] [CrossRef]
- Lundberg, S.M.; Erion, G.; Chen, H.; DeGrave, A.; Prutkin, J.M.; Nair, B.; Katz, R.; Himmelfarb, J.; Bansal, N.; Lee, S.I. From Local Explanations to Global Understanding with Explainable AI for Trees. Nat. Mach. Intell. 2020, 2, 56–67. [Google Scholar] [CrossRef] [PubMed]
- Midway, S.R. Principles of Effective Data Visualization. Patterns 2020, 1, 100141. [Google Scholar] [CrossRef]
- Nguyen, Q.V.; Miller, N.; Arness, D.; Huang, W.; Huang, M.L.; Simoff, S. Evaluation on Interactive Visualization Data with Scatterplots. Vis. Inform. 2020, 4, 1–10. [Google Scholar] [CrossRef]
- Sathyanarayanan, S. Confusion Matrix-Based Performance Evaluation Metrics. AJBR 2024, 27, 4023–4031. [Google Scholar] [CrossRef]
- Davis, J.; Goadrich, M. The Relationship between Precision-Recall and ROC Curves. In Proceedings of the 23rd International Conference on Machine Learning-ICML ’06, Pittsburgh, PA, USA, 25–29 June 2006; pp. 233–240. [Google Scholar]
- Lee, Y.; Seo, J. Suggestion of Statistical Validation on Feature Importance of Machine Learning. In Proceedings of the 2023 45th Annual International Conference of the IEEE Engineering in Medicine & Biology Society (EMBC), Sydney, Australia, 24 July 2023; pp. 1–4. [Google Scholar]
- Schwartz, J.M.; Moy, A.J.; Rossetti, S.C.; Elhadad, N.; Cato, K.D. Clinician Involvement in Research on Machine Learning–Based Predictive Clinical Decision Support for the Hospital Setting: A Scoping Review. J. Am. Med. Inform. Assoc. 2021, 28, 653–663. [Google Scholar] [CrossRef]
- Seoni, S.; Jahmunah, V.; Salvi, M.; Barua, P.D.; Molinari, F.; Acharya, U.R. Application of Uncertainty Quantification to Artificial Intelligence in Healthcare: A Review of Last Decade (2013–2023). Comput. Biol. Med. 2023, 165, 107441. [Google Scholar] [CrossRef]
- Feng, J.; Liang, J.; Qiang, Z.; Hao, Y.; Li, X.; Li, L.; Chen, Q.; Liu, G.; Wei, H. A Hybrid Stacked Ensemble and Kernel SHAP-Based Model for Intelligent Cardiotocography Classification and Interpretability. BMC Med. Inform. Decis. Mak. 2023, 23, 273. [Google Scholar] [CrossRef]
- Liu, J.; Zhu, D.; Deng, L.; Chen, X. Predictive Modeling of Heart Failure Outcomes Using ECG Monitoring Indicators and Machine Learning. Noninvasive Electrocardiol 2025, 30, e70097. [Google Scholar] [CrossRef] [PubMed]
- Sathyan, A.; Weinberg, A.I.; Cohen, K. Interpretable AI for Bio-Medical Applications. Complex Eng. Syst. 2022, 2, 18. [Google Scholar] [CrossRef] [PubMed]
- Baldazzi, G.; Solinas, G.; Del Valle, J.; Barbaro, M.; Micera, S.; Raffo, L.; Pani, D. Systematic Analysis of Wavelet Denoising Methods for Neural Signal Processing. J. Neural Eng. 2020, 17, 066016. [Google Scholar] [CrossRef]
- Chen, C.-C.; Tsui, F.R. Comparing Different Wavelet Transforms on Removing Electrocardiogram Baseline Wanders and Special Trends. BMC Med. Inform. Decis. Mak. 2020, 20, 343. [Google Scholar] [CrossRef]
- Guhdar, M.; Mstafa, R.J.; Mohammed, A.O. A Novel Data Augmentation Strategy for Robust Deep Learning Classification of Biomedical Time-Series Data: Application to ECG and EEG Analysis. arXiv 2025, arXiv:2507.12645. [Google Scholar] [CrossRef]
- Bishop, C.M. Pattern Recognition and Machine Learning; Springer: Berlin/Heidelberg, Germany, 2006. [Google Scholar]
- Azizi, T. Comparative Analysis of Statistical, Time–Frequency, and SVM Techniques for Change Detection in Nonlinear Biomedical Signals. Signals 2024, 5, 741–761. [Google Scholar] [CrossRef]
- Elwali, A.; Moussavi, Z. Obstructive Sleep Apnea Screening and Airway Structure Characterization During Wakefulness Using Tracheal Breathing Sounds. Ann. Biomed. Eng. 2017, 45, 839–850. [Google Scholar] [CrossRef]
- Quinlan, J.R. Induction of Decision Trees. Mach. Learn. 1986, 1, 81–106. [Google Scholar] [CrossRef]
- Gammerman, A.; Shafer, G.; Vovk, V. Algorithmic Learning in a Random World; Springer-Verlag: Berlin/Heidelberg, Germany, 2005; ISBN 0-387-00152-2. [Google Scholar]
- Elwali, A.; Moussavi, Z. A Novel Decision Making Procedure during Wakefulness for Screening Obstructive Sleep Apnea Using Anthropometric Information and Tracheal Breathing Sounds. Sci. Rep. 2019, 9, 11467. [Google Scholar] [CrossRef]
- Islam, T.; Basak, M.; Islam, R.; Roy, A.D. Investigating Population-Specific Epilepsy Detection from Noisy EEG Signals Using Deep-Learning Models. Heliyon 2023, 9, e22208. [Google Scholar] [CrossRef]
- Saha Tchinda, B.; Tchiotsop, D. A Lightweight 1D Convolutional Neural Network Model for Arrhythmia Diagnosis from Electrocardiogram Signal. Phys. Eng. Sci. Med. 2025, 48, 577–589. [Google Scholar] [CrossRef]
- Alqudah, A.M.; Moussavi, Z. Deep Learning Model for OSA Detection Using Tracheal Breathing Sounds During Wakefulness. CMBES Proc. 2023, 45, 1–4. [Google Scholar]
- Moussavi, Z. Fundamentals of Respiratory Sounds and Analysis. In Synthesis Lectures on Biomedical Engineering; Morgan & Claypool Publishers: San Rafael, CA, USA, 2006; Volume 1, pp. 1–68. [Google Scholar]
- Alqudah, A.M.; Moussavi, Z. Assessing Obstructive Sleep Apnea Severity During Wakefulness via Tracheal Breathing Sound Analysis. Sensors 2025, 25, 6280. [Google Scholar] [CrossRef]
- Van Den Eijnden, M.A.C.; Van Der Stam, J.A.; Bouwman, R.A.; Mestrom, E.H.J.; Verhaegh, W.F.J.; Van Riel, N.A.W.; Cox, L.G.E. Machine Learning for Postoperative Continuous Recovery Scores of Oncology Patients in Perioperative Care with Data from Wearables. Sensors 2023, 23, 4455. [Google Scholar] [CrossRef]
- Naidoo, J.; Shelmerdine, S.C.; Ugas-Charcape, C.F.; Sodhi, A.S. Artificial Intelligence in Paediatric Tuberculosis. Pediatr. Radiol. 2023, 53, 1733–1745. [Google Scholar] [CrossRef] [PubMed]
- Wang, F.; Preininger, A. AI in Health: State of the Art, Challenges, and Future Directions. Yearb. Med. Inform. 2019, 28, 16–26. [Google Scholar] [CrossRef] [PubMed]
- Habehh, H.; Gohel, S. Machine Learning in Healthcare. Curr. Genomics 2021, 22, 291–300. [Google Scholar] [CrossRef] [PubMed]
- Ellis, R.J.; Sander, R.M.; Limon, A. Twelve Key Challenges in Medical Machine Learning and Solutions. Intell.-Based Med. 2022, 6, 100068. [Google Scholar] [CrossRef]
- Alowais, S.A.; Alghamdi, S.S.; Alsuhebany, N.; Alqahtani, T.; Alshaya, A.I.; Almohareb, S.N.; Aldairem, A.; Alrashed, M.; Bin Saleh, K.; Badreldin, H.A.; et al. Revolutionizing Healthcare: The Role of Artificial Intelligence in Clinical Practice. BMC Med. Educ. 2023, 23, 689. [Google Scholar] [CrossRef]
- Zhang, C.; Chen, J.; Li, J.; Peng, Y.; Mao, Z. Large Language Models for Human–Robot Interaction: A Review. Biomim. Intell. Robot. 2023, 3, 100131. [Google Scholar] [CrossRef]
- McNamara, D.; Ong, C.S.; Williamson, R.C. Costs and Benefits of Fair Representation Learning. In Proceedings of the AIES 2019-Proceedings of the 2019 AAAI/ACM Conference on AI, Ethics, and Society, Honolulu, HI, USA, 27–28 January 2019; pp. 263–270. [Google Scholar] [CrossRef]
- Murdoch, B. Privacy and Artificial Intelligence: Challenges for Protecting Health Information in a New Era. BMC Med. Ethics 2021, 22, 122. [Google Scholar] [CrossRef] [PubMed]
- Feldstein, S. Evaluating Europe’s Push to Enact AI Regulations: How Will This Influence Global Norms? Democratization 2023, 31, 1049–1066. [Google Scholar] [CrossRef]
- Lin, Y.M.; Gao, Y.; Gong, M.G.; Zhang, S.J.; Zhang, Y.Q.; Li, Z.Y. Federated Learning on Multimodal Data: A Comprehensive Survey. Mach. Intell. Res. 2023, 20, 539–553. [Google Scholar] [CrossRef]
- Lac, L.; Leung, C.K.; Hu, P. Computational Frameworks Integrating Deep Learning and Statistical Models in Mining Multimodal Omics Data. J. Biomed. Inform. 2024, 152, 104629. [Google Scholar] [CrossRef]
- Alamatsaz, N.; Tabatabaei, L.; Yazdchi, M.; Payan, H.; Alamatsaz, N.; Nasimi, F. A Lightweight Hybrid CNN-LSTM Explainable Model for ECG-Based Arrhythmia Detection. Biomed. Signal Process. Control. 2024, 90, 105884. [Google Scholar] [CrossRef]
- Bai, X.; Dong, X.; Li, Y.; Liu, R.; Zhang, H. A Hybrid Deep Learning Network for Automatic Diagnosis of Cardiac Arrhythmia Based on 12-Lead ECG. Sci. Rep. 2024, 14, 24441. [Google Scholar] [CrossRef]
- Maddury, S. Automated Huntington’s Disease Prognosis via Biomedical Signals and Shallow Machine Learning. arXiv 2023, arXiv:2302.03605v2. [Google Scholar]
- Olyanasab, A.; Annabestani, M. Leveraging Machine Learning for Personalized Wearable Biomedical Devices: A Review. J. Pers. Med. 2024, 14, 203. [Google Scholar] [CrossRef] [PubMed]
- Zaim, T.; Abdel-Hadi, S.; Mahmoud, R.; Khandakar, A.; Rakhtala, S.M.; Chowdhury, M.E.H. Machine Learning- and Deep Learning-Based Myoelectric Control System for Upper Limb Rehabilitation Utilizing EEG and EMG Signals: A Systematic Review. Bioengineering 2025, 12, 144. [Google Scholar] [CrossRef] [PubMed]
- Jeong, I.; Chung, W.G.; Kim, E.; Park, W.; Song, H.; Lee, J.; Oh, M.; Kim, E.; Paek, J.; Lee, T.; et al. Machine Learning in Biosignal Analysis from Wearable Devices. Mater. Horiz. 2025, 12, 6587–6621. [Google Scholar] [CrossRef]
- Islam, M.K.; Rastegarnia, A.; Sanei, S. Signal Artifacts and Techniques for Artifacts and Noise Removal. In Signal Processing Techniques for Computational Health Informatics; Springer: Berlin/Heidelberg, Germany, 2020; pp. 23–78. [Google Scholar]
- Philips, W. Adaptive Noise Removal from Biomedical Signals Using Warped Polynomials. IEEE Trans. Biomed. Eng. 1996, 43, 480–492. [Google Scholar] [CrossRef]
- Schanze, T. Compression and Noise Reduction of Biomedical Signals by Singular Value Decomposition. IFAC-PapersOnLine 2018, 51, 361–366. [Google Scholar] [CrossRef]
- Sakai, A.; Minoda, Y.; Morikawa, K. Data Augmentation Methods for Machine-Learning-Based Classification of Bio-Signals. In Proceedings of the 2017 10th Biomedical Engineering International Conference (BMEiCON), Hokkaido, Japan, 31 August–2 September 2017; pp. 1–4. [Google Scholar]
- Shapshak, P. Fourier Transform in Bioinformatics and Biomedicine. Bioinformation 2025, 21, 575–577. [Google Scholar] [CrossRef]
- Pezoulas, V.C.; Zaridis, D.I.; Mylona, E.; Androutsos, C.; Apostolidis, K.; Tachos, N.S.; Fotiadis, D.I. Synthetic Data Generation Methods in Healthcare: A Review on Open-Source Tools and Methods. Comput. Struct. Biotechnol. J. 2024, 23, 2892–2910. [Google Scholar] [CrossRef]
- Barberis, A.; Aerts, H.J.W.L.; Buffa, F.M. Robustness and Reproducibility for AI Learning in Biomedical Sciences: RENOIR. Sci. Rep. 2024, 14, 2381. [Google Scholar] [CrossRef] [PubMed]
- Chang, S.; Shihong, Y.; Qi, L. Clustering Characteristics of UCI Dataset. In Proceedings of the 2020 39th Chinese Control Conference (CCC), Shenyang, China, 27–29 July 2020; pp. 6301–6306. [Google Scholar]
- Blankertz, B.; Muller, K.-R.; Krusienski, D.J.; Schalk, G.; Wolpaw, J.R.; Schlogl, A.; Pfurtscheller, G.; Millan, J.R.; Schroder, M.; Birbaumer, N. The BCI Competition III: Validating Alternative Approaches to Actual BCI Problems. IEEE Trans. Neural Syst. Rehabil. Eng. 2006, 14, 153–159. [Google Scholar] [CrossRef] [PubMed]
- Wan, Z.; Yu, Q.; Mao, J.; Duan, W.; Ding, C. OpenECG: Benchmarking ECG Foundation Models with Public 1.2 Million Records. arXiv 2025, arXiv:2503.00711. [Google Scholar] [CrossRef]
- Bota, P.; Silva, R.; Carreiras, C.; Fred, A.; Da Silva, H.P. BioSPPy: A Python Toolbox for Physiological Signal Processing. SoftwareX 2024, 26, 101712. [Google Scholar] [CrossRef]
- Makowski, D.; Pham, T.; Lau, Z.J.; Brammer, J.C.; Lespinasse, F.; Pham, H.; Schölzel, C.; Chen, S.H.A. NeuroKit2: A Python Toolbox for Neurophysiological Signal Processing. Behav. Res. 2021, 53, 1689–1696. [Google Scholar] [CrossRef] [PubMed]
- Lee, G.; Gommers, R.; Waselewski, F.; Wohlfahrt, K.; O’Leary, A. PyWavelets: A Python Package for Wavelet Analysis. JOSS 2019, 4, 1237. [Google Scholar] [CrossRef]
- Forcier, M.B.; Gallois, H.; Mullan, S.; Joly, Y. Integrating Artificial Intelligence into Health Care through Data Access: Can the GDPR Act as a Beacon for Policymakers? J. Law Biosci. 2019, 6, 317–335. [Google Scholar] [CrossRef] [PubMed]
- Barocas, S.; Hardt, M.; Narayanan, A. Fairness and Machine Learning; MIT Press: Cambridge, MA, USA, 2019. [Google Scholar]
- Begley, T.; Schwedes, T.; Frye, C.; Feige, I. Explainability for Fair Machine Learning. arXiv 2020, arXiv:2010.07389. [Google Scholar] [CrossRef]
- Yaacoubi, C.; Besrour, R.; Lachiri, Z. A Multimodal Biometric Identification System Based on ECG and PPG Signals. ACM Int. Conf. Proceeding Ser. 2020, 16, 1–6. [Google Scholar] [CrossRef]
- Lee, H.G.; Noh, K.Y.; Ryu, K.H. Mining Biosignal Data: Coronary Artery Disease Diagnosis Using Linear and Nonlinear Features of HRV. In Proceedings of the Pacific-Asia Conference on Knowledge Discovery and Data Mining, Nanjing, China, 22–25 May 2007; pp. 218–228. [Google Scholar]
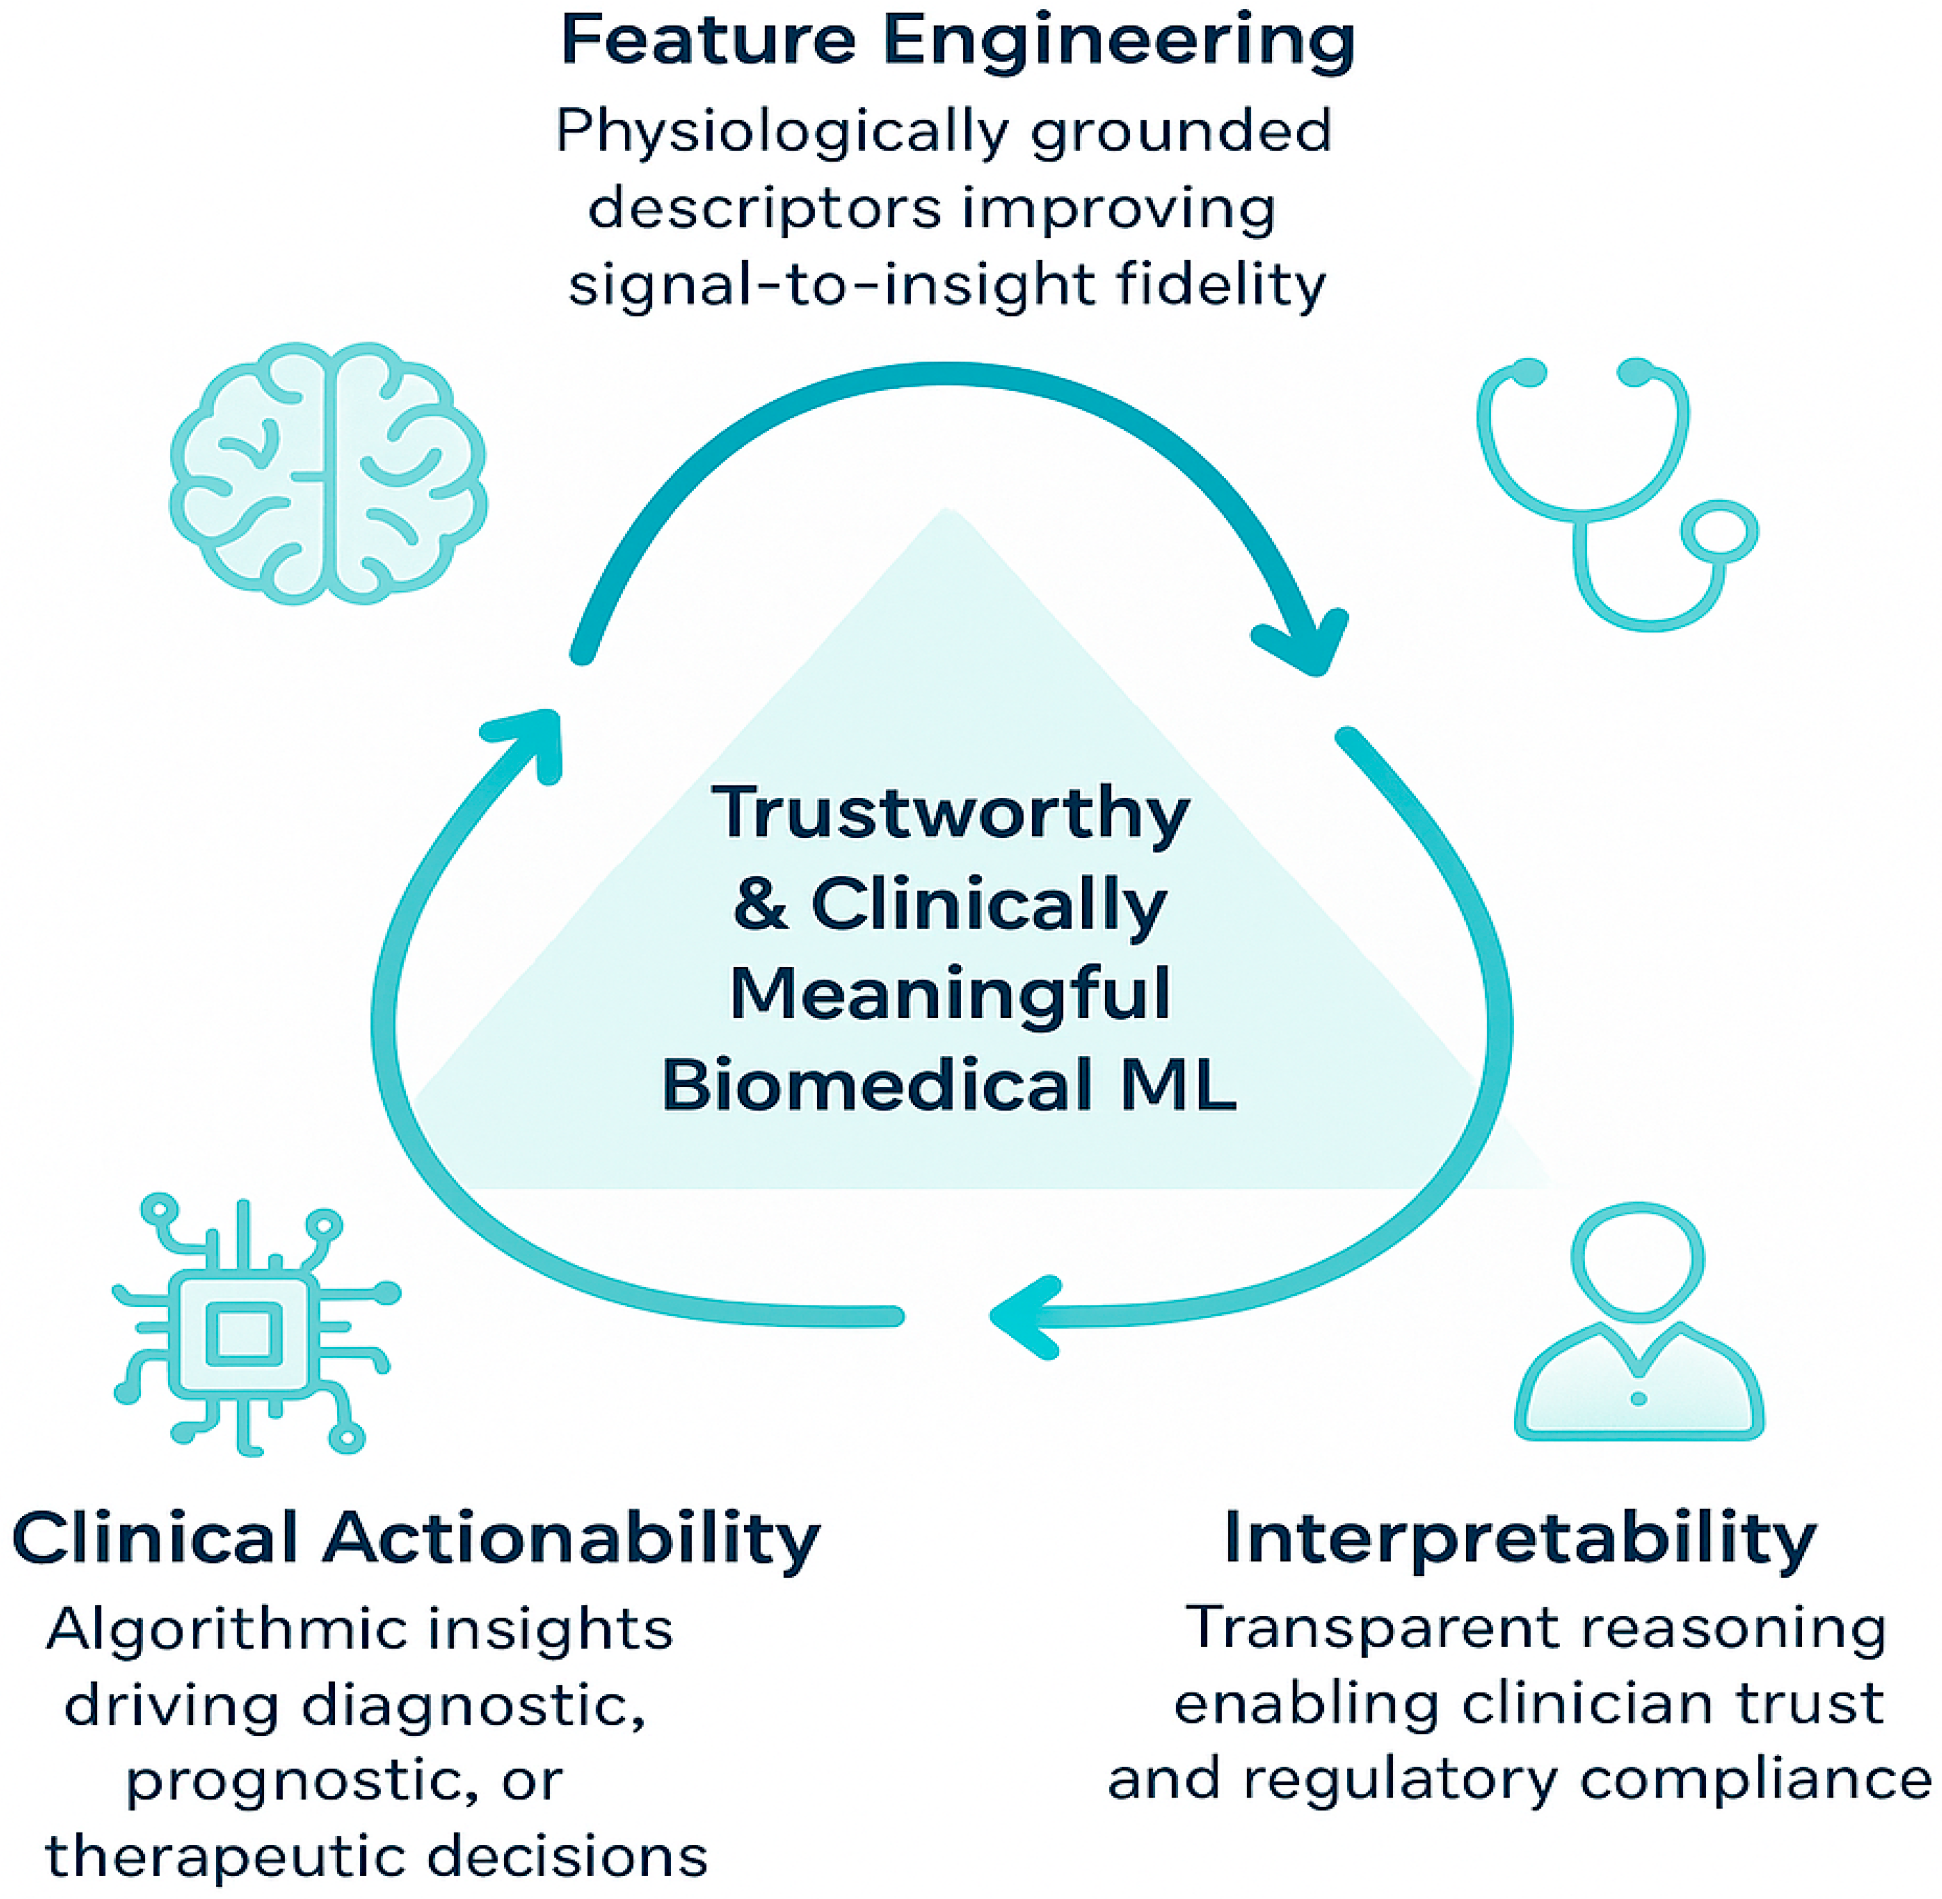
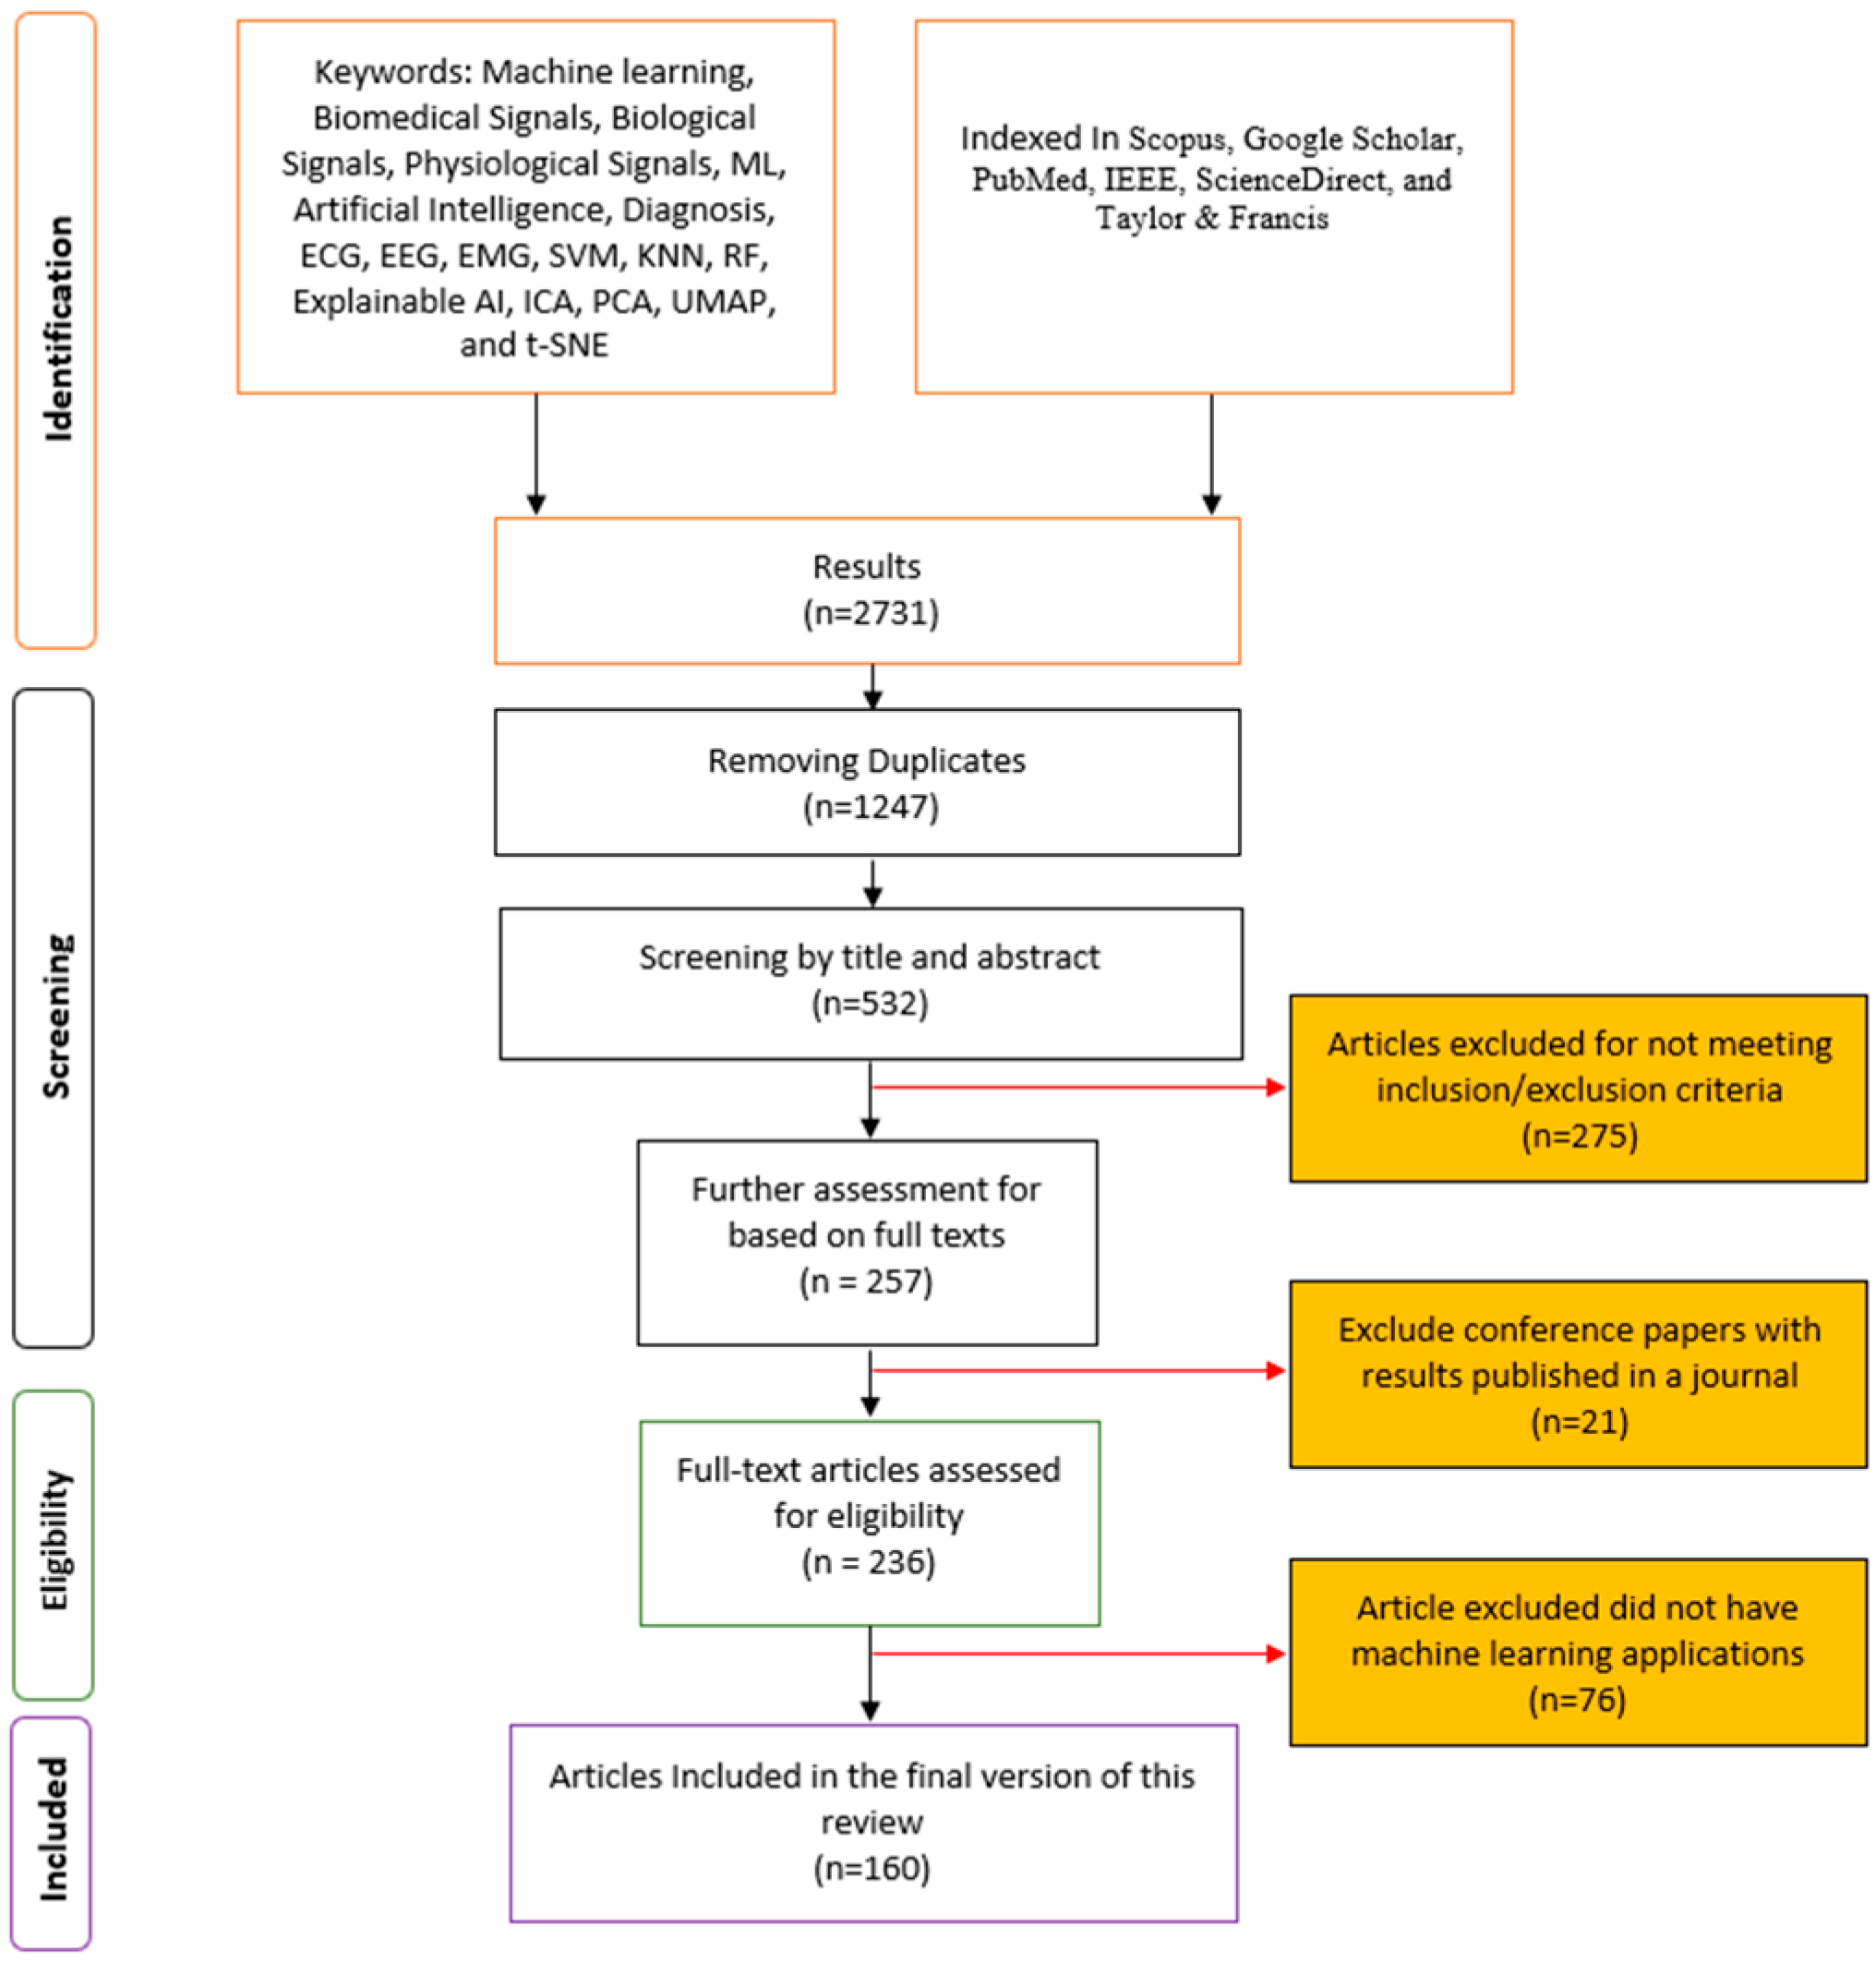

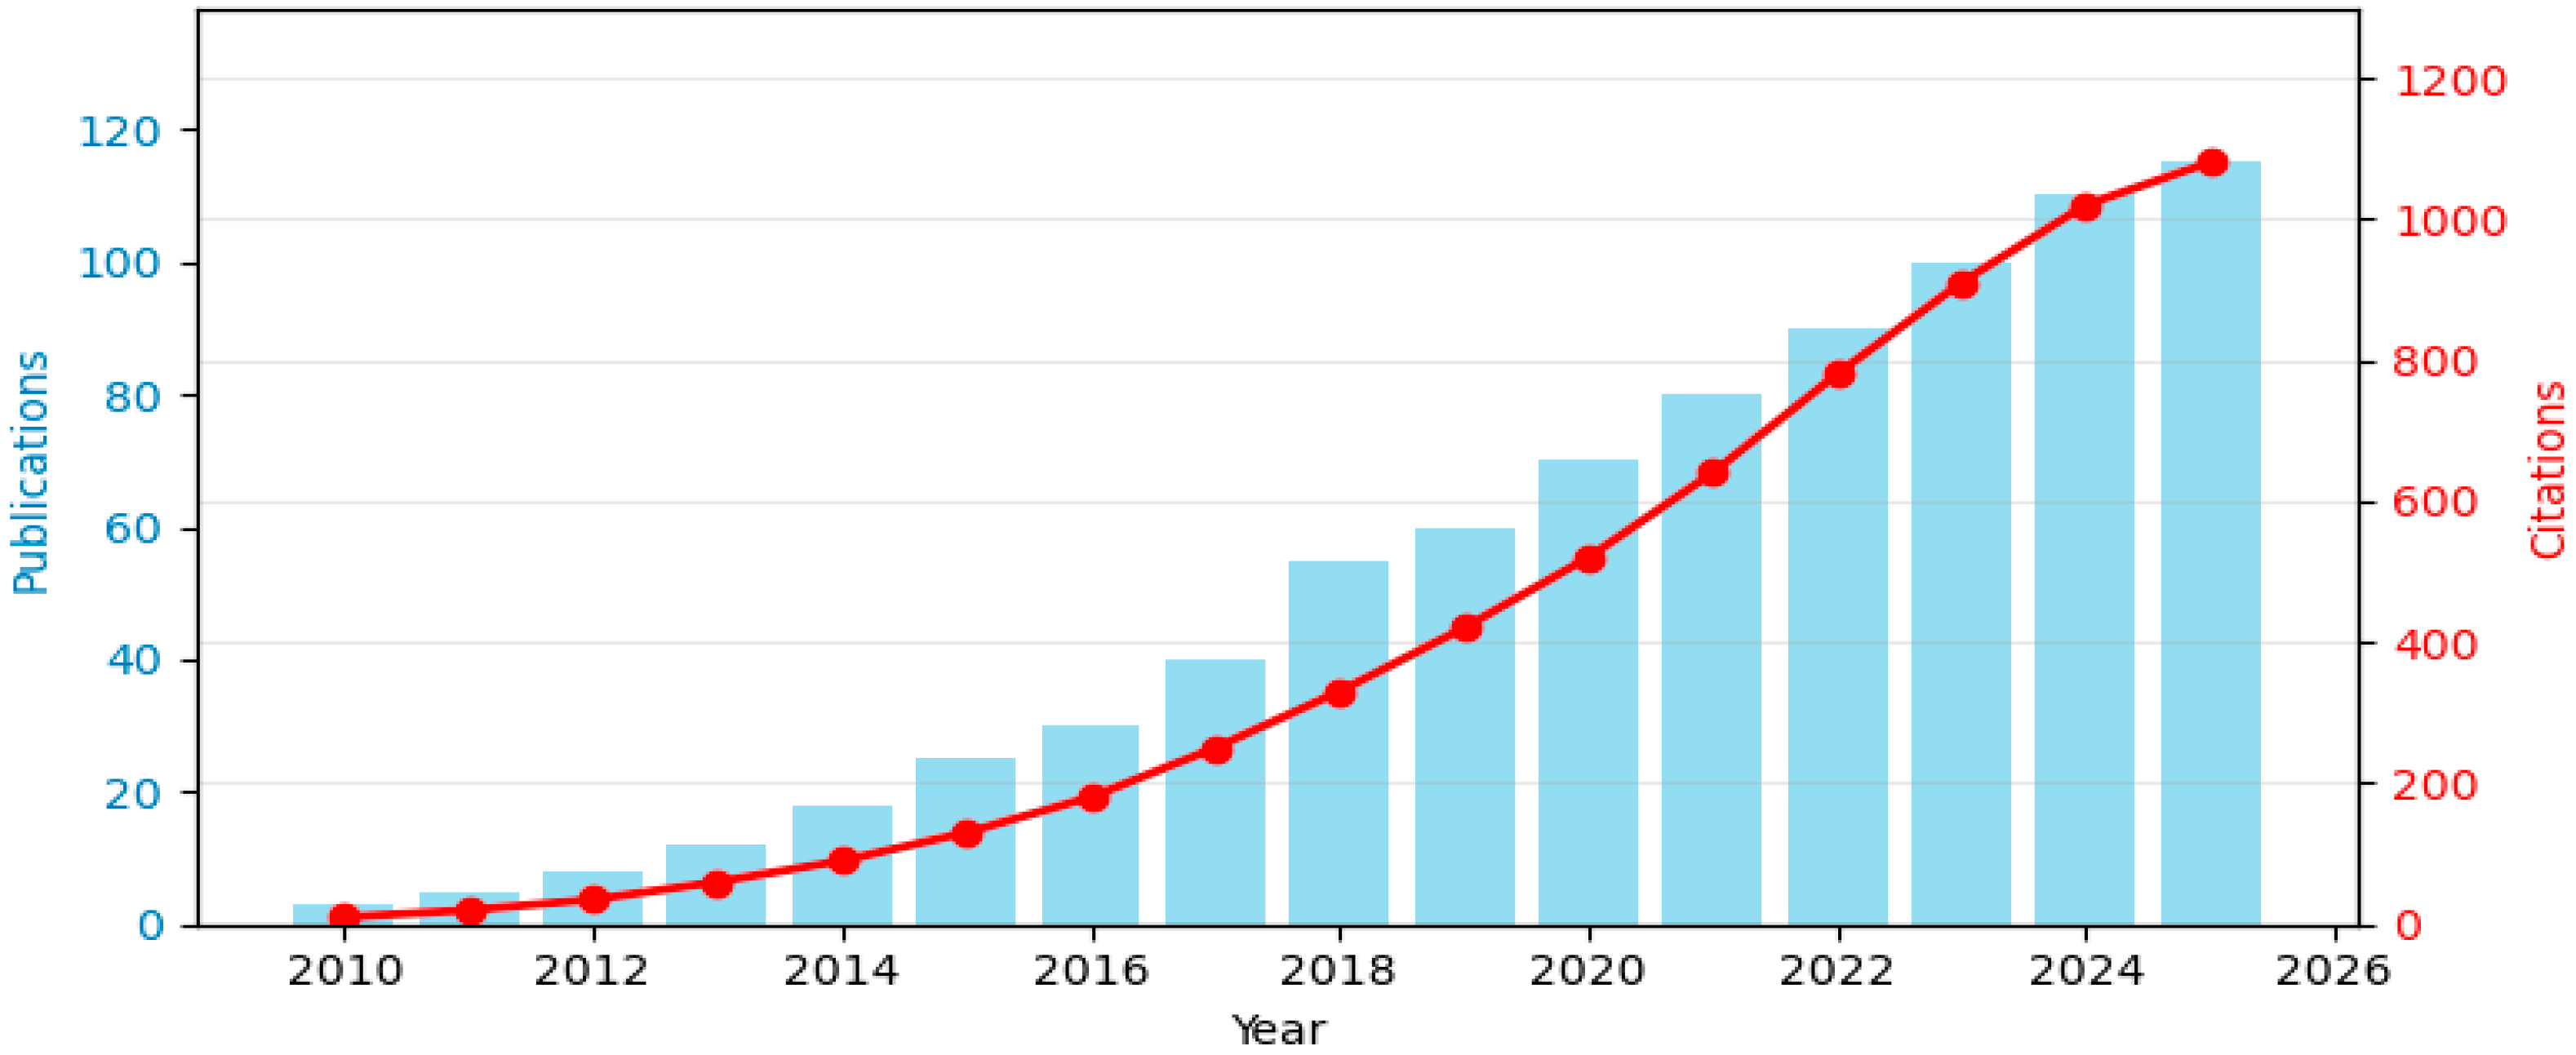
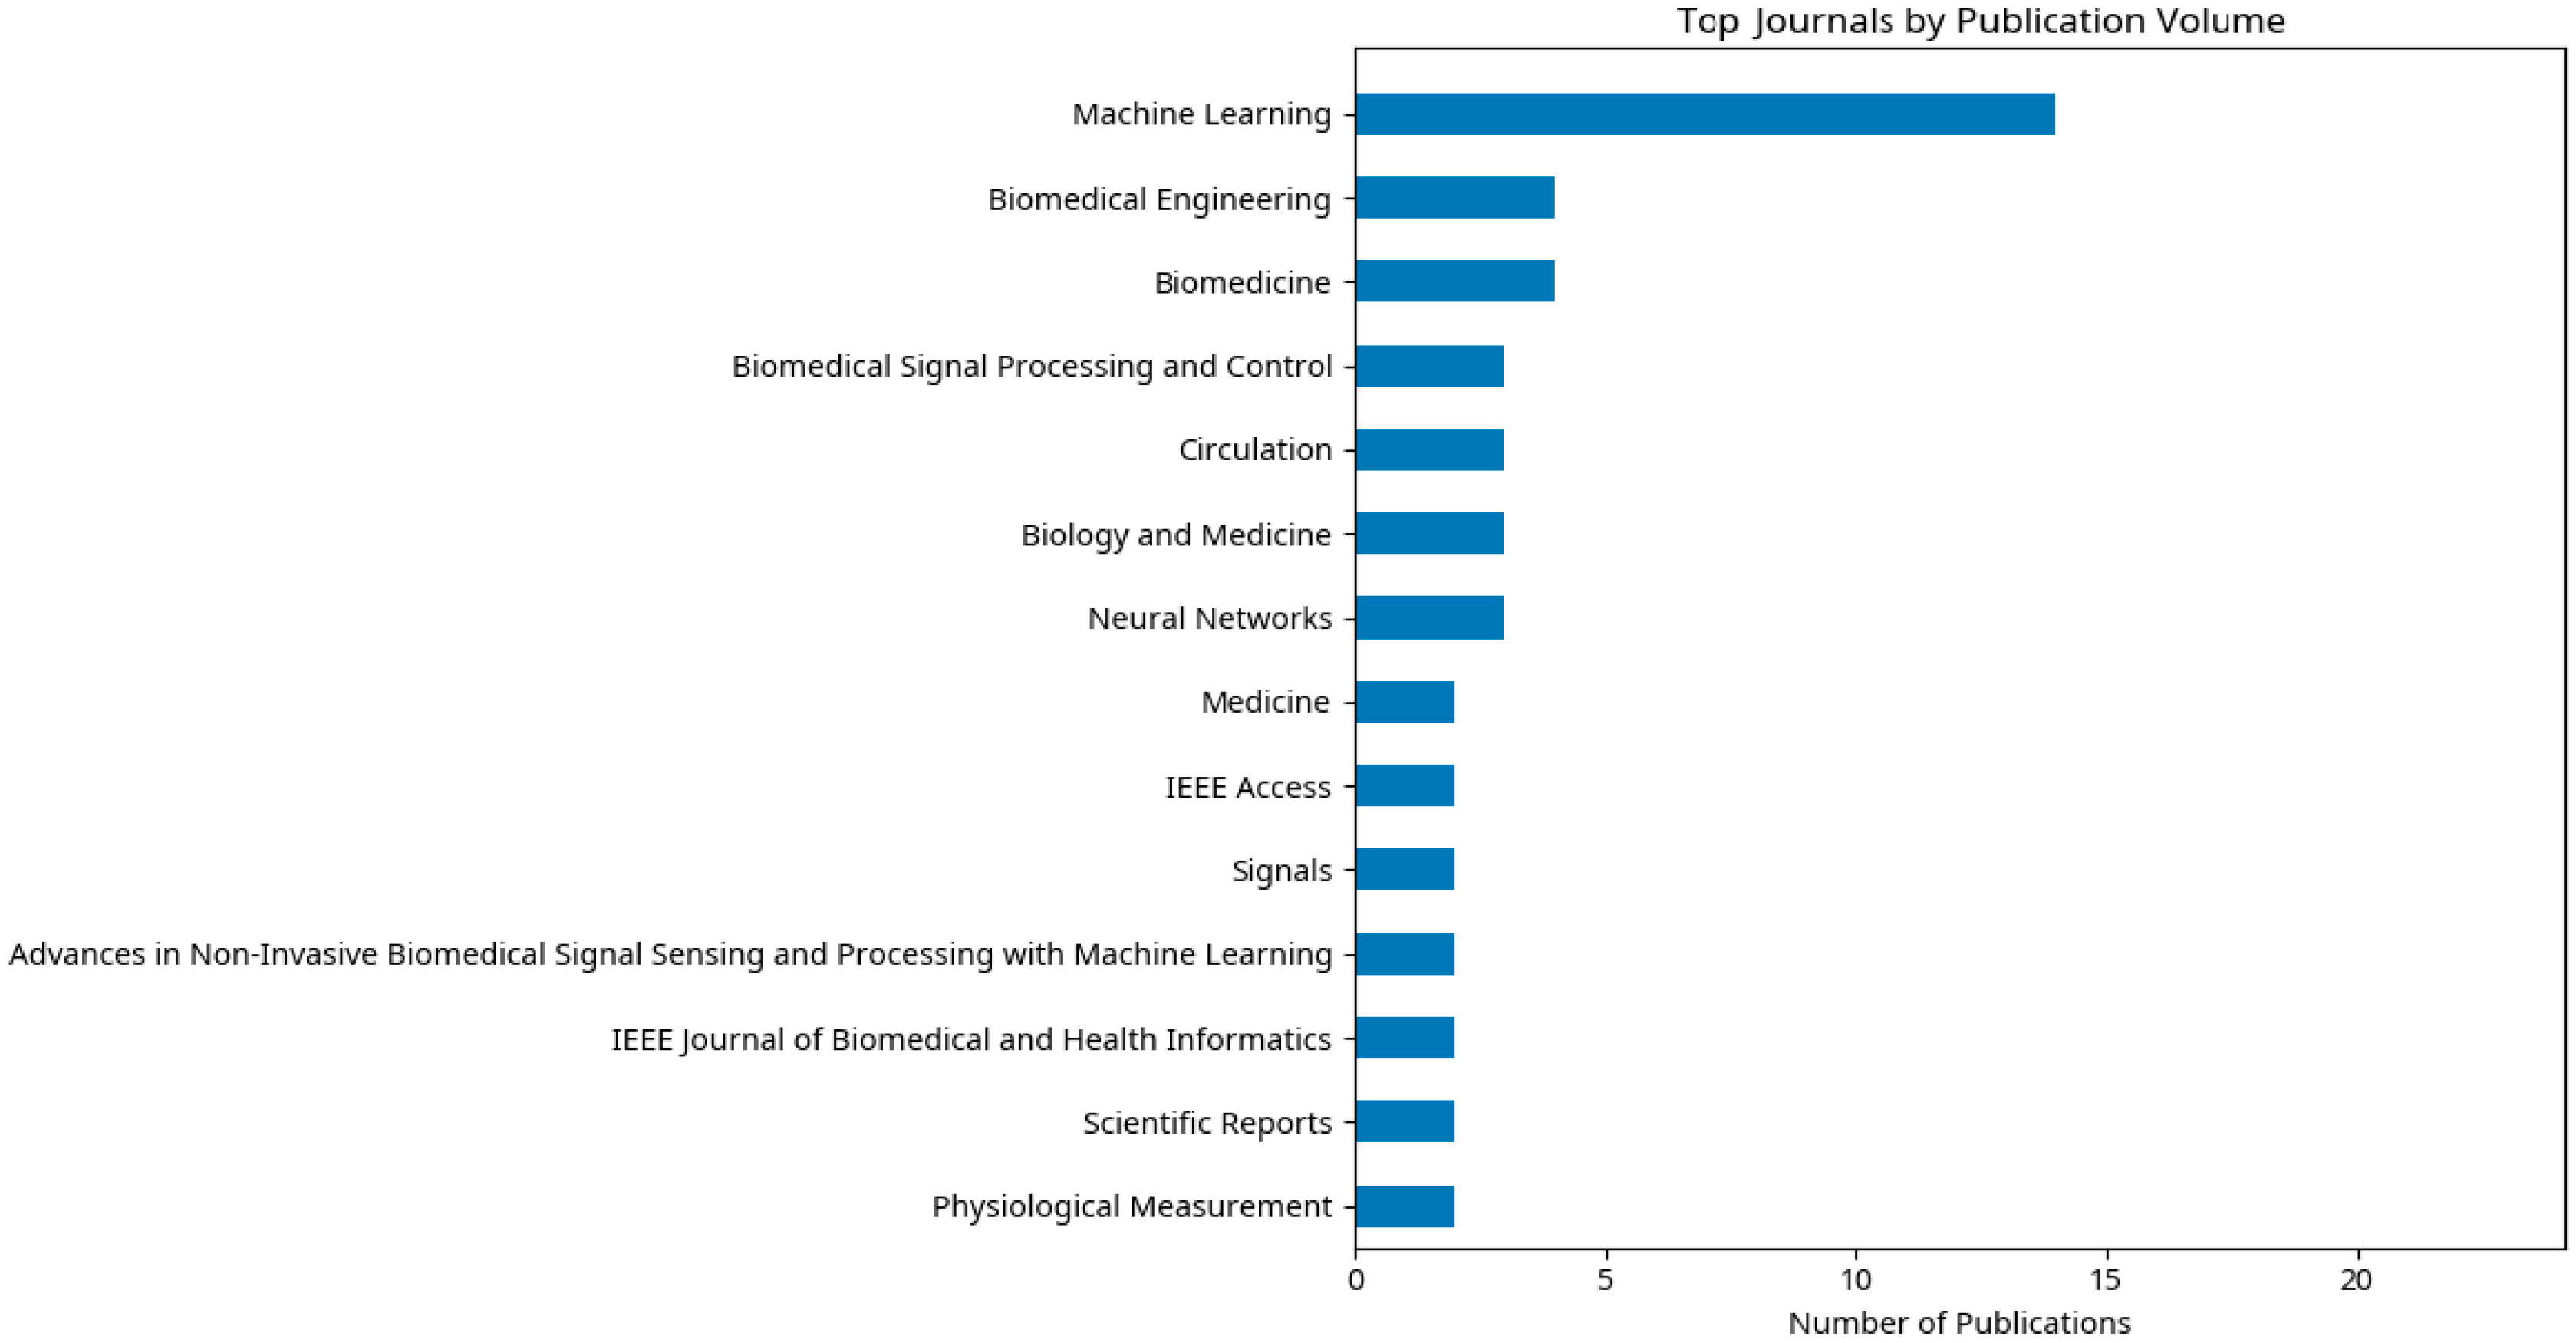
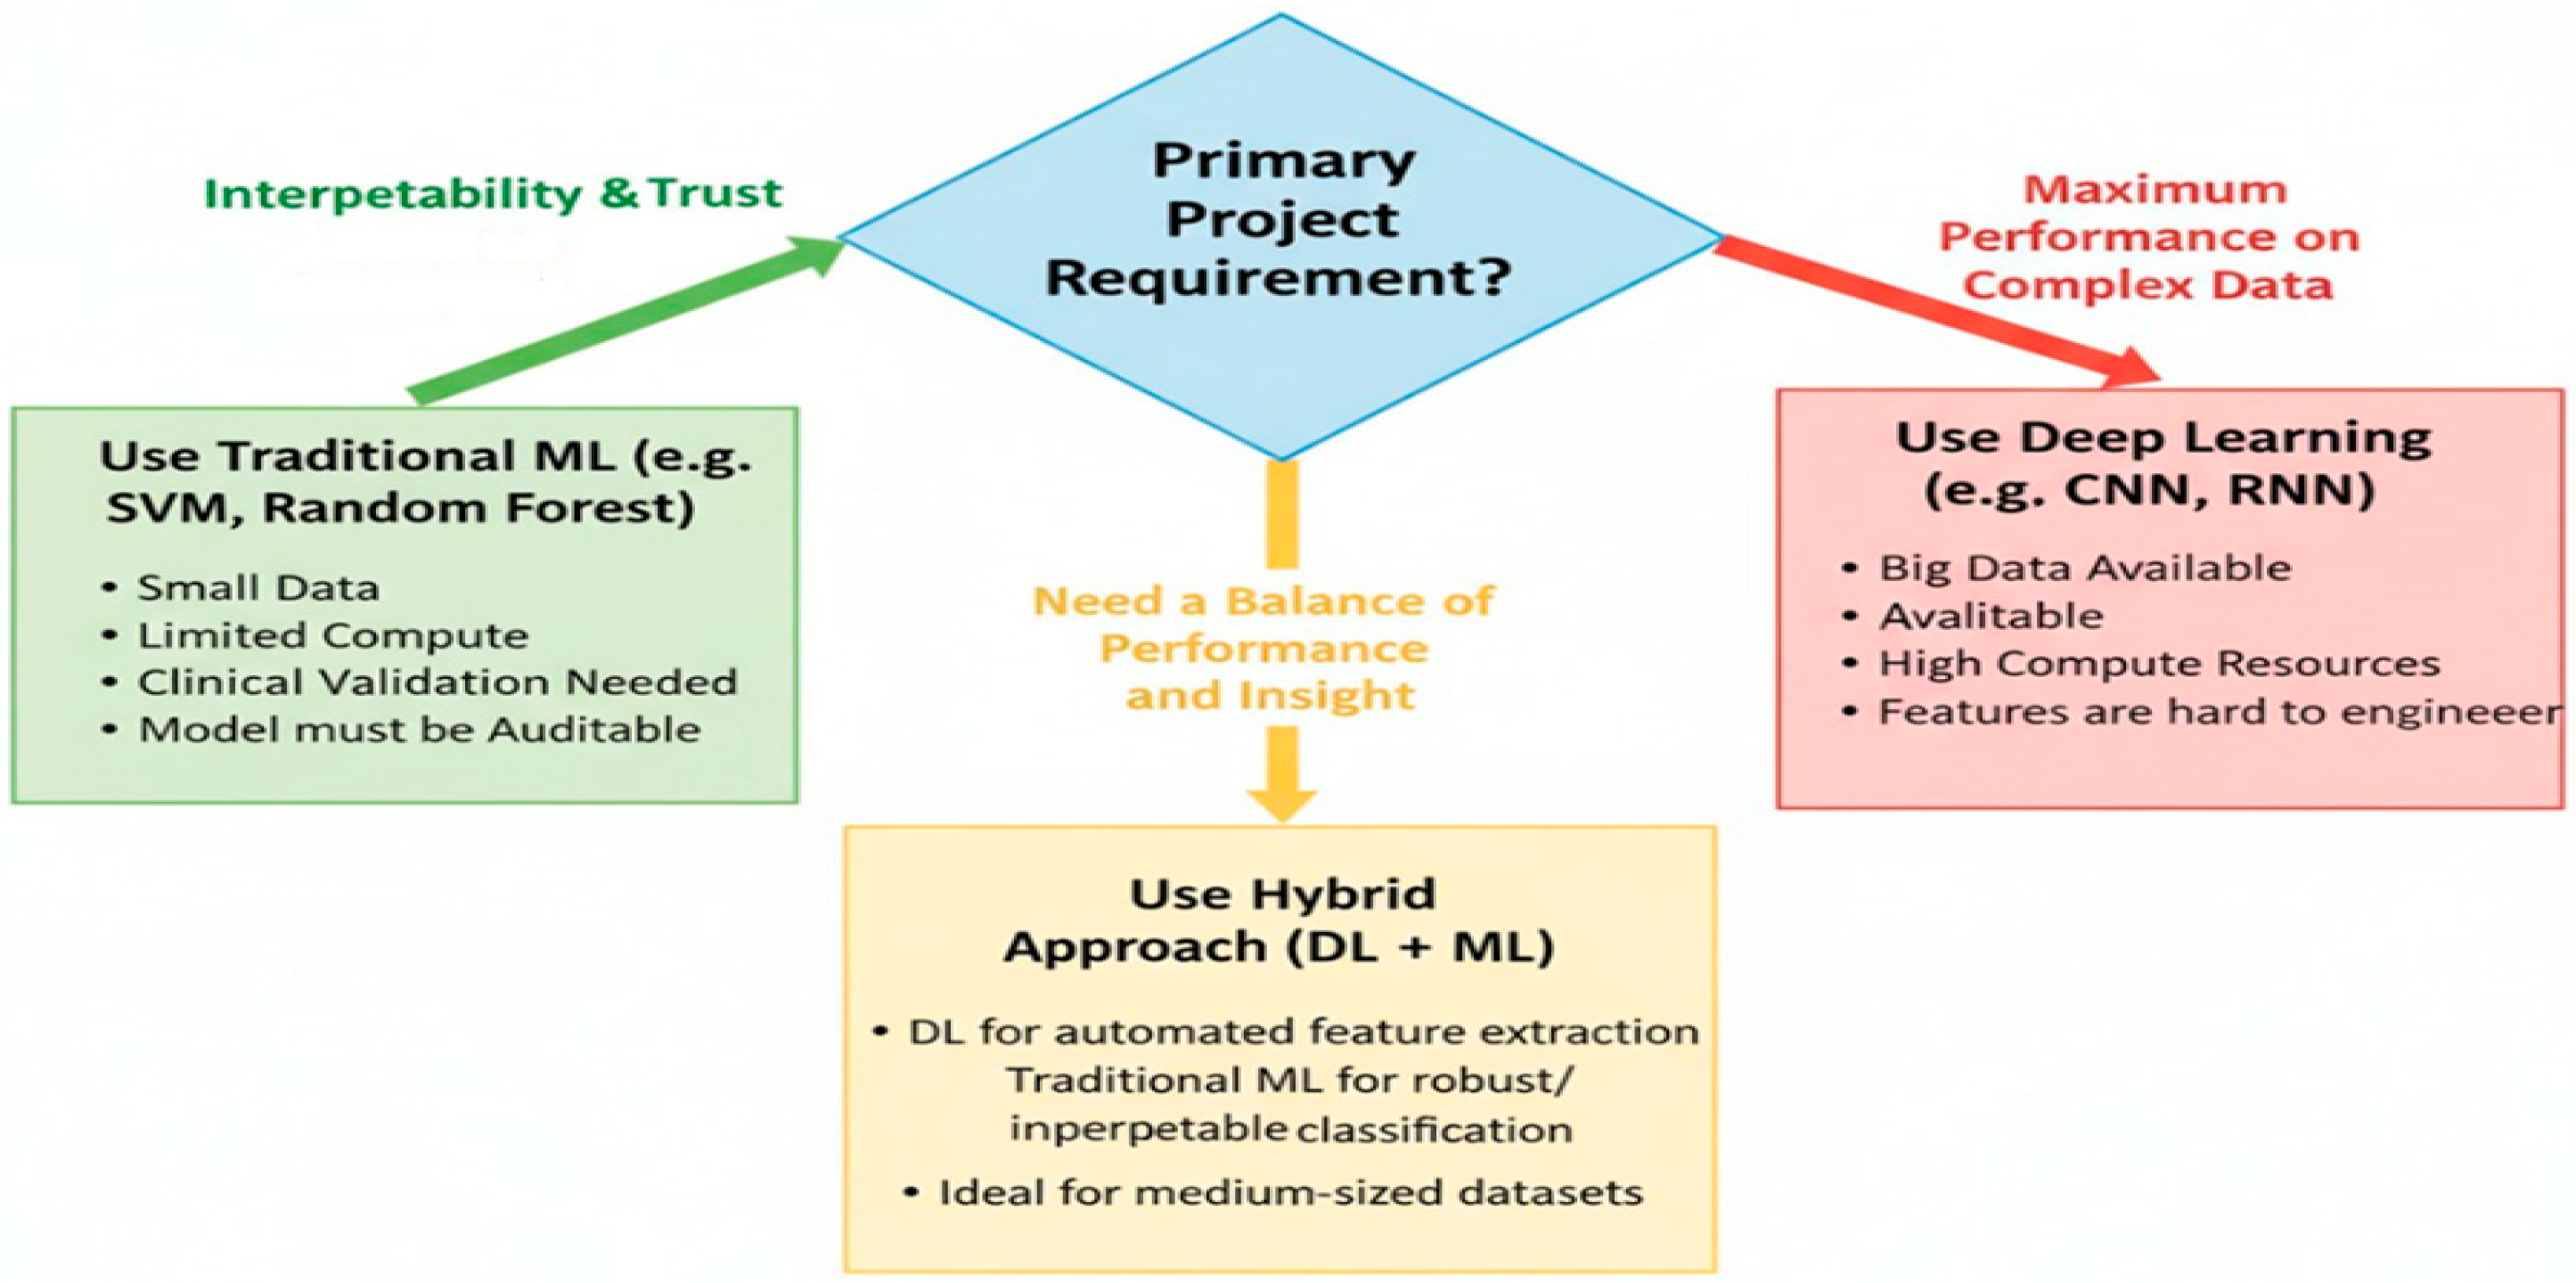
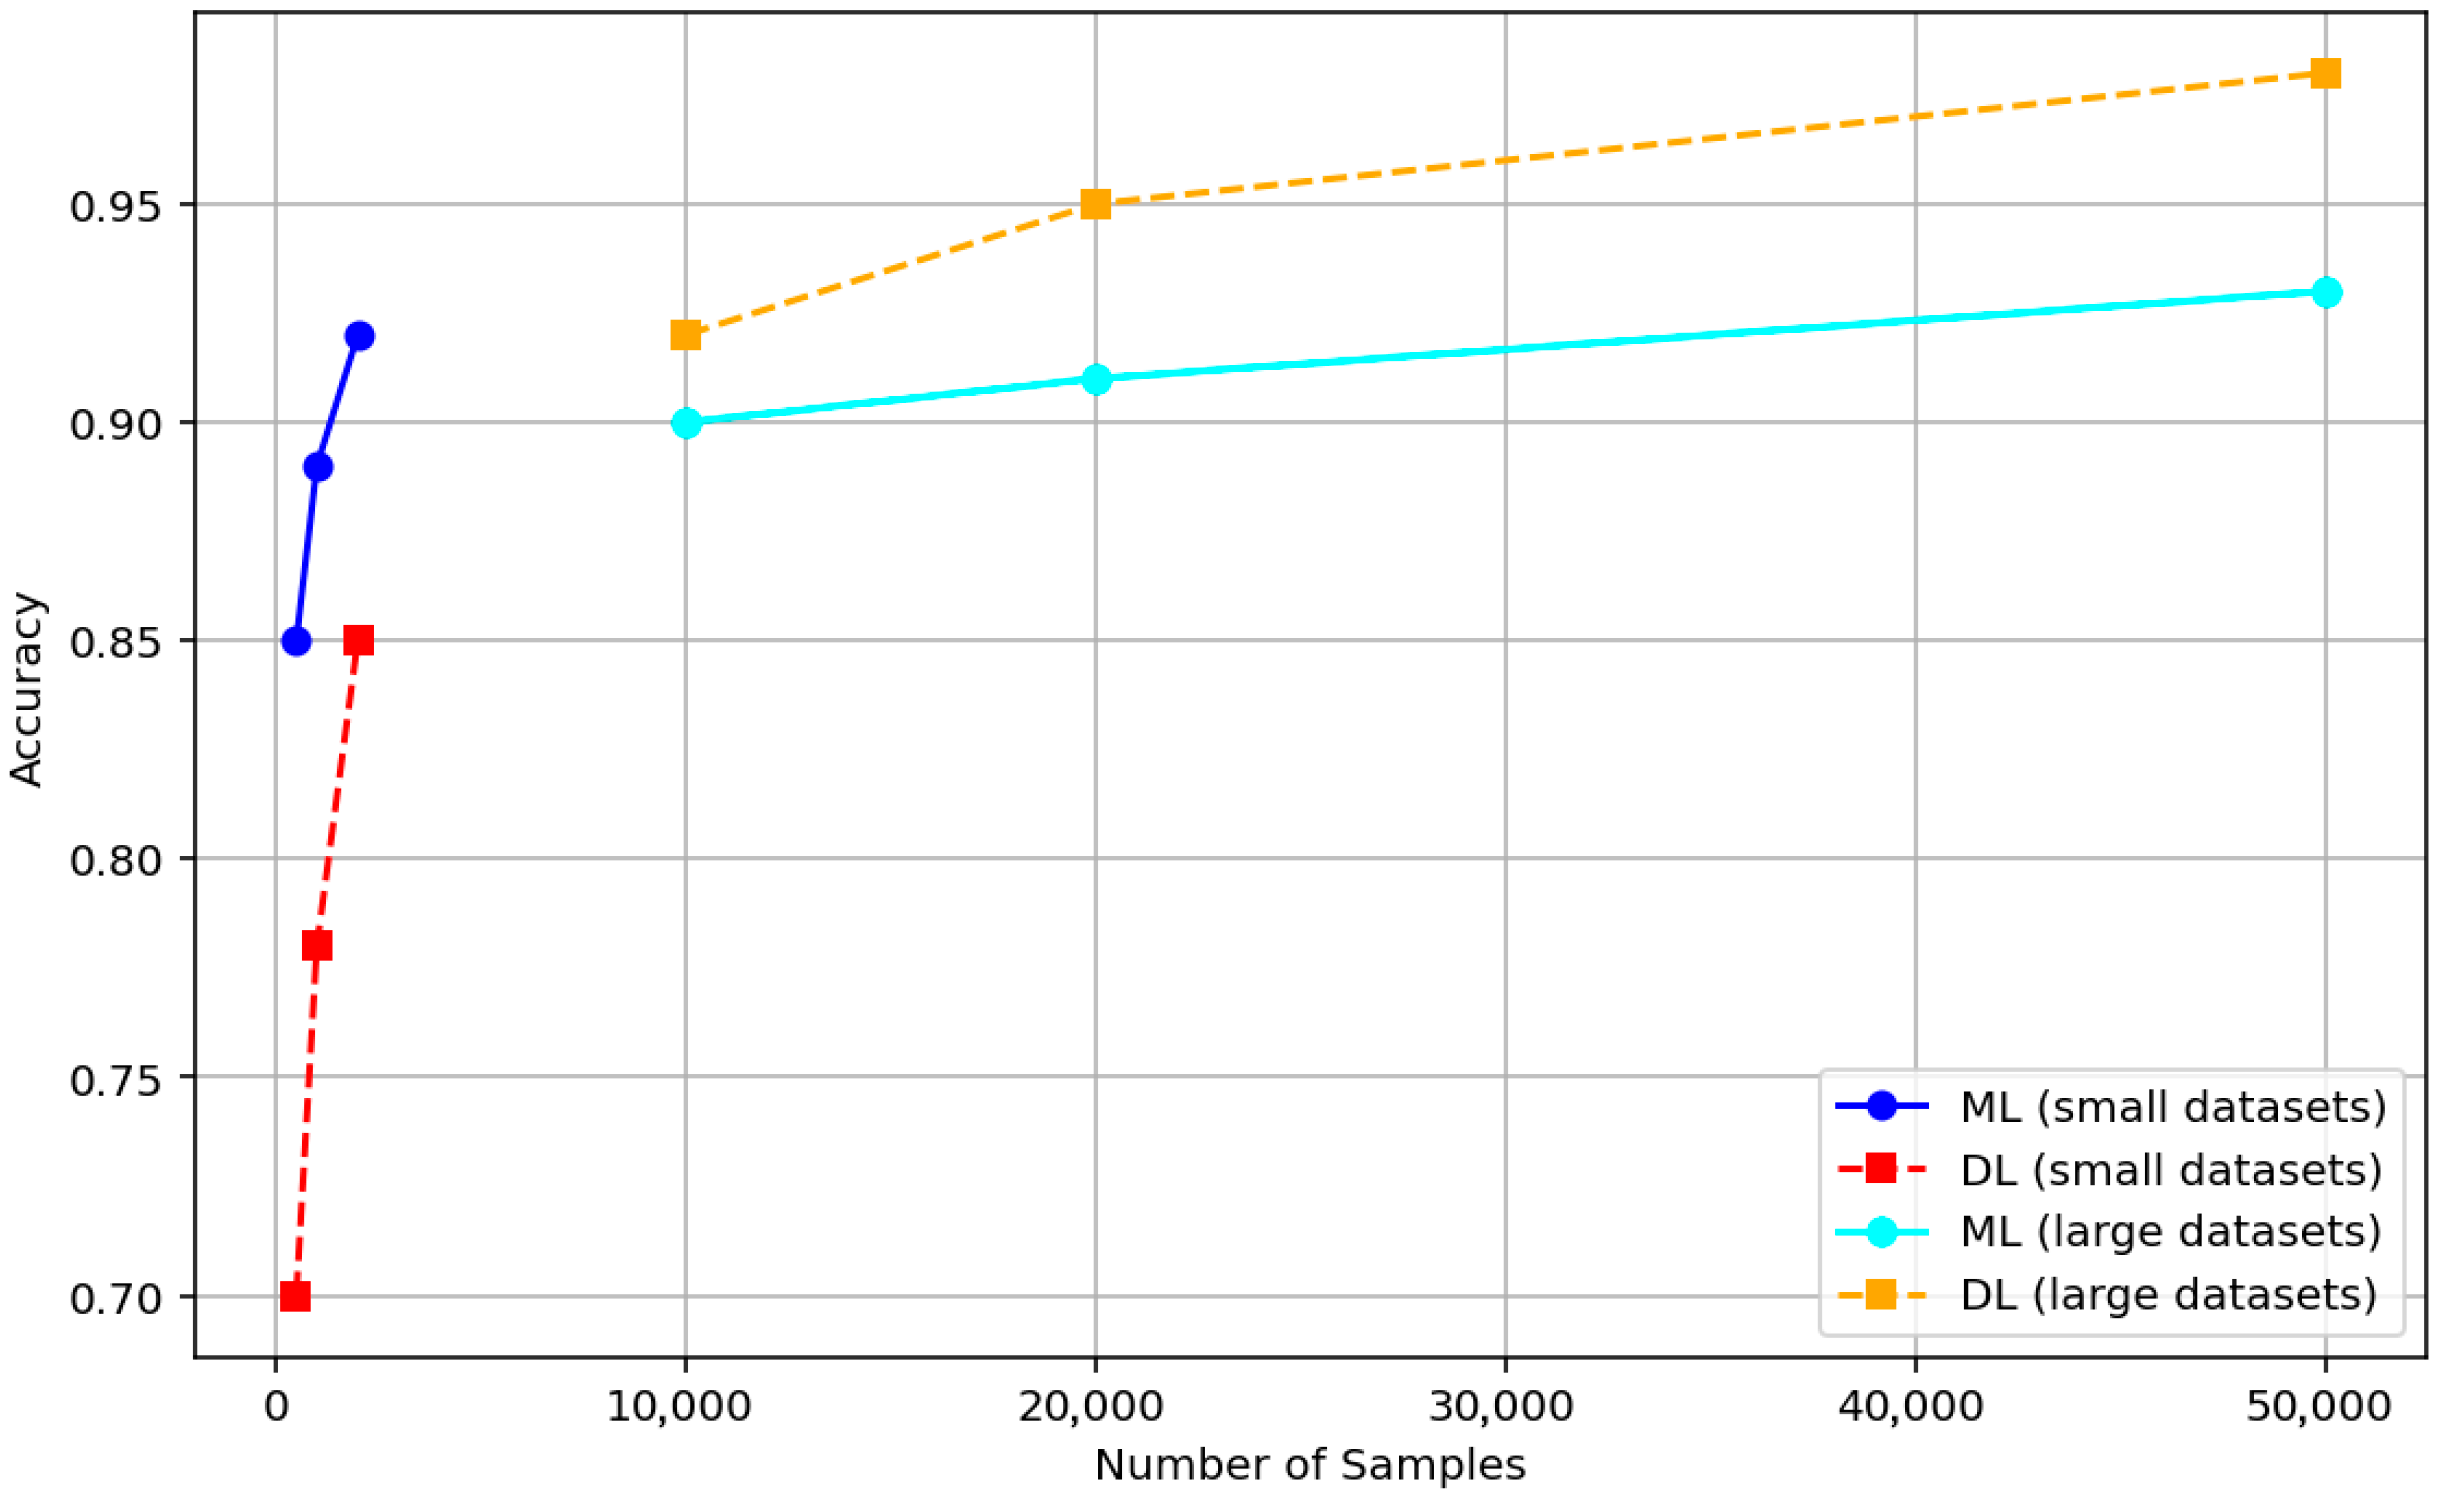
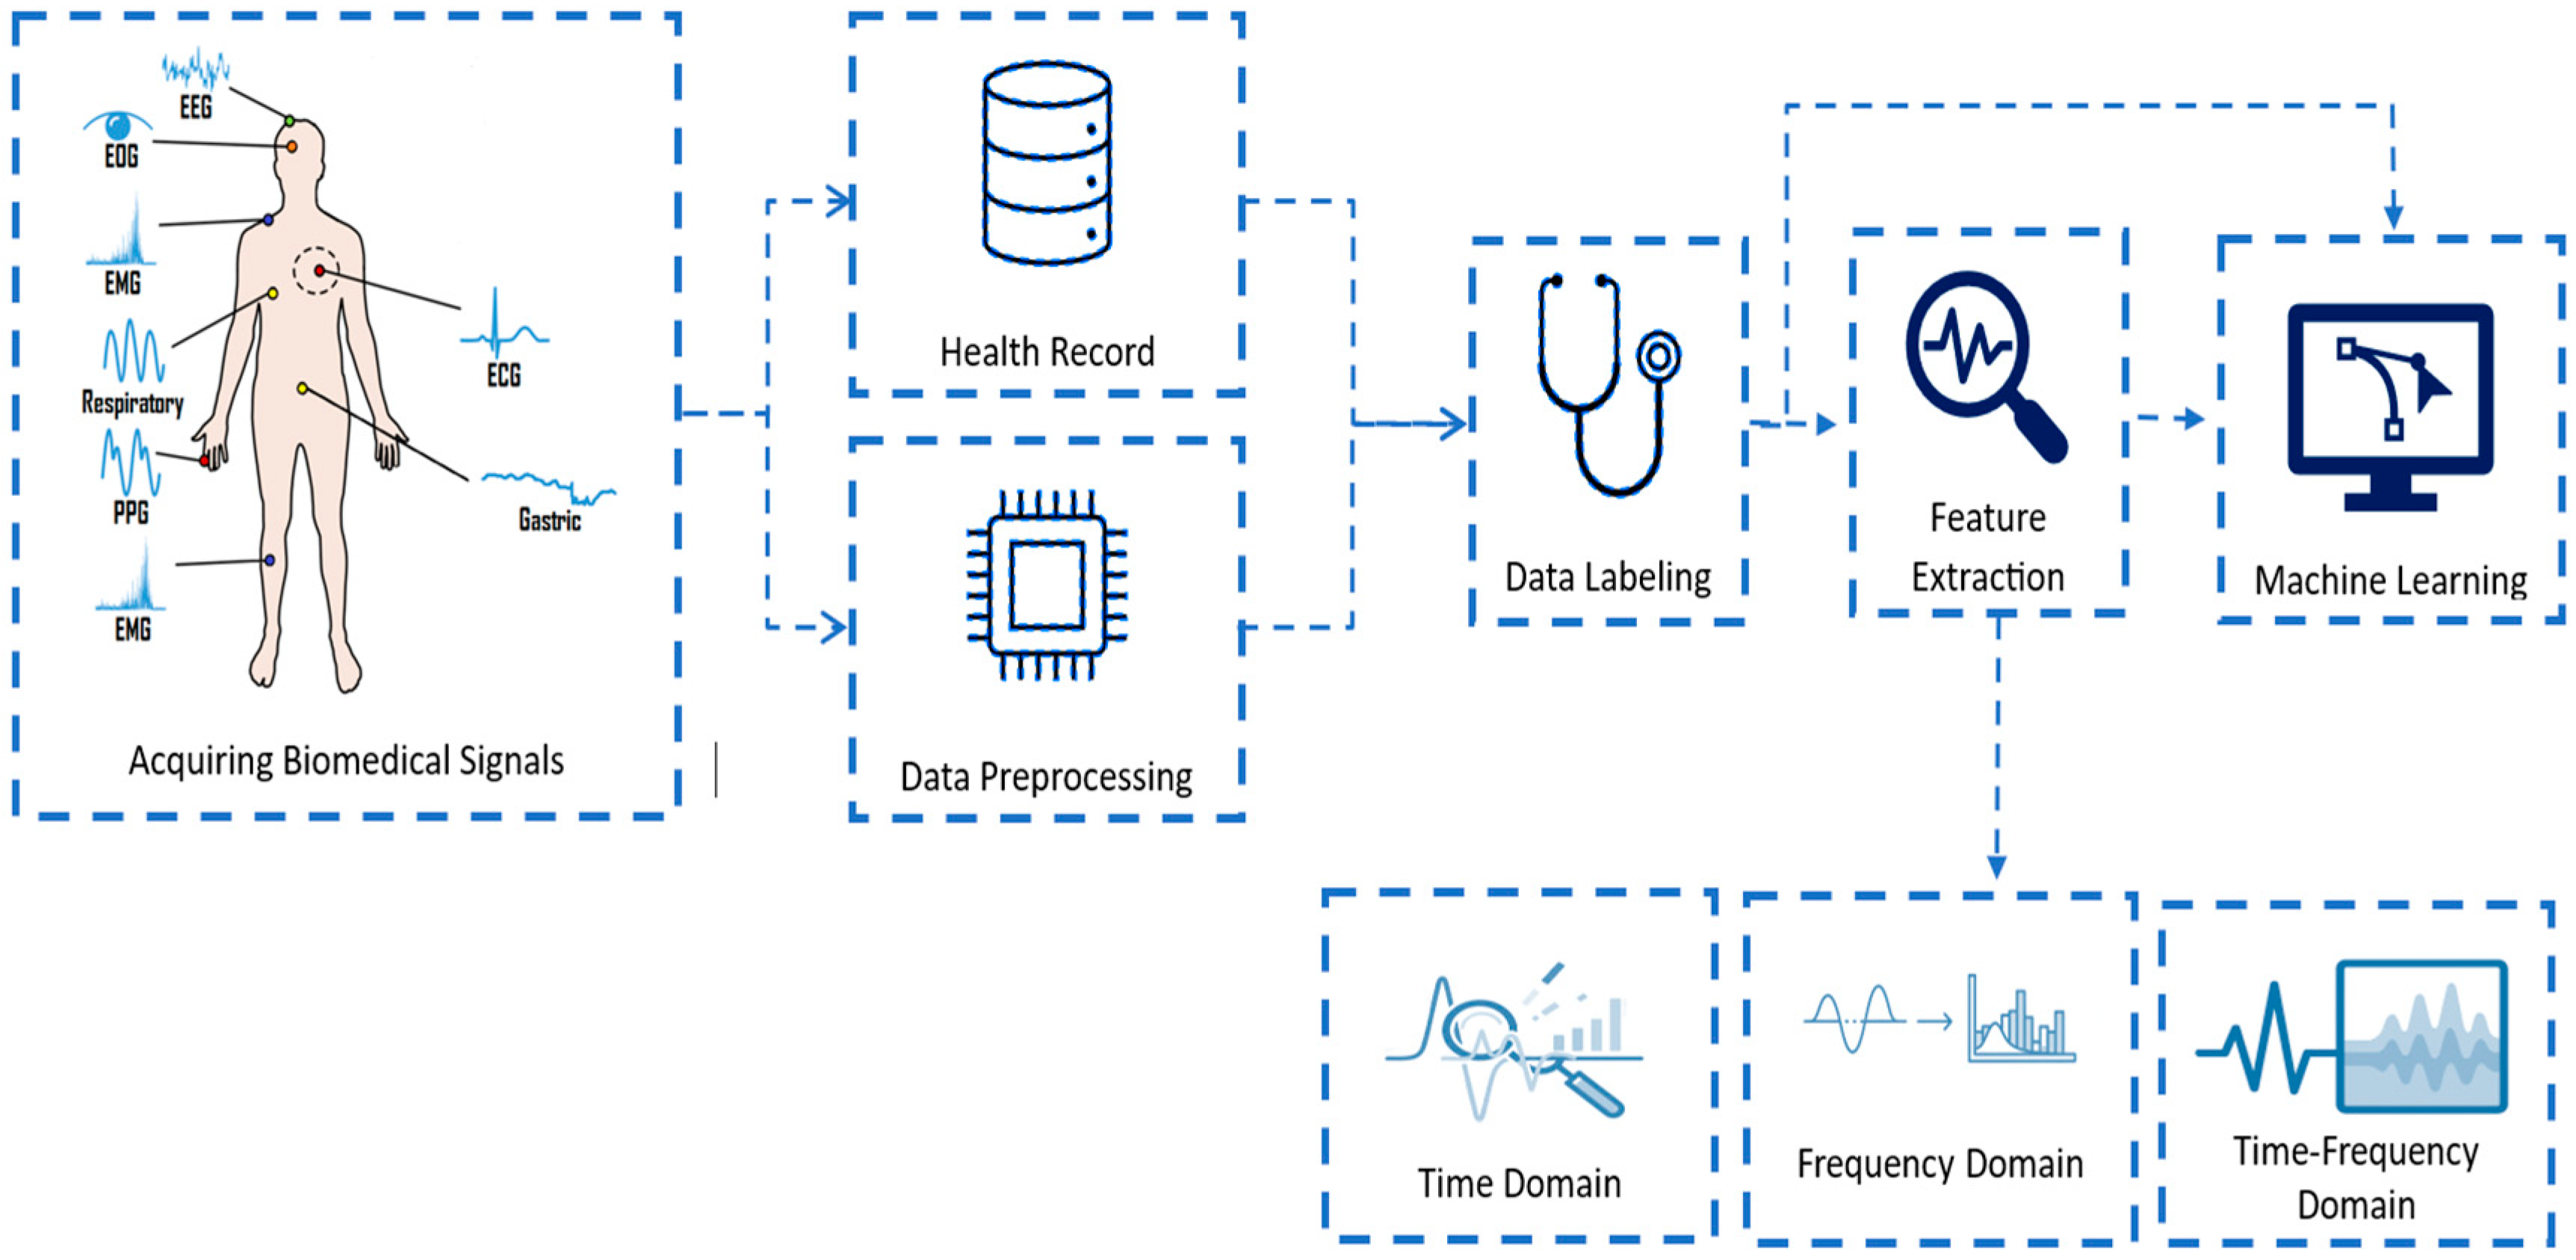
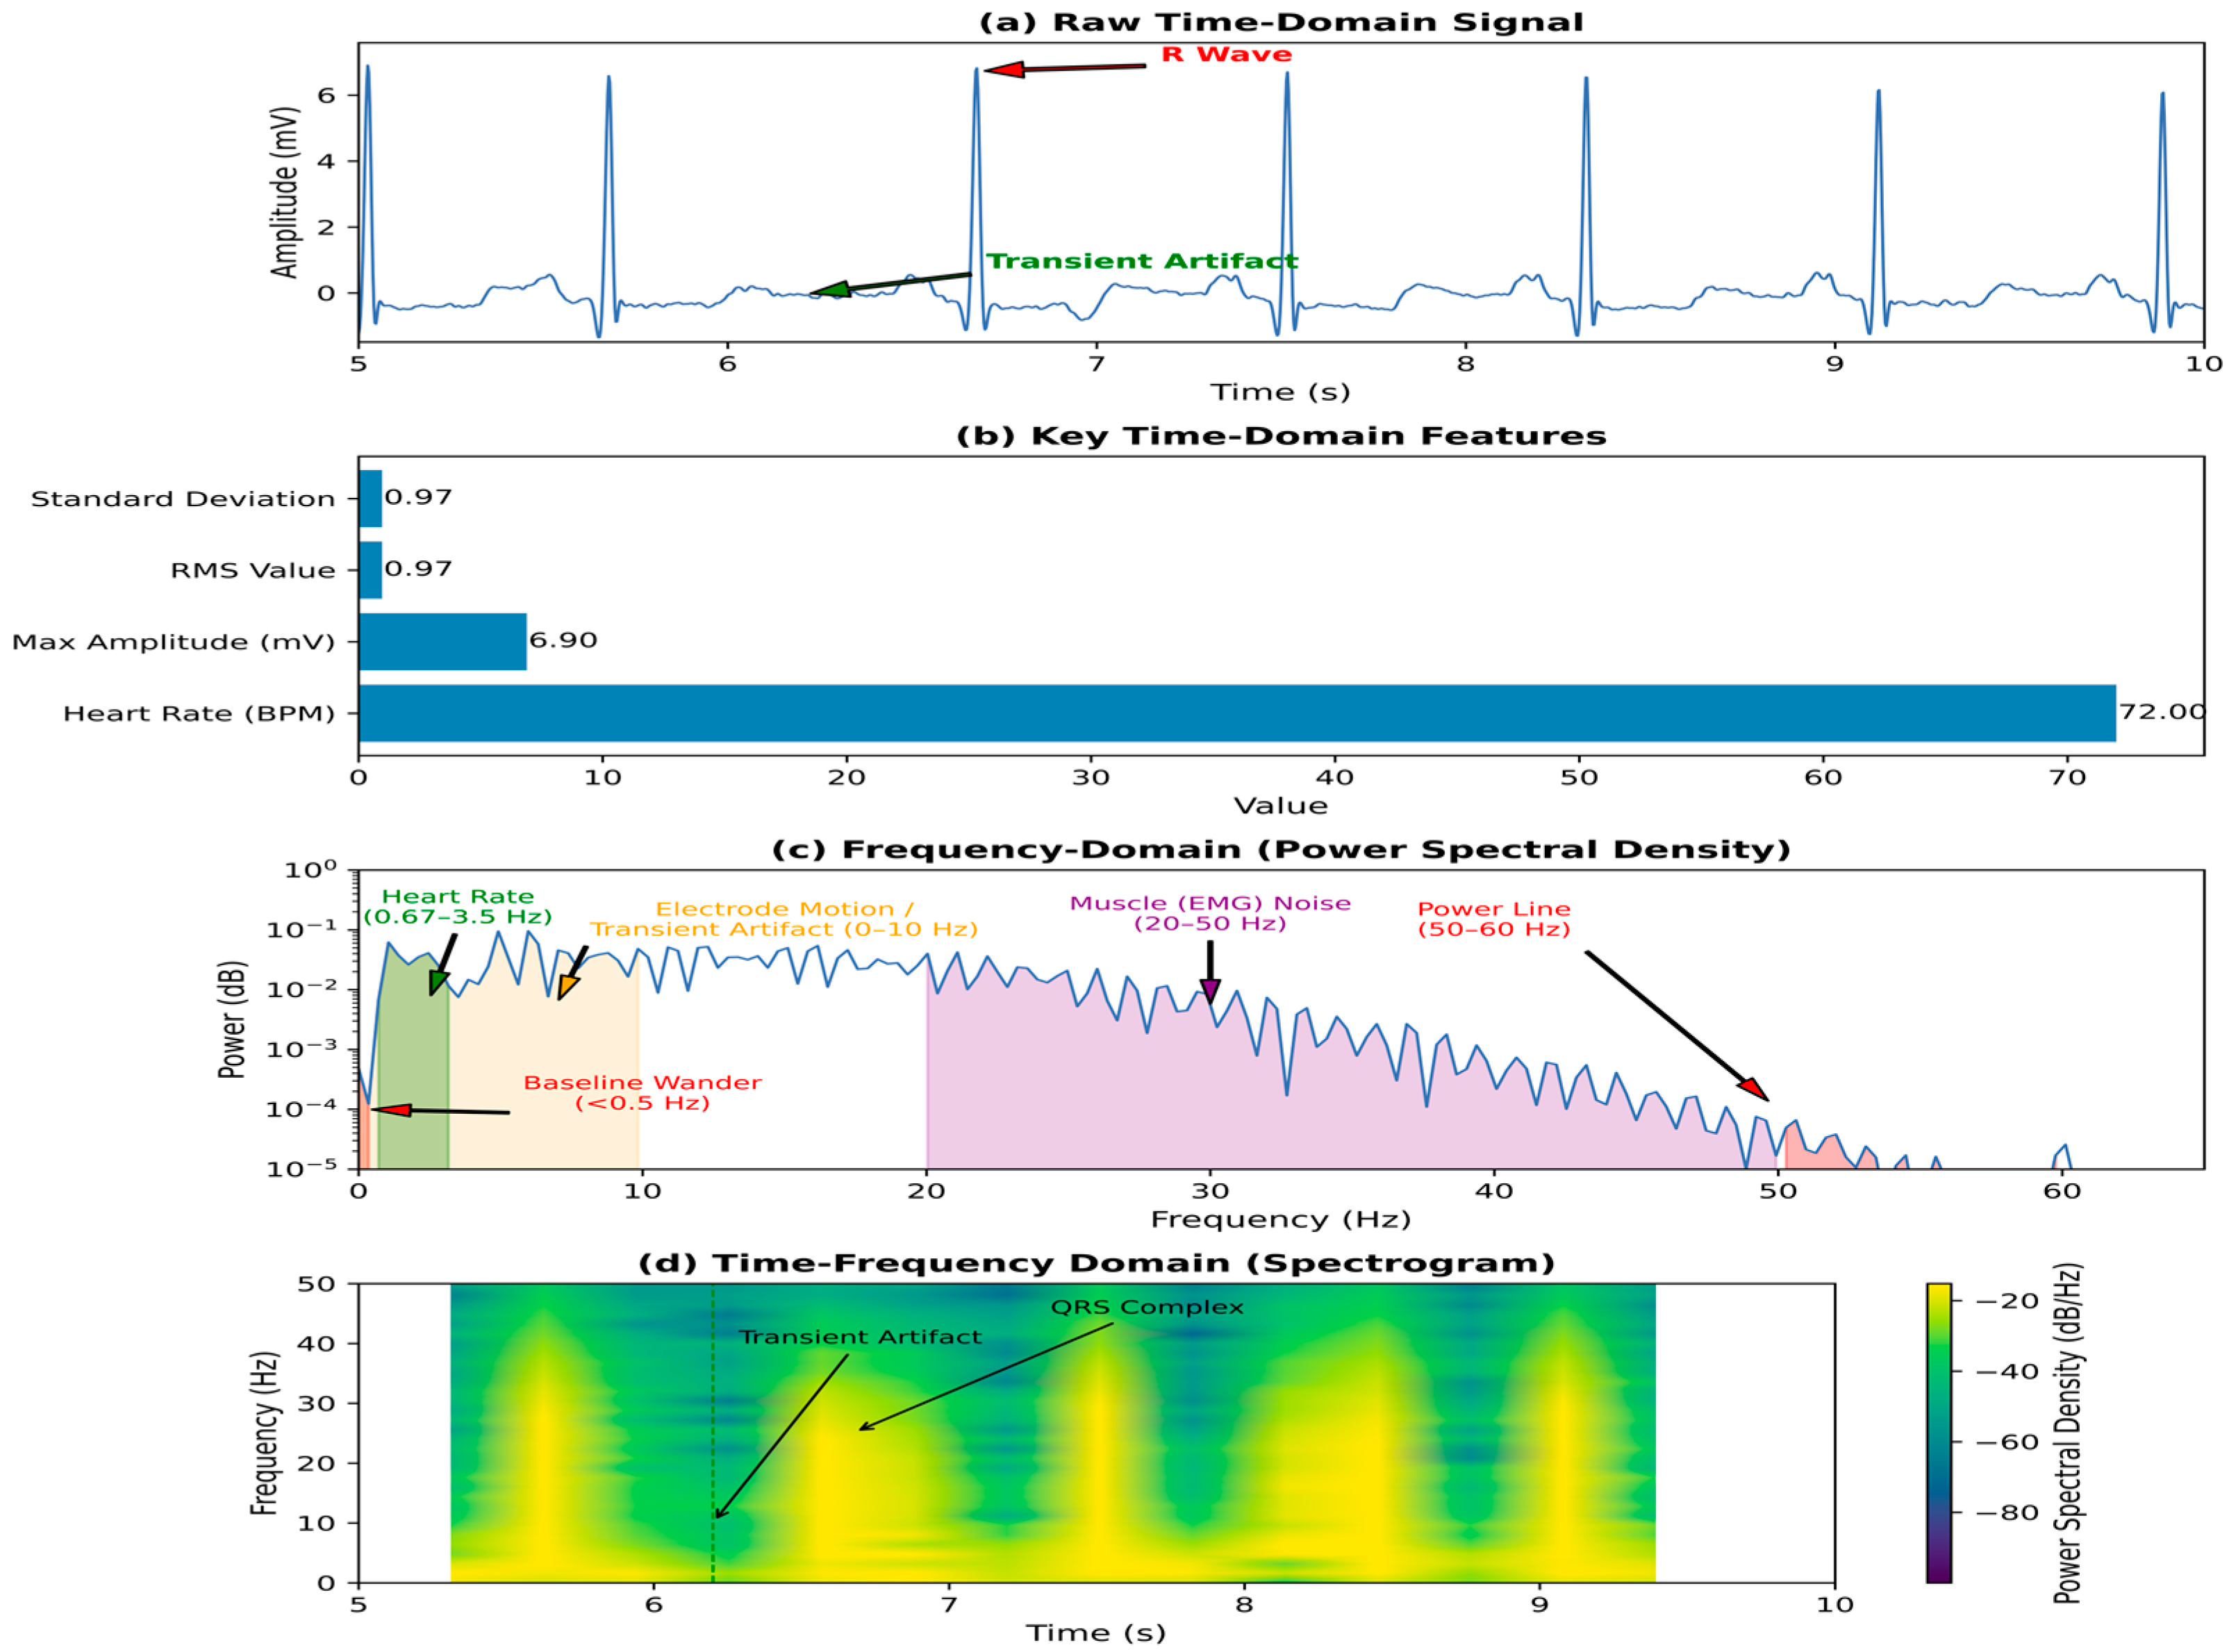
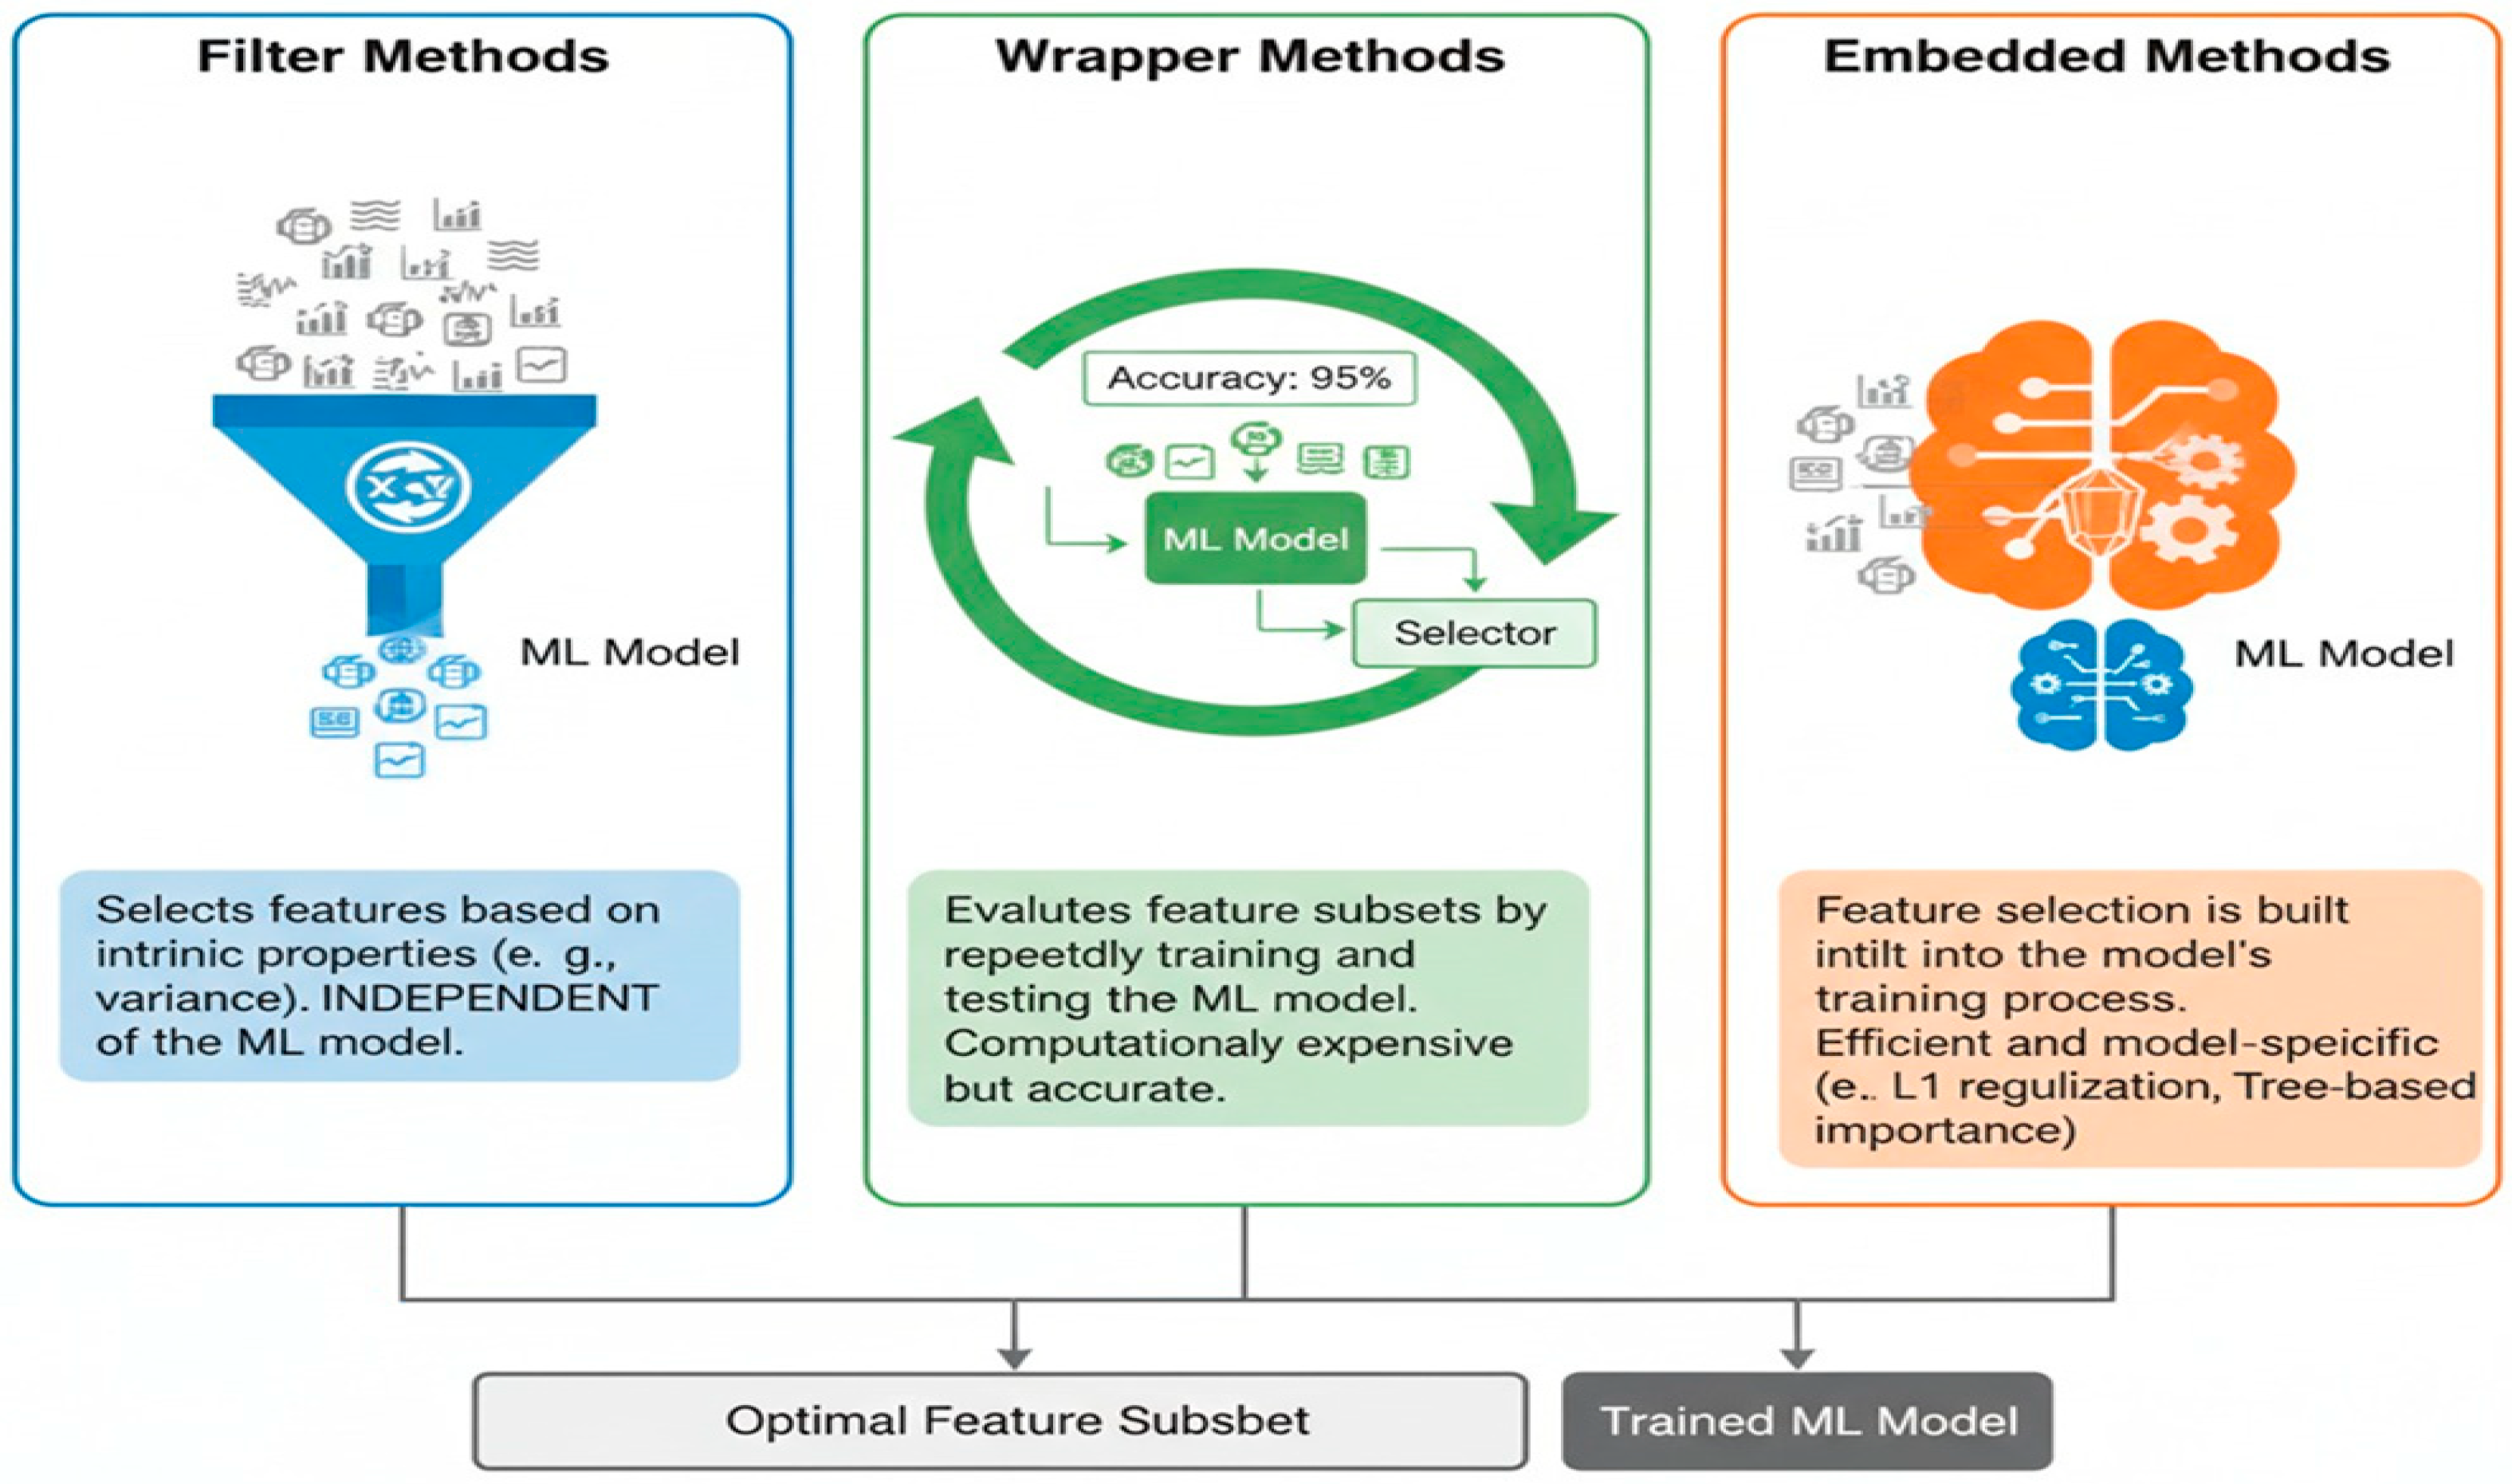
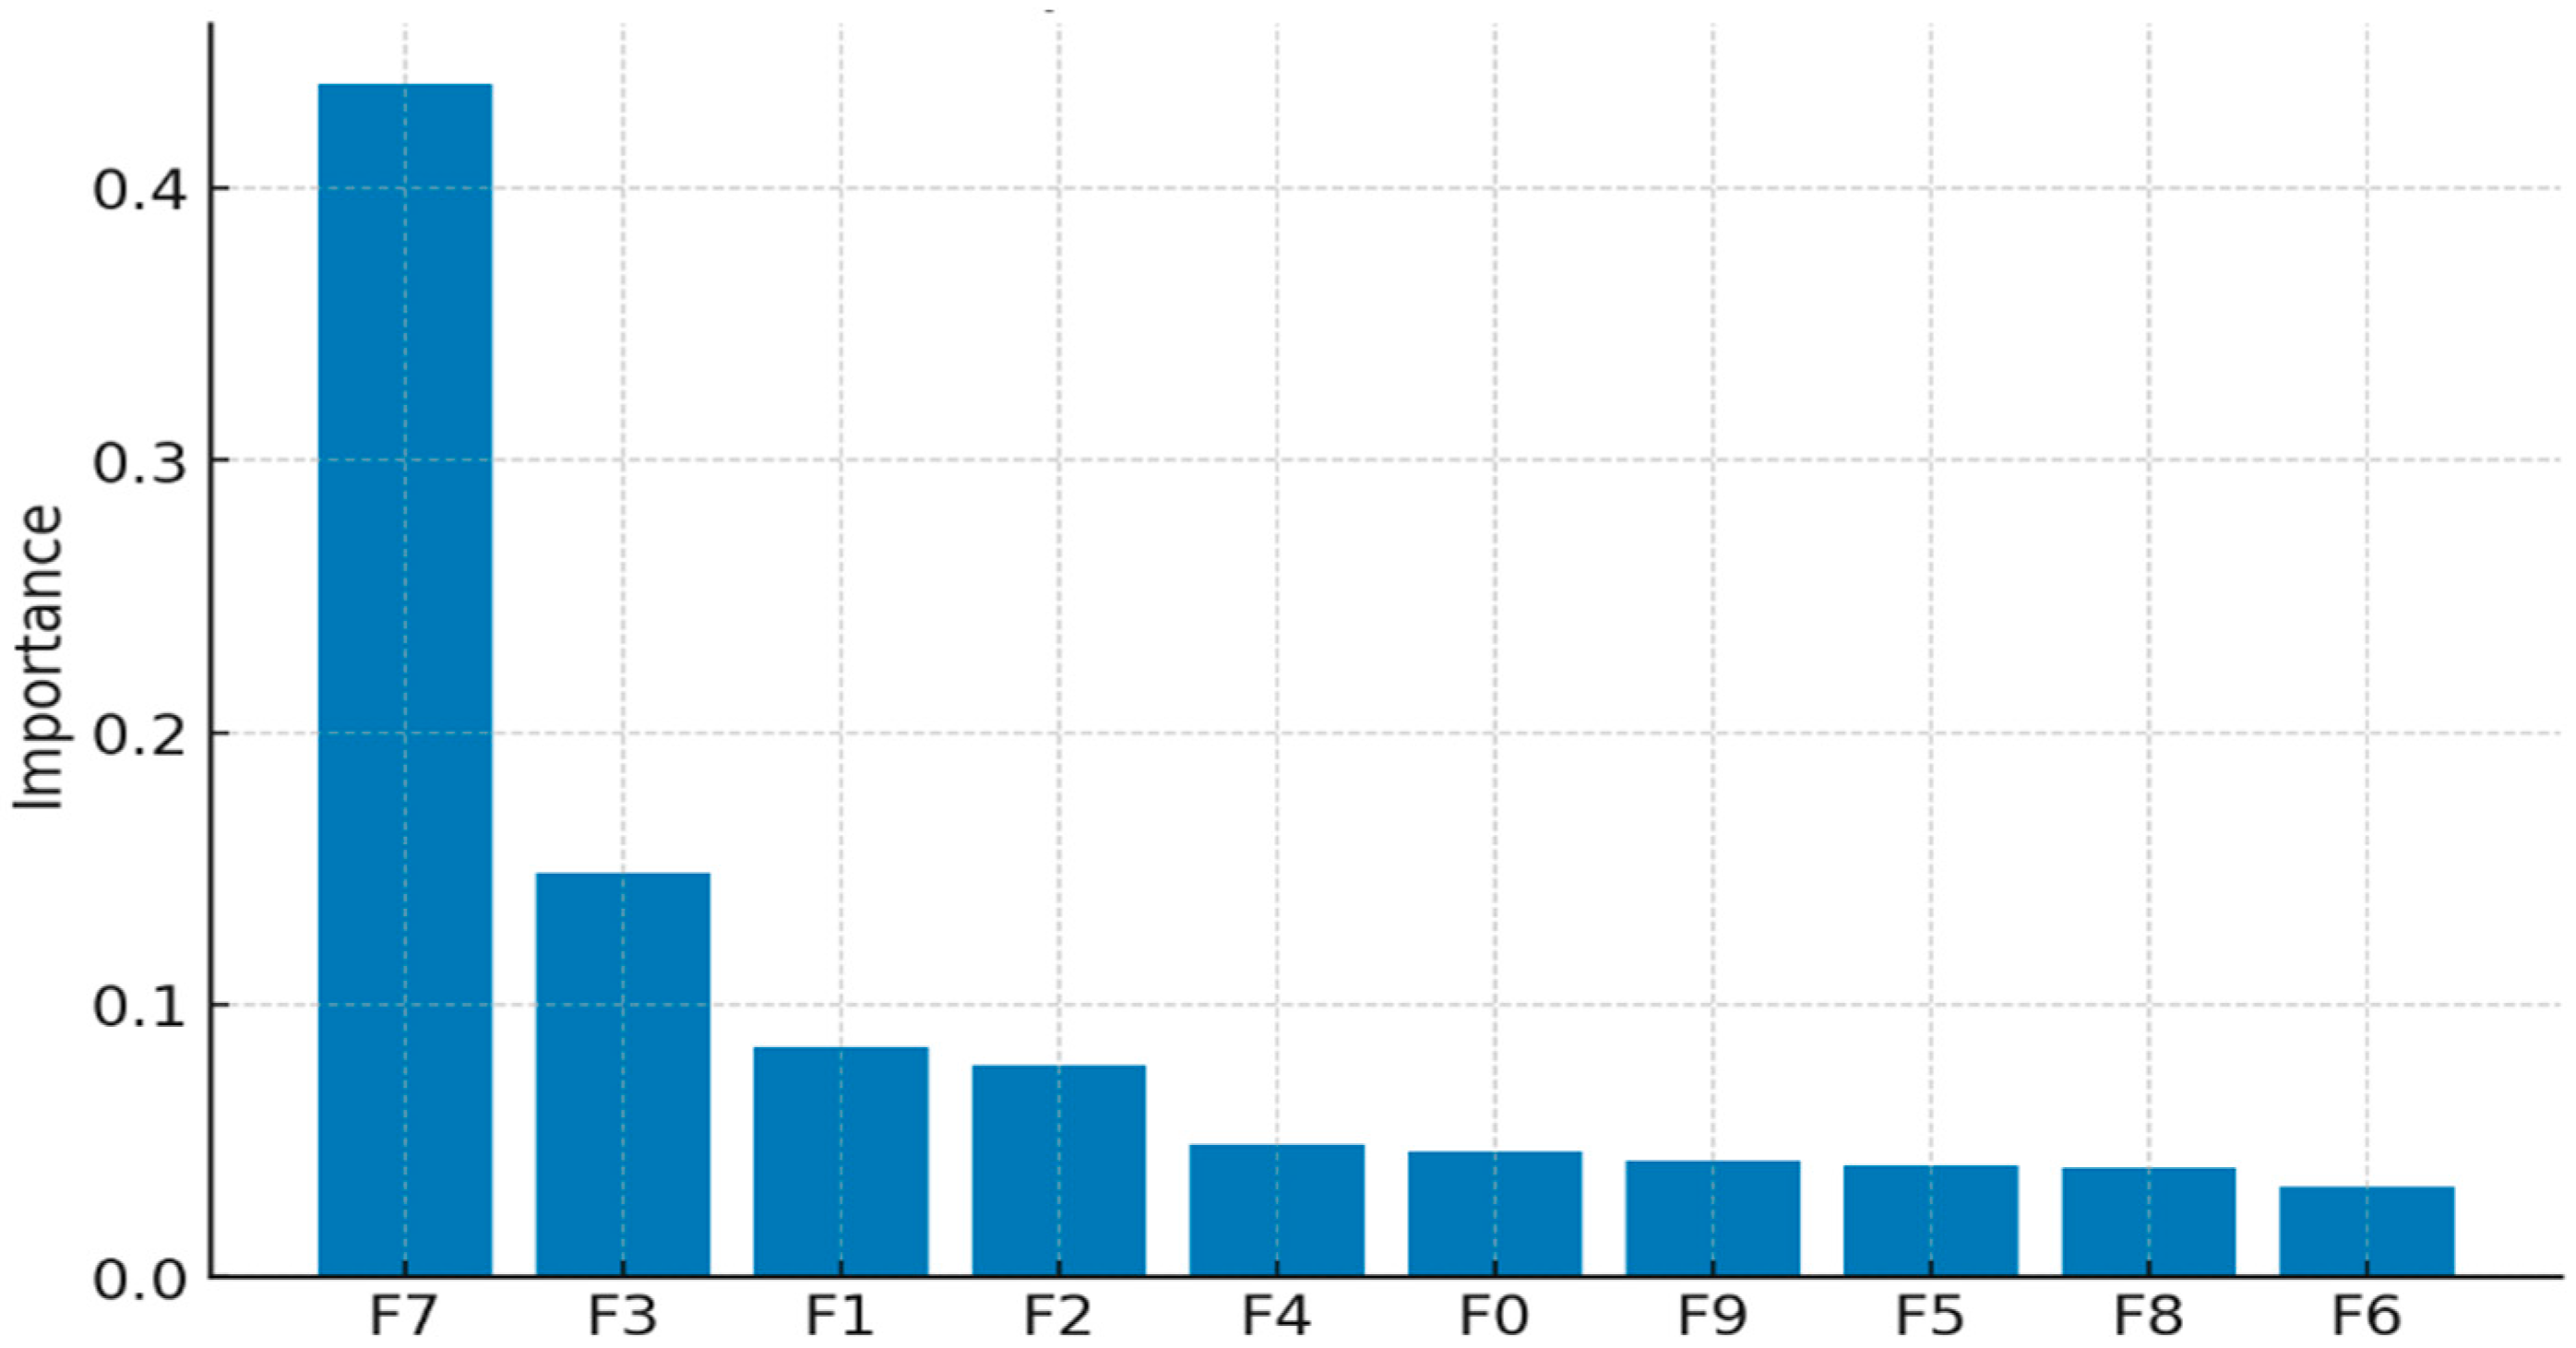
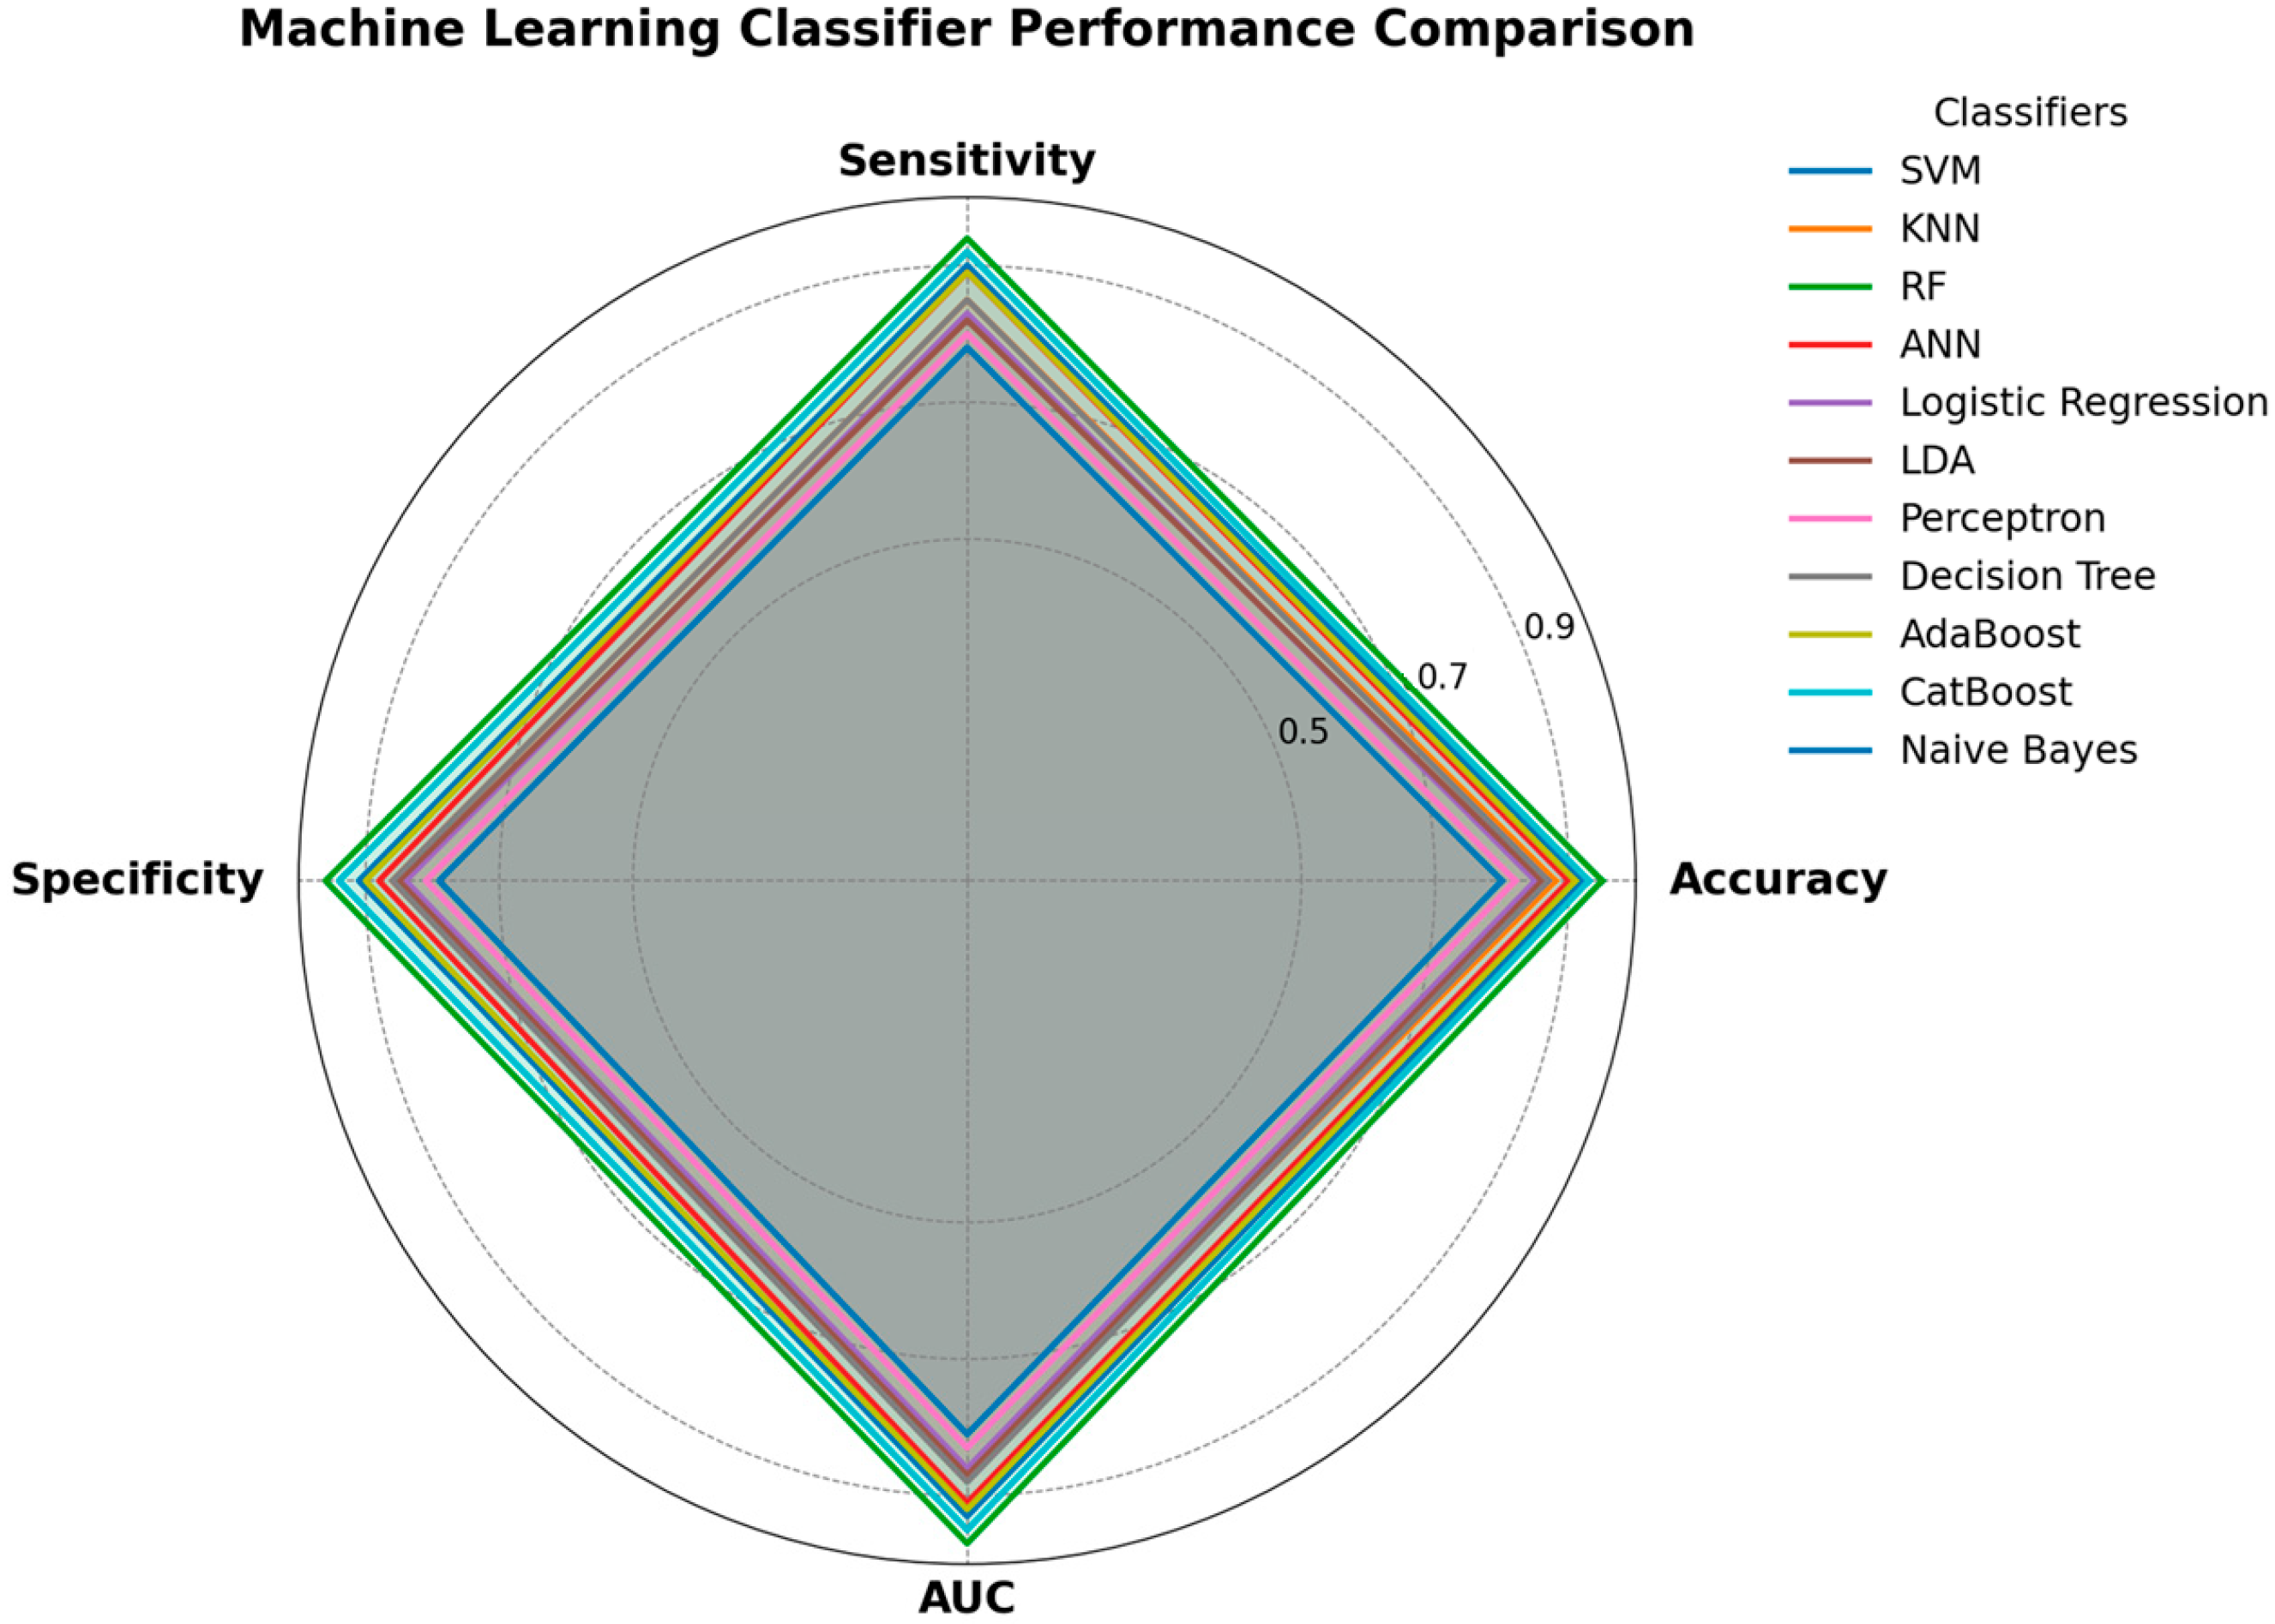
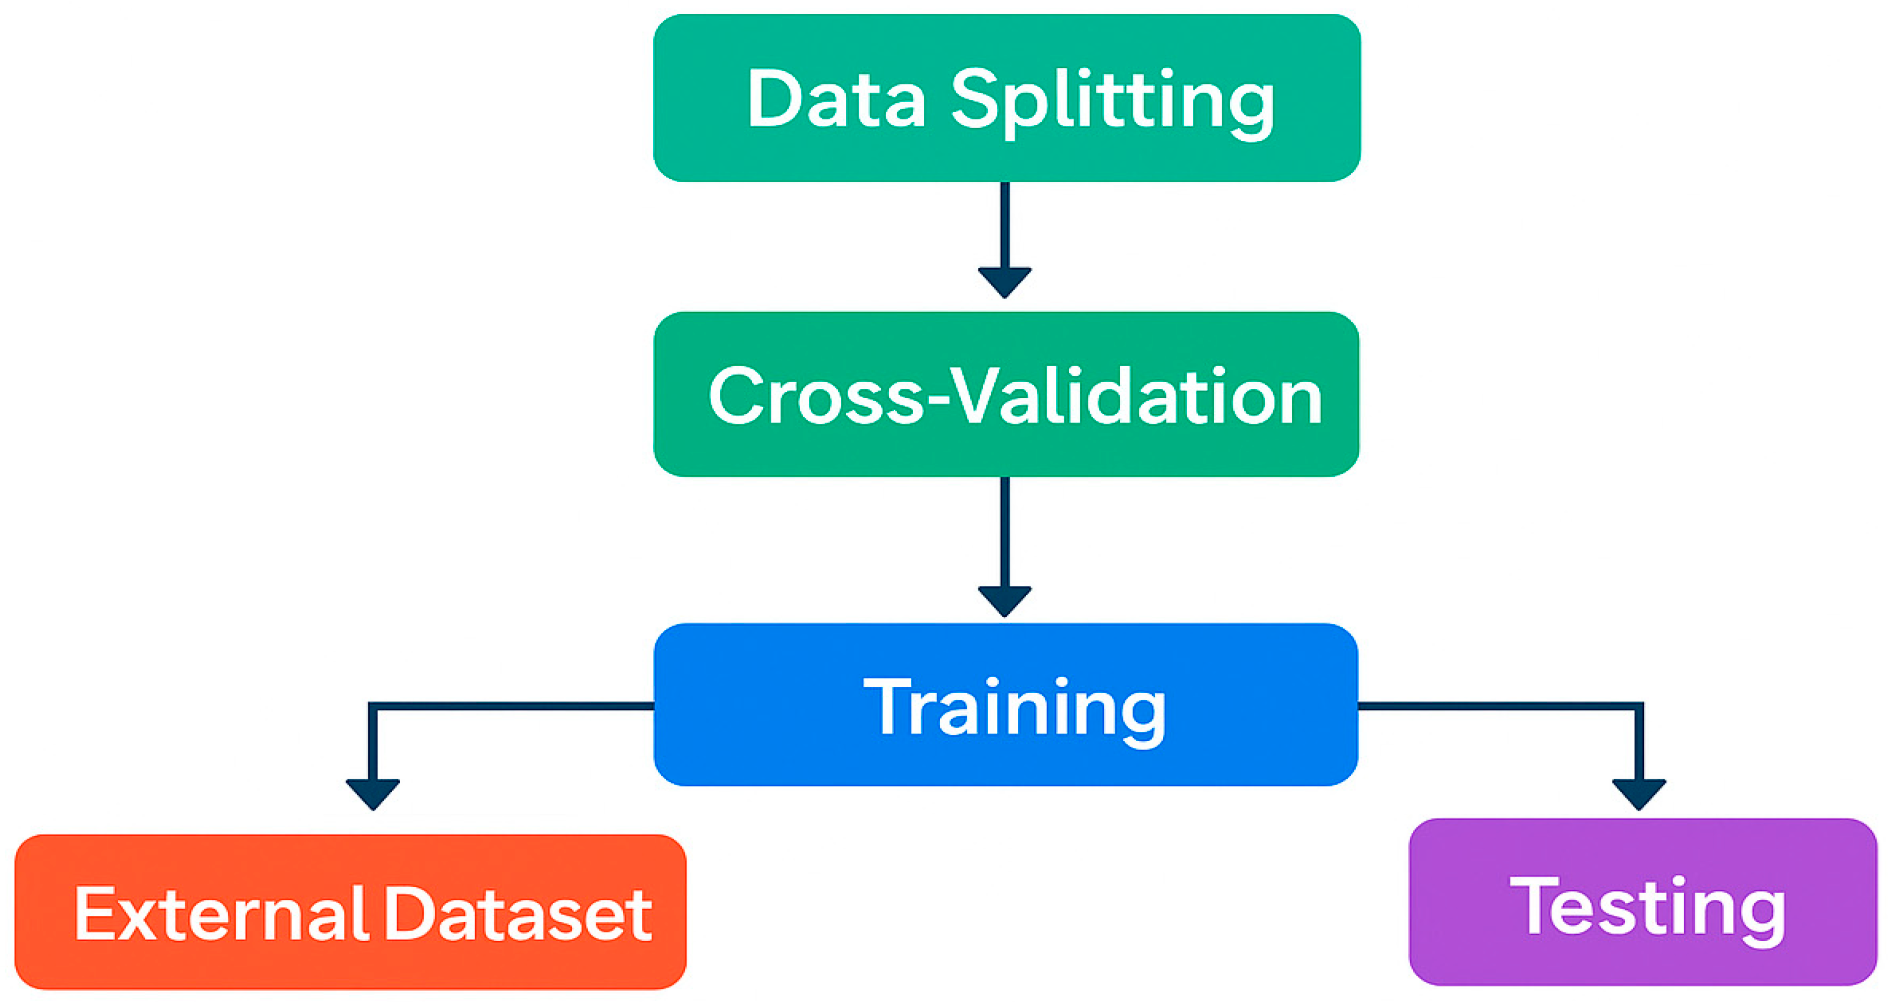

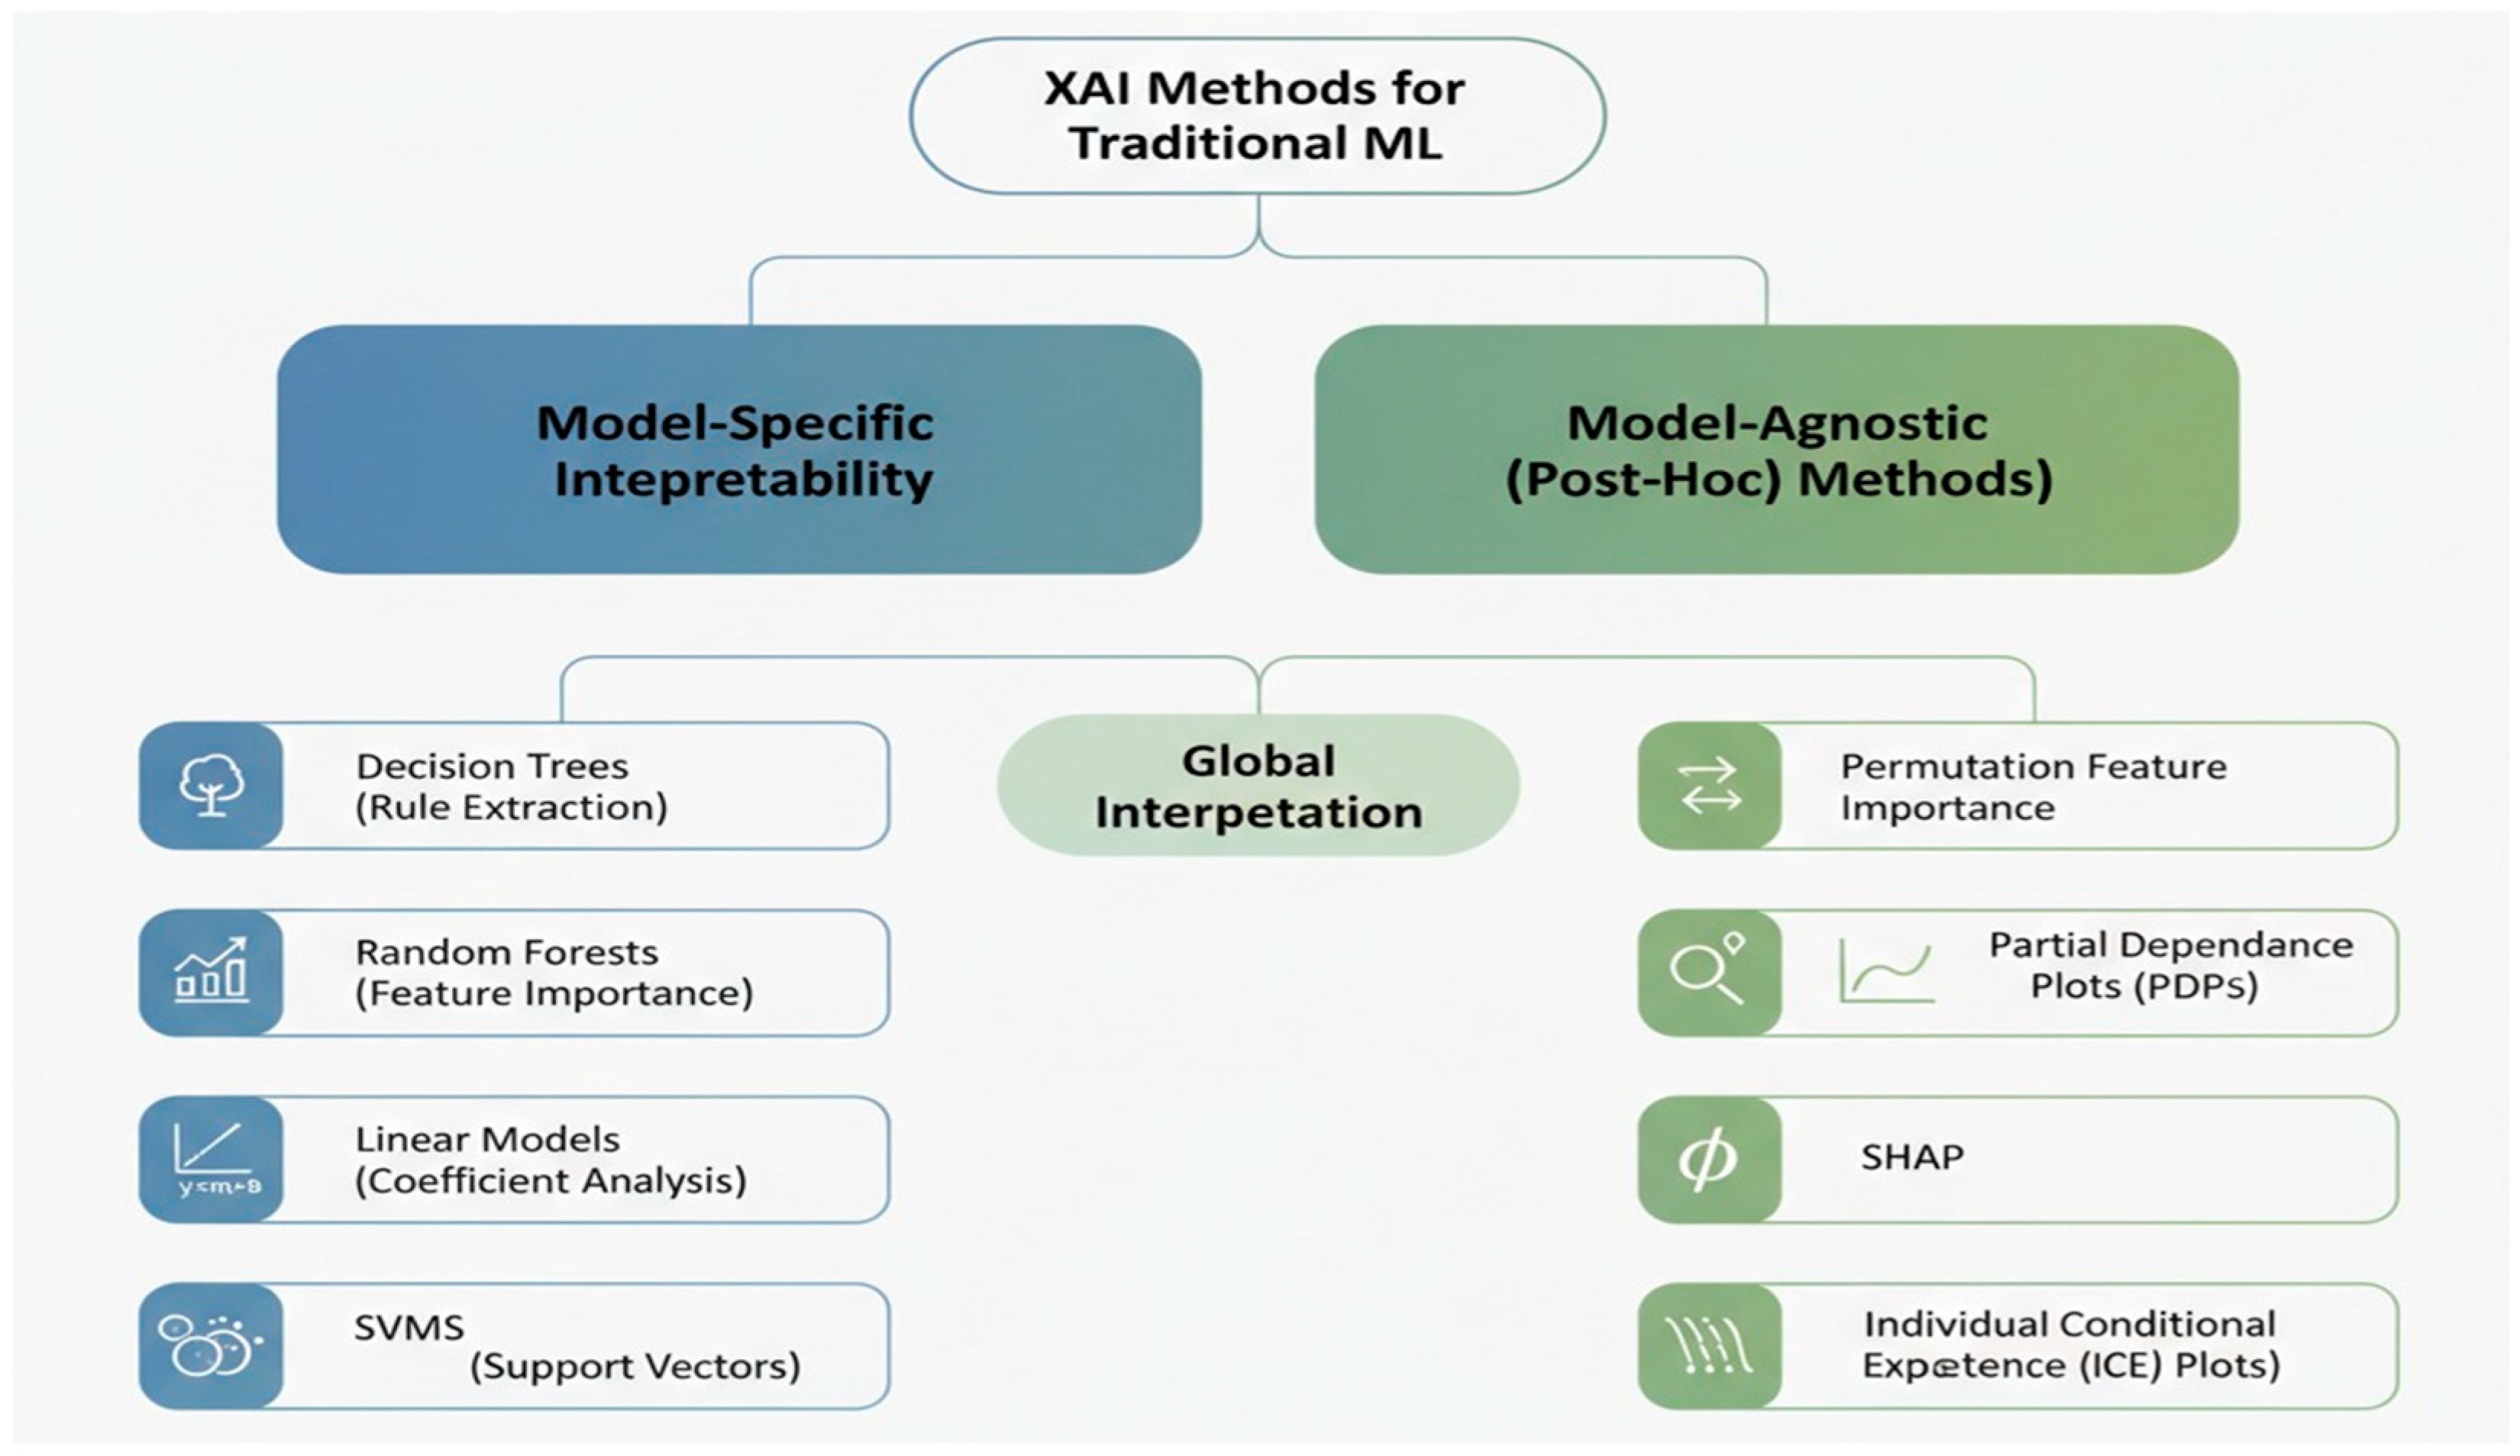

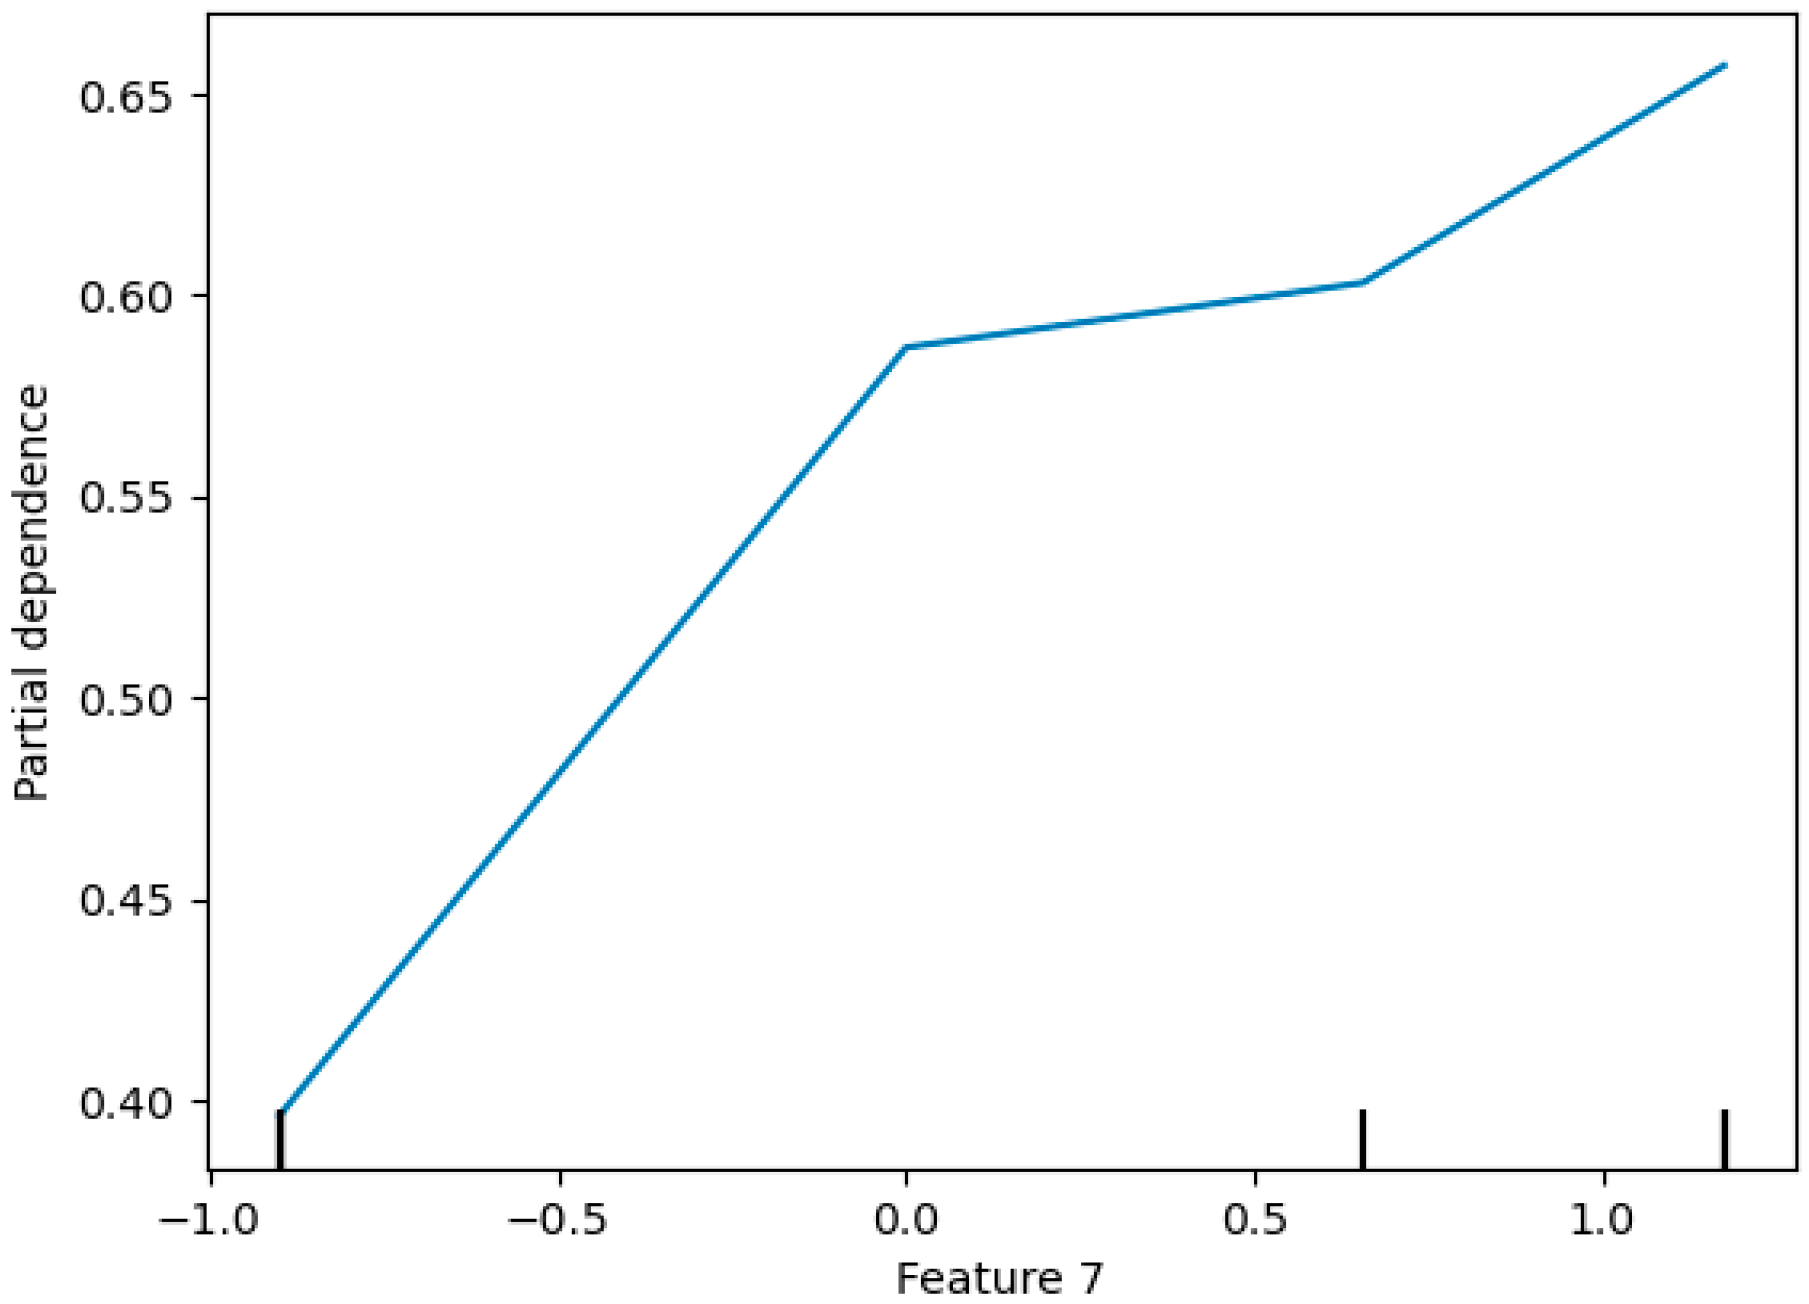
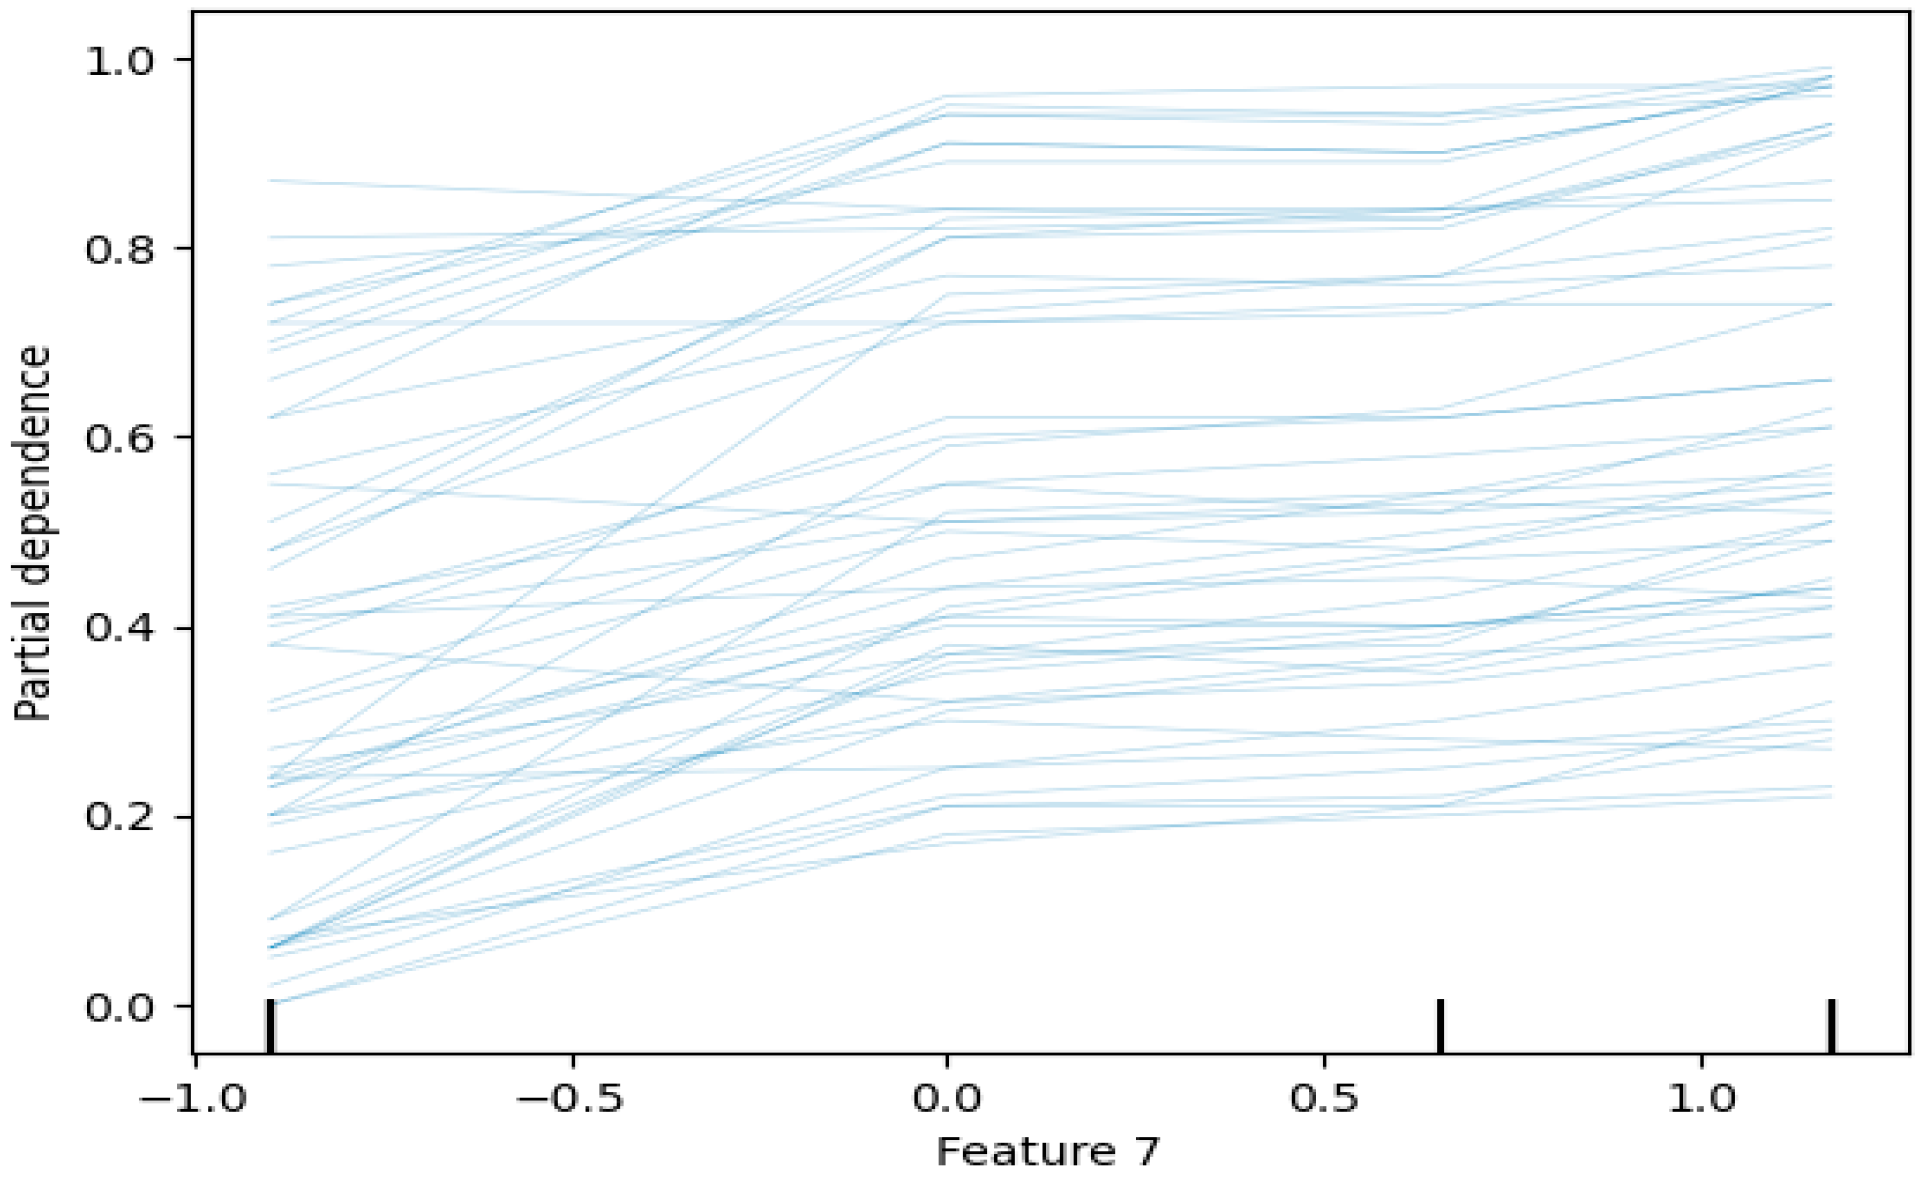

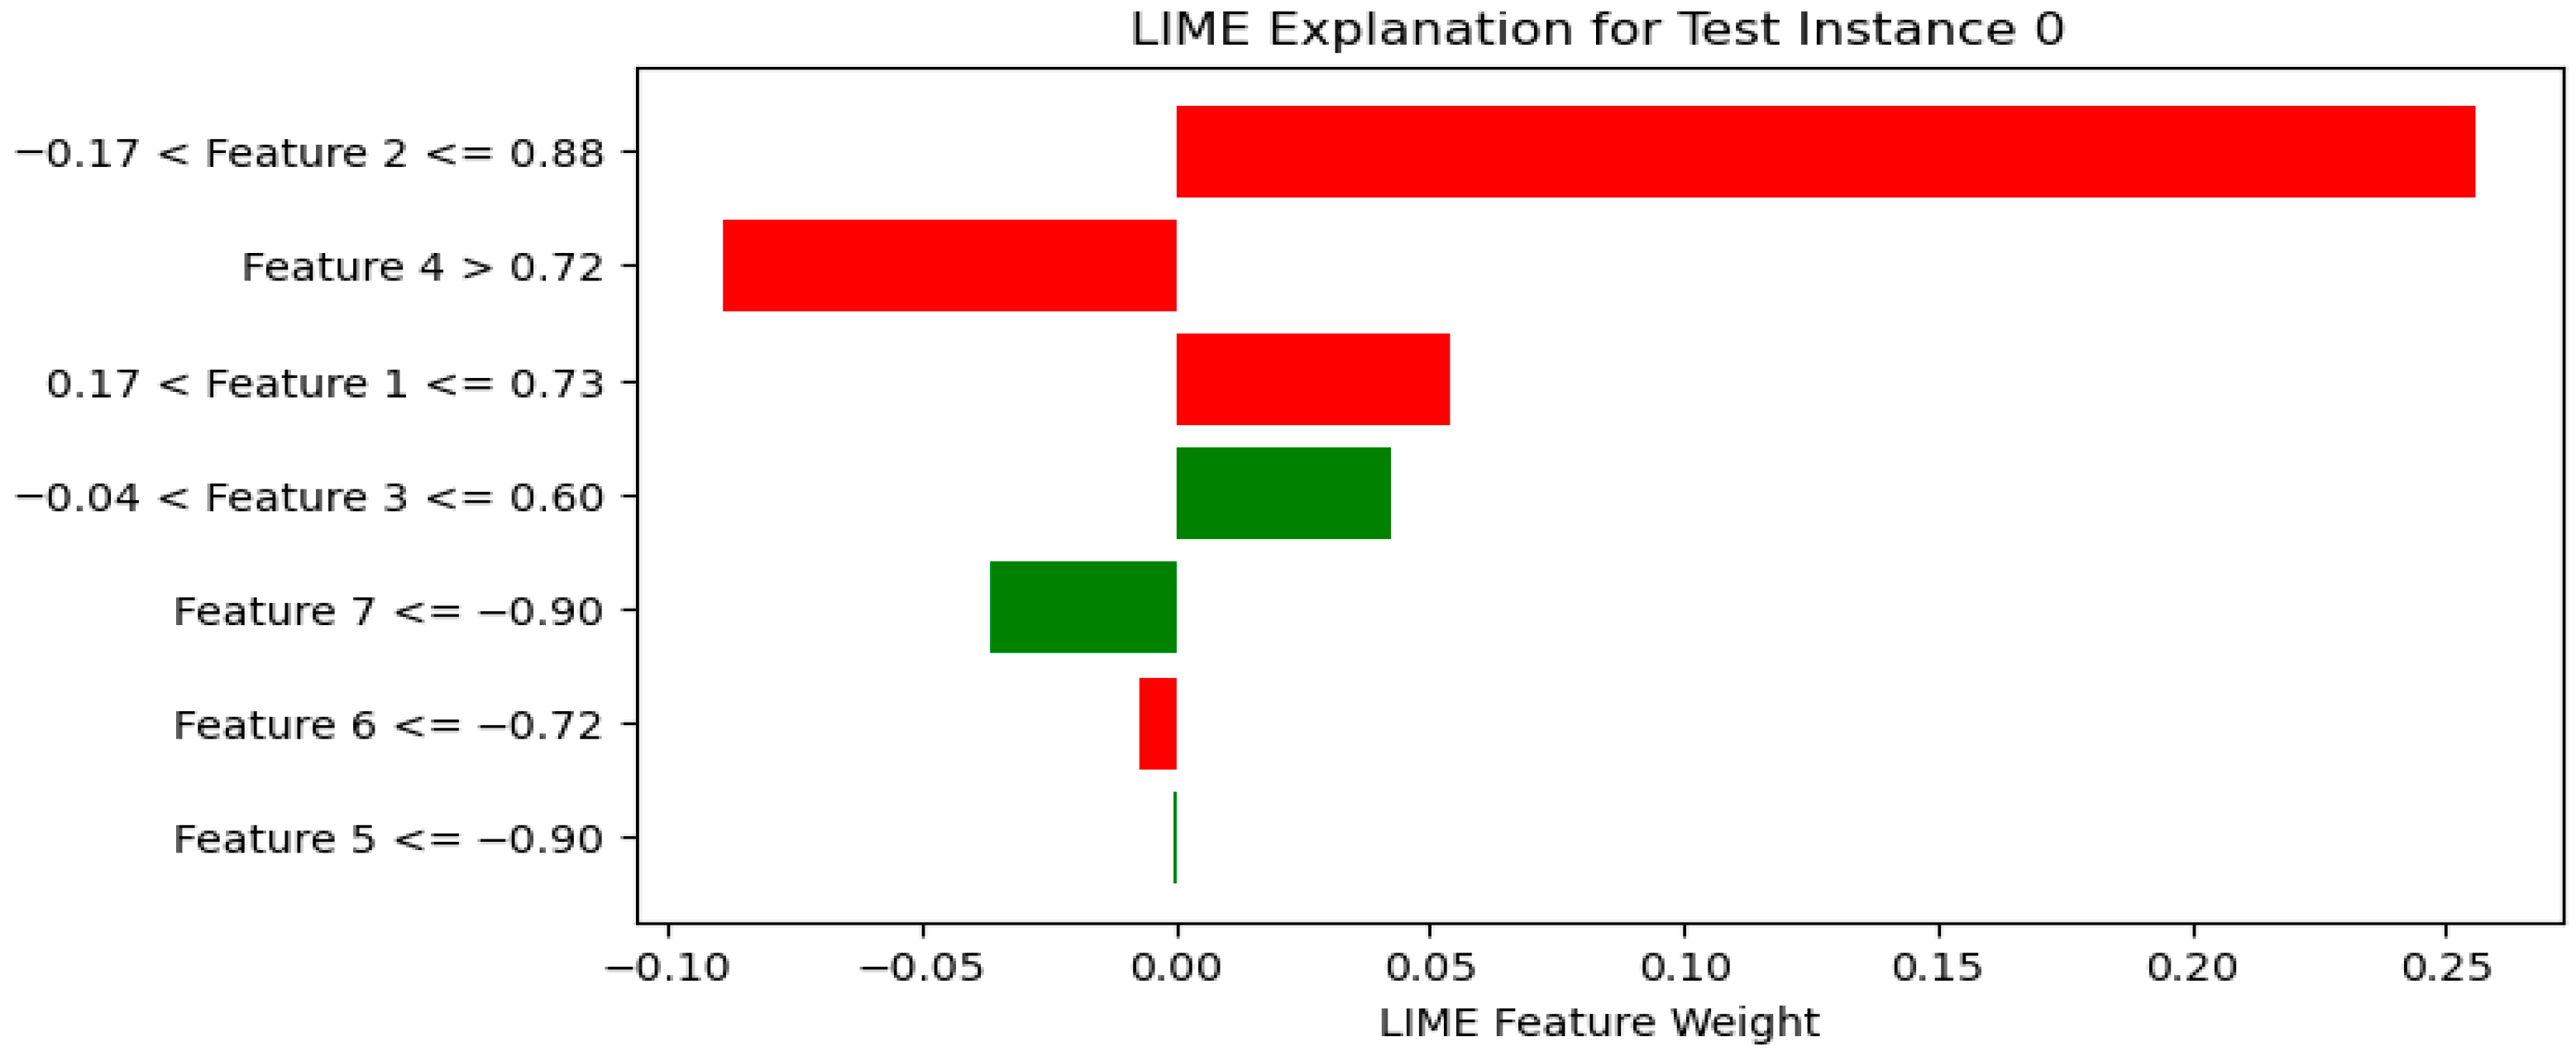

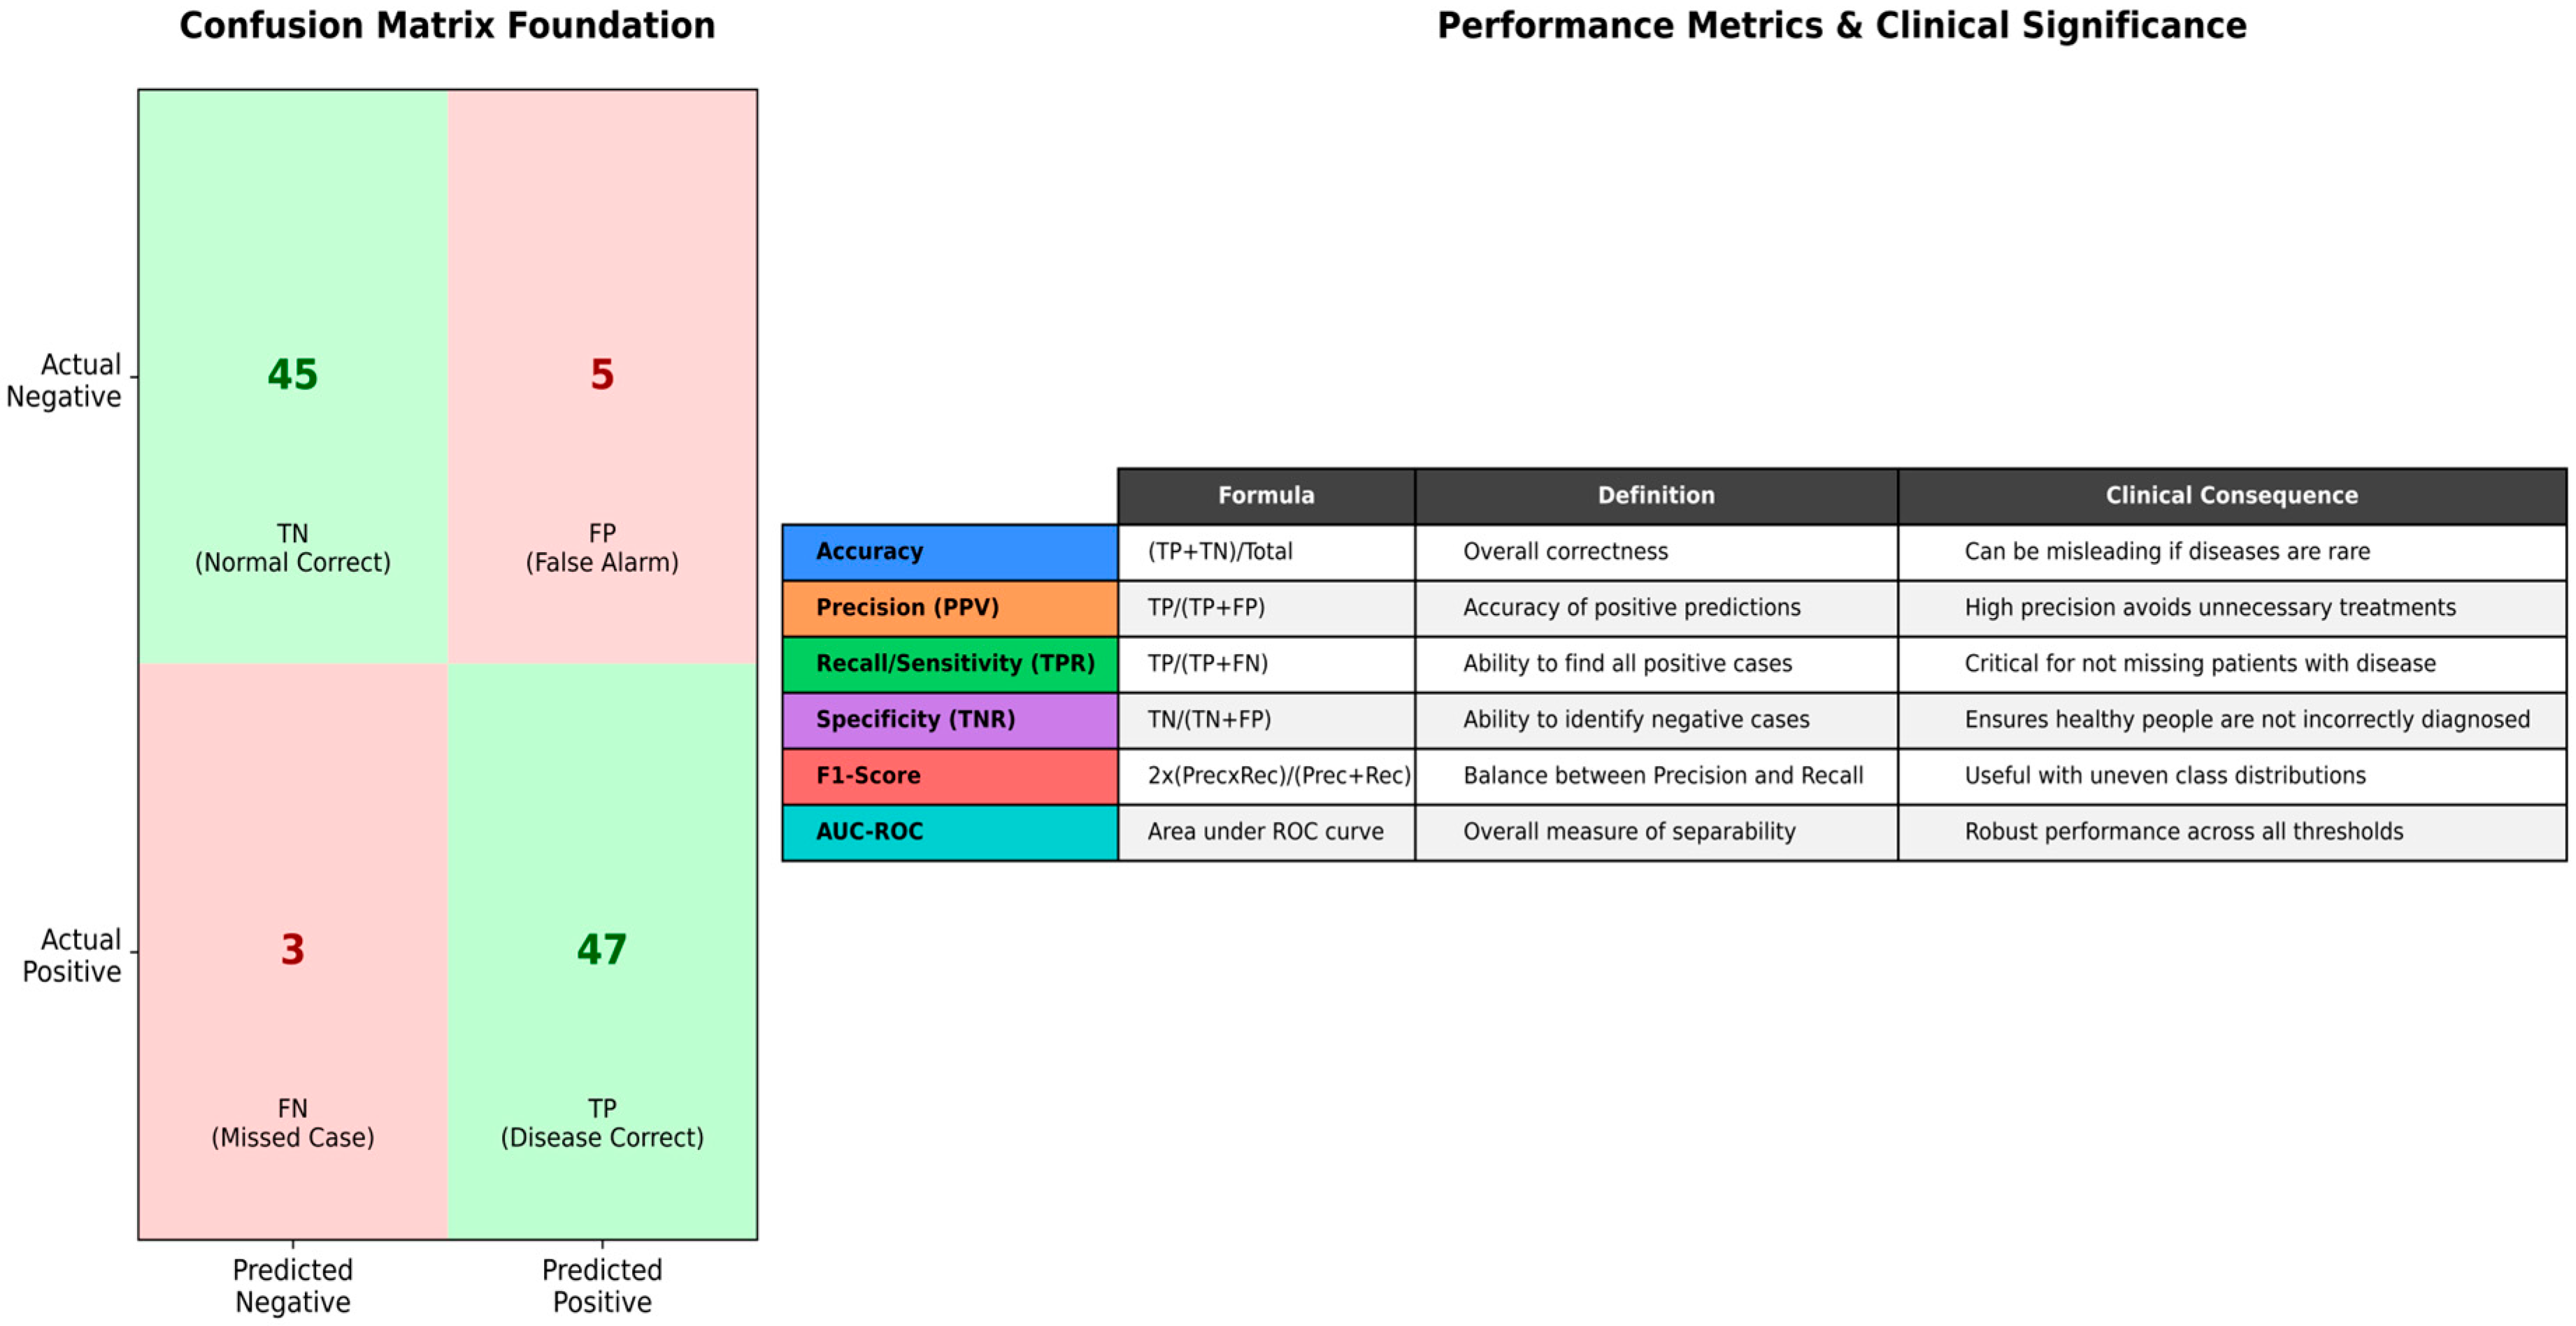
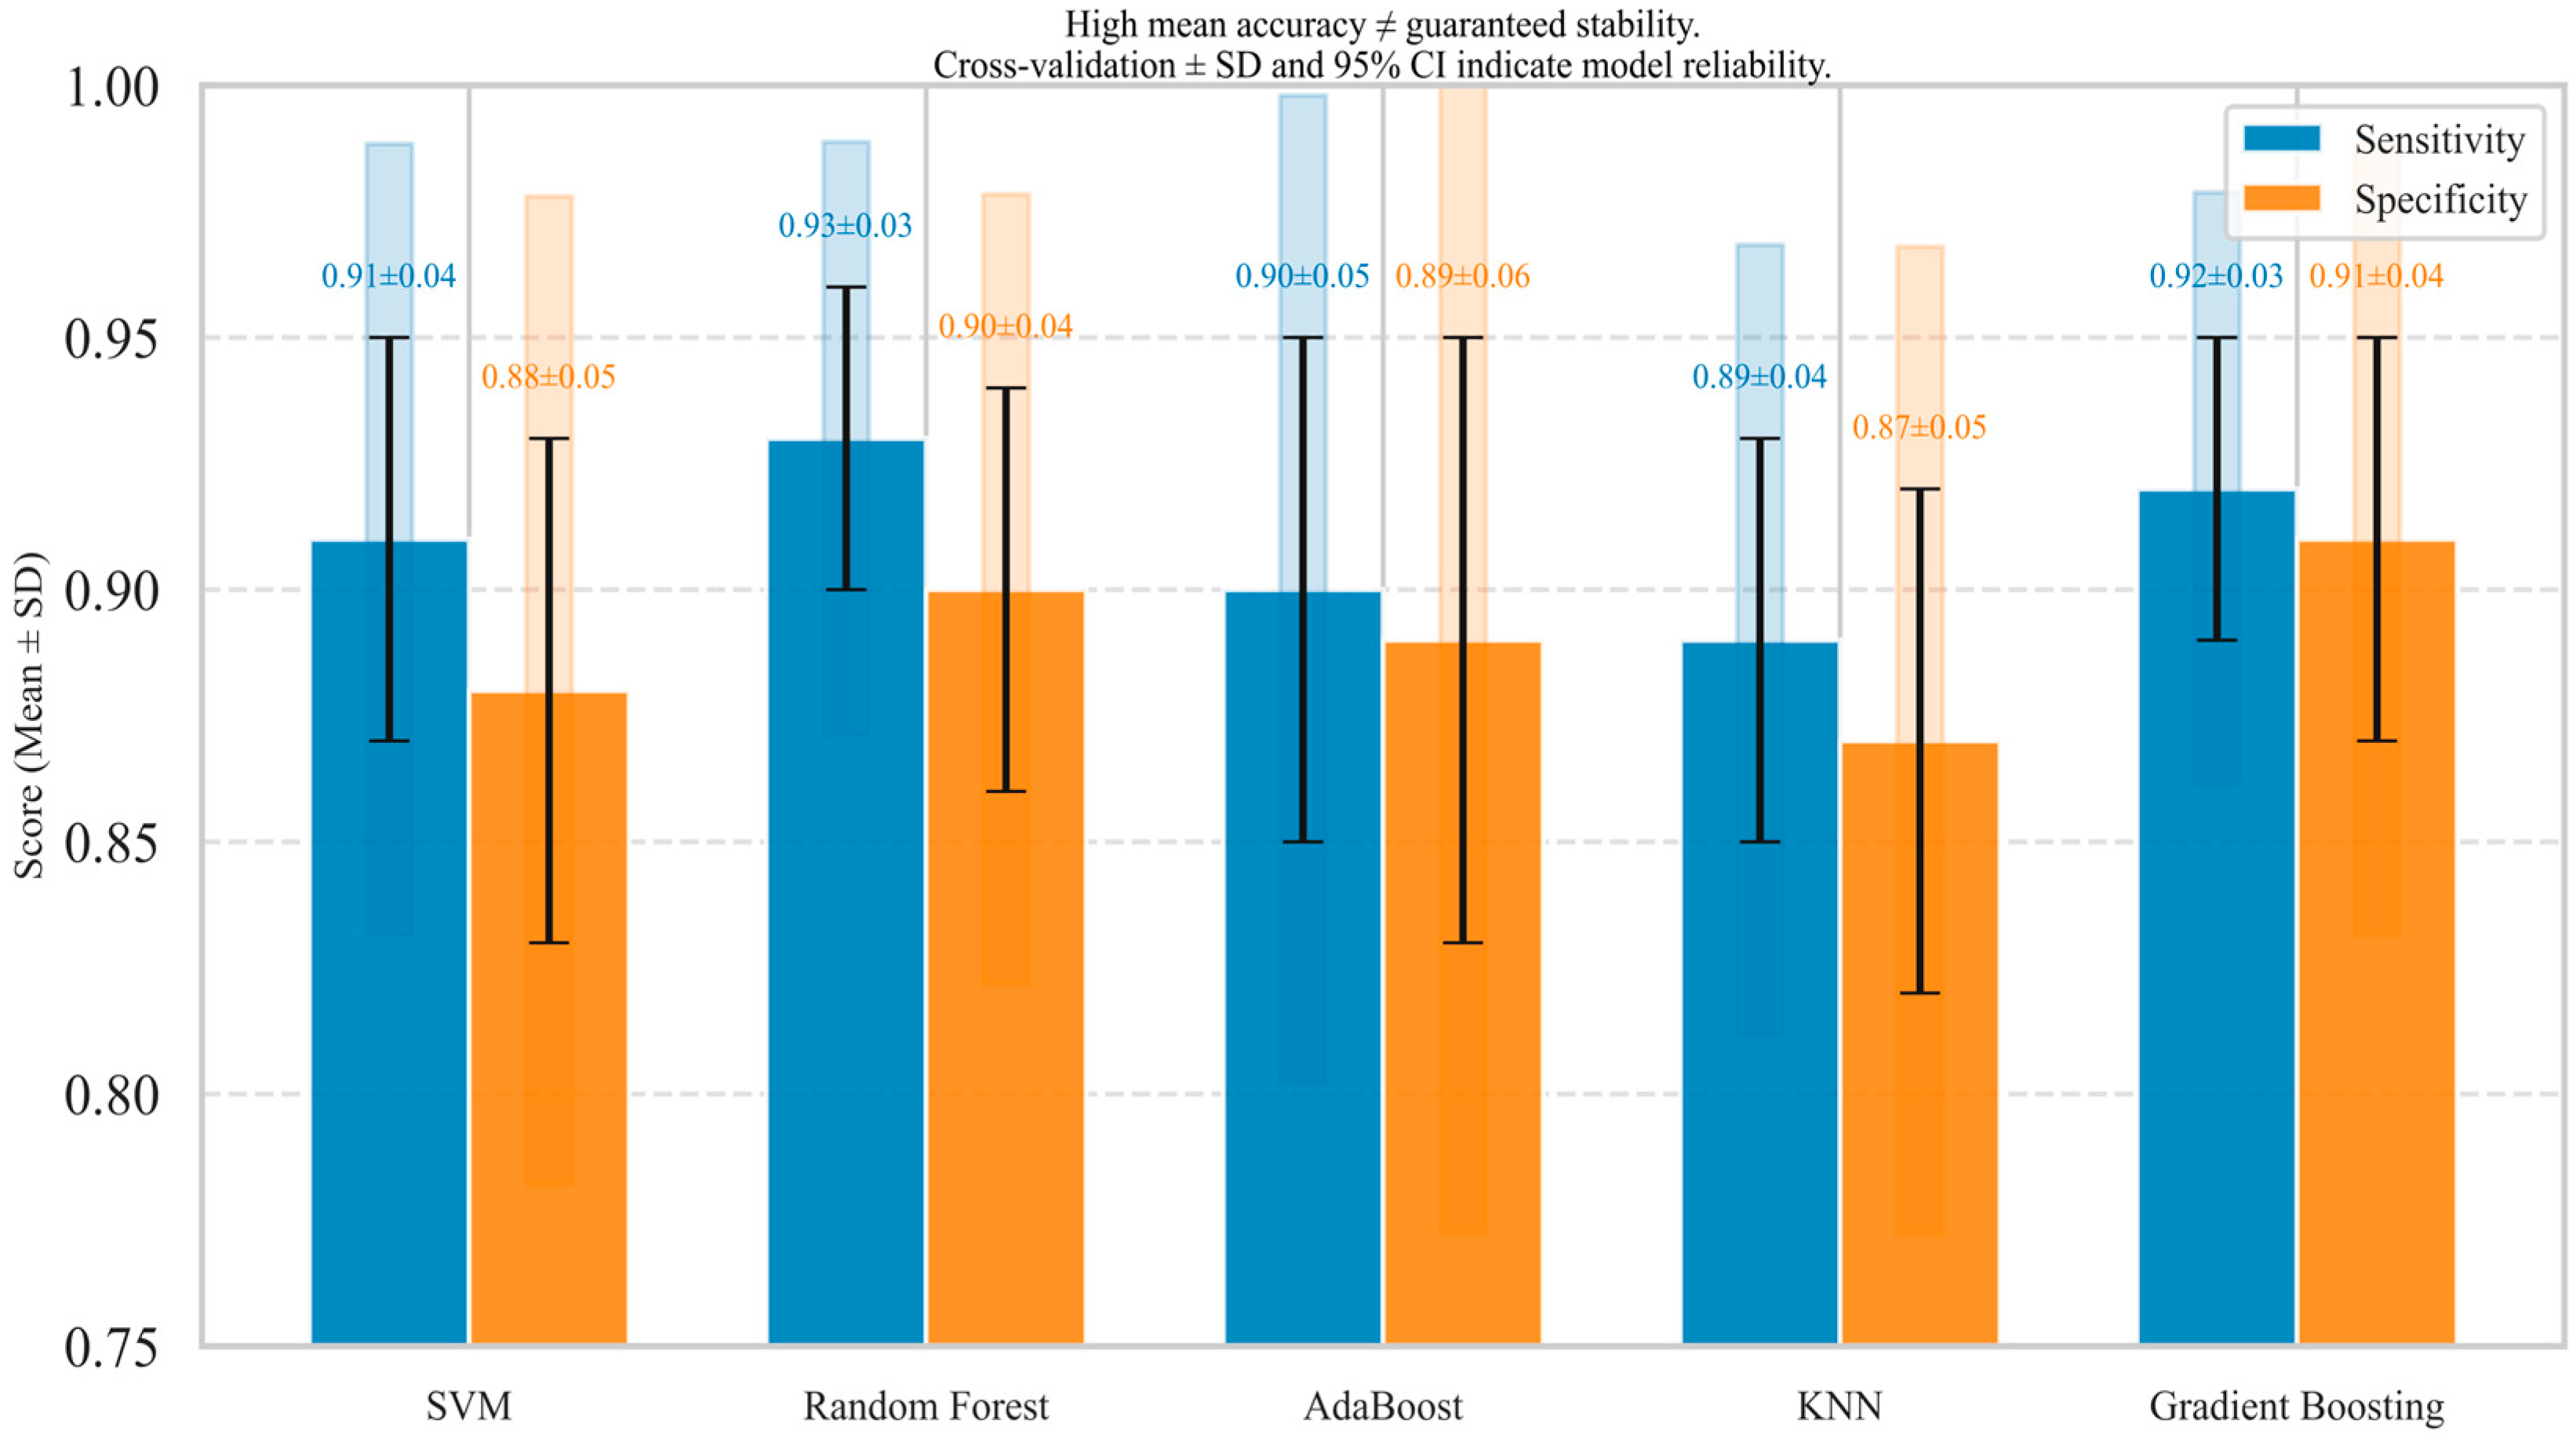
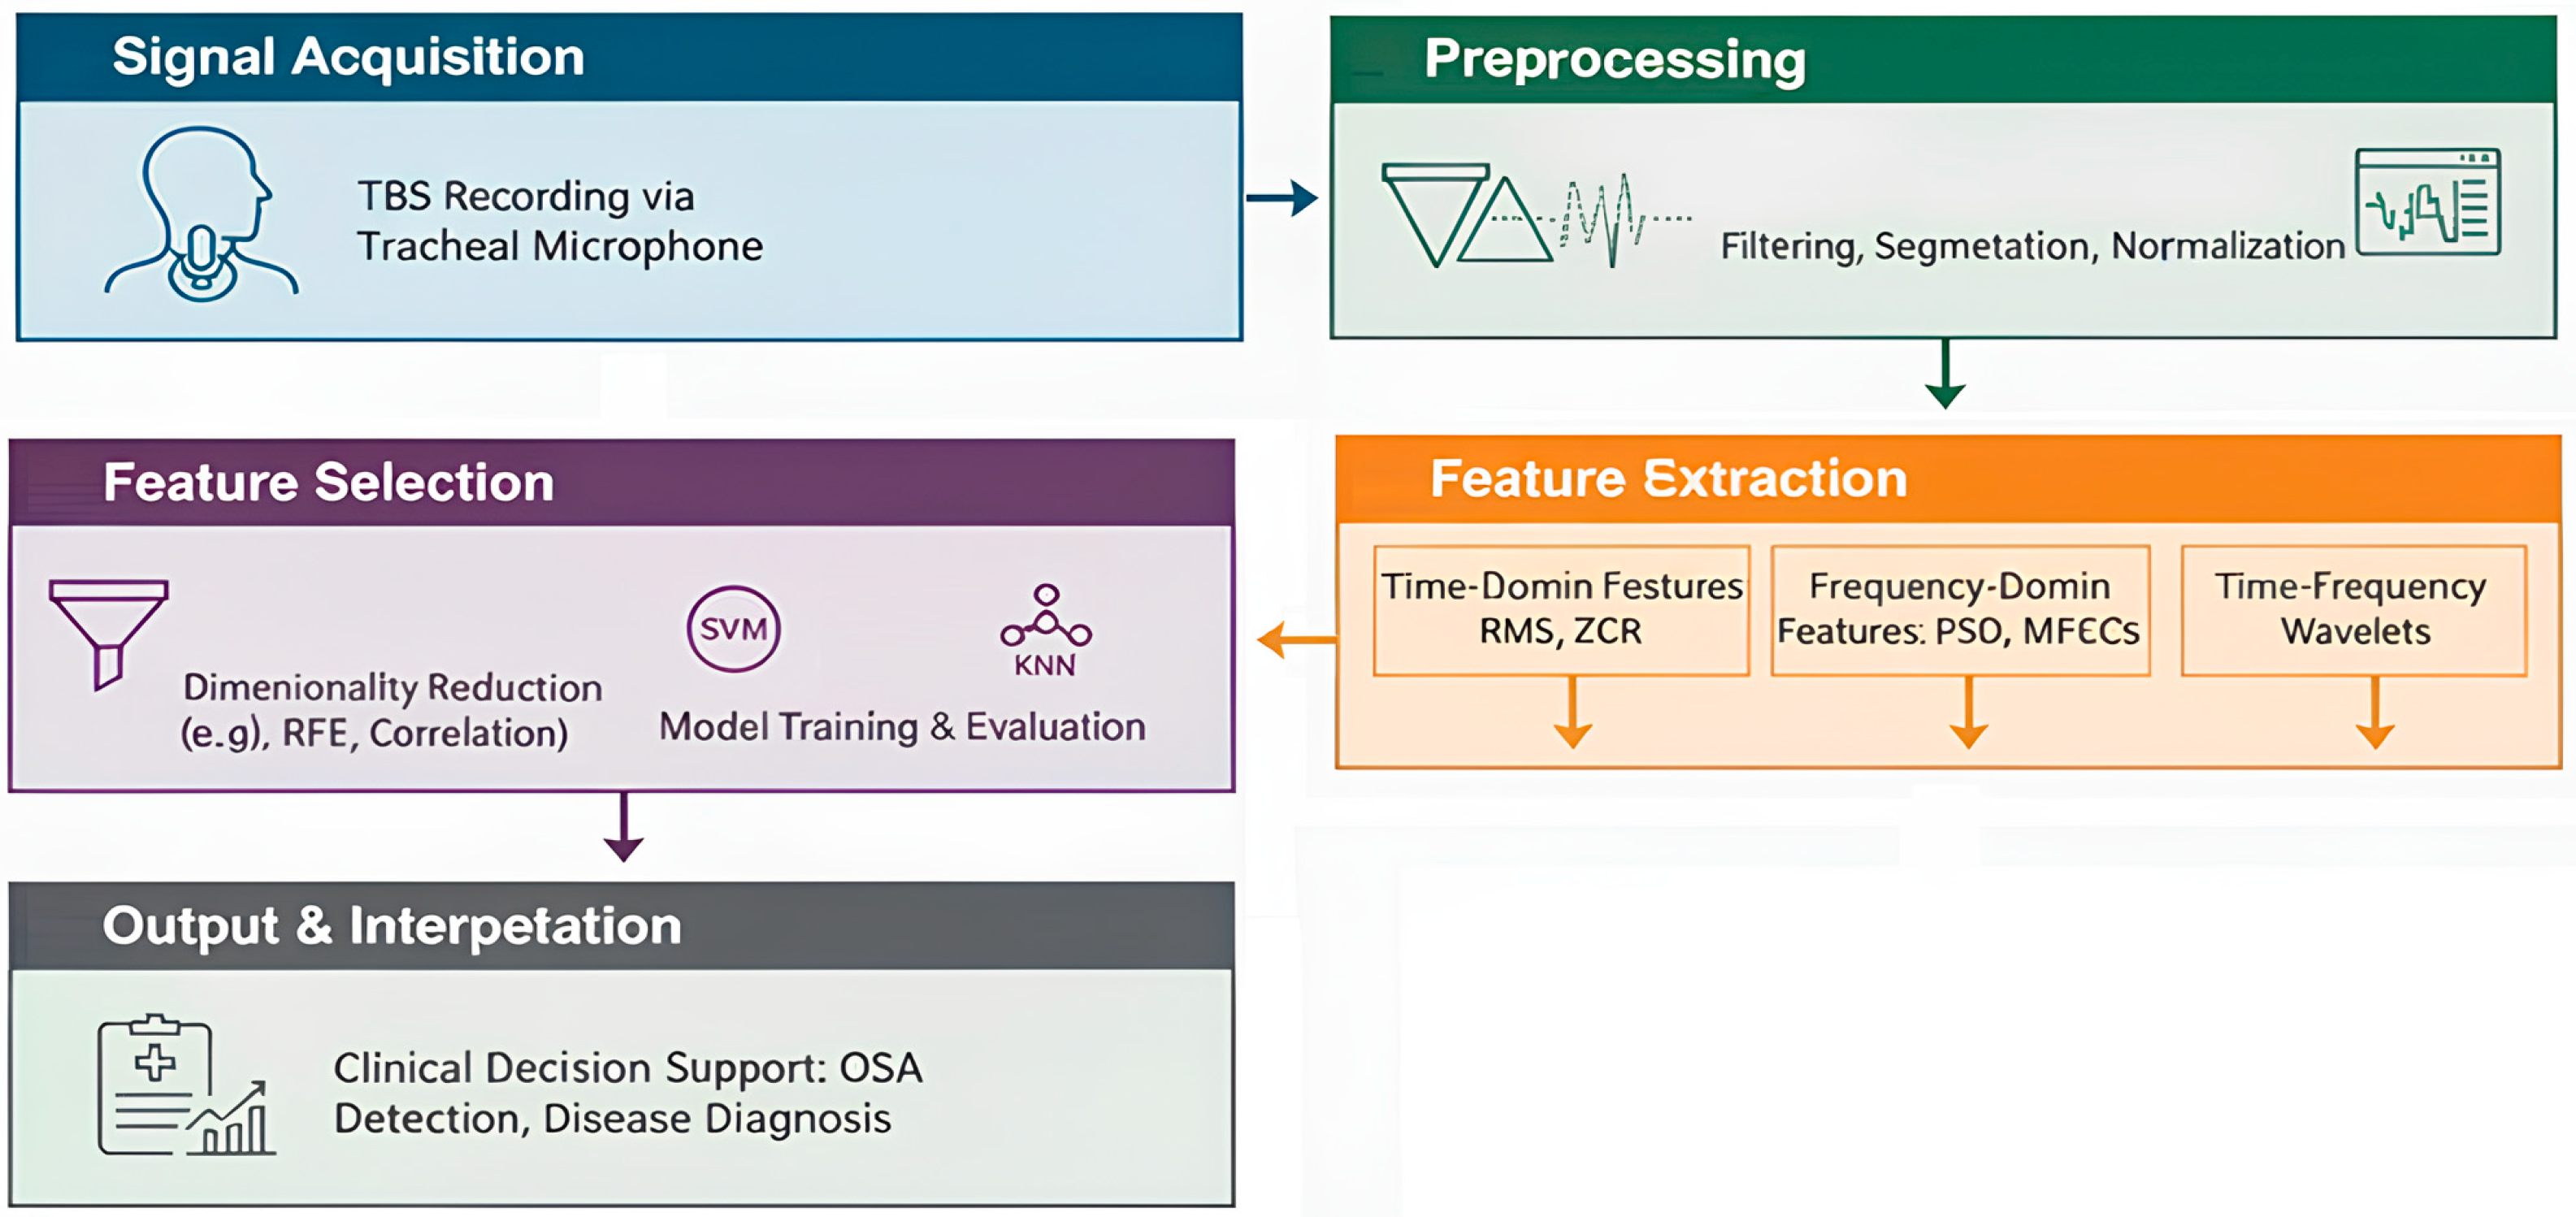
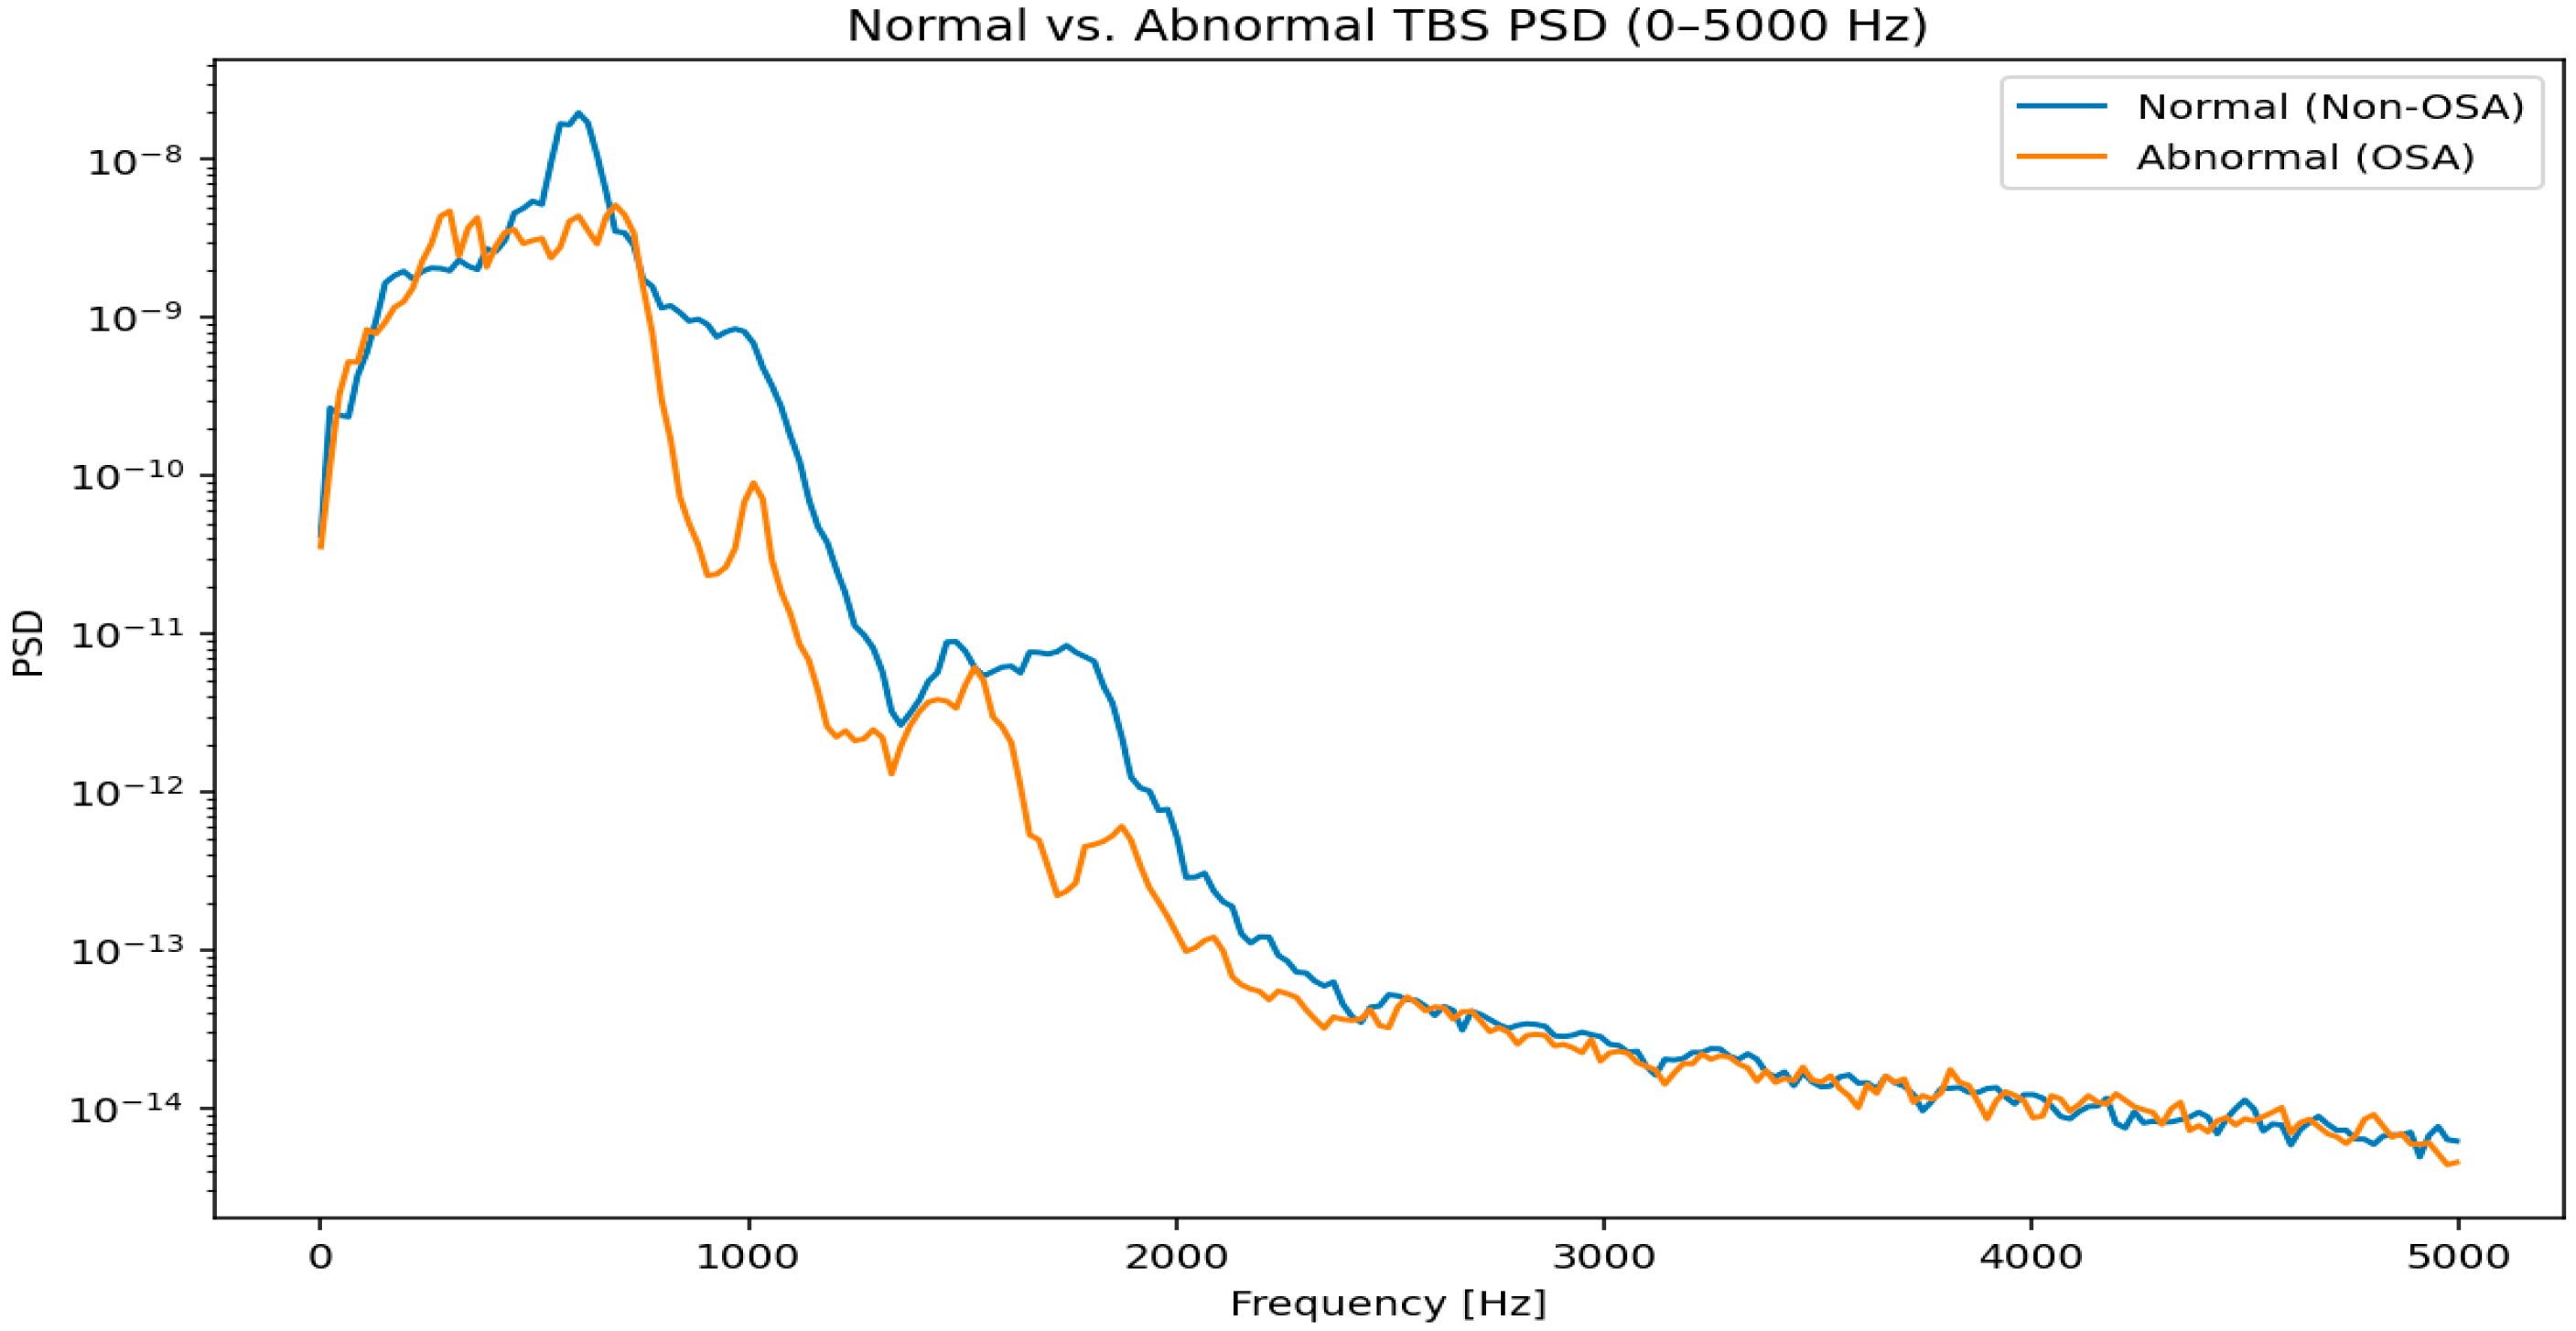
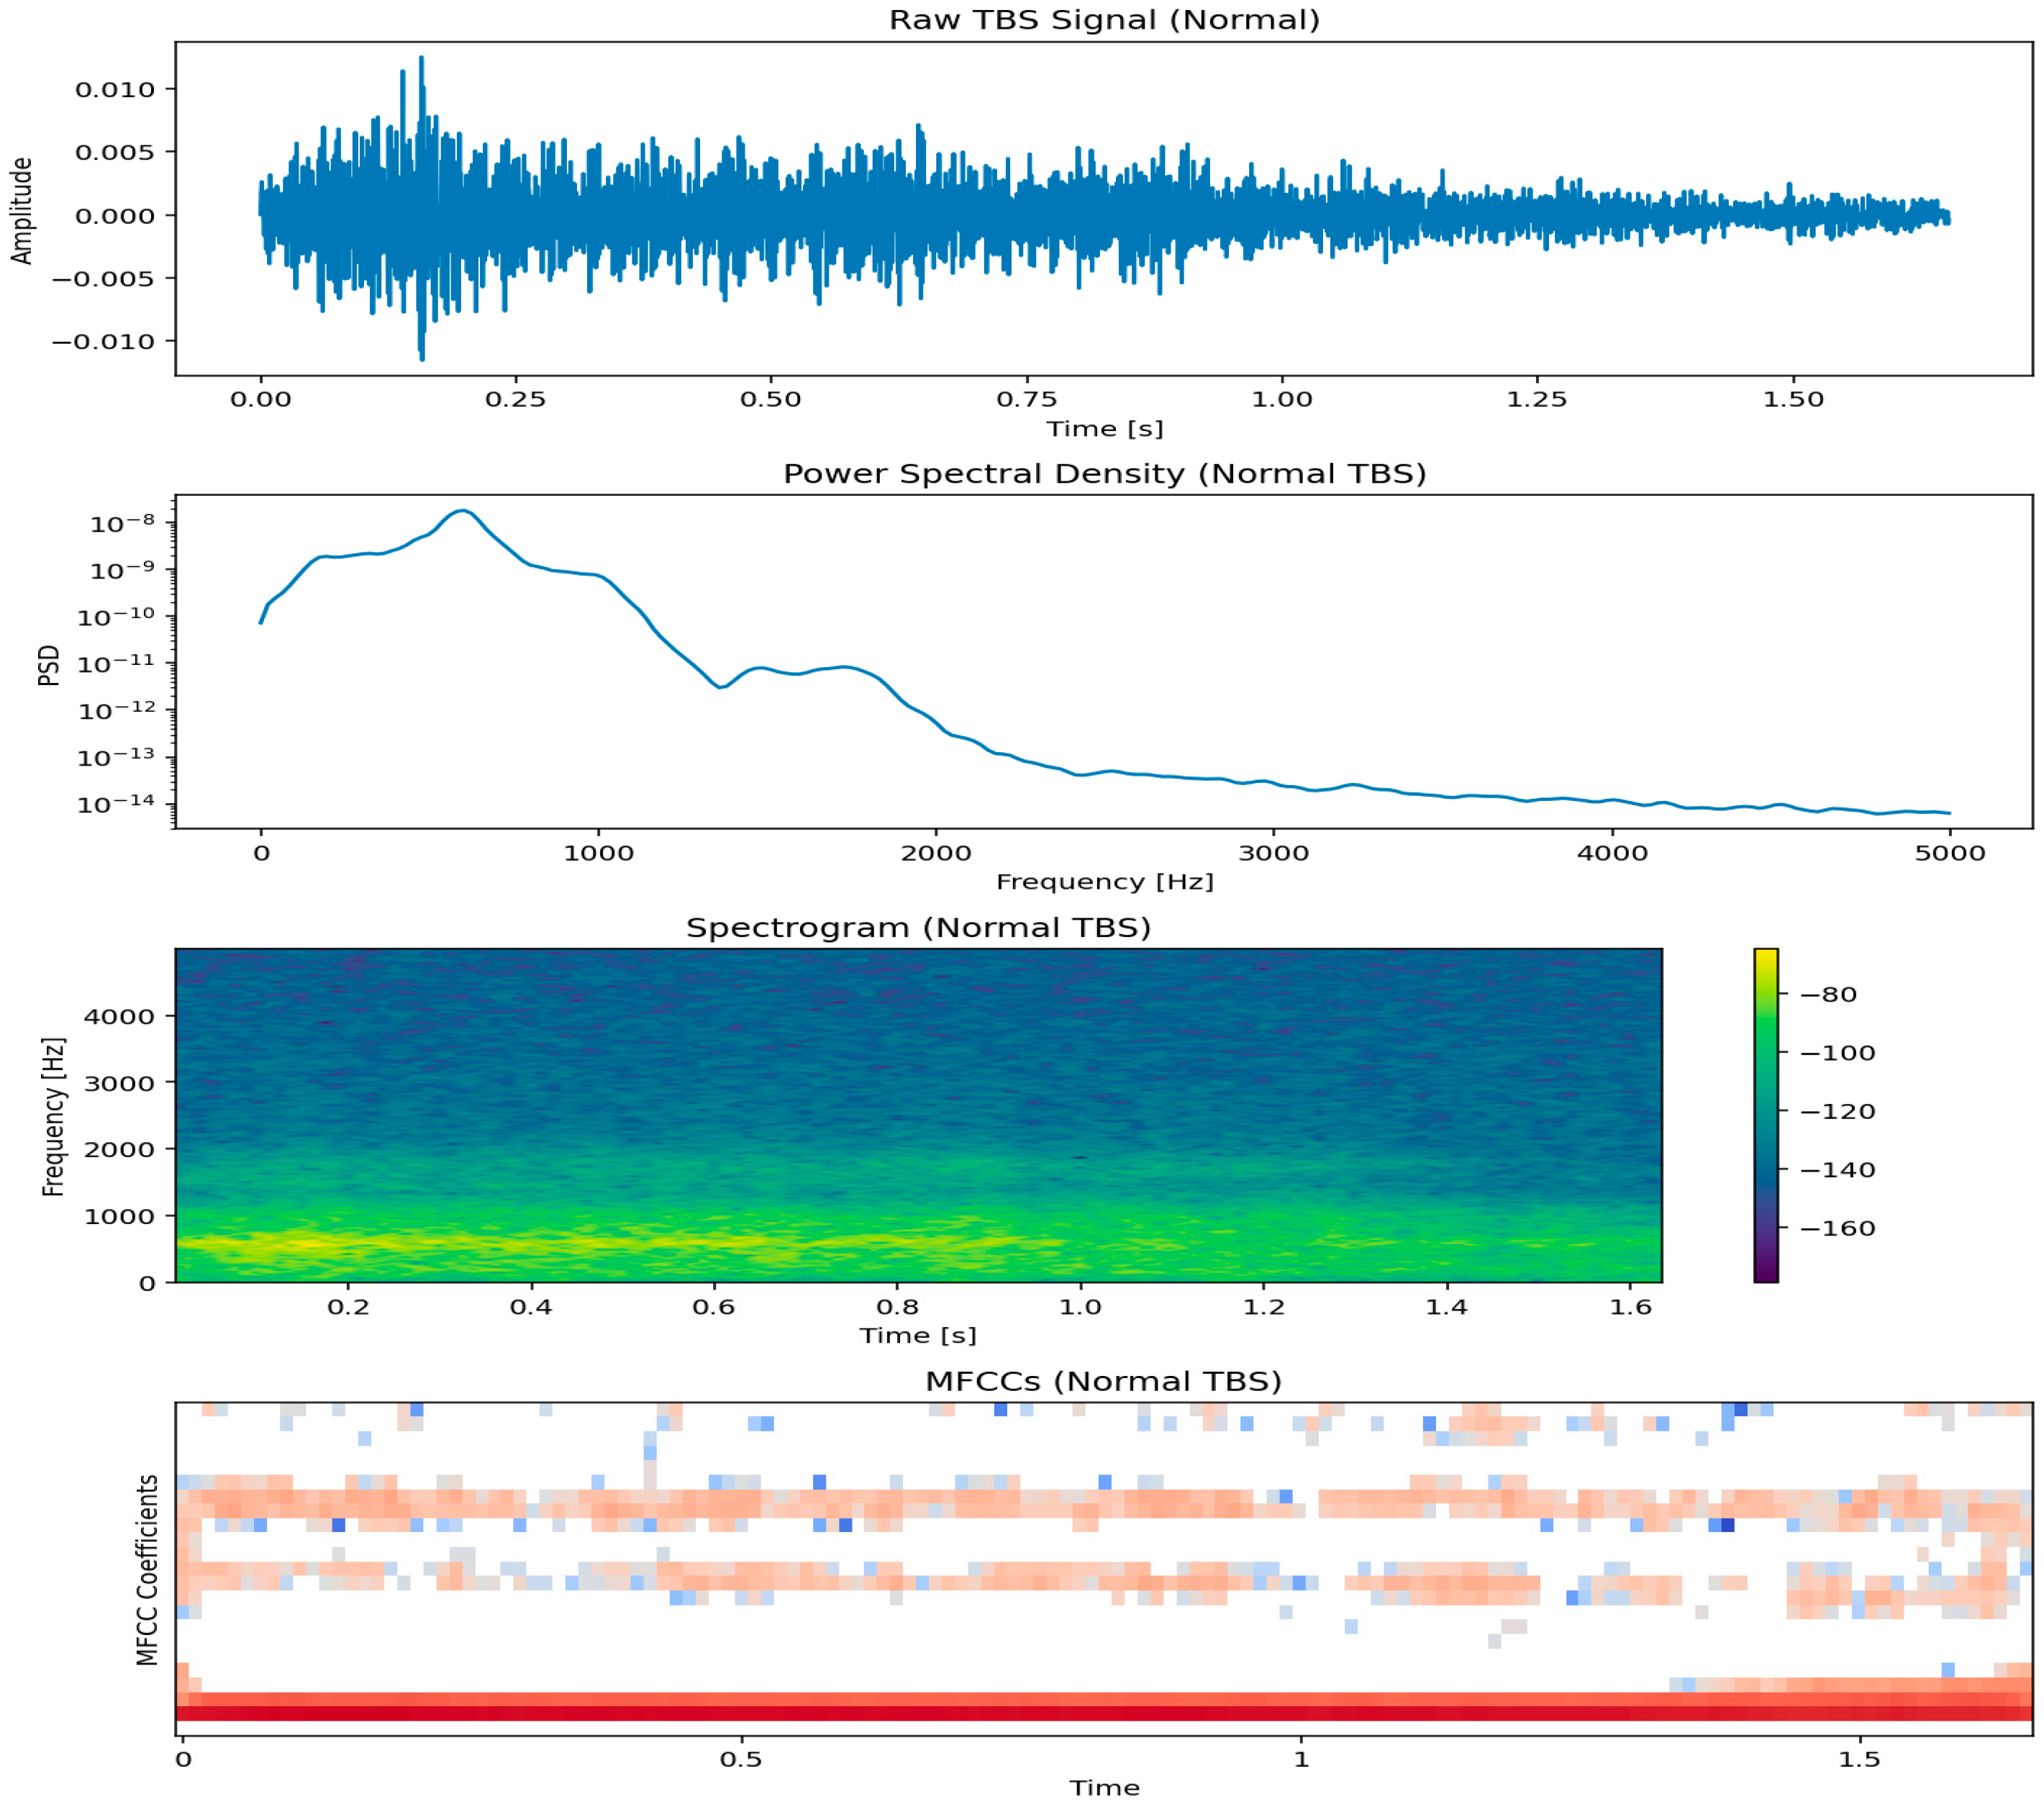
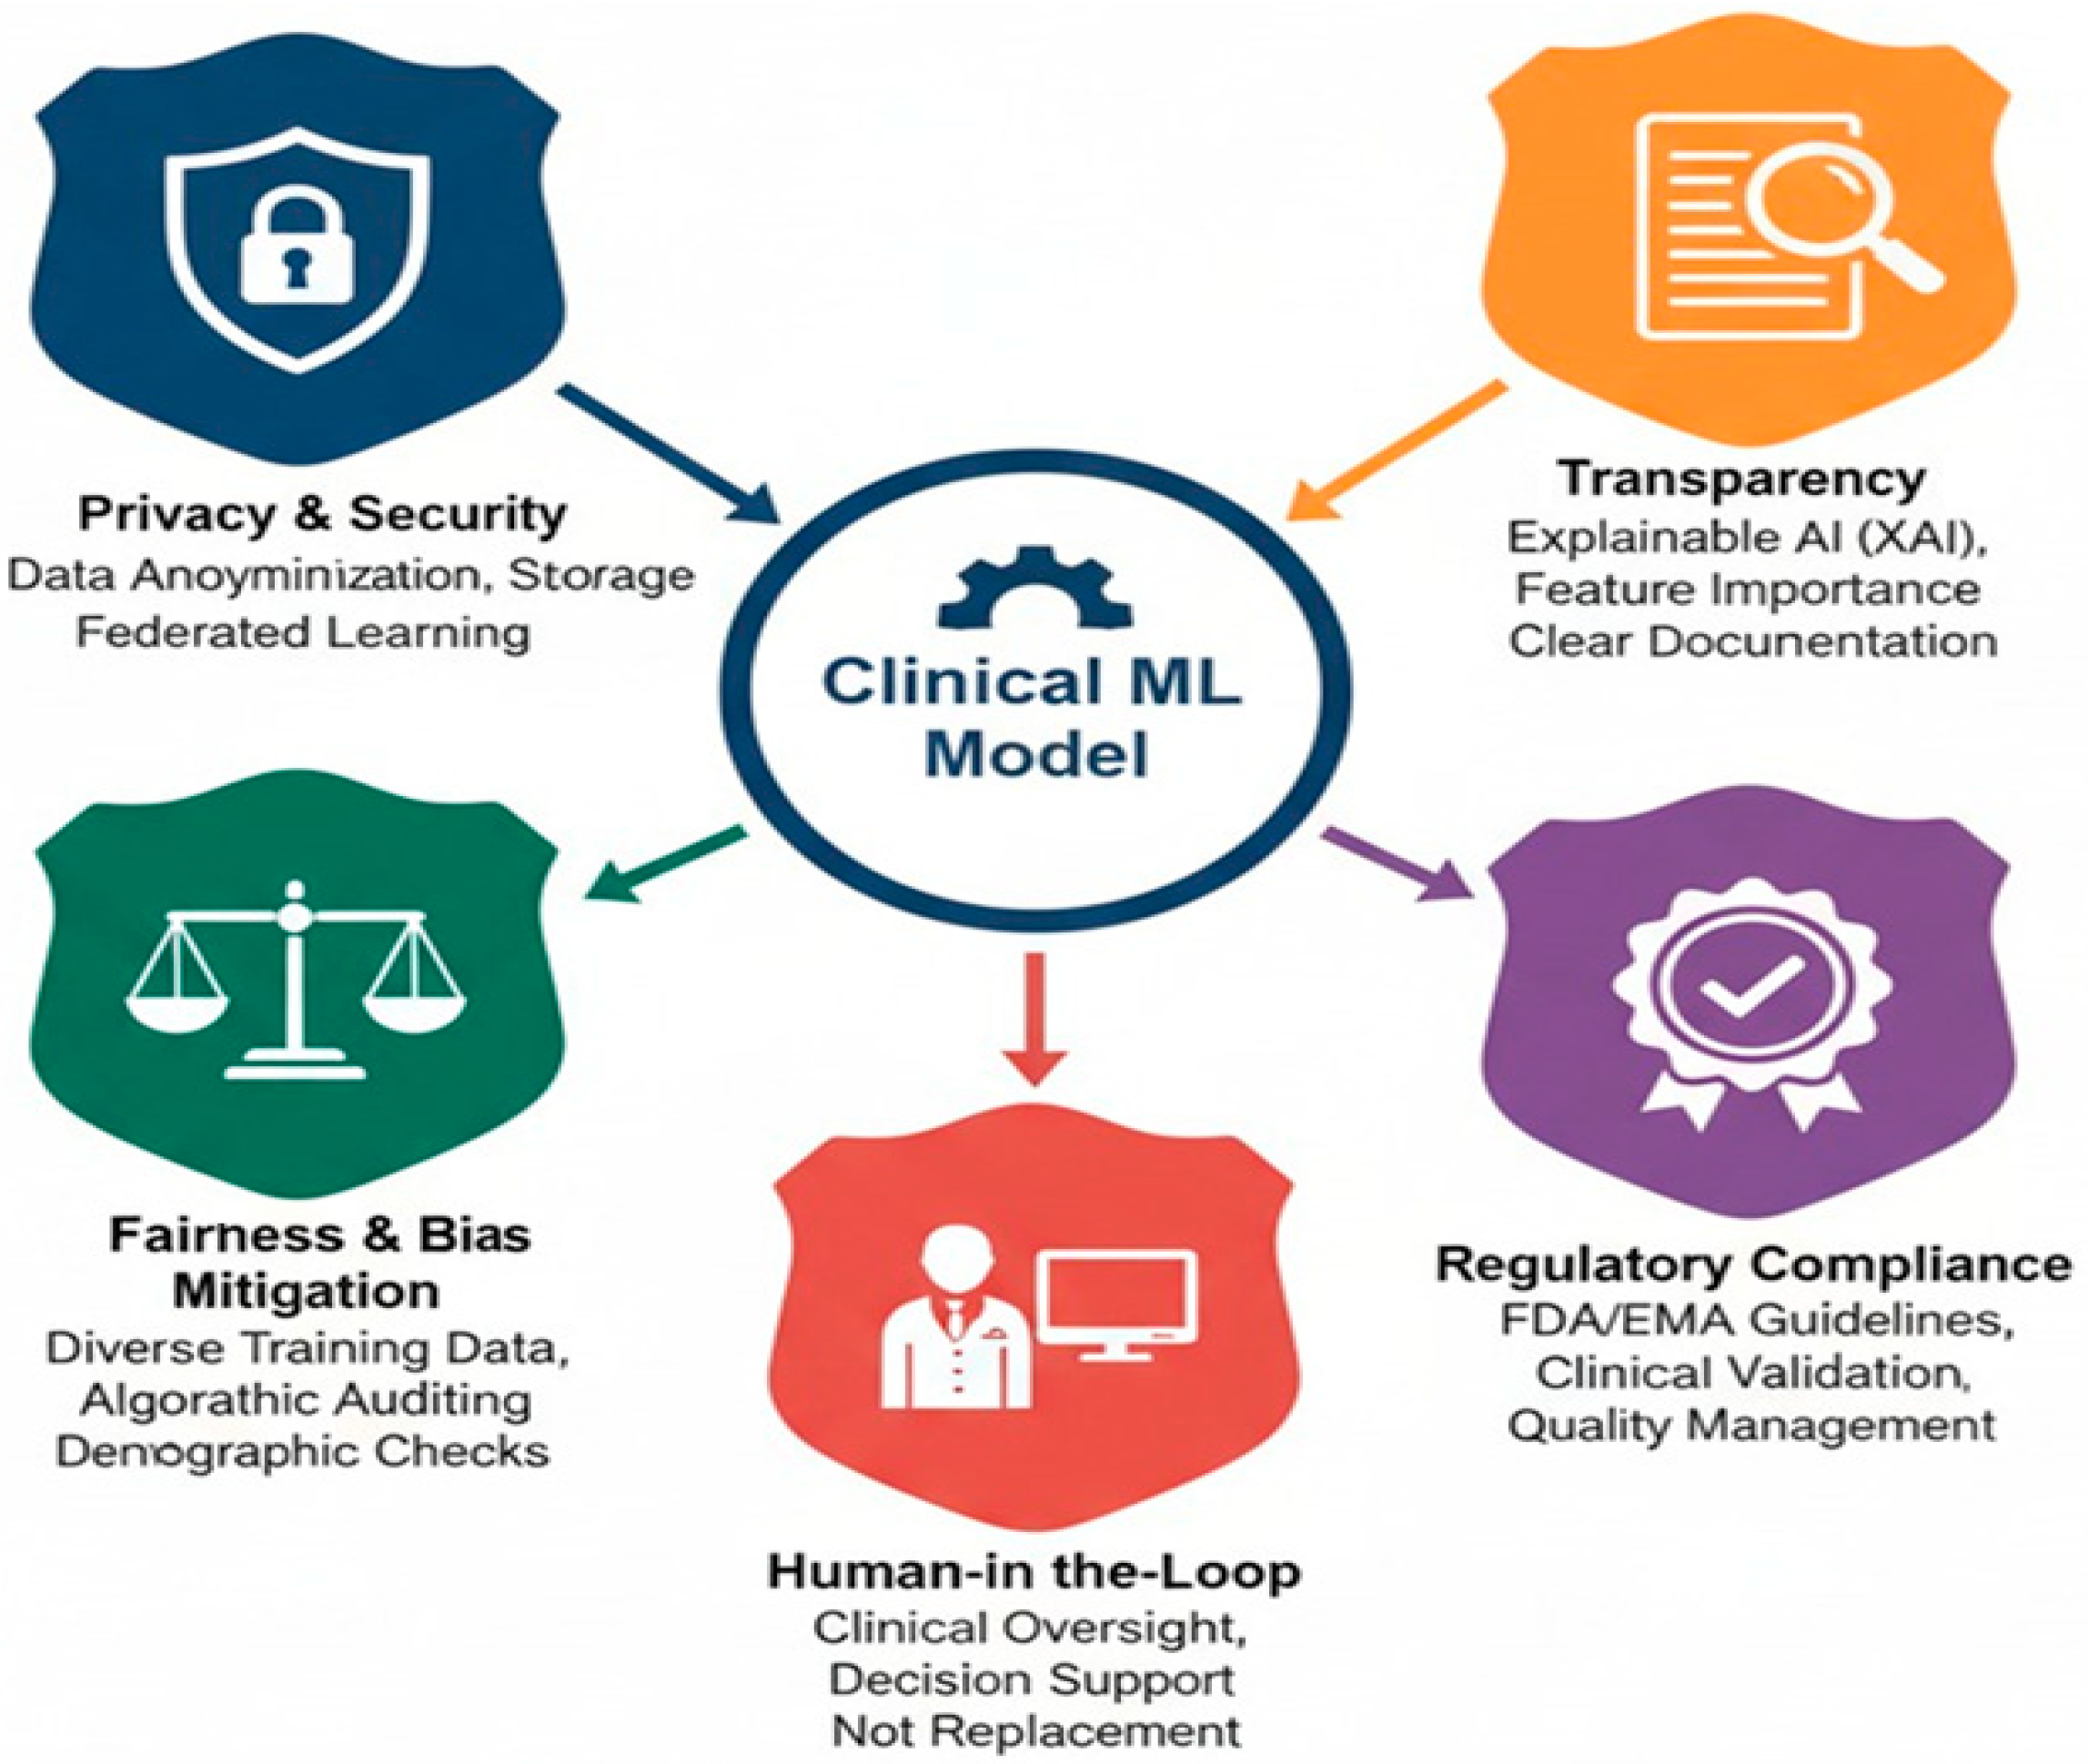
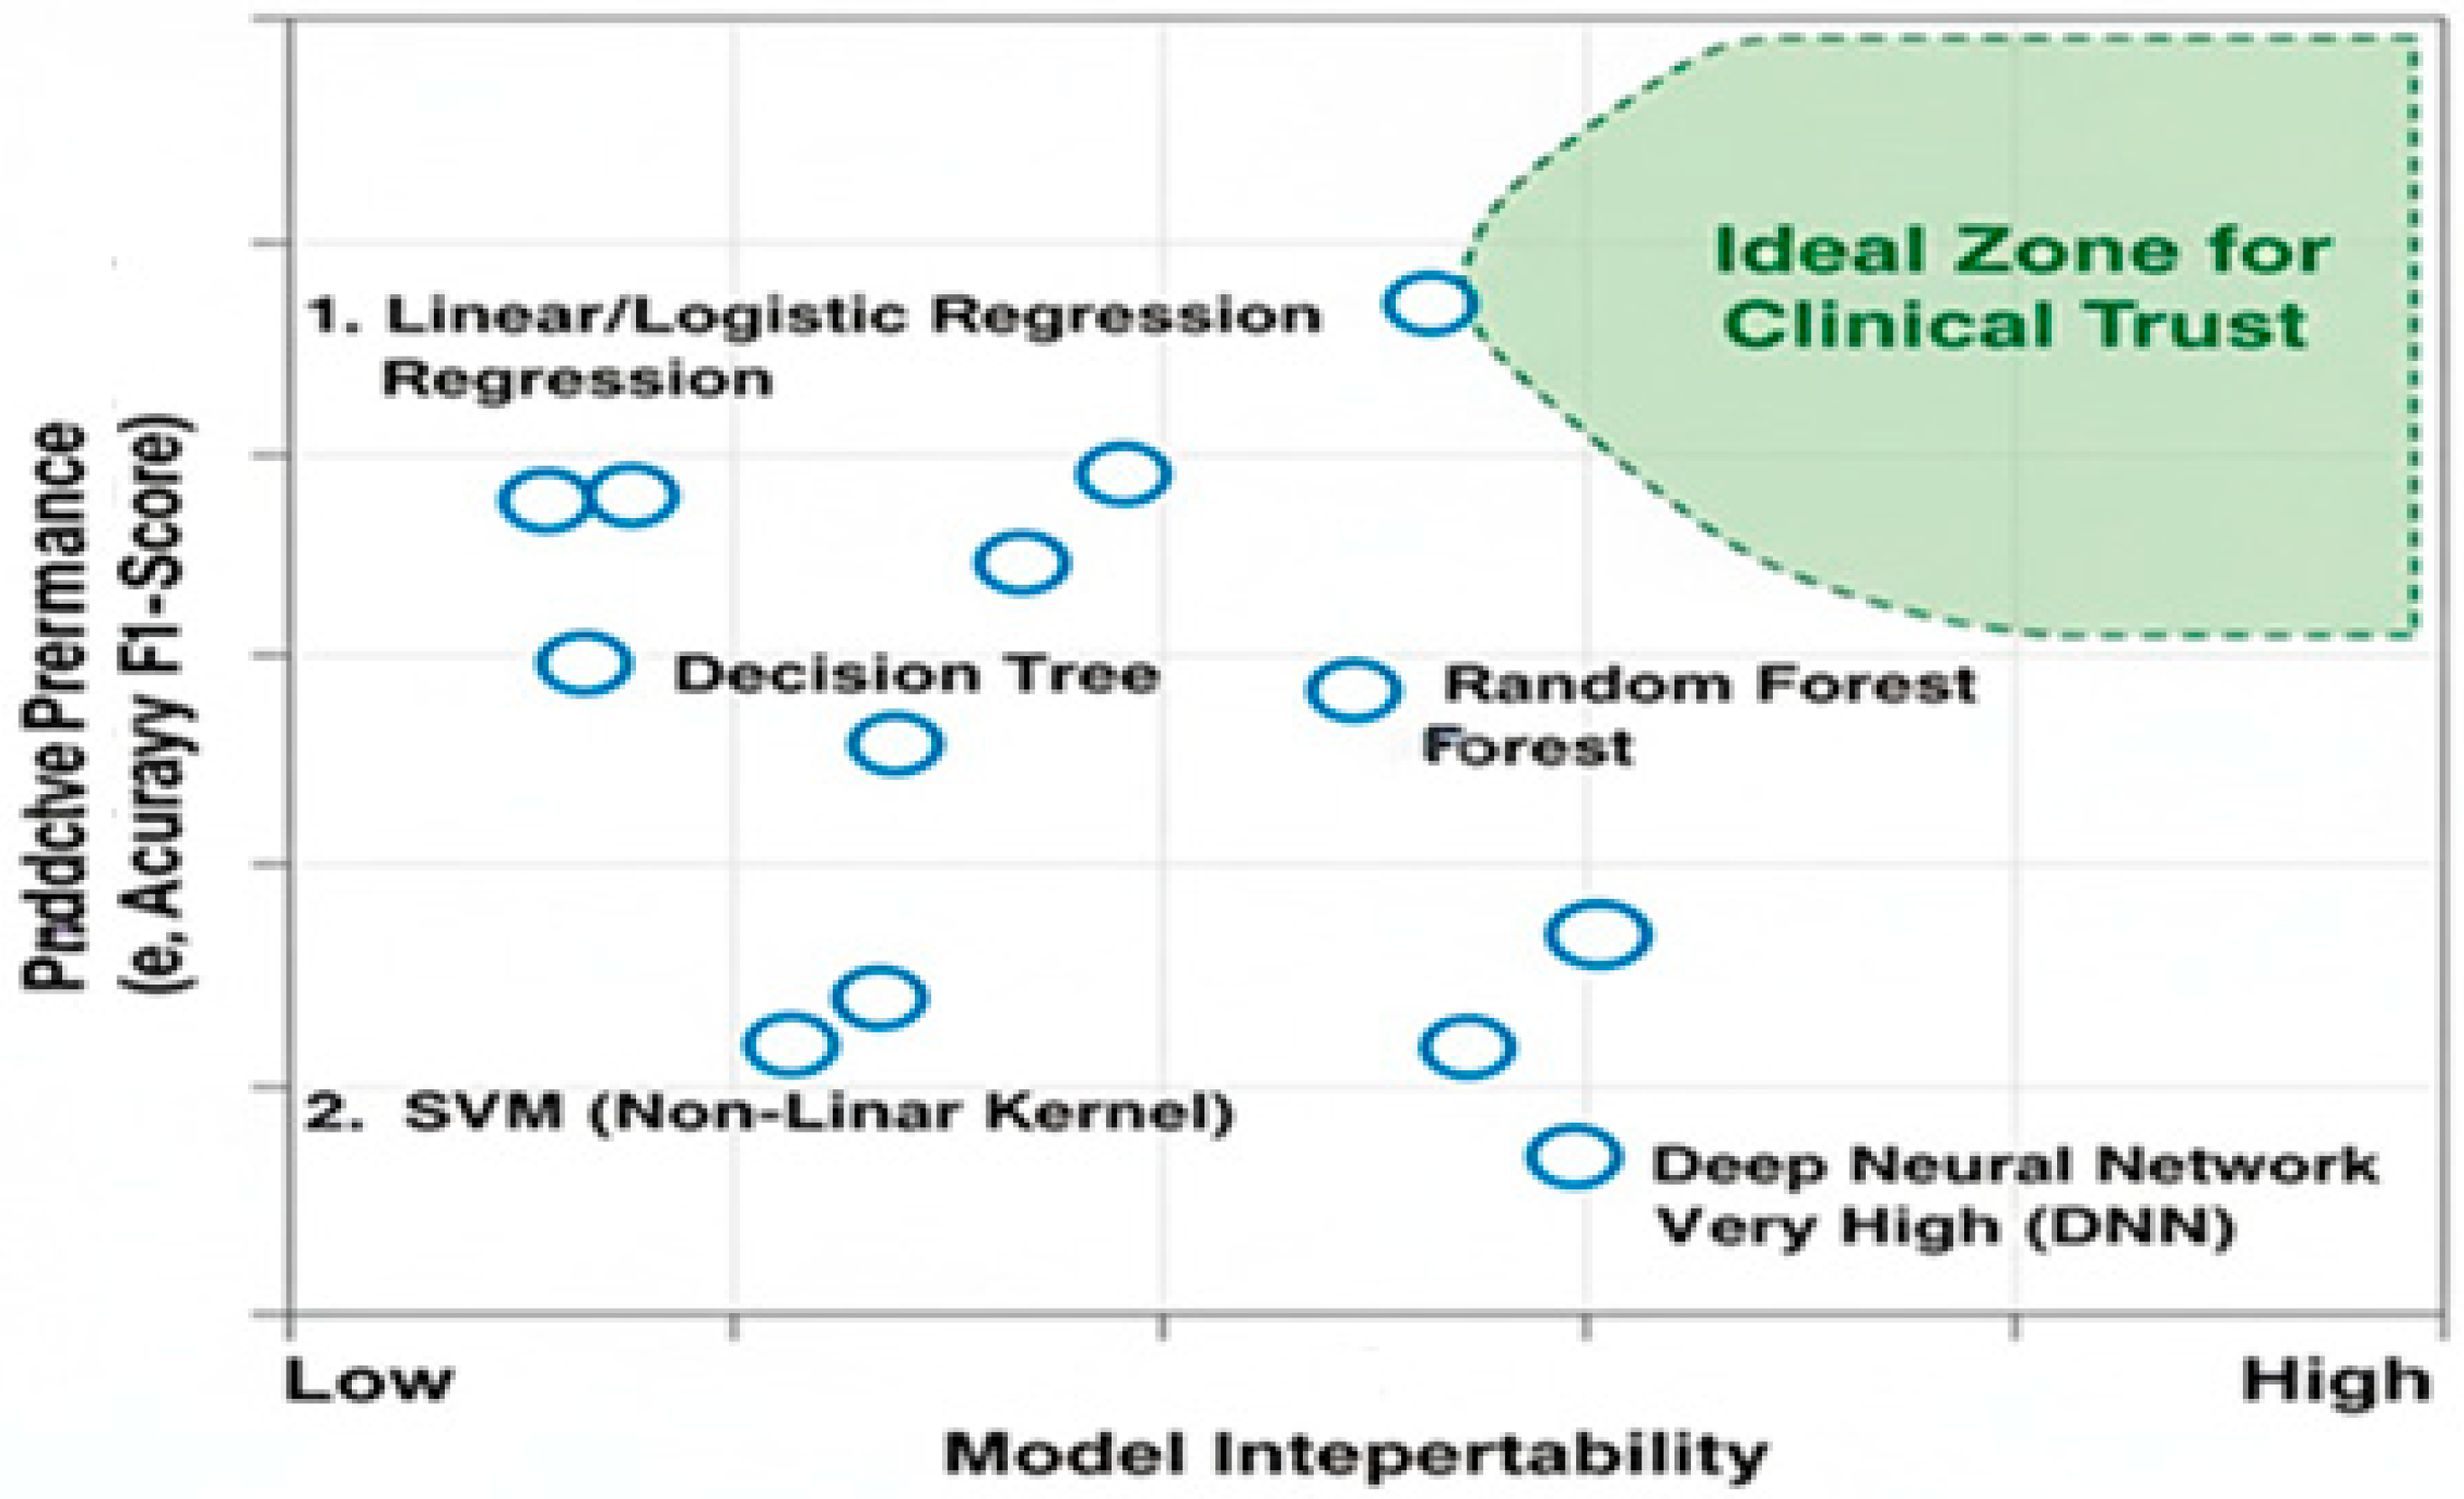
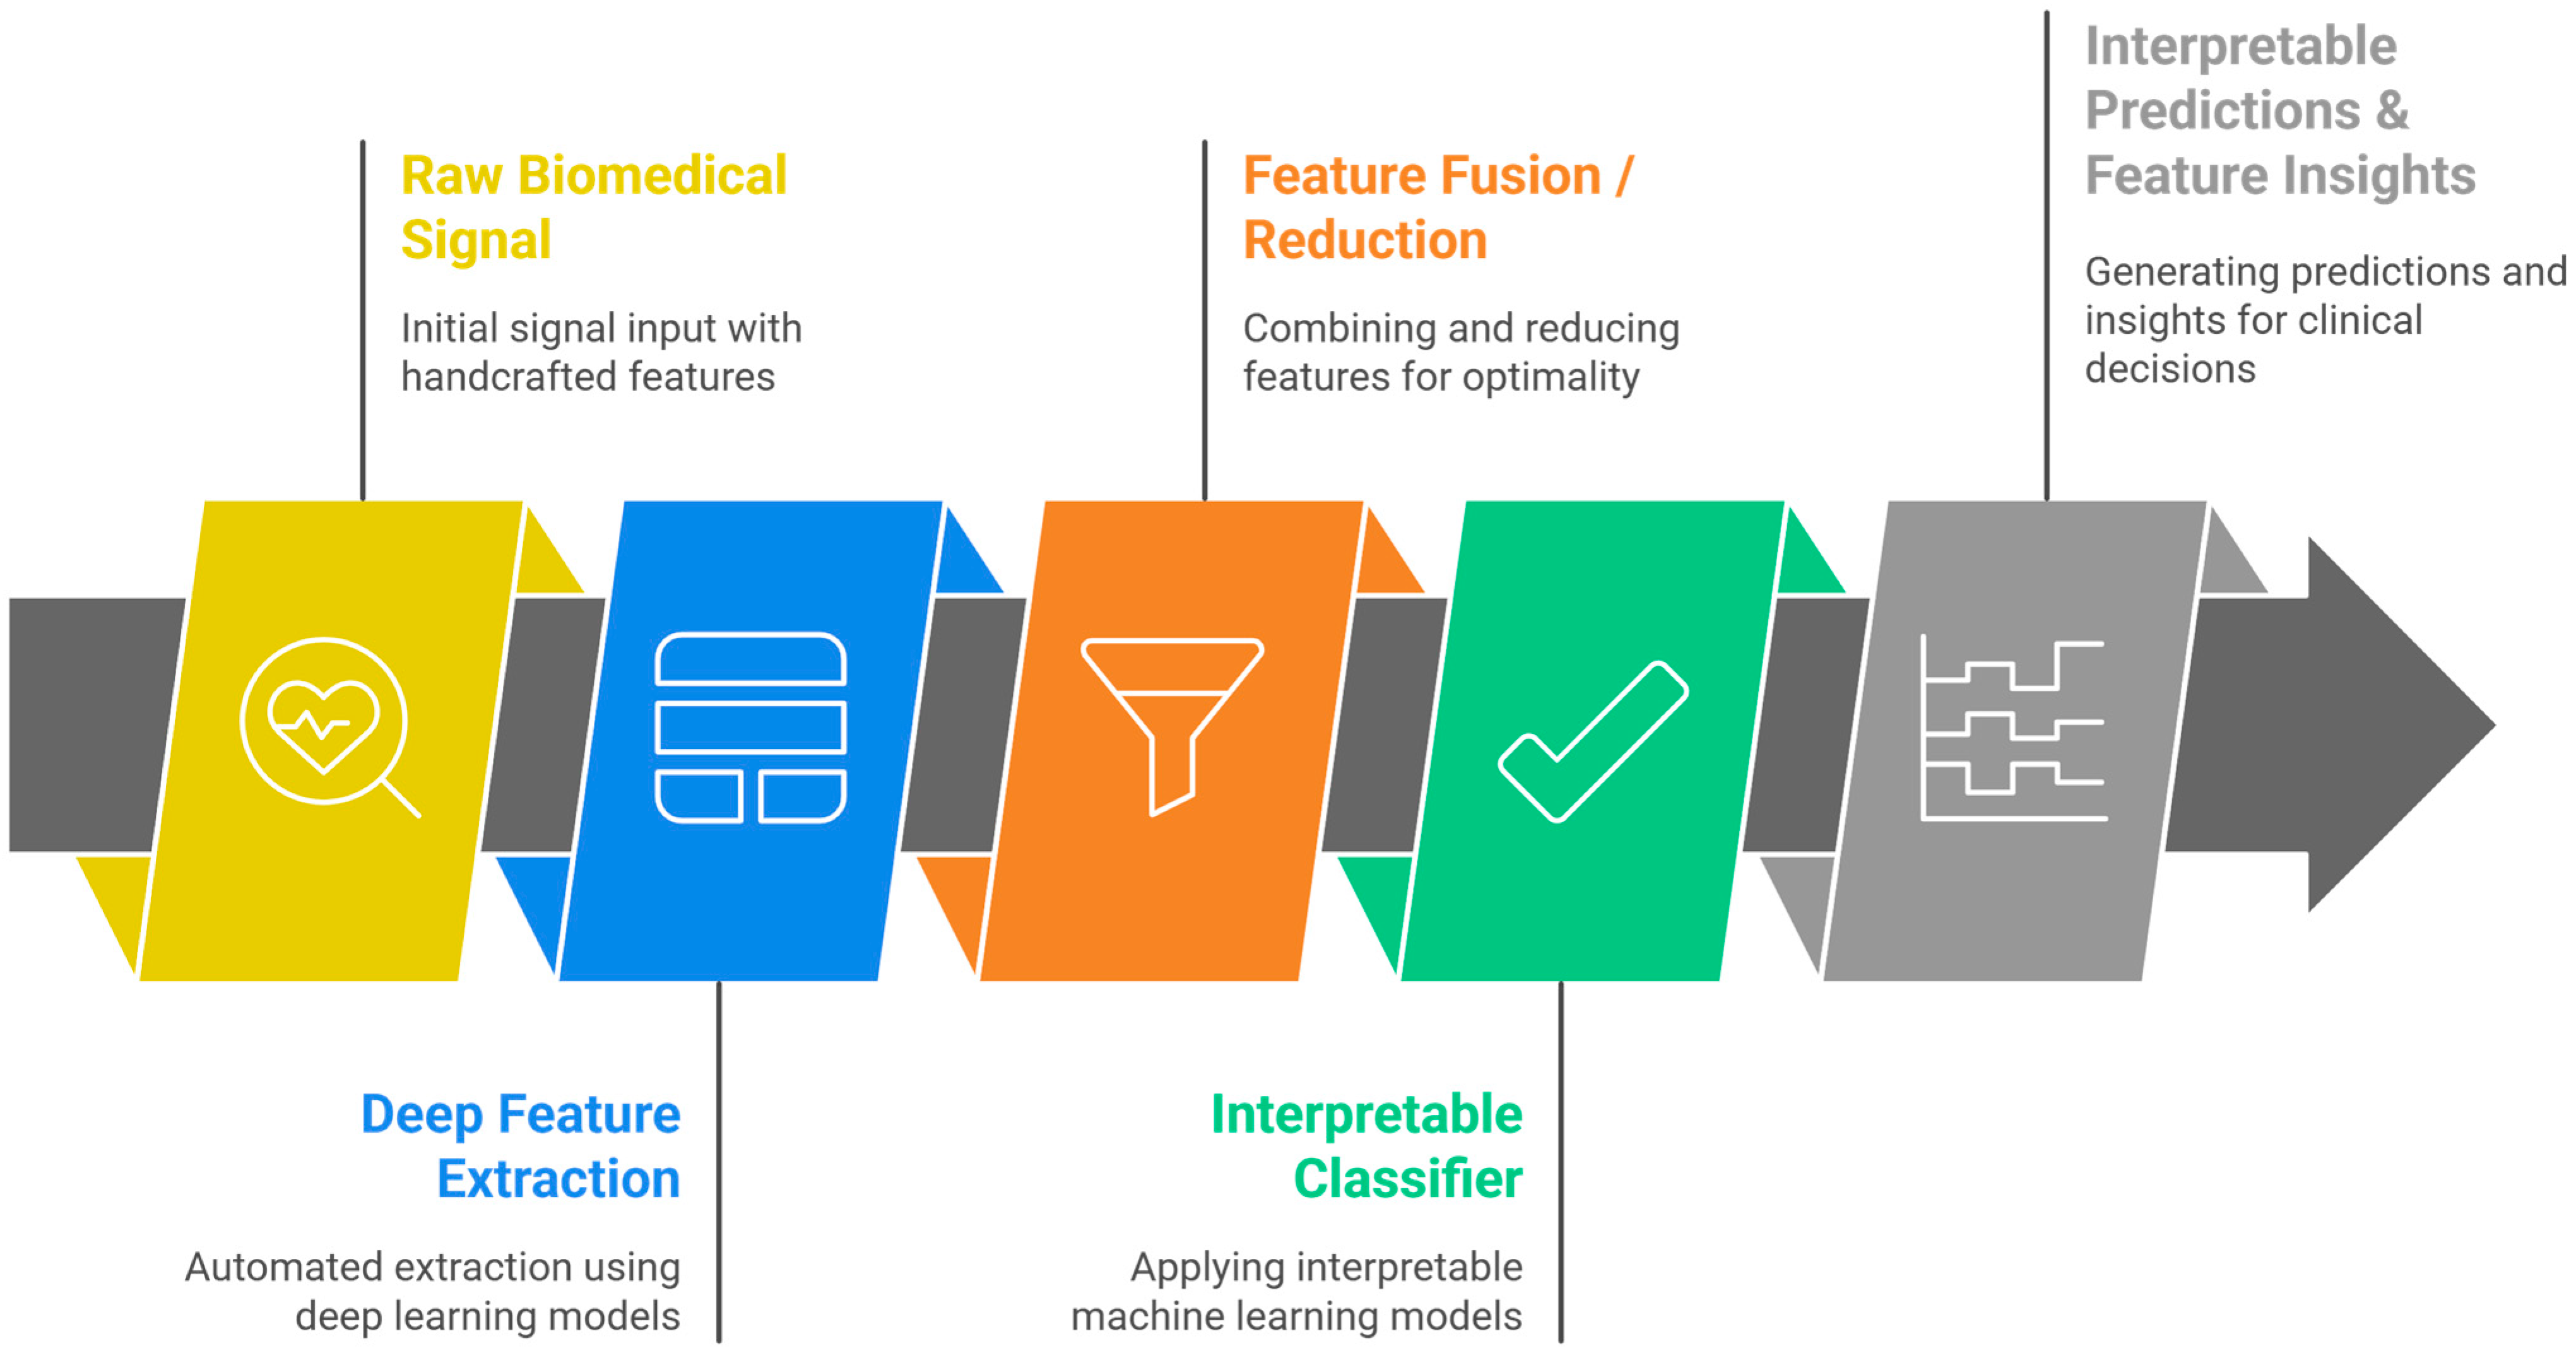
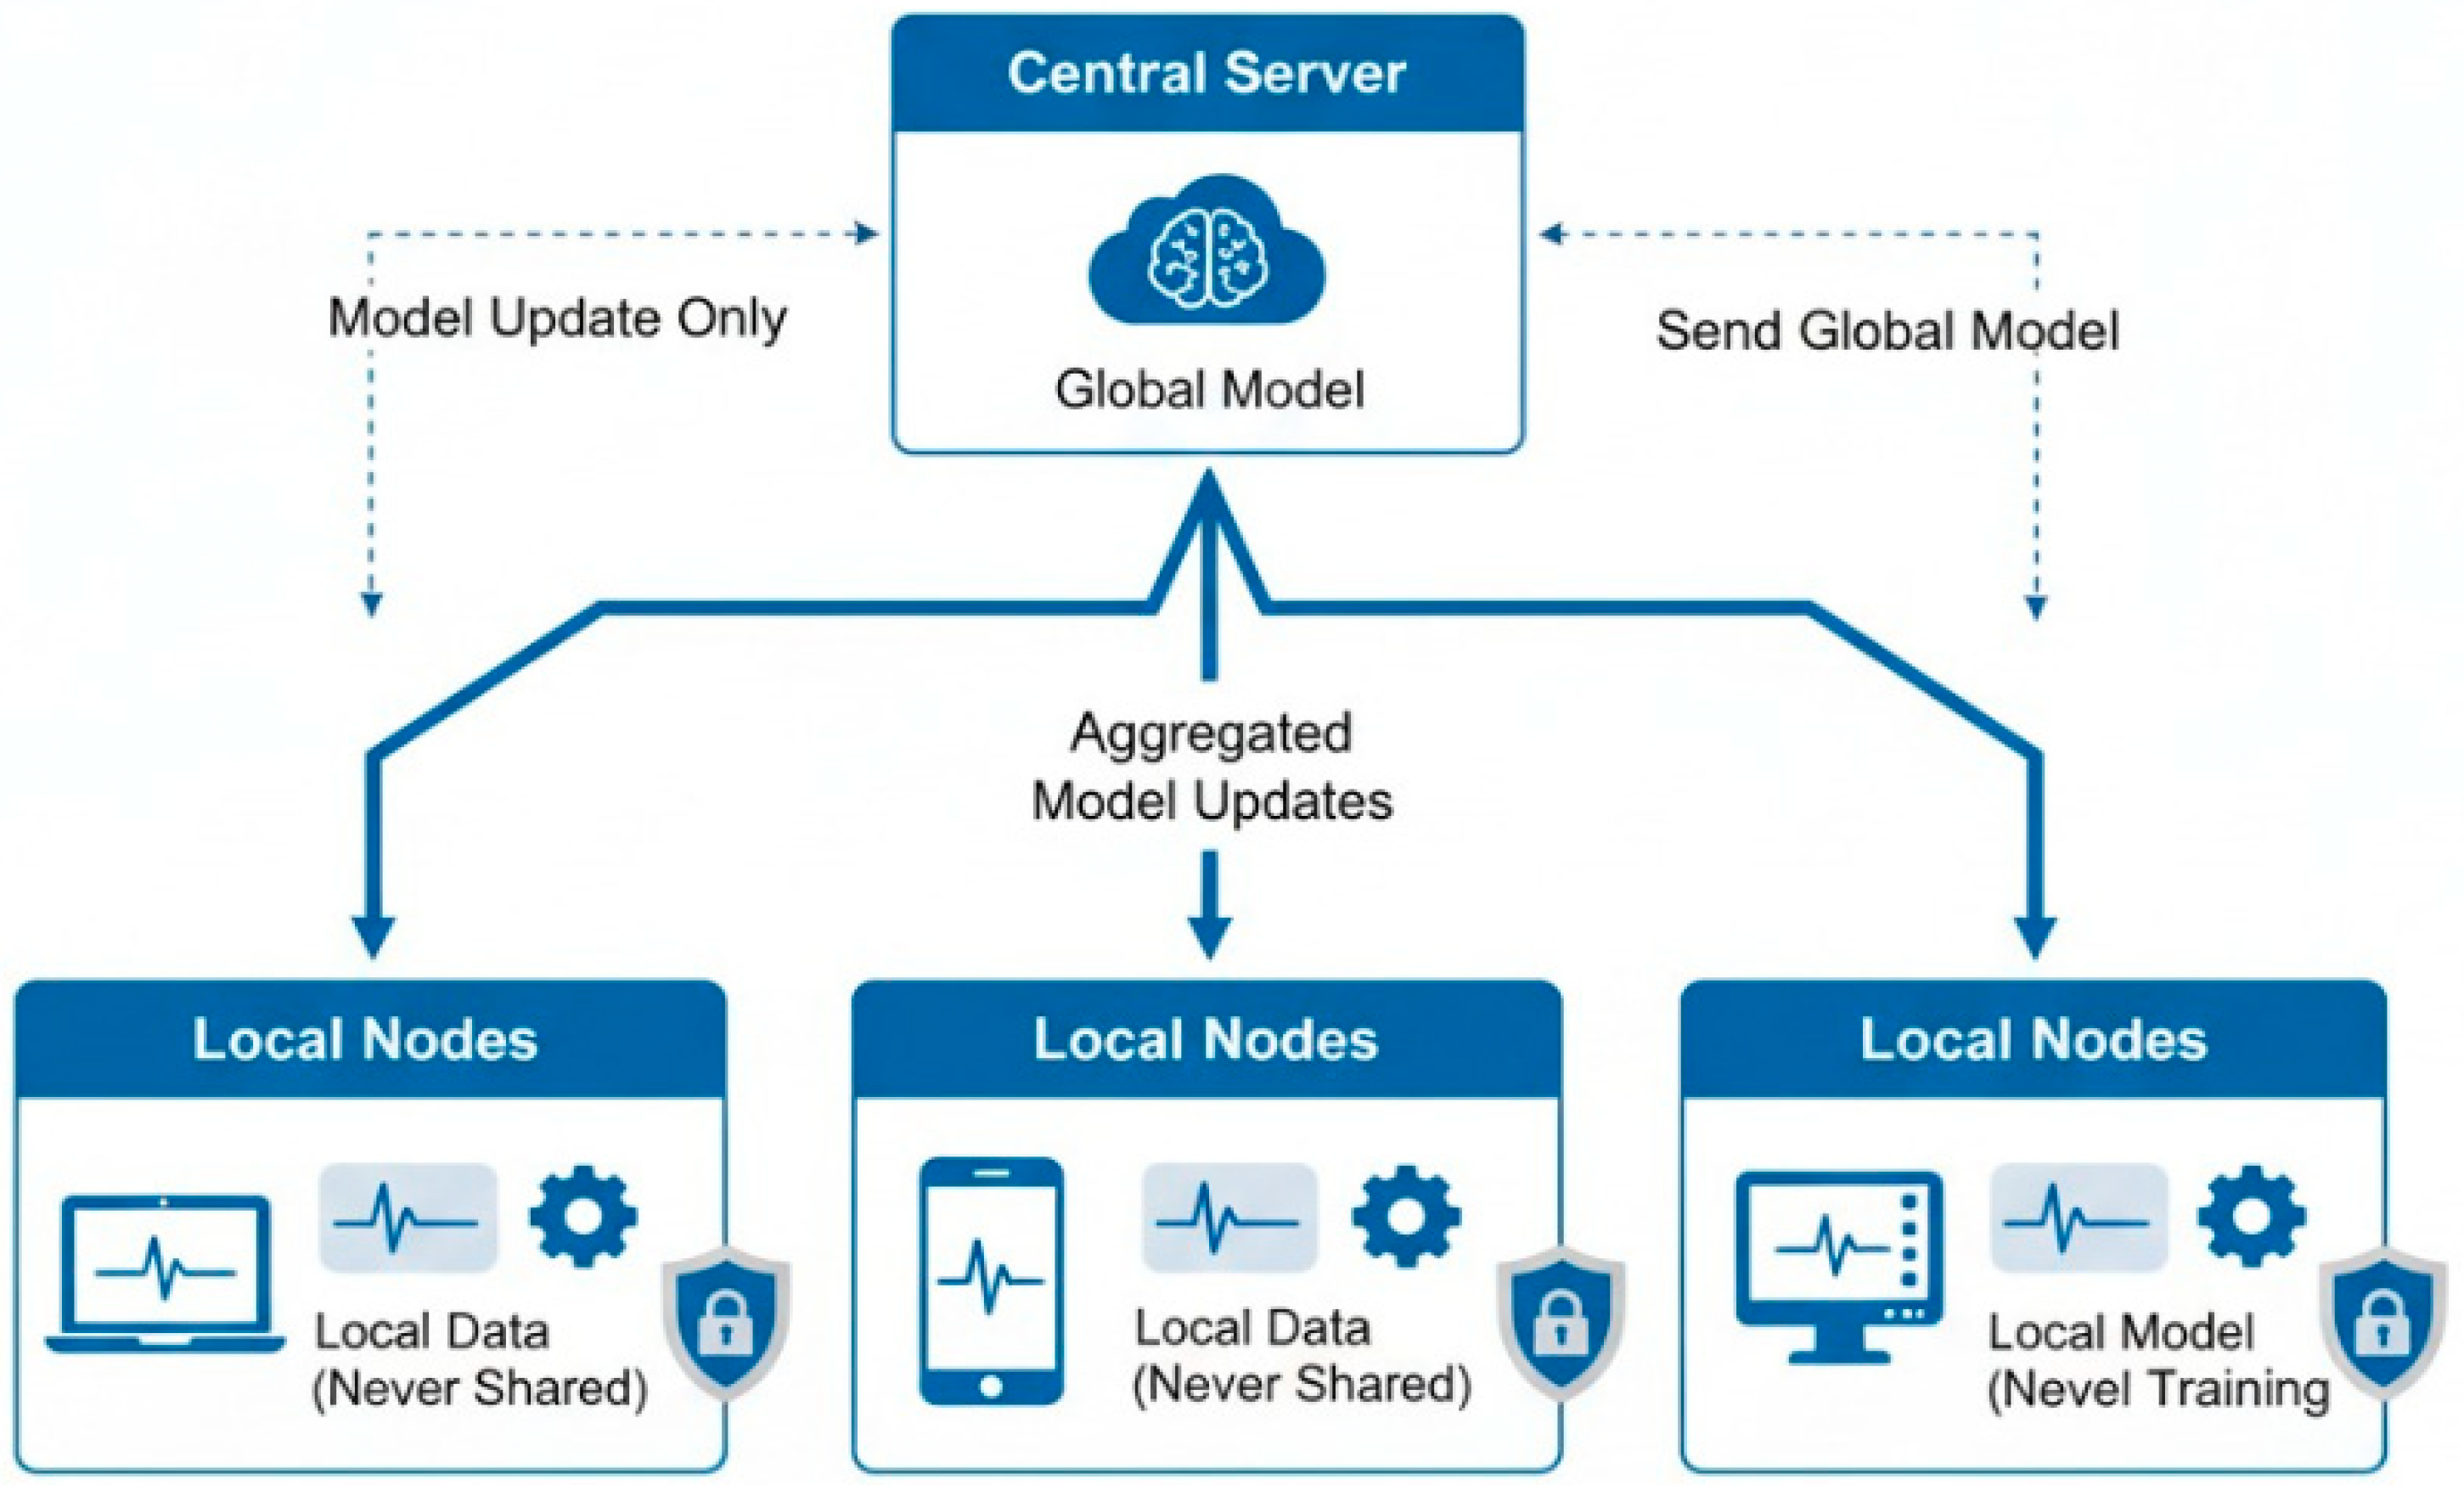
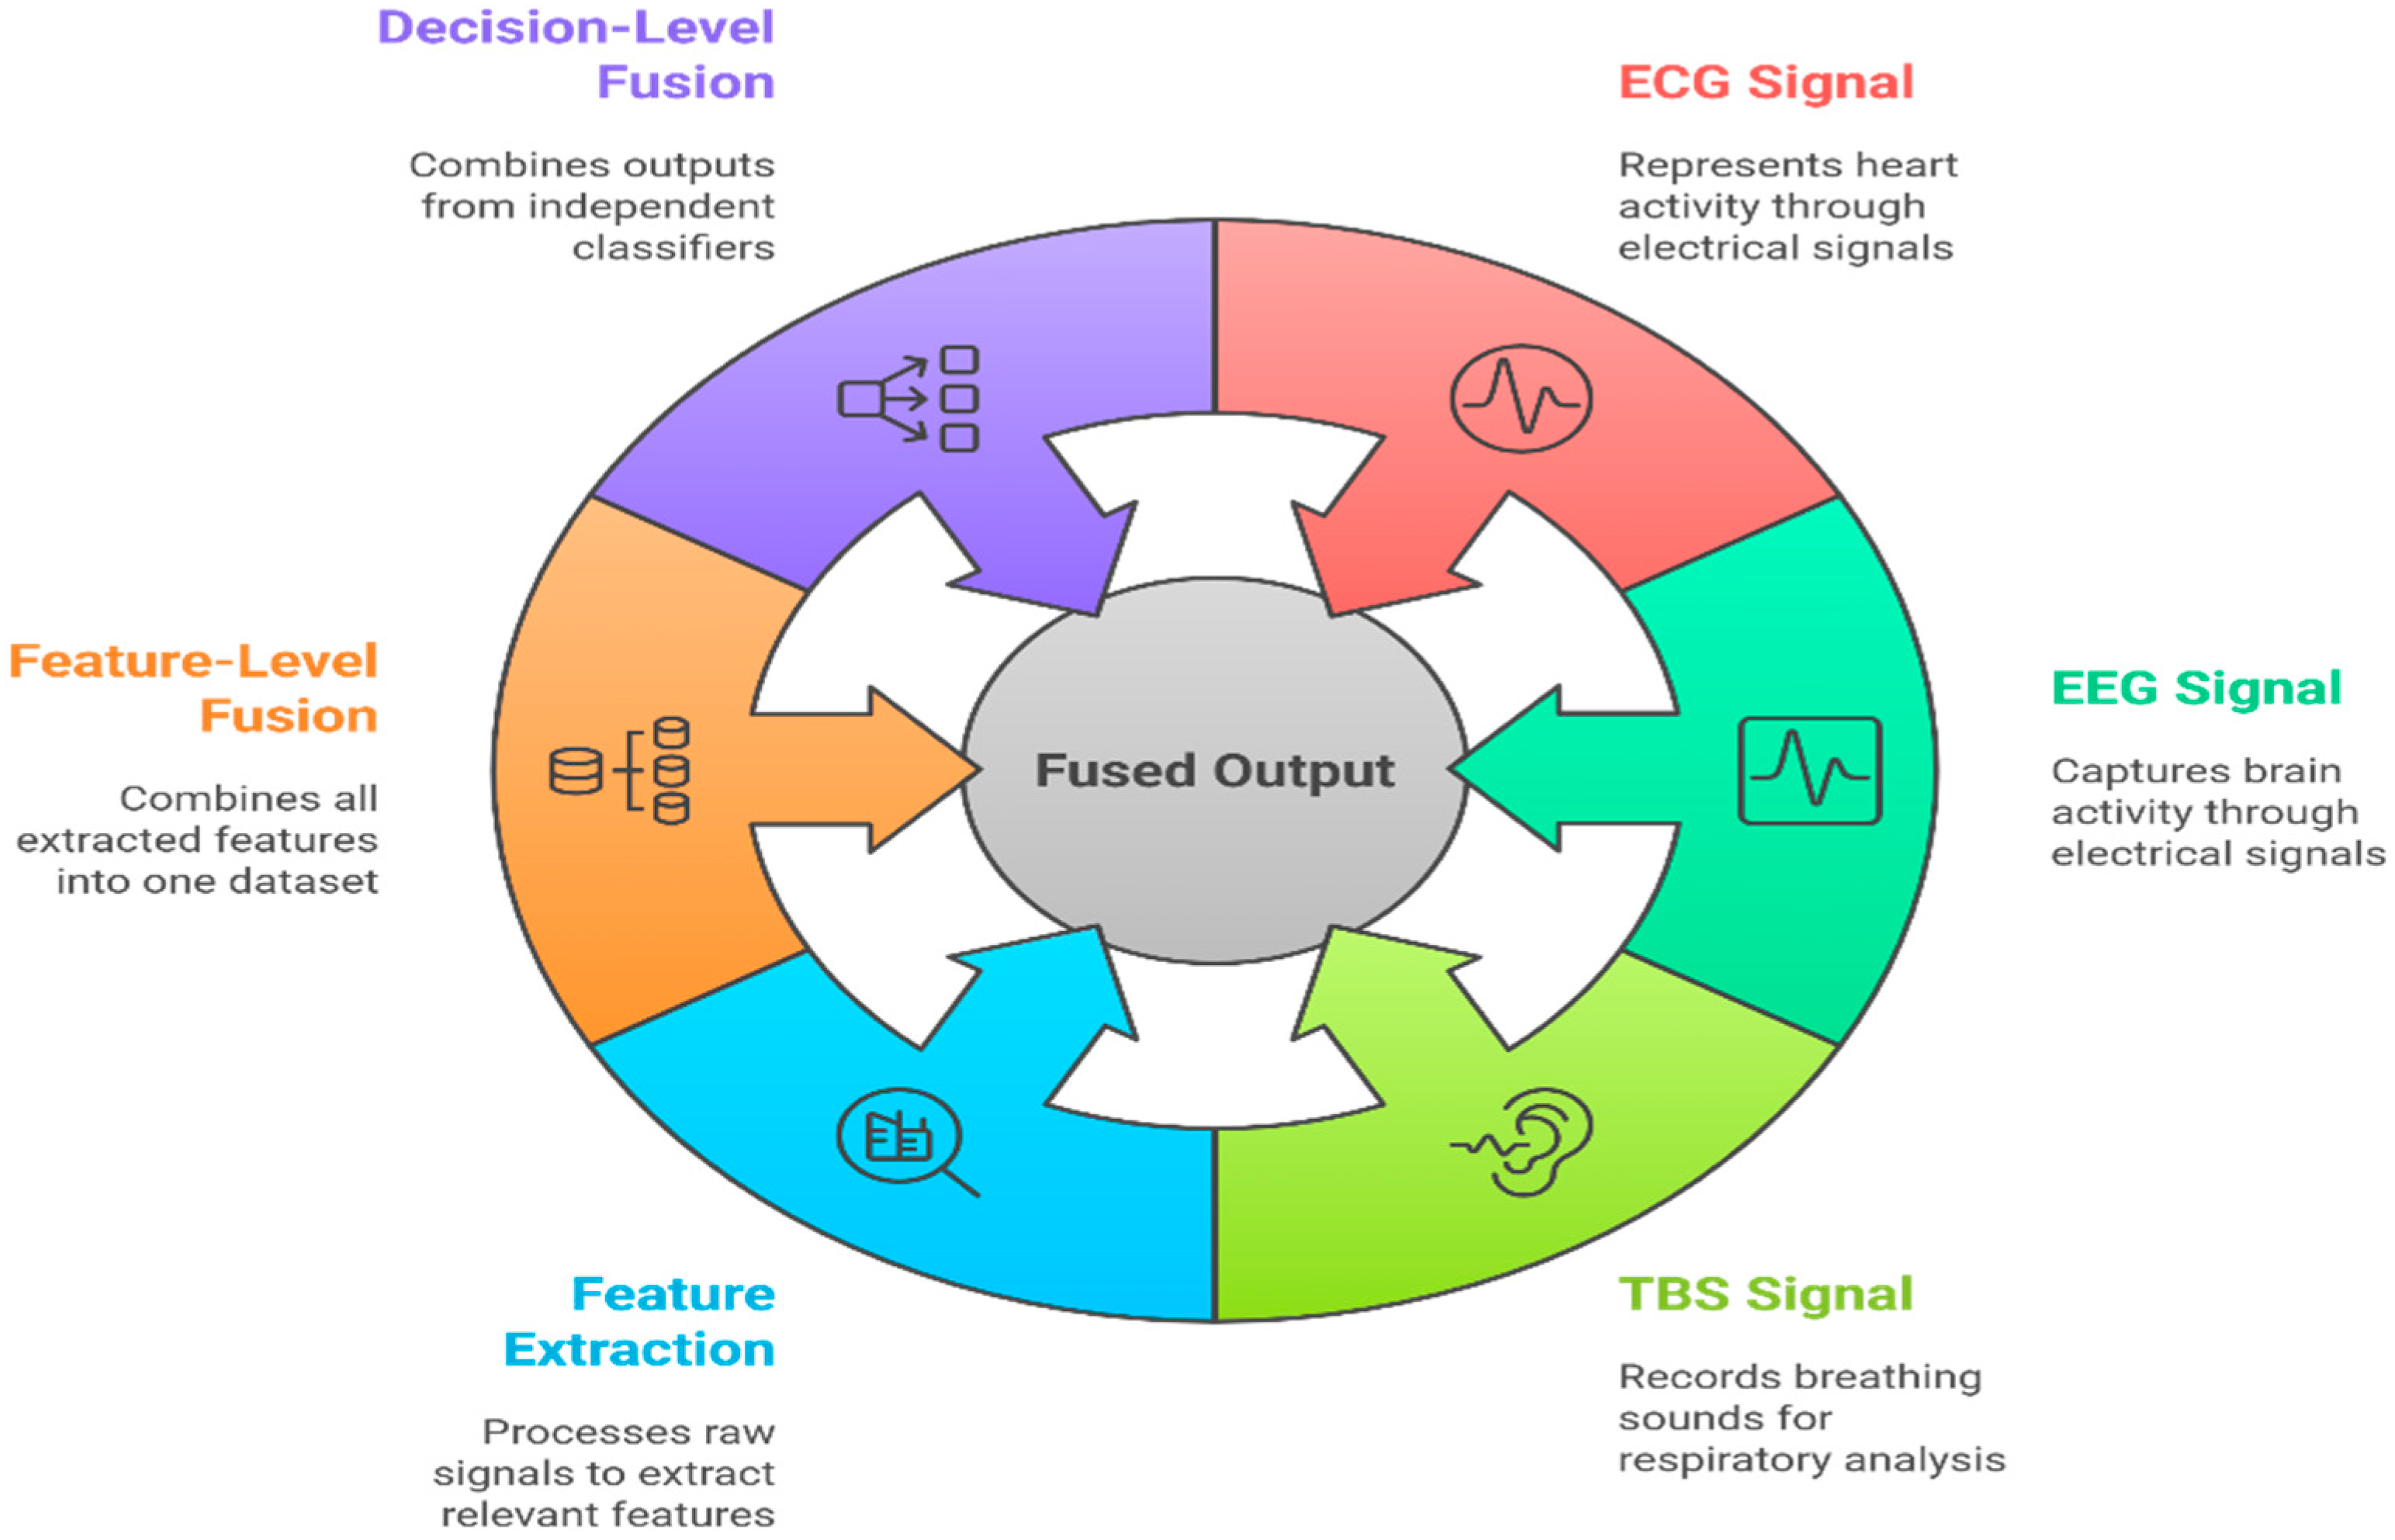
| Factor | Machine Learning | Deep Learning | Implication for Medical Use |
|---|---|---|---|
| Interpretability | High (Decision rules, feature importance) | Low (“Black-box” nature) | Traditional ML is preferred for clinical trust and validation. |
| Data Requirements | Low to Moderate | Very High | Traditional ML is often the only viable option for most specific medical studies. |
| Computational Cost | Low (runs on CPU) | High (requires GPUs) | Traditional ML enables real-time analysis on low-power devices. |
| Domain Knowledge | Explicitly incorporated via feature engineering | Learned implicitly from data | Traditional ML leverages and validate existing clinical expertise. |
| Regulatory Path | simpler, more transparent | complex, requires extensive validation | Traditional ML is better aligned with current medical device approval frameworks. |
| Factor | ML | DL | Implication for Biomedical Signals |
|---|---|---|---|
| Accuracy (small data) | 85–92% (n < 2000) | 70–85% (n < 2000) | ML preferred for small datasets |
| Accuracy (large data) | 90–93% (n > 10,000) | 92–98% (n > 10,000) | DL surpasses ML only with large datasets |
| Interpretability | High (decision rules, feature importance) | Low (“black-box”) | ML favored for clinical trust and validation |
| Computational cost | Low (CPU, minutes) | High (GPU, hours) | ML enables real-time deployment |
| Feature engineering | Explicit, domain-informed | Implicit, learned from data | ML leverages existing clinical knowledge |
| Modality | Method | Metric | Interpretability | Clinical Validation | Gap Identified |
|---|---|---|---|---|---|
| ECG | SVM, RF, DT | Accuracy, F1 | High | Partial | Limited benchmarking across small vs. large datasets |
| EEG | SVM, CNN, LSTM | Accuracy, AUC | Medium | Limited | Interpretability for complex DL models lacking |
| EMG | RF, RNN | Accuracy | High | Partial | Inconsistent validation across heterogeneous populations |
| Tracheal Sounds | SVM, RF, DT | Specificity, Sensitivity | High | Rare | Few studies include clinical outcome validation |
| EVestG | ML, DL hybrids | Accuracy, Sensitivity | Medium | Limited | Sparse comparative studies and hybrid model evaluation |
| PPG | ML, CNN | Accuracy, F1 | Medium | Partial | Limited transparency and reproducibility reporting |
| Feature Category | Examples | Descriptions | Application in Biomedical Signals |
|---|---|---|---|
| Amplitude-based | Max, Min, Mean, RMS, Variance, Std Dev | Quantify signal amplitude and power | EMG (RMS for muscle activity), TBS (RMS for breathing intensity) |
| Morphological | P-wave duration, QRS complex duration, ST-segment elevation | Describe the shape of specific signal components | ECG (diagnosing cardiac conditions), EMG (WAMP for muscle activity) |
| Statistical | Skewness, Kurtosis, Zero-crossing rate | Describe the distribution and periodicity of the signal | Respiratory sounds (ZCR for frequency content) |
| Feature Category | Examples | Description | Application in biomedical Signals |
|---|---|---|---|
| Spectral Content | Power Spectral Density (PSD), Spectral Centroid, Band Power Ratios | Quantify the distribution of power across frequencies | EEG (alpha, beta, theta, delta bands), HRV from ECG, Respiratory sounds (wheezes, crackles) |
| Speech-related | Mel-Frequency Cepstral Coefficients (MFCCs) | Capture spectral envelope, robust to recording variations | Tracheal breathing sounds (robust representation of respiratory sounds) |
| Wavelet Transform (WT) | Decomposes the signal into different frequency components at various resolutions. | ECG, EEG (capturing transient and oscillatory phenomena) | Wavelet Transform (WT) |
| Short-Time Fourier Transform (STFT) | Provides a spectrogram, a visual representation of frequency content over time | Evoked potentials in EEG, transient events in ECG (changes in power or dominant frequencies) | Short-Time Fourier Transform (STFT) |
| Method Type | Description | Advantages | Disadvantages | Examples |
|---|---|---|---|---|
| Filter Methods | Select features based on intrinsic properties, independent of the ML model | Computationally efficient, suitable for high-dimensional data | Ignore interaction with ML model, may select redundant features | Variance Threshold, Correlation-based Feature Selection (CFS), Statistical Tests (Chi-squared, ANOVA, Mutual Information) |
| Wrapper Methods | Evaluate feature subsets by training and testing an ML model | Consider interaction with the ML model, which is generally more accurate | Computationally expensive, prone to overfitting with small datasets | Forward Selection, Backward Elimination, Recursive Feature Elimination (RFE) |
| Embedded Methods | Perform feature selection during model training | Balance of efficiency and accuracy, considers feature interactions | Method-dependent, less flexible than filter methods | Lasso (L1 Regularization), Tree-based Methods (Decision Trees, Random Forests, Gradient Boosting) |
| Algorithm | Strengths | Weaknesses | Applications in Biomedical Signals |
|---|---|---|---|
| Logistic Regression | Simple, interpretable, and effective for linear relationships | Assumes linearity, poor for complex non-linear data | Binary classification (e.g., disease presence/absence, respiratory sound classification) |
| Linear Discriminant Analysis (LDA) | Interpretable, effective for class separability | Assumes normal distribution and equal covariance | EEG (emotion recognition), ECG (classification), BCI systems, EVestG |
| Perceptron | Fast and straightforward, foundational to neural networks | Limited to linearly separable problems | ECG (beat classification), breathing pattern analysis |
| Naïve Bayes | Fast, efficient with high-dimensional data | Assumes feature independence | Real-time biomedical monitoring, initial classification |
| Support Vector Machines (SVMs) | Robust to overfitting, works well with high-dimensional data | Sensitive to kernel choice and noisy data | ECG (arrhythmia), EEG (seizure detection), EMG (movement recognition), respiratory sounds, EVestG |
| K-Nearest Neighbors (KNN) | Simple, non-parametric, easy to interpret | Computationally expensive, sensitive to irrelevant features | ECG (heartbeat classification), EEG (sleep stages), respiratory sound analysis |
| Decision Tree | Highly interpretable, handles mixed data types | Prone to overfitting, unstable to small data changes | Disease diagnosis, respiratory pathology identification |
| Random Forest | Robust, accurate, handles high-dimensional data | Less interpretable (ensemble nature) | Sleep stage classification, disease diagnosis |
| AdaBoost | High accuracy, focuses on difficult cases | Sensitive to noise and outliers | Sleep stage detection, respiratory sound pathology |
| CatBoost | Excellent with categorical features, less overfitting | Computationally intensive | Multimodal disease prediction, respiratory sound analysis |
| Artificial Neural Networks (Shallow) | Models complex, non-linear patterns | Requires more data, less interpretable | General biomedical classification tasks |
| Logistic Regression | Simple, interpretable, and effective for linear relationships | Assumes linearity, poor for complex non-linear data | Binary classification (e.g., disease presence/absence, respiratory sound classification) |
| Method | Type | Strengths | Limitations | Representative Clinical Example |
|---|---|---|---|---|
| SHAP | Global & Local | Quantitative feature attribution; consistent with game-theoretic fairness | Computationally intensive; may yield unstable results for correlated features | EEG seizure biomarkers; heart-sound murmur detection |
| LIME | Local | Explains individual predictions; model-agnostic; intuitive for clinicians | Sensitive to perturbation sampling; limited reproducibility | Respiratory sound interpretation; ECG anomaly explanation |
| Permutation Importance | Global | Simple to compute; directly comparable across models | May ignore feature interactions | Feature relevance in sleep apnea detection |
| Partial Dependence/ICE Plots | Global/Local | Visualizes marginal and individual feature effects | Assumes feature independence; can obscure nonlinearities | Relation between spectral centroid and breathing abnormality |
| Model-Specific (Tree/Linear Models) | Intrinsic | Directly interpretable through weights or rules; low computational cost | Limited flexibility for non-linear or high-dimensional data | Logistic regression for OSA risk prediction; rule-based decision trees for cough classification |
| Feature Domain | Example Features | Physiological/Clinical Relevance | Typical Applications |
|---|---|---|---|
| Time-Domain | RMS, Mean, Zero-Crossing Rate, P-wave duration, QRS width | Reflects amplitude, rhythm, and morphology of physiological events | ECG arrhythmia detection, EMG muscle activation, TBS airflow intensity |
| Frequency-Domain | PSD, Spectral Centroid, Band Power Ratios, MFCCs | Quantifies oscillatory patterns and energy distribution | EEG (brain waves), respiratory sound wheeze/crackle detection, HRV analysis |
| Time–Frequency Domain | Wavelet Energy, STFT features, Spectrogram statistics | Captures transient or non-stationary physiological changes | EEG evoked potentials, TBS phase differentiation |
| Non-Linear Features | Entropy, Fractal Dimension, Lyapunov Exponent | Indicates signal complexity and regulatory balance | EEG seizure detection, ECG variability, cognitive state assessment |
| Higher-Order Statistics | Bispectrum, Trispectrum, Skewness, Kurtosis | Detects non-Gaussianity and coupling of physiological events | EEG cross-frequency coupling, respiratory anomaly analysis |
| ML Model | Interpretability Output | Clinically Meaningful Insight | Example in Practice |
|---|---|---|---|
| Decision Tree | Explicit decision rules (e.g., “if RMS > 0.5→abnormal”) | Transparent condition–decision mapping | Respiratory sound classification (standard vs. abnormal) |
| Random Forest | Feature importance ranking | Identifies dominant physiological markers | EEG: α/β ratio importance in drowsiness detection |
| Logistic Regression | Feature coefficients (positive/negative weights) | Quantifications of the direction of clinical association | ECG: prolonged QRS duration positively linked to arrhythmia risk |
| SVM | Support vector influence | Highlights boundary-defining physiological patterns | EMG: separation between rest and contraction epochs |
| SHAP/LIME (Post hoc) | Local feature contribution per instance | Case-by-case interpretability of prediction rationale | TBS: spectral centroid and RMS jointly drive OSA classification |
| Metric | Description | Importance of Biomedical Signals |
|---|---|---|
| Accuracy | Proportion of correctly classified instances | Can be misleading with class imbalance; general overview |
| Precision | True positives among all optimistic predictions | Crucial when false positives are costly (e.g., unnecessary procedures) |
| Recall (Sensitivity) | True positives among all actual positive instances | Critical when false negatives are costly (e.g., missing a diagnosis) |
| F1-Score | Harmonic mean of precision and recall | Balanced measure, useful with uneven class distributions |
| Specificity | True negatives among all actual negative instances | Essential for avoiding false alarms |
| AUC-ROC | Area under the Receiver Operating Characteristic curve | Robust measure of classifier performance, independent of threshold |
| Signal | Dataset | ML (Best) | DL (Best) | Metric | Reference |
|---|---|---|---|---|---|
| EEG | TUH EEG | SVM (0.93 ± 0.02) | CNN (0.96 ± 0.04) | AUC | [24,67,127] |
| ECG | MIT-BIH | Random Forest (0.94 ± 0.03) | 1-D CNN (0.91 ± 0.05) | F1 | [66,128] |
| EMG | Ninapro | SVM (0.89 ± 0.04) | RNN (0.92 ± 0.06) | Accuracy | [24] |
| TBS | AwakeOSA | Random Forest (0.82) | CNN (0.73) | Specificity | [126,129] |
| Step | Method/Features | Notes/Performance |
|---|---|---|
| Signal Acquisition | Microphone at suprasternal notch; band-pass filter (75–3000 Hz) | Reduces low-frequency body noise, high-frequency artifacts |
| Preprocessing | Segmentation of breath cycles; normalization | Ensures consistency across subjects |
| Time-Domain Features | RMS, ZCR, Peak Amplitude, Breath Duration, Breath Rate | Correlated with airflow intensity and obstruction |
| Frequency Features | PSD in (100–250 Hz) and (300–500 Hz) bands; Centroid | Detects turbulence and abnormal airflow patterns |
| Time–Frequency | STFT spectrogram features; Wavelet coefficients | Captures transient events and non-stationary components |
| Classifiers Tested | SVM (83.92% testing accuracy), Random Forests (81.4% testing accuracy), Regularized logistic regression (79.3% ± 6.1% testing accuracy) | SVM and RF show the best accuracy; Trees are the most interpretable |
| Challenge | Description | Potential Solutions |
|---|---|---|
| Noise and Artifacts | Motion artifacts, electrode noise, and environmental interference | Filtering, ICA, adaptive preprocessing, wavelet denoising |
| Non-Stationarity | Physiological signals vary dynamically over time | Time–frequency features, wavelets, adaptive feature extraction |
| Scalability | Manual feature engineering and some algorithms scale poorly with large datasets. | Automated feature selection, ensemble methods, dimensionality reduction (PCA/ICA) |
| Interpretability vs. Accuracy | Trade-off between transparent models and high-performance ensembles | Hybrid models, post hoc interpretability (SHAP, LIME), feature importance visualization |
| Temporal Dependencies | Difficulty capturing long-term dynamics | Window-based features, sequence models integrated with traditional ML |
| Toolbox | Supported Signals | Key Features |
|---|---|---|
| BioSPPy | ECG, PPG, EMG, resp. | Time, frequency, time-frequency, denoising |
| NeuroKit2 | EEG, ECG, EDA | Entropy, fractal, HRV, ML ready |
| PyWavelets | All | Customizable wavelet transforms |
| Dataset | Task/Signal | Best Algorithm | Accuracy (%) | Sensitivity (%) | Specificity (%) |
|---|---|---|---|---|---|
| MIT-BIH Arrhythmia | ECG classification | SVM, Random Forest | 97–99 | 96 | 98 |
| PhysioNet Sleep-EDF | Sleep staging/EEG | Random Forest | 88–92 | 86 | 91 |
| Respiratory Sound DB | Wheeze/Crackle | Random Forest, DT | 93–96 | 90 | 94 |
Disclaimer/Publisher’s Note: The statements, opinions and data contained in all publications are solely those of the individual author(s) and contributor(s) and not of MDPI and/or the editor(s). MDPI and/or the editor(s) disclaim responsibility for any injury to people or property resulting from any ideas, methods, instructions or products referred to in the content. |
© 2025 by the authors. Licensee MDPI, Basel, Switzerland. This article is an open access article distributed under the terms and conditions of the Creative Commons Attribution (CC BY) license (https://creativecommons.org/licenses/by/4.0/).
Share and Cite
Alqudah, A.M.; Moussavi, Z. Bridging Signal Intelligence and Clinical Insight: A Comprehensive Review of Feature Engineering, Model Interpretability, and Machine Learning in Biomedical Signal Analysis. Appl. Sci. 2025, 15, 12036. https://doi.org/10.3390/app152212036
Alqudah AM, Moussavi Z. Bridging Signal Intelligence and Clinical Insight: A Comprehensive Review of Feature Engineering, Model Interpretability, and Machine Learning in Biomedical Signal Analysis. Applied Sciences. 2025; 15(22):12036. https://doi.org/10.3390/app152212036
Chicago/Turabian StyleAlqudah, Ali Mohammad, and Zahra Moussavi. 2025. "Bridging Signal Intelligence and Clinical Insight: A Comprehensive Review of Feature Engineering, Model Interpretability, and Machine Learning in Biomedical Signal Analysis" Applied Sciences 15, no. 22: 12036. https://doi.org/10.3390/app152212036
APA StyleAlqudah, A. M., & Moussavi, Z. (2025). Bridging Signal Intelligence and Clinical Insight: A Comprehensive Review of Feature Engineering, Model Interpretability, and Machine Learning in Biomedical Signal Analysis. Applied Sciences, 15(22), 12036. https://doi.org/10.3390/app152212036


