1. Introduction
In modern manufacturing, weld grinding remains largely manual, resulting in inconsistency and inefficiency. The lack of comprehensive industrial datasets constrains the development of automated visual inspection systems. Hence, constructing an open, realistic weld dataset is essential for advancing intelligent welding.
The industrial environment of welding and grinding is harsh, and manual grinding has a severe adverse effect on workers’ health [
1,
2]. However, welding and grinding are basic intelligent manufacturing technologies. They are widely used across various applications in modern industry, including spacecraft, large rockets, new-energy vehicle components, subways, and complex bridges. In theory, intelligent control technology can enable industrial robots to replace humans in welding and weld grinding [
3,
4,
5]. However, many research results cannot be applied to the actual production scene because they lack specific cognition and judgment of the current work environment.
Vision-guided industrial robots collect images and videos of the current scene using cameras, parse the current working scene information through object detection, image segmentation, and semantic understanding, and transmit it to the control center to guide industrial robot operation. Therefore, the intelligent development of industrial manufacturing is inseparable from computer vision technology.
In the welding and grinding scene, visual understanding of welds [
6] is a prerequisite for further judgment and operation of welded parts. However, there are currently major obstacles in research on weld image learning, understanding, and analysis, most of which stem from the substantial lag in the study of weld image datasets relative to computer vision technology.
The advancement of computer-aided inspection in industrial manufacturing relies heavily on the availability of robust, comprehensive datasets. In weld quality control, X-ray imaging is a critical non-destructive testing method, and several public datasets have been established to facilitate the development of automated defect-detection algorithms. The WDXI dataset [
7] offers 13,766 16-bit TIF images covering seven defect types, but severe class imbalance hampers unbiased training. The GDXray-Welds dataset [
8] contains only 68 raw images; extensive manual cropping and annotation are required to generate usable patches, introducing inconsistency despite its successful use in deep-learning studies. The RIAWELC dataset [
9] provides 24,407 preprocessed 224 × 224 pixels images across four classes, achieving >93% classification accuracy, but its limited defect taxonomy limits its applicability to broader industrial scenarios. Collectively, these X-ray datasets focus on internal defects, exhibit class imbalance, demand heavy preprocessing, and lack comprehensive defect categories, limiting their utility for surface-based tasks such as weld-bead detection or reinforcement analysis.
In the field of weld seam detection and recognition, the construction of high-quality weld-surface datasets is a prerequisite for advancing computer vision algorithms. Recent studies have proposed several relevant datasets. The Welding Seams Dataset on Kaggle [
10] contains 1394 color images with a uniform resolution of 448 × 448 pixels. The dataset provides binary masks for weld-bead segmentation, but the masks are sparse and represent only straight-bead welds, preventing evaluation of multi-type classification. Annotation granularity is limited to coarse pixel masks without instance-level delineation. Walther et al. [
11] introduced a multimodal dataset that couples probe-displacement data with 32 × 32 pixels thermal images for 100 samples. The thermal modality captures the temperature field during laser-beam welding, yet the dataset annotates merely the overall weld quality as Sound or Unsound. No geometric or type labels are supplied, and the low spatial resolution restricts fine-grained feature learning. The MLMP Dataset [
12] consists of 1400 simulated cross-section profiles rendered at 480 × 450 pixels. Each sample includes precise geometric parameters derived from Flow-3D simulations, providing annotation accuracy that exceeds that of typical image-based labeling. However, because the data are synthetically generated, they cannot fully reproduce the texture, noise, and illumination variations encountered in real industrial environments. Moreover, the dataset does not contain explicit weld-type categories. Zhao et al. [
13] aggregated 1016 raw images sourced from open-source repositories, laboratory captures, and web crawling, then expanded the collection to 3048 images through data augmentation. The dataset supplies pixel-level semantic segmentation masks, enabling instance-aware training. Nevertheless, it lacks weld-type annotations, and the original image resolution is undisclosed, which hampers tasks that require high-precision spatial detail.
In general, these datasets suffer from several common shortcomings. They contain relatively few images—usually only a few hundred to a few thousand—which limits the amount of data available to train robust deep learning models. The image resolutions are low, ranging from 32 × 32 pixels to about 480 × 450 pixels, making it challenging to capture fine weld textures and subtle defects. The coverage of weld types is narrow, often representing only a single geometry or a binary quality label, and therefore does not reflect the diversity of real-world welding processes. The annotation details are coarse, typically limited to sparse binary masks or simple quality tags, and do not provide instance-level segmentation. These limitations hindered the creation of a universal dataset with multiple categories and high-precision weld surface information, and constrained progress in computer vision-driven weld inspection and intelligent welding applications.
To address this deficiency, in this paper, we established a weld surface image dataset, INWELD. The original dataset data were collected, sifted and processed, and annotated. The training, validation, and test sets were reasonably balanced with respect to weld geometry and welding methods. Ablation experiments in object detection and instance segmentation confirmed the effectiveness of the dataset’s balanced distribution. In addition, the performance of the multi-category annotation weld image dataset in object detection and instance segmentation was evaluated through experiments. The main contributions of this paper are as follows:
- (1)
A weld surface image dataset was established for the first time. The images were captured in the factory and subjected to detailed, intensive manual annotation, which can be used for object detection and instance segmentation.
- (2)
Based on actual industrial production, a dataset partitioning method was proposed to achieve a balanced distribution in terms of weld geometry and welding method, which has higher accuracy in object detection and instance segmentation than the usual random partitioning method.
- (3)
Multi-category annotations were added to the dataset, which achieved ideal prediction results in both object detection and instance segmentation tasks, and the geometry and welding method information of the weld being tested can be obtained without additional calculations.
The rest of this paper is organized as follows.
Section 2 introduces data acquisition and processing,
Section 3 performs balanced partitioning of the dataset,
Section 4 conducts experimental studies,
Section 5 discusses the result, and
Section 6 concludes the paper.
2. Data Acquisition and Processing
2.1. Data Collection
We visited six welding factories, including Shanxi Taiyuan Jinrong Robot Co., Ltd., and its partners, to capture on-site weld images.
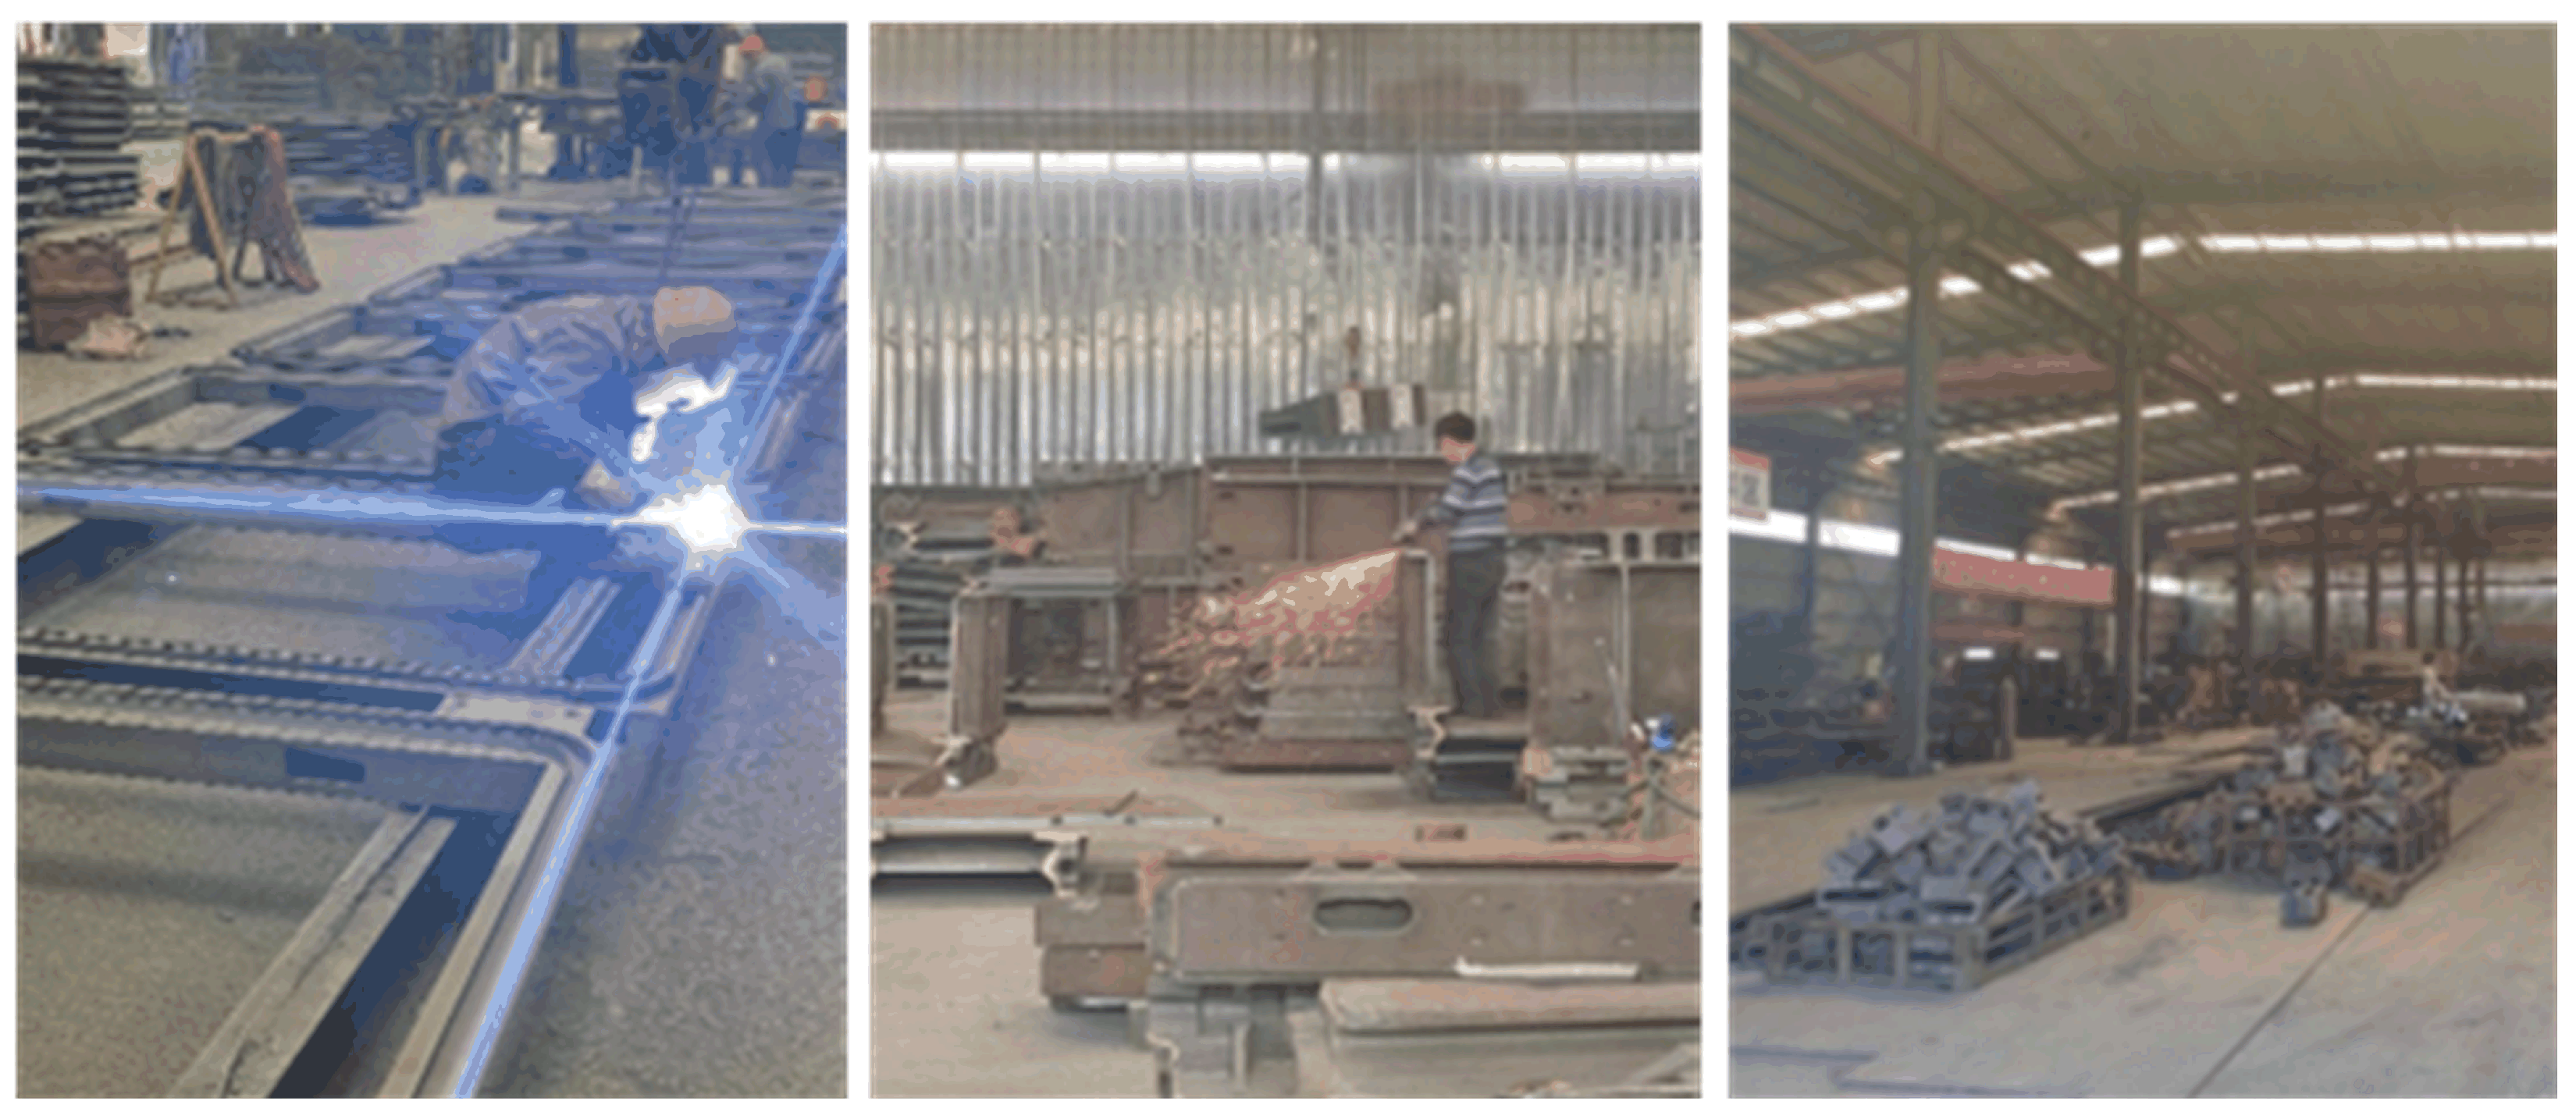
Figure 1 shows the shooting environment for weld photos. All images in the dataset were captured with a Xiaomi MIX 2 smartphone, Xiaomi, Beijing, China (12 MP rear camera, f/2.0 aperture, 27 mm equivalent focal length). All images were captured with a Xiaomi MIX 2 smartphone (12 MP rear camera, f/2.0 aperture, 27 mm equivalent focal length). The phone’s automatic exposure algorithm was used, resulting in varying ISO, shutter speed, and aperture across images. Photographs were taken under ambient natural light without artificial lighting. A variety of different weld geometries were collected, including flat straight welds, flat curved welds, space spliced straight welds, space curved welds, spot welds, etc. The welding methods mainly include manual arc welding, carbon dioxide shielded welding, and submerged arc welding.
We acquired a total of 17,811 original weld images. Each weld type does not appear in a single image. Some images contain multiple kinds of welds and multiple welds of the same type. In addition, most welds are long strips, except for spot welds, which makes it difficult for a single picture to capture a complete weld. In this case, each image includes a partial part of the weld, and the remaining part is shown in other photos. There is no need to splice a whole long weld, as the portions of the weld image are obtained and processed separately each time in the weld acquisition system.
2.2. Image Sifting and Processing
The original photos taken are screened and qualified. The screening criteria are as follows: (1) If the weld is not precise or the image is fuzzy, it will be judged as unqualified. (2) If multiple photos of a weld are taken at the same angle, select the clearest one. (3) If a long weld is photographed in sections and the differences between the sections are too small, they will be selectively deleted. The retention standard is that a new weld is visible to the naked eye. (4) When the image contains multiple welds, at least one precise weld will be retained, and welds that are not clear will be judged as unqualified. (5) If the same weld or weld combination is photographed at different shooting angles, and the difference between the angles is too small, they will be selectively deleted. The retention standard is based on the visible changes in vision angles and weld shapes. (6) When there are slag and powder obstructions on the weld, the retention standard is that the edge line is not damaged and can be identified by the naked eye.
After screening, a total of 9638 qualified images were obtained. Through rotation and cropping, the weld surface images were unified to 1440 × 1080 pixels to ensure the overall weld width was at least 100 pixels. Then the unified-size images were screened again, and a total of 8536 weld surface photos were obtained, including 900 holey weld images.
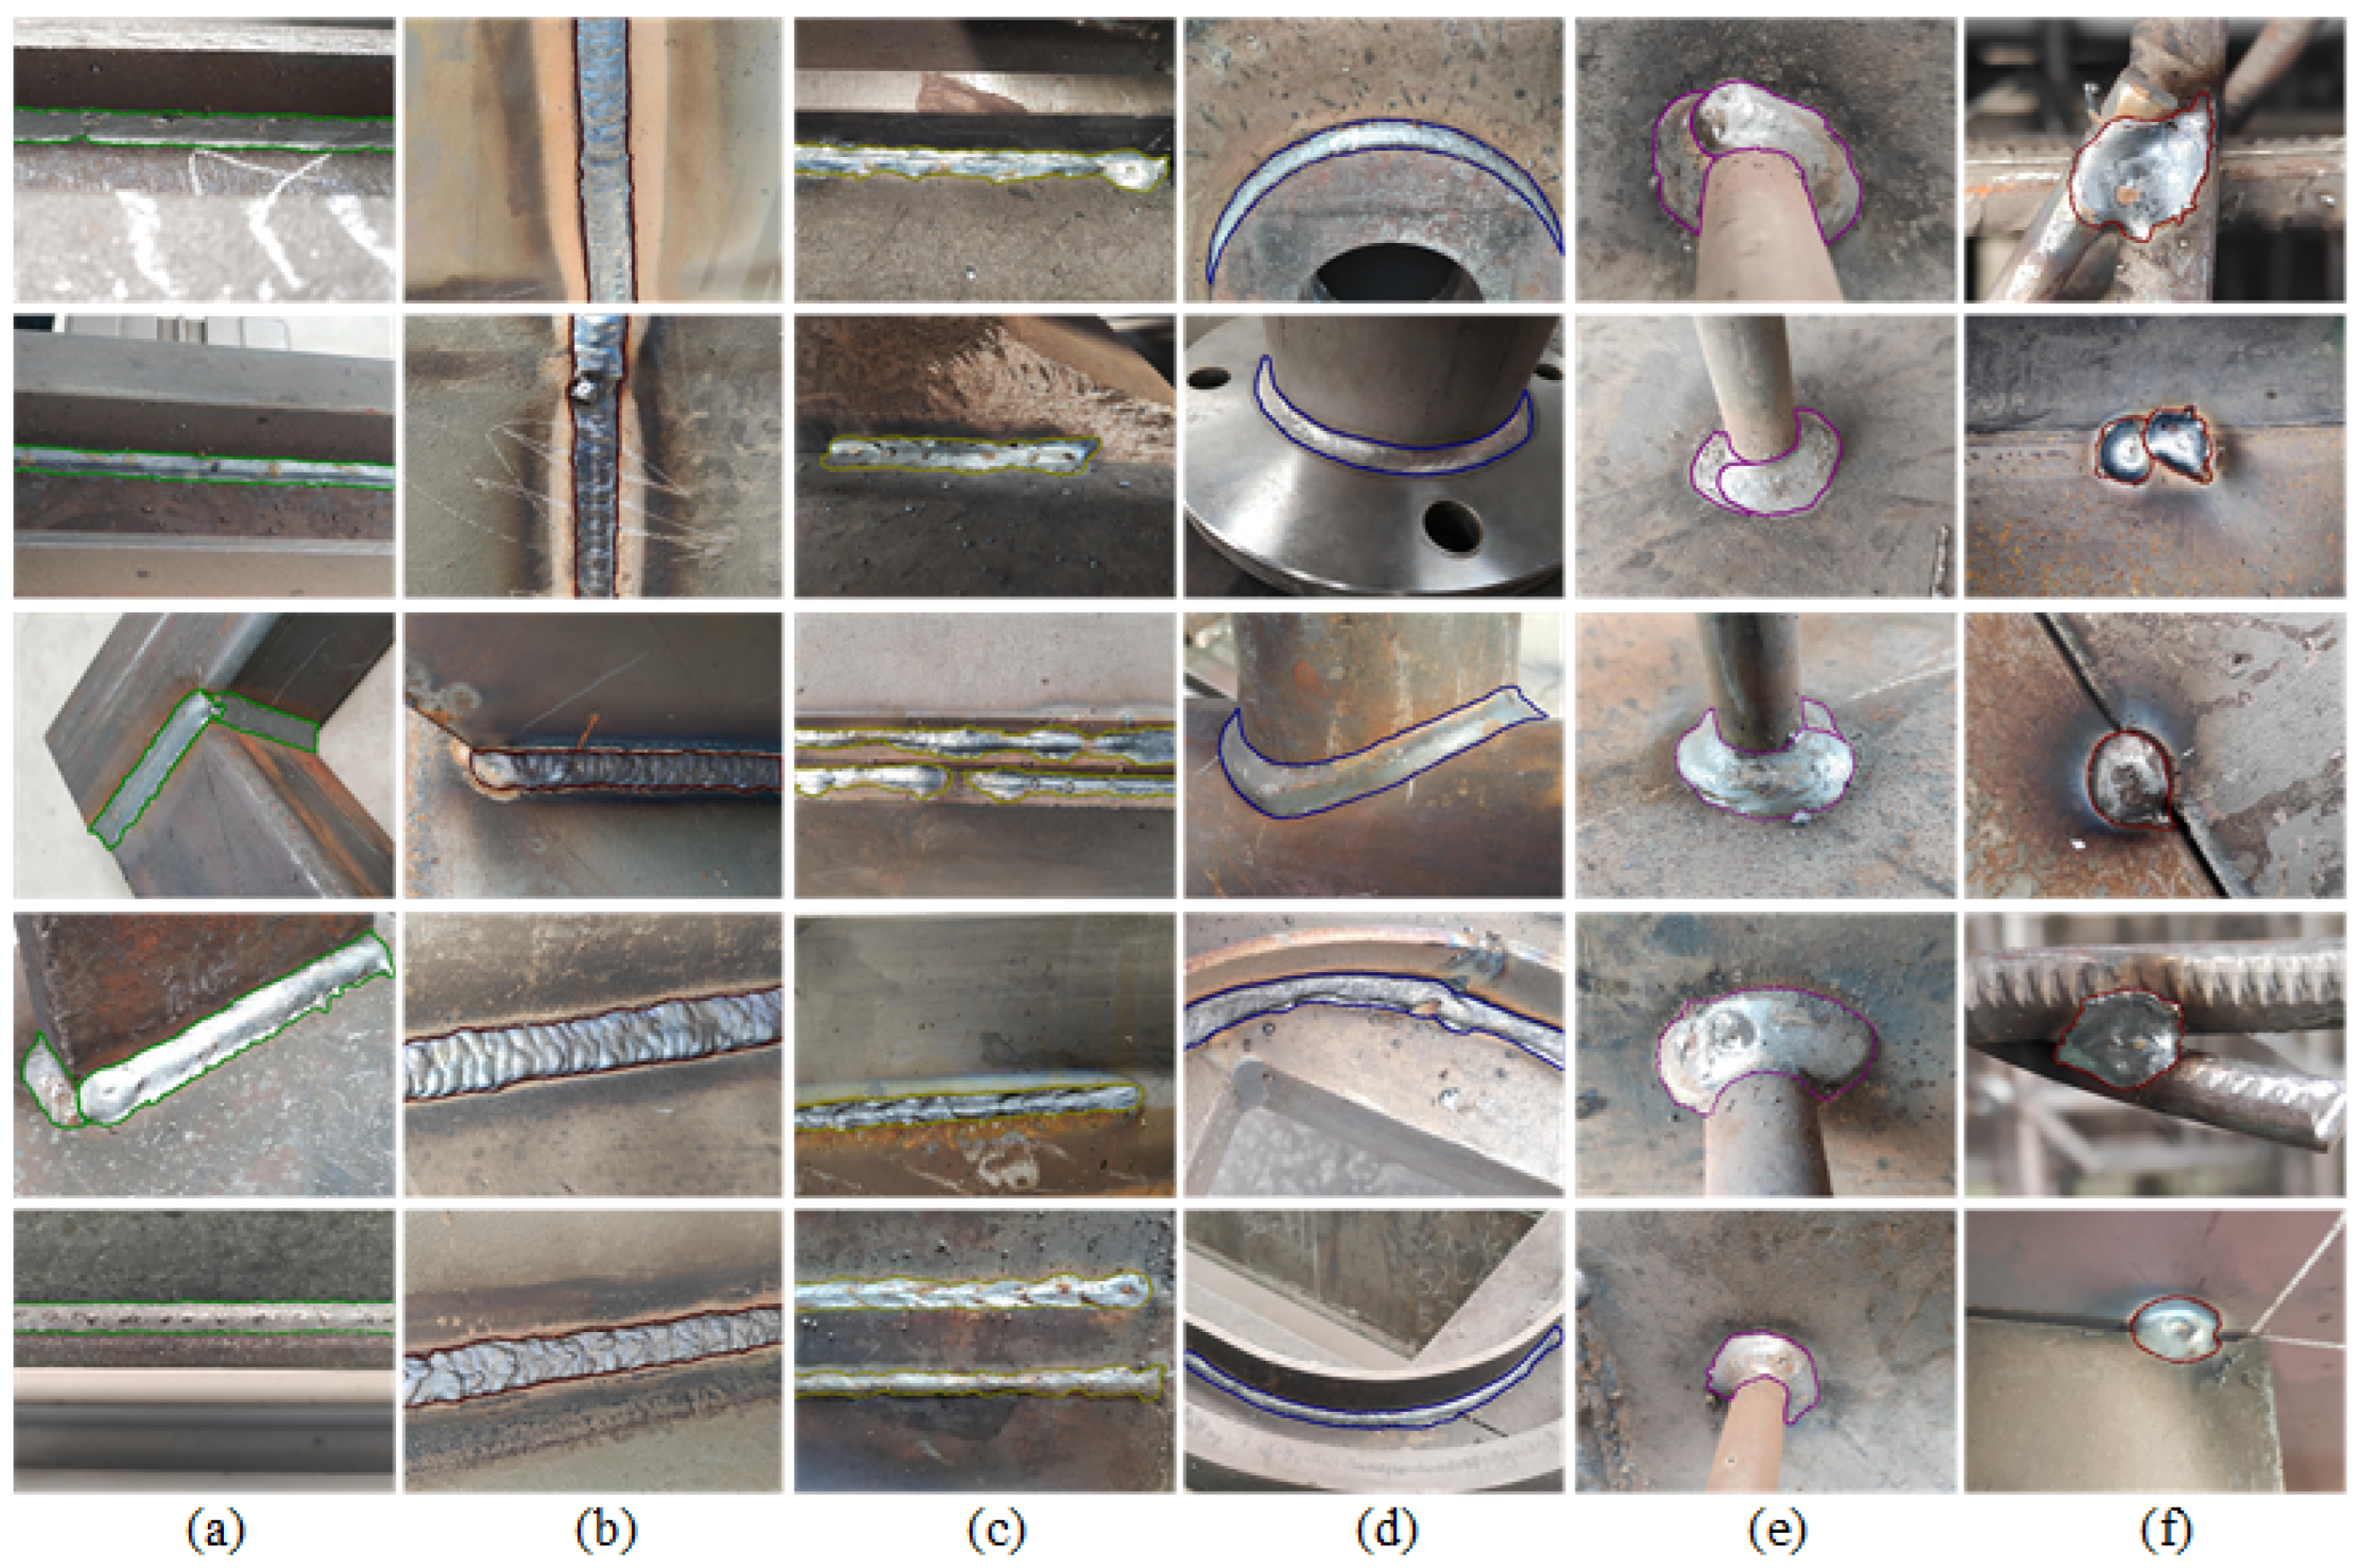
The final weld surface image mainly includes four geometric forms—spot welds, straight welds, curved welds, and holey welds—and three welding methods—CO
2 shielded welding, submerged arc welding, and manual arc welding. The distribution statistics of welds are shown in
Table 1. There are 17,133 weld instances total. From the perspective of geometry, there are 1054 spot welds, 9798 straight welds, 2956 curved welds, and 3325 holey welds. From the standpoint of welding methods, there are 7918 CO
2 shielded welds, 8751 manual arc welds, and 207 submerged arc welds. Among them, the spot weld and holey weld methods are both manual arc welding.
To restore the original industrial scene where the weld is located, we did not perform image processing on the dataset to adjust brightness and contrast, except for supplementing external light sources when natural light was insufficient. On the contrary, we aim to use raw images from natural industrial scenes while maintaining weld clarity.
2.3. Data Annotation
To ensure the professionalism and accuracy of the annotation, 12 mechanical engineering graduate students who are familiar with welding and have welding experience manually annotated the dataset. After the annotation was completed, it underwent multiple rounds of verification and modification to ensure its accuracy and precision. This process took a total of one year.
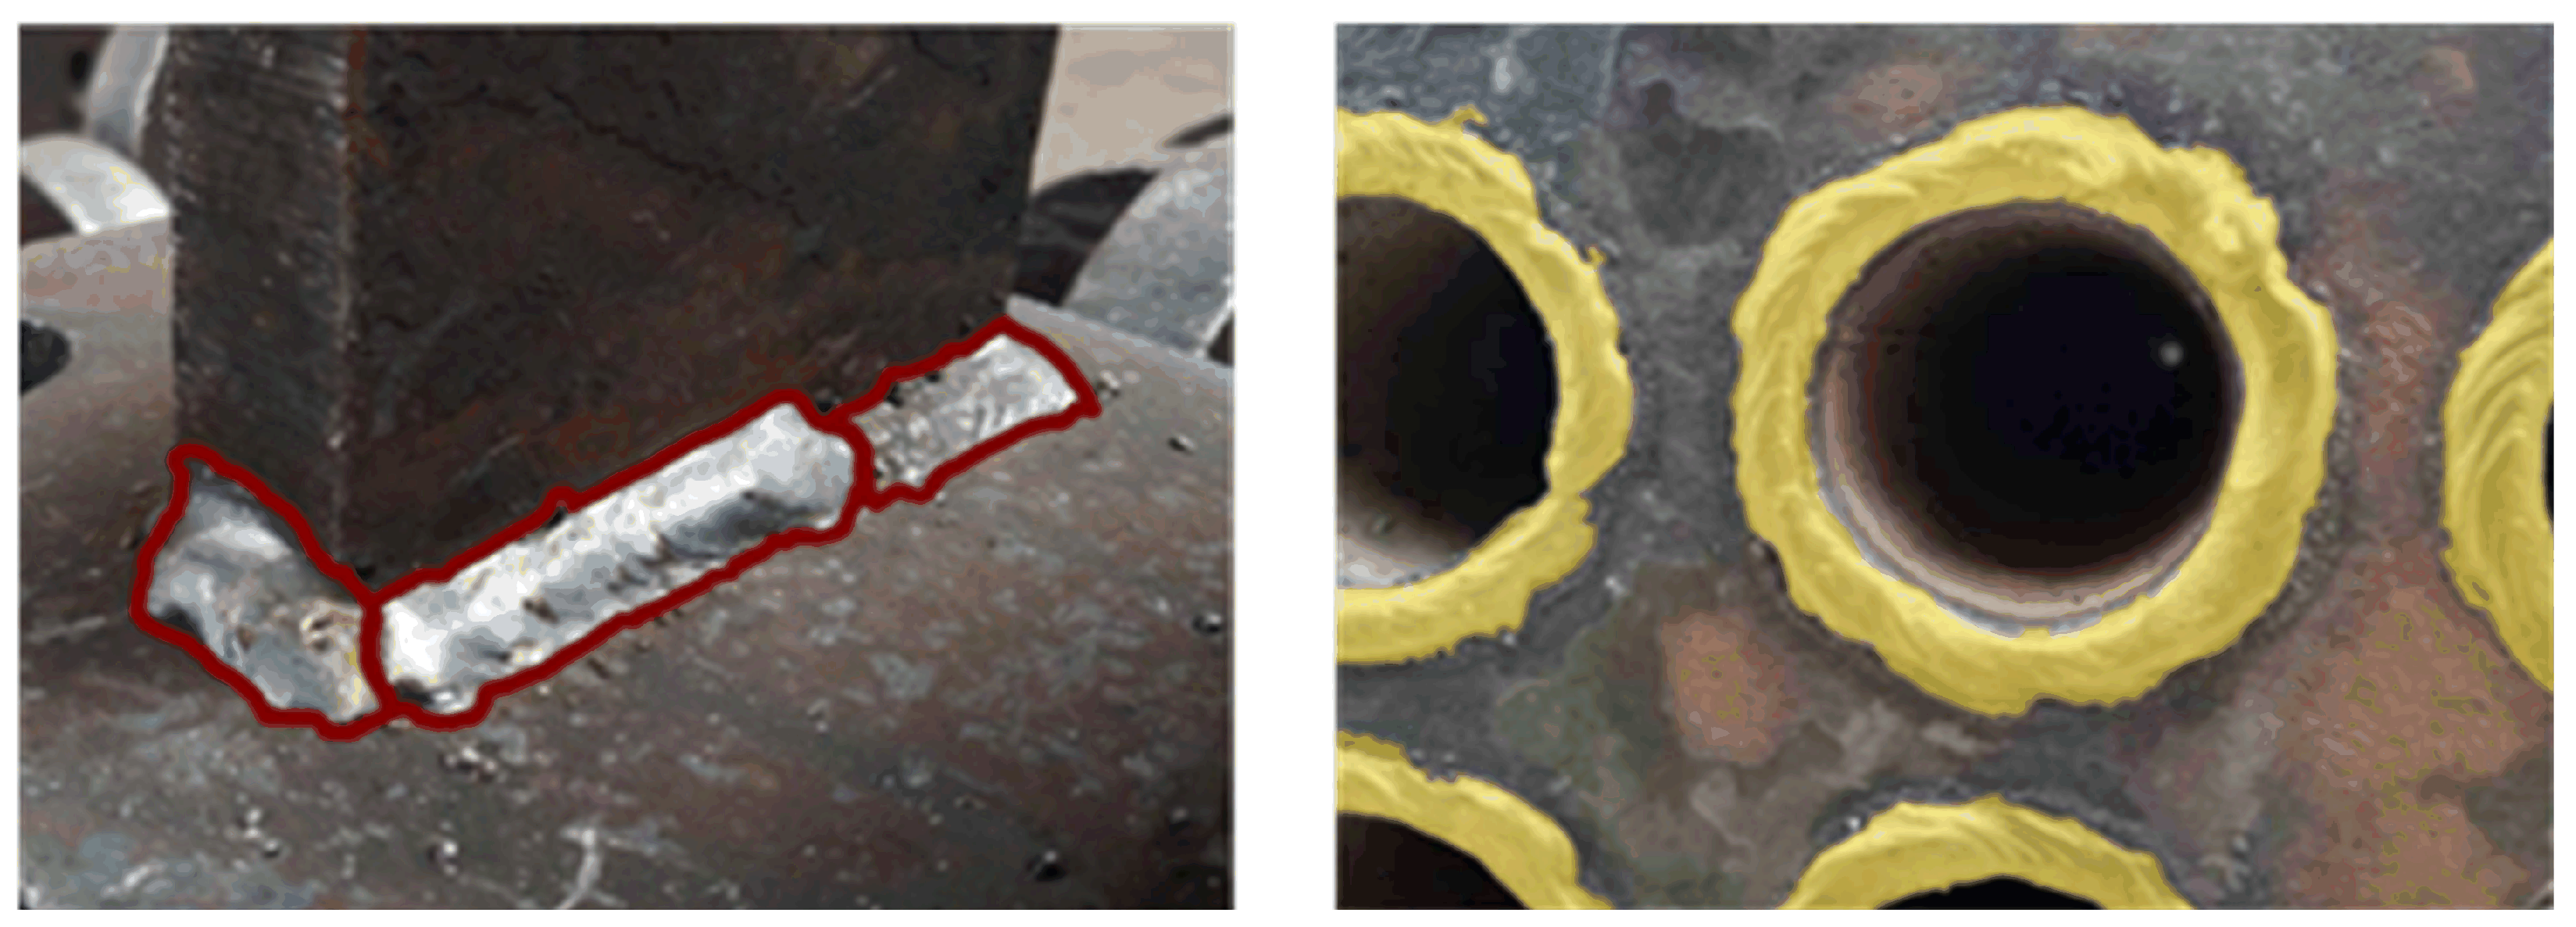
We manually annotate weld images into two categories, welds with holes and welds without holes, using polygonal annotations. For welds without holes, we use LabelMe [
14] for manual annotation, and for welds with holes, we use Supervisely [
15] for online manual annotation. The samples of densely annotated weld images are shown in
Figure 2. Among these, the left image is annotated in LabelMe with dense red points, and the right one is annotated in Supervisely with yellow areas.
A random 2% subset of the weld images (170 images) was independently labeled by all 12 annotators. Pairwise Intersection over Union (IoU) was computed for each image. The average IoU across the subset was 0.88, which exceeded the commonly used consistency threshold of 0.80 [
16,
17,
18].
To enhance the versatility of the weld surface image dataset, we converted the non-hole weld dataset annotation file into the COCO dataset format [
19] after completing the annotation. However, due to the limitation that the COCO dataset cannot represent objects with holes, we retained the original Supervisely data format for welds with holes.
3. Dataset Representative Split
Usually, the dataset is randomly split into a training set, a test set, and a validation set [
19]. However, this method is highly random and cannot guarantee balanced stability of the objects’ states across the three subsets, especially for highly uncertain weld images. Therefore, to divide the dataset more reasonably and ensure that each object detection and instance segmentation model can represent the variability across different welding methods and weld morphologies, we evenly distribute the 7636 non-porous weld images across the training, test, and validation sets [
20].
We design a balanced distribution of welding methods and weld geometries through basic allocation criteria. Specifically, all welding methods (including CO2 shielded welding, submerged arc welding, and manual arc welding) and all weld geometries (including spot welds, straight welds, and curved welds) are evenly distributed across the training, test, and validation sets in the same proportions. At the same time, the training, test, and validation sets are split in a 7:2:1 ratio. We obtain a balanced distribution of 5350 training images, 1523 test images, and 763 validation images, all with dense annotations in the COCO format.
5. Discussion
We conducted ablation experiments to compare the equal-distribution splitting strategy with a conventional random split of training, validation, and test sets. The balanced distribution approach significantly improves Average Precision for both object detection and instance segmentation, demonstrating that a more balanced dataset yields more reliable performance across algorithms. Subsequently, we evaluated the dataset under two annotation schemes: a single-category scheme, where all weld regions are labeled simply as “weld,” and a multi-category scheme that annotates eight classes based on welding type and weld geometry. Across five representative detectors and segmenters, both schemes achieve high detection accuracies, confirming the quality and completeness of the annotations. Error analysis reveals that most misclassifications occur between geometrically similar welds and between welds that share the same shape but differ in welding methods. The rare “curve-others” class, with very few training samples, exhibits the lowest AP, indicating that limited data for minority categories directly degrade performance. Although some welding methods are infrequently used in real production, resulting in fewer images and slightly lower performance for those classes, the probability of encountering such welds on the shop floor is minimal, so the overall impact on practical applications is negligible.
From an industrial perspective, the dataset can be leveraged as a weld-region detection and segmentation system that supports multiple downstream tasks. For facilities that only need to locate welds without distinguishing their type, the single-category annotation enables a lightweight detector to run on edge hardware for real-time weld localization, facilitating robotic tracking, automated welding-parameter logging, or downstream quality-control pipelines. When a production line uses multiple welding methods, multi-category annotations enable a single model to simultaneously classify both the geometric shape and the welding method, eliminating the need for separate detectors for each technique and simplifying system integration. Moreover, because the dataset provides explicit geometry and welding method labels, it can drive higher-level manufacturing operations such as automated weld polishing, in which the system can infer the appropriate polishing tool path and parameters for each detected weld region, ensuring consistent surface finish while avoiding over-polishing of delicate areas. This unified detection–segmentation framework thus serves as a versatile foundation for real-time inspection, flexible multi-process monitoring, and advanced robotic manipulation in modern welding factories.
In summary, the proposed weld image dataset, INWELD, available in both single- and multi-category formats, can offer a scientifically balanced, richly annotated resource for training robust object detection and instance segmentation models. The comprehensive evaluation across multiple algorithms confirms its suitability for a wide range of industrial scenarios, from basic weld localization to sophisticated process-aware robotic operations such as automated polishing. By addressing class imbalance through balance distribution splitting and providing detailed geometry and welding method annotations, the dataset not only advances research in weld-region perception but also facilitates practical deployment in contemporary manufacturing environments.
6. Conclusions
To achieve weld-object detection and instance segmentation in industrial scenarios, we have built the first weld-surface image dataset INWELD, collecting 17811 raw weld photographs and, after screening, retaining 8536 high-quality annotated images. The dataset is split into training, test, and validation sets in a ratio of 7:2:1. In comparative experiments between random and equilibrium data splits, CenterNet and YOLOv7 achieved AP50 of 89.8% and 81.3% under the equilibrium split. Mask R-CNN and Deep Snake achieved instance segmentation AP50 of 88.7% and 84.9%, respectively. Among which, Deep Snake achieved 3.3% improvement in AP50 over the random split, demonstrating that a balanced dataset markedly improves model robustness. In multi-category annotations, the AP50 of CenterNet and YOLOv7 exceeded 80%, while Mask R-CNN, YOLACT, and Deep Snake achieved AP50 of 61.9%, 69.5%, and 72.0%, respectively. At the same time, it enables joint prediction of weld geometry and welding process, which supports real-time weld localization, cross-process monitoring, intelligent post-processing, and predictive maintenance in manufacturing environments. However, the current collection is limited by relatively uniform indoor lighting and by samples drawn from factories in a single geographic region, which may affect generalization to more varied illumination conditions and material finishes. In the future, we will extend the dataset to include 3D weld surface acquisition and enrich it with diverse lighting and surface contamination scenarios to improve robustness and enable domain adaptation techniques.


