Article

Transient Prediction Model of Wellbore Temperature in Ultra-Deep Wells Considering Cementing Quality

1
Petroleum Engineering Technology Research Institute, Sinopec Northwest Oilfield Company, Urumqi 830000, China
2
Key Laboratory of Enhanced Recovery for Fracture-Cave Oil Reservoir, Sinopec, Urumqi 830000, China
3
College of Petroleum Engineering, China University of Petroleum (Beijing), Beijing 102249, China
4
College of Carbon Neutral Energy, China University of Geosciences (Beijing), Beijing 100083, China
5
School of Energy Resources, China University of Geosciences (Beijing), Beijing 100083, China
*
Authors to whom correspondence should be addressed.
Appl. Sci. 2025, 15(22), 12029; https://doi.org/10.3390/app152212029
Submission received: 16 September 2025 / Revised: 5 November 2025 / Accepted: 10 November 2025 / Published: 12 November 2025

Abstract

Deep and ultra-deep oil and gas reservoirs are characterized by extreme temperature and pressure conditions. During drilling, bottomhole temperatures often exceed the tolerance of downhole tools, leading to signal loss and damage to key components. Accurate prediction of the wellbore temperature field is therefore critical for ultra-deep drilling operations. Cementing quality significantly affects heat transfer between the wellbore and the formation, yet its influence is often neglected in existing prediction models. This study incorporates cementing quality into wellbore–formation heat transfer analysis, develops a method to calculate the effective thermal conductivity of cement, and establishes a transient heat transfer model based on energy conservation. The model is discretized and solved using the finite difference method. The effectiveness of the proposed model is validated against the Keller models, with a resulting relative error of 2.3%. Field data from three ultra-deep wells are used to evaluate the performance of the wellbore heat transfer model, incorporating cementing quality. The results indicate that the mean relative error of bottomhole temperature prediction is 0.77%, while that of outlet temperature prediction is 3.06%. This work provides an accurate method for predicting wellbore temperature profiles in ultra-deep wells and offers technical support for temperature-controlled drilling.

1. Introduction

Deep and ultra-deep formations have become key frontiers for current and future oil and gas exploration [1]. Owing to their abundant hydrocarbon resources, China holds significant potential for continued development in these challenging domains. According to the 2015 national oil and gas resource assessment, deep and ultra-deep reservoirs contain about 67.1 billion tons of oil equivalent, representing nearly 34% of the country’s total reserves [2]. However, drilling operations in such reservoirs are confronted with a range of technical challenges, including highly complex subsurface structures, severe formation fracturing, borehole instability, and difficulties in maintaining directional control [3]. Under high-temperature and high-pressure conditions, the cement slurry exhibits pronounced rheological changes that reduce displacement efficiency, accelerate fluid loss, and shorten the setting period, ultimately impairing cementing performance [4,5]. In addition, wellbore deformation, casing elasticity, and cement shrinkage can generate micro-gaps that degrade annular heat transfer, disrupt wellbore–formation thermal exchange, and induce problems such as fluid migration, reservoir energy loss, and compromised well integrity [6]. Consequently, integrating cementing quality into the prediction of wellbore temperature profiles is crucial for achieving reliable temperature-controlled drilling in ultra-deep wells.
Extensive studies have been conducted worldwide on predicting wellbore temperature profiles in ultra-deep wells. Currently, the most prevalent approaches include analytical models [7,8] and numerical simulations [9,10]. Analytical methods generally assume steady-state heat transfer between the wellbore and the surrounding formation. In reality, however, the temperature field evolves dynamically, making such simplified assumptions inadequate for accurate real-time prediction. Based on the Holmes–Swift model [11], Hasan and Kabir [12] analyzed wellbore temperature behavior for both forward and reverse circulation, while Spindler [7] incorporated the effects of fluid flow, annular convection, and conductive heat transfer in the formation. Despite these advances, both models used a simplified overall heat transfer coefficient to represent formation–annulus exchange and omitted the role of the cement in thermal coupling. Zhao et al. [13] established both analytical and numerical models to investigate heat transfer between the wellbore and formation, demonstrating that numerical simulations yield higher accuracy. Consequently, numerical methods have been increasingly employed for more realistic and comprehensive prediction of wellbore temperature profiles. A modeling approach was introduced by Abdelhafiz et al. [14] to evaluate convective heat transfer coefficients for laminar and turbulent regimes, accompanied by the development of transient analytical and numerical wellbore heat transfer models. Building upon this, Yang et al. [15,16] integrated parameters such as drill string structure, casing design, radial thermal gradients, and axial conduction to construct a more detailed transient model describing wellbore–formation heat exchange. The results demonstrated that variations in the fluid’s radial temperature gradient significantly impact the surrounding formation temperature, whereas axial conduction contributes minimally to the initial thermal distribution. To address the thermal behavior during cementing, Chen et al. [17] constructed a predictive model that considers formation temperature differences. Zhang et al. [18,19] and Li et al. [20] formulated transient wellbore–formation coupling models for abnormal conditions such as leakage, gas influx, and overflow, and investigated how the position of these events affects temperature variation along the wellbore. Although substantial progress has been made in transient wellbore–formation heat transfer modeling by considering factors such as flow regimes, casing configurations, and radial temperature distribution, most existing studies still assume constant cement thermal conductivity and overlook the effect of cementing quality on heat transfer. In practice, non-uniform cement bonding leads to depth-dependent variations in the effective thermal conductivity of the cement sheath. Furthermore, none of the existing models quantitatively integrate field-measured CBL data, which provide a direct evaluation of cement integrity.
Unlike previous studies that assumed uniform cement thermal conductivity, this study establishes a novel framework that couples cement bond logging (CBL) measurements with the thermal characteristics of the cement to improve the accuracy of wellbore temperature prediction in ultra-deep wells. The effective thermal conductivity is derived by translating CBL amplitude data into equivalent micro-gap widths, enabling the transient wellbore–formation heat transfer model to quantitatively reflect the impact of cementing quality on temperature variation. This integration provides a field-calibrated basis for more reliable temperature forecasting and regulation in ultra-deep well operations.

2. Model Development

2.1. Physical Model and Assumption

Figure 1 schematically illustrates the circulation process. Drilling fluid is injected into the drill pipe and flows downward, primarily transferring heat through convection with the drill pipe. After being ejected from the drill bit, the fluid then flows upward through the annulus, with heat transfer occurring primarily through convection with both the outer wall of the drill pipe and the wellbore wall. Heat transfer between solids is primarily conducted via conduction [21].
To establish the mathematical model more accurately and conveniently, it is necessary to simplify the physical model reasonably. The following assumptions are made:
(a)
The drilling fluid flows in one dimension through both the drill pipe and annulus, with convective heat transfer as the only consideration [21,22].
(b)
The drilling fluid is incompressible.
(c)
The static formation temperature is maintained at a sufficient distance from the wellbore.
(d)
The drill string is centered, and the wellbore has a regular shape.

2.2. Mathematical Model

Using the first law of thermodynamics, governing equations are formulated to describe heat transfer in the drilling fluid within the drill pipe and annulus, as well as in the drill pipe wall, casing, cement sheath, and surrounding formation. The heat transfer equations for each control unit are presented as follows:
(1)
Drilling fluids in drill pipe
The main contributors to changes in the internal energy of the drilling fluid within the drill pipe are the heat transported by fluid motion and the convective heat exchange with the pipe wall. This relationship can be expressed mathematically as follows [22]:
ρ m C m π r dp , i 2 T m t = ρ m V m π r dp , i 2 C m T m z + 2 π r dp , i h m - dp T dp T m
(2)
Drill pipe wall
The temperature of the drill pipe wall is primarily governed by the convection heat transfer between the drilling fluid and both the inner and outer walls of the drill pipe, as well as the axial heat conduction within the pipe. The governing equation for this process can be expressed as follows [22,23]:
ρ dp C dp π r dp , o 2 r dp , i 2 T dp t = λ dp π r dp , o 2 r dp , i 2 2 T dp z 2 + 2 π r dp , i h m - dp T m T dp + 2 π r dp , o h dp - a T a T dp
(3)
Drilling fluids in the annulus
The temperature of the drilling fluid in the annulus is mainly governed by convective heat exchange with the drill pipe and wellbore walls, as well as by the heat transported along with the fluid flow. The corresponding heat transfer equation can be written as follows [23]:
ρ m C m π r ca 1 , i 2 r dp , o 2 T a t = ρ m V a π r ca 1 , i 2 r dp , o 2 C m T a z + 2 π r dp , o h dp - a T dp T a + 2 π r ca 1 , i h a - ca T ca 1 T a
(4)
Casing
Factors influencing the casing temperature include axial heat conduction, convection heat transfer between the drilling fluid and the casing, and heat conduction between the casing and the cement. The governing heat transfer equation for the casing can be expressed as follows [21,24]:
ρ ca C ca π r ca 1 , o 2 r ca 1 , i 2 T ca 1 t = λ ca π r ca 1 , o 2 r ca 1 , i 2 2 T ca 1 z 2 + 2 π r ca 1 , i h a - ca T a T ca 1 + 2 π r ca 1 , o λ ca 1 ce 1 T ce 1 T ca 1 r ca 2 , i r ca 1 , i / 2
where λca1−ce1 represents the equivalent thermal conductivity between the first casing layer and the first cement layer, which can be calculated as follows [24]:
λ ca 1 ce 1 = r ca 2 , i r ca 1 , i r ca 2 , i r ca 1 , o / k + r ca 1 , o r ca 1 , i / λ ca
(5)
Cement
The thermal behavior of the cement is mainly controlled by axial heat conduction within the cement itself and conductive heat exchange with the casing. The corresponding heat transfer equation can be expressed as follows [21,22]:
ρ ce C ce π r ca 2 , i 2 r ca 1 , o 2 T ce 1 t = k π r ca 2 , i 2 r ca 1 , o 2 2 T ce 1 z 2 + 2 π r ca 2 , i λ ce 1 ca 2 T ca 2 T ce 1 r ca 2 , o r ca 1 , o / 2
where λce1−ca2 is the combined thermal conductivity between the first layer of cement and the second layer of casing, which can be expressed as follows [24]:
λ ce 1 ca 2 = r ca 2 , o r ca 1 , o r ca 2 , o r ca 2 , i / λ ca + r ca 2 , i r ca 1 , o / k
(6)
Formation
Formation heat transfer can be modeled as cylindrical wall heat transfer, and its expression can be written as follows [24]:
ρ f C f T f t = λ f 2 T f z 2 + λ f r r r T f r

2.3. Initial and Boundary Conditions

Properly defined initial and boundary conditions are crucial for solving the above governing equations of wellbore heat transfer across different formations.
(1)
Initial condition
When the drilling fluid is stationary in the wellbore, the initial temperature of each heat transfer control unit is assumed to be equal to the static formation temperature (SFT) [22].
T m z , t = 0 = T g + G f z T dp z , t = 0 = T g + G f z T a z , t = 0 = T g + G f z T ca z , t = 0 = T g + G f z T ce z , t = 0 = T g + G f z T f z = T g + G f z
(2)
Boundary conditions
The inlet boundary condition is defined by the wellhead inlet temperature (ILT):
T m z = 0 , t = T in
At the bottom of the well, the temperature of the drilling fluid inside the drill pipe and in the annulus are the same, and equal to the temperature of the drill pipe [22,25]:
T m z = L , t = T dp z = L , t = T a z = L , t
The temperature of the formation at a certain distance from the wellbore is the SFT [21]:
T f r , z , t r r = 0

2.4. Overall Thermal Conductivity of the Cement Considering Cement Quality

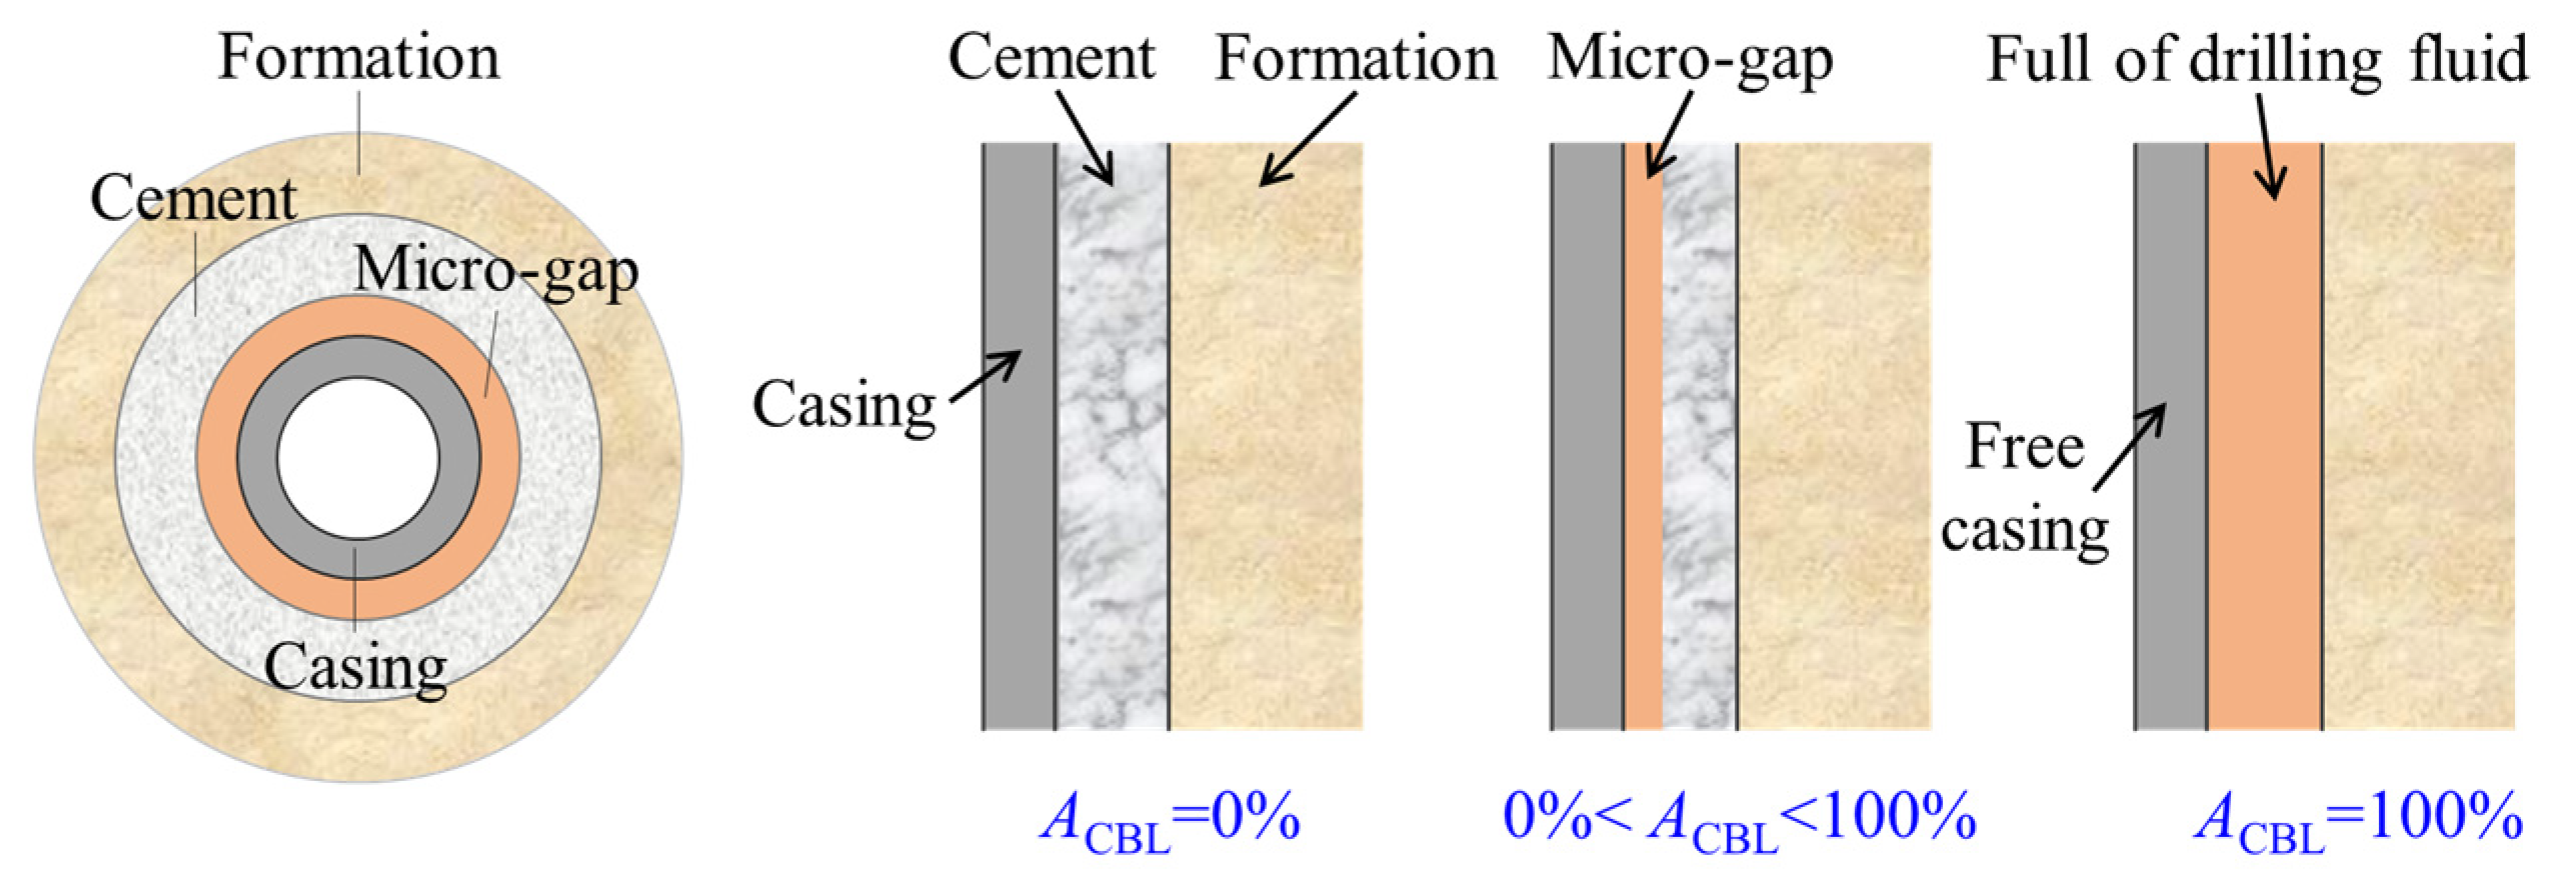
Cement bond logging (CBL) is the primary method for evaluating cementing quality. The measured data is a relative value, representing the percentage of the acoustic amplitude at the target well section relative to the amplitude at the free casing. The calculation method is as follows:
A CBL = Target   well   sec tion   amplitude Free   casing   sec tion   amplitude × 100 %
The above formula indicates that a smaller CBL value corresponds to better cementing quality. A CBL of 100% suggests no cementing and the casing is a free casing, as shown in Figure 2.
For the cement control volume, the CBL amplitude is simplified as the micro-annulus width, and the effective thermal conductivity is calculated using the thermal resistance method, as illustrated in Figure 3.
Heat transfer between the micro-gap and cement occurs in two stages: (a) Heat transfer from the outer surface of the cement to the outer surface of the micro-gap (i.e., the inner surface of the cement). (b) Heat transfer from the outer boundary of the micro-gap to its inner surface. The heat flux Φ through each stage in series is assumed to be equal [21,26].
Φ = A λ m A CBL r f r ca , o T ca T s
Φ = A λ ce 100 A CBL r f r ca , o T s T f
By rewriting Equations (14) and (15) in terms of temperature and pressure and eliminating the wall temperature Ts, the following expression is obtained:
Φ = A T ca T f A CBL r f r ca , o λ m + 100 A CBL r f r ca , o λ ce = A k T ca T f
The overall heat transfer coefficient k is given by the following:
k = 1 A CBL r f r ca , o λ m + 100 A CBL r f r ca , o λ ce

2.5. Convective Heat Transfer Coefficient

The CHTC is mainly calculated by the Nusselt number, thermal conductivity, and hydraulic diameter, which can be expressed as follows:
h = N u λ D h
When the flow pattern is laminar, Incropera et al. [27] suggest that for a constant wall temperature boundary, the Nusselt number is 3.66, and for a constant wall heat flux boundary, the Nusselt number is 4.36.
When the flow pattern is turbulent, Gnielinski [28] derived the expressions for calculating the Nusselt number in a circular tube and an annulus, as shown in Equation (19) and Equation (21), respectively:
N u dp = f dp / 8 R e dp 1000 P r dp 1 + 12.7 f dp / 8 0.5 P r dp 2 / 3 1
where fdp is calculated as follows:
f dp = 1.82 log R e dp 1.64
N u an = f an / 8 R e an P r an 1 + D h / L 2 / 3 F an k 1 + 12.7 f an / 8 0.5 P r an 2 / 3 1
where Dh, k1, fan, Rean*, Fan, and η can be calculated as follows.
D h = 2 r o r i
k 1 = 1.07 + 900 Re an 0.63 1 + 10 P r an
f an = 1 1.8 log R e an 1.5 2
R e an = Re an 1 + η ln η + 1 η 2 1 η 2 ln η
F an = 0.75 η 0.17 , η = r i r o

2.6. Auxiliary Equations

(1)
Drilling fluid properties
The Sorelle model [29] is used to calculate drilling fluid density under high-temperature and high-pressure conditions.
ρ T , P = ρ 0 + 3.32 × 10 3 T T 0 + 2.37 × 10 5 P P 0 / 6895 8.35 × 10 3
The Bingham model is used to characterize the drilling fluid rheology, and the Minton model [30] is applied to evaluate its plastic viscosity under high-temperature and high-pressure conditions.
μ = 0.736 μ 0 e 0.011 T T 0 + 6.4 × 10 6 P P 0 6895
The temperature-dependent models for the thermal conductivity and specific heat capacity of the drilling fluid are expressed as follows [31]:
λ = 1.37 × 10 3 T + 0.31 ρ + 0.24
C = 6.24 T 1227.53 ρ + 3536.7
(2)
Formation properties
In the drilling process, variations in lithology lead to significant differences in rock density and temperature-dependent thermal properties. Tiskatine et al. [32] established calculation models for the physical property parameters of various lithologies, as shown in Table 1.

3. Model Solution and Validation

3.1. Model Solution

The governing equations for heat transfer in each control unit are solved using the finite difference approach, where first-order derivatives are approximated with backward differences and second-order derivatives with central differences. Once discretized, these equations can be represented in the following unified form [33]:
A i , j n t T i , j n t + B i , j n t T i , j 1 n t + C i , j n t T i , j + 1 n t + D i , j n t T i 1 , j n t + E i , j n t T i + 1 , j n t = F i , j n t T i , j n t 1
The governing equations for all control volumes are assembled into matrix form and solved iteratively using the Gauss–Seidel method, together with the prescribed initial and boundary conditions. This procedure provides the temperature distribution within each control volume across different depths and times [21].

3.2. Model Validation

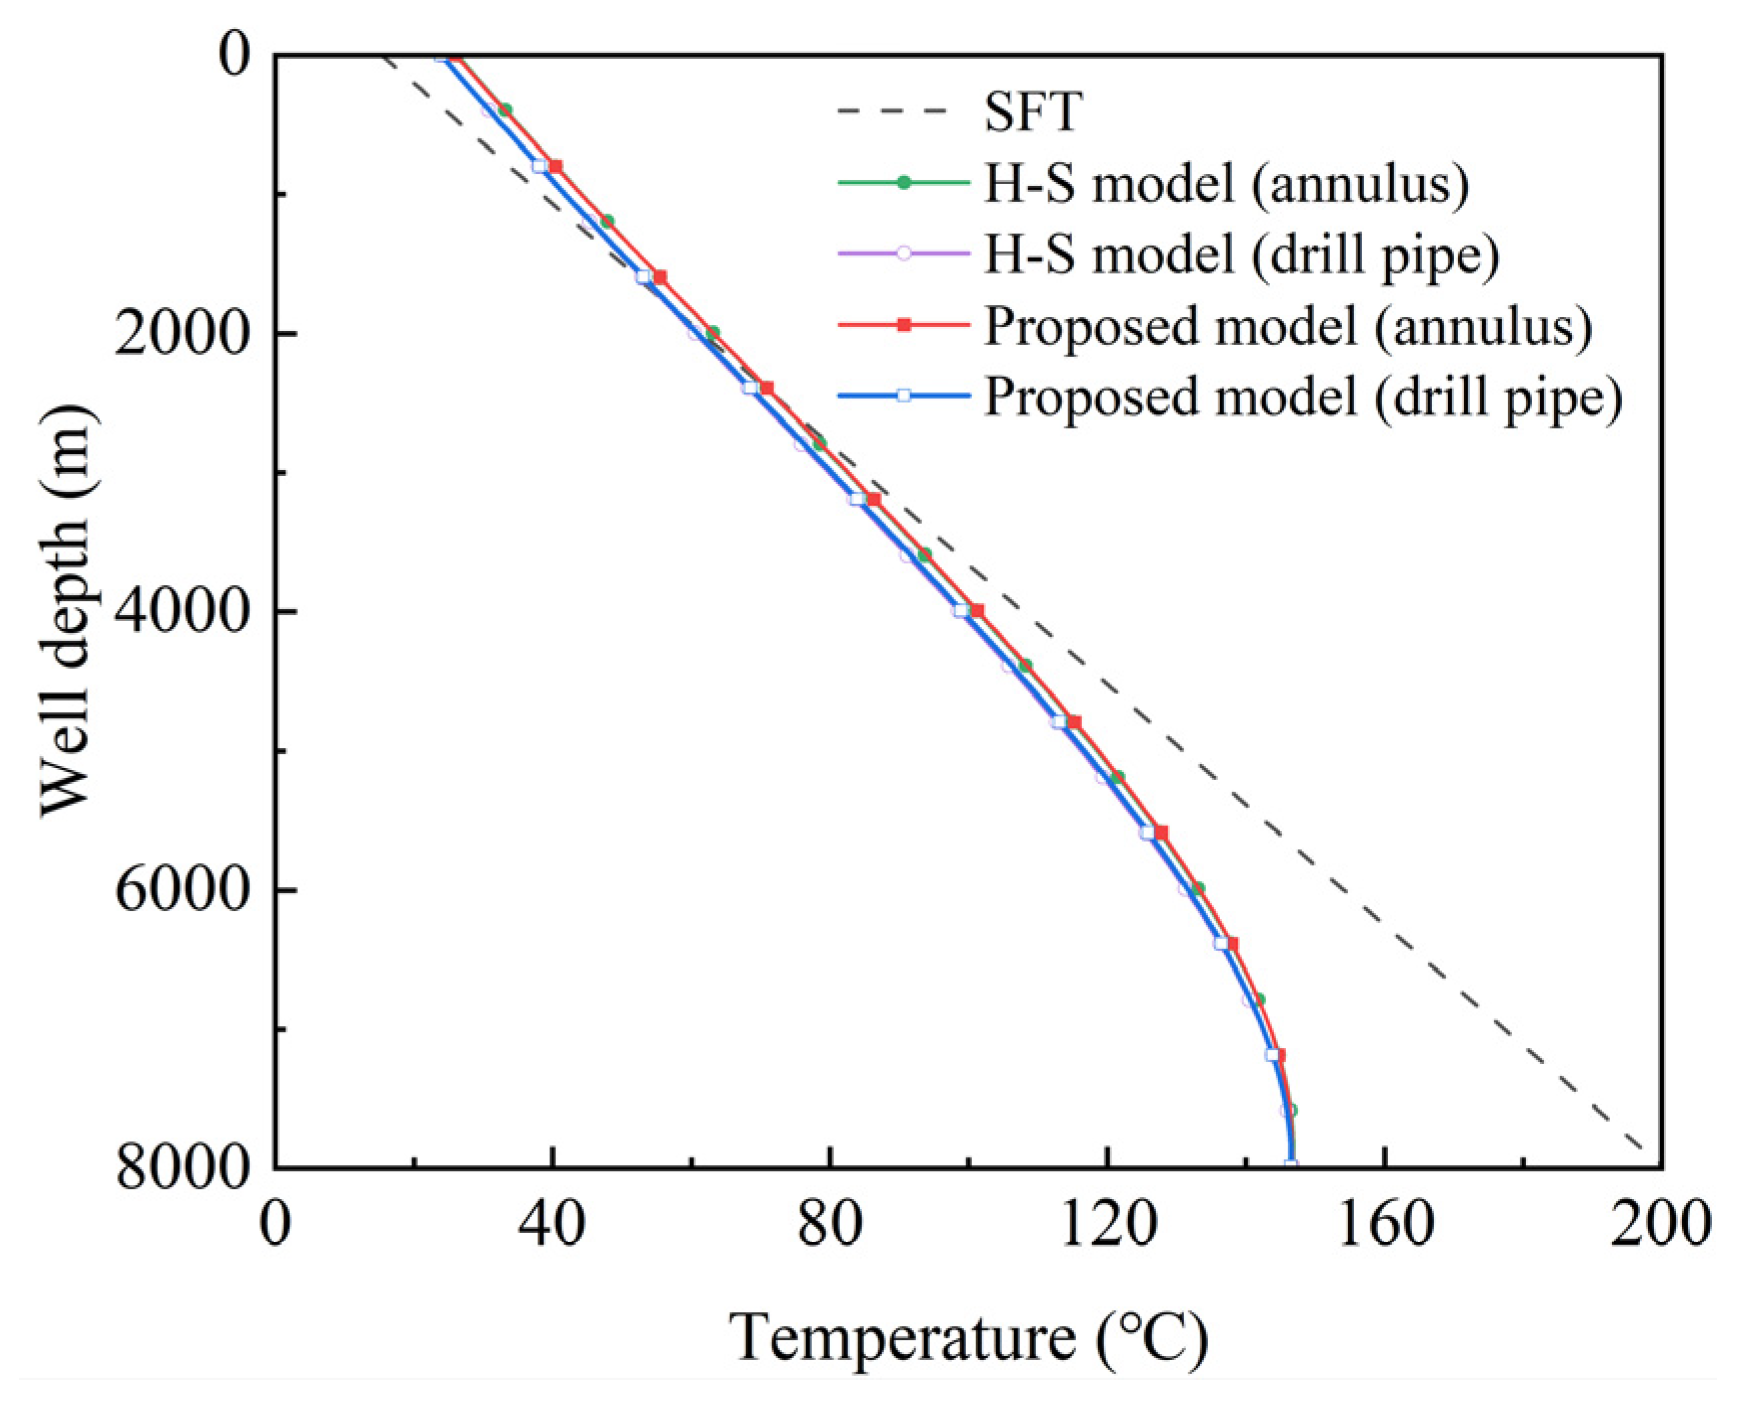
The Holmes & Swift model [11] is a steady-state analytical approach for predicting wellbore temperature, which does not consider cementing quality, drill pipe wall thickness, or the impact of wellbore temperature on the surrounding formation. For the purpose of comparison and validation, the proposed model is adjusted to steady-state conditions by extending the circulation time and simplifying the system to exclude cementing quality, pipe wall thickness, and formation effects. The key parameters used for model verification are summarized in Table 2, and the corresponding comparison results are shown in Figure 4.
As illustrated in Figure 4, the proposed model predicts an annular outlet temperature (OLT) of 26.00 °C and a BHT of 146.52 °C. In comparison, the Holmes & Swift model yields 26.22 °C and 146.73 °C, respectively. The root mean square error (RMSE) is 0.149 °C for the annular temperature and 0.323 °C for the drill pipe temperature. The relative error (RE) between the two models remains below 1%, and their temperature profiles show strong agreement, demonstrating the reliability and accuracy of the proposed model.
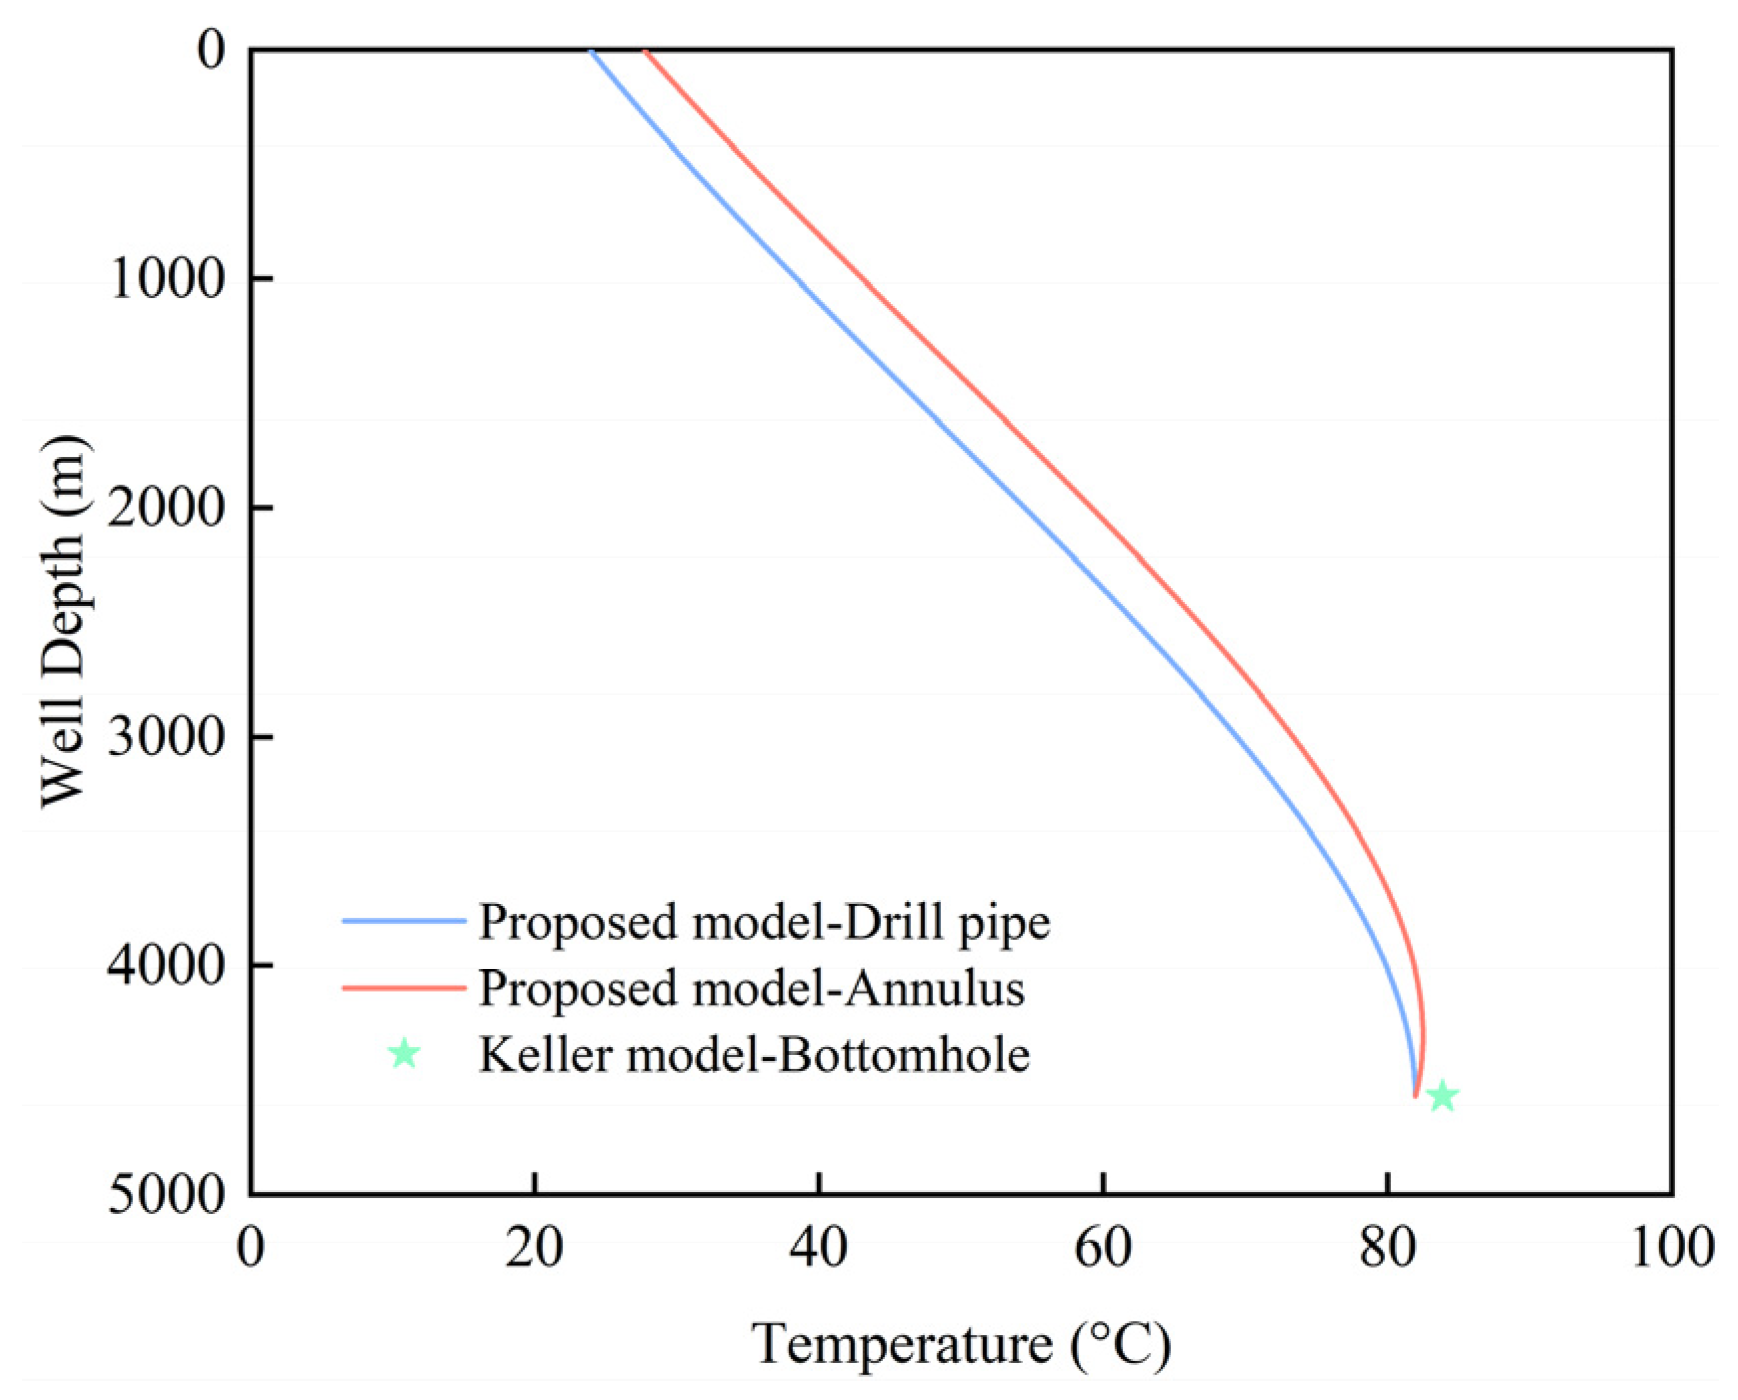
The proposed model was further validated against a transient Keller model. In this case, the well depth was 4572 m, with a convective heat transfer coefficient of 340.7 W/m2/°C between the drilling fluid inside the drill pipe and the pipe wall, and 5.7 W/m2/°C between the annular drilling fluid and the drill pipe wall and casing. Additional input parameters are summarized in Table 2, and the corresponding validation results are presented in Figure 5.
As illustrated in Figure 5, after 24 h of circulation, the BHT predicted by the proposed model is 81.96 °C, compared with 83.89 °C predicted by the Keller model. The absolute error (AE) between the two results is 1.93 °C, corresponding to a relative error (RE) of 2.3%.

4. Application Cases of Shunbei Oilfield

This study employs field data from three ultra-deep wells in the Shunbei block of the Northwest Oilfield, together with their CBL measurements, to validate the proposed transient wellbore–formation heat transfer model that incorporates cementing quality.

4.1. Case Study—Shunbei Well A

Shunbei Well A is an ultra-deep directional well reaching a measured depth of 8543 m and a true vertical depth of 8296 m, with a limestone formation as the target reservoir. The well’s casing program is outlined in Table 3.
The drill string in the 8425–8516 m section of Shunbei Well A is composed of 10 m of Φ120.6 mm non-magnetic drill collars (NMDCs), 755 m of Φ88.9 mm drill pipe, 415 m of Φ88.9 mm heavy-weight drill pipe (HWDP), 3500 m of Φ88.9 mm drill pipe, 1070 m of Φ127 mm drill pipe, and 2766 m of Φ139.7 mm drill pipe. The thermal properties of the various heat transfer media within this well are summarized in Table 4.
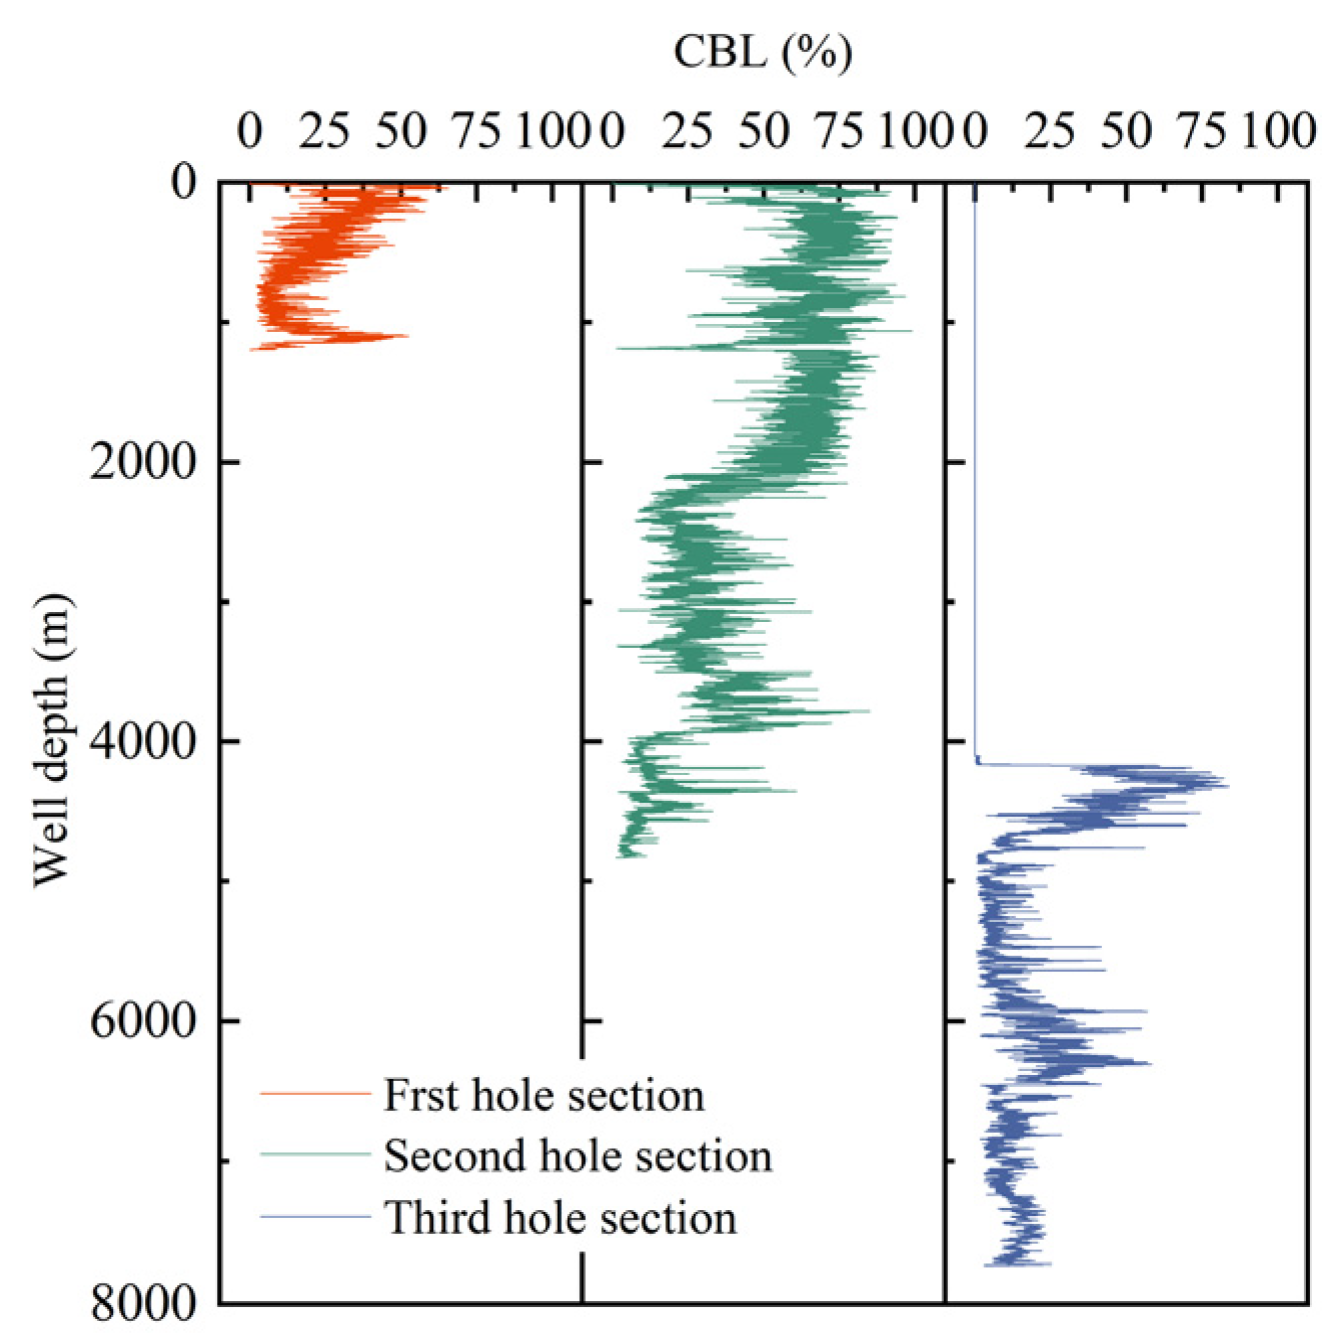
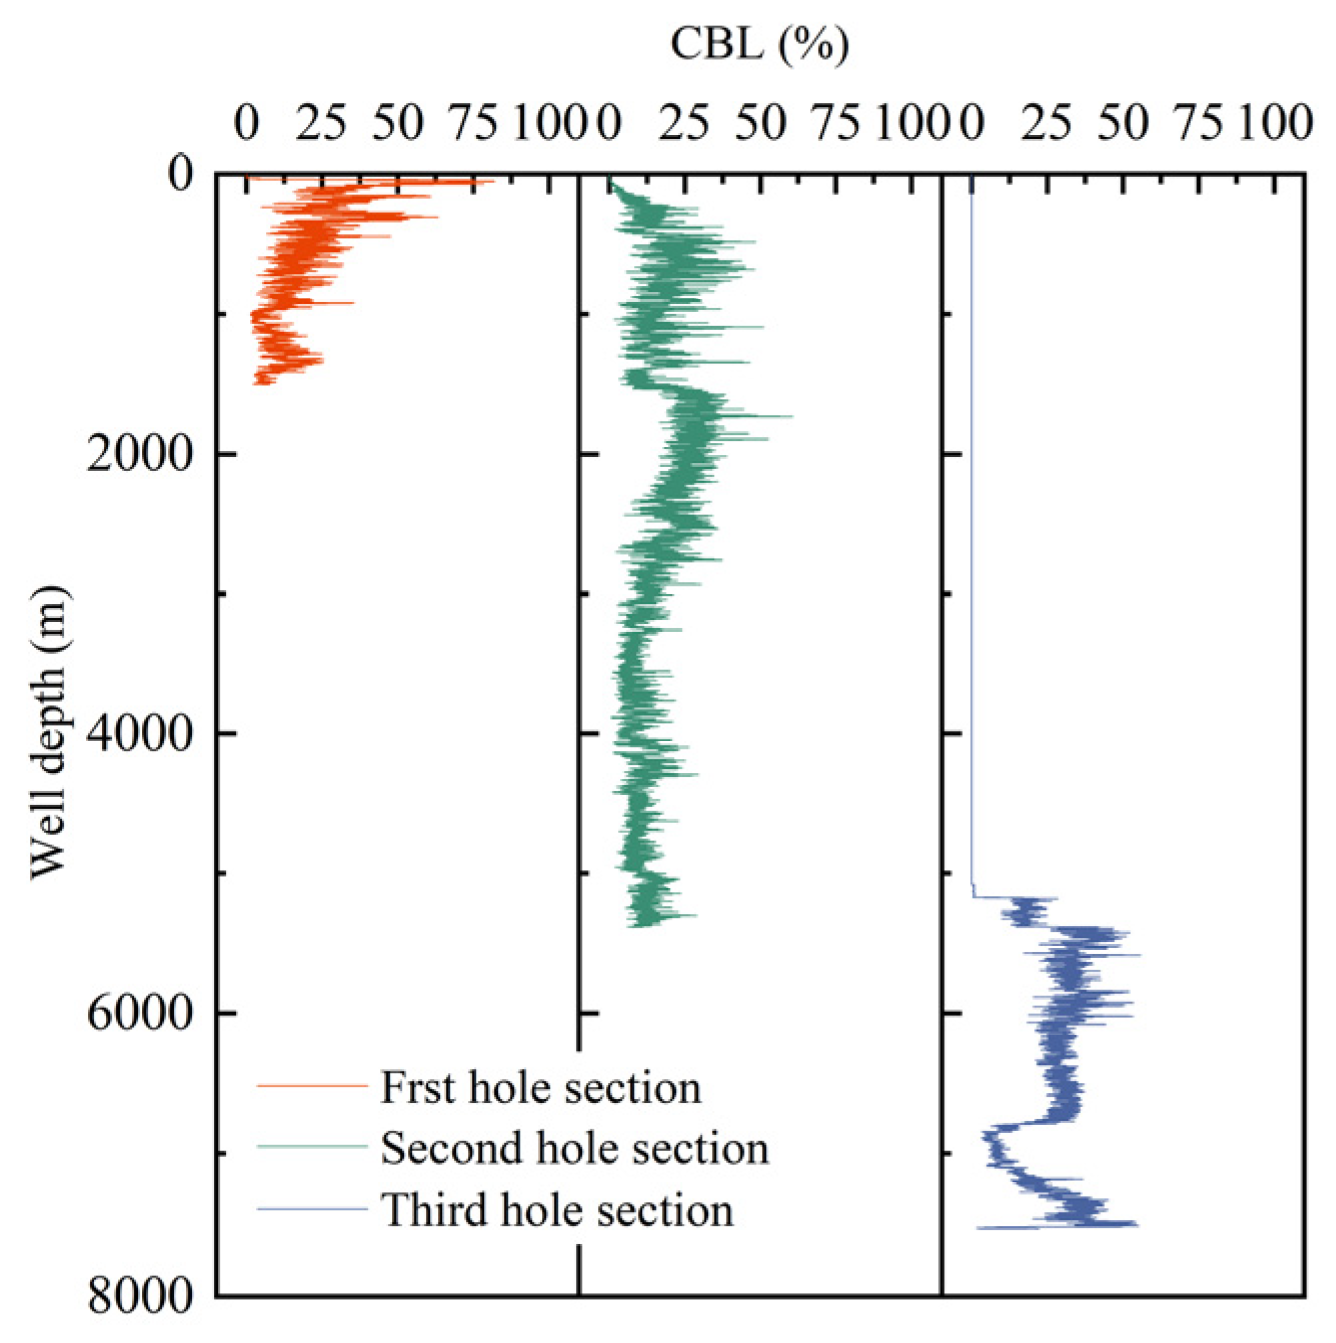
Figure 6 shows the CBL curves for the intermediate casing across three different well sections of Shunbei Well A. These data can be used to evaluate cementing quality and to determine the effective thermal conductivity of the cement.
During the drilling and circulation process in this well section, the drilling fluid has a plastic viscosity of 22 mPa·s, an injection flow rate of 15 L/s, and an ILT of 34 °C. After 22 h of circulation, the measurement while drilling (MWD) measured a BHT of 160 °C at the 8516 m depth, and an OLT of 35 °C. Using the temperature logging as the SFT, along with the casing program in Table 2, the thermophysical property parameters in Table 3, and the aforementioned data, these are input into the formation–wellbore heat transfer model. The calculated results are shown in Figure 7.
Figure 7 presents the predicted temperature distributions of the annular and drill pipe fluids using formation–wellbore heat transfer models that consider and neglect cementing quality. When cementing quality is considered, the predicted BHT and OLT are 161.90 °C and 33.93 °C, respectively. Compared with the measured data, the AEs for BHT and OLT are 1.90 °C and 1.07 °C, corresponding to REs of 1.19% and 3.06%.
When cementing quality is not considered, the predicted BHT and OLT are 164.29 °C and 33.76 °C, respectively. In this case, the AEs for BHT and OLT increase to 4.29 °C and 1.24 °C, with REs of 2.68% and 3.54%. These results indicate that accounting for cementing quality improves the accuracy of BHT prediction by 1.49% and that of OLT prediction by 0.48%.

4.2. Case Study—Shunbei Well B

Shunbei Well B is an exploratory well in the Shuntuoguole Uplift of the Tarim Basin. It is drilled to a total depth of 8287 m, with a vertical depth of 7834 m and a core height of 13.7 m. During the 20th drilling run, between 8108 and 8234 m, the primary lithology is limestone. The casing program and borehole enlargement are provided in Table 5.
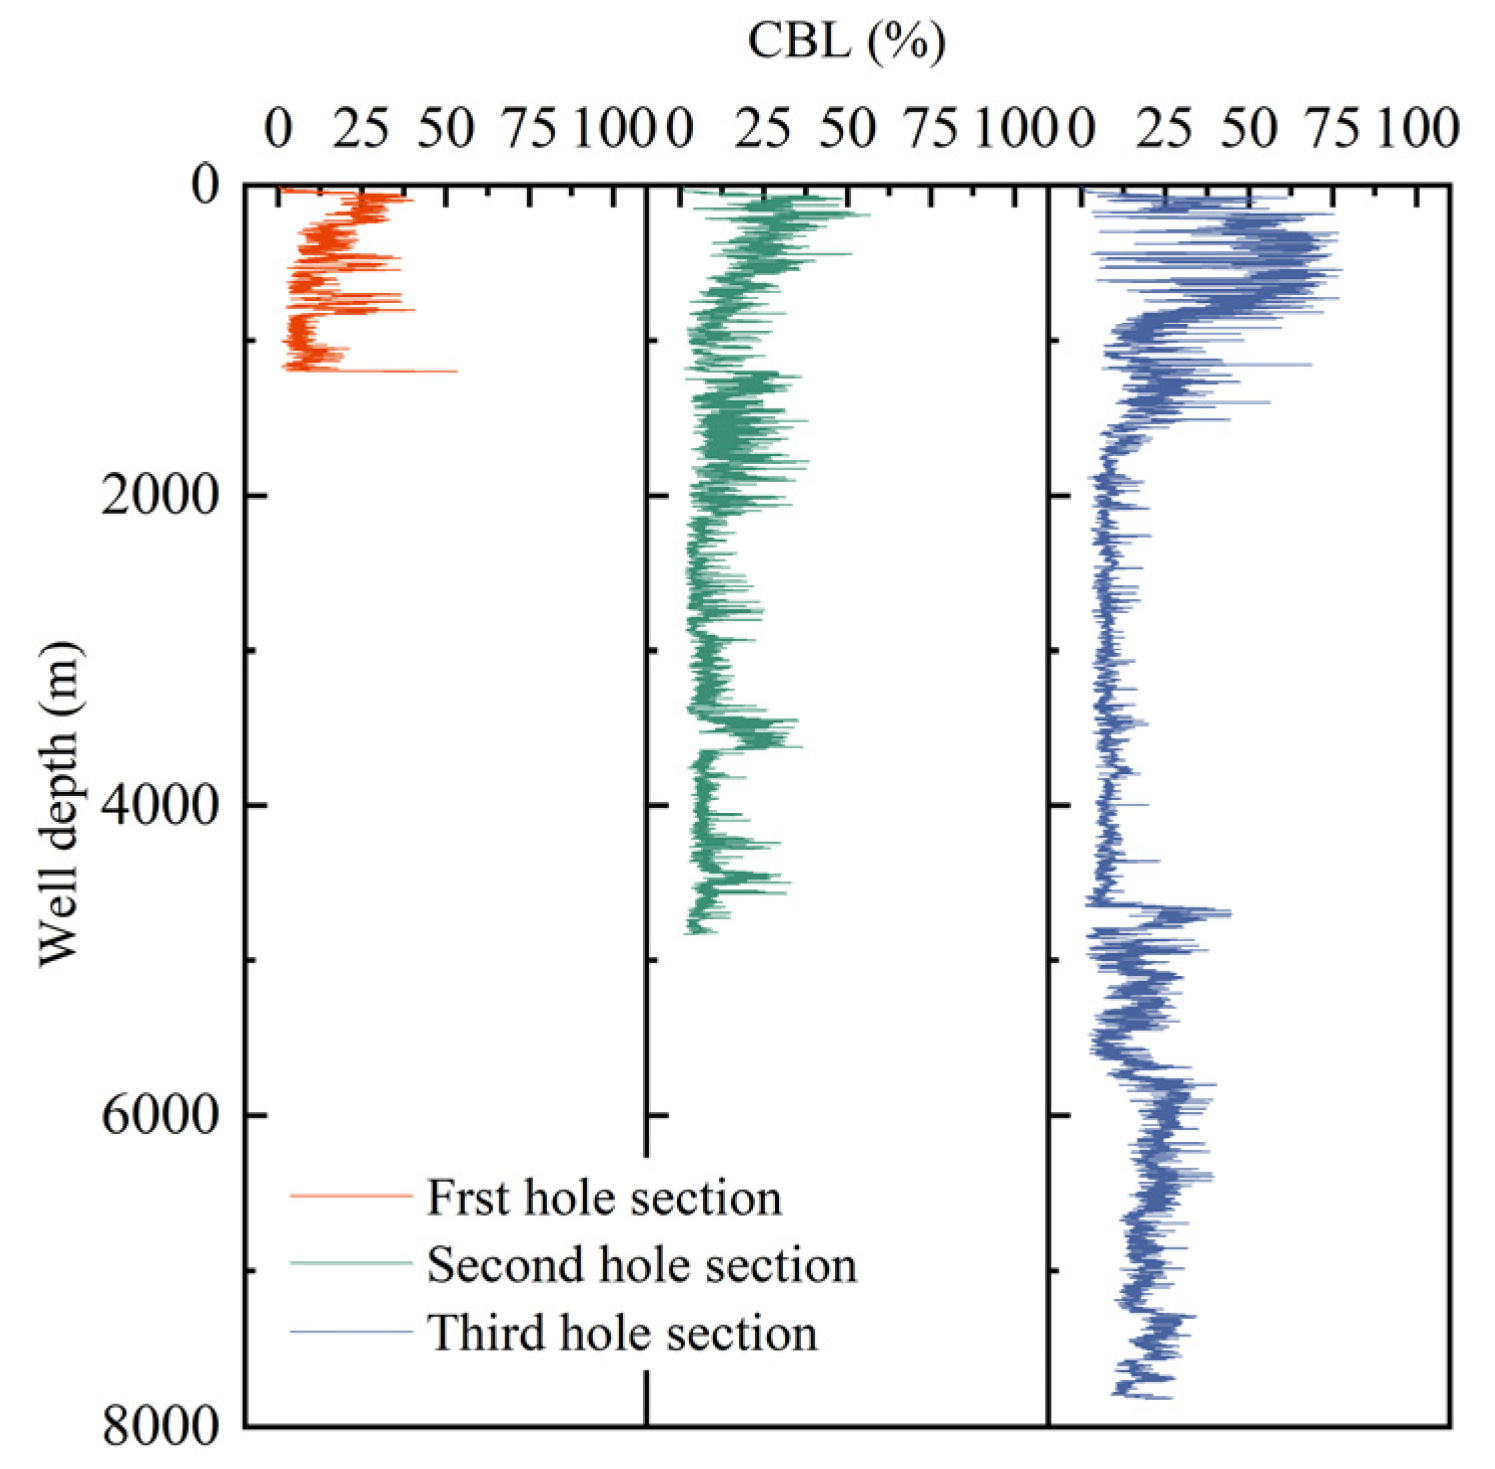
The drill string assembly for this well section consisted of Φ149.2 mm bit + Φ120 mm positive displacement motor (PDM) + Φ121 mm NMDC + Φ101.6 mm drill pipe + Φ88.9 mm HWDP + Φ101.6 mm drill pipe + Φ139.7 mm short drill pipe. The thermal properties of the drilling fluid, drill pipe, casing, cement, and formation are summarized in Table 6. Figure 8 presents the CBL curves from three well sections of Shunbei Well B, providing insights into the cementing quality and wellbore integrity along the depth intervals.
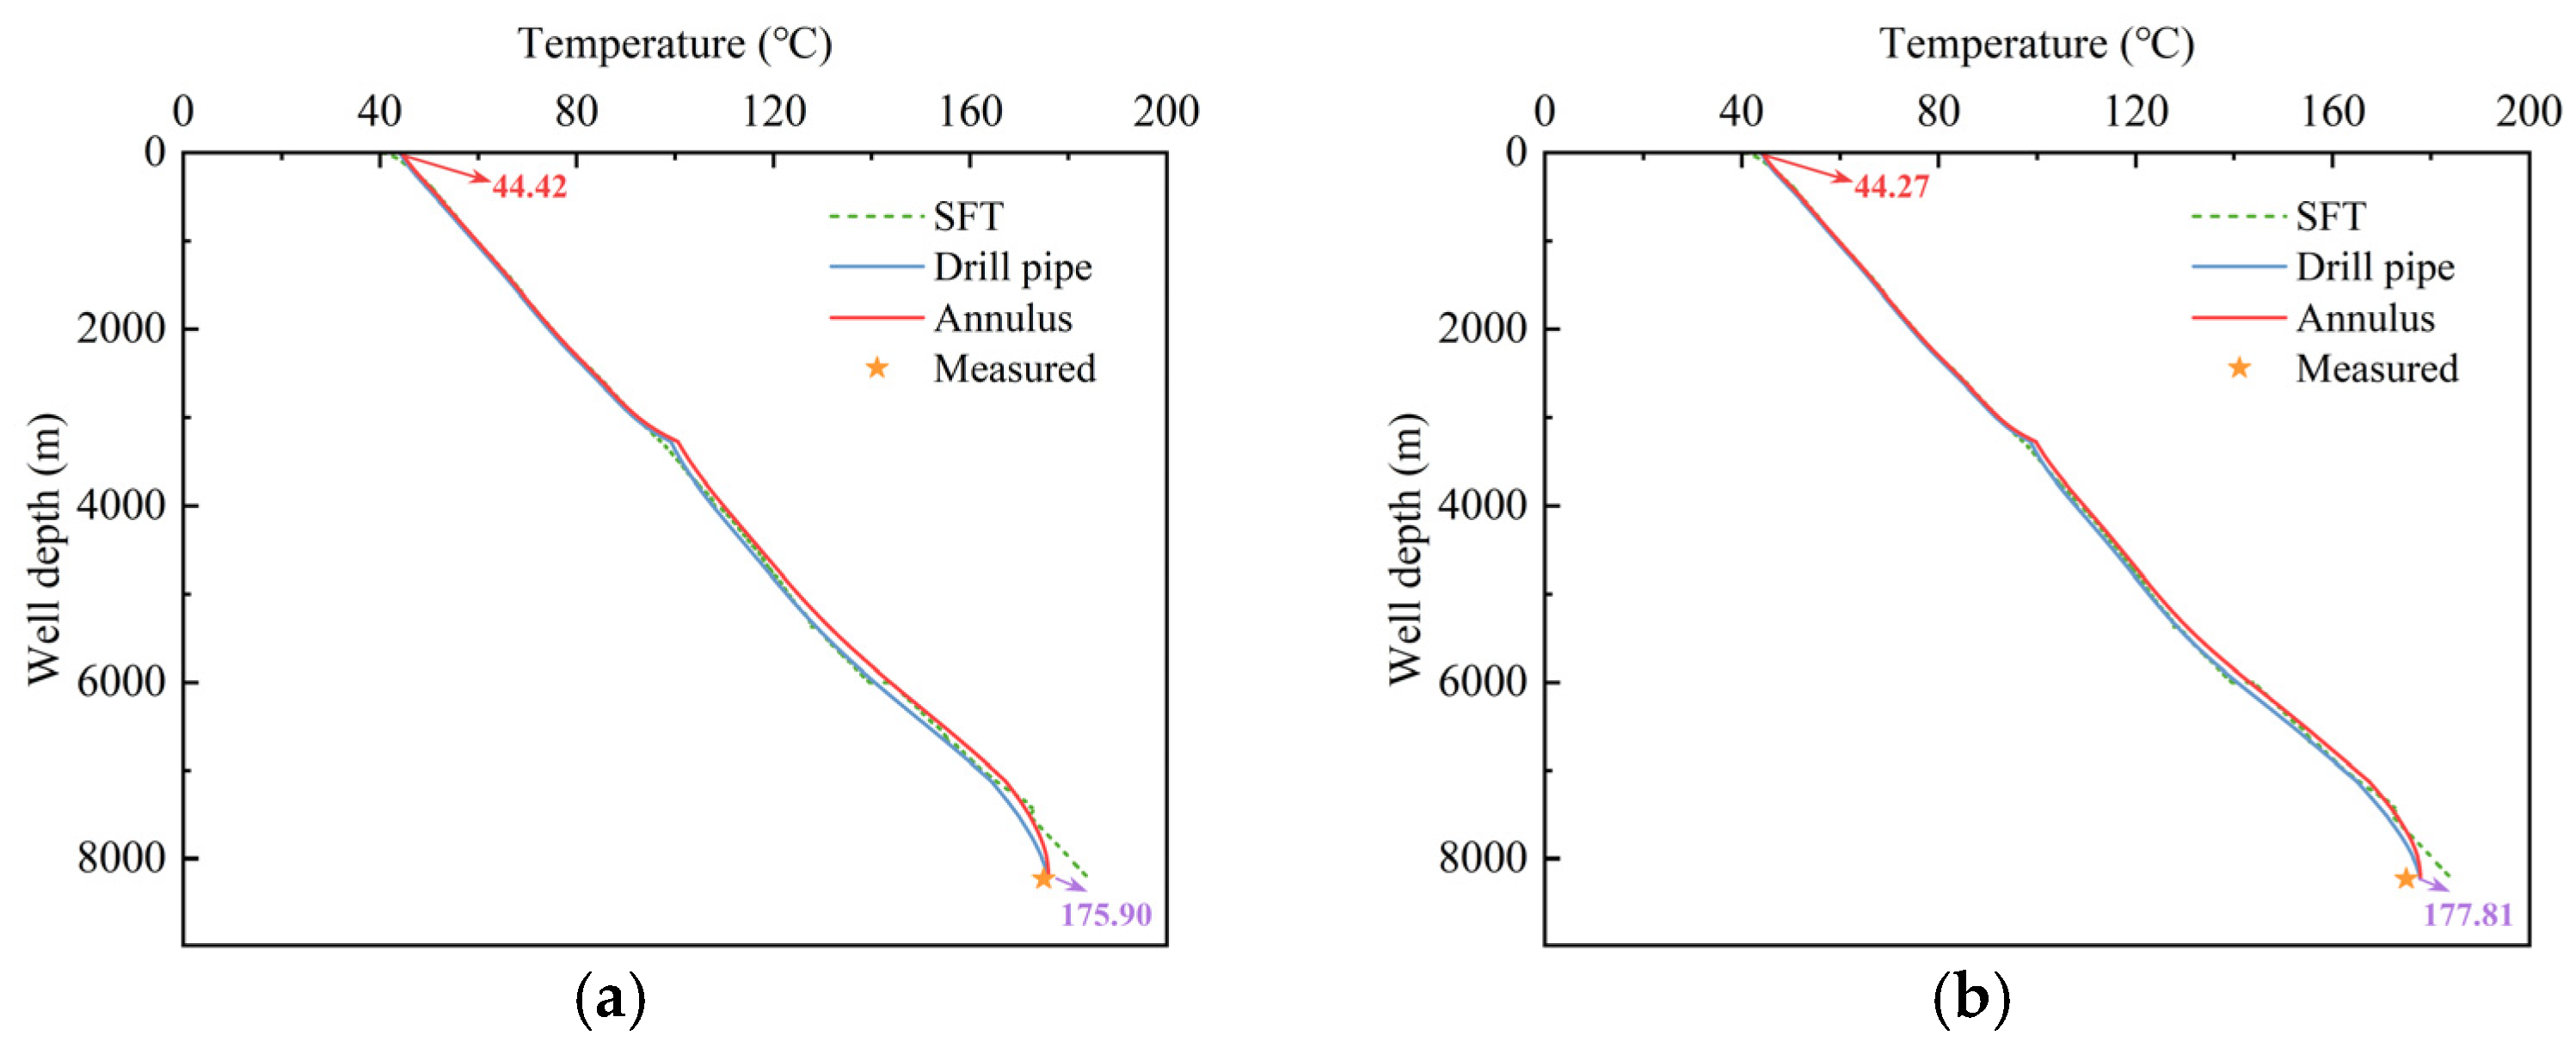
In this well section, the drilling fluid exhibits a plastic viscosity of 22 mPa·s and a flow rate of 15 L/s, with an ILT of 44 °C. After 23 h of circulation, the MWD recorded a BHT of 175 °C at 8230 m and an annular OLT of 47 °C at the wellhead. Using the temperature logging from the fourth open-hole section as the SFT, together with the above operational data, the initial and boundary conditions, the casing program listed in Table 4, and the thermophysical properties summarized in Table 5, these parameters are input into the wellbore–formation heat transfer model for simulation. The calculated results are presented in Figure 9.
Figure 9 illustrates the temperature distributions of the annular drilling fluid and the drill pipe fluid calculated by the formation–wellbore heat transfer models that either consider or neglect cementing quality, along with the model-predicted and measured BHT. When cementing quality is considered, the predicted BHT and OLT are 175.90 °C and 44.42 °C, respectively. Compared with the measured data, the AEs for BHT and OLT are 0.90 °C and 2.58 °C, corresponding to REs of 0.51% and 5.49%.
Without accounting for cementing quality, the predicted BHT and OLT are 177.81 °C and 44.27 °C, respectively, with AEs of 2.81 °C and 2.73 °C, and REs of 1.61% and 5.81%. The results demonstrate that incorporating cementing quality improves the accuracy of BHT prediction by 1.10% and OLT prediction by 0.32%.

4.3. Case Study—Shunbei Well C

Shunbei Well C is an exploration well located in the Shuntuoguole Uplift of the Tarim Basin. Its measured depth is 8479 m, with a true vertical depth of 8215 m and a heart filling height of the drilling rig of 10.5 m. Table 7 presents the casing program data for Shunbei Well C.
During drilling of the 8442–8479 m well section, the primary rock type encountered is limestone. The drill string assembly for this well section comprises a 10 m NMDC, 880 m of Φ88.9 mm drill pipe, 230 m of Φ88.9 mm HWDP, 3095 m of Φ88.9 mm drill pipe, and 4260 m of Φ114.3 mm drill pipe. The thermal properties of the heat transfer media, including drilling fluid, drill pipe, casing, cement, and rock, are provided in Table 8. The CBL for three drilling opening sections of Shunbei Well C are presented in Figure 10.
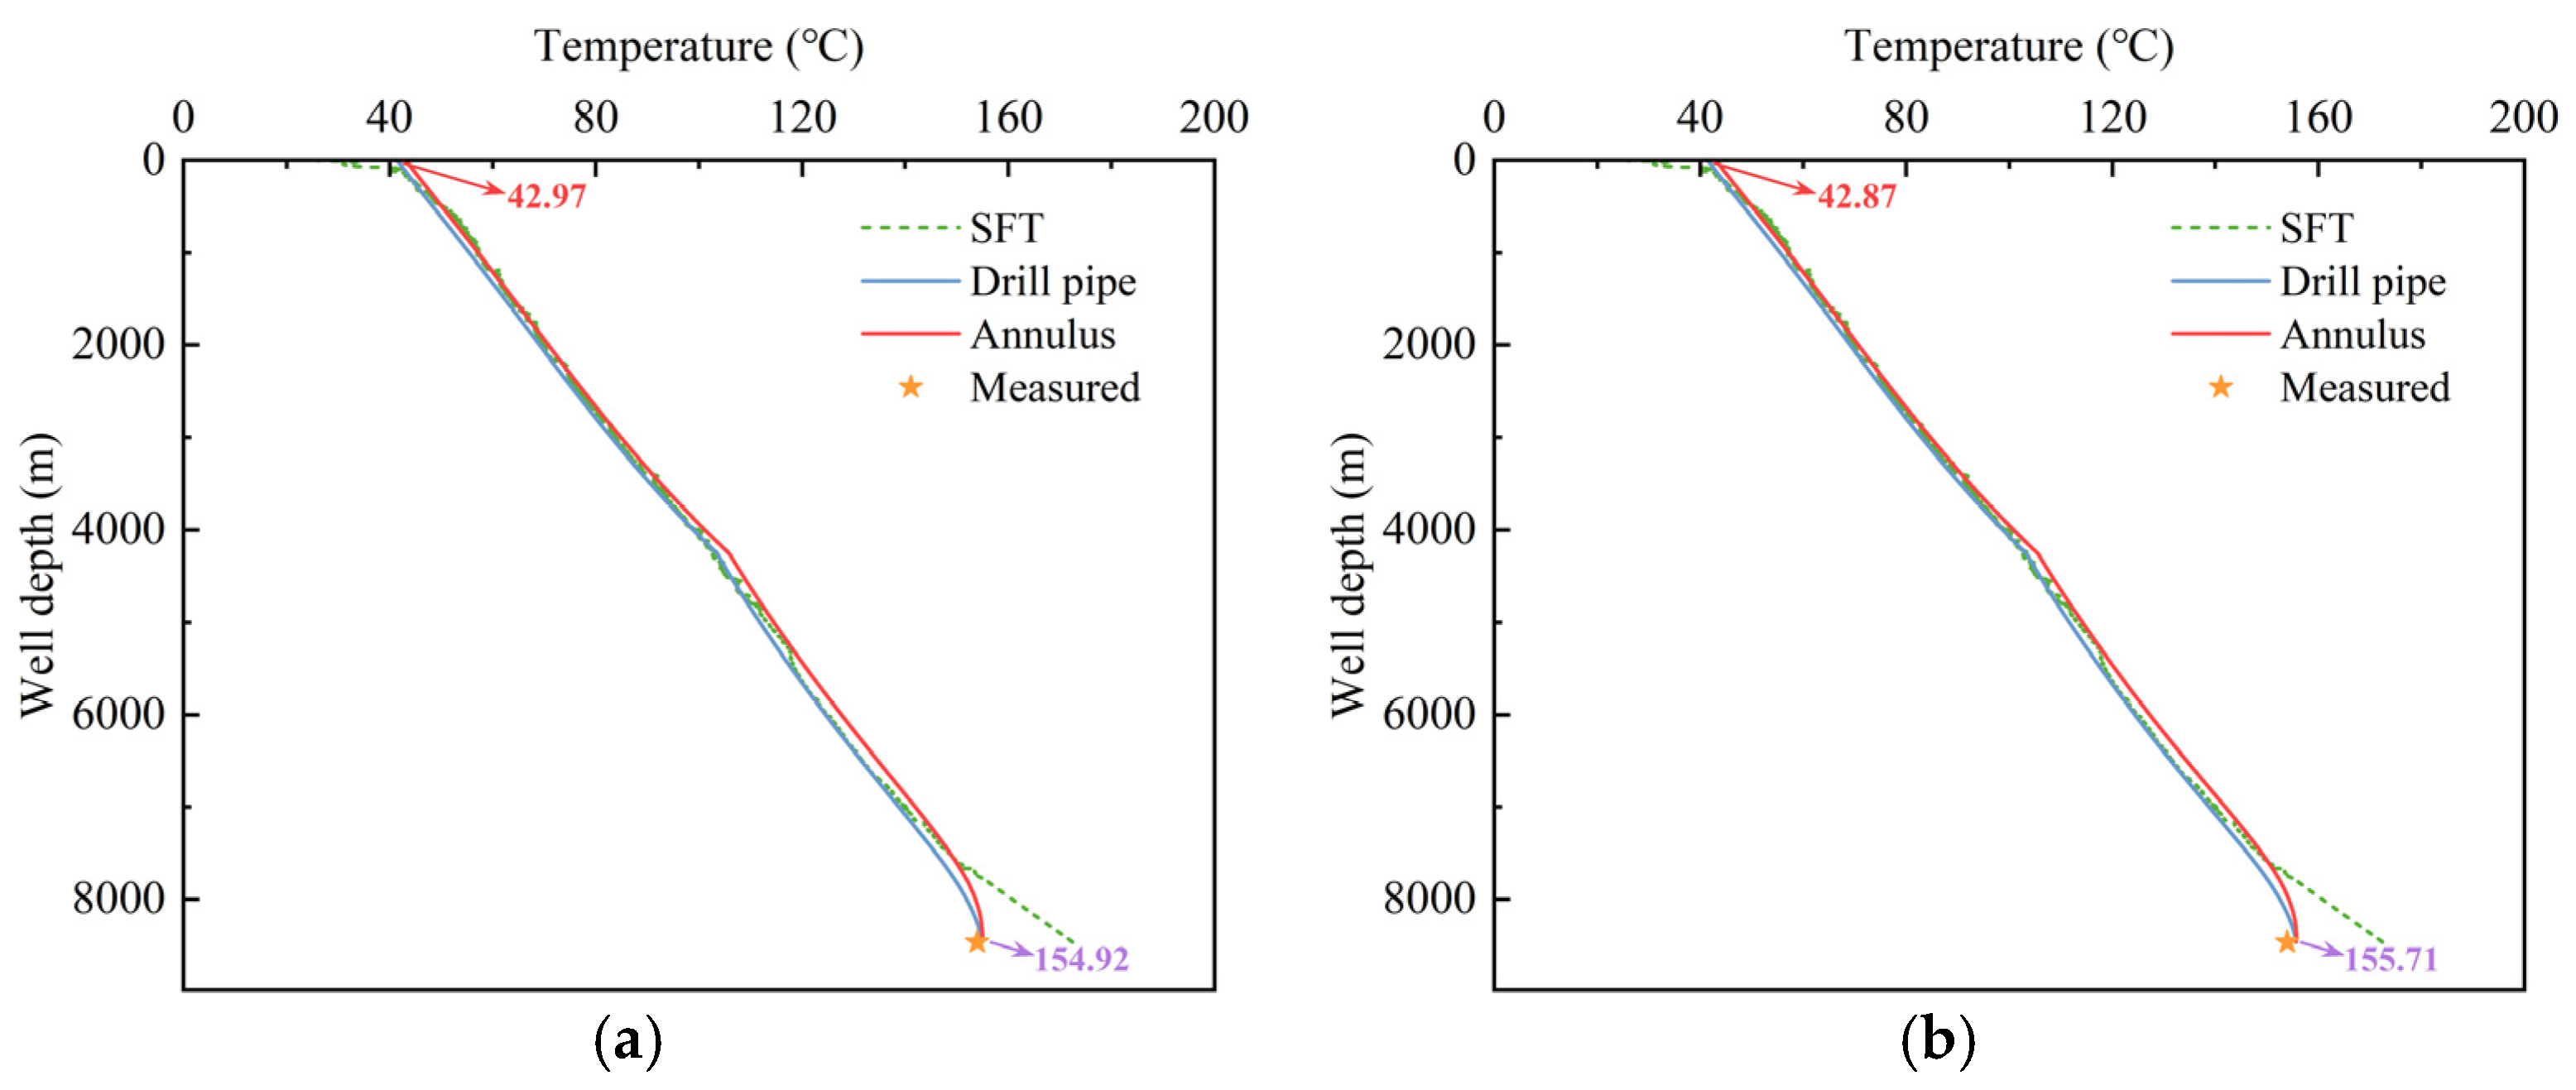
In this well section, the drilling fluid has a plastic viscosity of 20 mPa·s, a flow rate of 14 L/s, and an ILT of 41.3 °C. After 47 h of circulation drilling, the BHT measured by the MWD instrument is 154 °C at 8475 m with an OLT of 42.6 °C at wellhead. Using the fourth opening well section temperature logging as the SFT, the casing program parameters, thermophysical properties, CBL data, and the previously mentioned engineering parameters are input into the formation–wellbore heat transfer model. The model is then solved based on the initial and boundary conditions. The predicted wellbore temperature profile is presented in Figure 11.
The drilling fluid temperatures in the annular and the drill pipe of Shunbei Well C are predicted using formation–wellbore heat transfer models that either considered or neglected cementing quality, as shown in Figure 11. When cementing quality is considered, the predicted BHT is 154.92 °C, which is very close to the measured BHT of 154 °C, with an AE of 0.92 °C and a RE of 0.60%. The predicted OLT is 42.97 °C, compared with the measured OLT of 42.6 °C, yielding an AE of 0.27 °C and an RE of 0.63%.
Without accounting for cementing quality, the predicted BHT and OLT are 155.71 °C and 42.87 °C, respectively, resulting in AEs of 1.71 °C and 0.37 °C and REs of 1.11% and 0.87%. The results demonstrate that incorporating cementing quality improves the accuracy of BHT prediction by 0.51% and OLT prediction by 0.24%.
In summary, the field applications across three wells indicate that the RE of the predicted BHT remains within 2%, and that of the OLTs are within 6%, and the mean absolute error (MAE) of BHTs is 1.24 °C, the mean relative error (MRE) of BHTs is 0.77%, the MAE of OLTs is 1.31 °C, and the MRE of OLTs is 3.06%. Compared with the prediction results obtained without considering cementing quality, the accuracy of BHT prediction improves by an average of 1.03%, and that of OLT prediction improves by an average of 0.35%. The results verify the effectiveness and reliability of the proposed model for predicting the transient wellbore–formation temperature field in ultra-deep wells while accounting for cementing quality.

5. Conclusions

In this study, a calculation method for the overall thermal conductivity of cement containing micro-gap is proposed, and a formation–wellbore heat transfer model for ultra-deep wells considering cementing quality is developed. The proposed model provides a practical framework for real-time temperature management in ultra-deep drilling operations. By integrating real-time drilling data such as flow rate, inlet temperature, and circulation time, the model can help engineers predict bottomhole temperature evolution, optimize operational parameters, and design effective temperature-control strategies. This capability supports safe and efficient drilling in high-temperature, high-pressure environments. The following main conclusions are drawn:
(1)
Based on the principle of energy conservation, a formation–wellbore heat transfer model was established and compared with the Holmes & Swift and Keller models. The results show that, relative to the Holmes & Swift model, the RMSE of the predicted drill pipe and annulus temperatures are 0.149 °C and 0.323 °C, respectively. Compared with the Keller model, the AE of the predicted BHT is 1.93 °C, corresponding to a RE of 2.3%.
(2)
Using CBL data, the percentage of micro-gap in the cement is determined. Based on heat transfer resistance, an overall thermal conductivity model for micro-gap and cement is established, and embedded into the formation–wellbore heat transfer model.
(3)
The formation–wellbore heat transfer model considering cementing quality is validated using data from three ultra-deep wells. The results showed that the MAE in BHTs prediction is 1.24 °C, with a MRE of 0.77%. The MAE in OLT prediction is 1.31 °C, with a MRE of 3.06%. Considering cementing quality improves the prediction accuracy of bottomhole temperature by 1.03% and outlet temperature by 0.35%.

Author Contributions

Conceptualization, Z.D. and X.C.; methodology, Z.D. and X.Y.; software, Z.X. and Z.L.; validation, Z.D., X.C., and X.Y.; formal analysis, M.Z. and Z.L.; investigation, Z.X.; resources, X.Y.; data curation, Z.D.; writing—original draft preparation, Z.D. and X.Y.; writing—review and editing, X.C. and Z.X.; visualization, X.Y. and Z.L.; supervision, M.Z.; project administration, Z.X. and M.Z.; funding acquisition, X.C. and Z.X. All authors have read and agreed to the published version of the manuscript.

Funding

This research was funded by the project of the Sinopec Group Corporation “Research and application of heat-insulating technology for drilling tools in high-temperature wells”, grant number P22119.

Institutional Review Board Statement

Not applicable.

Informed Consent Statement

Not applicable.

Data Availability Statement

The original contributions presented in this study are included in the article. Further inquiries can be directed to the corresponding author.

Conflicts of Interest

Author Zhigang Dang and Xiuping Chen were employed by the company Sinopec Northwest Oilfield Company. The remaining authors declare that the research was conducted in the absence of any commercial or financial relationships that could be construed as a potential conflict of interest.

Nomenclature

The following variables are used in this manuscript:
ρmDensity of drilling fluid, kg/m3
CmSpecific heat capacity of drilling fluid, J/kg/°C
rdp,iInner radius of the drill pipe, m
TmTemperature of drilling fluid in the drill pipe, °C
tTime, s
VmVelocity of the drilling fluid in the drill pipe, m/s
zDepth, m
hm-dpCHTC of the wall of the drill pipe, W/m2/°C
TdpTemperature of the wall of the drill pipe, °C
ρdpDensity of the drill pipe, kg/m3
CdpSpecific heat capacity of the drill pipe, J/kg/°C
rdp,oOuter radius of the drill pipe, m
λdpThermal conductivity of the drill pipe, W/m/°C
hdp-aCHTC between the drilling fluid in annulus and the drill pipe, W/m2/°C
TaTemperature of the drilling fluid in the annulus, °C
rca1,iInner radius of the first casing or the radius of the borehole, m
VaVelocity of the drilling fluid in the annulus, m/s
ha-caCHTC between drilling fluid in the annulus and the casing, W/m2/°C
Tca1Temperature of the first casing or the borehole wall, °C
ρcaDensity of the casing, kg/m3
CcaSpecific heat capacity of the casing, J/kg/°C
rca1,oOuter radius of the first casing, m
λcaThermal conductivity of the casing, W/m/°C
rca2,iInner radius of the second layer of casing, m
TceTemperature of the first layer of cement, °C
λca1-ce1Overall thermal conductivity between the first casing and the first cement, W/m/°C
kOverall thermal conductivity of the cement, W/m/°C
ρceDensity of the cement, kg/m3
CceSpecific heat capacity of the cement, J/kg/°C
rca2,oOuter radius of the second layer of casing, m
Tca2Temperature of the second layer of casing °C
λce1-ca2Overall thermal conductivity between the first cement and the second casing, W/m/°C
ρfDensity of the formation, kg/m3
CfSpecific heat capacity of the formation, J/kg/°C
TfTemperature of the formation, °C
TgTemperature of the surface, °C
GfTemperature gradient of the stratum, °C/m
TinILT of drilling fluid in the drill pipe, °C
LWell depth, m
ΦHeat flux, W
ASurface area, m2
ACBLAcoustic amplitude, %
rca,oOuter radius of the casing, m
rfRadius of the formation, m
TsTemperature at the micro-gap inner wall (cement inner wall), °C
λceThermal conductivity of the cement, W/m/°C
hConvective heat transfer coefficient, W/m2/°C
NuNusselt number, -
λThermal conductivity, W/m/°C
DhHydrodynamic diameter, m
RedpReynolds number of turbulence in the circular tube, -
PrdpPrandtl number, -
fdpFriction factor in drill pipe, -
ReanReynolds number of turbulence in the circular tube, -
PranPrandtl number, -
fanFriction factor in annulus, -
FanCorrection factor, -
ηGap ratio annulus, -
roOuter radius of the annulus space, m
riInner radius of the annulus space, m
PPressure, Pa
TDrilling fluid temperature in the drill pipe or annulus, °C
ρ0Initial density of drilling fluid, kg/m3
T0Test temperature, °C
P0Test pressure, Pa
μDrilling fluid plastic viscosity, Pa·s
μ0Initial plastic viscosity of drilling fluid, Pa·s
CSpecific heat capacity, J/kg/°C
A, B, C, D, E, FCoefficients of the control equations of the unit control body, -
ntTime node, -
iSpatial node on the radial direction of the wellbore, -
jSpace node on the axial direction of the wellbore, -

Abbreviations

The following abbreviations are used in this manuscript:
BHTBottomhole temperature
APIAmerican petroleum institute
SFTStatic formation temperature
ILTInlet temperature
OLTOutlet temperature
RERelative error
PDMPositive displacement motor
NMDCNon-magnetic drill collar
HWDPHeavy-weight drill pipe
AEAbsolute error
MWDMeasurement while drilling

References

  1. Guo, X.; Hu, D.; Li, Y.; Duan, J.; Zhang, X.; Fan, X.; Duan, H.; Li, W. Theoretical progress and key technologies of onshore ultra-deep oil/gas exploration. Engineering 2019, 5, 458–470. [Google Scholar] [CrossRef]
  2. Xu, C.; Zou, W.; Yang, Y.; Duan, Y.; Shen, Y.; Luo, B.; Ni, C.; Fu, X.; Zhang, J. Status and prospects of deep oil and gas resources exploration and development onshore China. J. Nat. Gas Geosci. 2018, 3, 11–24. [Google Scholar] [CrossRef]
  3. Zongqi, C.; Xianghua, L.; Binzhen, B.; Hao, Y. Technical progress and development consideration of drilling and completion engineering for ultra-deep wells in the Shunbei Oil & Gas Field. Pet. Drill. Tech. 2022, 50, 1–10. [Google Scholar]
  4. Wang, X.; Dong, M.; Sun, B.; Wang, Z.; Gao, Y.; Li, H. Cement Slurry Displacement Efficiency in Ultra-Deep Wells: A Thermal-Pressure-Dependent Rheology Model. Case Stud. Therm. Eng. 2025, 74, 106884. [Google Scholar] [CrossRef]
  5. Liu, R.; Yu, J.; Liu, L.; Wang, Z.; Zhou, S.; Zhu, Z. A Cement Bond Quality Prediction Method Based on a Wide and Deep Neural Network Incorporating Embedded Domain Knowledge. Appl. Sci. 2025, 15, 5493. [Google Scholar] [CrossRef]
  6. Wang, J.; Zhang, W.; Song, L.; Wu, J.; Wu, Y. Study on sealing integrity of cement sheath in ultra deep well reservoir reconstruction. Energy Sci. Eng. 2023, 11, 2630–2641. [Google Scholar] [CrossRef]
  7. Spindler, R. Analytical models for wellbore-temperature distribution. SPE J. 2011, 16, 125–133. [Google Scholar] [CrossRef]
  8. Kabir, C.; Hasan, A.; Kouba, G.; Ameen, M. Determining circulating fluid temperature in drilling, workover, and well control operations. SPE Drill. Complet. 1996, 11, 74–79. [Google Scholar] [CrossRef]
  9. Wang, Z.; Horne, R.N. Analyzing wellbore temperature distributions using nonisothermal multiphase flow simulation. In Proceedings of the SPE Western Regional Meeting, Anchorage, Alaska, 4–7 May 2011; p. SPE–144577-MS. [Google Scholar]
  10. Yang, H.; Li, J.; Liu, G.; Wang, C.; Li, M.; Jiang, H. Numerical analysis of transient wellbore thermal behavior in dynamic deepwater multi-gradient drilling. Energy 2019, 179, 138–153. [Google Scholar] [CrossRef]
  11. Holmes, C.S.; Swift, S.C. Calculation of circulating mud temperatures. J. Pet. Technol. 1970, 22, 670–674. [Google Scholar] [CrossRef]
  12. Hasan, A.R.; Kabir, C. Aspects of wellbore heat transfer during two-phase flow. SPE Prod. Facil. 1994, 9, 211–216. [Google Scholar] [CrossRef]
  13. Xiangyang, Z.; Cong, Z.; Peng, W.; Xiaoyang, L.; Mou, Y. A comparative study on the calculation accuracy of numerical and analytical models for wellbore temperature in ultra-deep wells. Pet. Drill. Tech. 2022, 50, 69–75. [Google Scholar]
  14. Abdelhafiz, M.M.; Hegele Jr, L.A.; Oppelt, J.F. Numerical transient and steady state analytical modeling of the wellbore temperature during drilling fluid circulation. J. Pet. Sci. Eng. 2020, 186, 106775. [Google Scholar] [CrossRef]
  15. Yang, M.; Zhao, X.; Meng, Y.; Li, G.; Zhang, L.; Xu, H.; Tang, D. Determination of transient temperature distribution inside a wellbore considering drill string assembly and casing program. Appl. Therm. Eng. 2017, 118, 299–314. [Google Scholar] [CrossRef]
  16. Yang, M.; Tang, D.; Chen, Y.; Li, G.; Zhang, X.; Meng, Y. Determining initial formation temperature considering radial temperature gradient and axial thermal conduction of the wellbore fluid. Appl. Therm. Eng. 2019, 147, 876–885. [Google Scholar] [CrossRef]
  17. Zhongming, C.; Rudolf, J. Accurate prediction wellbore transient temperature profile under multiple temperature gradients: Finite difference approach and case history. In Proceedings of the SPE Annual Technical Conference and Exhibition, Denver, CO, USA, 5–8 October 2003; p. 84583. [Google Scholar]
  18. Zhang, Z.; Xiong, Y.; Gao, Y.; Liu, L.; Wang, M.; Peng, G. Wellbore temperature distribution during circulation stage when well-kick occurs in a continuous formation from the bottom-hole. Energy 2018, 164, 964–977. [Google Scholar] [CrossRef]
  19. Zhang, Z.; Wei, Y.; Xiong, Y.; Peng, G.; Wang, G.; Lu, J.; Zhong, L.; Wang, J. Influence of the location of drilling fluid loss on wellbore temperature distribution during drilling. Energy 2022, 244, 123031. [Google Scholar] [CrossRef]
  20. Li, G.; Yang, M.; Meng, Y.; Wen, Z.; Wang, Y.; Yuan, Z. Transient heat transfer models of wellbore and formation systems during the drilling process under well kick conditions in the bottom-hole. Appl. Therm. Eng. 2016, 93, 339–347. [Google Scholar] [CrossRef]
  21. Yao, X.; Song, X.; Zhou, M.; Xu, Z.; Duan, S.; Li, Z.; Li, H. A modified heat transfer model for predicting wellbore temperature in ultra-deep drilling with insulated drill pipe. Energy 2025, 331, 136981. [Google Scholar] [CrossRef]
  22. Dang, Z.; Chen, X.; Yao, X.; Xu, Z.; Zhou, M.; Yang, W.; Song, X. Wellbore temperature prediction model and influence law of ultra-deep wells in Shunbei field, China. Processes 2024, 12, 1715. [Google Scholar] [CrossRef]
  23. YANG, M.M.; DENG, J.Z. A transient heat transfer model of wellbore and formation during the whole drilling process. Acta Pet. Sin. 2013, 34, 366. [Google Scholar]
  24. Xu, Z.; Wu, K.; Song, X.; Li, G.; Zhu, Z.; Sun, B. A unified model to predict flowing pressure and temperature distributions in horizontal wellbores for different energized fracturing fluids. SPE J. 2019, 24, 834–856. [Google Scholar] [CrossRef]
  25. Xuezhe, Y.; Xianzhi, S.; Zhengming, X.; Mengmeng, Z.; Shiming, D.; Yueqi, C.; Haobo, W. An inversion-while-drilling method for the static formation temperature of ultra-deep wells based on differential evolution algorithm. Acta Pet. Sin. 2025, 46, 1805–1816. [Google Scholar] [CrossRef]
  26. Willhite, G.P. Over-all heat transfer coefficients in steam and hot water injection wells. J. Pet. Technol. 1967, 19, 607–615. [Google Scholar] [CrossRef]
  27. Incropera, F.P.; DeWitt, D.P.; Bergman, T.L.; Lavine, A.S. Fundamentals of Heat and Mass Transfer; New York John Wiley & Sons, Inc.: Hoboken, NJ, USA, 1990; Volume 1072. [Google Scholar]
  28. Gnielinski, V. Neue Gleichungen für den Wärme-und den Stoffübergang in turbulent durchströmten Rohren und Kanälen. Forsch. Im. Ingenieurwesen A 1975, 41, 8–16. [Google Scholar] [CrossRef]
  29. Sorelle, R.R.; Jardiolin, R.A.; Buckley, P.; Barrios, J.R. Mathematical Field Model Predicts Downhole Density Changes in Static Drilling Fluids. In Proceedings of the SPE Annual Technical Conference and Exhibition, San Antonio, TX, USA, 5–8 October 1997. [Google Scholar]
  30. Minton, R.C.; Bern, P.A. Field Measurement and Analysis of Circulating System Pressure Drops with Low-Toxicity Oil-Based Drilling Fluids. In Proceedings of the IADC/SPE Drilling Conference, Dallas, TX, USA, 7–9 September 1988. [Google Scholar]
  31. Mao, L.; Wei, C.; Jia, H.; Lu, K. Prediction model of drilling wellbore temperature considering bit heat generation and variation of mud thermophysical parameters. Energy 2023, 284, 129341. [Google Scholar] [CrossRef]
  32. Tiskatine, R.; Bougdour, N.; Idoum, A.; Bazgaou, A.; Oaddi, R.; Ihlal, A.; Aharoune, A. Experimental investigation on rock thermal properties under the influence of temperature. Thermochim. Acta 2023, 720, 179424. [Google Scholar] [CrossRef]
  33. Yao, X.; Song, X.; Xu, Z.; Zhou, M.; Wang, Q. Research on the influence mechanism of heat-Insulating coating parameters in temperature-controlled drilling of ultra-deep well. Pet. Drill. Tech. 2024, 52, 126–135. [Google Scholar]
Figure 1. Physical model of drilling fluid circulation. Q is heat.
Applsci 15 12029 g001
Figure 2. Cement bond logging diagram of cement.
Applsci 15 12029 g002
Figure 3. Heat transfer between micro gap and cement.
Applsci 15 12029 g003
Figure 4. Comparison of calculation results between the proposed model and the Holmes & Swift model.
Applsci 15 12029 g004
Figure 5. Comparison results between the proposed and the Keller model after 24 h circulation.
Applsci 15 12029 g005
Figure 6. CBL of Shunbei Well A.
Applsci 15 12029 g006
Figure 7. Wellbore circulation temperature prediction results of Shunbei Well A. (a) Wellbore temperature profile, accounting for cementing quality. (b) Wellbore temperature profile, neglecting cementing quality.
Applsci 15 12029 g007
Figure 8. CBL of Shunbei Well B.
Applsci 15 12029 g008
Figure 9. Wellbore circulation temperature prediction results of Shunbei Well B. (a) Wellbore temperature profile accounting for cementing quality. (b) Wellbore temperature profile neglecting cementing quality.
Applsci 15 12029 g009
Figure 10. CBL of Shunbei Well C.
Applsci 15 12029 g010
Figure 11. Wellbore circulation temperature prediction results of Shunbei Well C. (a) Wellbore temperature profile, accounting for cementing quality. (b) Wellbore temperature profile, neglecting cementing quality.
Applsci 15 12029 g011
Table 1. Physical property calculation models for different lithologies.
LithologiesDensity
(kg/m3)
Specific Heat Capacity
(J/kg/°C)
Thermal Conductivity
(W/m/°C)
Limestone2655 C = 0.0002 T 2 + 0.7125 T + 861.93 λ = 0.47 ln T + 4.496
Sandstone2486 C = 9 × 10 6 T 2 + 0.5926 T + 866.30 λ = 0.10 ln T + 2.374
Mudstone2718 C = 0.0003 T 2 + 0.4725 T + 888.74 λ = 0.35 ln T + 4.719
Granite2586 C = 0.0006 T 2 + 0.8716 T + 803.16 λ = 0.08 ln T + 2.741
Basalt2602 C = 0.0004 T 2 + 0.8527 T + 806.91 λ = 0.07 ln T + 2.099
Marble2597 C = 0.0006 T 2 + 0.9579 T + 828.78 λ = 0.25 ln T + 3.497
Quartzite2670 C = 0.0007 T 2 + 1.1348 T + 762.99 λ = 0.65 ln T + 5.819
Gabbro2644 C = 0.0010 T 2 + 1.1463 T + 763.85 λ = 0.06 ln T + 2.038
Table 2. Basic data for model validation tests.
ParametersValue UnitParametersValue Unit
Depth8000 mDrill pipe specific heat400 J/kg/°C
Drill pipe inner diameter151 mmFormation specific heat837 J/kg/°C
Drill pipe outer diameter168 mmDrilling fluid thermal conductivity1.73 W/m/°C
Borehole diameter213 mmDrill pipe thermal conductivity43.75 W/m/°C
Drilling fluid density1200 kg/m3Formation thermal conductivity2.25 W/m/°C
Drill pipe density7800 kg/m3Surface temperature15.3 °C
Formation density2645 kg/m3Geothermal gradient2.31 °C/100 m
Drilling fluid viscosity45.4 mPa·sInlet temperature24 °C
Drilling fluid specific heat1675 J/kg/°CFlow rate13.2 L/s
Table 3. Borehole structure and borehole expansion rate of Shunbei Well A.
TypeBit Diameter (mm)Depth (m)Casing Outer Diameter (mm)Casing Setting Depth (m)Cement Top Depth (m)Hole Enlargement Ratio (%)
Surface casing660.41055081050/
Intermediate casing444.51199.5339.71199.150/
Intermediate casing311.24363250.8436203.94
Intermediate casing215.97728177.87726.7741624.14
Open-hole section149.28543///3.43
Table 4. Thermal property parameters of heat transfer medium of Shunbei Well A.
MediumDensity (kg/m3)Specific Heat (J/kg/°C)Thermal Conductivity (W/m/°C)
Drilling fluid1600 1 & Equation (27)Equation (30)Equation (29)
Drill pipe7800 2500 248 2
Casing7800 2500 248 2
Cement2140 32000 30.7 3
Formation rock2655 4985 42.021 4
1 Field measurement. 2 Reference [25]. 3 Reference [19]. 4 Reference [32].
Table 5. Borehole structure and borehole expansion rate of Shunbei Well B.
TypeBit Diameter (mm)Depth (m)Casing Outer Diameter (mm)Casing Setting Depth (m)Cement Top Depth (m)Hole Enlargement Ratio (%)
Surface casing660.41005081000/
Intermediate casing444.51507339.71506.330/
Intermediate casing311.25382250.85381.3707.88
Intermediate casing215.97528177.87527.765167.563.78
Open-hole section149.28287///3.12
Table 6. Thermal property parameters of the heat transfer medium of Shunbei Well B.
MediumDensity (kg/m3)Specific Heat (J/kg/°C)Thermal Conductivity (W/m/°C)
Drilling fluid1290 1 & Equation (27)Equation (30)Equation (29)
Drill pipe7800 2500 248 2
Casing7800 2500 248 2
Cement2140 32000 30.7 3
Formation rock2655 4985 42.021 4
1 Field measurement. 2 Reference [25]. 3 Reference [19]. 4 Reference [32].
Table 7. Borehole structure and borehole expansion rate of Shunbei Well C.
TypeBit Diameter (mm)Depth (m)Casing Outer Diameter (mm)Casing Setting Depth (m)Cement Top Depth (m)Hole Enlargement Ratio (%)
Surface casing660.41105081100/
Intermediate casing444.51201365.11200.750/
Intermediate casing333.44834273.14832.3804.87
Intermediate casing241.37821193.77819.8505.56
Open-hole section165.18479///3.37
Table 8. Thermal property parameters of heat transfer medium of Shunbei Well C.
Density (kg/m3)Specific Heat (J/kg/°C)Thermal Conductivity (W/m/°C)
Drilling fluid1110 1 & Equation (27)Equation (30)Equation (29)
Drill pipe7800 2500 248 2
Casing7800 2500 248 2
Cement2140 32000 30.7 3
Formation rock2655 4985 42.021 4
1 Field measurement. 2 Reference [25]. 3 Reference [19]. 4 Reference [32].
Disclaimer/Publisher’s Note: The statements, opinions and data contained in all publications are solely those of the individual author(s) and contributor(s) and not of MDPI and/or the editor(s). MDPI and/or the editor(s) disclaim responsibility for any injury to people or property resulting from any ideas, methods, instructions or products referred to in the content.