You are currently viewing a new version of our website. To view the old version click .
Applied Sciences
  • Article
  • Open Access

11 November 2025

Multi-Polar Approach to Parasitic Suppression in Smart Electromagnetic Skins (SESs)

and
Department of Electronics and Telecommunications (DET), Politecnico di Torino, Corso Duca Degli Abruzzi 24, 10129 Turin, Italy
*
Author to whom correspondence should be addressed.
This article belongs to the Special Issue Recent Advances in Reflectarray and Transmitarray Antennas

Abstract

Smart Electromagnetic Skins (SESs) provide a cost-effective and efficient alternative to in- creasing the number of Base Stations (BSs) for improving the performance of next-generation communication networks and contribute to the implementation of Smart Radio Environ- ments (SREs). SESs generalize the concept of ReflectArrays (RAs) because they redirect the incident field in a non-specular direction. However, as the difference between the pointing and specular directions increases, specular and parasitic effects arise, which affect the radiation pattern, energy efficiency, and pointing direction. The techniques generally adopted for SES design, using homogenized-effective-medium model, are unable to overcome this drawback efficiently. Starting with initial SES design based on the Phase-Gradient (PG) approach, the suppression of the higher order modes has been achieved by incorporating volumetric charge-current distributions when defining radiation modes, using theory of electromagnetic-multipoles. This approach reveals formation of anapoles in single-layer SESs/RAs for first time ever. By combining both local and non-local approaches in super-cell design, higher-order symmetry-breaking of unit cells is utilized to exploit anapole formation as a parasitic mode suppression method. Numerical analysis of SESs with increasing size confirms the effectiveness of the proposed approach, which allows for a drastic reduction in parasitic modes while leaving the performance of the desired mode unchanged. Adopting a multipole perspective enhances the understanding of SES radiation mechanisms, unlocks their unexploited performance potential, and opens new opportunities for multifunctional design.

1. Introduction

Physical layer of 6G systems is envisaged to provide communication, sensing, localization and computing in a programmable and cooperative Smart Radio Environment (SRE) [,,]. This requires ultra-broadband connectivity, low latency and seamless coverage [,]. Sub-THz/mm-wave bands have the potential to achieve these goals [,,]. Although it meets the performance requirements but it suffers from major draw-backs of Strong free-space attenuation, high building penetration loss, strong features interaction during propagation and strongly degradation in coverage outside Line-of-Sight (LoS) of Base Station(BS) antenna. For an implementation that maintains low complexity, environmental sustainability, and operational efficiency, adding new BSs to the SRE is not feasible []. To overcome this drawback and as an alternative to BSs, suitable, ad-hoc, active and passive devices, collectively referred to as Smart Electromagnetic Skins (SESs) can be introduced [,,]. They are thin surfaces, discretized with a proper number of sub-wavelength or resonant Unit Cells (UCs), also named meta-atoms, that can produce non-specular reflections to cover particular areas or address blind spots. In cases where reconfigurability is also required, active elements are introduced into the UCs, and the resulting configuration is referred to as Reconfigurable Intelligent Surfaces (RISs). The use of SES makes the environment also an additional degree of freedom towards optimal SRE implementation.
A smart skin can be realized using ReflectArray (RA) [,] technology. This generally refers to the case in which SESs are realized using cells having resonant behavior, being their size of the order of λ / 2 λ / 3 [,,,,]. In case in which cells have size is λ / 8 λ / 10 [,] is commonly said that it is realized with a metasurface. Strictly speaking a metasurface is a broader class of artificial metamaterials consisting of nano-scale structures designed to control electromagnetic waves, including phase, amplitude, and polarization, at sub-wavelength scales. Therefore, a reflectarray is a type of metasurface, while metasurfaces are not necessarily reflectarrays, since they can be used for different applications, including reflection, as with a reflectarray, or for other functions, such as focusing, polarization conversion, or sensing [,,,,,,].
From the perspective of the design procedure, RAs differ from metasurfaces. Their design involves a two-step process: first, a UC that can control the phase of the re-radiated field is defined; Then, these elements are arranged to provide the aperture phase distribution necessary to optimize the antenna’s overall properties. Conversely, the behavior of the metasurface is first described in terms of an equivalent impedance boundary condition that is then implemented through the proper selection of meta-atoms.
Regardless of the UC solution chosen, the primary distinction between a reflectarray and a smart skin lies in the distance and positioning of the reflecting surface relative to the source of the incident field. In an RA, the reflecting surface is typically located between 0.5 and 2 times the maximum size of the surface itself from the primary feed. Consequently, the field impinging on the borders is significantly lower than that impinging on the central part of the surface. Conversely, smart skins are usually located far from base stations; therefore, the incident field can be modeled as a plane wave with the same magnitude across the entire surface. In an RA, the position of the feed is selected to maximize antenna performance. In the context of smart skin, the position of the base station is fixed, and depending on the scenario; therefore, the position of the SES might not be selectable to ensure peak link performance, as in the case in which it is mounted on the wall of a building. For this reason, the direction of arrival of the incident field and/or the direction in which the field must be redirected could be strongly tilted with respect to the surface normal and quite different from each other (non-specular reflection). Finally, it is worth to notice that in a reflectarray the field radiated by feed impinges on the different UCs with a different angle of incidence, and this contributes to partially destroy the periodicity of the phase variation on the reflecting surface. Since the field impinging on a smart skin is a plane wave, it introduces a macro periodicity, depending on the incident and pointing angles, equal to the periodicity of variation of the phase delay across the surface. The phase variation over a macro period is then sampled by the UC. Depending on its size, it is not guarantee that it exists a (integer) number of UC who exactly covers the super-cell corresponding to the phase variation period; moreover, it is not guarantee that the range of variation for the phase provided by each UC is equal to 2 π . These two aspects introduce quantization errors that degrade the SES performance and contribute to the appearing in the radiation patterns of lobes due to the radiation of undesired Floquet modes. Particularly evident is the arising of modes with indices m = 0 in the direction specular to that of the incident field and m = 1 in the direction specular to the desired pointing one.
Smart skins are usually designed using the Phase-Gradient (PG) approach, that is widely-used for wave-front control [,,,] by exploiting the generalized law of reflection and refraction []. It allows generating far field radiation pattern by linear phase synthesis using reactive surface impedances that capture and re-radiate incoming plane waves into desired far-field radiation pattern. However, the optimization of the SES considering it as a surface impedance modulated panel [] based on only the phase of the reflection coefficient as source field of the of UCs forming the PG super-cell does not fully define the radiation modes of the structure. Moreover, it does not guarantee power conservation with surrounding medium [], resulting into parasitic radiations. To address this, power conservation with surrounding medium was defined as a boundary condition [,] resulting into complex surface impedances having periodic active (negative) and passive (positive) resistance for high power efficiency anomalous reflection. To ensure efficiency at higher deflection angles, an accurate response is required from the active or passive components incorporated onto the surface, or from the auxiliary evanescent fields.
Non-local optimization for ensuring far-field phase integrity in presence of near-field coupling increases the problem size and computational cost. To reduce near-field coupling between the UC and ensure the far-field phase integrity of cells, as theoretically calculated in [], folded-dipole cells were used in []. They attribute the reduction in the far field of parasitic and undesired harmonic reflections to the presence of loop currents on the UCs, which minimize the near-field coupling between them and ensure the same phase in the far field as theoretically calculated for each UC []. However, this does not explain the significant differences in the level and pattern of parasitic reflections at different pointing angles. Therefore, using only far-field phase analysis to describe the radiation pattern of a planar metallic super cell, including the re-radiation phase of the individual cells and the incorporation of near-field interactions, is inadequate when employing either the phase-gradient or the theory-of-diffraction-based approaches. This analysis fails to fully describe the underlying phenomena causing the radiation pattern, resulting in non-global optimization and radiation beyond the design calculations.
At high deflection angles, specular and parasitic reflections [] and impedance mismatch between incident and pointing waves affects energy coupling efficiency into the desired mode causing performance degradation of PG- based SES []. MetaGratings (MG) were proposed to overcome efficiency limitations and stringent fabrication requirements of PG surfaces []. MGs, inspired by principles of diffraction gratings [], are 1D array of polarization line currents exploiting the momentum property of waves in conjunction with intelligent Floquet mode positioning in a structure having dominant electric and magnetic dipolar responses [] to cancel unwanted diffraction orders and achieve high efficiency at large deflection angles. Higher order electric and magnetic multipolar responses in a single meta-atom [] and super-cell of meta-atoms [] having bi-anisotropic properties [] have also been employed to enhance diffraction efficiency of MG. MG performance efficiency is limited at low deflection angles, for high incidence angles or if the number of Floquet modes increase. Hybrid combination of PG and MG in a multi-layer metasurface structure has been used to combine benefits of PG and MG [].
SESs designed using both PG and MG are based on presence of Electric Dipoles (ED) and Magnetic Dipoles (MD) as radiation sources [,]. Using ED and MD, Kerker effect has also been utilized for back-scattering cancellation and enhancing forward scattering [] based on first and second Kerker conditions [] using different combinations of electric and magnetic multipoles. From perspective of design approach, SES design can be based on either local or non-local approaches. In non-local design approach, response at a particular location depends on fields at that location and also at other locations [] which acts as an additional degree of freedom in desired response generation. Therefore, a combination and presence of bi-anisotropy [] and non-locality [,] based on electric and magnetic multipoles is an important condition for achieving efficient anomalous reflection [].
We approach the problem of specular and parasitic suppression in SESs utilizing the theory of electromagnetic multipoles [,], which considers far-field as a superposition of electromagnetic fields created by point multipoles formed due to spatially localized arbitrary-shaped electric charges and current distributions in structure []. We move beyond conventional bi-anisotropic electric and magnetic multipole effects in anomalous reflective single-layer planar static passive metal-dielectric-metal (ground) structures and report the formation of Toroidal Dipoles (TDs) and anapoles within cells.
Thanks to the developed technique, we significantly improve undesired modes suppression as compared to same size PG-design SES. Anomalous diffraction-grating behavior is observed on increasing 1D array size with all Floquet modes response getting sharp without any change in their respective scattering direction or magnitude. At the same time non-Floquet mode spurious radiations suppression is enhanced.
The paper is organized as follows. In Section 2 the SES radiation mechanism modeling is discussed, in Section 3 the proposed methods is presented and results on its application are discussed. Section 4 links the beneficial effects of the proposed approach to the theory of multipoles that is used to justify the obtained suppression of the undesired reflections, while Section 5 discusses diffraction grating-like behavior. Finally in Section 6 concluding remarks are summarized.

2. SES Radiation Mechanism Modeling

SESs are inspired by metasurface design therefore analytical models of radiation mechanisms of metasurface hold true for SESs. Electromagnetic wave interaction with one-dimensional periodic SES structure (with period, D, along y-axis) can be modeled analytically using Bloch–Floquet theorem []:
Ψ ( y ) = m = + A m e i k y , m y , with k y , m = k y + 2 m π D .
Here, Ψ ( y ) denotes the field expressed as a superposition of plane waves, A m are the expansion coefficients, k y is the fundamental propagation constant, k y , m are the spatial harmonics of the wavevector, D is the period of the structure, and m is an integer denoting the diffraction order. This is used to further develop analytical models for electromagnetic wave interaction with metasurfaces.

2.1. Homogenized Effective Medium Model

For a 2D planar SES with thickness h < < λ / 2 , above interaction can be modeled by a slab with 3D homogenized effective medium parameters. This electromagnetically thin homogeneous slab can be further simplified into an effective zero-thickness sheet model by considering spatial fields variations inside this homogeneous slab (now called metasurface) to be negligible []. This allows it to be modeled using 2D effective medium parameters instead of 3D as long as the assumption about negligible field variations inside the slab holds true. To model this electromagnetically thin sheet as an electromagnetic boundary where desired wave-manipulation will take place, 3 techniques are used. The first one is an Impedance Boundary Conditions (IBCs) technique for bi-anisotropic metasurfaces which models the electric and magnetic field discontinuities at the interface (the zero-thickness sheet) as the equivalent impedance and admittance conditions, expressed by Equations (2) and (3).
n × ( E 2 + E 1 ) 2 = Z ¯ ¯ e e · n × ( H 2 H 1 ) + K ¯ ¯ m e · n × ( E 2 E 1 ) .
n × ( H 2 + H 1 ) 2 = Y ¯ ¯ m m · n × ( E 2 E 1 ) + K ¯ ¯ e m · n × ( H 2 H 1 ) .
Here, Z ¯ ¯ e e denotes the electric surface impedance tensor, Y ¯ ¯ m m the magnetic surface admittance tensor, and K ¯ ¯ e m and K ¯ ¯ m e the electric-to-magnetic and magnetic-to-electric surface coupling tensors, respectively. n ^ × E and n ^ × H are the components of the field tangential to the surface. n ^ being the unit vector orthogonal to it.
The second approach uses the polarizability model [] which considers the sub-wavelength meta-atoms/UCs as equivalent electric and magnetic dipole moments. These sub-wavelength coupled electric and magnetic dipolar sources combine to form the metasurface and the fields re-directed by each of these add up to form the far-field radiation pattern. The electric ( p ) and magnetic ( m ) dipole moments are related to the local fields E loc and H loc , at the location of particle dipoles due to incident fields by polarizability dyadics, as shown in Equation (4):
p m = α ¯ ¯ ee α ¯ ¯ em α ¯ ¯ me α ¯ ¯ mm · E loc H loc
The four polarizability dyadics are the electric-electric polarizability tensor α ¯ ¯ ee , the electric-magnetic cross-polarizability tensor α ¯ ¯ em , the magnetic-electric cross-polarizability tensor α ¯ ¯ me , and the magnetic-magnetic polarizability tensor α ¯ ¯ mm .
E loc and H loc are given by Equations (5) and (6):
E loc = E inc + β ¯ ¯ e · p
H loc = H inc + β ¯ ¯ m · m
where interaction constants are []:
β ¯ ¯ e = j ω η 0 4 S 1 1 i k R exp ( i k R ) I ¯ ¯ t
+ j η 0 ϵ 0 μ 0 ω 3 6 π η 0 ω 2 S I ¯ ¯ t
β ¯ ¯ m = β ¯ ¯ e η 0 2
Here S = a 2 is the UC area, k = ω ϵ 0 μ 0 is the free-space wave number, η 0 = μ 0 / ϵ 0 is the free-space wave impedance, R = a / 1.438 for a square arrangement of dipoles, I ¯ ¯ t = I ¯ ¯ n ^ n ^ is the tangential unit dyadic, and { is the real part.
The third model that can be used is the susceptibility model, also known as the Generalized Sheet Transition Conditions (GSTC), which takes into account both tangential and normal material parameters. Electric and magnetic surface polarization densities are related to effective surface susceptibilities of the sheet. According to it, for time-invariant metasurface the electric polarization density P and the magnetic polarization density M have the expression in Equations (9) and (10) []:
P = ϵ 0 χ ¯ ¯ e e · E av + 1 c χ ¯ ¯ e m · H av
M = χ ¯ ¯ m m · H av + 1 η 0 χ ¯ ¯ m e · E av
where E av and H av are the average electric and magnetic fields, ϵ 0 is the permittivity of free space, c is the speed of light in free space, and χ ¯ ¯ e e , χ ¯ ¯ m m , χ ¯ ¯ e m , χ ¯ ¯ m e are the electric, magnetic, electro-magnetic, and magneto-electric susceptibility tensors, respectively.
Except the polarizability model, both afore-mentioned zero-thickness sheet models view meta-surface in terms of its macroscopic response represented through effective materials parameters like refractive index, permittivity, admittance and impedance. These models approximate the impact of field configurations in the geometry of scatterers structure. This diminishes contribution of bi-anisotropy and non-locality in macroscopic response due to modeling approximations. The polarizability model is based only on electric and magnetic dipole moments due to interaction of incoming wave with the geometric structure of individual scatterers which can be represented by sheet electric and magnetic surface current densities radiating free space plane waves:
J e = ( j ω p ) / ( S )
J m = ( j ω m ) / ( S )
The reflected field of a meta-surface can therefore be written as the sum of sheet currents in Equations (11) and (12) and is given by Equation (13):
E r = j ω 2 S · [ η 0 p n ^ × m ]
However, polarizability model is also based on zero-thickness sheet approximation and ignores contribution of spatial field variations within the finite thickness geometry of the individual scatterers towards any dipole formations in the meta-surface. Moreover, it only considers electric and magnetic dipoles as radiation sources of the structure.

2.2. Multipole Scattering Model

The multipoles scattering model defines radiation from a structure taking into account the volumetric charge-current distributions unlike homogenization models that are based on sheet currents of electric and magnetic dipoles only. This diminishes the possibility to observe and model presence of toroidal dipole moments formed in individual scatterers due to peculiar charge-current distributions []. From the perspective of interaction with external fields and radiative capability, TD are of two types. The first one are related to static or non-radiating type charge-current configuration [] and are called static TD or anapole mode and while the second type refers to radiating type and are called as dynamic TD. The dynamic TD radiates similar to ED [] but based on a different charge-current configuration. Dynamic TD have opposite space-parity and time-parity properties [] from MD and ED, respectively. Dynamic TD are also of two types. The electric TD and magnetic TD. Electric toroidal dipole is formed by head-to-tail arrangement of magnetic dipole moments due to surface currents flowing along the meridian of a torus forming a ring of meridian surface currents on torus. Magnetic TD is formed by head-to-tail arrangement of electric dipole moments []. The far-field of an array of TD orientated along the xy-plane and radiating in z-direction using Cartesian coordinate system is given by Equation (14) []:
E s = μ 0 c 2 k 2 2 S 2 T exp ( i k R )
in which E s is the scattered electric field, μ 0 is the permeability of free space, k is the free-space wavenumber, S is the UC area, T is the projection of the toroidal dipole moment, T , onto the plane of the array, and R is the distance from the array plane to the far-field observation point. The subscript ( · ) denotes the projection of a vector onto the plane of the array. If the array lies in the x y plane, then the projection of the toroidal dipole is given by Equation (15):
T = T x x ^ + T y y ^
where T x and T y are the Cartesian components of the toroidal dipole.
In general, the projection can be written as in Equation (16):
T = T ( T · R ^ ) R ^
where R ^ is the unit vector from the plane of array of toroidal dipoles to the observation point in far-field.
From the perspective of theory of electromagnetic multipoles, multipole decomposition is used for calculating the formation of individual multipoles in a structure and their corresponding contribution to far-field scattering cross-section of structure. Dipole moments are defined using the displacement current, J , in the structure due to incident field []. Electric, magnetic and toroidal dipoles present in a structure, orientated along the xy-plane with height along z-axis, are given in Cartesian coordinate system by Equations (17)–(19) [,].
Electric Dipole (ED) Moment:
p = 1 i ω J d 3 r
Magnetic Dipole (MD) Moment:
m = 1 2 c ( r × J ) d 3 r
Toroidal Dipole (TD) Moment:
T = 1 10 c r ( r · J ) 2 r 2 J d 3 r
where p [C · m] is the electric dipole moment vector, m [A · m2] is the magnetic dipole moment vector, T [C · m2] is the electric toroidal dipole moment vector, J ( r ) [A/m2] is the displacement current density on the structure giving rise to dipoles, r [m] is the position vector from the dipoles to observation point, r = r [m] is the magnitude of the position vector of dipoles. In the present case, the displacement current density could be evaluated through Equation (20):
J = i ω ε 0 ( n 2 1 ) E
where E is electric field at the dipole position and n is refractive index of the structures.
Radiation from scattering currents can be used to represent scattering from objects. From the electromagnetic multipoles theory perspective, scattered power of these dipole moments can be calculated from scattering currents of individual multipoles which are given by Equations (21)–(23) []:
I p = 2 ω 4 3 c 3 p 2
I m = 2 ω 4 3 c 3 m 2
I T = 2 ω 6 3 c 5 T 2
The total scattered power considering electric, magnetic and electric toroidal dipole moments as in our structure is therefore calculated using the scattering currents as in Equation (24):
I total = I p + I m + 4 ω 5 3 c 4 ( p · T ) + I T
Finally, the scattering cross-section can be obtained by Equation (25) [,]:
C sca sum k 0 4 6 π ϵ 0 2 E inc 2 p + i k 0 T 2 + k 0 4 ϵ d / μ 0 6 π ϵ 0 E inc 2 m 2 .

2.3. Comparison of Radiation Mechanism Analytical Models

Analysis of both analytical models of radiation mechanism reveals fundamental differences and unique properties. The effective medium model, and its techniques, are based on radiation from surface currents on a sheet thereby eliminating any possibility to model volumetric charge current distributions effects into the radiation calculations. This makes the definition of radiation mechanisms inadequate, eliminates possibility to model bi-anisotropy due to interactions occurring within finite volume of the structure which are orthogonal to the plane of structure and therefore makes optimization non-global. Moreover, they are based on simplifications of wave-matter interaction in structure and generalization assumptions thereby reducing the range of phenomena that can be defined and modeled in comparison to those which are actually taking place in a SES structure for a particular wave-manipulation goal. However, over a period of time they have been elaborately developed at application-level with limits on wave-matter interactions possible in a structure. Multipolar decomposition model takes into consideration the volumetric effects of charge-current distributions inside the structure giving more control over defining and modeling the wave-matter interactions for a desired wave-manipulation task. However, for anomalous reflective SES it is not as developed as the homogenization-based effective medium parameters model. Although multi-polar decomposition model has more accuracy than effective medium model due to greater possibility of defining the underlying phenomena, it is not equally developed for anomalous reflective passive planar SES. Analytical methods that combine strengths of both models is a research gap.

3. Proposed Approach

In the previous section we analyzed the fundamental differences in the analytical modeling of the interaction and scattering of electromagnetic waves from SES based on the effective medium and multipolar expansion approaches. Due to their unique characteristics, we leverage the strengths of both models in our design. Therefore, we resort to full-wave simulations to confirm our methods as an analytical approach combining both models is an existing research gap. We consider a static passive planar anomalous reflective SES at 8 GHz. The SES lies in the x y -plane and is designed for anomalous reflection (Floquet mode, m = + 1 ) towards θ = 60 and ϕ = 90 , when a normally incident TM-plane wave in impinging on it. The SES structure is a single-layer, planar metal-dielectric-metal configuration with perfect electric conductor (PEC) layers on the top and bottom of the substrate. A sketch of the SES, with the reference system and the incident and desired pointing directions is shown in Figure 1.
Figure 1. Sketch of SES with the adopted reference system, the considered incident and pointing vectors and indication of the related angles. The SES is lying in xy-plane. The incident and pointing vectors are in the yz-plane. θ i and ϕ i indicate the incident plane wave, while θ r and ϕ r show the direction in which re-radiated anomalous wave must point.

3.1. Initial Unit Cell

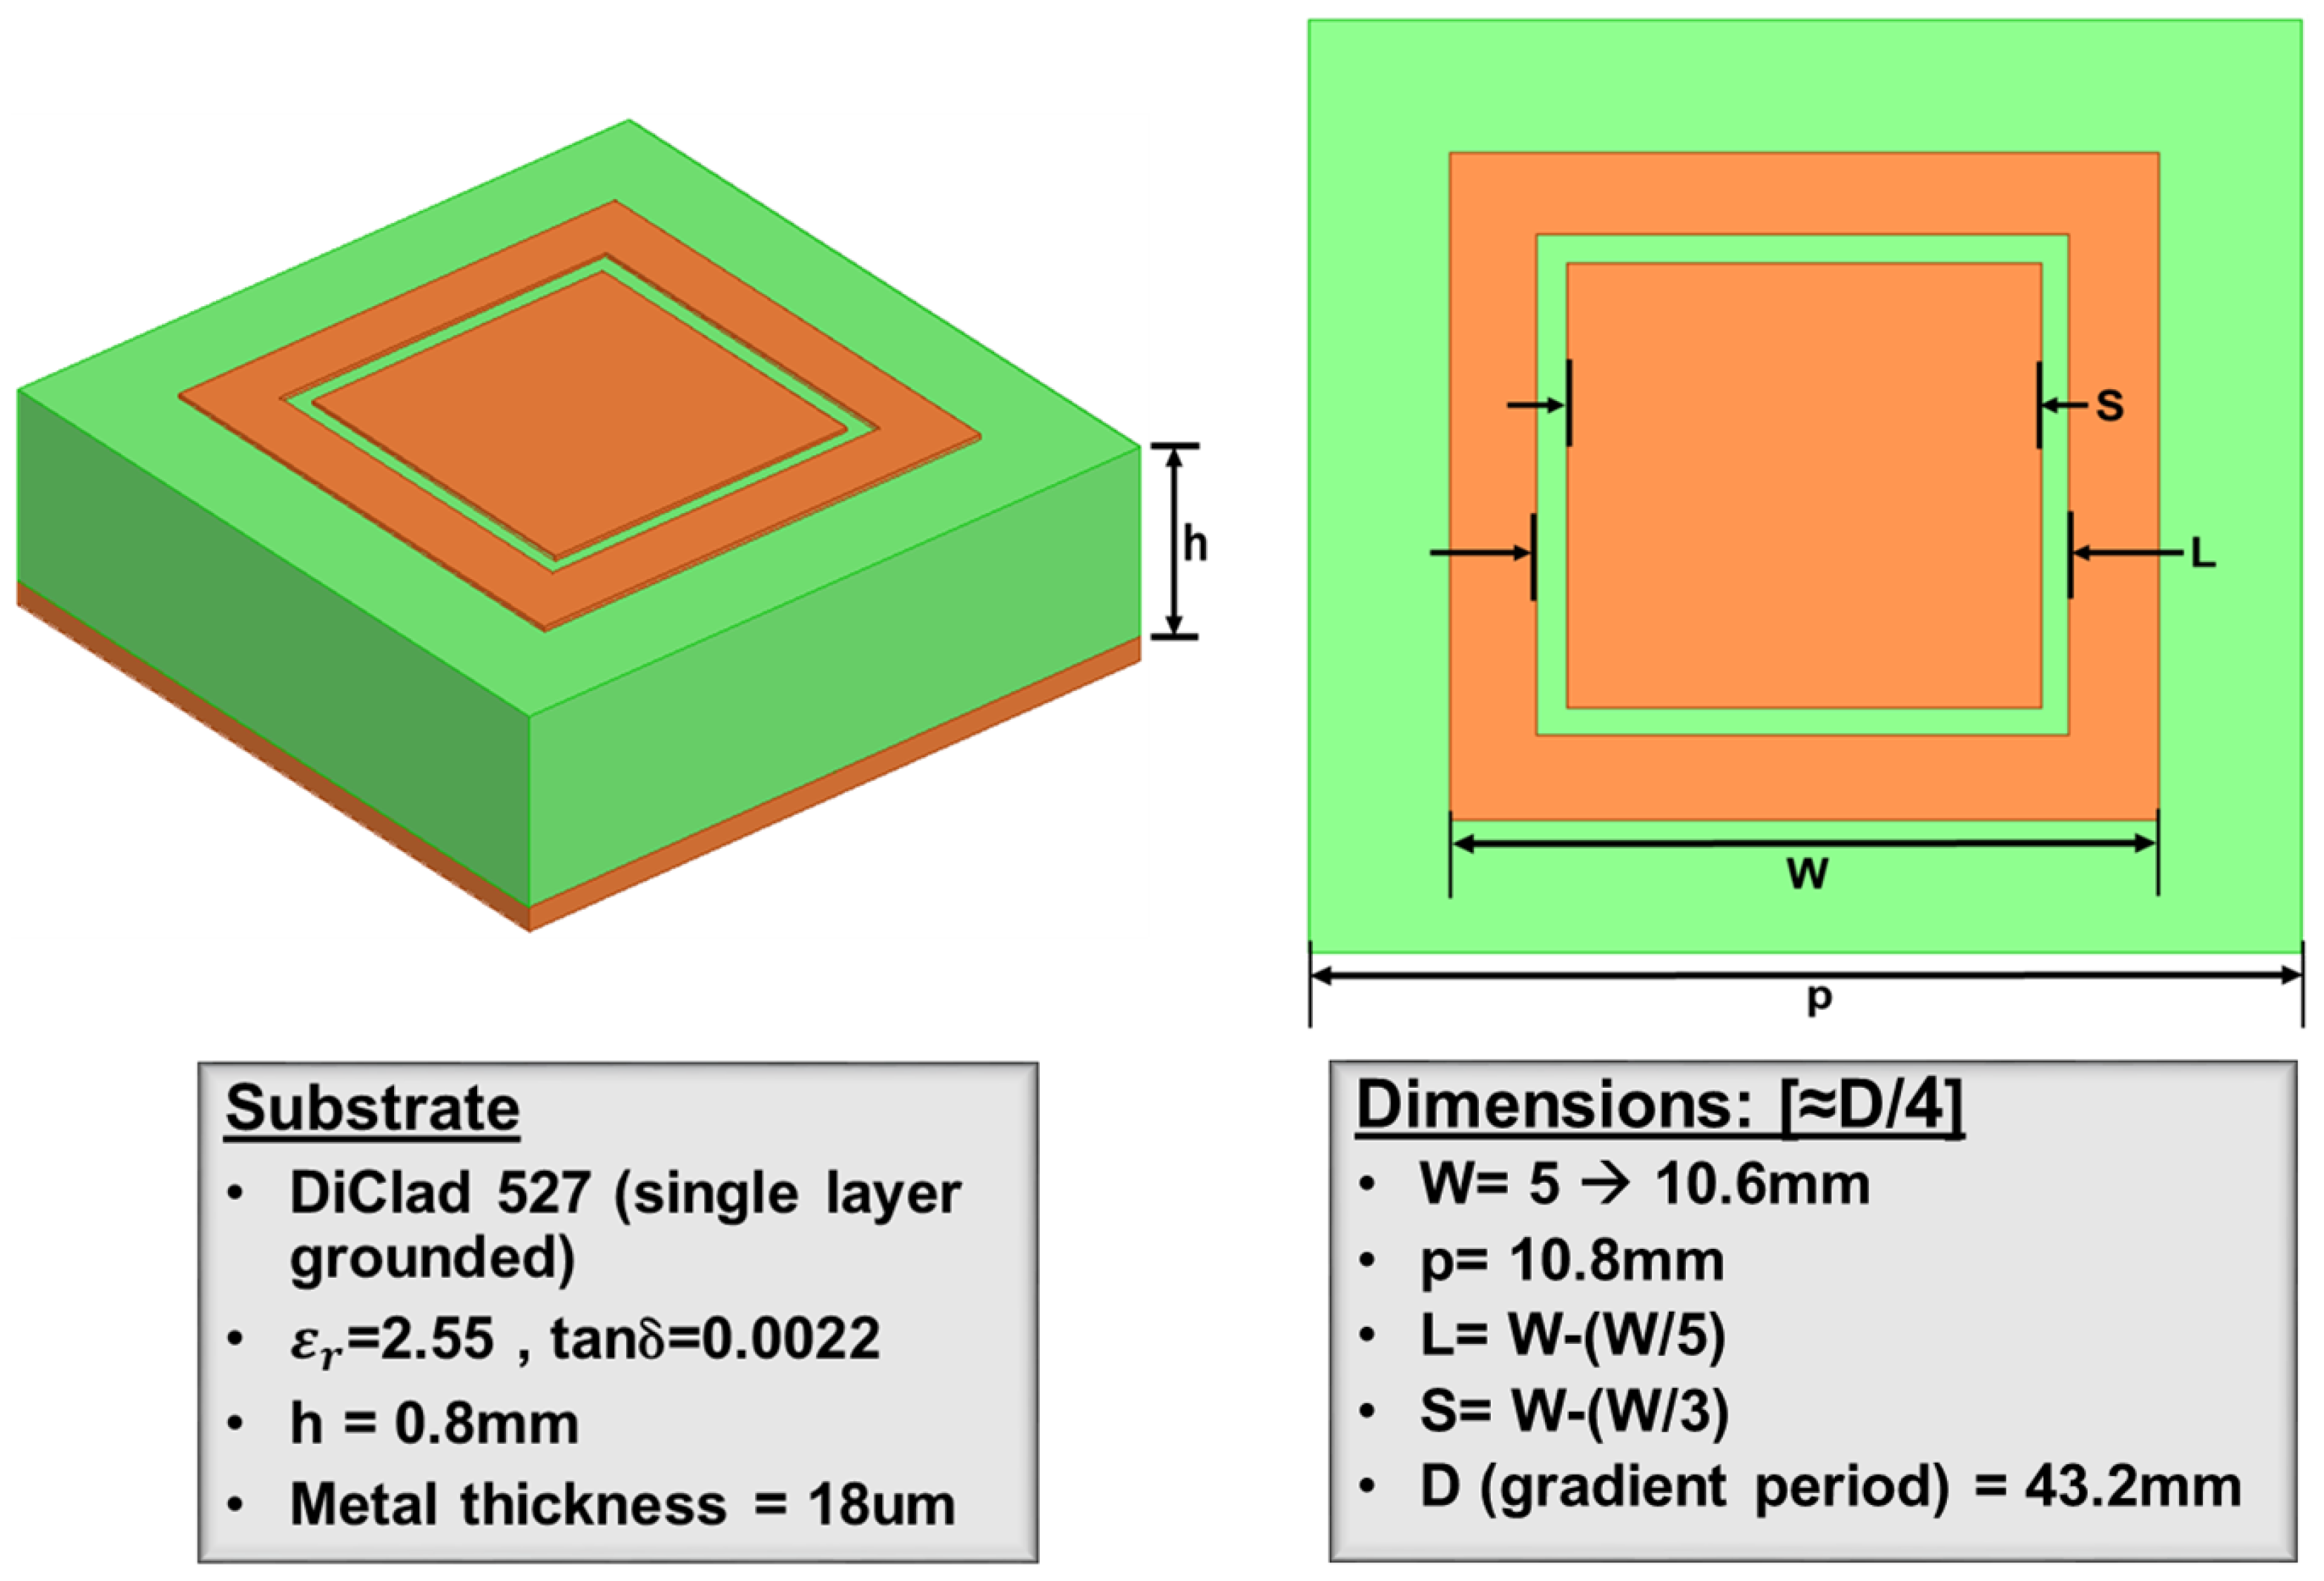
The UC and substrate characteristics are detailed in Figure 2 and summarized in the following. The single layer substrate is made of Rogers® DiClad 527 dielectric material with relative permittivity ε r = 2.55 and loss tangent tan δ = 0.0022 , having a thickness h = 0.8 mm. The top metal is a PEC layer having a thickness of 18 µm and ground plane is defined by a 2D PEC sheet. A square ring and an inner square patch are printed on the top layer of the substrate. The size of the UC is p = 10.8 mm, which equals D / 4 at the design frequency, f = 8 GHz. D is the gradient period at f = 8 GHz for desired anomalous reflection. The size of outer side of the square ring is W, the inner side of square ring is L = W W / 5 and inner patch is S = W W / 3 . The UC was simulated using ANSYS® Electronics Desktop R2023 using periodic boundary conditions (using Floquet ports along z-axis and two independent sets of primary and secondary periodic boundaries along x and y axes) for a normally incident plane wave.
Figure 2. UC: geometry and materials characteristics.
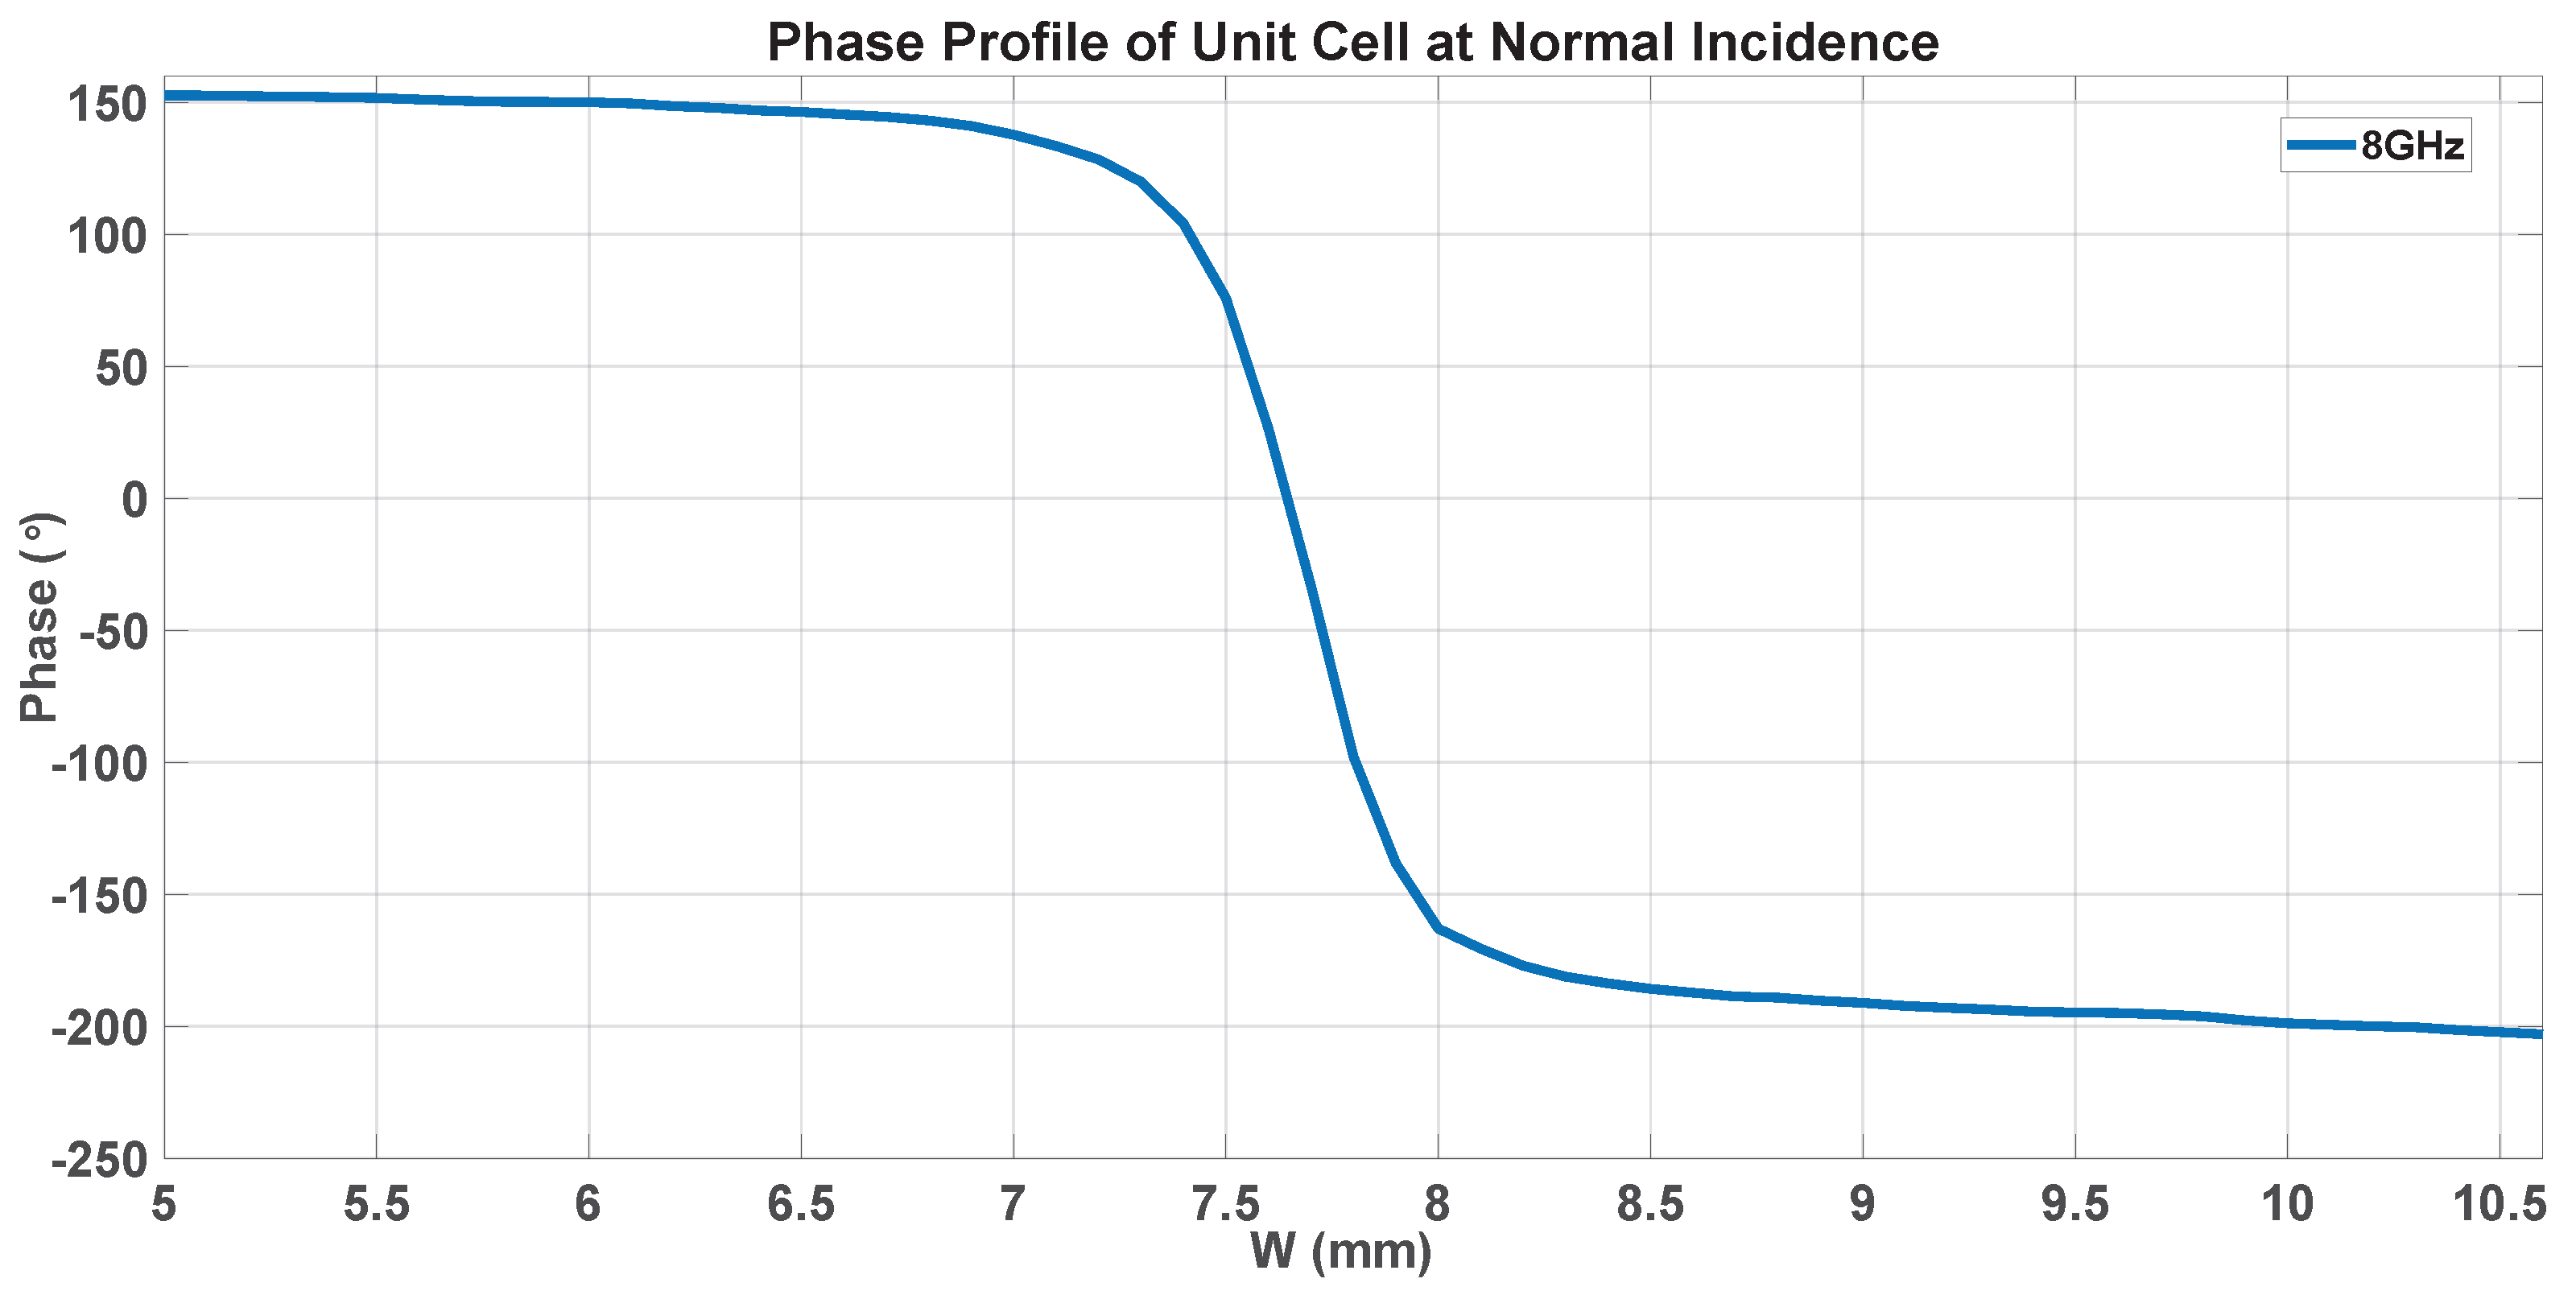
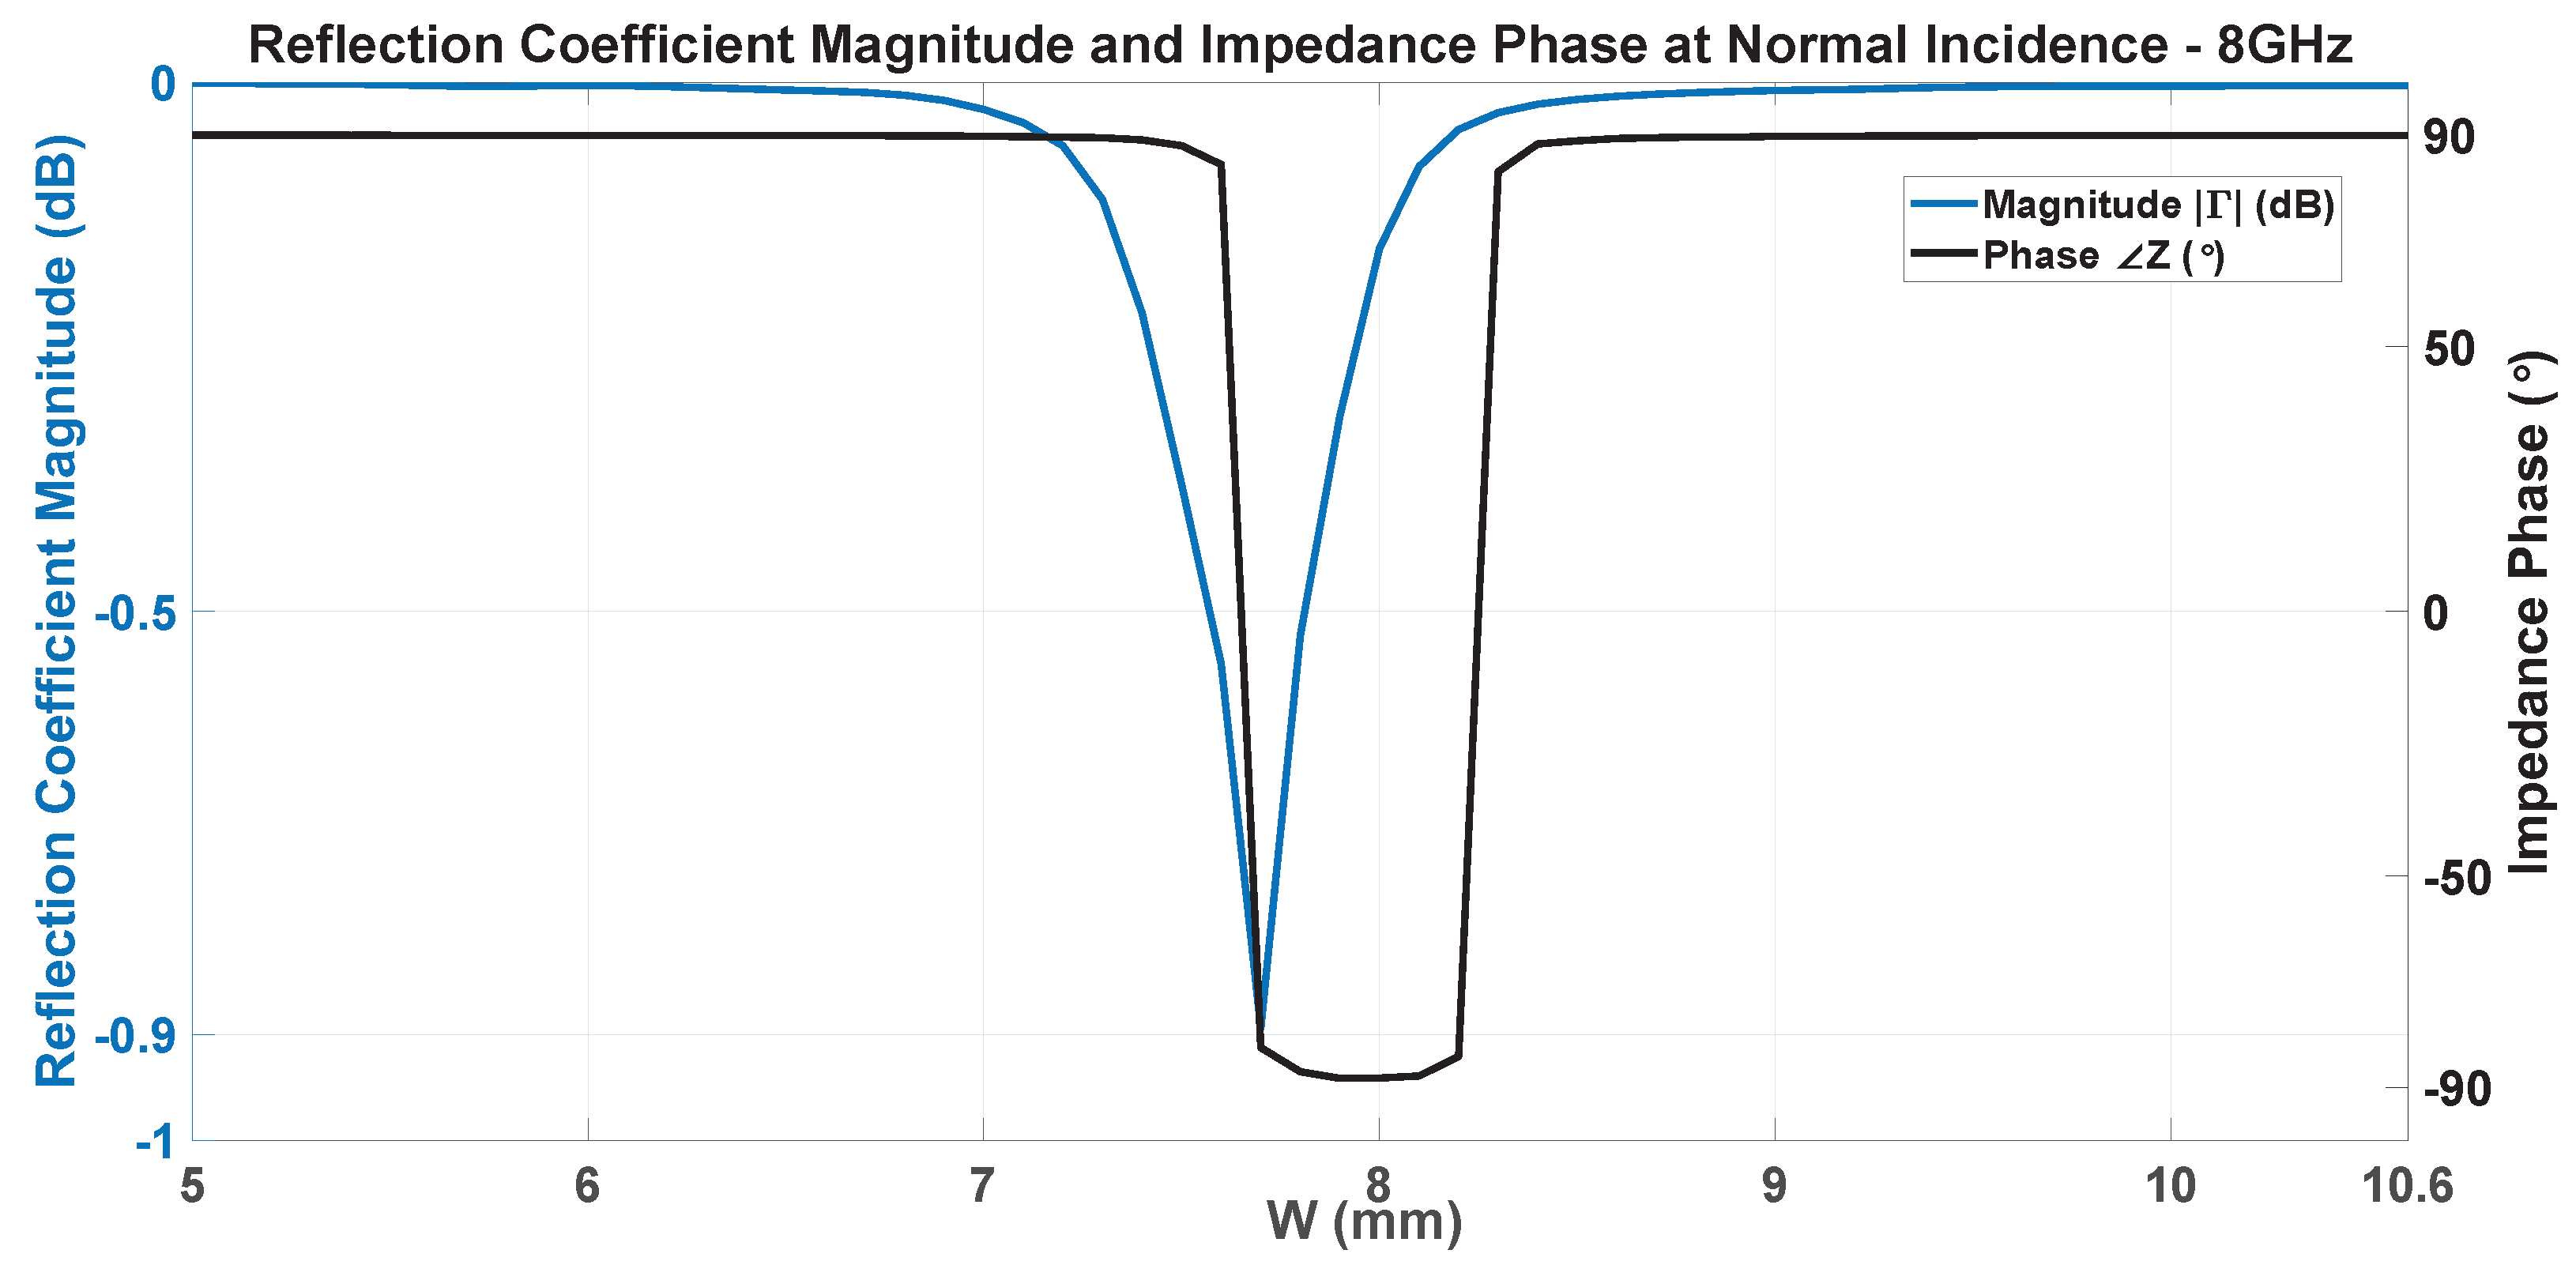
In Figure 3 and Figure 4, the behavior of the phase and magnitude of S 11 provided by the UC when the side W of the square ring is varied (from W = 5 mm to W = 10.6 mm) is plotted. The phase covers a range of variation of approximately 360 , while the magnitude is never lower than −0.9 dB over the entire interval of variation for W.
Figure 3. Variation of the phase of S 11 with the geometrical free parameter W of the UC.
Figure 4. Variation of | S 11 | and of the phase of the impedance with the geometrical free parameter W of the UC.
In Figure 4, the behavior of the phase of the impedance Z is also reported, confirming good resonance matching as indicated by phase inversion in correspondence to the resonant size of the UC.

3.2. PG Super-Cell Definition

Let consider a smart skin consisting of one row of UC along y and designed to have anomalous reflection in the y z -plane. Therefore, it is possible to define a spatial period D y given by Equation (26) [,]:
D y = λ sin θ r sin θ i
where θ i is the angle of incidence, and θ r is the reflection angle defined in the reference system in Figure 1. This period is covered by a super-cell with the same size at its turn discretized by a proper number of UCs.
The phase variation over one period of the meta-surface along the y-axis is can therefore be written as in Equation (27)
ϕ ( y ) = 2 π y D y ,
which represents the tangential wavenumber difference at the boundary, multiplied by the cell position along y-axis, i.e.,
ϕ ( y ) = k ( sin θ r sin θ i ) y ,
In the case considered here, in which a normally incident plane wave is required to be reflected towards 60 , D y the gradient period for 2 π phase variation along y-axis at 8 GHz, results to be 43.2 mm []. In view of the UC size, 4 of them are required to discretize the super-cell as shown in Figure 5, where the phase required by each cell and the corresponding value of W are also shown.
Figure 5. Conventional super-cell based on generalized law of reflection and refraction.
The coordinate of the center of each UC along y-axis are 5.4 mm, 16.2 mm, 27 mm, 37.8 mm, respectively. Using the super-cell as basic radiating unit, PG-design based passive planar reflective SES composed of one dimensional array of 1 × 9 super-cells (388.8 mm) along y-axis is generated. The radar cross-section (RCS) at 8 GHz for this SES is obtained through full-wave electromagnetic simulation using time domain solver of CST® Microwave Studio 2015), and it is shown in Figure 6. For the full-wave simulation of the SES, a perfectly matched layer (PML) boundary was used along all three axes, with a minimum distance of λ / 4 to the structure at the center and the monitor frequencies. The simulation frequency range was chosen from 7 to 10 GHz in 100 MHz increments at the desired monitor frequencies. The normal background material was used without changing the surrounding material settings of the structure. A hexahedral mesh type was used in the solver setup with an accuracy of −30 dB. The default Gaussian-type plane wave excitation signal was used in the stimulation setting.
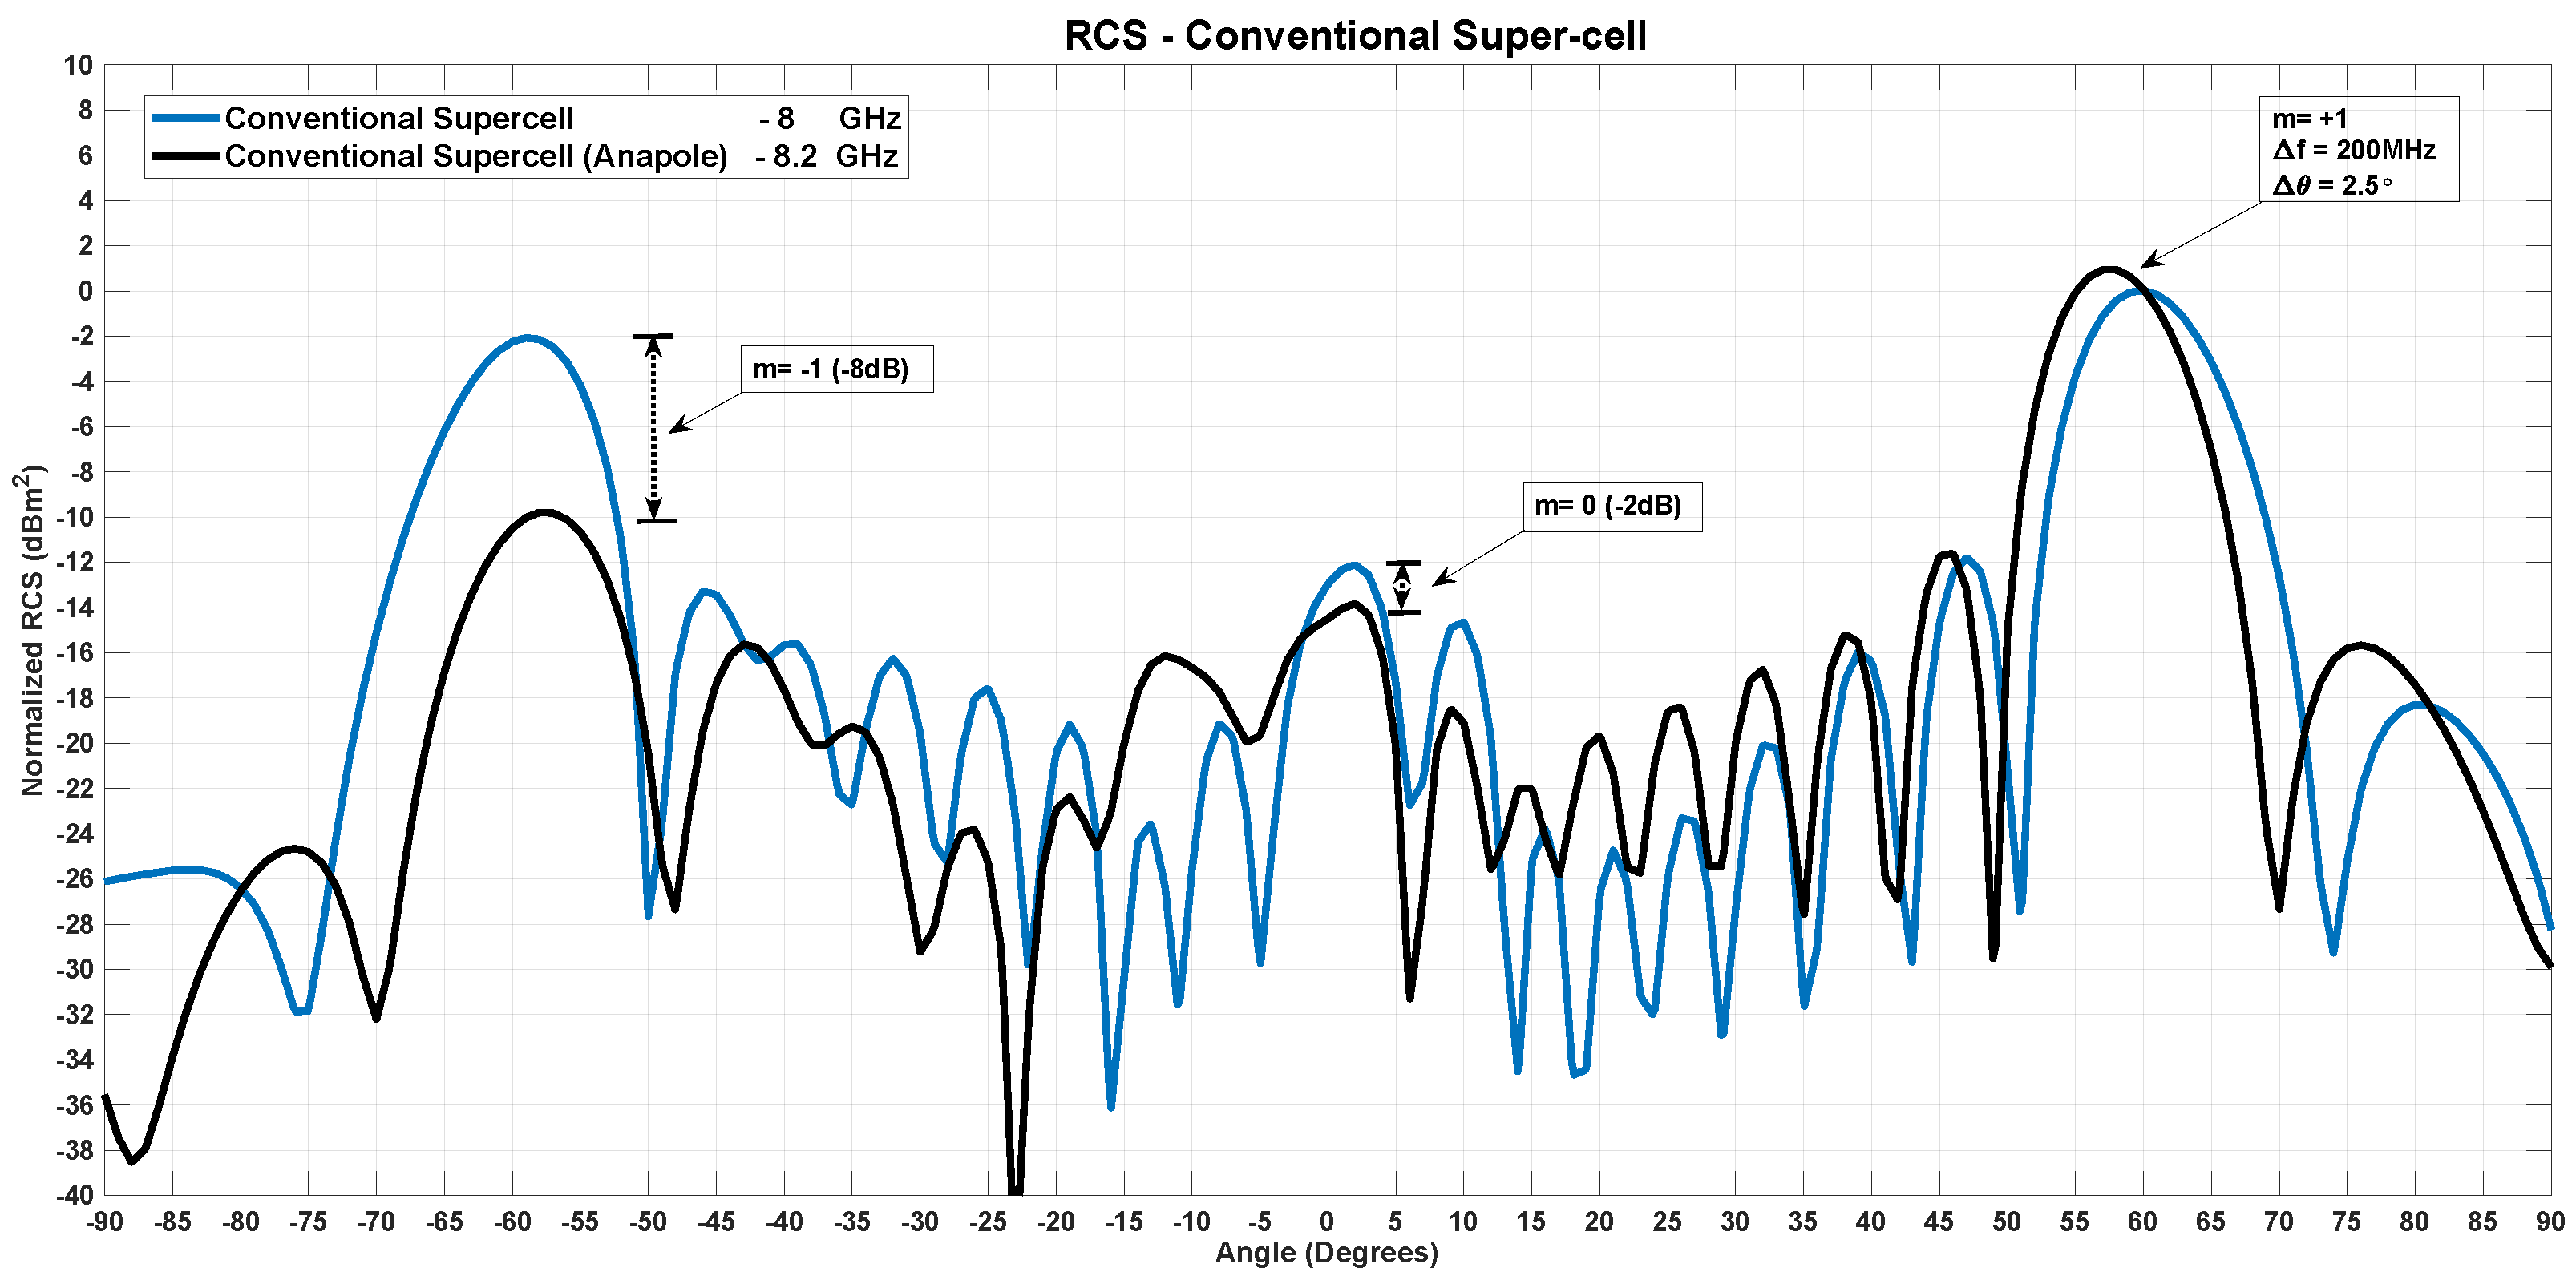
Figure 6. Anapole response in PG-based SES ( 1 × 9 super-cells): shift in pointing direction and frequency.
The RCS behavior evaluated at 8 GHz presents the desired beam pointing at 60 , that corresponds ti the radiation of m = + 1 Floquet mode. The lobe in the direction specular to the incidence ( m = 0 ) is no higher than the other lobes, while the lobe due to the Floquet mode m = 1 , pointing towards 60 is quite high, only 2 dB lower than the main beam. Performing a frequency scan of the RCS we find a better suppression response of undesired modes at 8.2 GHz i.e., 200 MHz away from design frequency. Due to spectral disposition 200 MHz away, RCS has a pointing error of 2 . 5 for m = + 1 . Geometric tuning of response frequency is possible by changing different sub-dimensions forming the scatterer structure and by changing the angular orientation of scatterer [].

3.3. UC and Super-Cell Modifications and Effects on the SES Performance

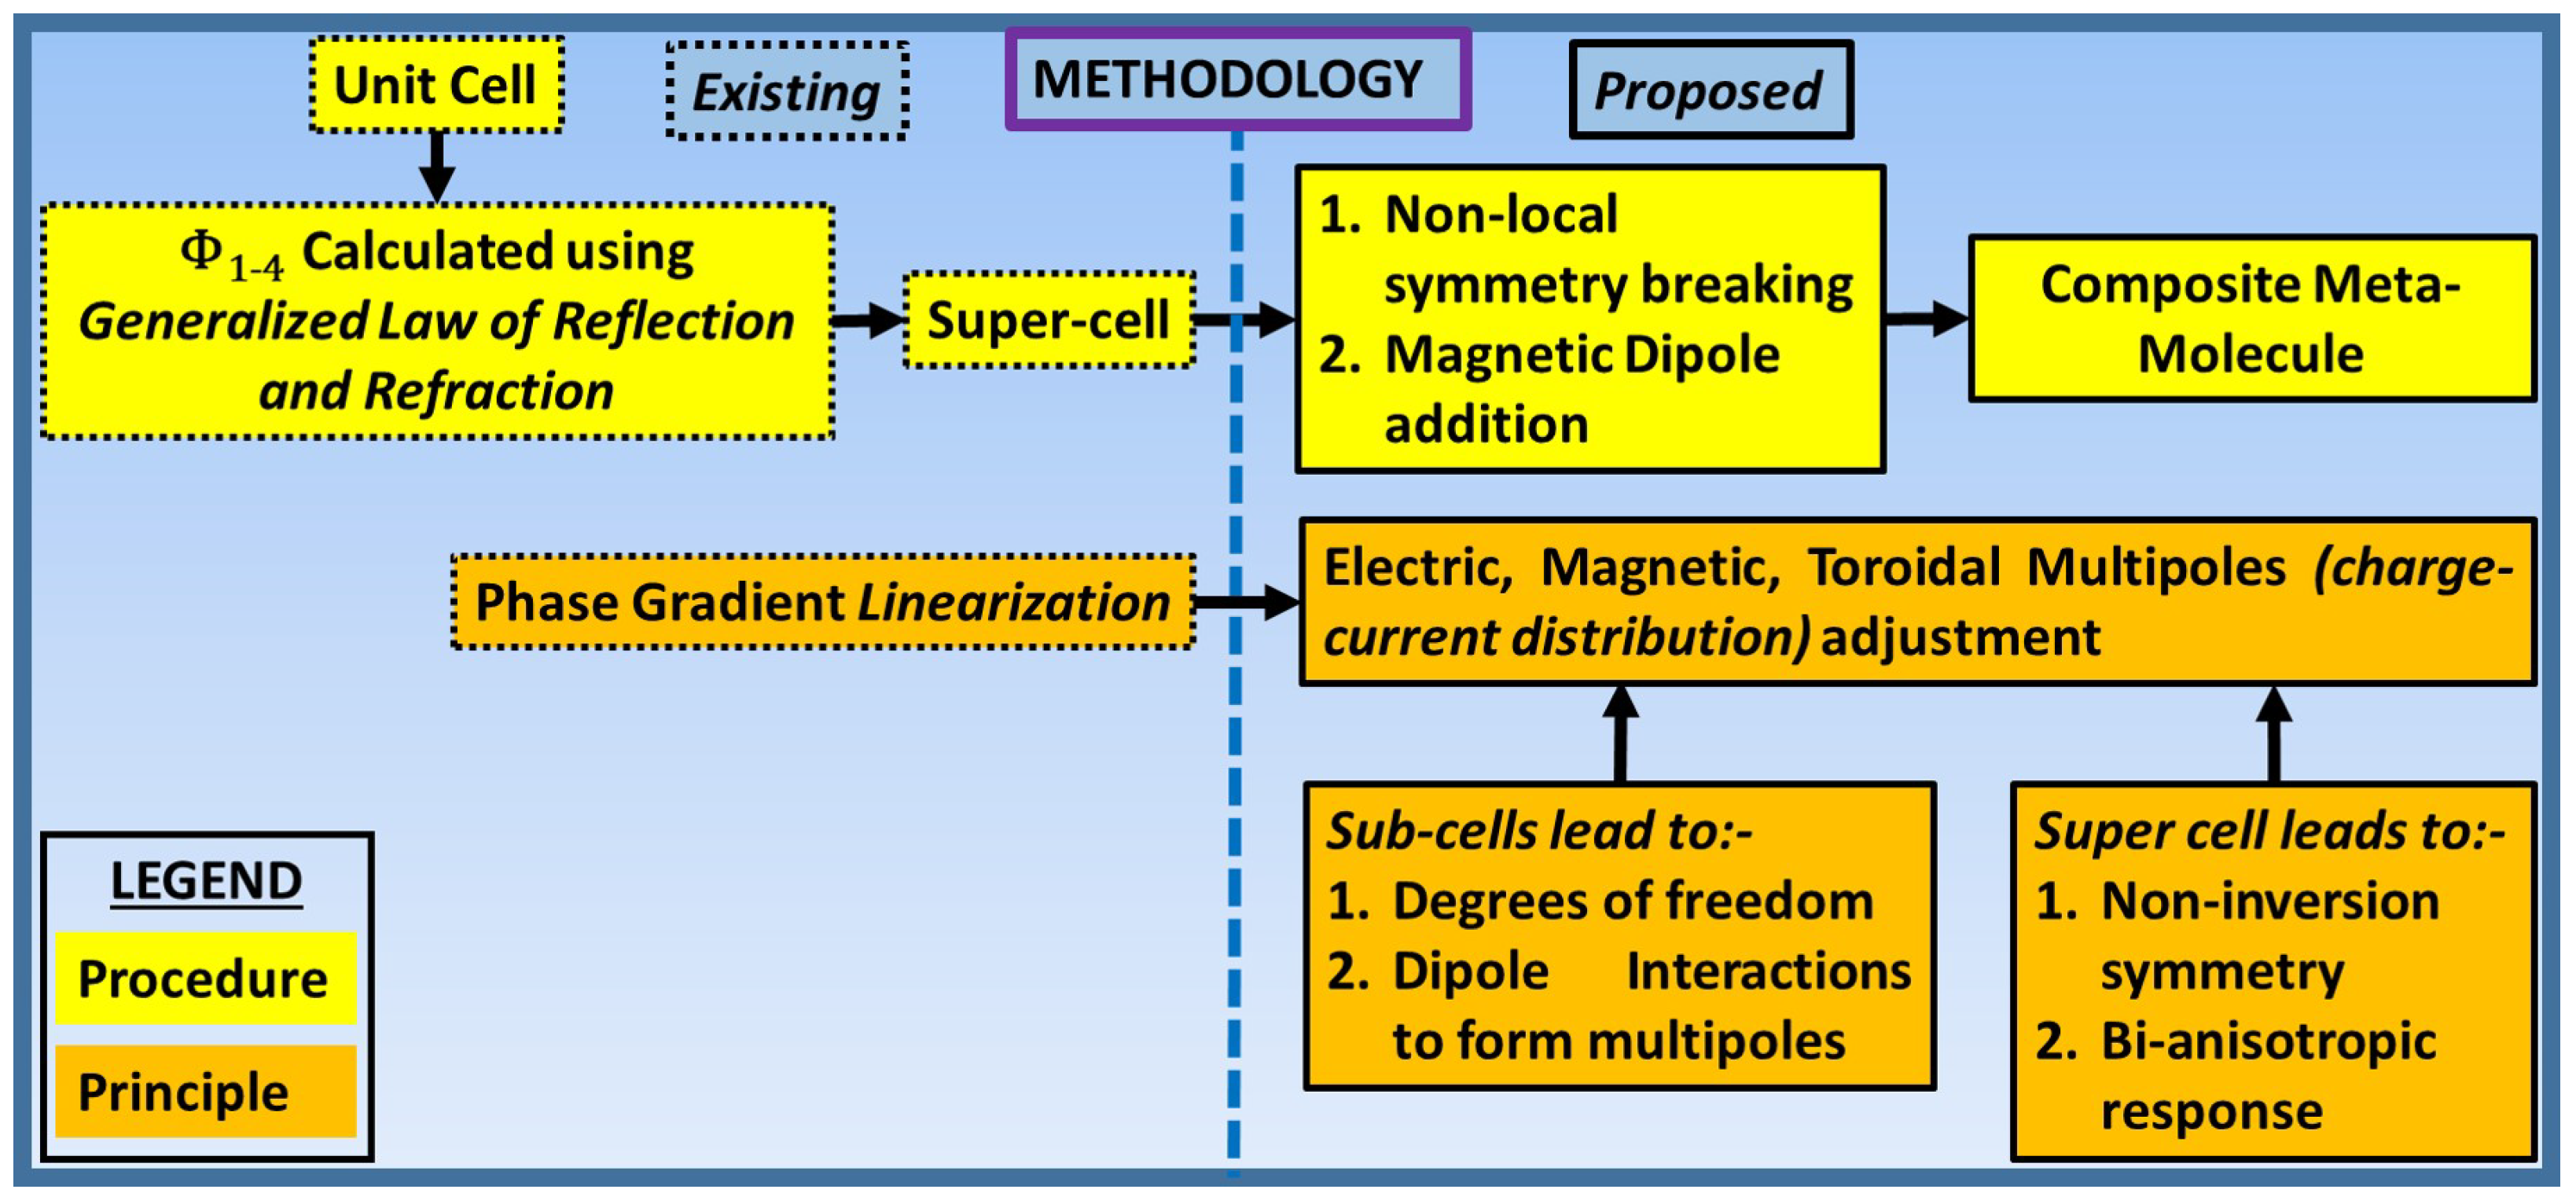
To overcome the drawback of the design procedure outlined above, here we propose a different approach, schematically described in Figure 7, that involves higher order symmetry breaking of UCs and non-local symmetry breaking of the super-cells to bring best possible undesired modes scattering suppression at the design frequency of 8 GHz. First, non-local symmetry breaking involves equal size reduction of only inner patches of the cells. Then all the inner patches are equally tilted by 3 . In the last step we introduce a magnetic dipole lateral to the super-cell gradient period direction of + y -axis, which also results in fine tuning of frequency response. Incorporating these changes we achieve a shift in the undesired modes scattering suppression which was initially observed at 8.2 GHz.
Figure 7. Sketch of the proposed methodology (Dotted lines show existing methodology and solid lines show proposed methodology).

3.3.1. Inner Patch Size Reduction

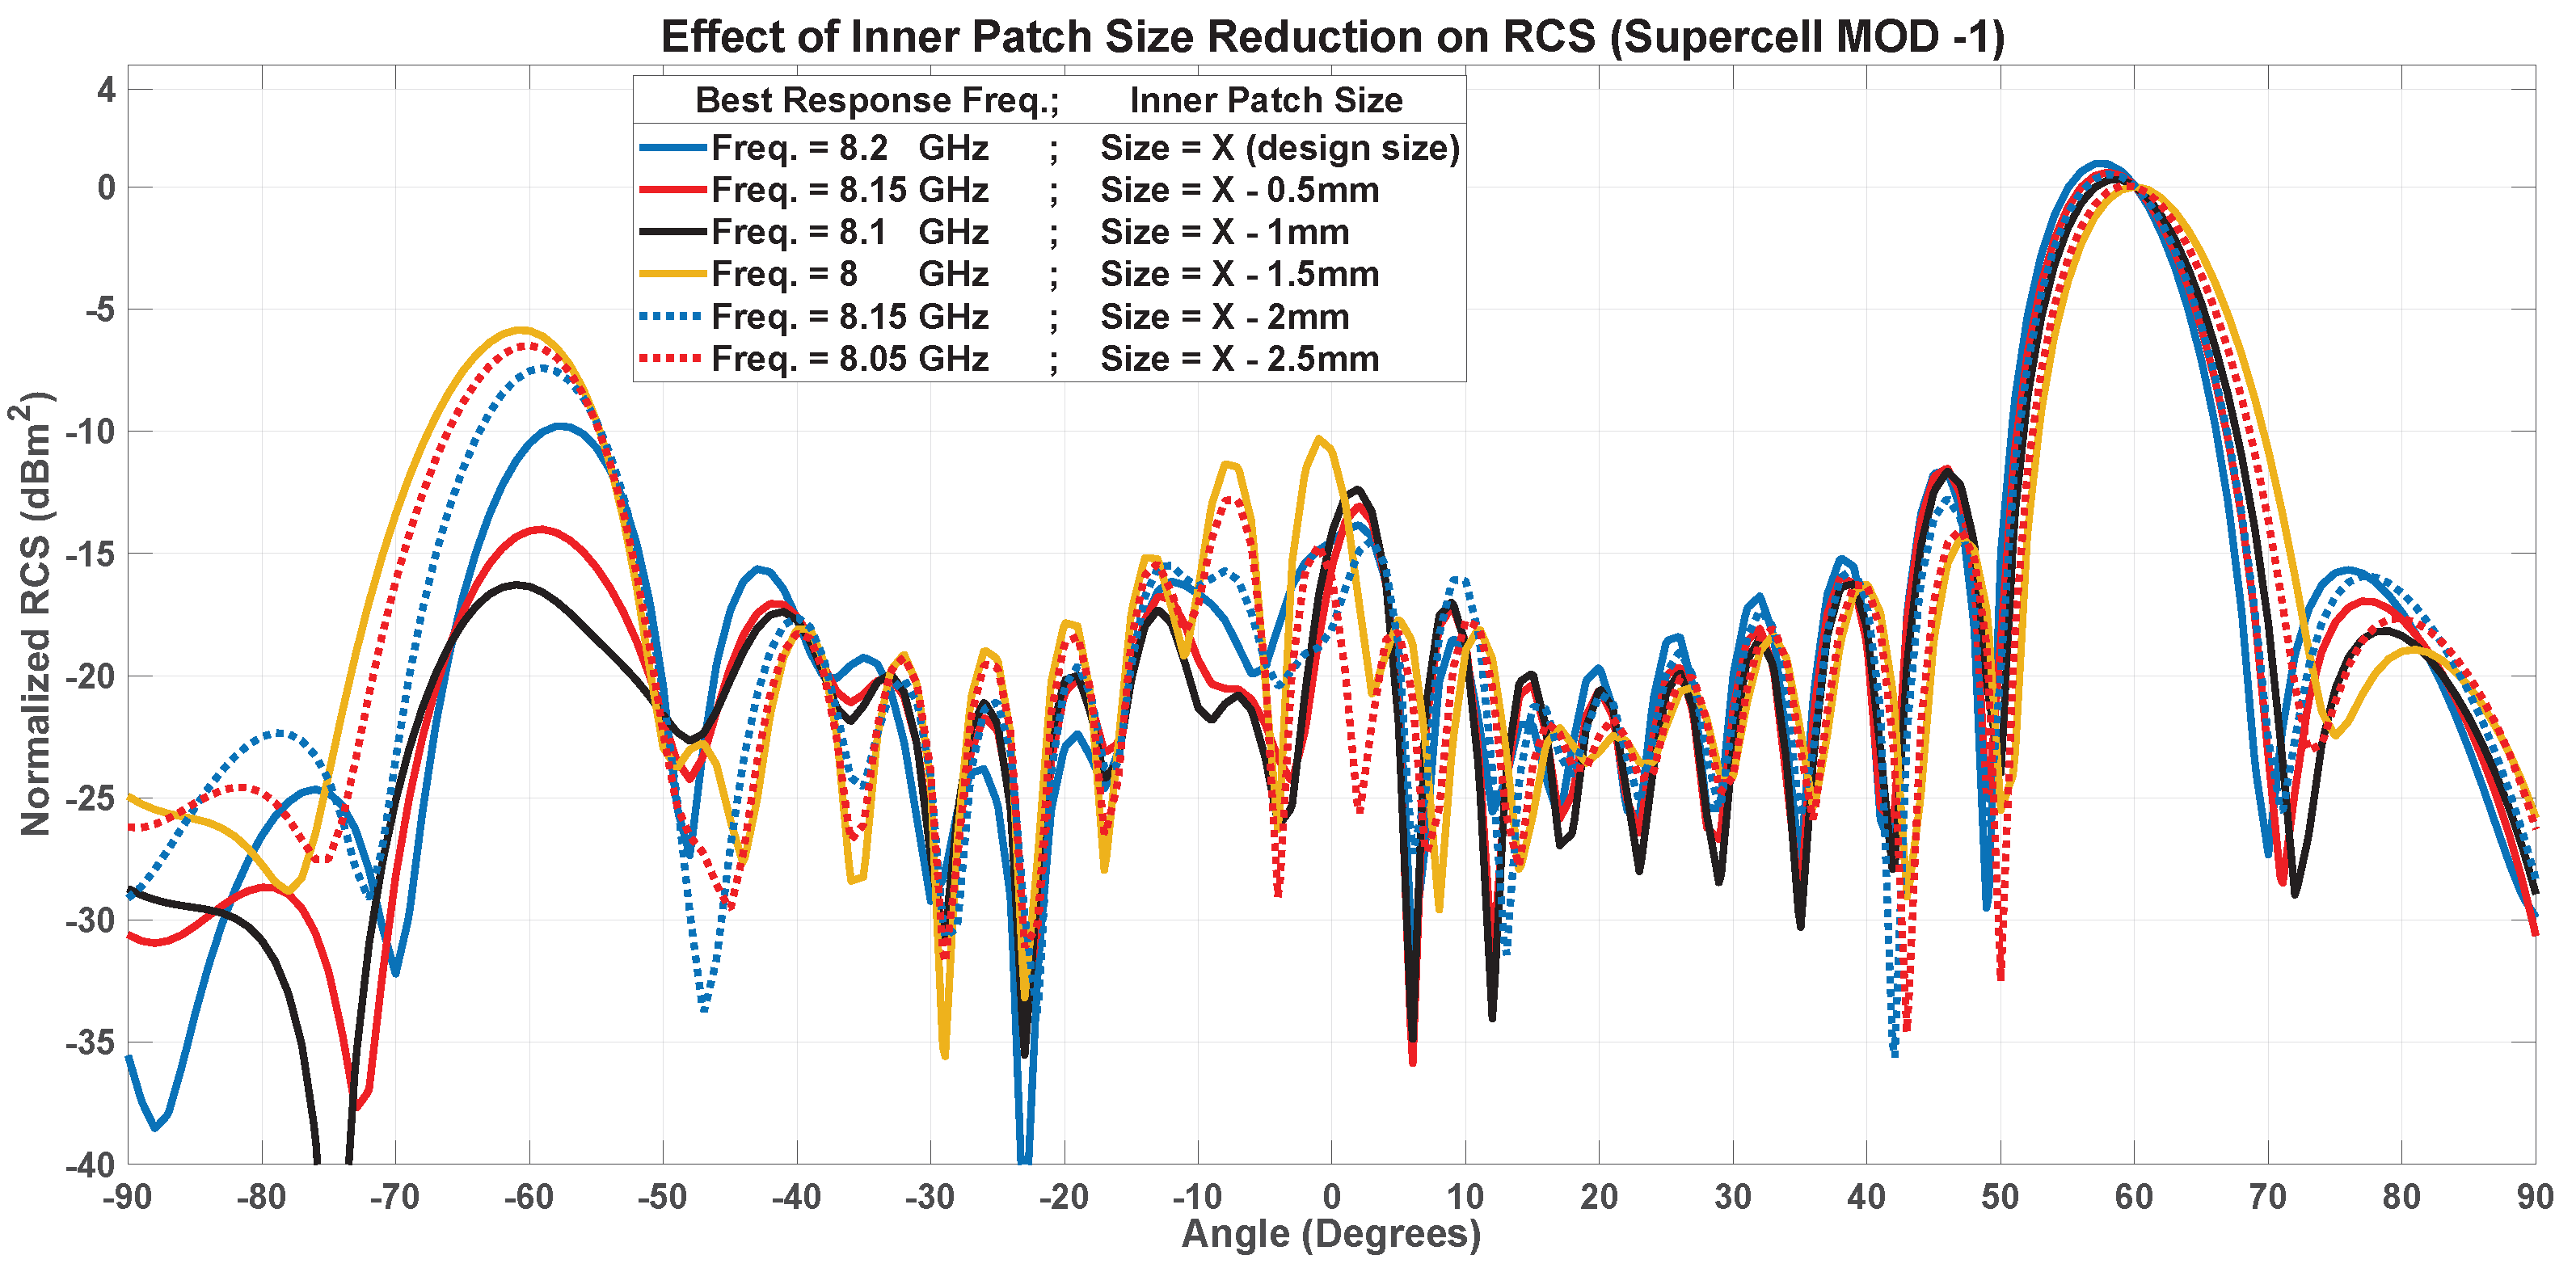
Firstly, we perform equal size reduction of all inner patches without any change to the outer patch. We start from the PG-design dimension of inner patch denoted by X. At X-1 mm i.e., 1 mm of equal size reduction of all inner patches of the super-cell there is a frequency down-shift of 100 MHz to 8.1 GHz. The RCS obtained at 8.1 GHz with this reduced size inner patch is shown in Figure 8 (black line); while the main lobe is almost unchanged, it is possible to notice a remarkable reduction of the m = 1 lobe.
Figure 8. Effect of reducing inner patch size (MOD-1) on RCS. Response shifting by 100 MHz (black graph).
Reducing the size beyond X-1 mm up to X-2.5 mm causes frequency oscillations of the suppression response of the order of 150 MHz. However, for size reduction beyond X-1 mm, undesired modes suppression is also degraded beyond conventional PG design therefore we limit first symmetry breaking modification to X-1 mm and use it to bring suppression response to 8.1 GHz.

3.3.2. Inner Patch Tilting

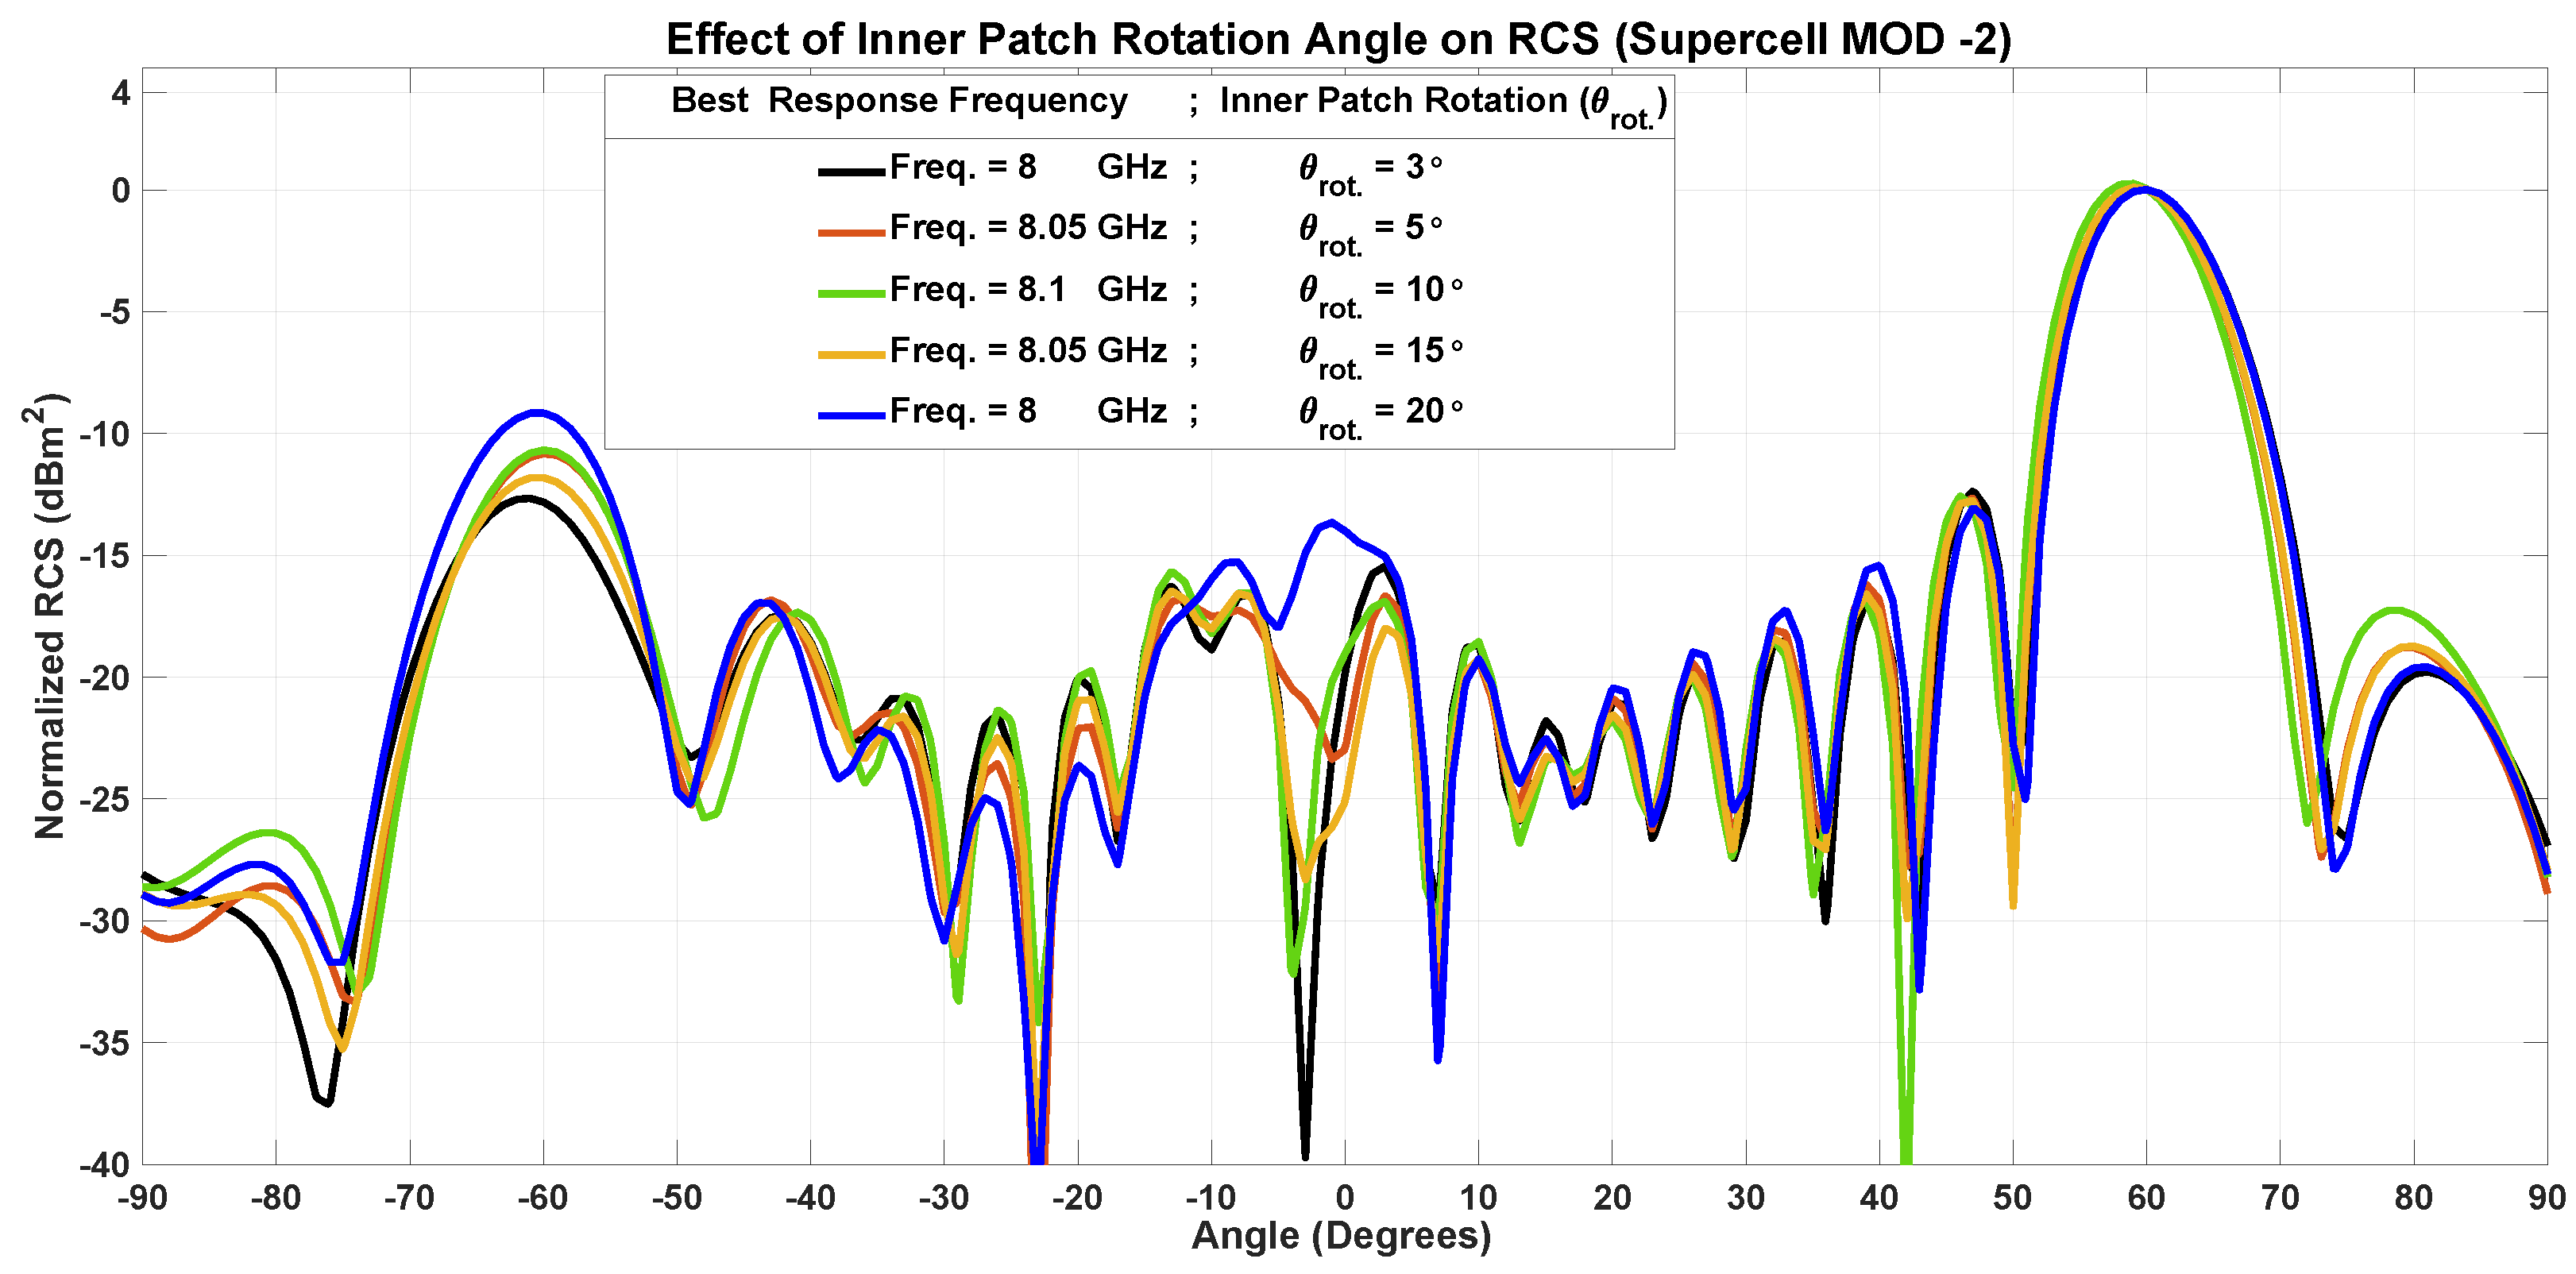
In the second symmetry-breaking modification, we tilt the inner patches of all cells equally, without changing the outer ring of the UC. Here, we observe frequency oscillations in the suppression response of approximately 100 MHz, which corresponds to a variation in the tilt angle, as demonstrated by the curves plotted in Figure 9. These curves, related to the RCS behaviors evaluated for various tilt angles, show that the best reduction of undesired lobes is obtained for θ r o t = 3 , so this value is adopted for the following analysis.
Figure 9. Effect of angular tilting of inner patch (MOD-2) on RCS. Response shifting by 100 MHz (black graph).

3.3.3. Introduction of Inner Patch Hole

The third change introduces an equally sized hole into each inner patch of the super-cell. Notably, adding a hole to each UC does not change its phase response (see Figure 10), indicating the inadequacy of the far-field phase of cells as the sole criterion for determining the far-field radiation pattern.
Figure 10. Phase profile comparison of UCs with same design parameters except fixed hole of 1mm diameter. Inset: (a) initial UC; (b) UC with hole.
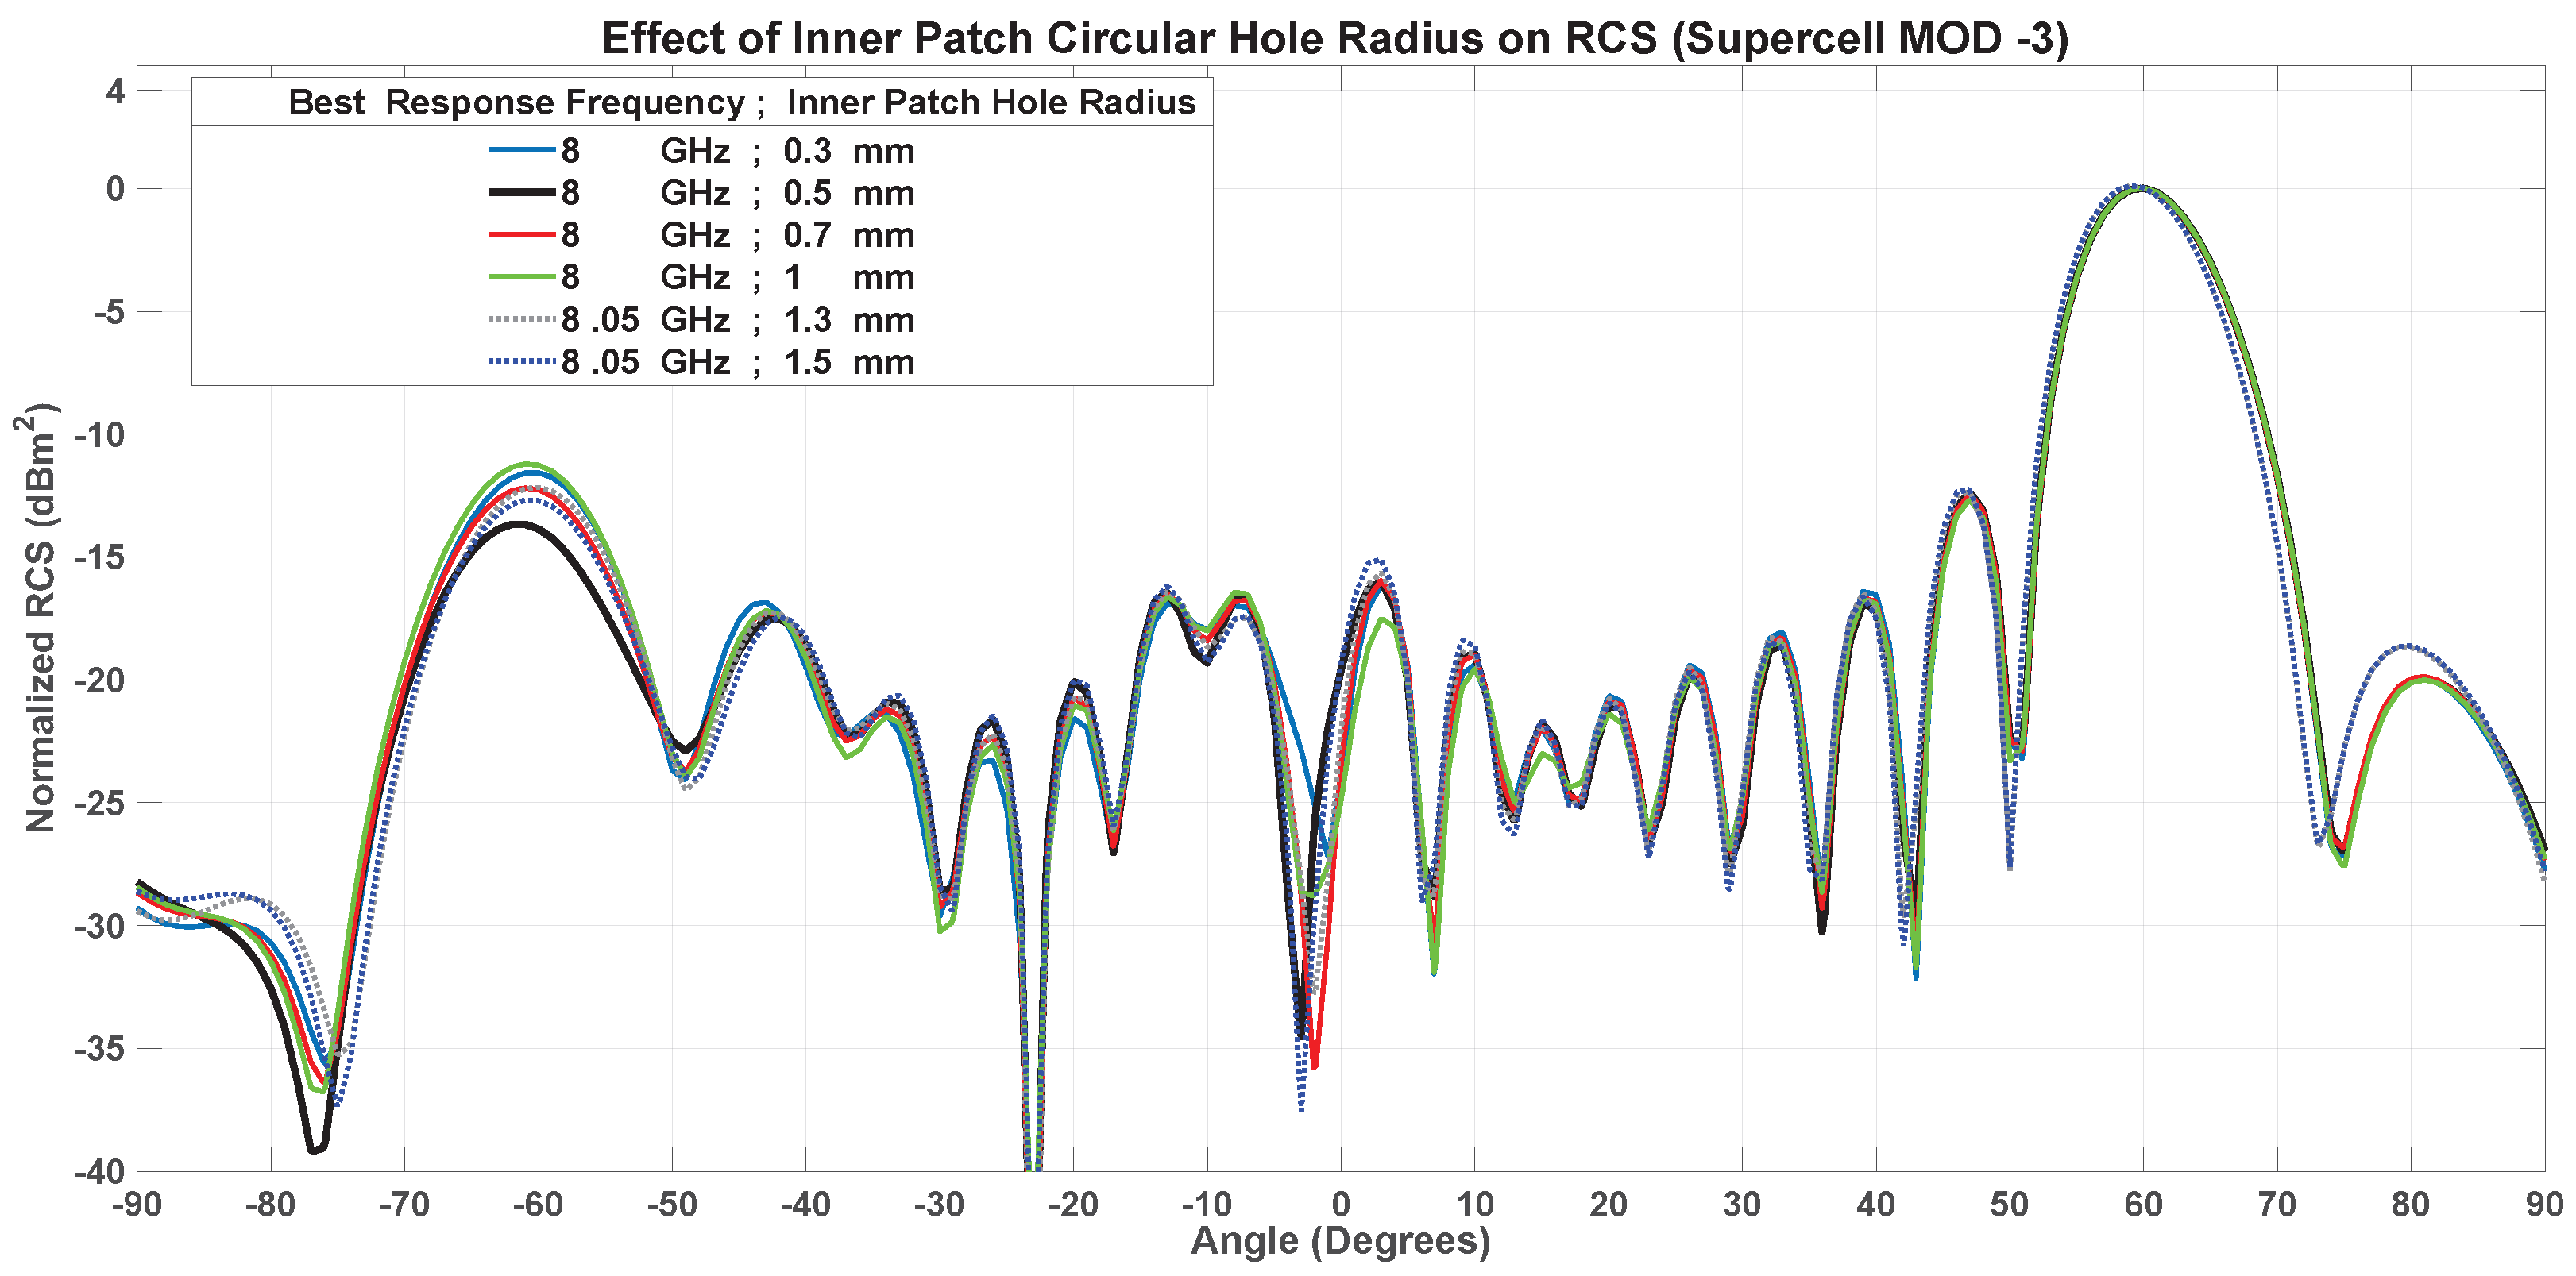
Changing the radius of the hole from 0.3 mm to 1.5 mm causes frequency oscillations in the suppression response up to 50 MHz, as shown in Figure 11. However, an inner patch hole with a radius of 0.5 mm provides the best suppression, so we selected it as the third modification.
Figure 11. Effect of adding fixed hole of 1 mm diameter in inner patch (MOD-3) on RCS. The parasitic mode suppression is improved without any frequency shift (black graph).

3.3.4. Modification Effects and Discussion

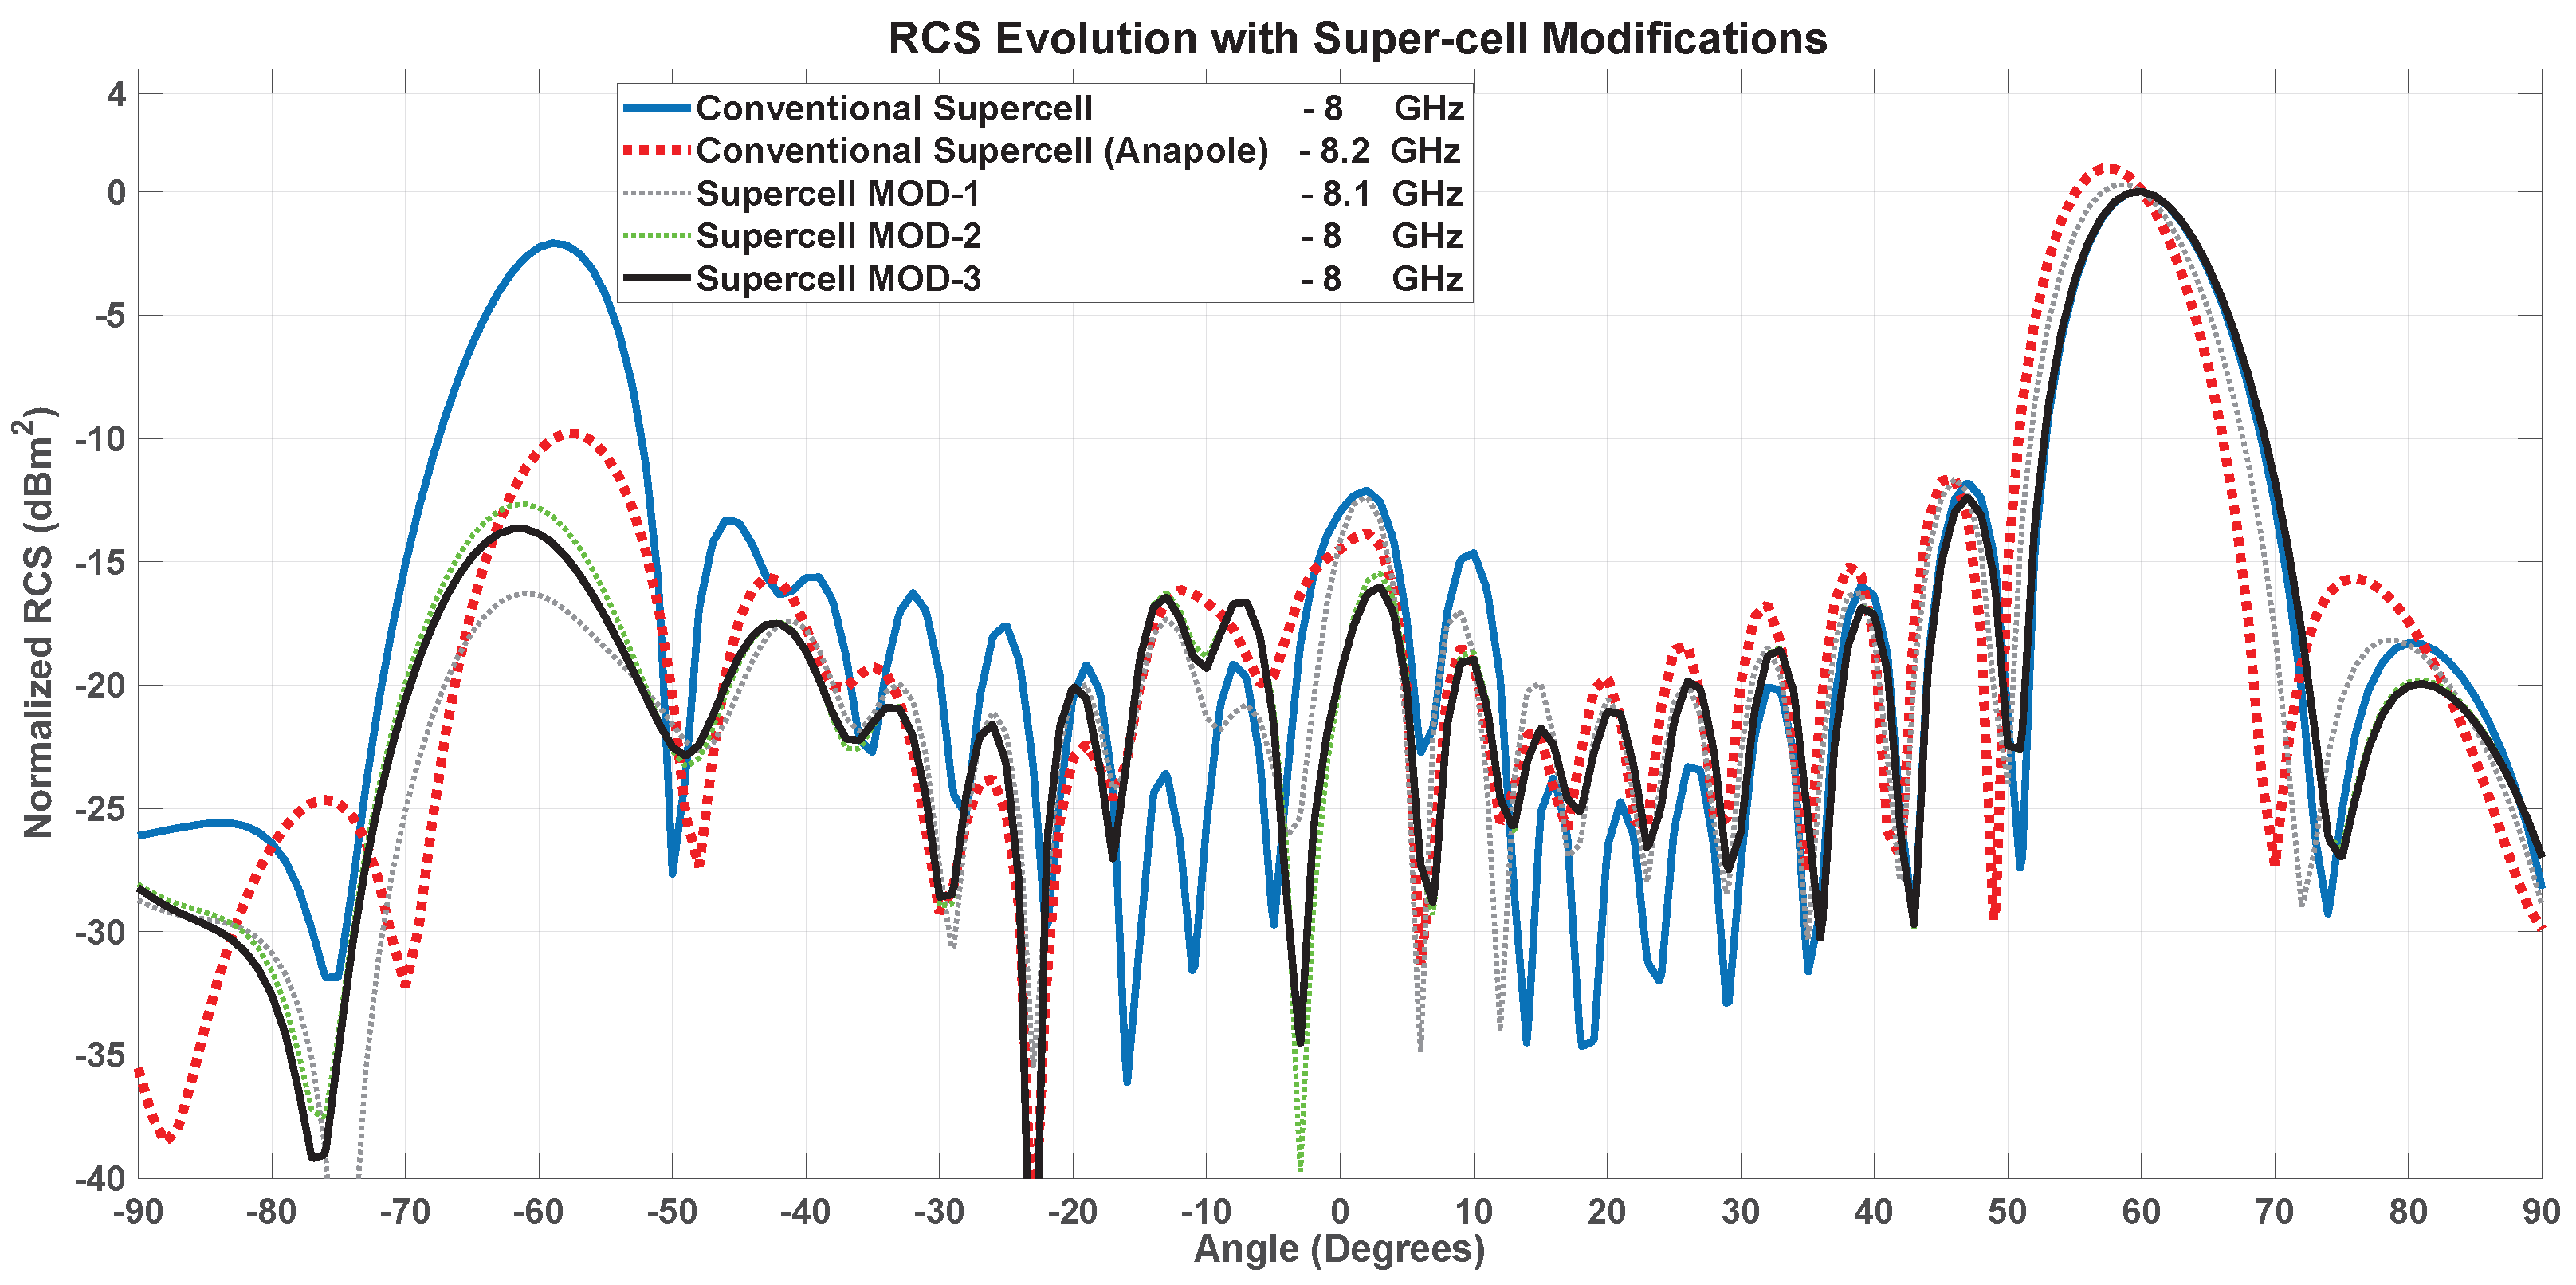
The three modifications described above result into frequency shifting of the best suppression response initially observed at 8.2 GHz down to the desired frequency of 8 GHz. In Figure 12 it is summarized how the RCS varies with the introduction of the three proposed modifications, labeled MOD1, MOD2 and MOD3 in the plot. It appears that the main lobe is unaffected by them. On the other hand, they contribute to reducing the parasitic lobes at the desired frequency.
Figure 12. Response evolution with modifications in super-cell.
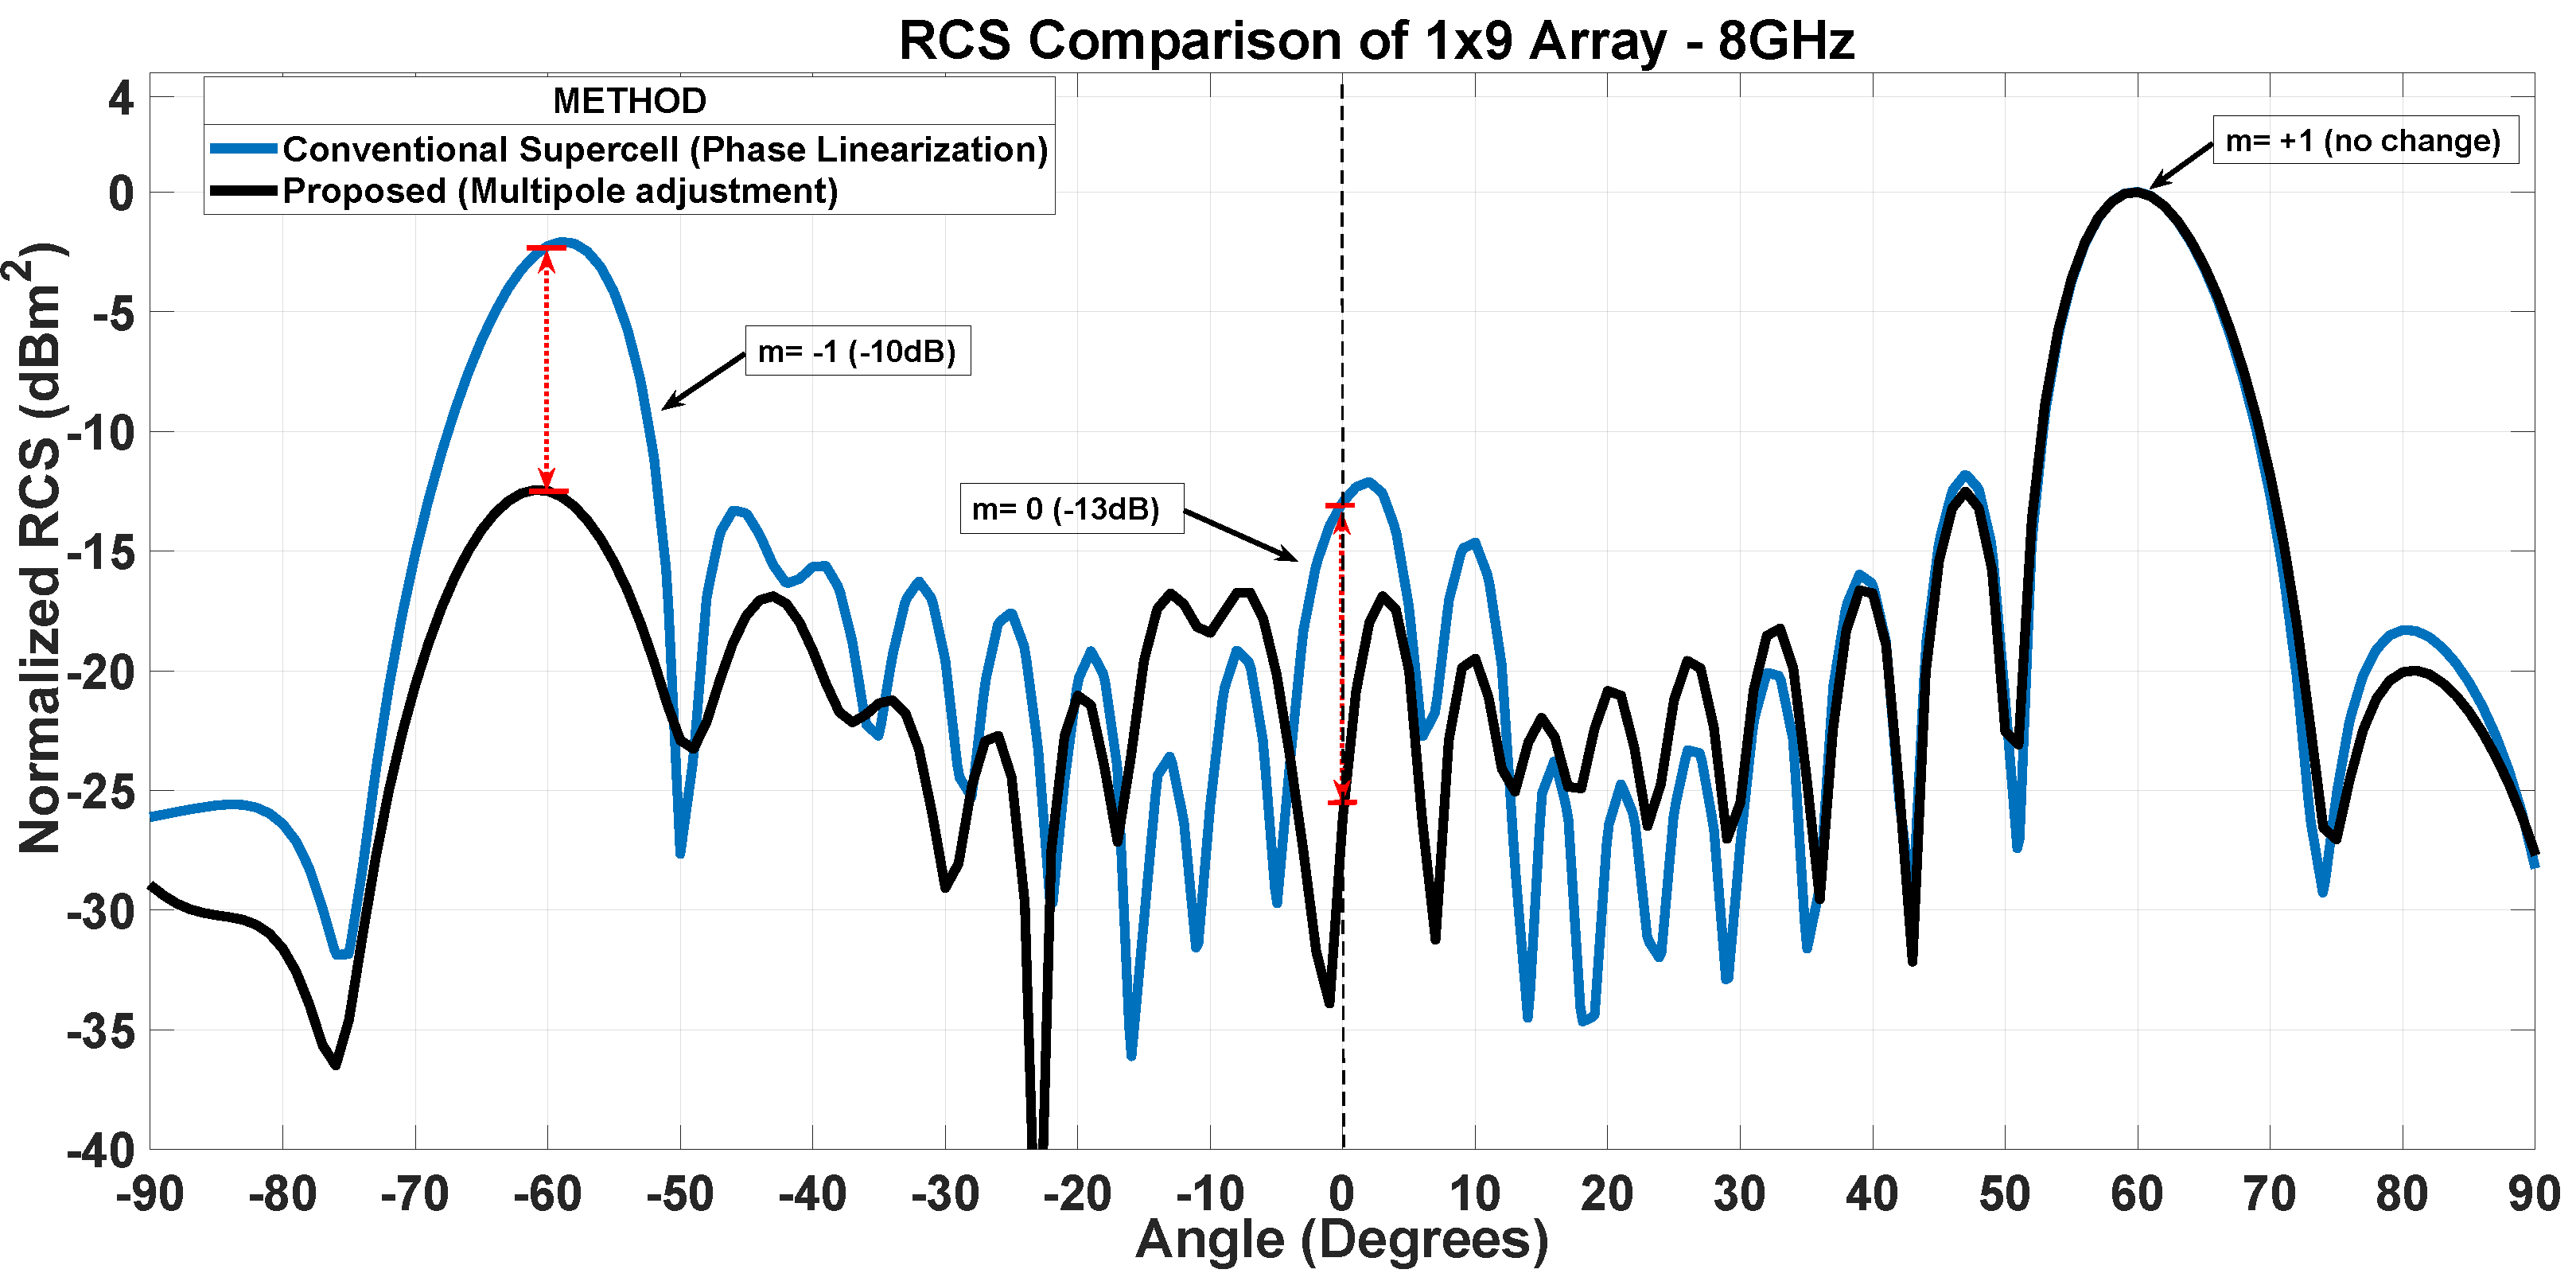
Compared to the initial PG design based SES of 1 × 9 super-cells, after modifications we get suppression improvement in both undesired modes of m = 0 and m = 1 by 13 dB and 10 dB, respectively as confirmed by the plot in Figure 13, where the RCS evaluated at 8 GHz for the SESs design with the PG method and the proposed approach is shown. These results can be compared with those shown in [], Figure 8. In that case, the focus was on suppressing the m = 1 mode through gradient-based optimization of the super-cell. A comparison of the optimized RCS in Figure 8 of [] and Figure 13 reveals that the here proposed technique affects both spurious lobes and introduces a greater reduction in the m = 1 mode. Furthermore, as will be discussed in Section 5, the proposed approach also benefits the bandwidth, while no information about this aspect is given in reference [].
Figure 13. RCS comparison of multipoles adjusted and PG-based SES ( 1 × 9 super-cells).
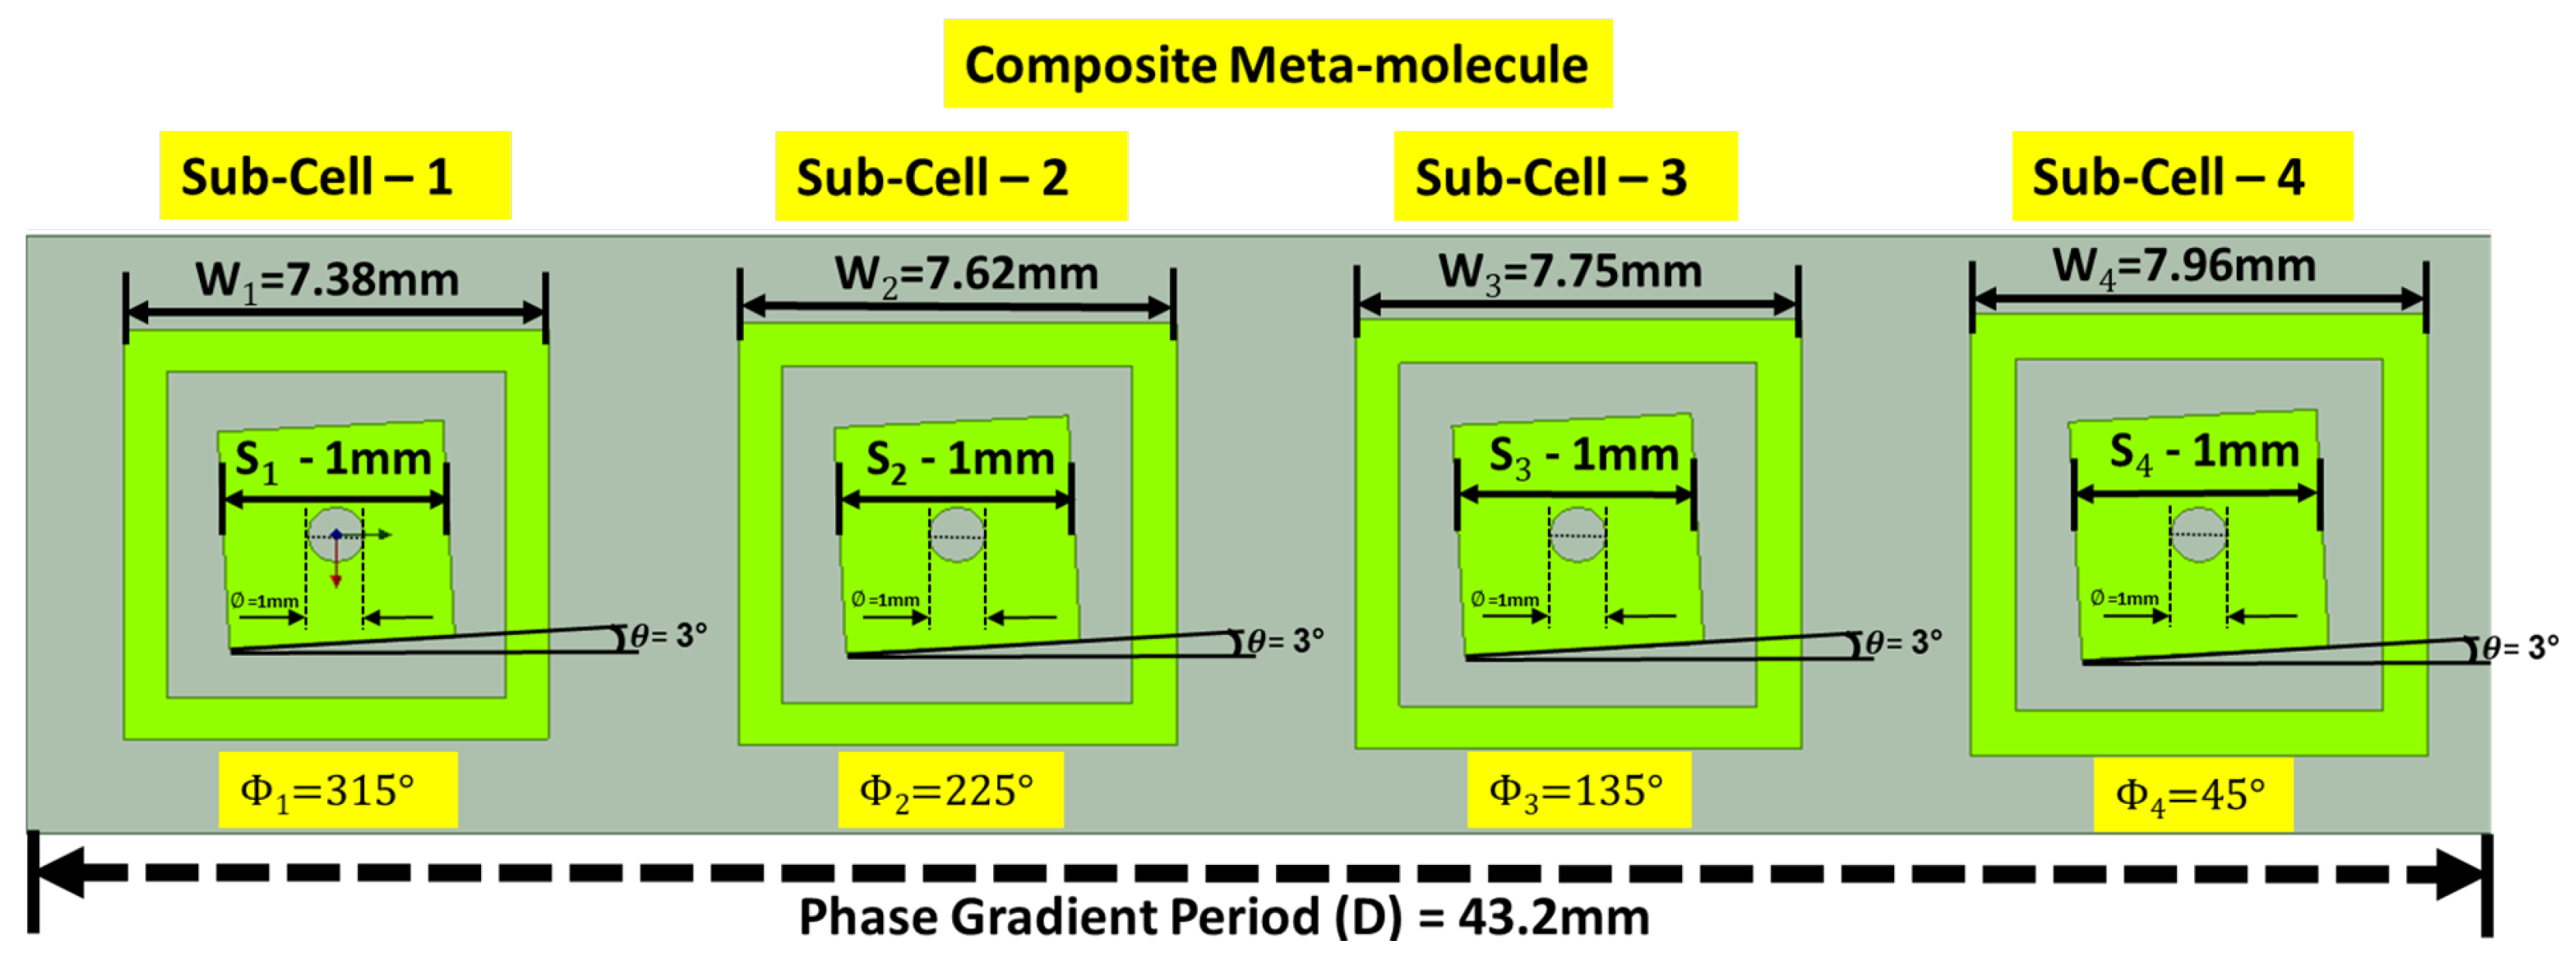
This is achieved by transforming the super-cell, initially created using the local (PG design) approach (Figure 5), by applying non-local modifications to a composite meta-molecule (Figure 14), where all the inner patches are correlated through non-locality (i.e., equal geometric changes to the initial design), while retaining the locality of all the outer patches (i.e., no geometric changes to the initial design). However, the symmetry between the inner patches and the outer rings of each cell is now violated.
Figure 14. Composite meta-molecule after multipoles adjustments.
Within a single super-cell, we combine local and non-local design approaches, which, from the UC geometry point of view, is as follows:
(a)
Outer rings–unmodified–Local design–anomalous reflection
(b)
Inner patch–modified–Non-local design–undesired radiation suppression
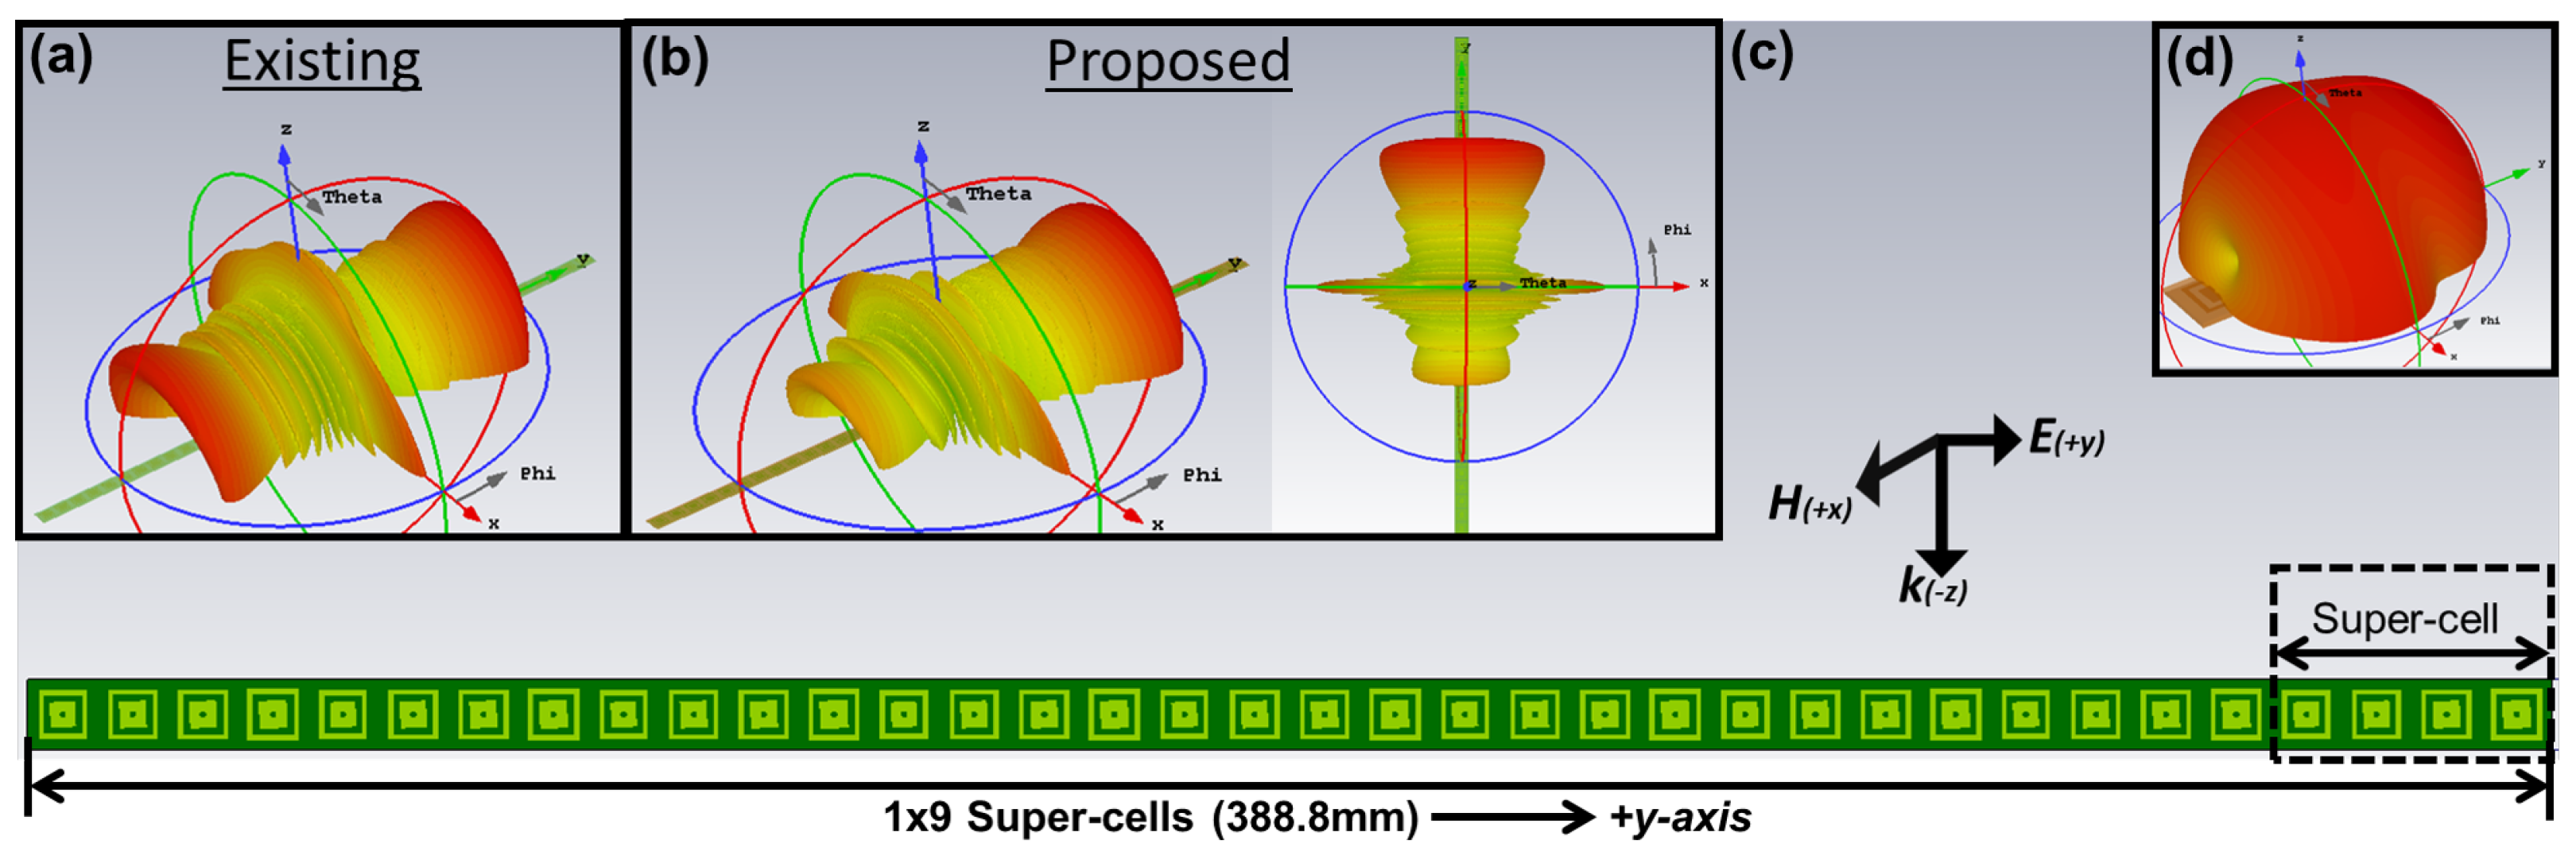
Therefore, this composite meta-molecule is the result of a combination of local and non-local design approaches. Furthermore, electromagnetic interactions between sub-structures (inner patch and outer ring) of each cell promote their bi-anisotropy. By incorporating non-locality and bi-anisotropy we achieve improved 3 D radiation pattern as the one plotted in Figure 15b by using a composite meta-molecule, with respect to that radiated by a same size SES of 1 × 9 super-cells designed with PG method (Figure 15a).
Figure 15. SES configuration and 3 D radiation patterns. (a) Radiation pattern based on generalized reflection law. (b) Radiation pattern after multipoles adjustment. (c) SES and incident TM-plane wave configuration. (d) Radiation pattern of single super-cell after multipoles adjustment.

4. Application of Theory of Multipoles to Anomalous Reflective SES

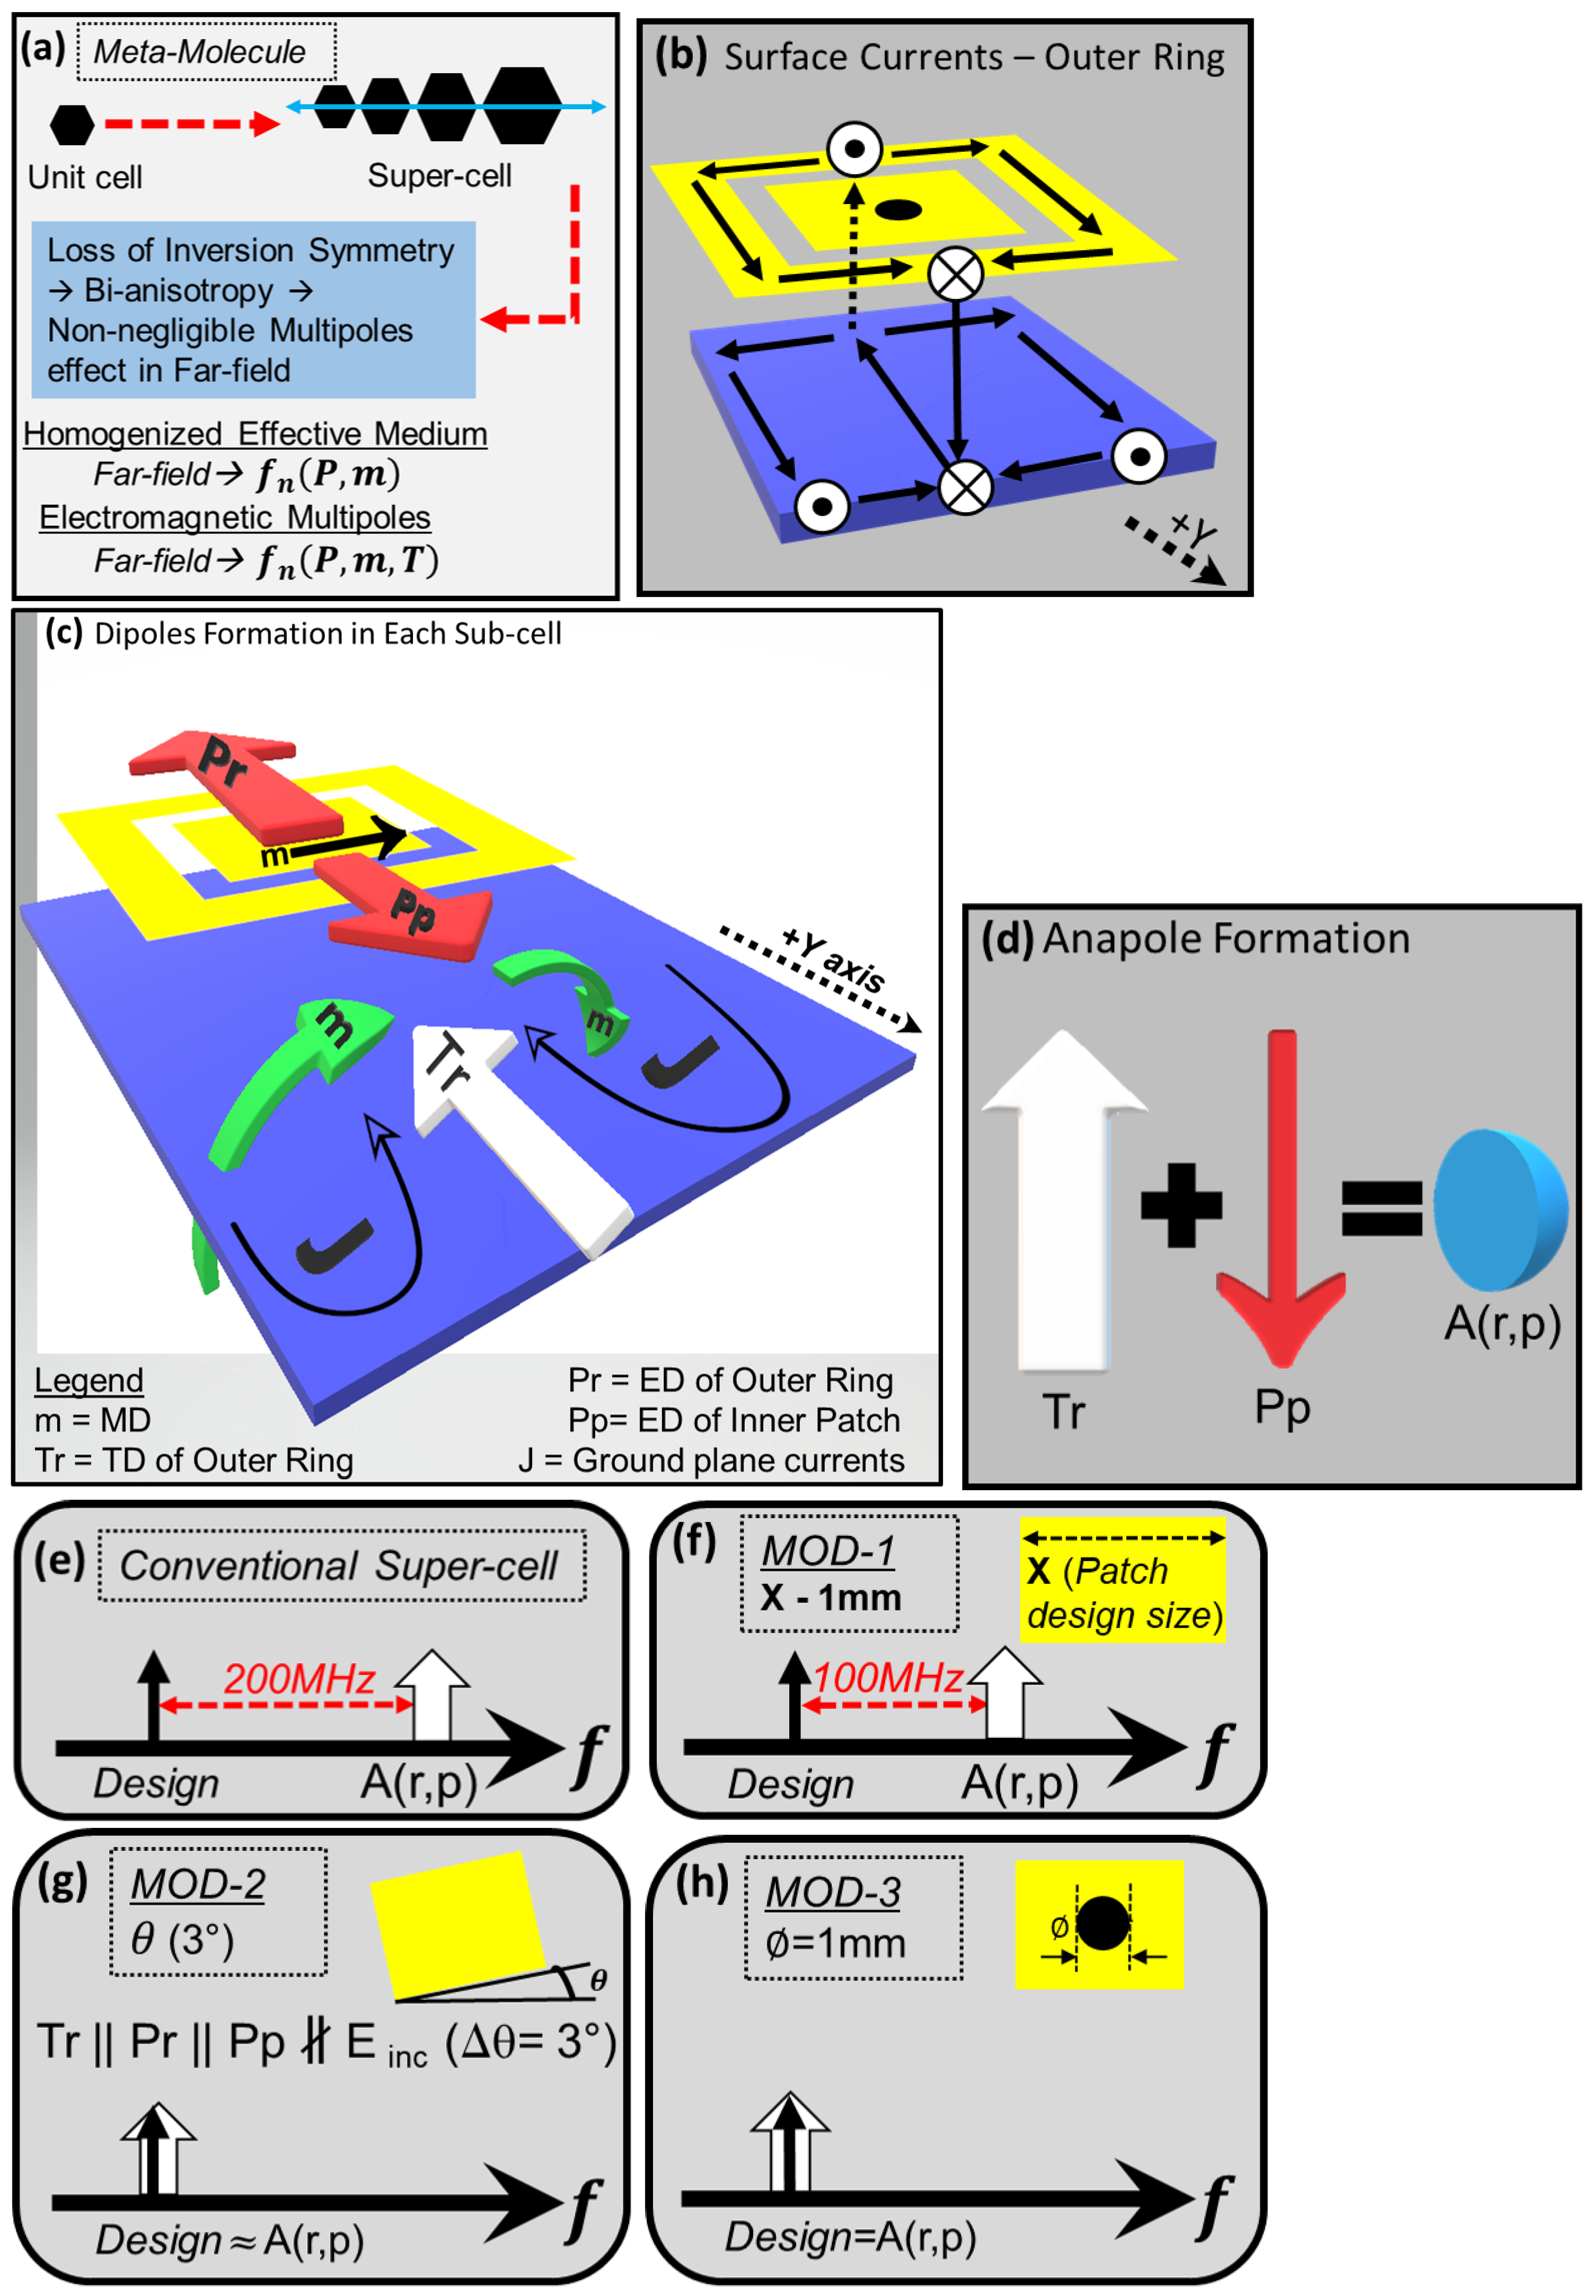
Viewing the super-cell as a cluster of metal particles [] with dipole formations at each sub-particle (UC) of this cluster [], the post-super-cell-making process not only effects the structure’s response but also provides new degrees of freedom (possible through non-locality and symmetry breaking) in addition to those provided by the individual cells forming the super-cell. When we make a PG-based super-cell using sub-wavelength UCs [,], we introduce two new properties to the super-cell:
(a)
Area of dynamic charge-currents distributions i.e., super-cell size, D y (at 8 GHz for normal incidence and pointing angle of 45 is 53 mm, when the pointing angle is 60 the area becomes 43.2 mm, for 70 is 40 mm and for 85 is 37.6 mm) becomes comparable to or larger than effective wavelength ( λ = 37.5 mm at 8 GHz). This configuration makes the contributions of higher order multipoles non-negligible in the structure response [,].
(b)
The structure loses inversion symmetry along the gradient period, i.e., super-cell length, D y , Figure 16h. This non-inversion symmetry introduces bi-anisotropy at the super-cell level [] and contribution of charge-current distributions and TD in far-field radiations becomes non-negligible. This super-cell level bi-anisotropy due to non-inversion symmetry is different from UC level bi-anisotropy which can be possible in symmetric UCs.
Figure 16. Dipoles formation and suppression mechanism. (a) Meta-molecule formation based on multipoles. (b) 3D surface currents in outer ring forming current loops and MD. (c) Dipoles formations in a UC involving top and ground layer surface currents. (d) Formation of anapole in a UC due to destructive interference of ED and TD of outer ring and inner patch. (e) Conventional super-cell response where anapole is present away from desired frequency. (f) Effect of MOD-1 on anapole. (g) Effect of MOD-2 on anapole. (h) Effect of MOD-3 on anapole.
Therefore super-cell based on local design approach is scale comparable with wavelength of operation, has non-inversion symmetry (see Figure 16a) and there is formation of non-negligible 3D charge-current distributions in the structure. Due to these conditions the analysis and optimization of far-field radiation pattern basing only on phase analysis of sub-wavelength scatterers is inadequate. Complex electromagnetic multipoles expansion provides a more accurate description of dynamic field-matter interactions and the resultant formation of far-field radiation pattern.
TD and anapole formation has been reported for planar 2D metasurfaces []. From classical electrodynamics perspective anapole is non-radiating and non-interacting with external fields []. From scattering theory perspective, anapole can be considered as far-field scattering cancellation of a dynamic electric TD and an ED which are spatially overlapping and co-excited but out of phase []. It is worth mentioning that destructive interference of electric TD and ED scattered fields result into far-field radiation suppression [] and not total cancellation as through this weak free-space radiation coupling anapole is detectable [].
The far-field scattering contribution from multipoles can be written as according to Equation (29) []:
E scat k 2 4 π ε 0 n × p × n + i k n × T × n + 1 v d [ m × n ]
For an anapole formed by electric and toroidal dipoles, it becomes:
E scat k 2 4 π ε 0 { n × p × n + i k n × T × n }
Equation (30) indicates there will total far-field radiation cancellation if the electric and toroidal dipole contributions to the scattered fields are exactly out of phase thereby interfering destructively. Exact cancellation as possible in the mathematical terms, does not occur in real scenarios and therefore we have far-field radiation suppression instead to total cancellation. This phenomena is observable in the frequency spectrum of the total scattered fields (i.e., addition of scattering cross-sections of individual multipoles) as a drop in total scattered power in the direction of interest at desired frequency. For SESs, it is measurable through RCS of the structure and its variations across the frequency spectrum. It is also worth mentioning that both ED and TD have TM radiation characteristics which is different from MD which has TE polarization []. Therefore anapole also has TM polarized radiation [,].
Anapole based on dynamic TDs have been used for scattering minimization by enhancing field confinement in metallic meta-atoms [,] in transmission mode and dielectric meta-atoms [] in emission mode. This has been achieved using specialized and non-planar scatterer geometries based on expensive fabrication processes [].
However, it has not been done for undesired scattering minimization in anomalous reflecting static passive 1D SES that are based on low cost single layer substrate materials having simple and planar scatterer geometries.

4.1. Charge-Current Distribution and Dipoles Formation

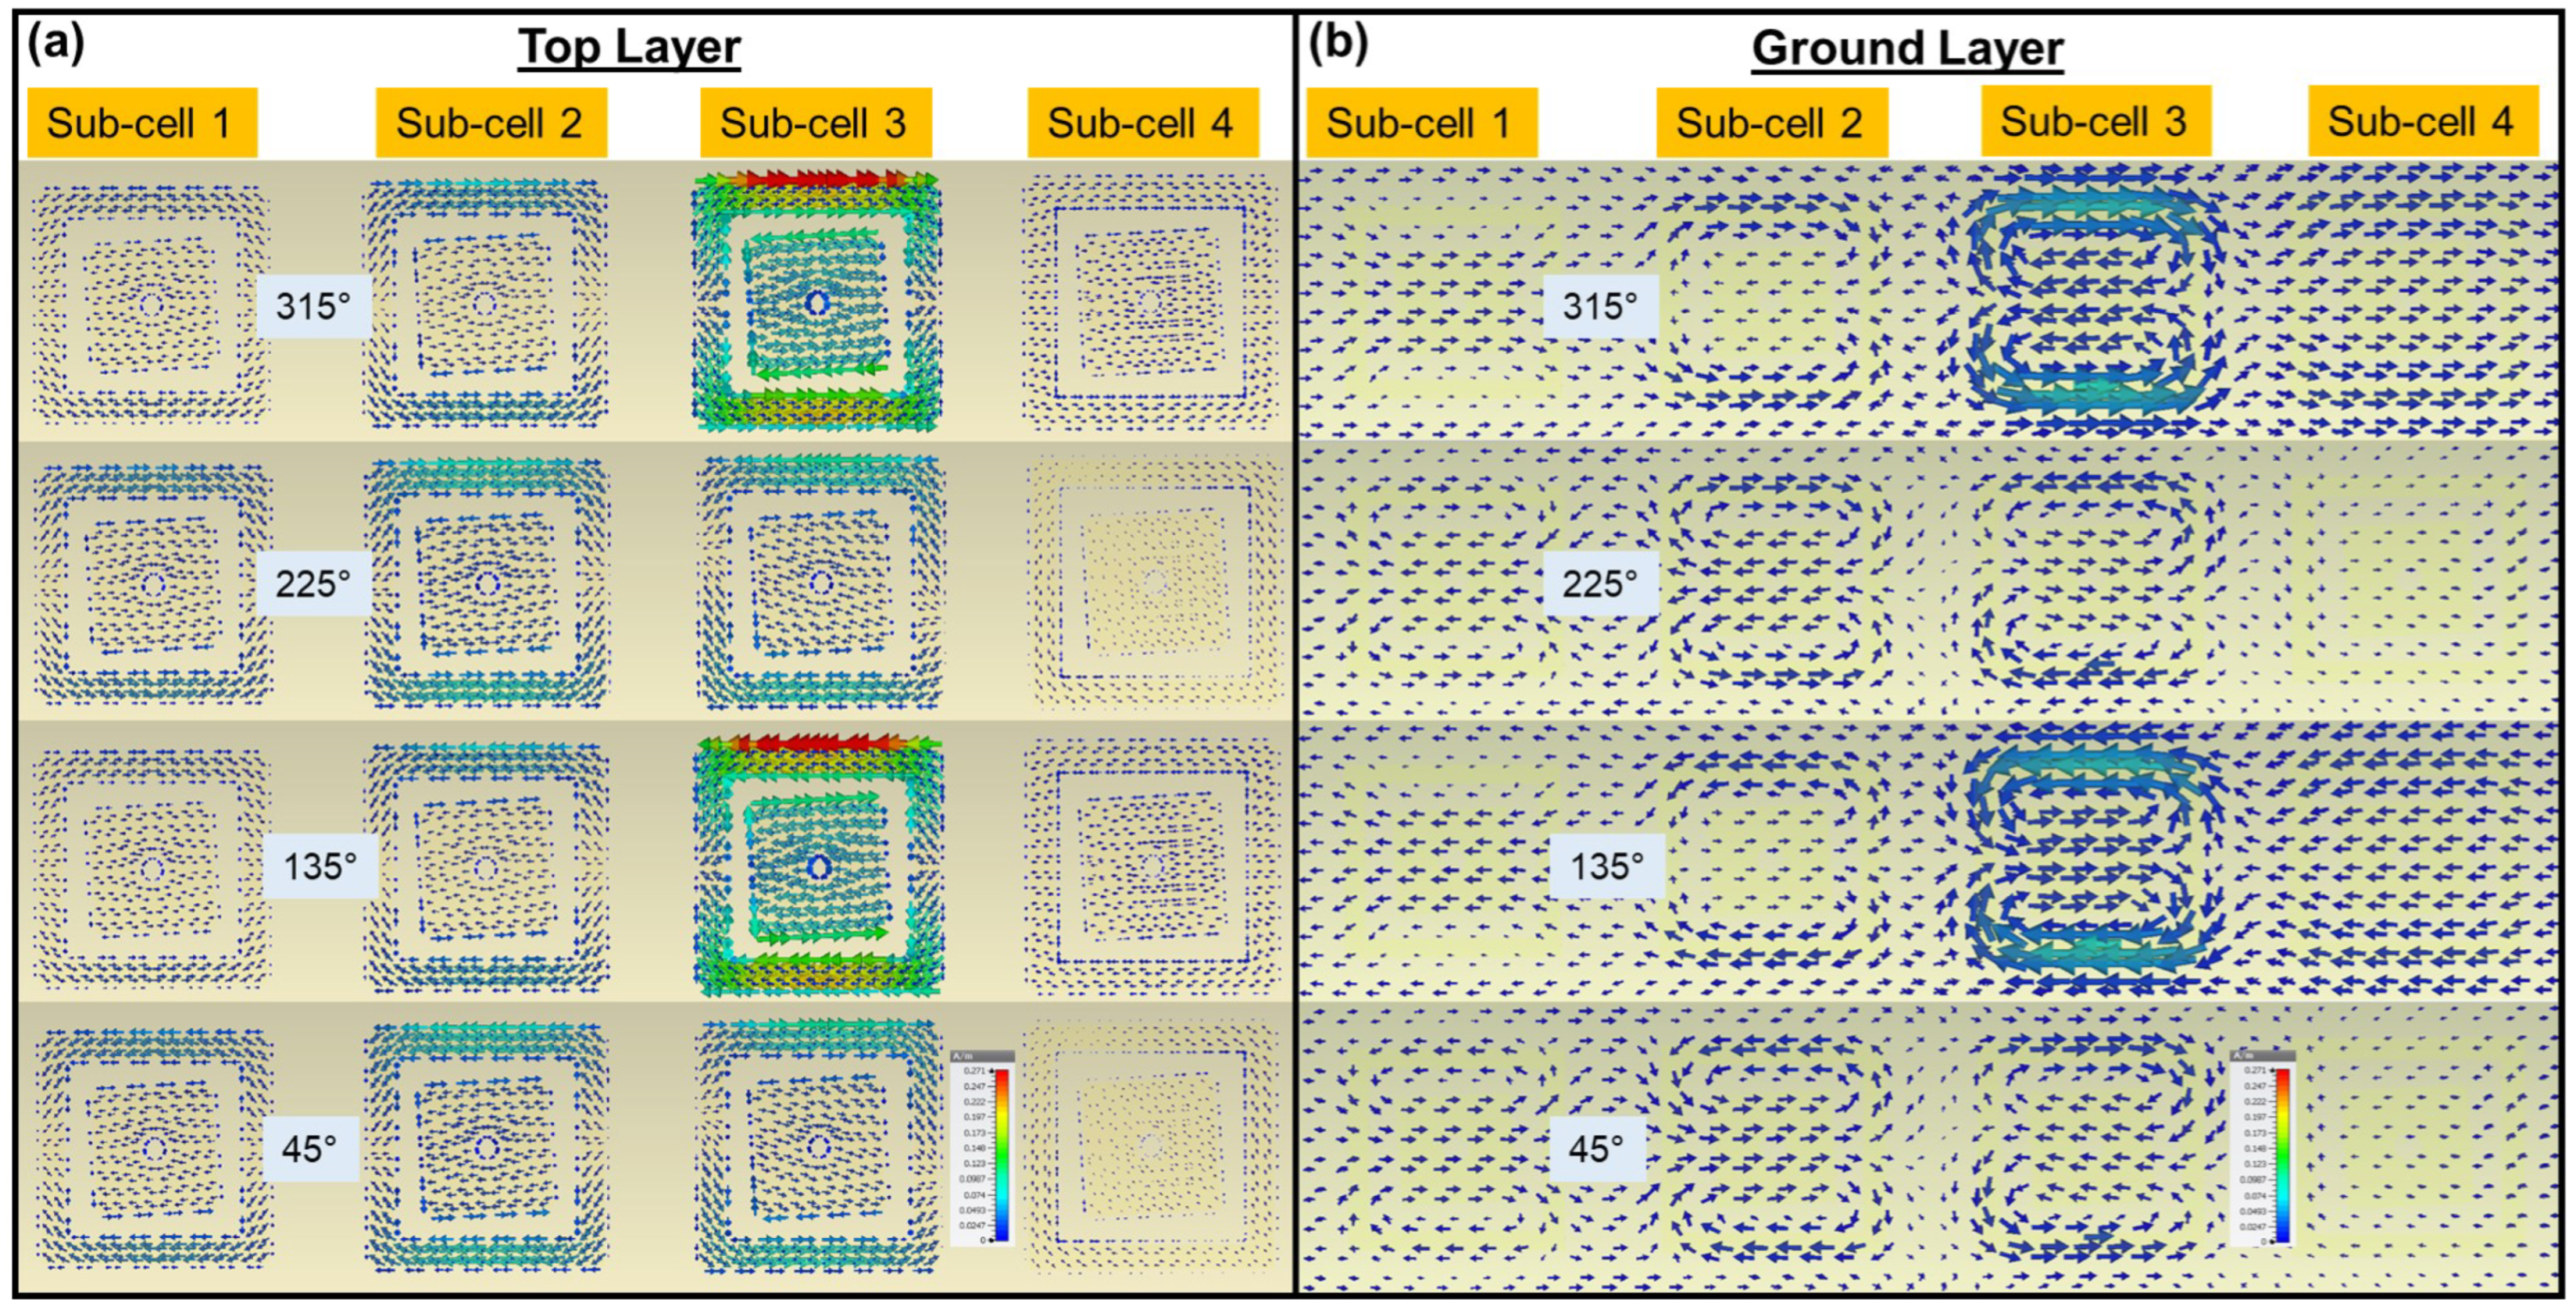
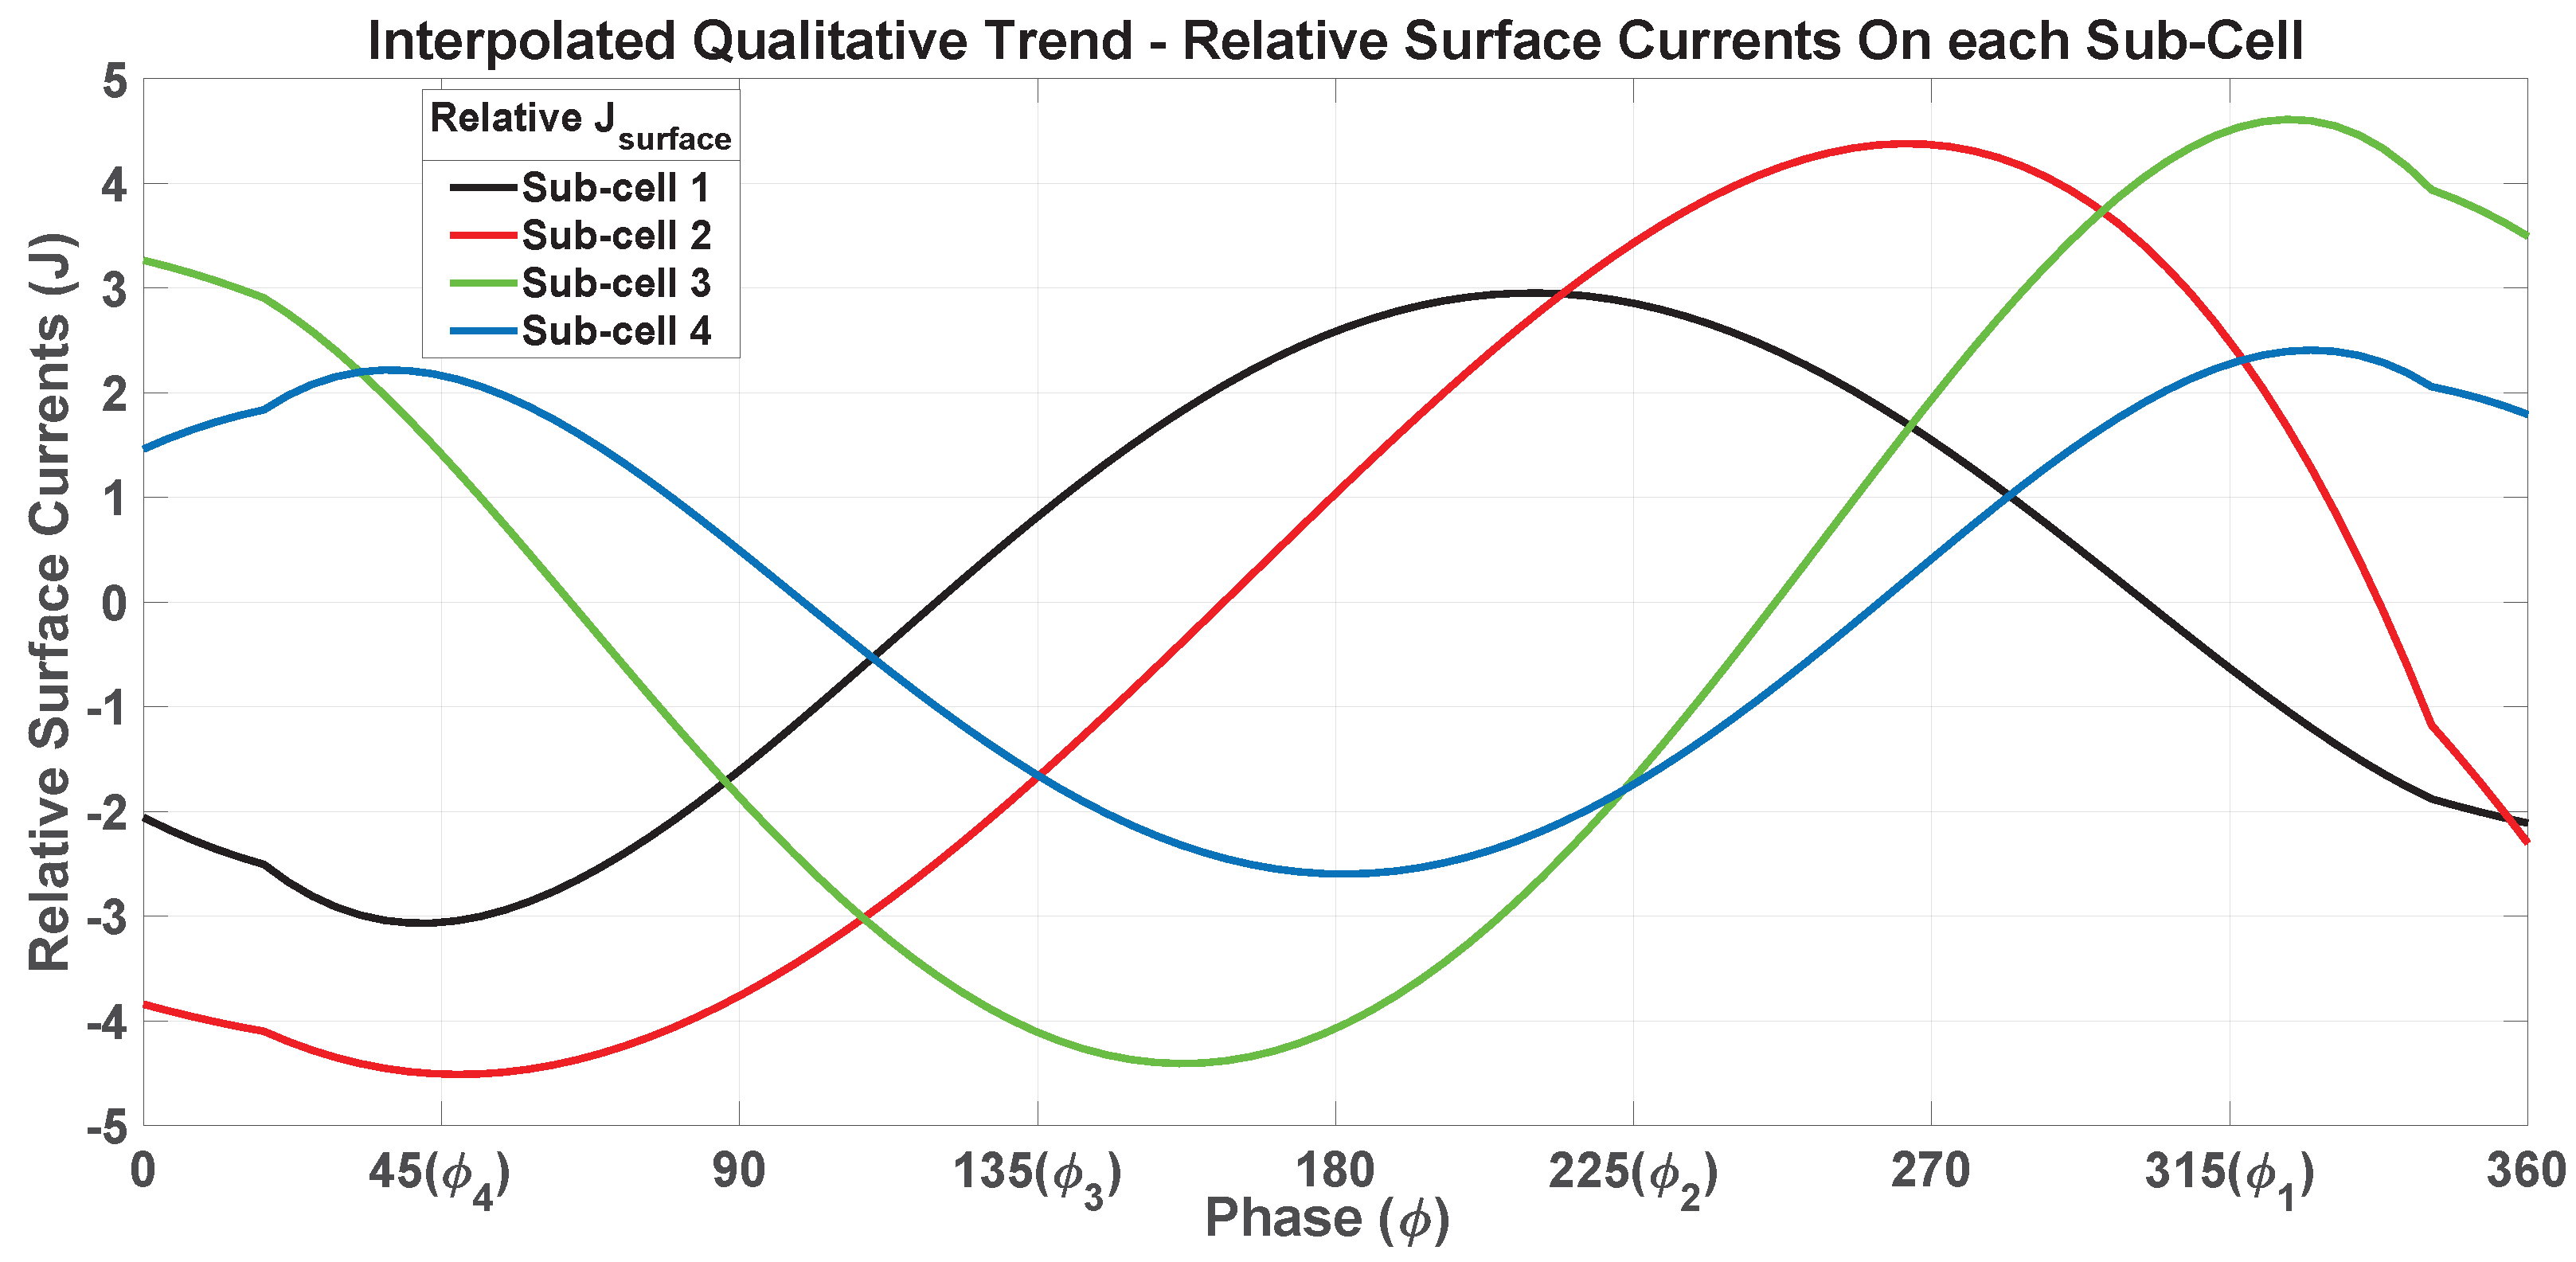
We analyze the charge-current distributions on composite meta-molecule starting from the surface currents at the top and ground layers. These surface currents are at the phase values that each UC must provide, i.e., 315 , 225 , 135 and 45 and are shown in Figure 17. Also, to make a qualitative assessment of surface currents trends on each UC, we assign four relative magnitude levels to surface currents, with J1 indicating maximum magnitude and J4 indicating the minimum within a 360 phase cycle. We indicate direction of surface current as it is on outer ring of each UC. Mutual coupling between surface currents on the ground plane during a complete phase cycle is indicated by J M 12 , showing ground plane current flowing from UC 1 towards UC 2. Taking snapshots of magnitude and direction of surface currents with a 30 phase step, we create a detailed trend in the magnitude and direction of surface current variation on each UC within a super-cell, as summarized in Table 1. An interpolated qualitative trend graph is also generated (as shown in Figure 18) based on four magnitude levels and directions of surface currents referenced to the outer ring. The magnitudes of the surface currents on each of the four cells of the top layer have cyclic magnitude variations within a phase variation of 180 , as viewable in Table 1. Out of the four UCs, the surface current at cell 3 has the maximum magnitude at phase values of 135 and 315 , corresponding to each of 180 phase cycles of opposite directed currents.
Figure 17. Surface currents of each UC and for different values of the required phase. Surface current patterns are periodic with a cycle of 180 with mirror image symmetry (a) Top layer: no current mutual coupling. (b) Ground plane; Formation of magnetic dipoles; mutual coupling between surface currents of UCs.
Table 1. Snapshots of surface currents for different values of the required phase. Arrows (black) show current direction on outer ring. J1–J4 qualitatively compare relative magnitudes of surface currents among the 4 UCs. J M n m shows there is mutual coupling of surface current from UC n towards cell m in the ground plane. Φ 1 4 are phase values of each UC calculated from generalized law of reflection and refraction.
Figure 18. Interpolated qualitative comparison of relative surface currents among UCs. Mirror Image response periodicity with 180° phase cycle is evident.
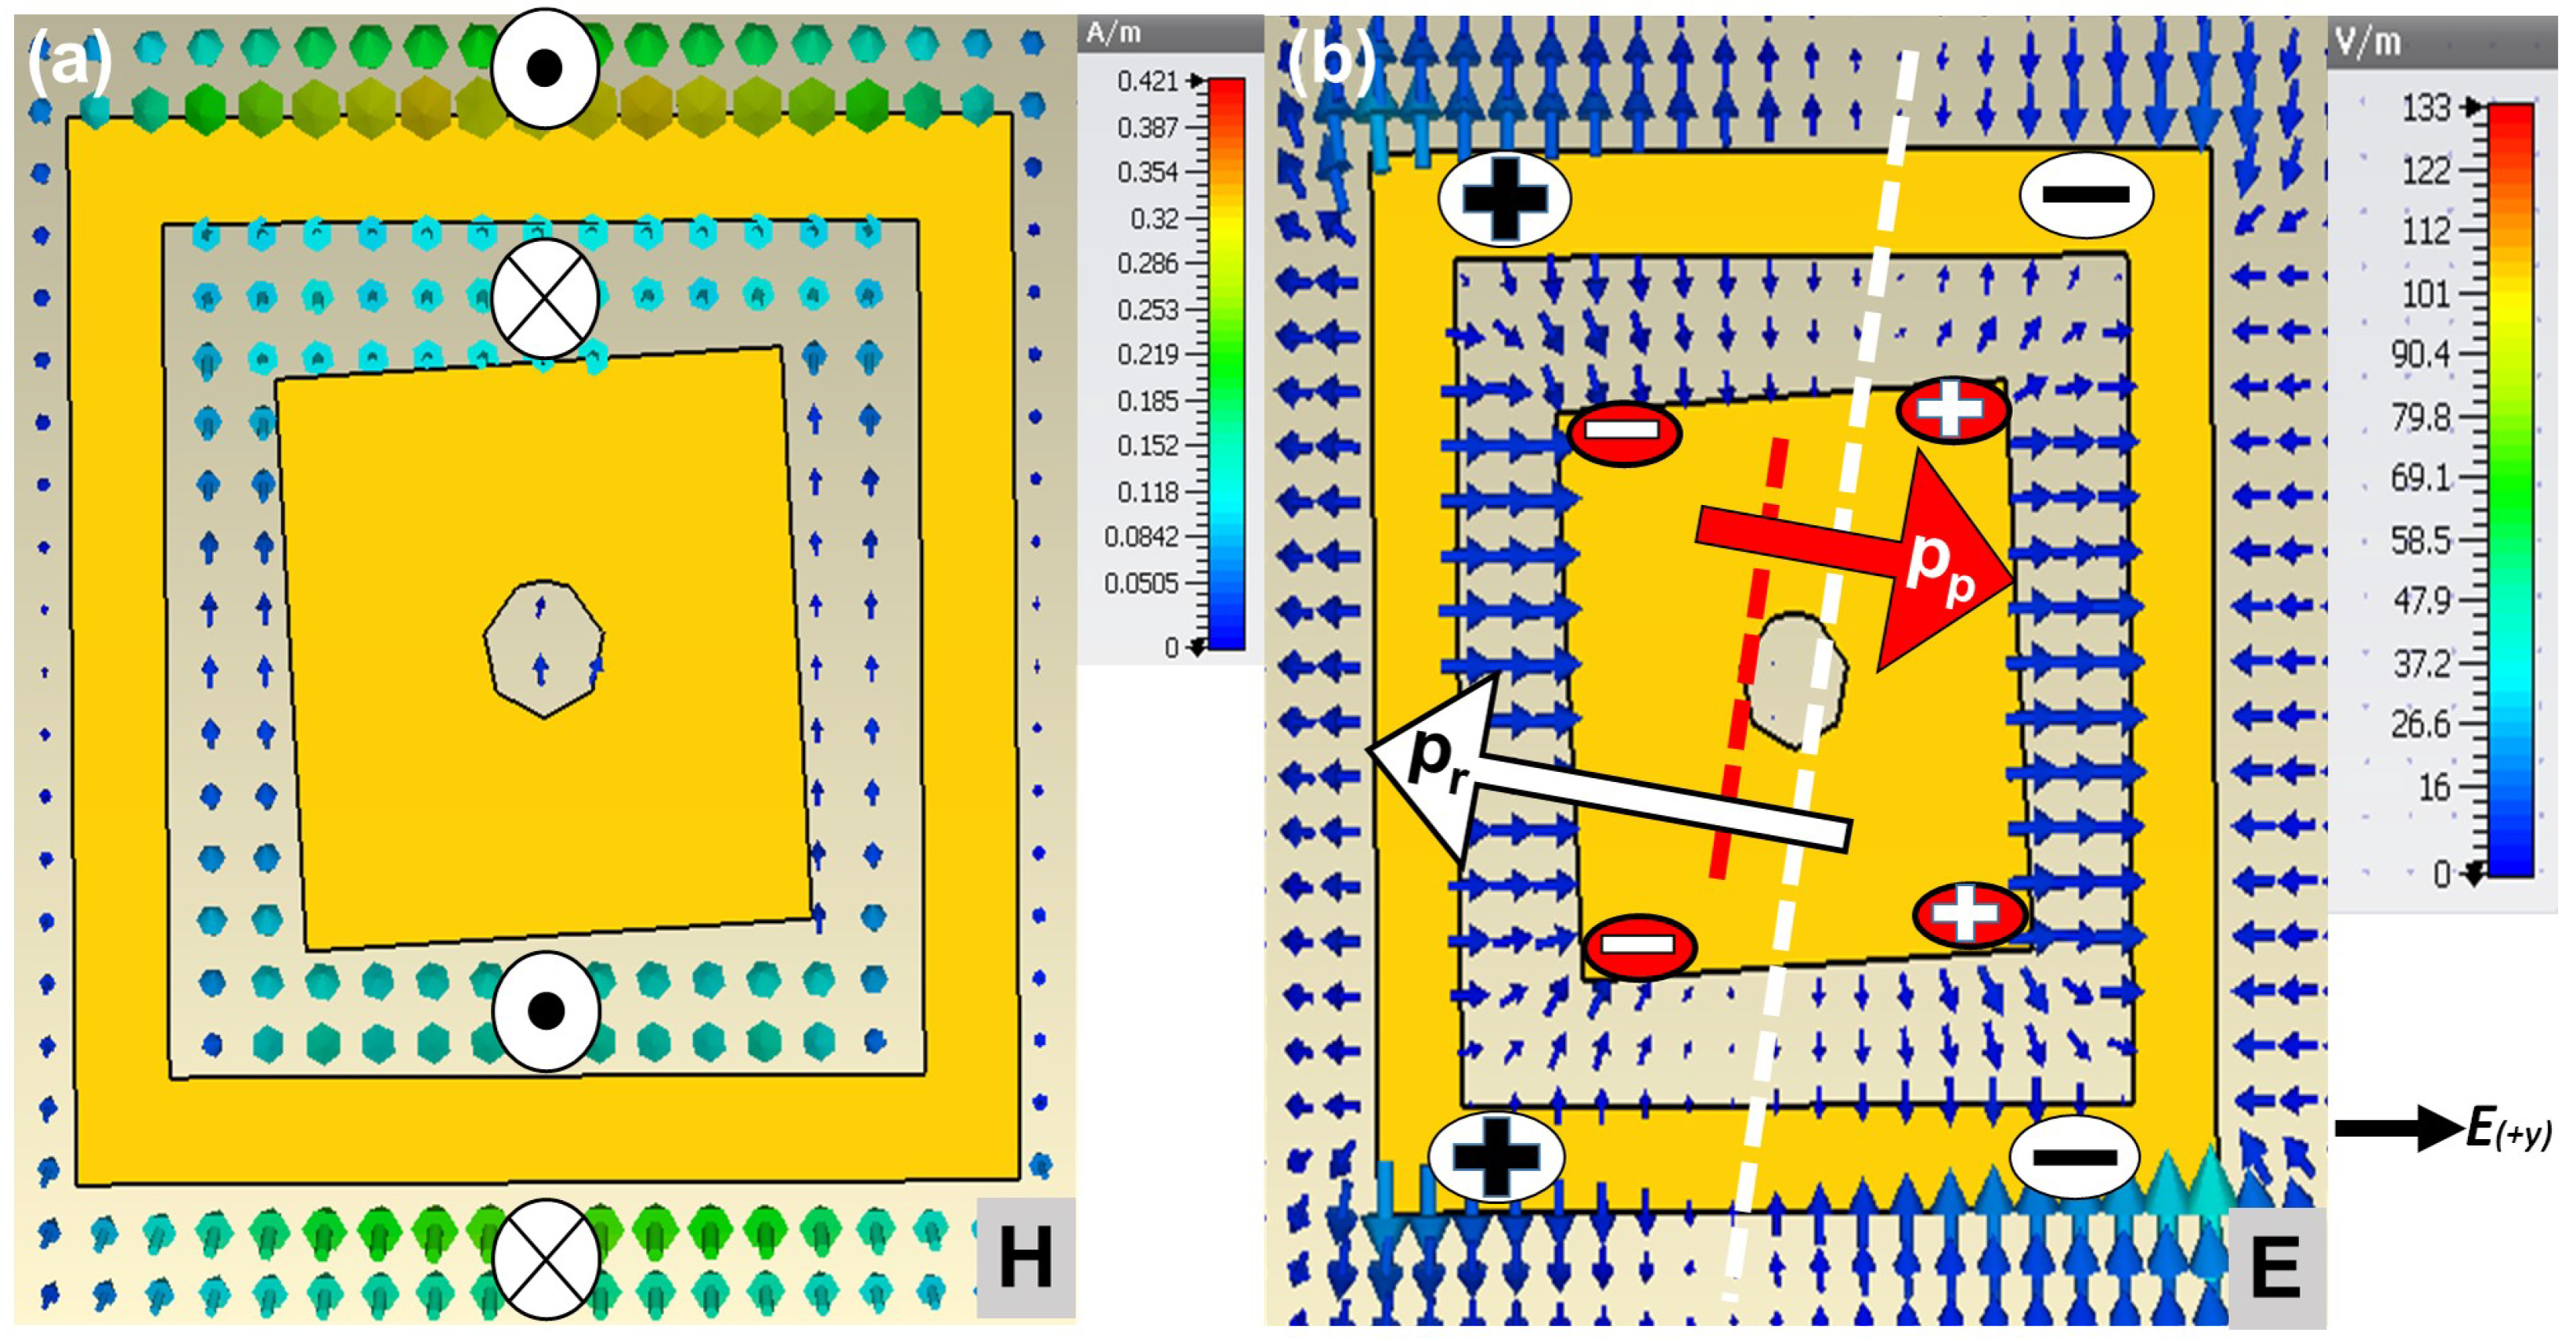
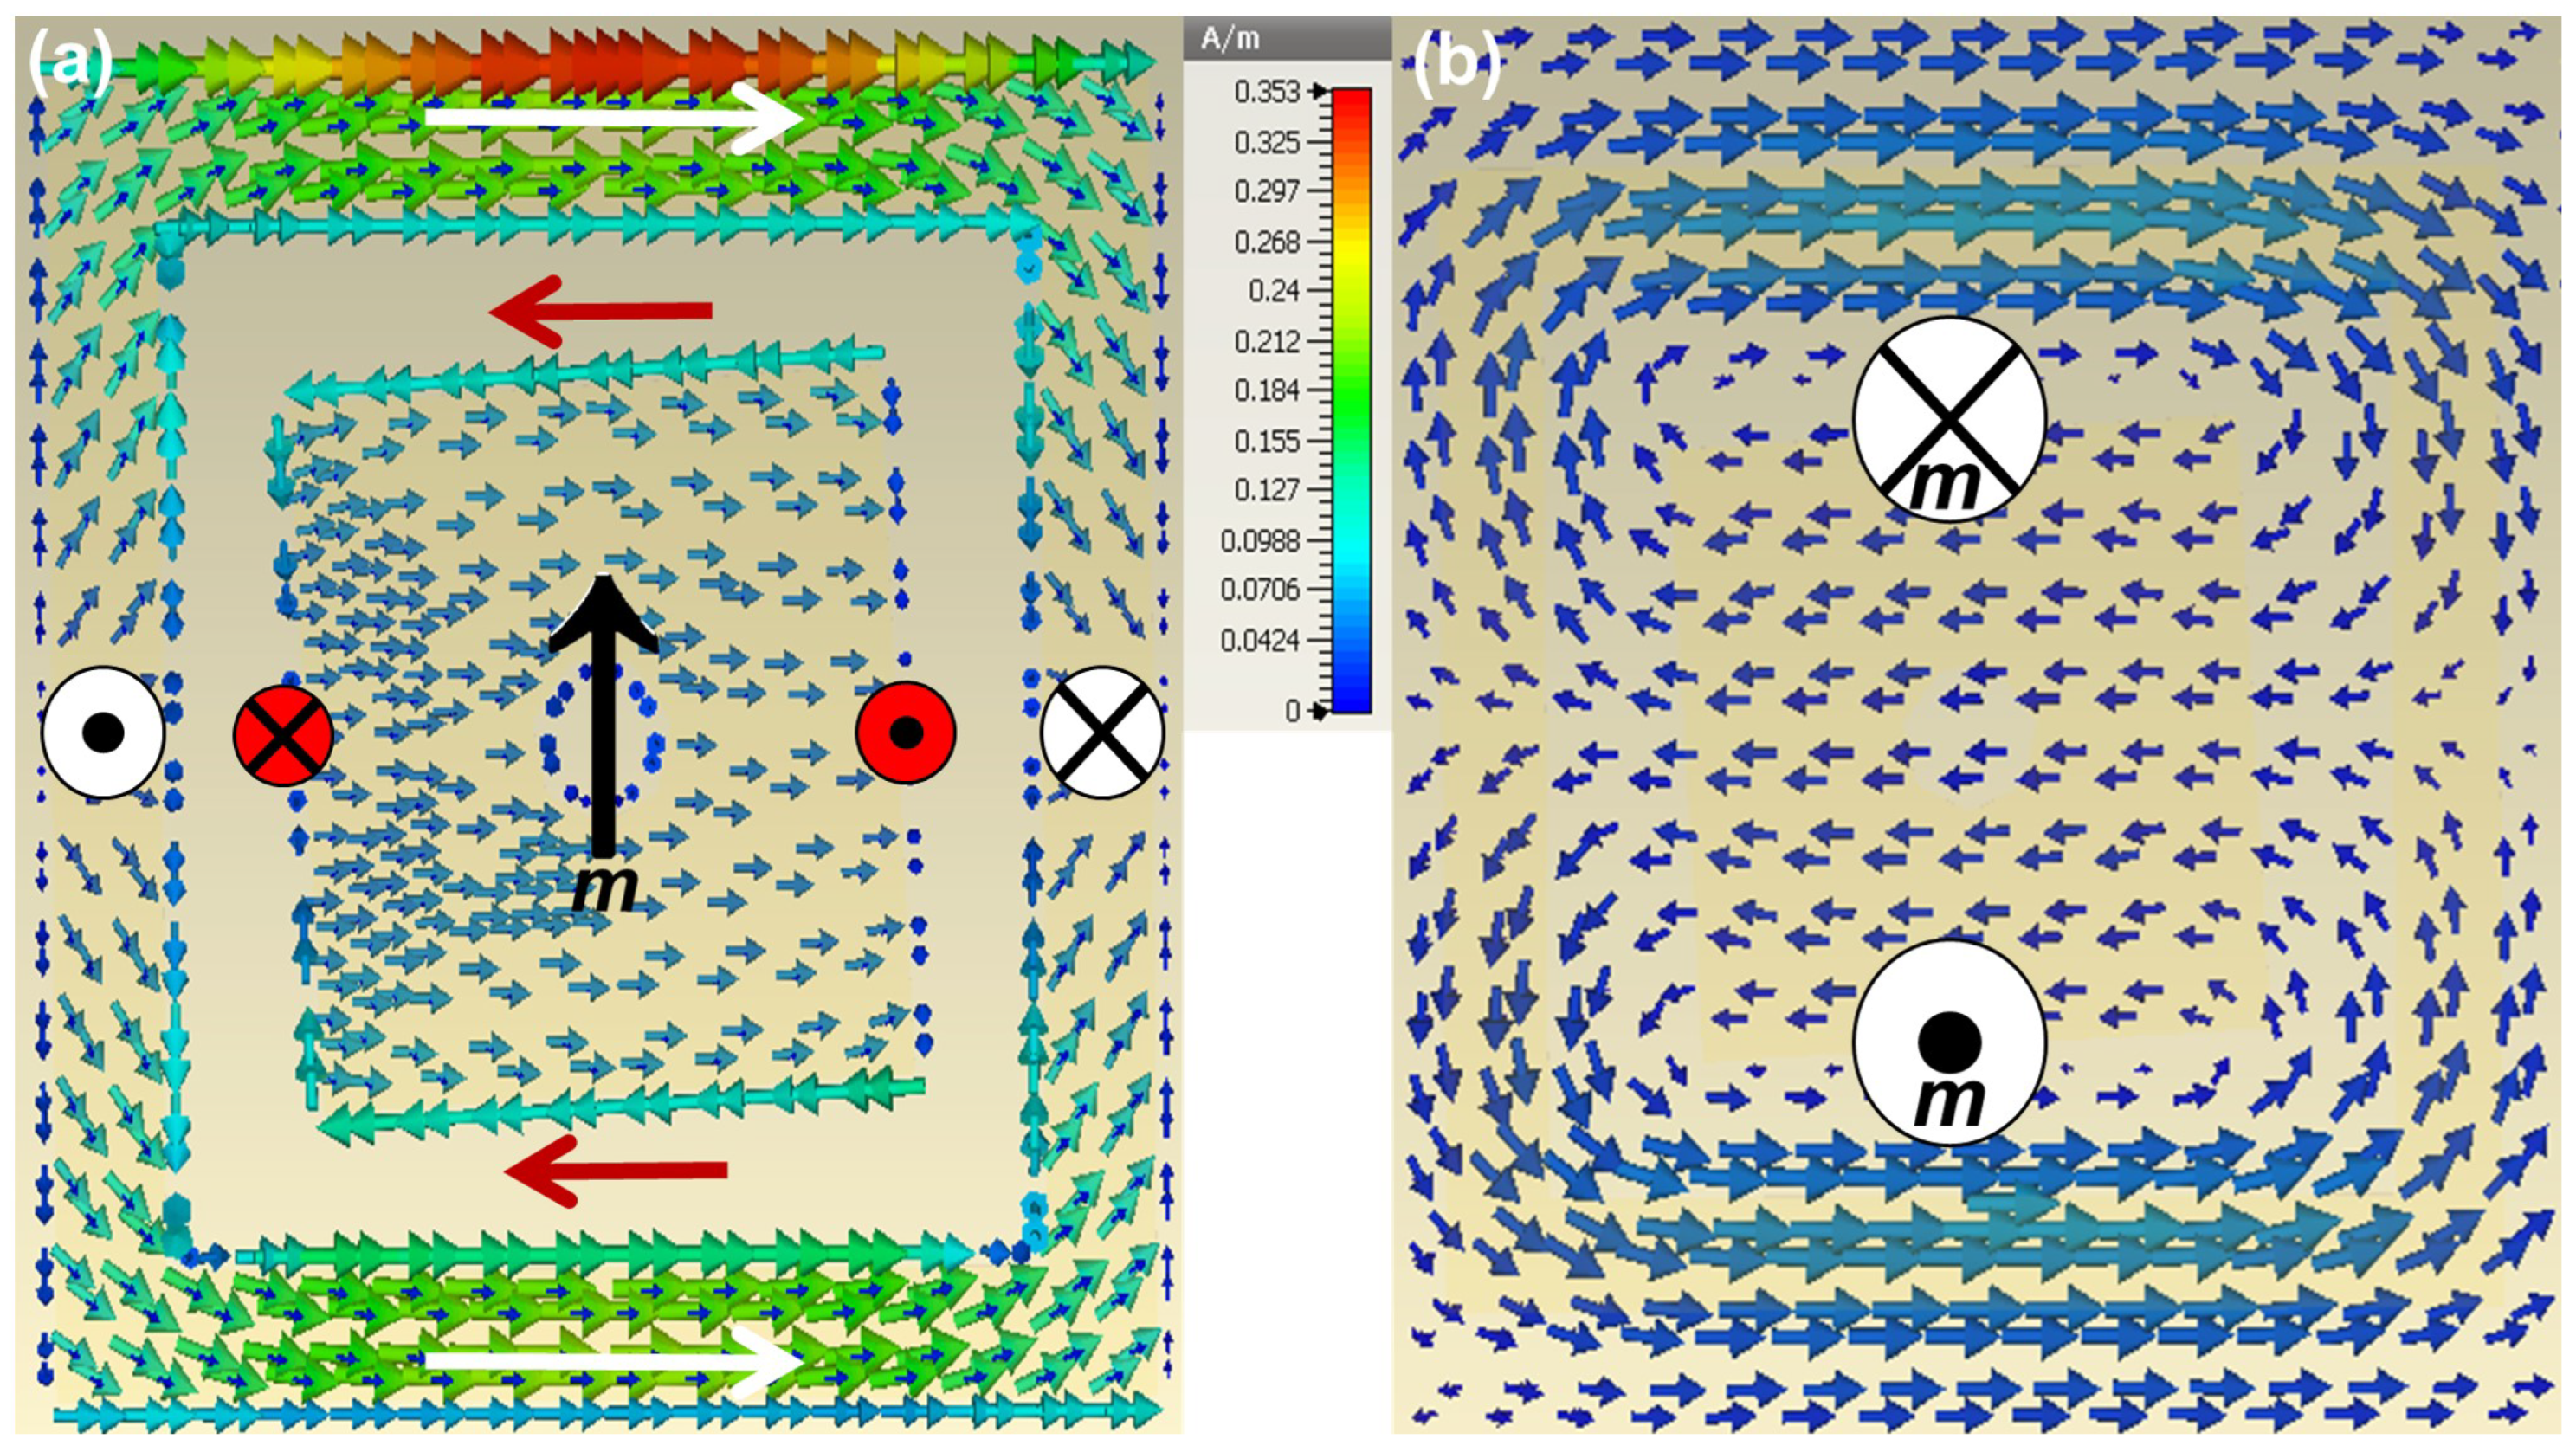
Surface current on each of top layer cell is accompanied by corresponding formation of circular surface current in the ground plane, Figure 17b. This make the role of ground plane current distributions an aspect of consideration in defining the radiation mechanism. The strength and direction of the ground plane circular loop currents generated beneath each UC are directly corresponding to the currents on respective top layer outer rings although ground plane is a single physical and electrical body unlike the top layer outer rings that are physically and electrically isolated. The H fields of each UC, plotted in Figure 19a, follow the right hand rule according to the direction of surface current on the outer ring. E fields of each UC, shown in Figure 19b, reveal an electric field potential boundary at the middle of each UC aligned with the inner patch tilt introduced during second symmetry breaking modification. This tilted potential boundary results into formation of electric dipoles within each UC. However due to oppositely directed E field potentials, the electric dipole of outer ring, P r , is opposite in direction to electric dipole of inner patch, P p . It is worth noticing that electric dipole moments of outer ring and inner patch are in a concentric but oppositely directed arrangement. However, due to different physical structures and potentials directions, their identity and response is distinct from each other.
Figure 19. UC H and E fields and dipole formation (cell-3 at phase value of 315° is taken due to clarity of fields). (a) H-fields (field direction in/out of page shown in white circles with cross and dot, respectively) due to surface currents on outer ring. (b) E-field and tilted ED formation (+ and-sign show the positive and negative polarity, respectively, of the ED). P p (red) and P r (white) are ED of inner patch and outer ring, respectively. P p and P r are parallel to each other and oppositely directed due to co-axial anti-phase currents. Tilting P r and P p by 3° in MOD-2 causes Shifting of anapole by 100 MHz.
In Figure 20a,b the surface currents behavior on top and ground layer within each UC are plotted. Figure 20a shows that at the outer ring of each UC in the top layer, there is a 3D flow of surface currents which divides the outer ring into two co-directional surface currents flow paths as indicated by white arrows. These 3D current paths source out and sink in towards the ground plane while converging at the middle of outer ring along the +y-axis. This creates two 3D current loops resulting into magnetic dipole moments along +x-axis (transverse to super-cell direction) in a head-to-tail arrangement, as shown in Figure 16b. Outer ring surface currents also generate two planar surface currents loops in the ground plane that are co-directional to the corresponding surface currents of outer ring on top layer (see Figure 20b). This creates two magnetic dipole moments along +x-axis in the ground plane in a ring-like arrangement that reinforce the magnetic dipole moments of outer ring at top layer. This head-to-tail arrangement of magnetic dipole moments of the outer ring forms a toroidal dipole moment along the super-cell but opposite in direction i.e., along negative y-axis, (Figure 16c) with respect to the current flows of the outer ring as shown in Figure 20.
Figure 20. UC surface currents (cell-3 at phase value of 315° is taken due to clarity of fields). (a) Surface currents on top layer: anti-phase currents on outer ring (white arrow) and inner patch (red arrow) are evident. In both sub-structures the surface currents are forming 3D current loops in/out of the structure as indicated by white circles (outer ring) and red circles (inner patch). Magnetic dipole (black arrow) formed in inner patch. (b) Surface currents on ground plane corresponding to the top layer on left panel: MD formation in/out of ground plane.
On the inner patch of each cell in the top layer, there are co-directional current flow paths analogous to the outer ring but in opposite direction as indicated by red arrows, Figure 20a. However, these current flow paths are not 3D as observed in case of outer ring. The currents of inner patch stay confined strictly to the top and bottom layer of the inner patch while forming a closed current path between edges and patch surface, with no corresponding effect on the ground plane charge-current distributions. Addition of a hole to inner patch during third super-cell non-local modification, results into formation of a surface current loop around the hole responsible for the formation of magnetic dipole moment at the middle of the inner patch (Figure 20a). This magnetic dipole moment of inner patch represented by the black arrow in middle of inner patch in Figure 16c, is directed lateral to the toroidal dipole moment formed by the outer ring.

4.2. Controlling Dipole Interactions for Radiation and Suppression Management

As a consequence of the charge-current distribution formed in the structure due to interaction with incoming incident plane wave, there is dipole formation as discussed in preceding sub-section. These UC dipoles then interact with each other within the position and phase frame work of super-cell resulting into formation of far-field radiation pattern as measured through RCS obtained by full-wave simulation of SES, as discussed in previous section. First, we see how these dipole interact with each other to create far-field radiation pattern so that we can assess impact of modifications to manage far-field pattern by suppressing undesired and reinforcing desired radiations for our desired frequency of 8 GHz. Within each cell, in total there are 2 electric dipoles, one toroidal dipole (incorporates magnetic dipoles constituting it) and one magnetic dipole, all contribute to the radiation and suppression effects that are being managed to obtain desired far-field radiation (Figure 16c). From UC structure point of view, outer ring has one toroidal dipole and one electric dipole, inner patch has one electric dipole and one magnetic dipole. The head-to-tail arrangement of magnetic dipoles formed in the outer ring of each UC and corresponding reinforcing magnetic dipoles excited in the ground plane results into formation of toroidal dipole moment along the length of the super-cell, as highlighted in Figure 16b. Presence of bi-anisotropy both at UC and super-cell levels makes the contributions of this TD to far-field radiation non-negligible []. Anapole can be generated in a structure based on interaction of ED and TD that are co-located but in physically un-connected sub-geometries [].
Therefore the interaction of dynamic TD, T r , with oppositely directed electric dipole of the inner patch, P p , generates an anapole state (Figure 16d), that results into far-field radiation suppression of undesired modes ( m = 0 and m = 1 ). The electric dipole moment, P r , formed in the outer ring results into desired radiation of Floquet mode m = + 1 . The anapole response was noticed in PG-based SES at 8.2 GHz, as shown in Figure 6 and Figure 16e. Anapoles have a frequency dependent behavior that can be frequency-shifted by geometric tuning of the structure [,,].
For geometric tuning, we perform non-local symmetry breaking of super-cell structure to frequency-shift the anapole response to 8 GHz. In the first geometric tuning, we reduce size of all inner patches to bring anapole down to 8.1 GHz (Figure 16f). In the second non-local geometric tuning of super-cell, we tilt all inner patches by 3 . This causes misalignment of the incident TM-plane wave electric field vector with the dipoles formed in the structure formed along y-axis. This misalignment between incident electric field vector and dipoles of the structure causes frequency shifting of the anapole from 8.1 GHz to 8 GHz (Figure 16g). To further improve the suppression characteristics we fine tune the frequency of anapole using the third modification, that is a magnetic dipole in the inner patch. Its interaction with the anapole causes fine frequency shifting of the anapole (Figure 16h) as shown by RCS magnitude and frequency variations with size variations of hole, plotted in Figure 11. It is important to notice that although this hole does not have impact on phase response of the cell (Figure 10) which was used to generate the super-cell using the local design approach (Figure 5), it does effect the RCS magnitude and direction of the composite meta-molecule, (Figure 14) which is modified from perspective of electromagnetic multipoles formation in the structure. Summarizing roles of dipole and effects of geometric tuning:
(a)
T r + P p = Anapole (undesired radiation suppression)
(b)
Inner patch size reduction (frequency shifting of anapole)–modification–1
(c)
Inner patch tilt (frequency shifting of anapole)–modification–2
(d)
m, magnetic dipole of inner patch (frequency shifting of anapole)–modification–3
(e)
P r for desired radiation

5. Effect of Dipole Interactions on Frequency Response of Modes

To analyze the effect of dipoles and subsequent modifications on the frequency response of radiation modes of the structure, a frequency scan of the RCS generated by the SES from 7.5–8.5 GHz was done adopting a 10 MHz frequency step. The structure has three distinct Floquet radiation modes; two undesired, m = 1 and m = 0 , and one desired, m = + 1 . For each radiation mode of SES, 1 × 9 radiating units, frequency response analysis was separately done to observe how it radiates initially and how it evolves with the modifications.
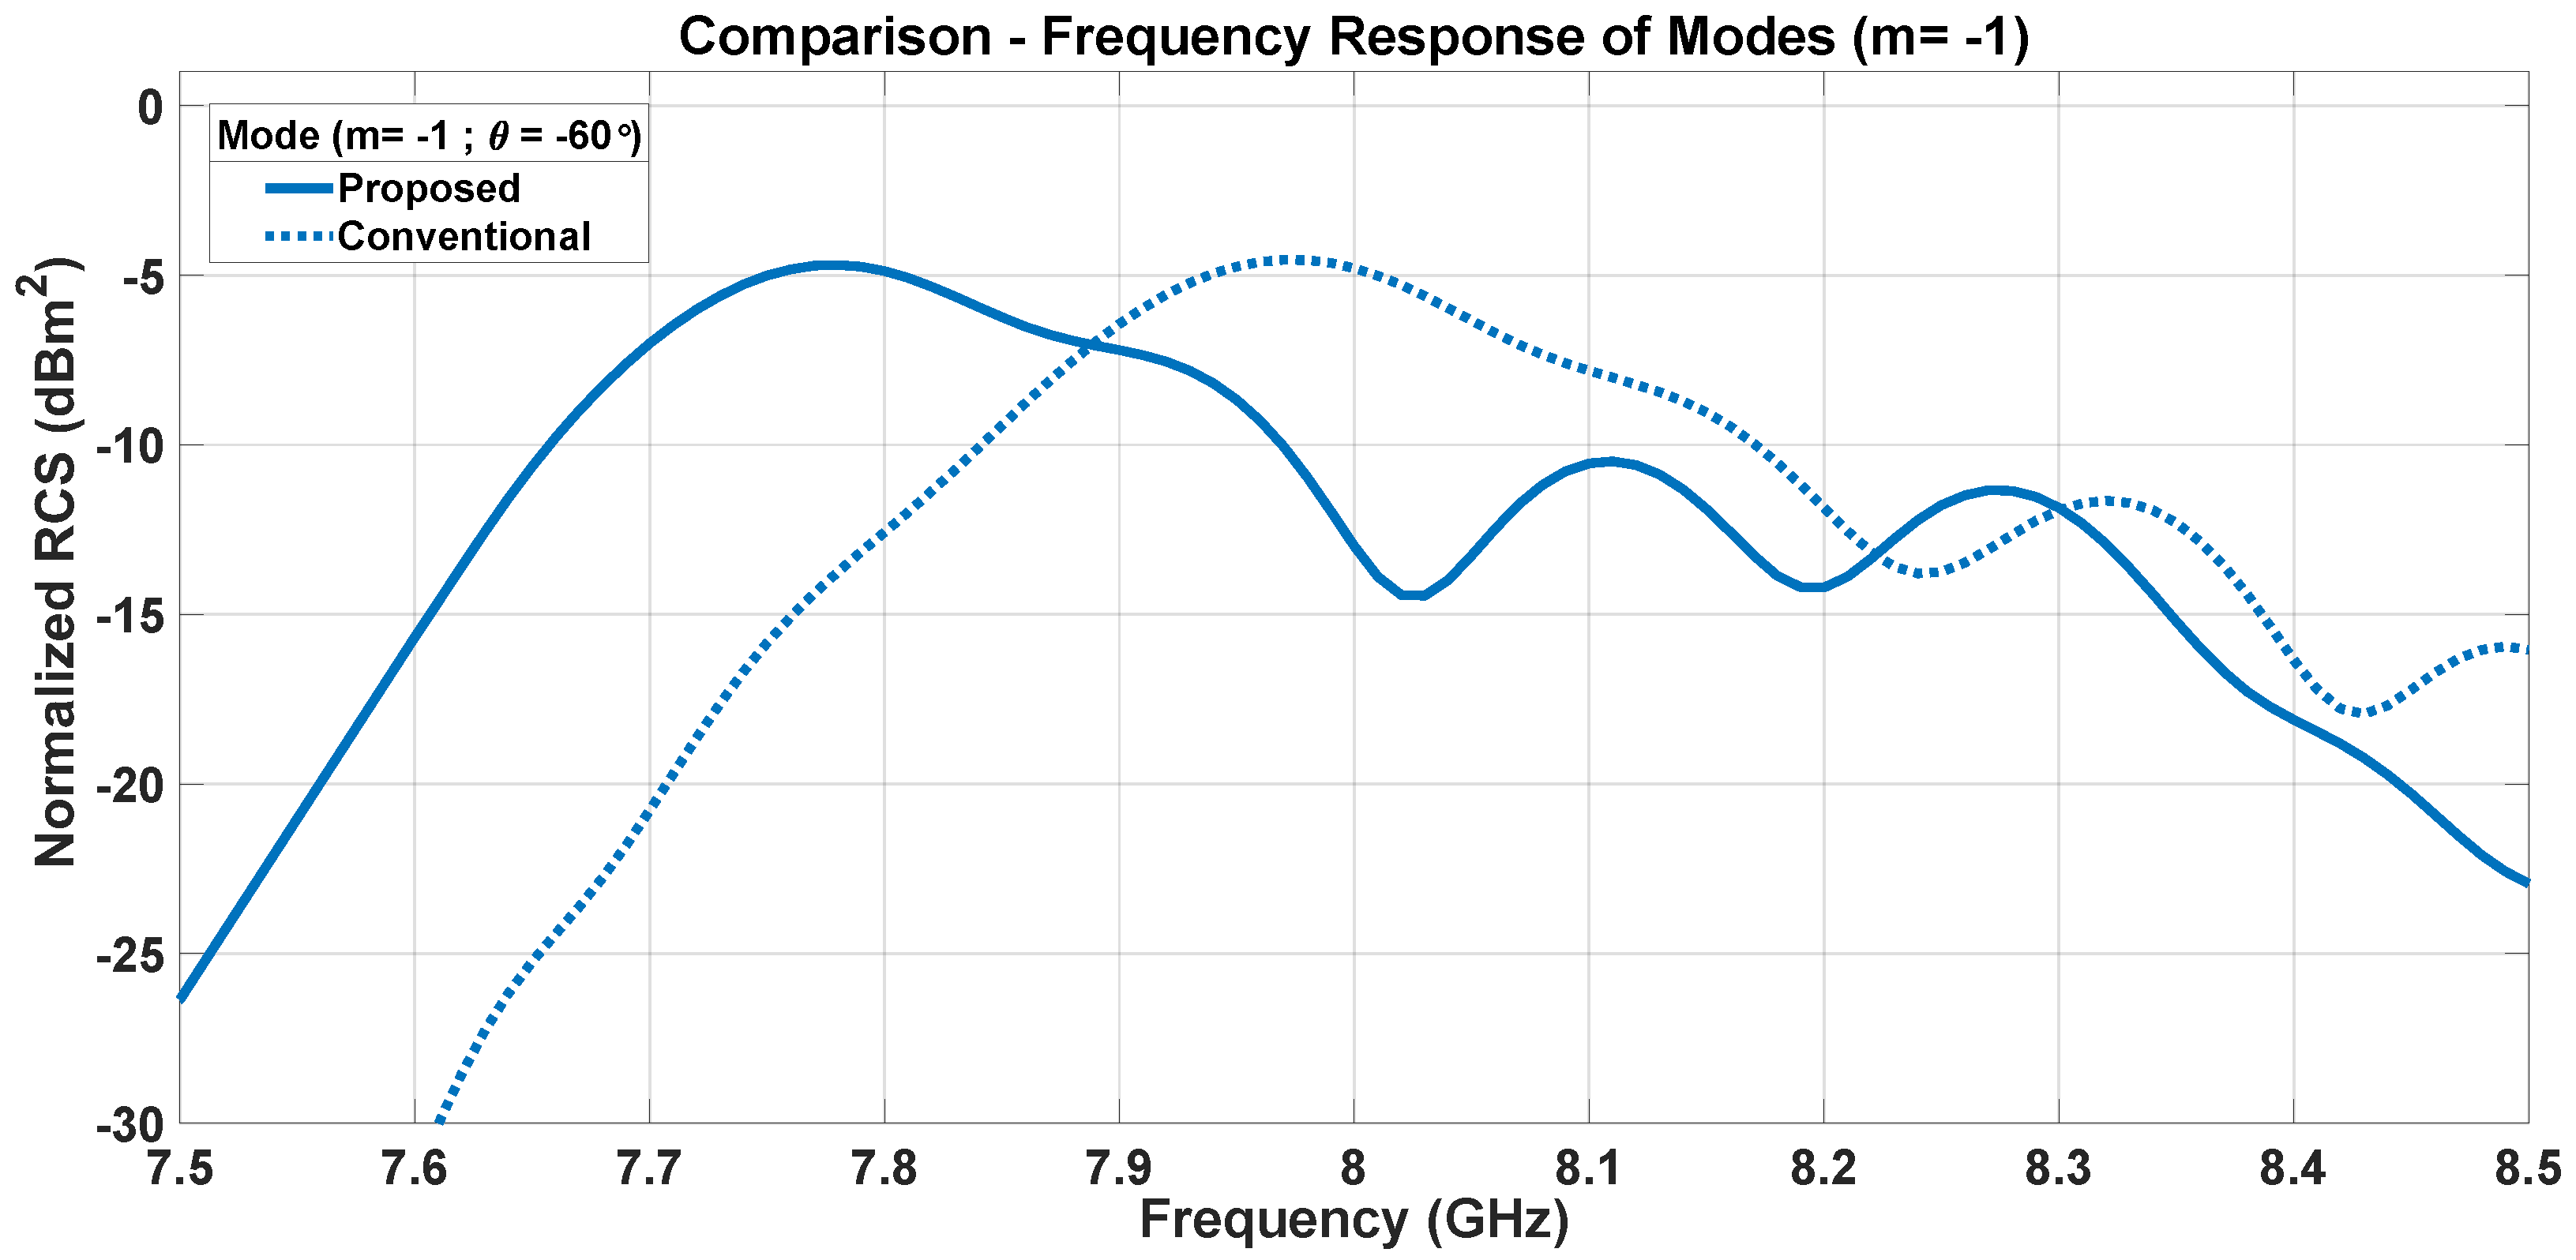
In Figure 21 the variation of the RCS related to radiation of the mode m = 1 for both the SESs designed with the PG method and the proposed approach over the considered frequency range is plotted. In the case of the PG-based SES, the RCS has a maximum at the design frequency and it is no lower than −10 dB between 7.85 GHz and 8.18 GHz. On the contrary, the smart skin designed with the proposed approach exhibits a RCS of approximately −14 dB at the design frequency, and it stays lower than −10 dB for frequencies greater than 7.89 GHz.
Figure 21. Frequency response of modes ( m = 1 , θ = 60 ).
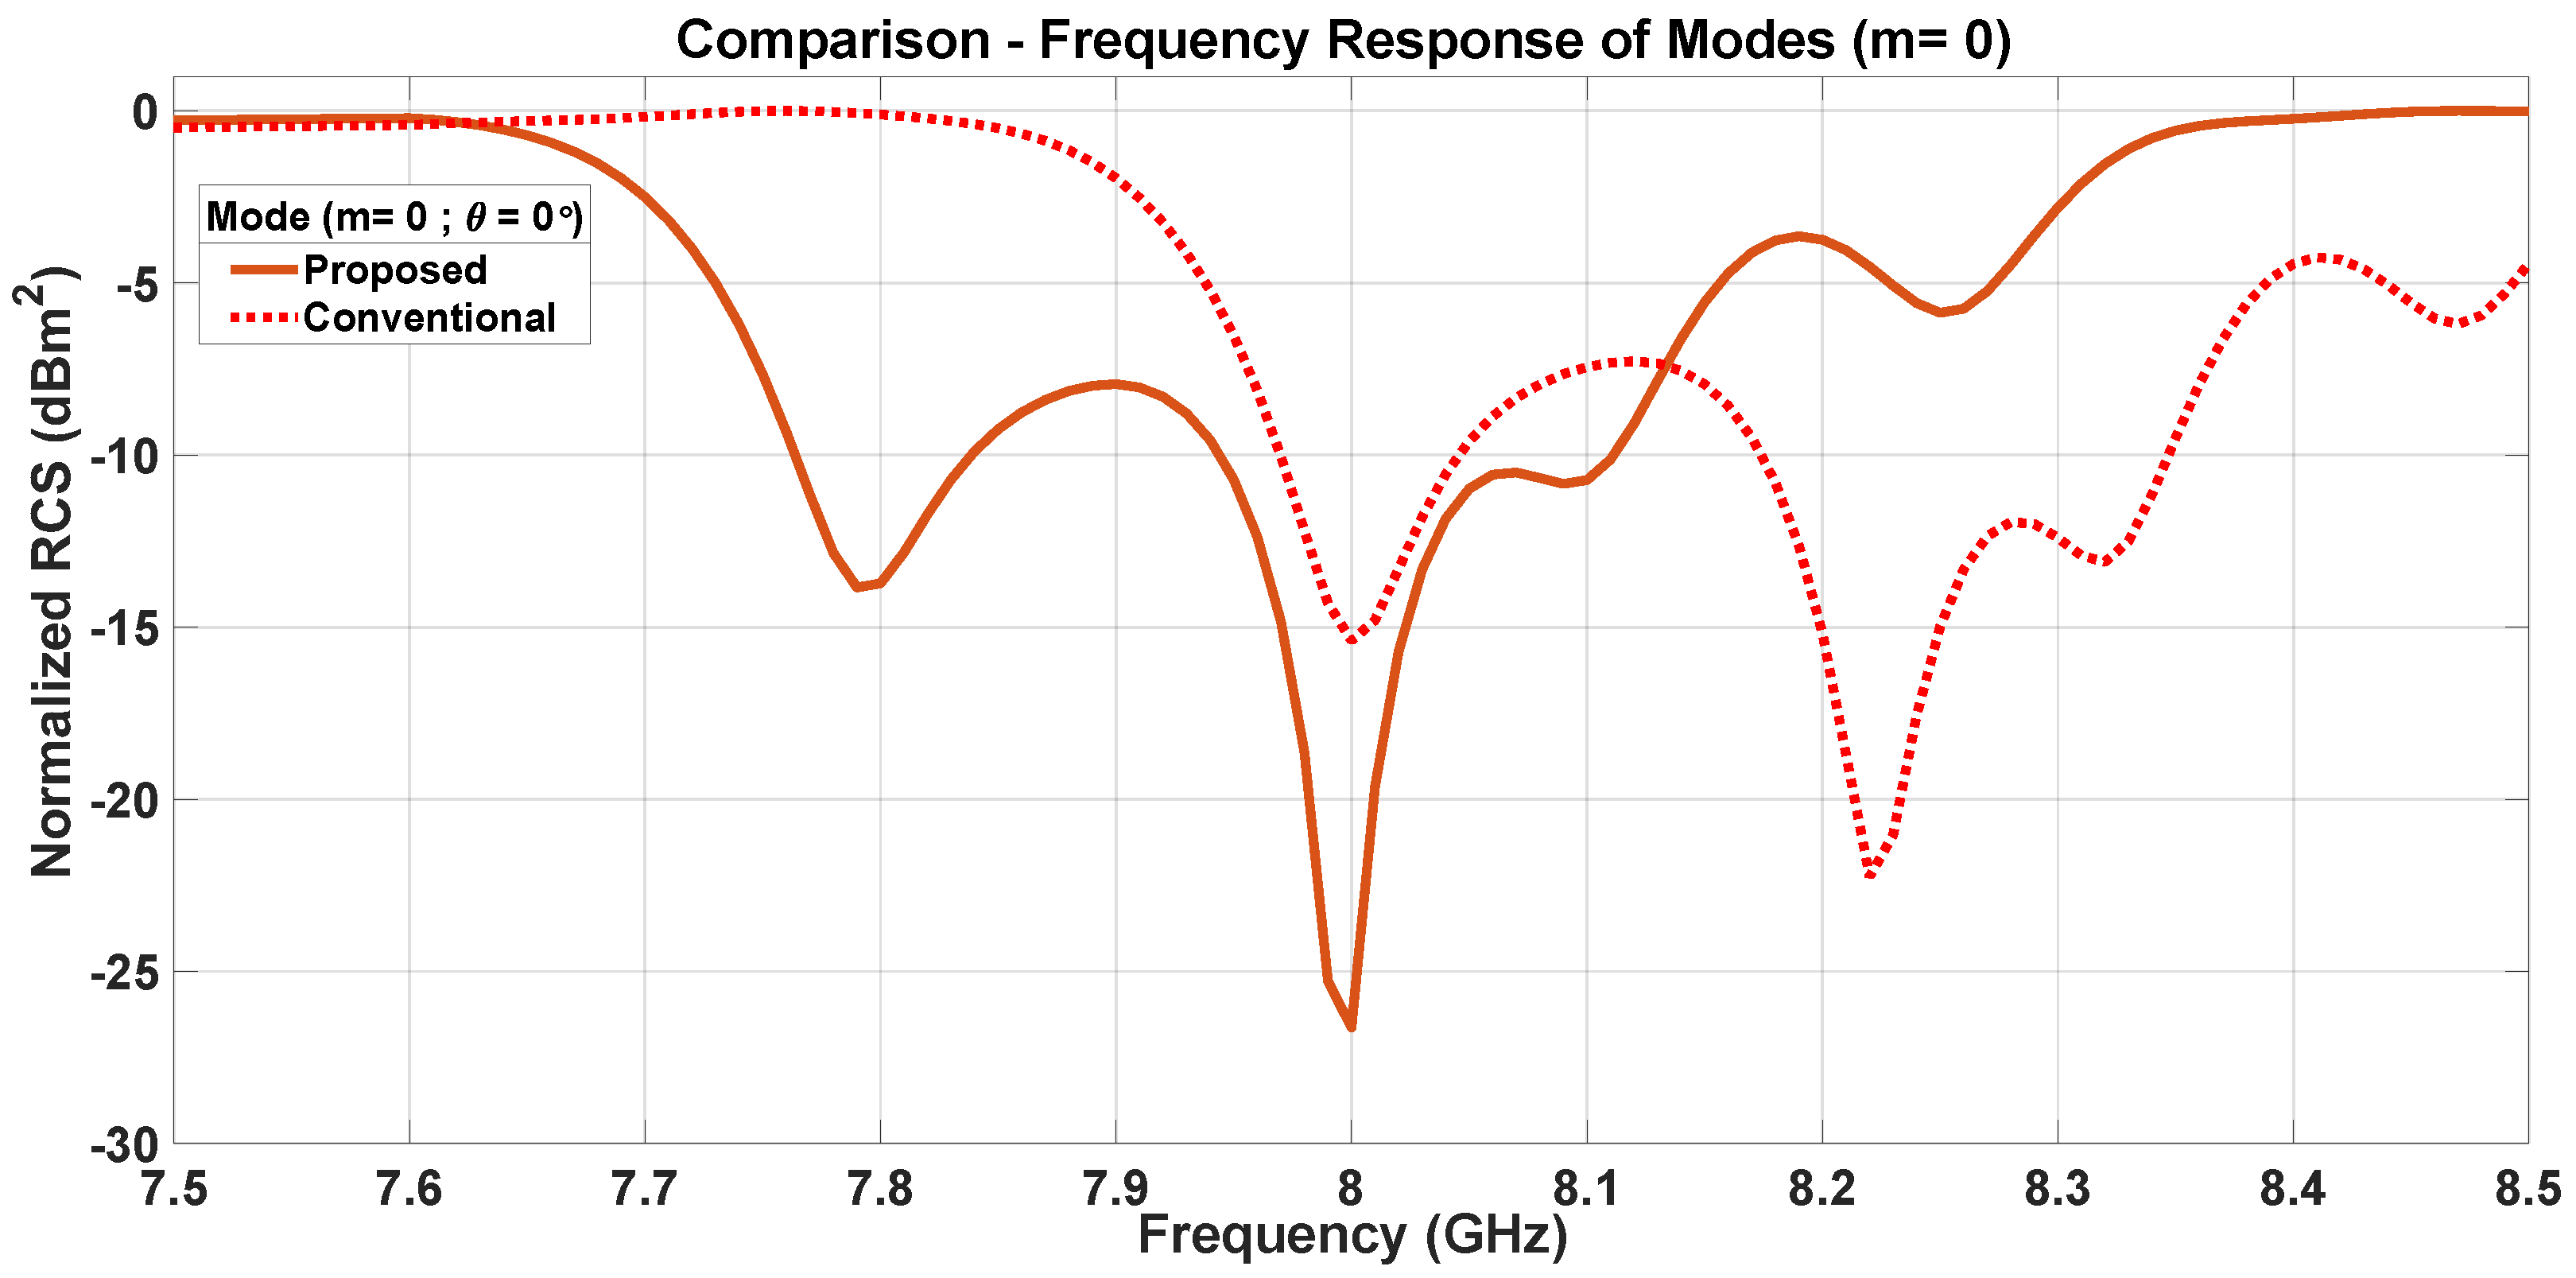
A similar analysis has been performed for the contribution of the radiation of the m = 0 mode and the results are plotted in Figure 22. While the RCS of the smart skin designed with the PG method stays below −10 dB only over a reduced band around 8 GHz and for frequencies between 8.19 GHz and 8.35 GHz, the SES designed with the proposed approach provides RCS lower than −10 dB over the ranges 7.7–7.82 GHz and 7.84–8.11 GHz, with a very low value (−26 dB) at the design frequency.
Figure 22. Frequency response of modes. ( m = 0 , θ = 0 ).
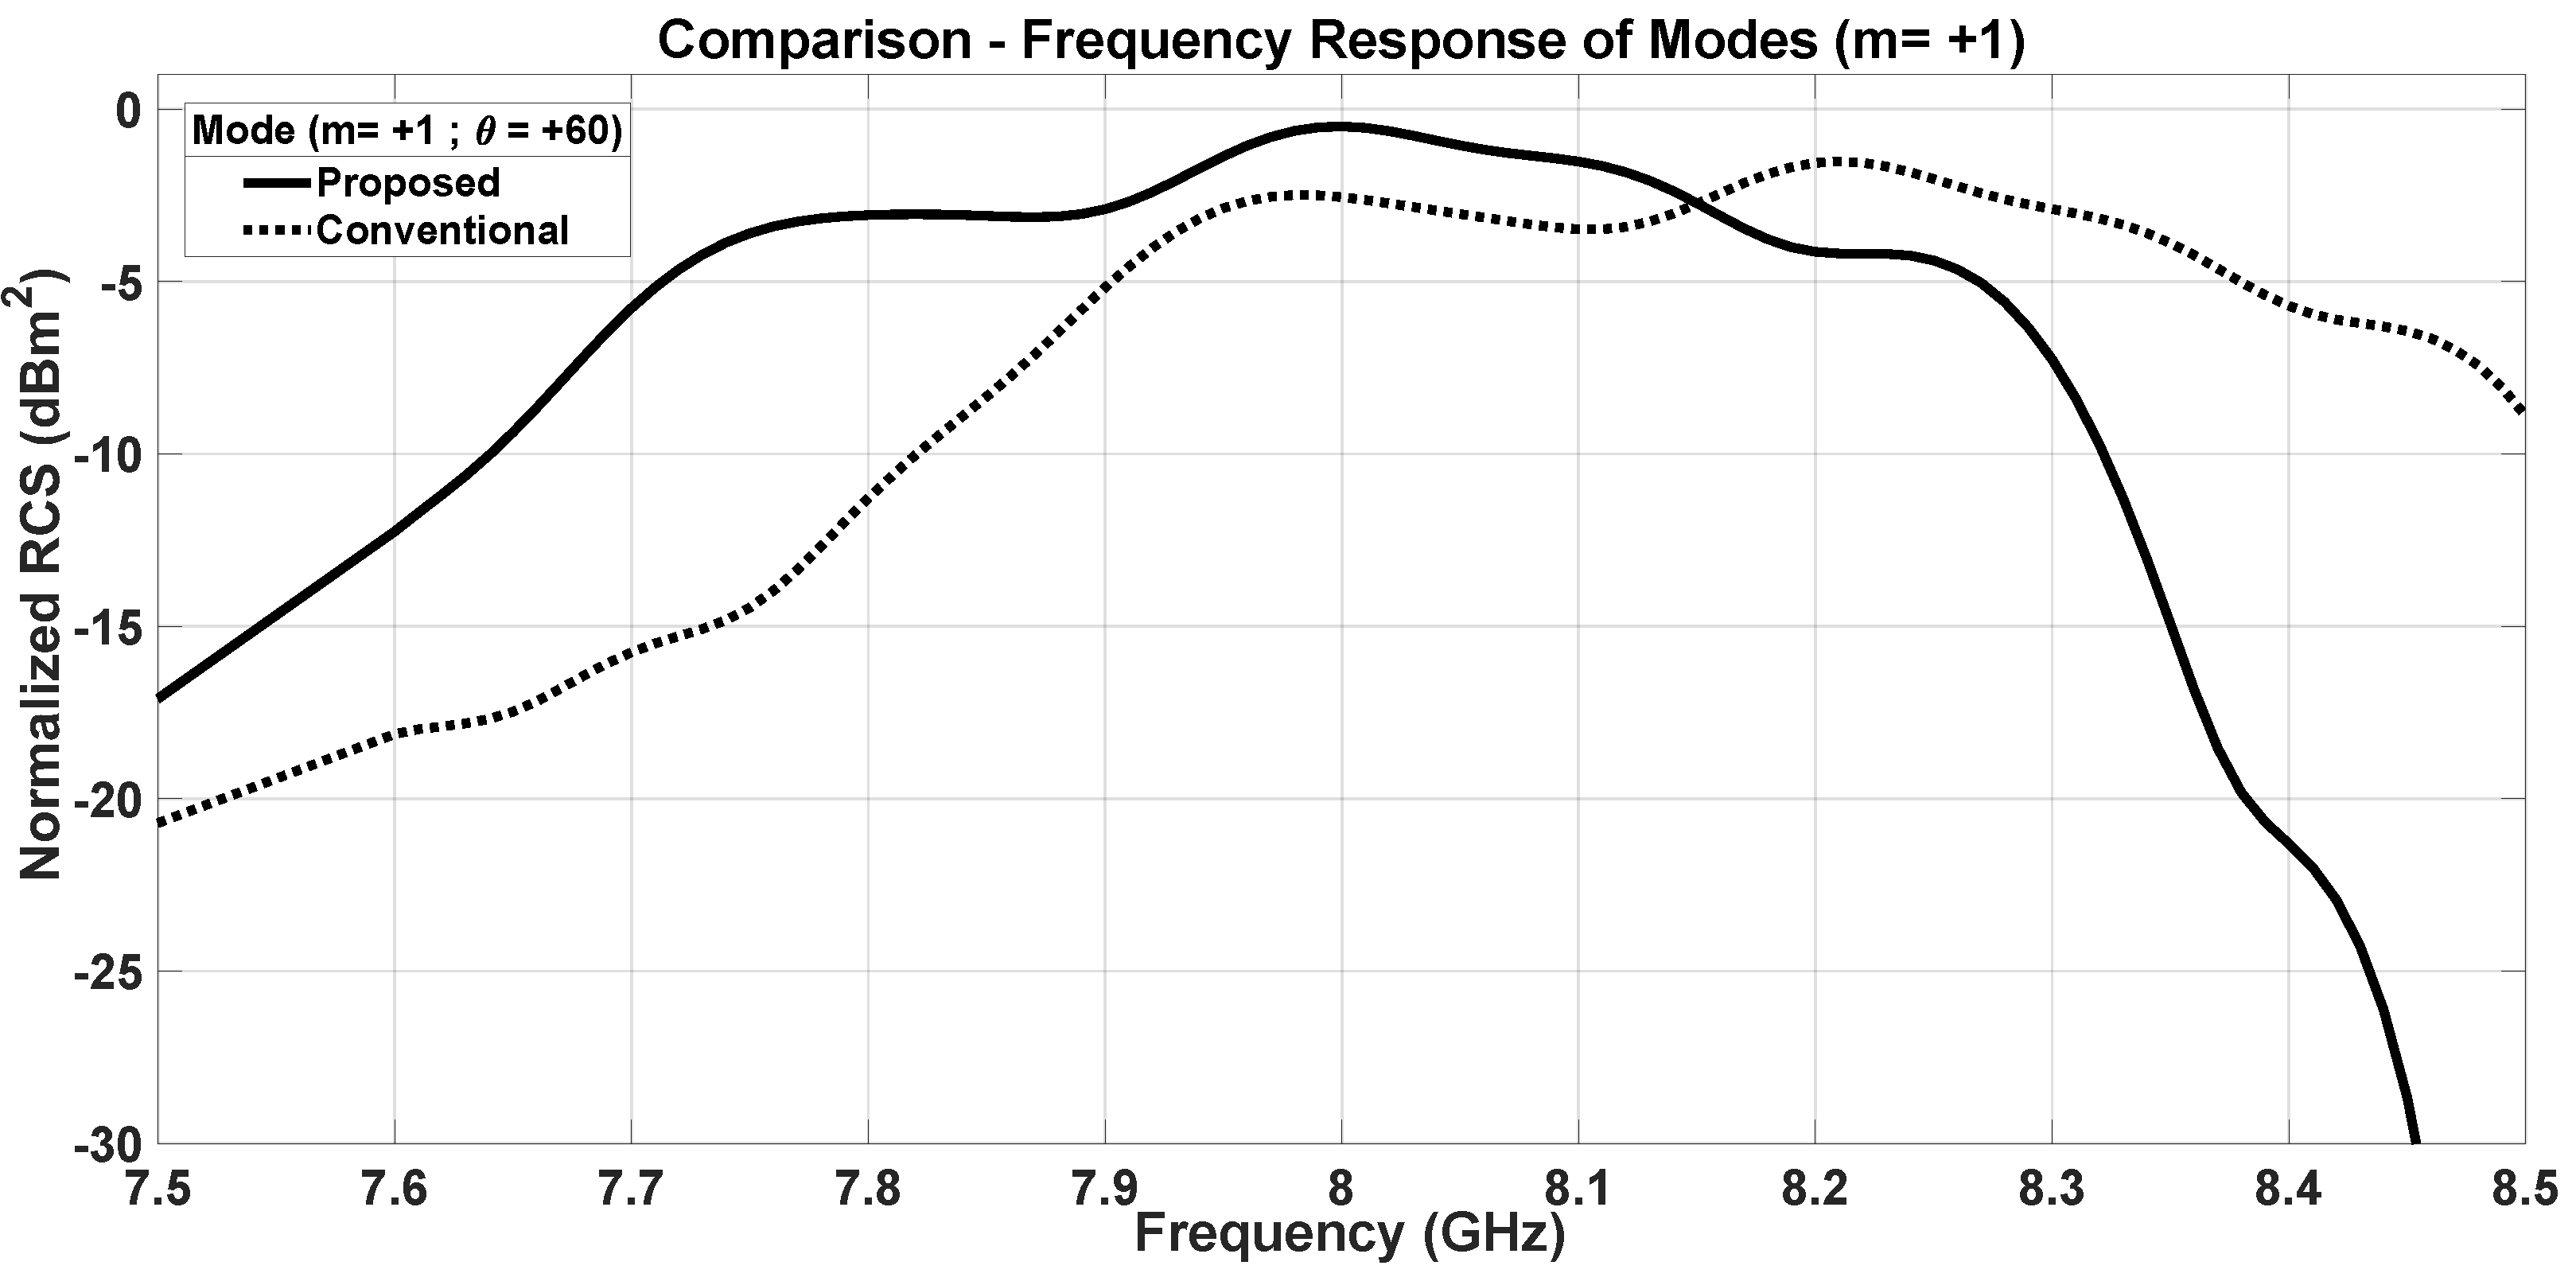
Finally, Figure 23 shows the frequency behavior of the RCS in the correspondence of the pointing angle θ = + 60 . The SES designed with the PG method shows a −3 dB bandwidth of ∼6% centered at 8.2 GHz, while for the smart skin designed with the proposed approach the bandwidth is centered at 8 GHz and it is of the order of 14 % .
Figure 23. Frequency response of modes. ( m = + 1 , θ = + 60 ).

6. Diffraction Grating-like Behavior

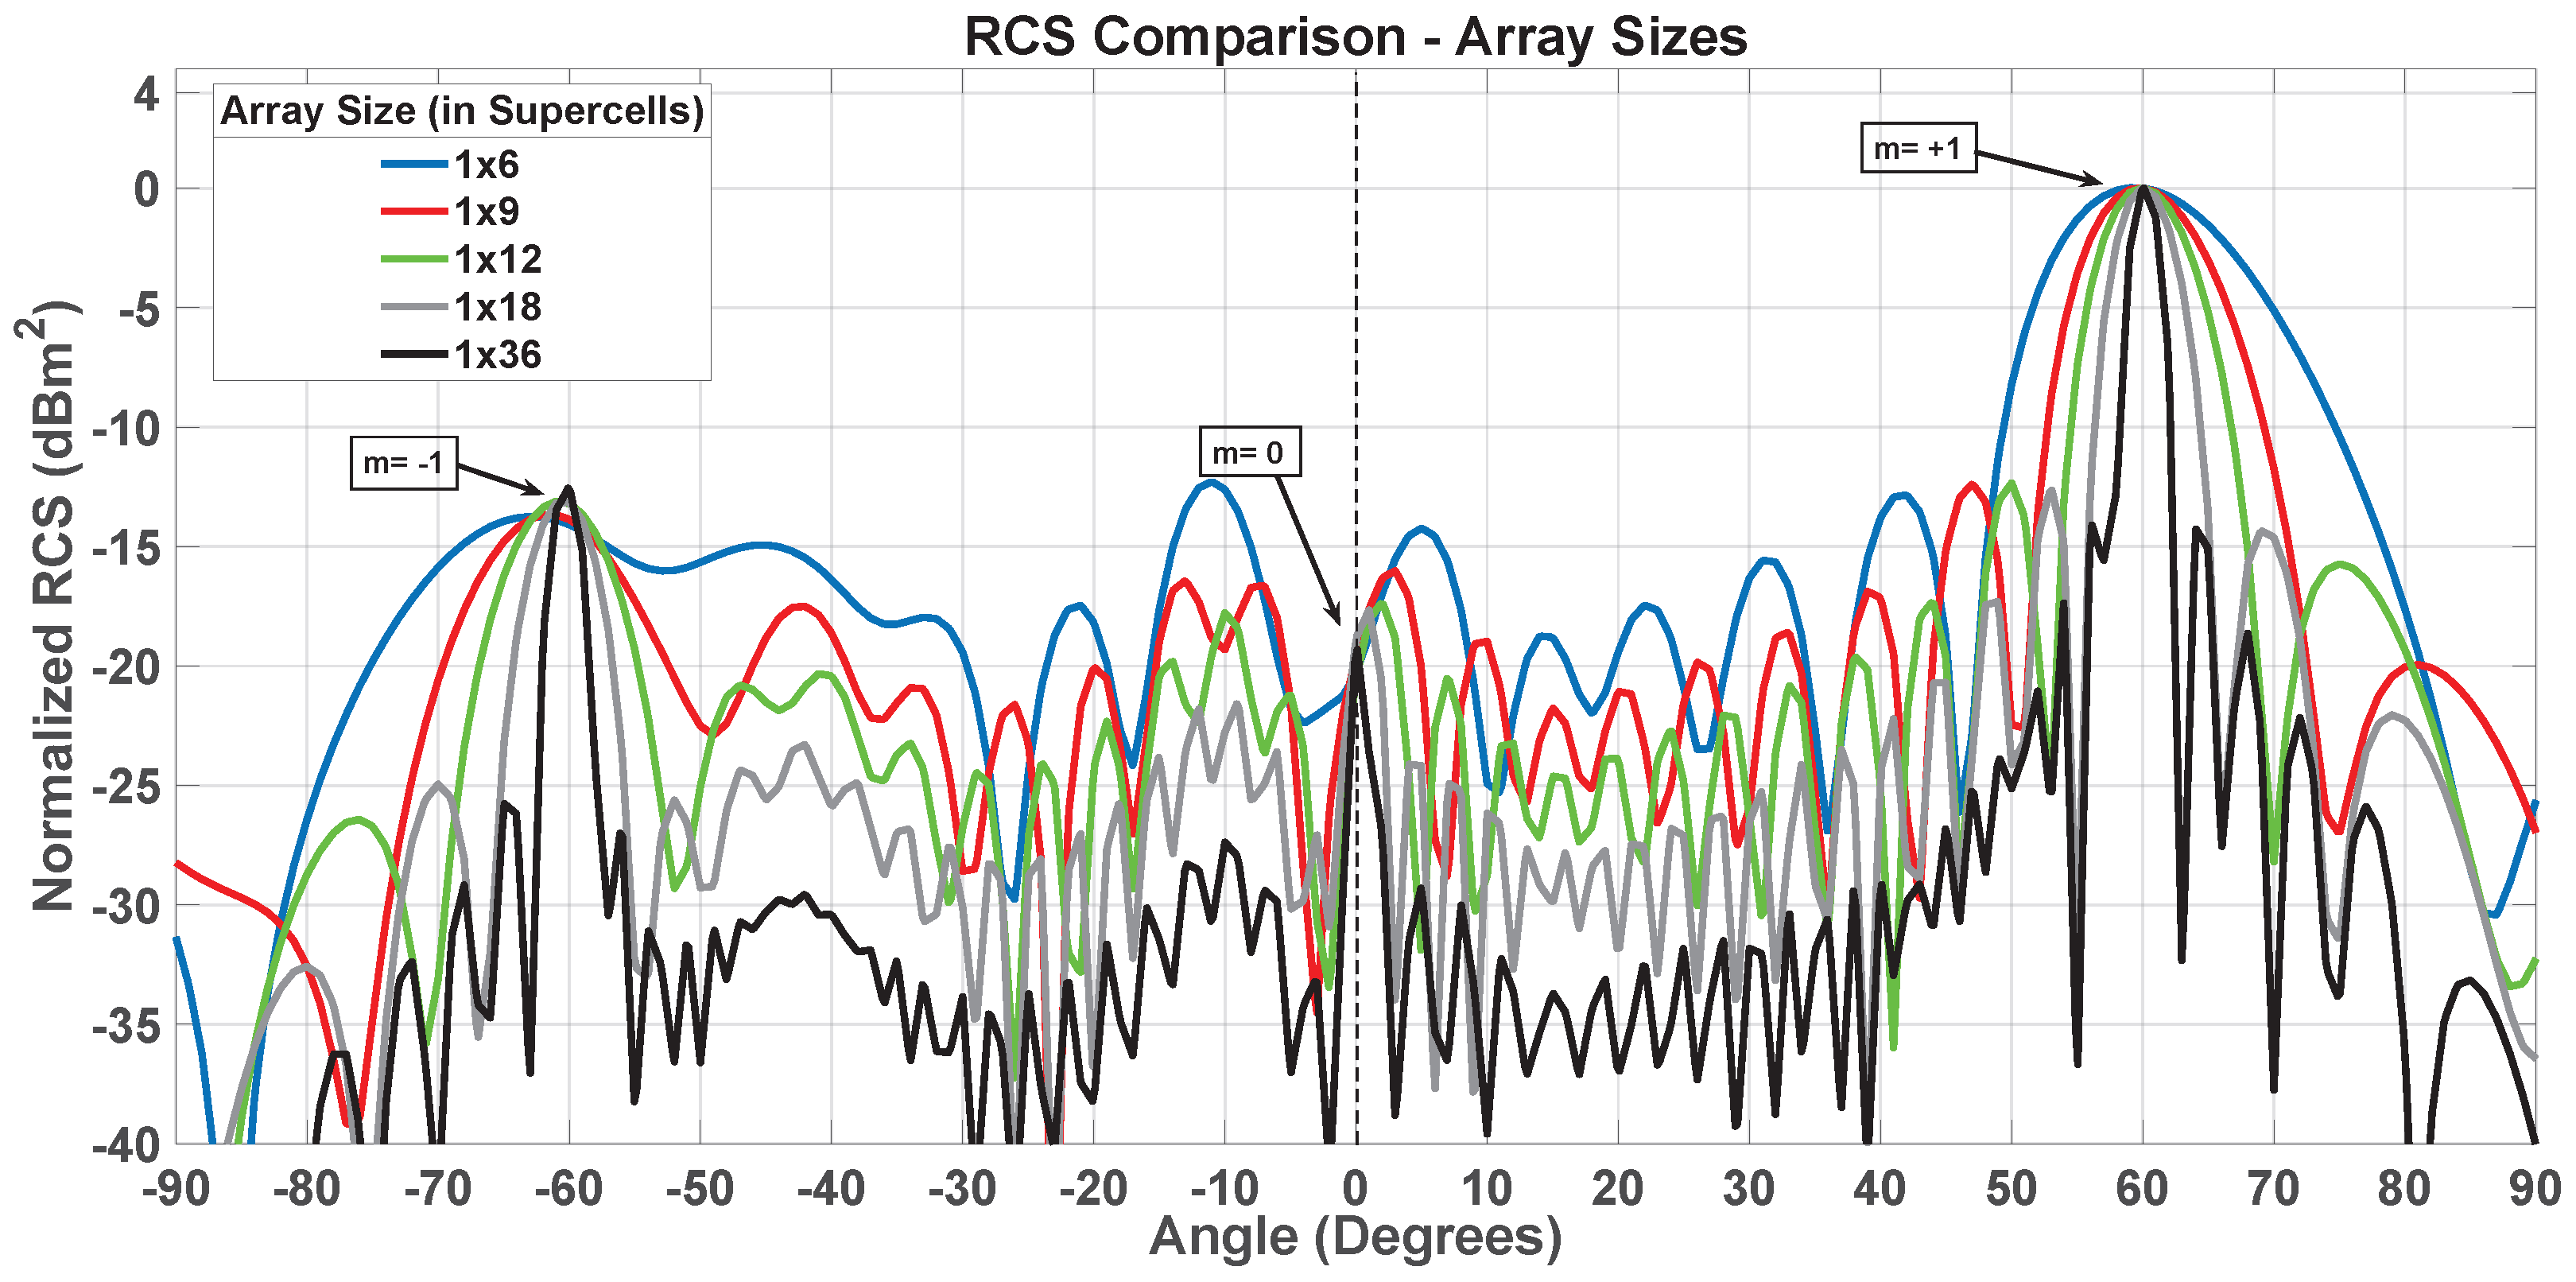
Up to now all the results and discussion were based on static passive anomalous reflective 1D SES composed of 9 radiating elements i.e., 1 × 9 composite meta-molecules, orientated along the + y -axis. Now we vary the size of the SES considering configuration with different numbers of the macro-cells. The SES size from 1 × 6 to 1 × 36 in different step sizes results into sharpening of the modes. In Figure 24, the RCS obtained by the full-wave analysis of different size SESs is plotted. The difference of magnitude between desired Floquet mode and undesired Floquet modes, i.e., parasitic suppression, stays fixed irrespective of number of radiating elements. While at the same time suppression of all non-Floquet spurious radiations is increased in proportionality to the number of super-cells. This shows an ideal diffraction grating-like response having anomalous reflecting capability and efficient parasitic suppression capability. An important structural difference is that unlike anomalous reflecting Meta-gratings, a single radiating element (super-cell) is just 1D and not transverse to the pointing direction.
Figure 24. Effect of SES size on RCS. All Floquet modes become sharper (beam-width reduced) and spurious radiation suppression increased, showing diffraction grating-like response.

7. Sensitivity Analysis

Finally, an exhaustive analysis is carried out to study the dependence of SES performance on variations in the quantities involved in its design, since these quantities may differ from the nominal values adopted.
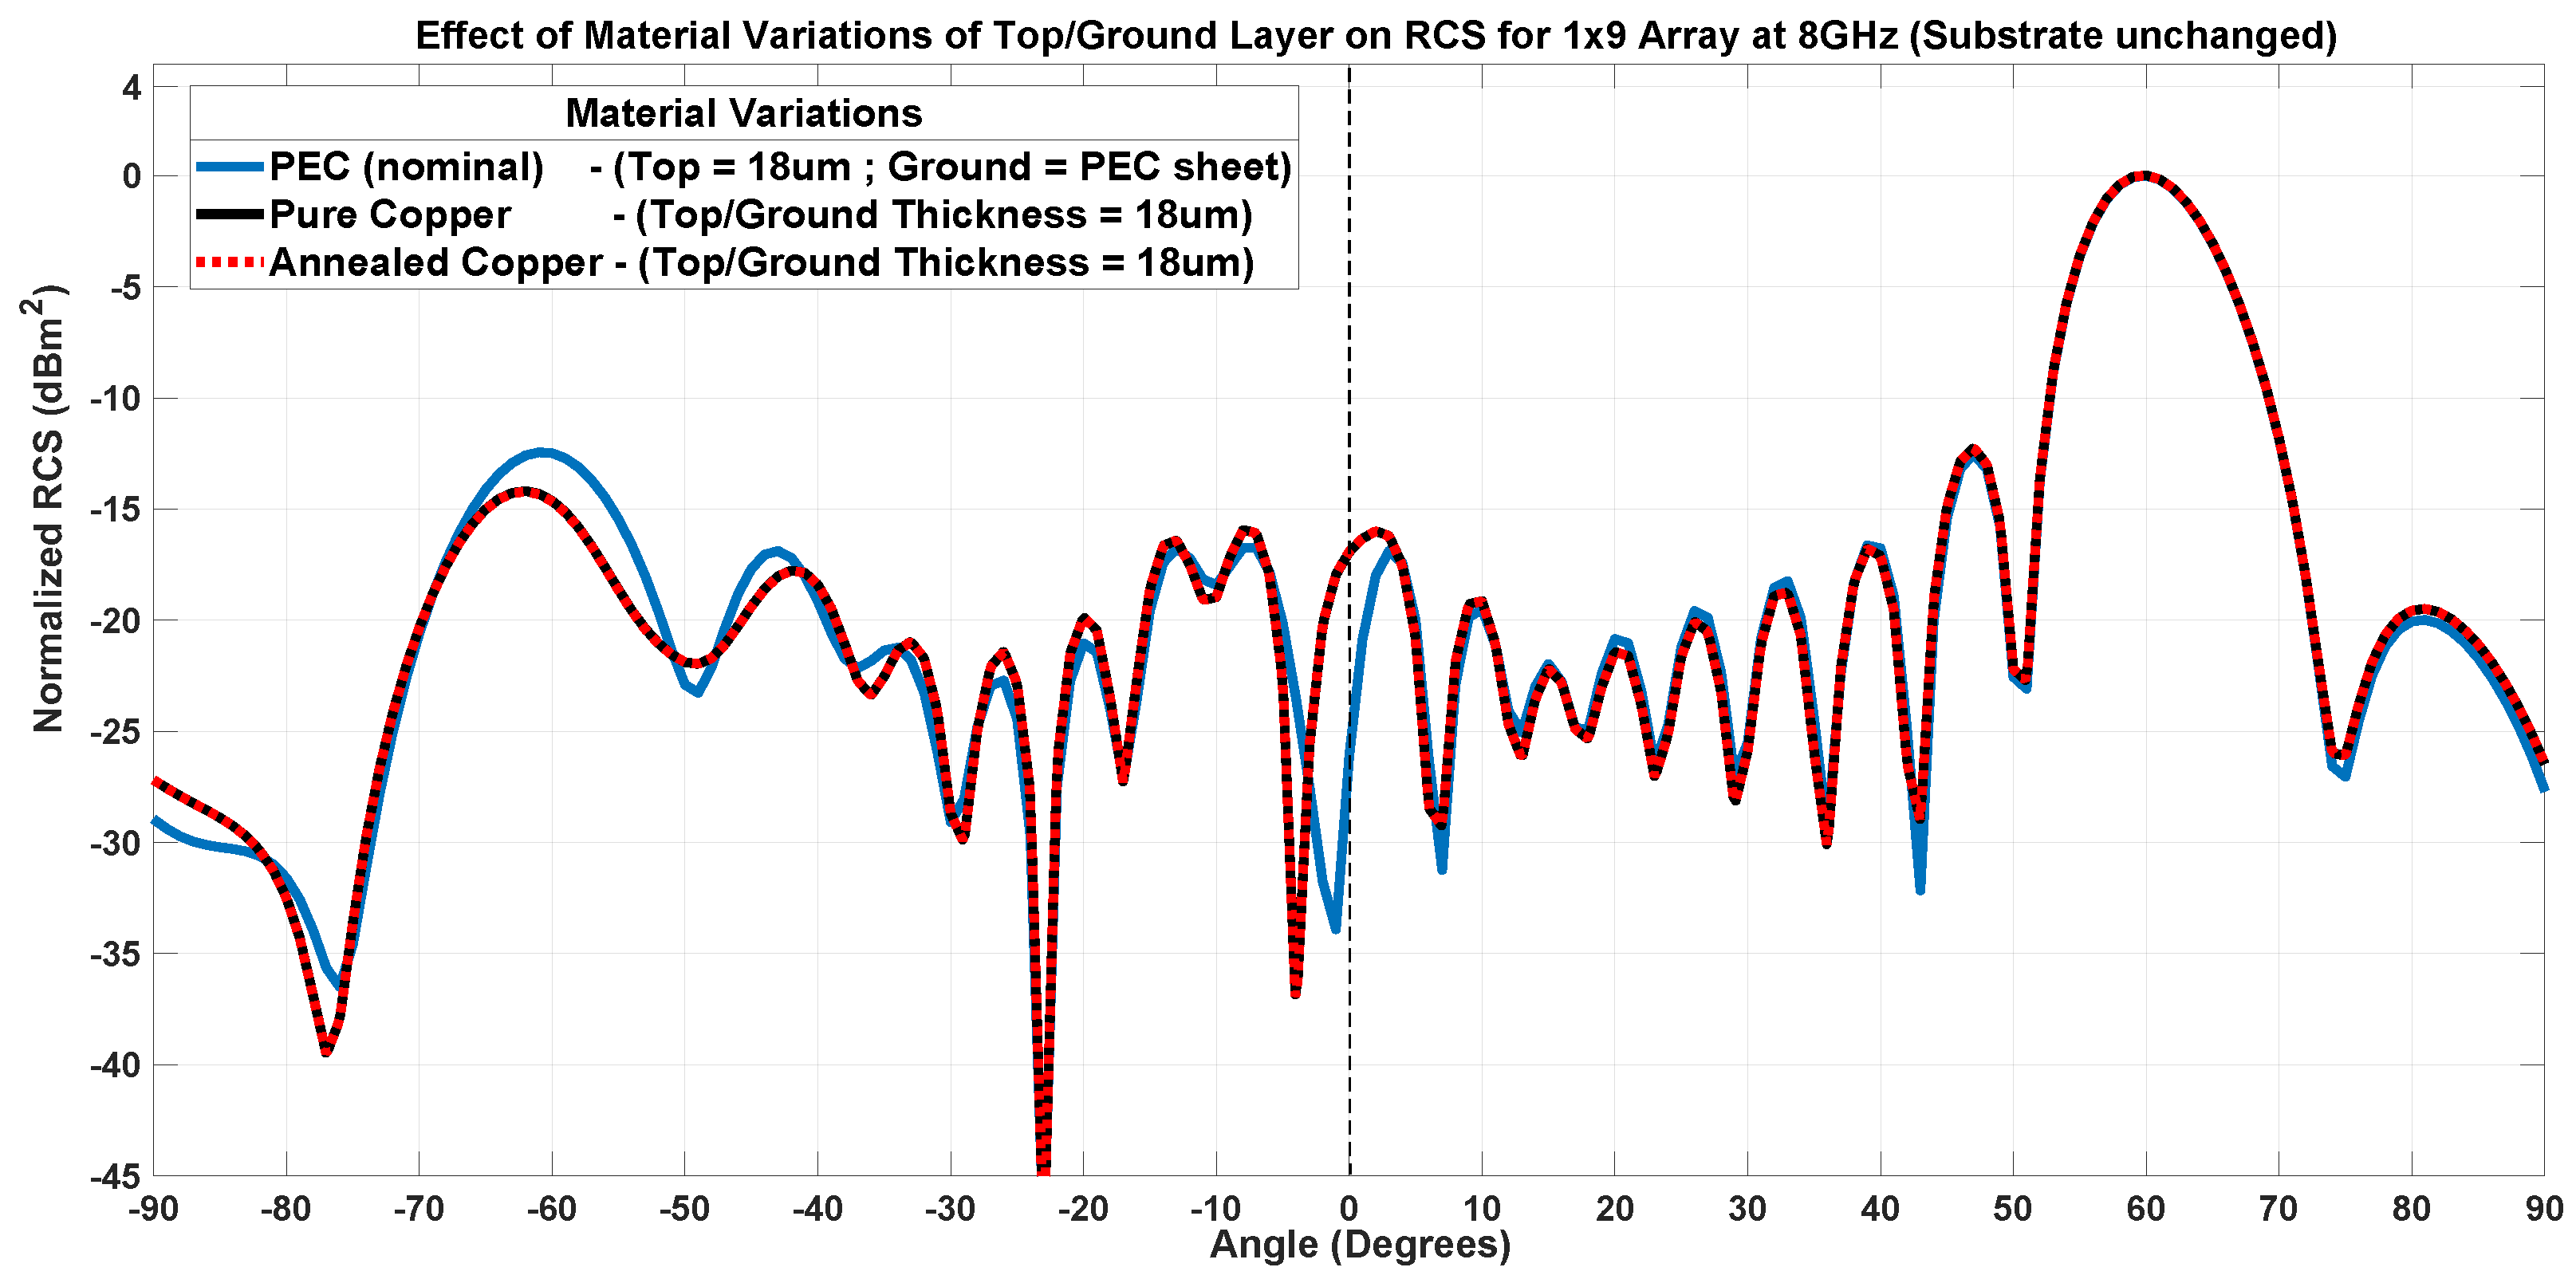
Two types of analyses were performed: a study of the effects of manufacturing tolerances on SES behavior and an analysis of the impact of using perfect electric conductors instead of real ones on the proposed method and results. The effect of the introduced variations on the RCS, evaluated at 8 GHz, and on the frequency response of Floquet modes was analyzed in all the considered cases.

7.1. Fabrication Tolerance Analysis

To analyze the robustness of the proposed method with respect to manufacturing tolerances, each of the three unit cell parameters (size and tilting of the inner patch and size of the inner patch hole) that were used to reduce spurious lobes is changed within an interval around its nominal value. The effect of each variation is examined separately, with the nominal values used for the other two quantities.

7.1.1. Inner Patch Size-MOD-1

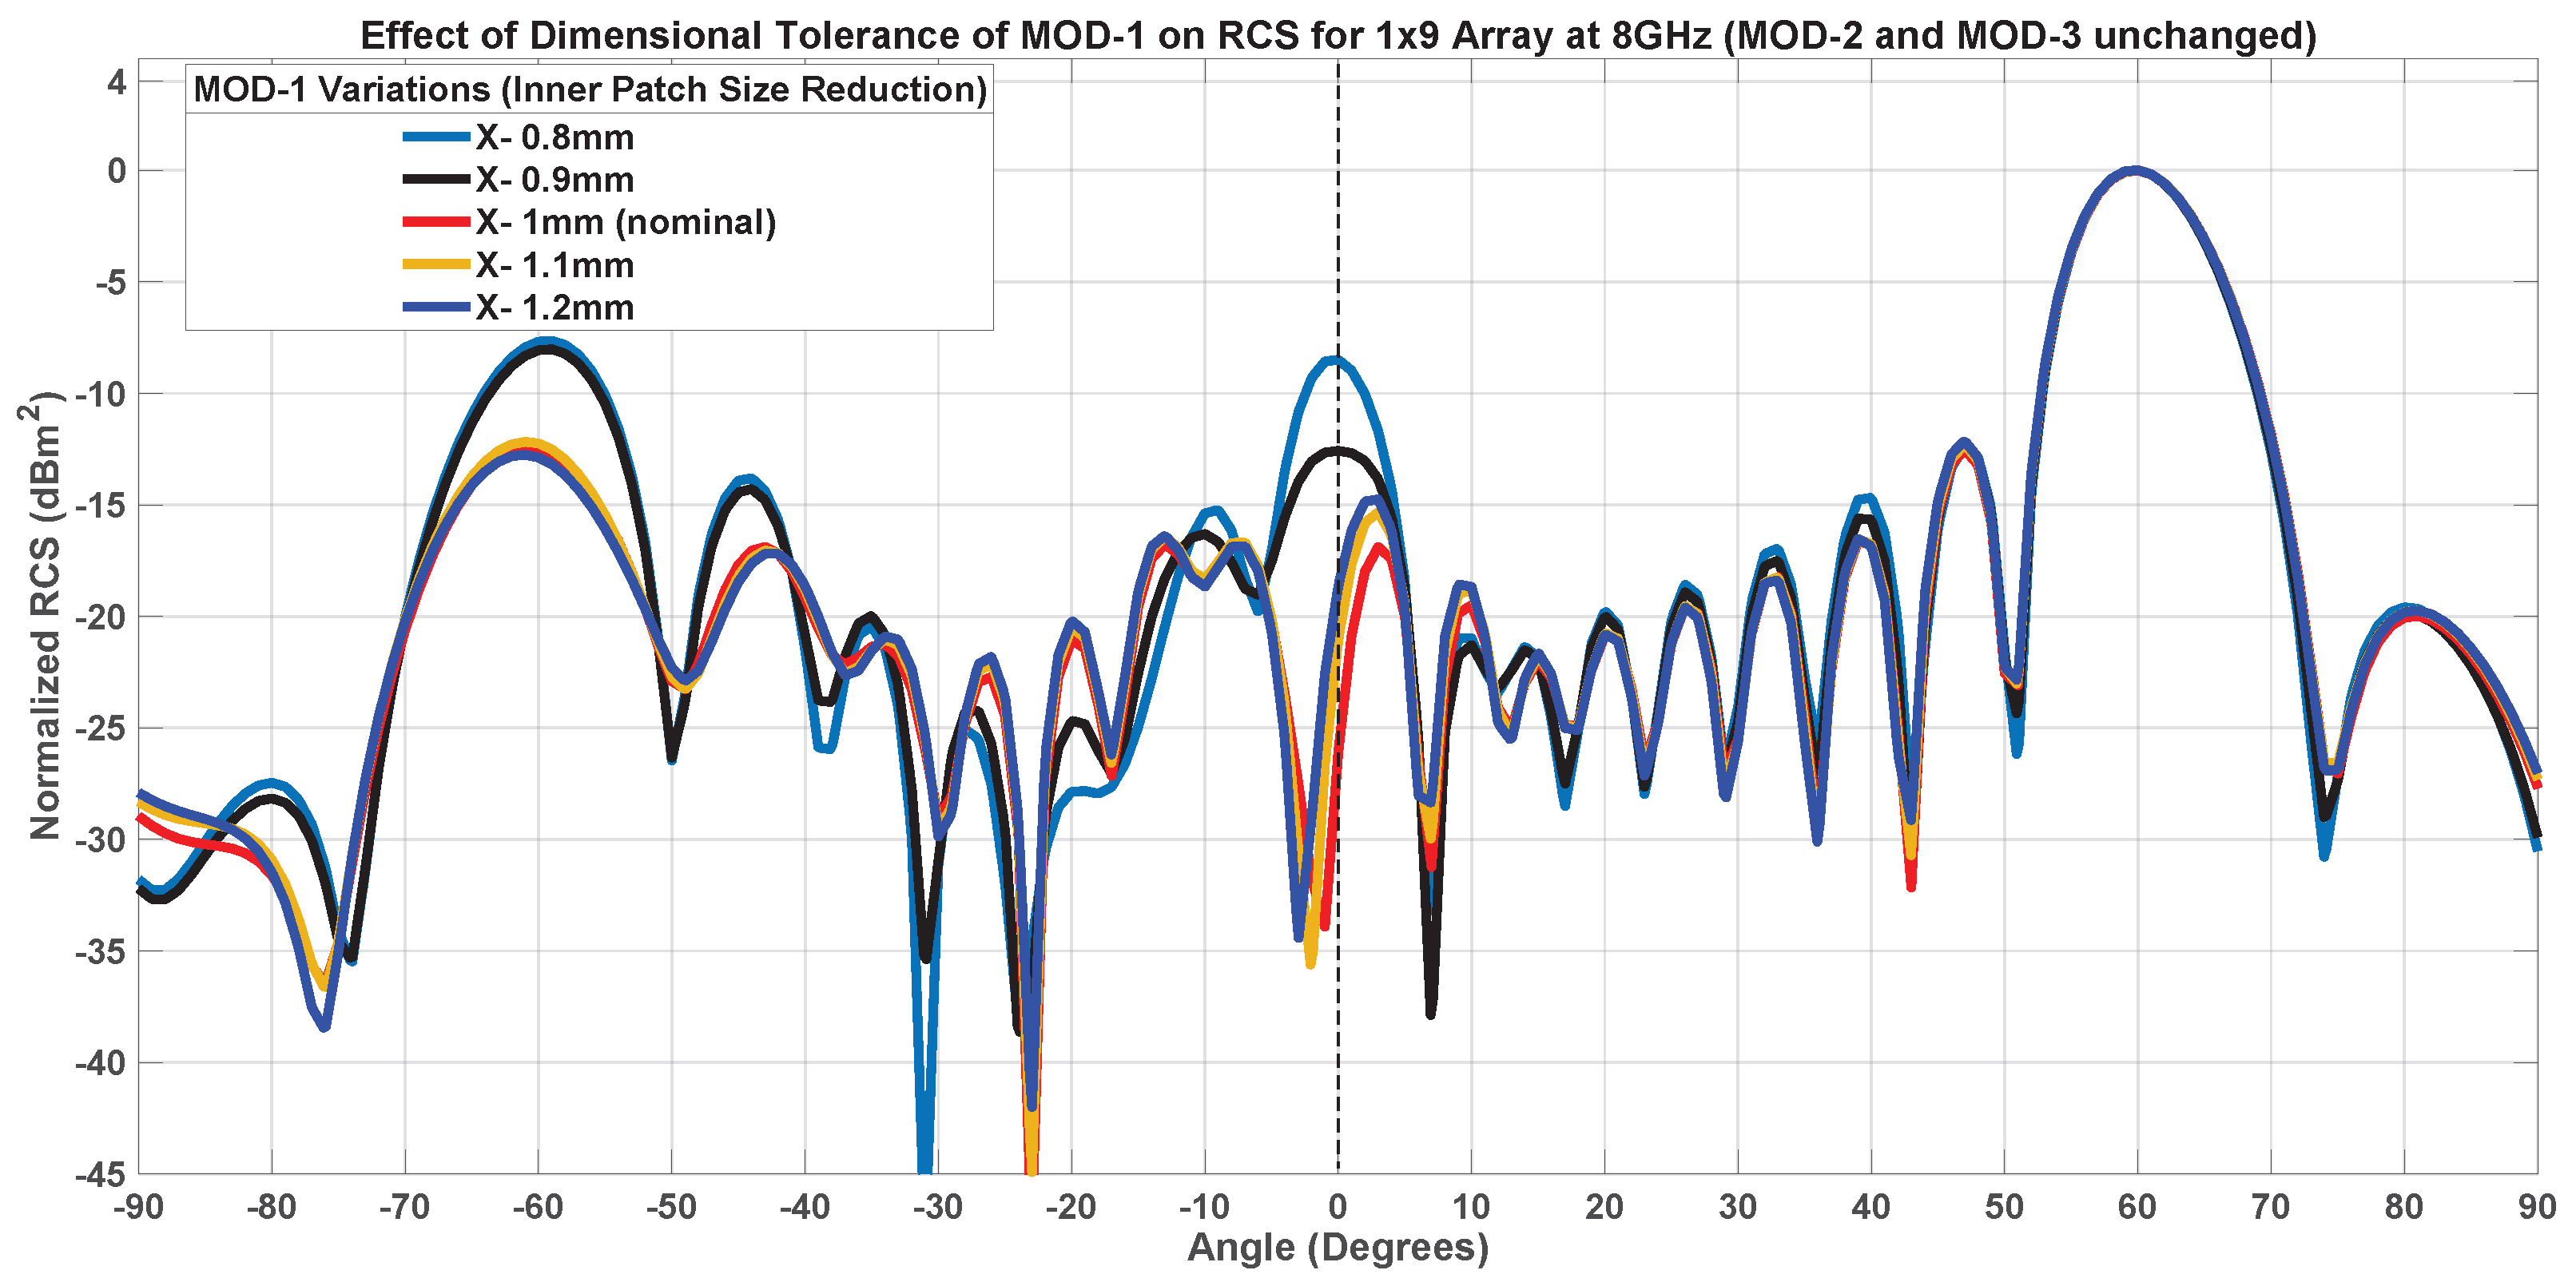
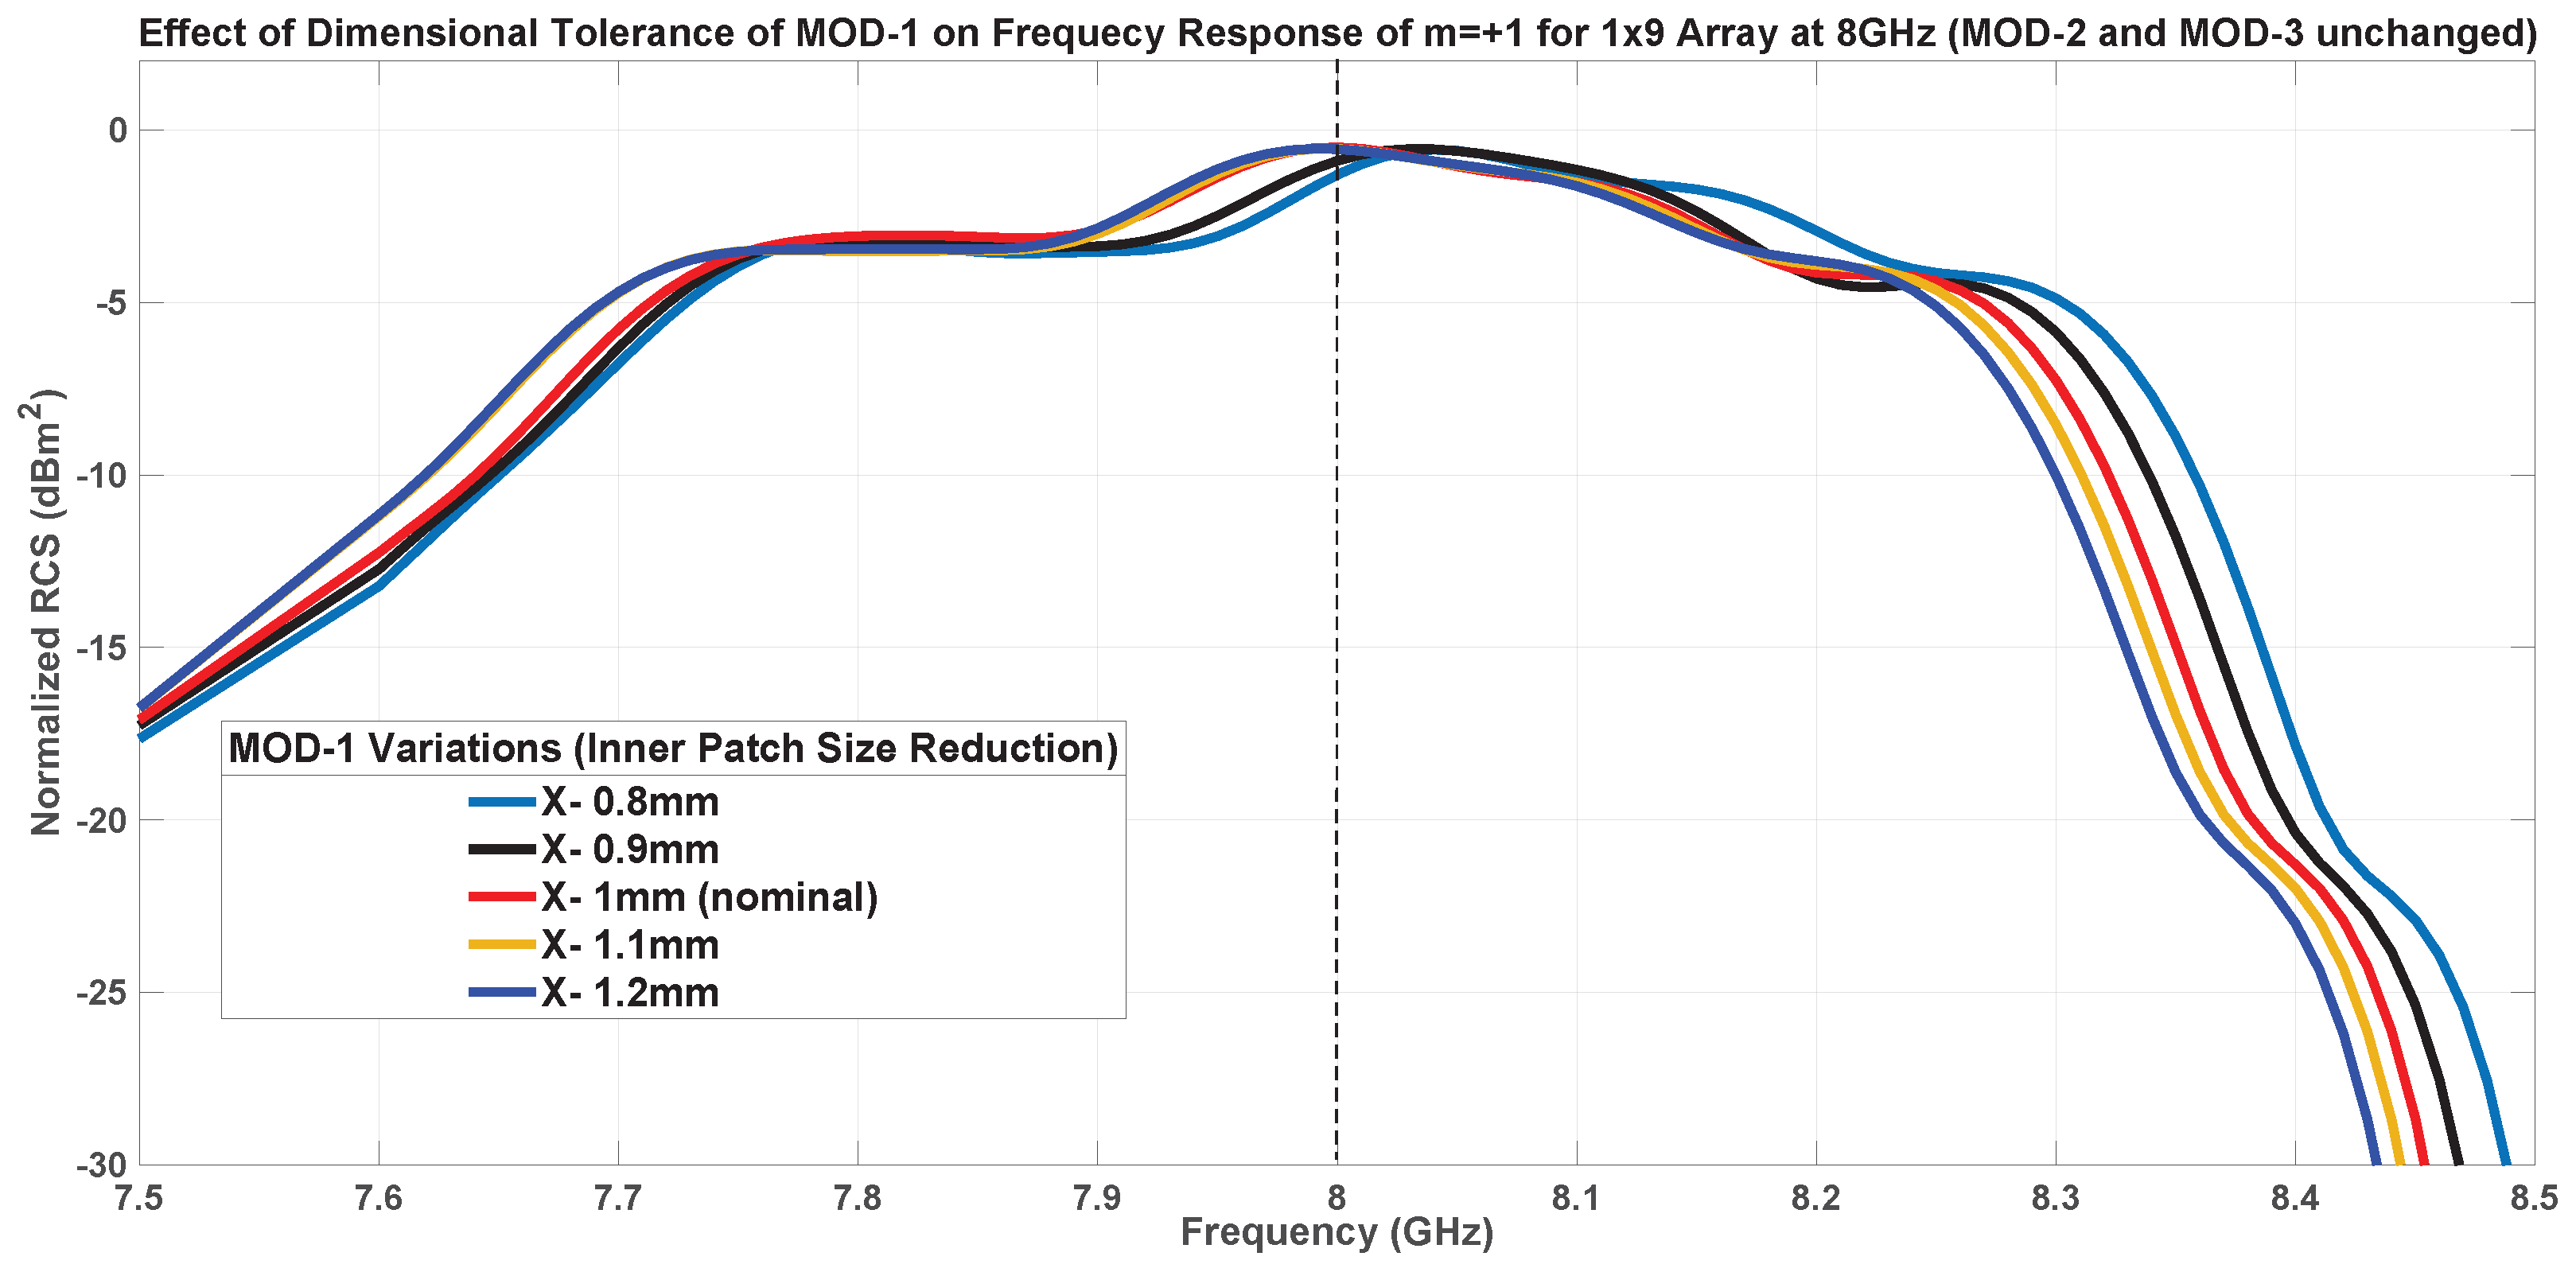
The first parameter considered is the size of the inner patch, which was varied between 0.8 mm and 1.2 mm. Figure 25 plots the RCS obtained from five different values within this interval. In all cases, the parasitic suppression provided is better than that offered by the PG-based SES of the same size. However, while increasing the inner patch size beyond its nominal value does not affect the level of the spurious lobes, when the size decreases below 1 mm, both the m = 1 and the m = 0 lobes increase.
Figure 25. Effect of Inner Patch size Variations on RCS at 8 GHz.
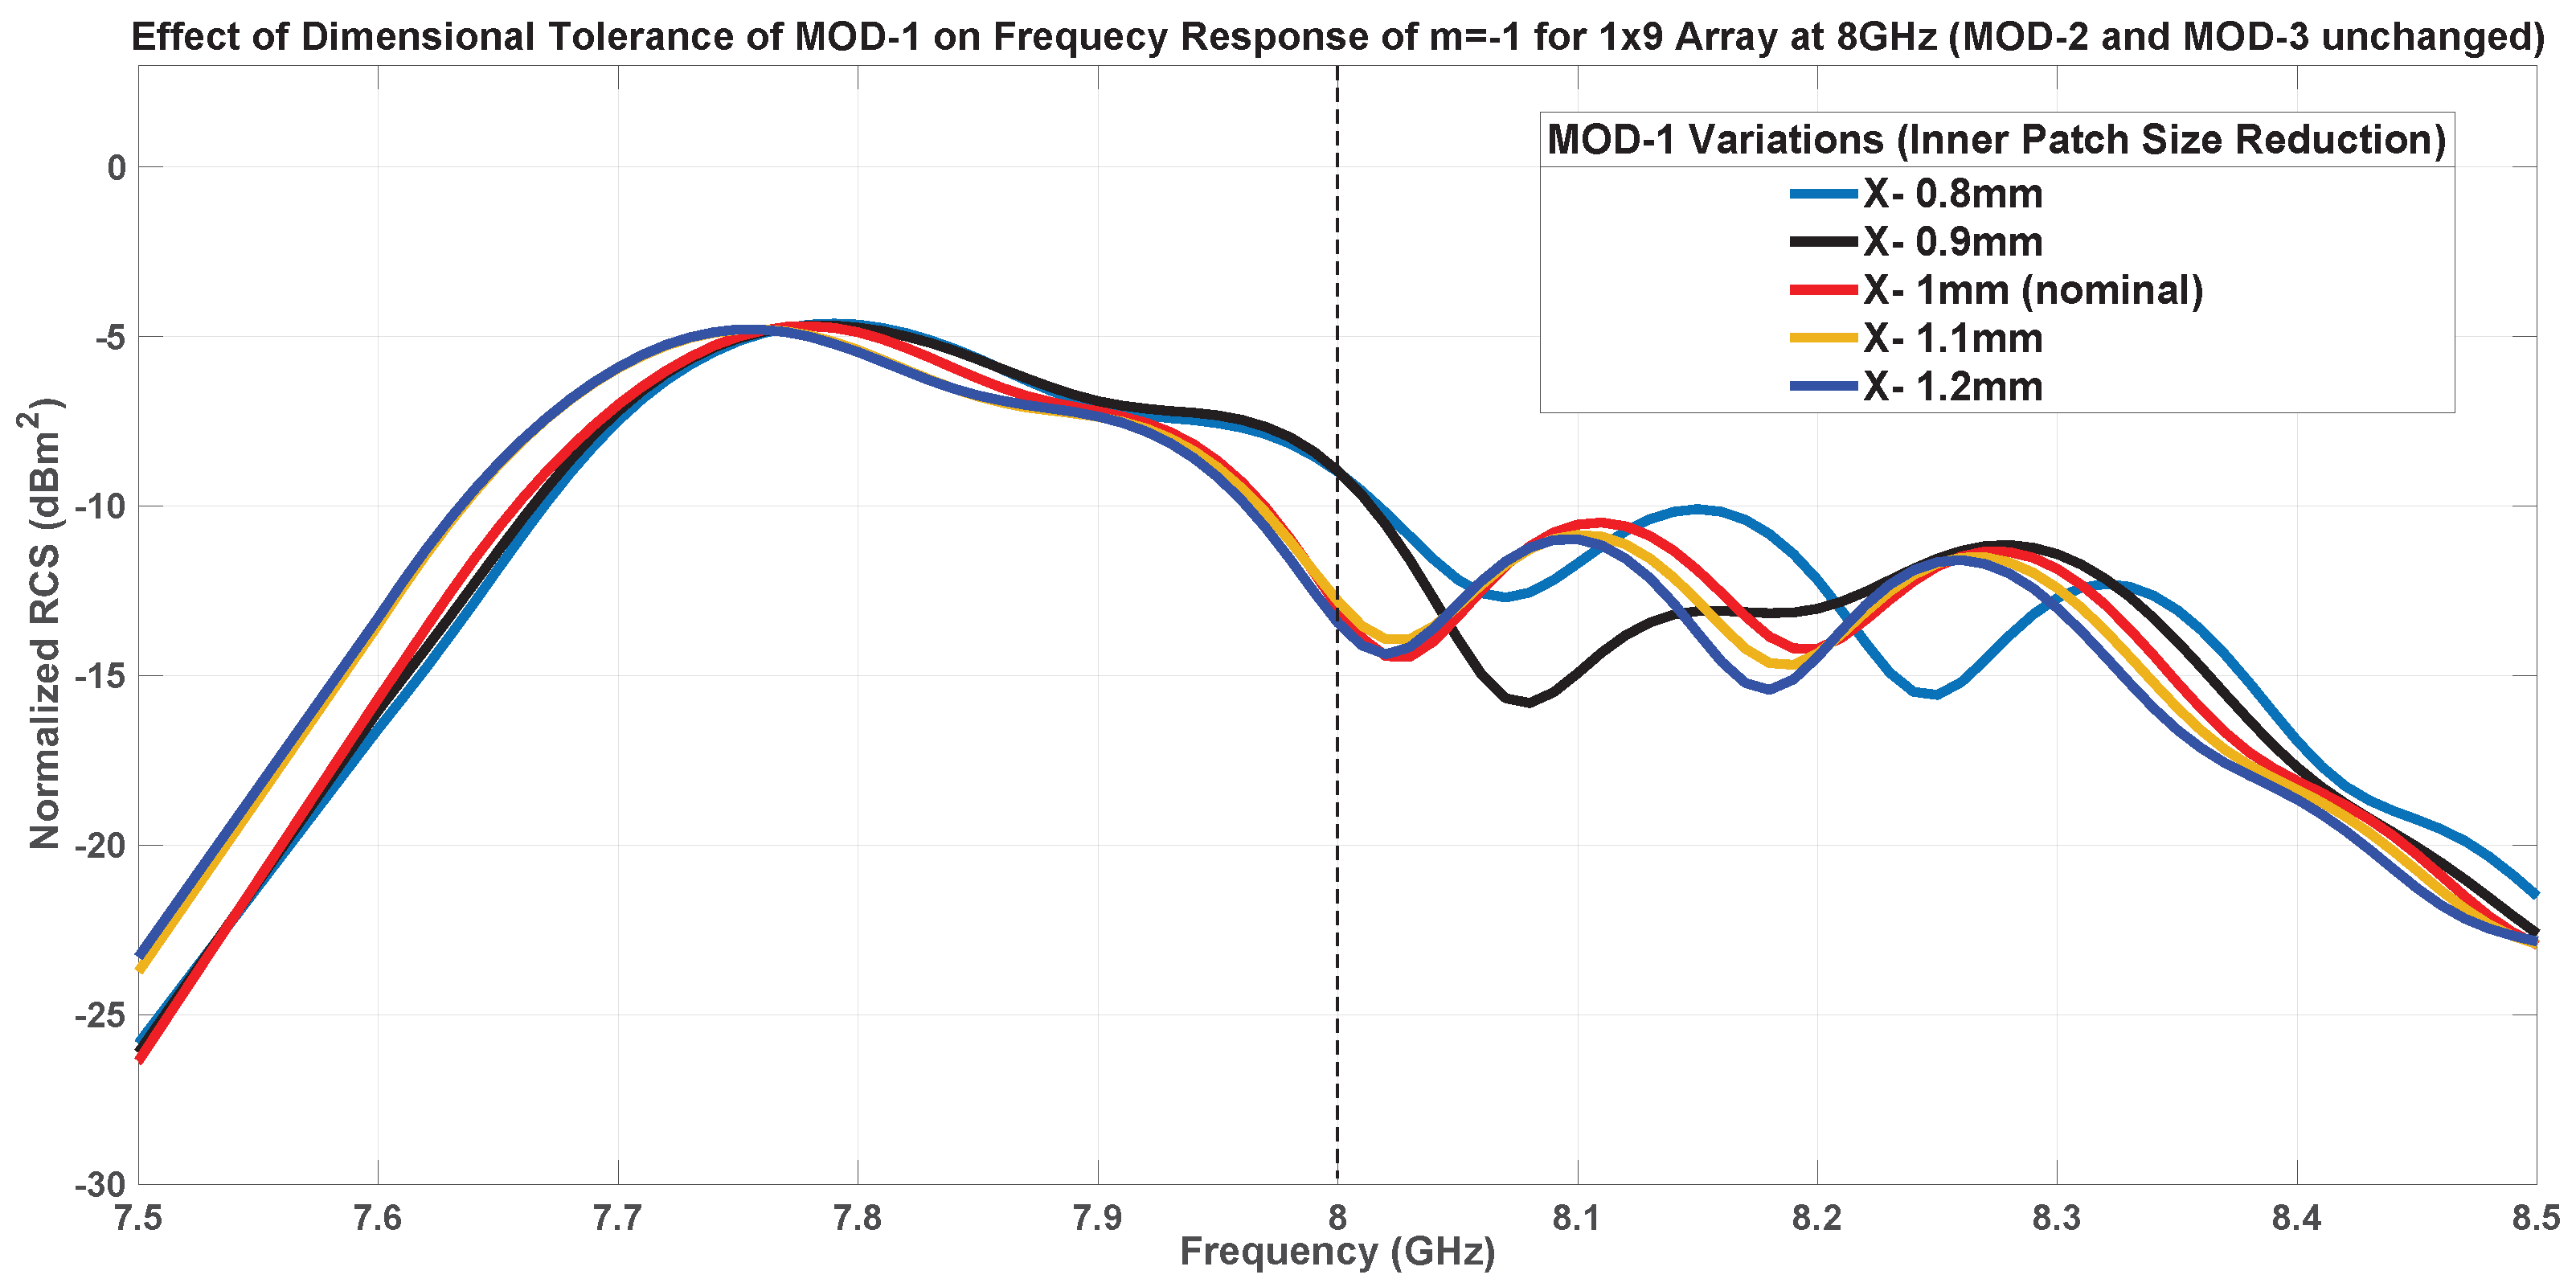
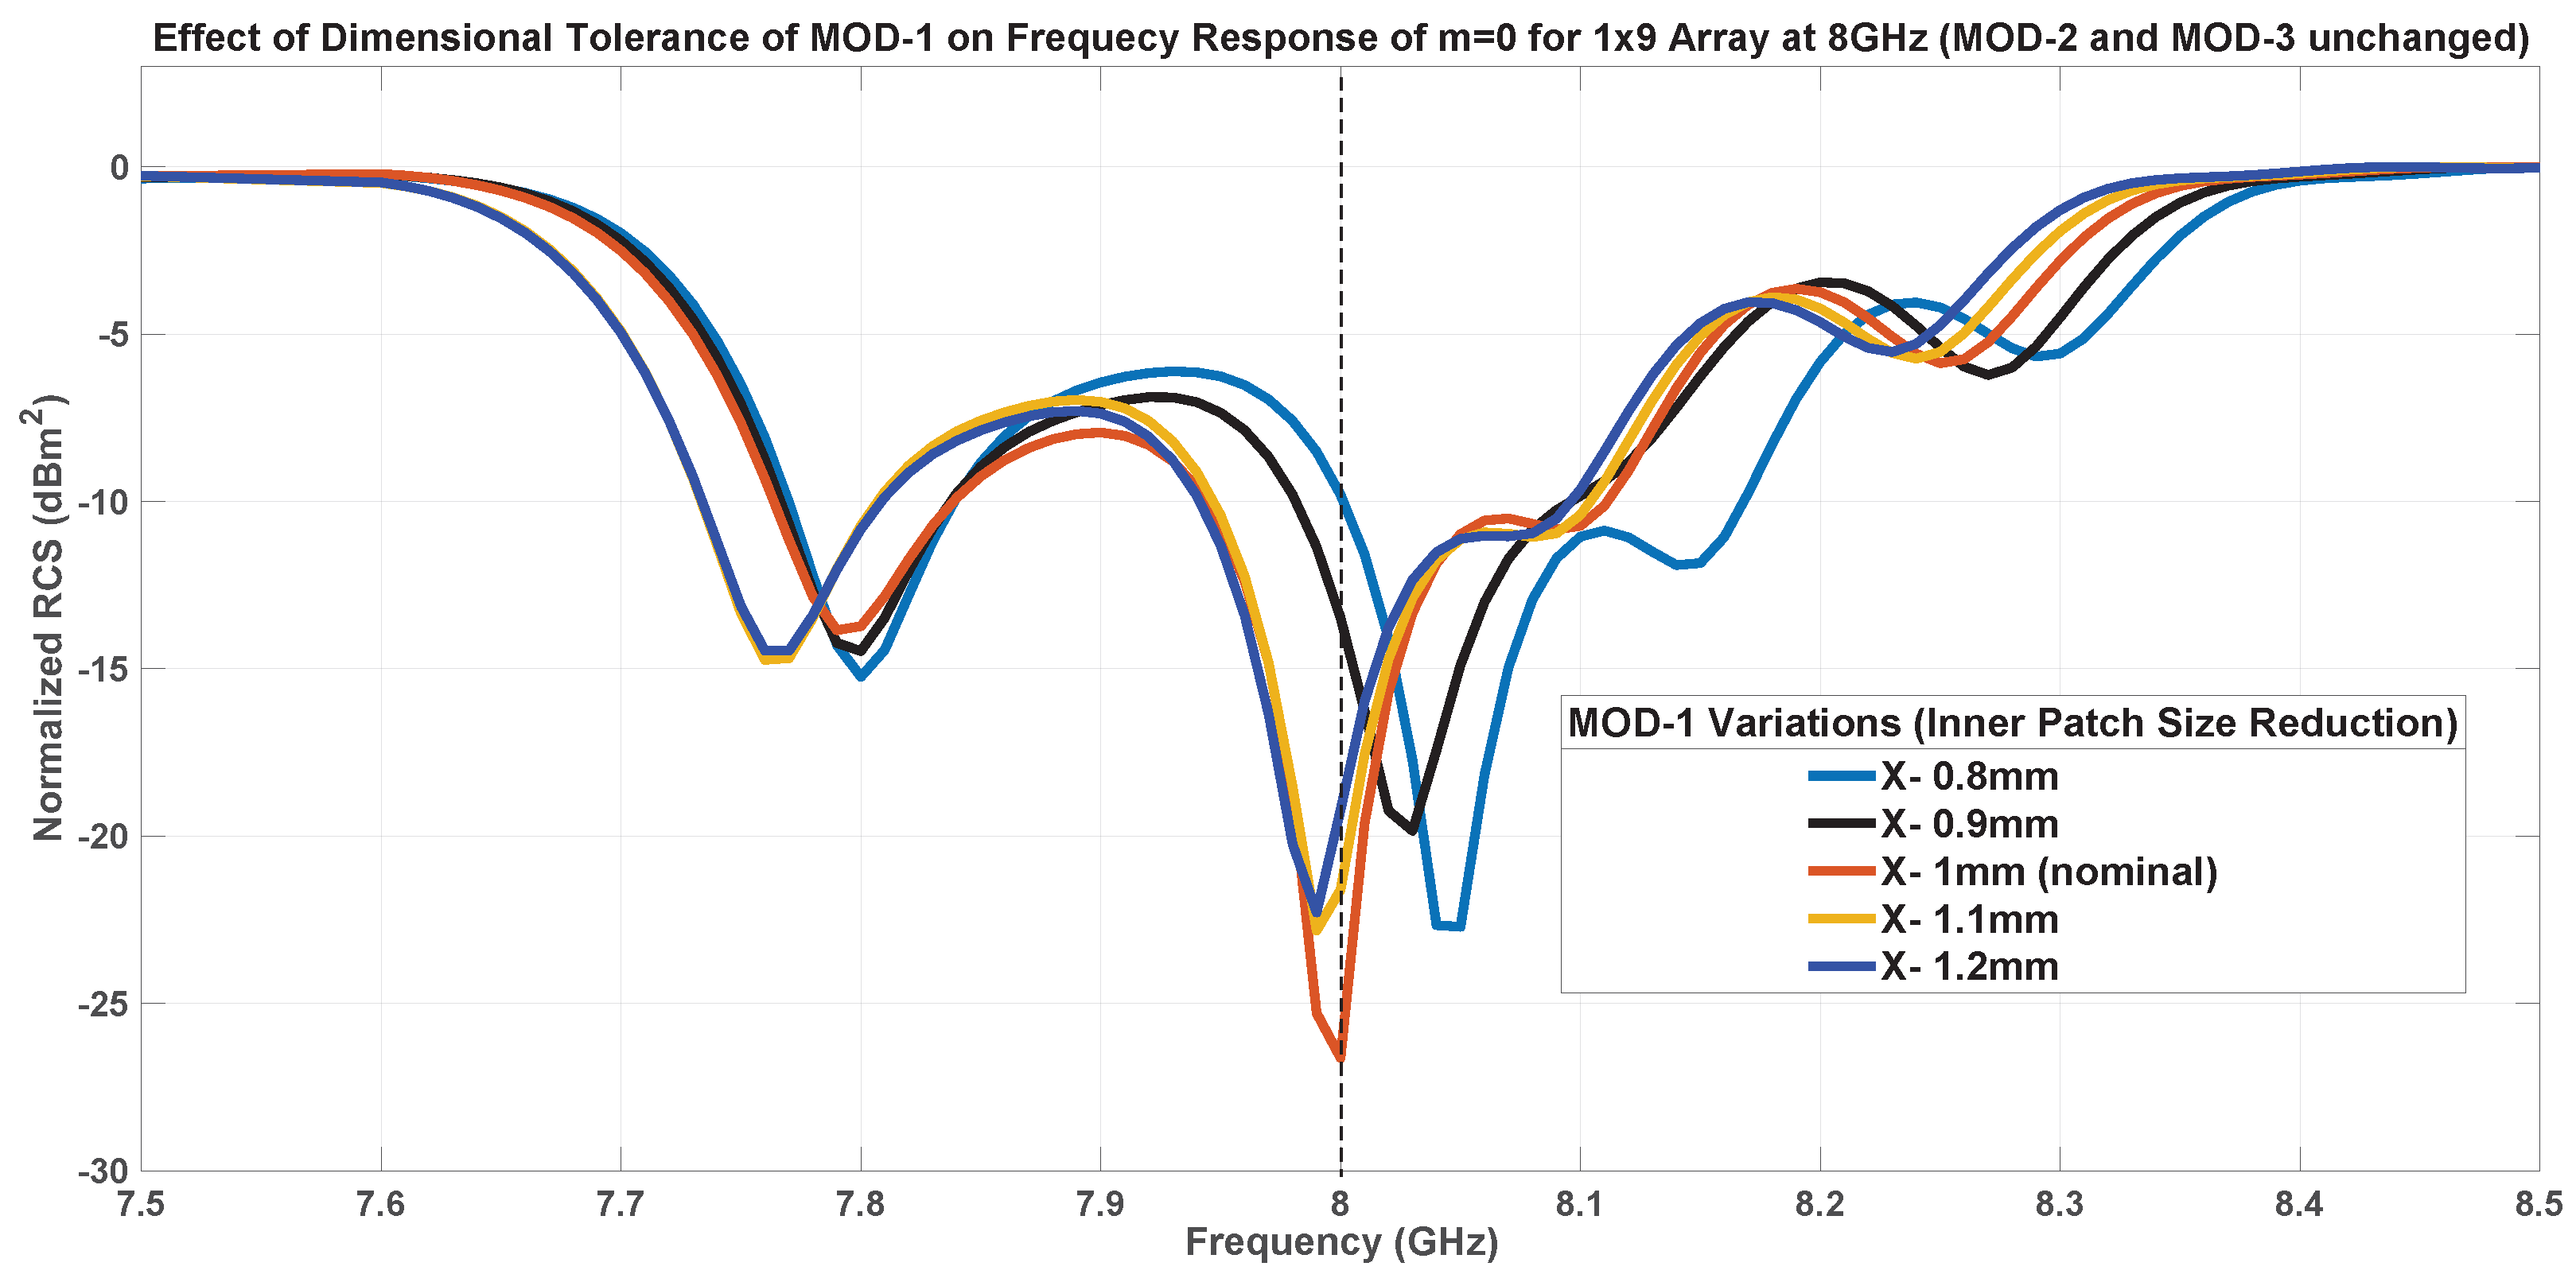
Figure 26, Figure 27 and Figure 28 plot the frequency variation of the three Floquet modes for the same inner patch size values considered above. The curves in Figure 28 shows that the beam pointing to the desired direction is slightly affected by changes in the inner patch size. Regarding the two parasitic lobes, the curves for the different inner patch sizes exhibit similar behavior, but at the design frequency, they confirm the differences observed in Figure 25.
Figure 26. Effect of Inner Patch size Variations on Frequency Response of Floquet Mode m = 1 .
Figure 27. Effect of Inner Patch size Variations on Frequency Response of Floquet Mode m = 0 .
Figure 28. Effect of Inner Patch size Variations on Frequency Response of Floquet Mode m = + 1 .

7.1.2. Inner Patch Tilting-MOD-2

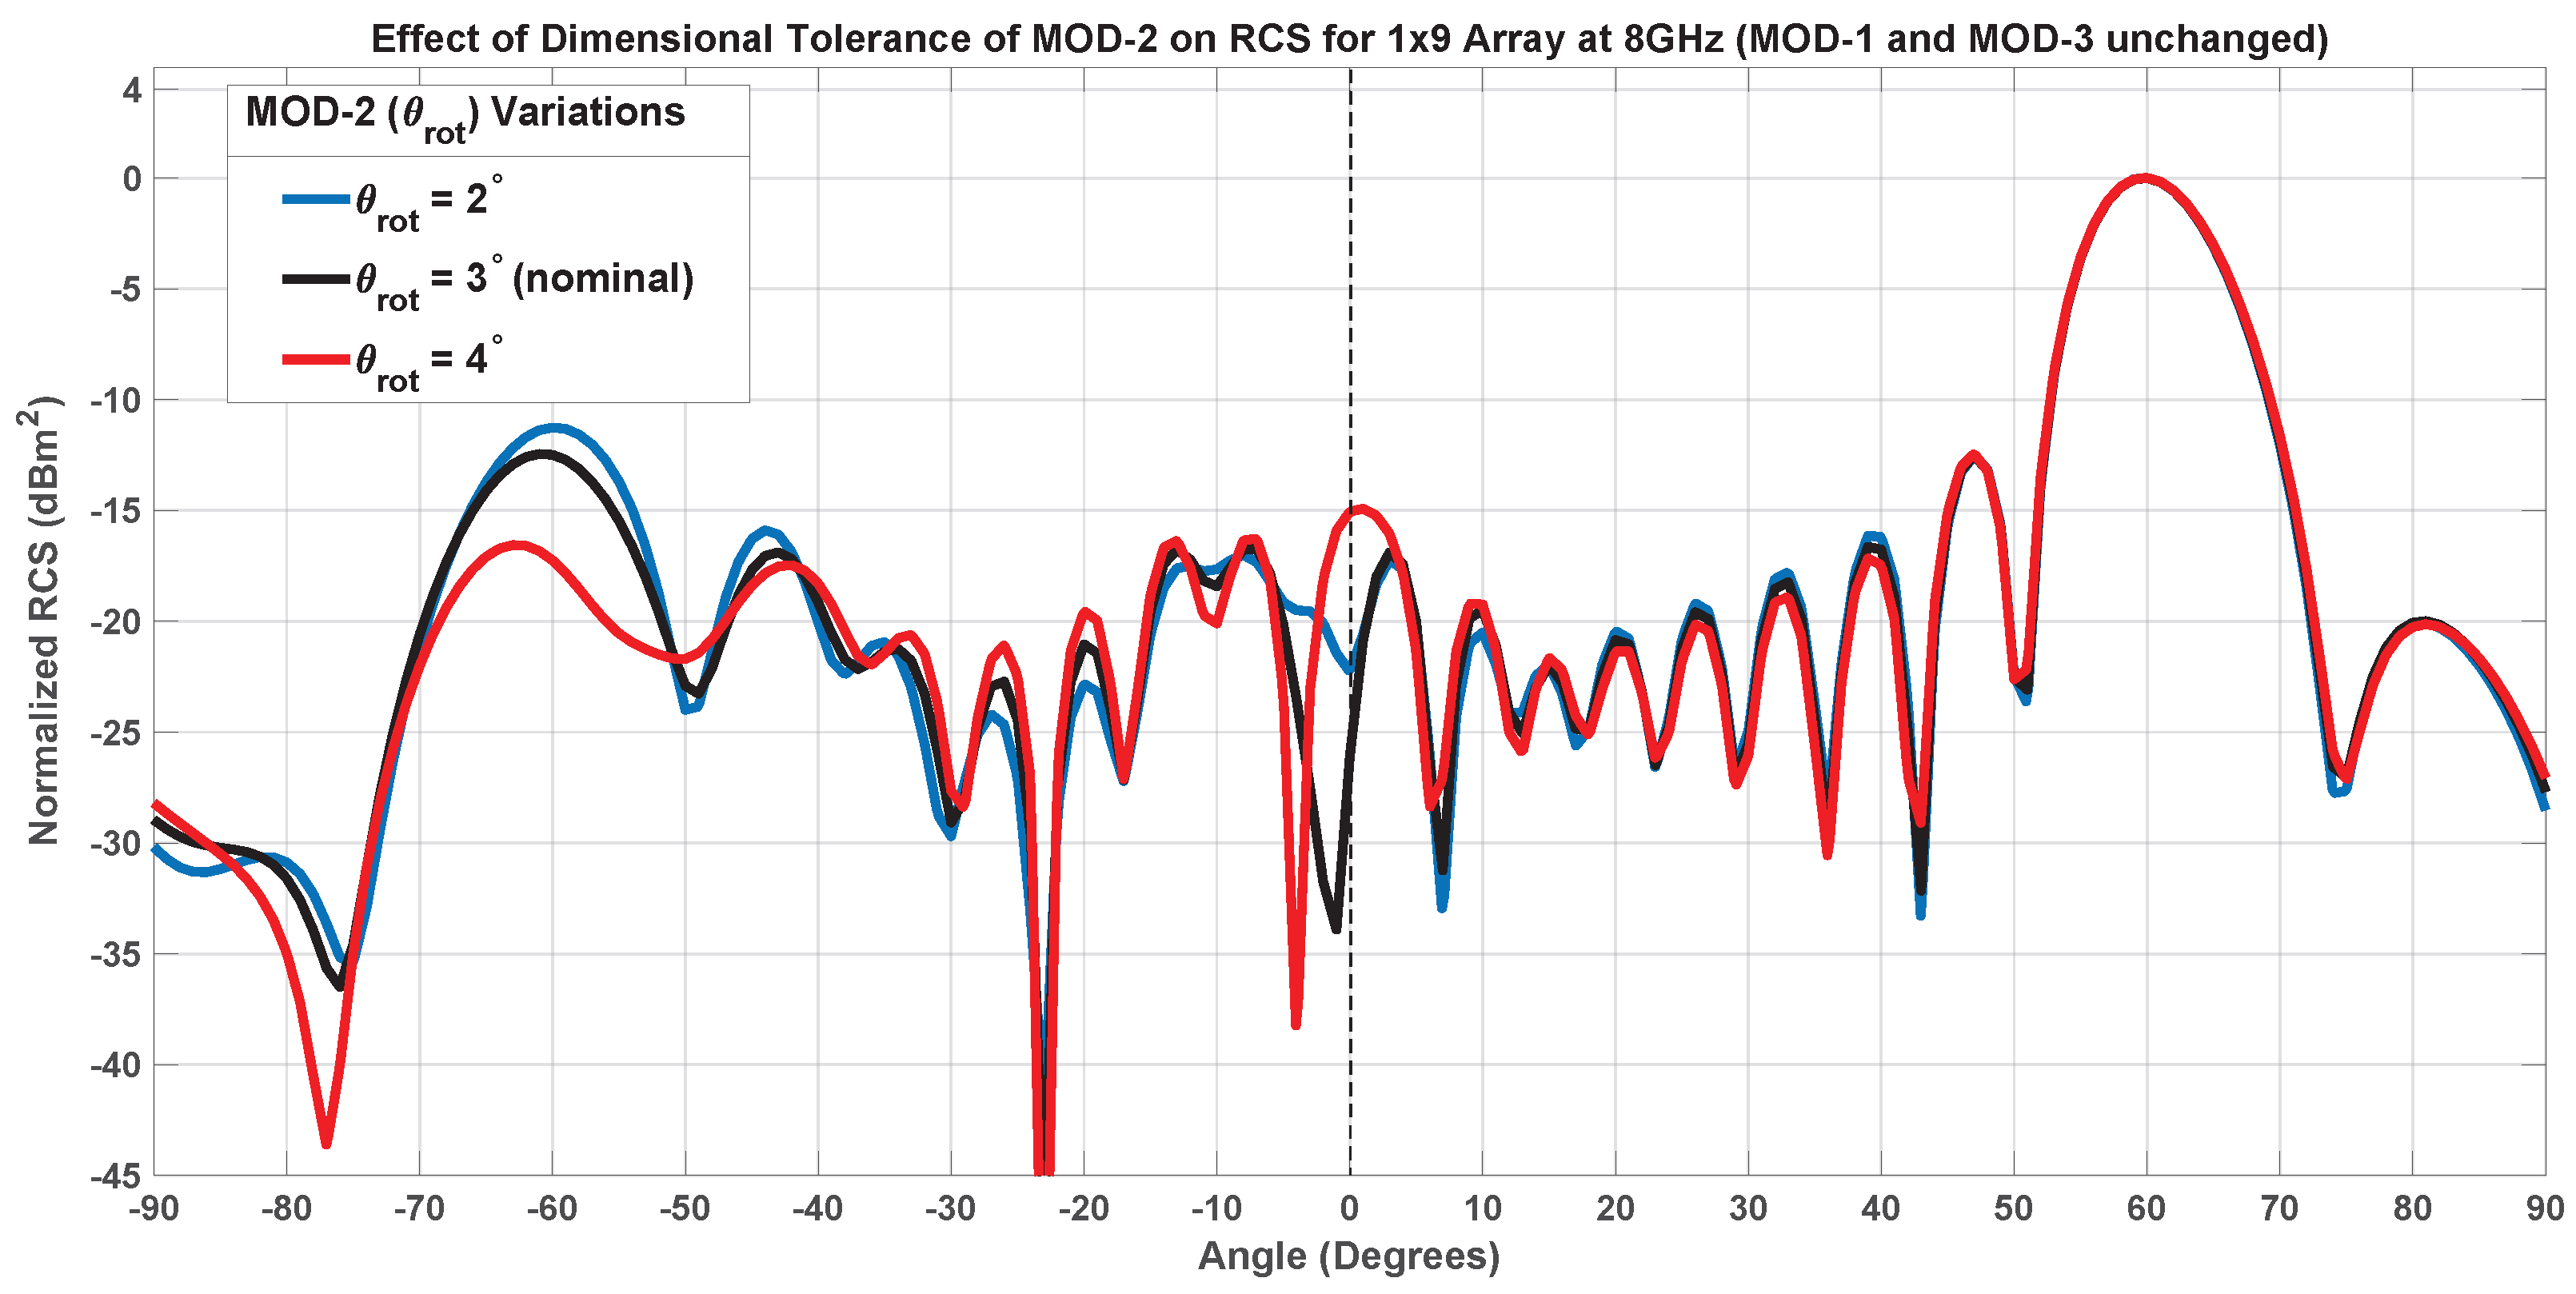
While the inner patch is nominally rotated by 3 , here tilt angles of 2 and 4 are considered. The curves in Figure 29, which refer to the RCS evaluated for different tilt angles, show that when the tilt angle is smaller than in the nominal case, the RCS stays almost the same. When the tilt angle is 4 the m = 1 lobe decreases, while the m = 0 lobe increases slightly.
Figure 29. Effect of Inner Patch Tilt Variations on RCS at 8 GHz.
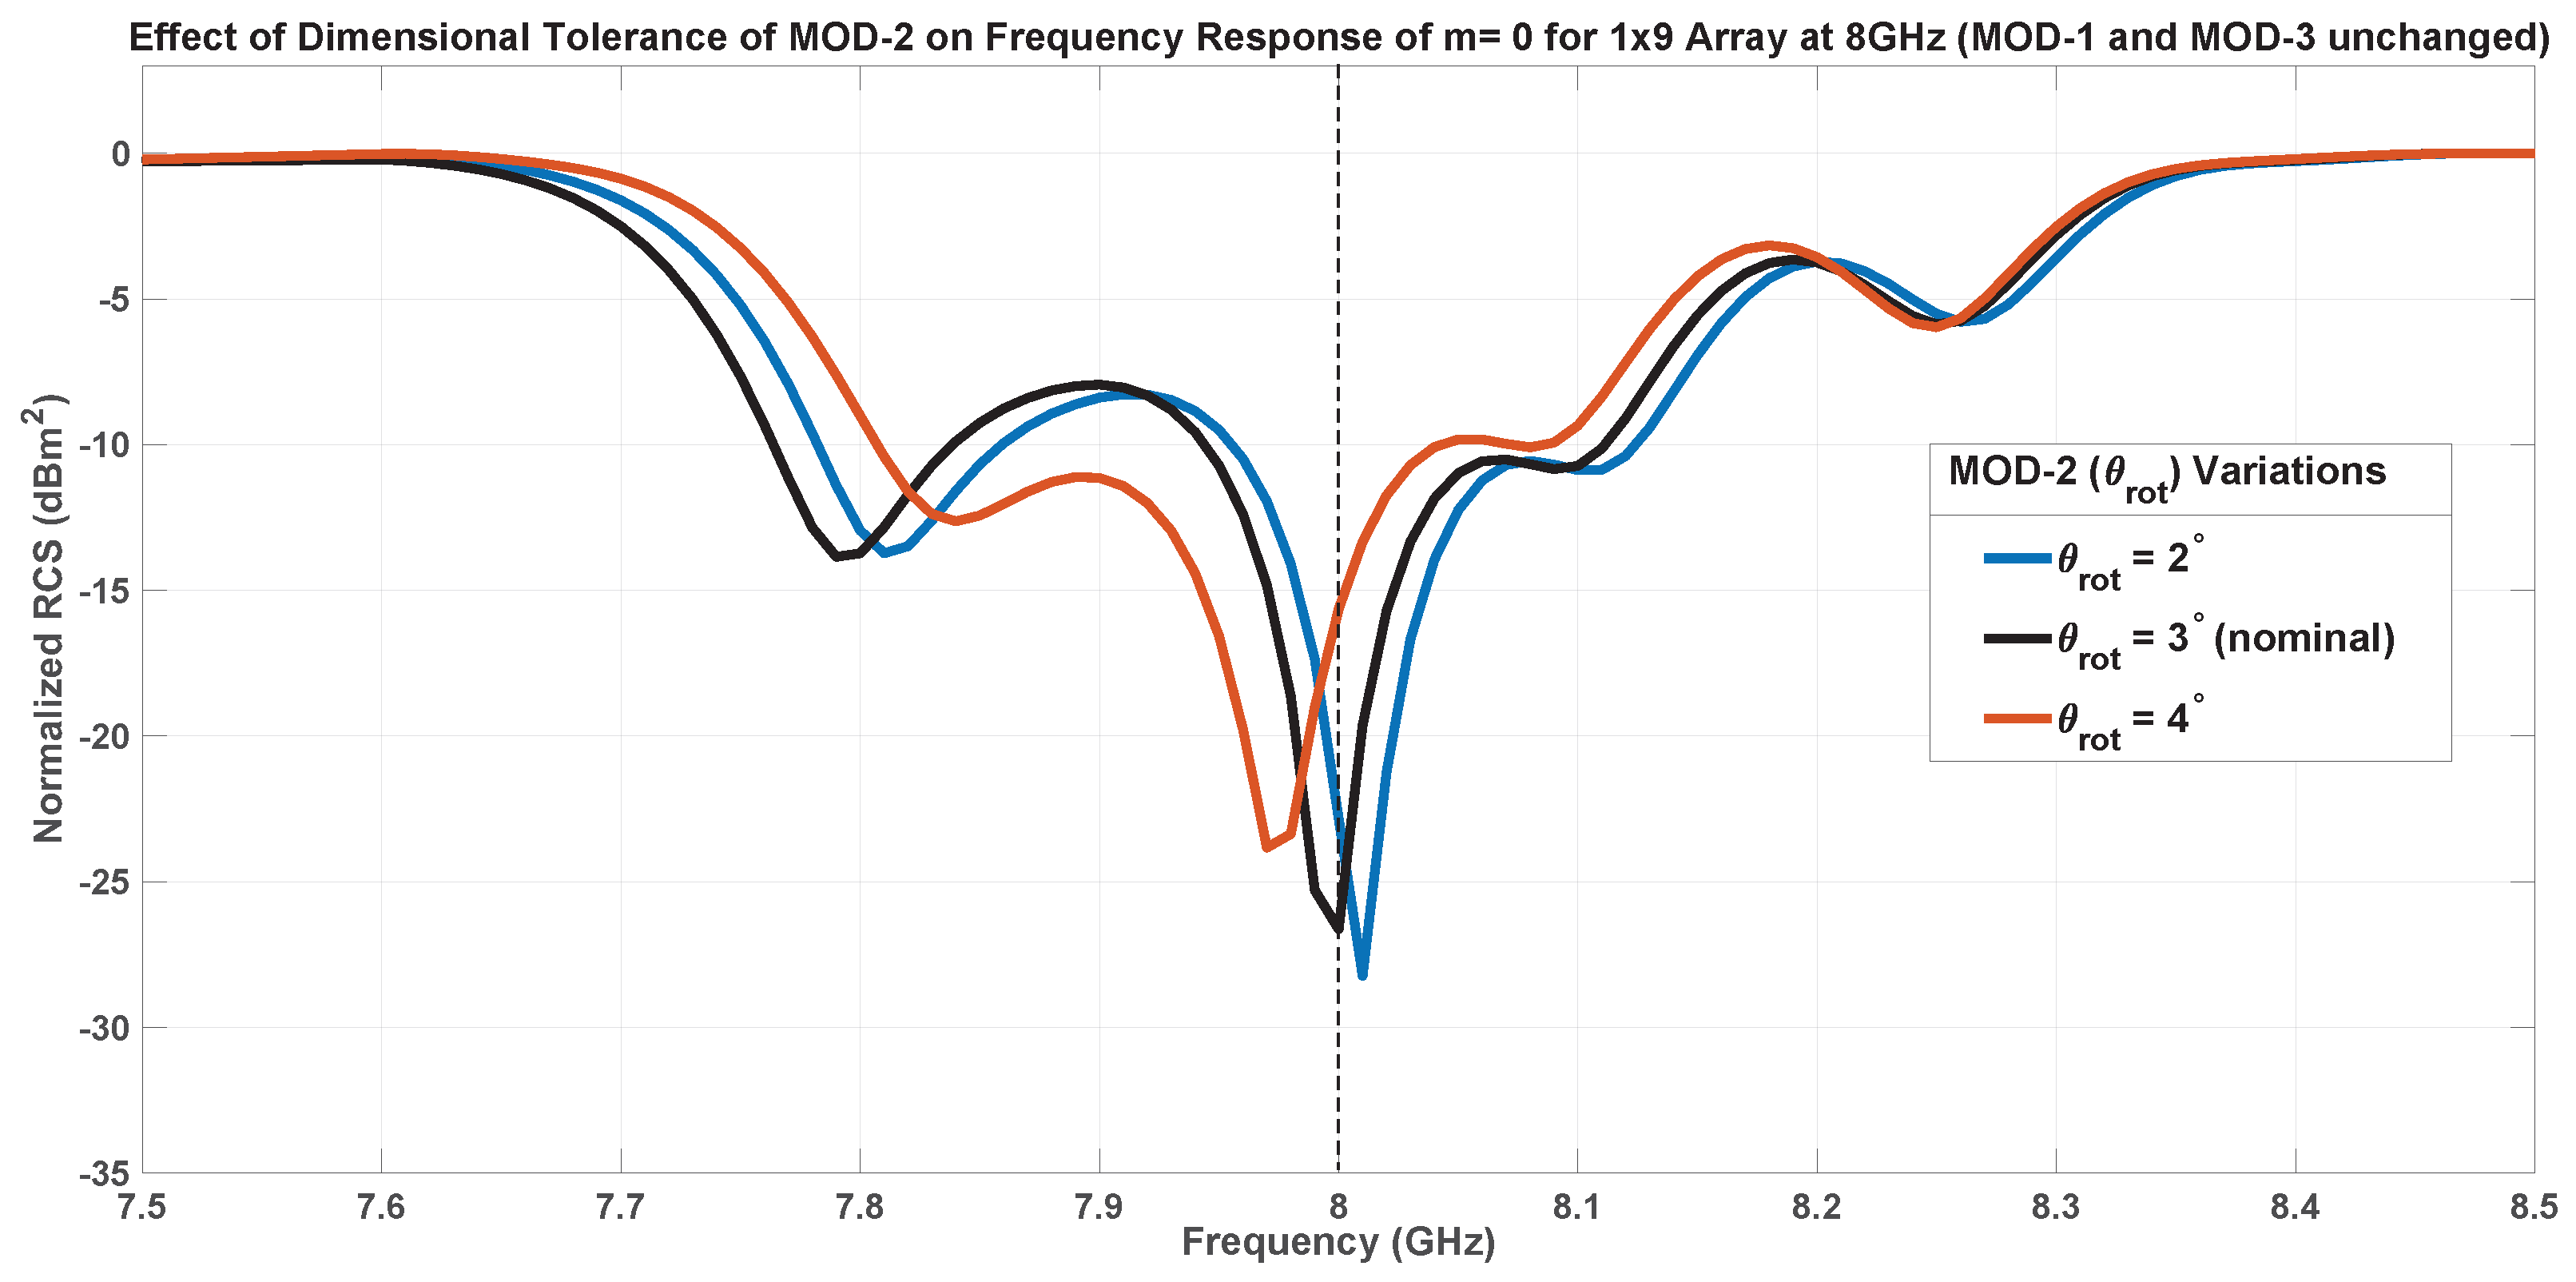
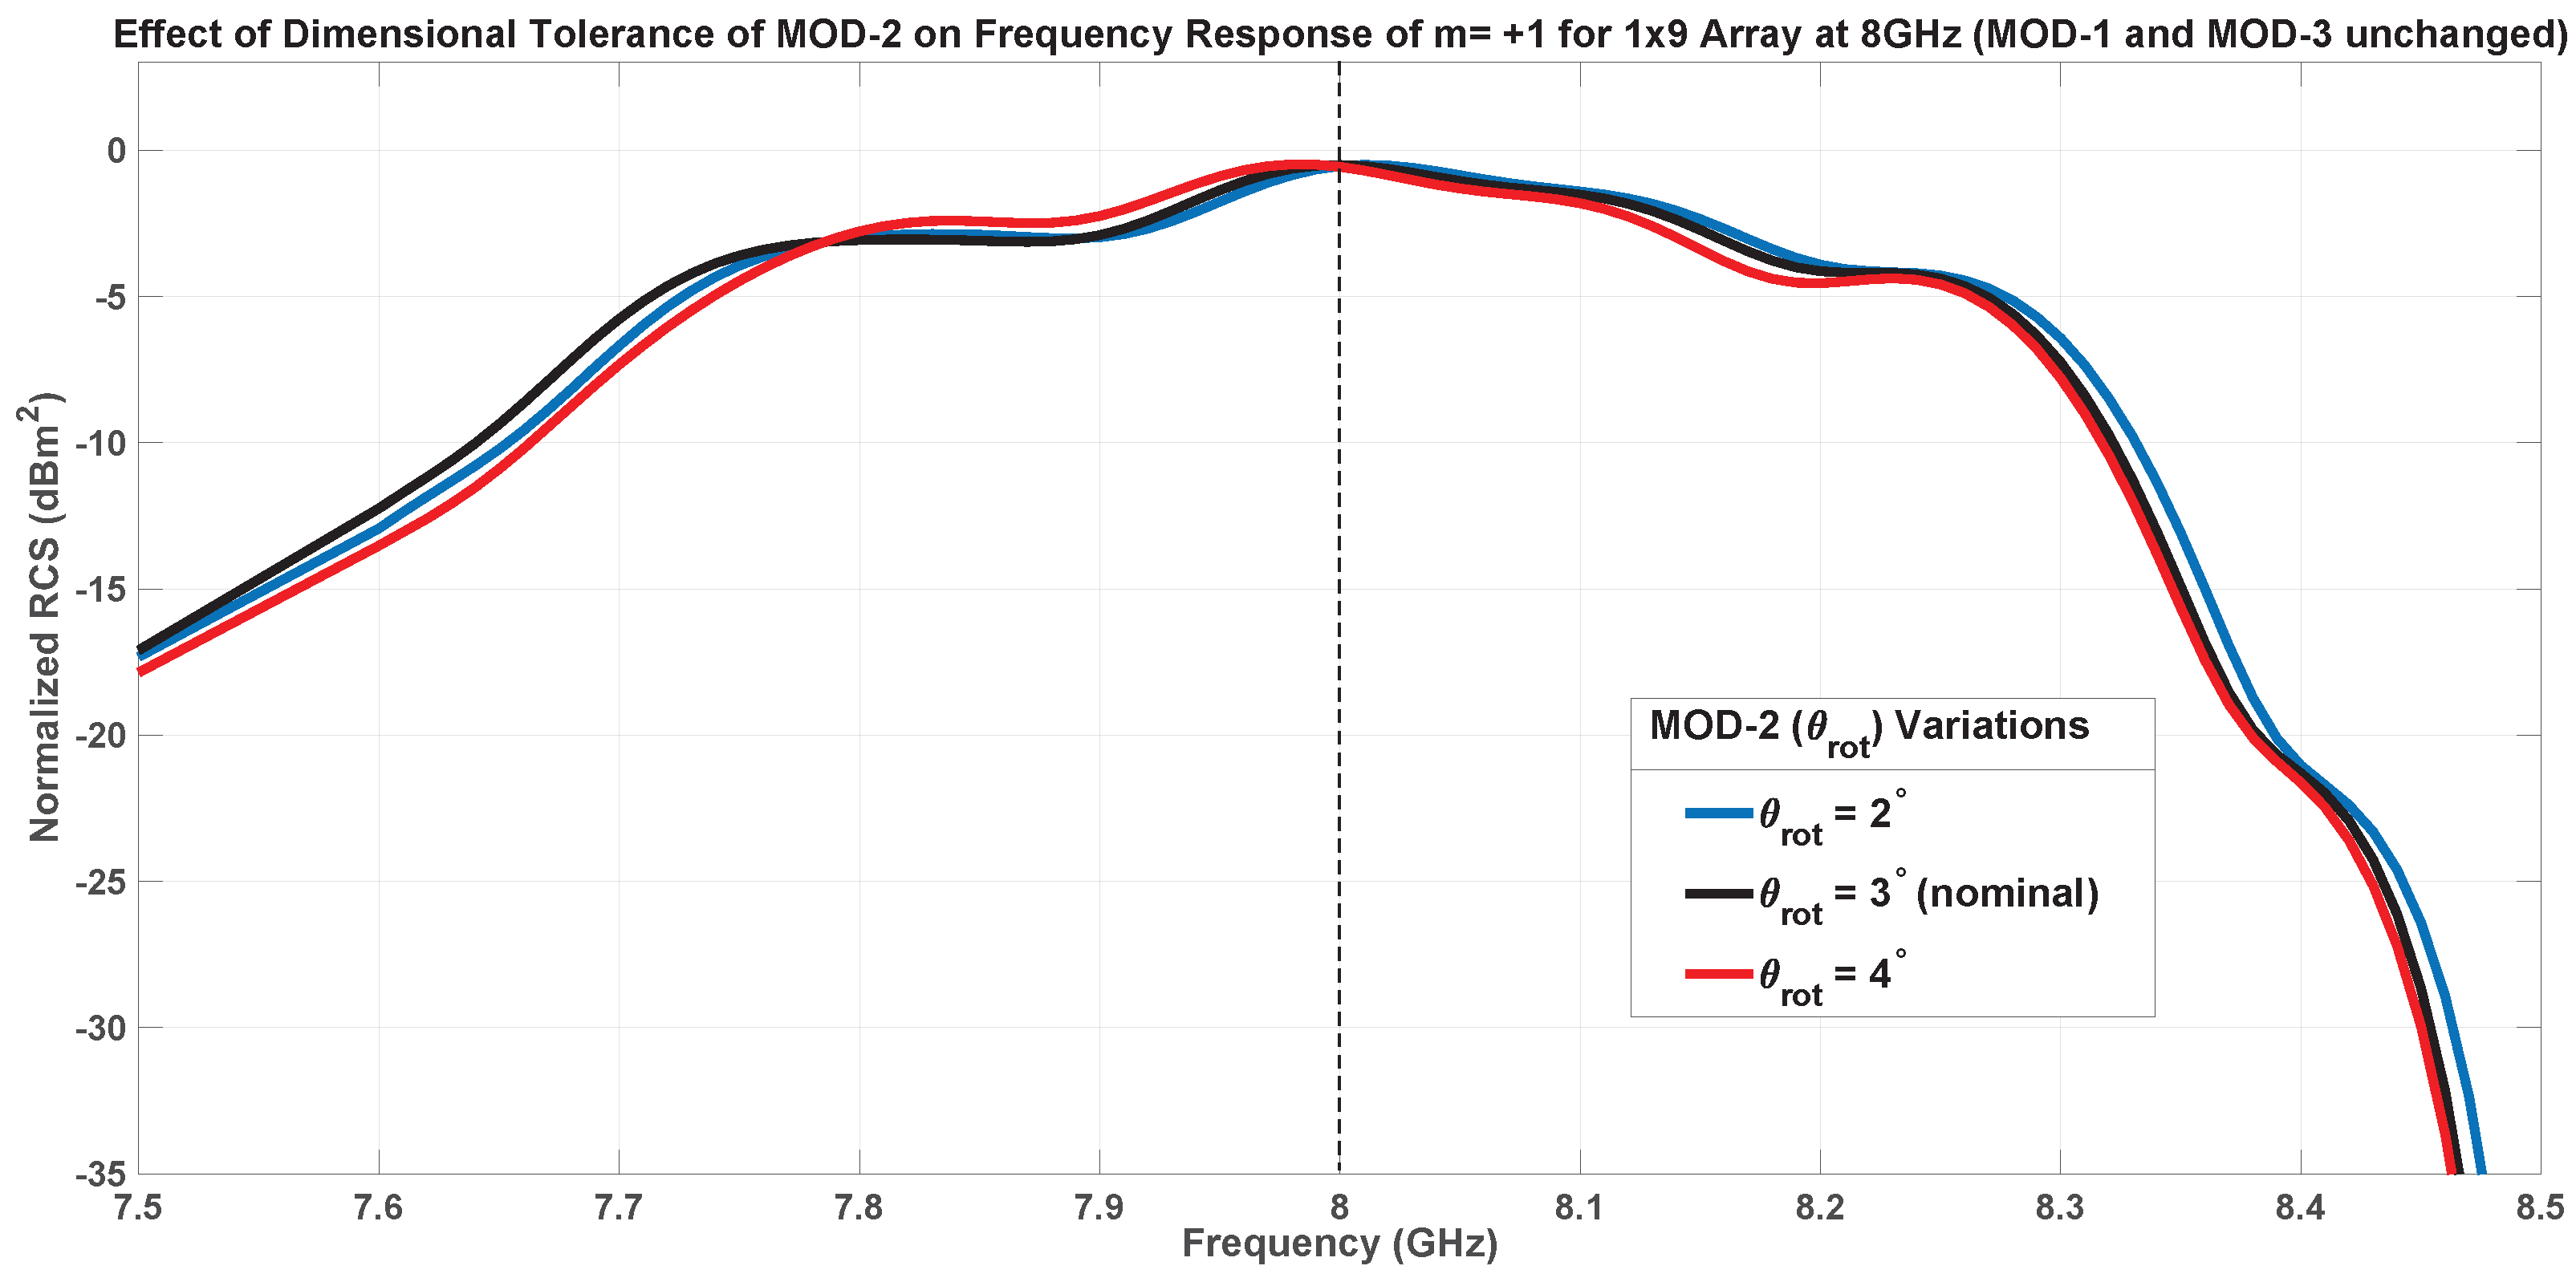
The results in Figure 30, Figure 31 and Figure 32, which plot the frequency behavior of the principal lobes, reflect the considerations already made for RCS. An angle of 4 results in a frequency shift for the minimum of the specular and parasitic lobes, improving the former and deteriorating the latter to a lesser extent at the design frequency.
Figure 30. Effect of Inner Patch Tilt Angle Variations on Frequency Response of Floquet Mode m = 1 .
Figure 31. Effect of Inner Patch Tilt Angle Variations on Frequency Response of Floquet Mode m = 0 .
Figure 32. Effect of Inner Patch Tilt Angle Variations on Frequency Response of Floquet Mode m = + 1 .

7.1.3. Inner Patch Hole Size-MOD-3

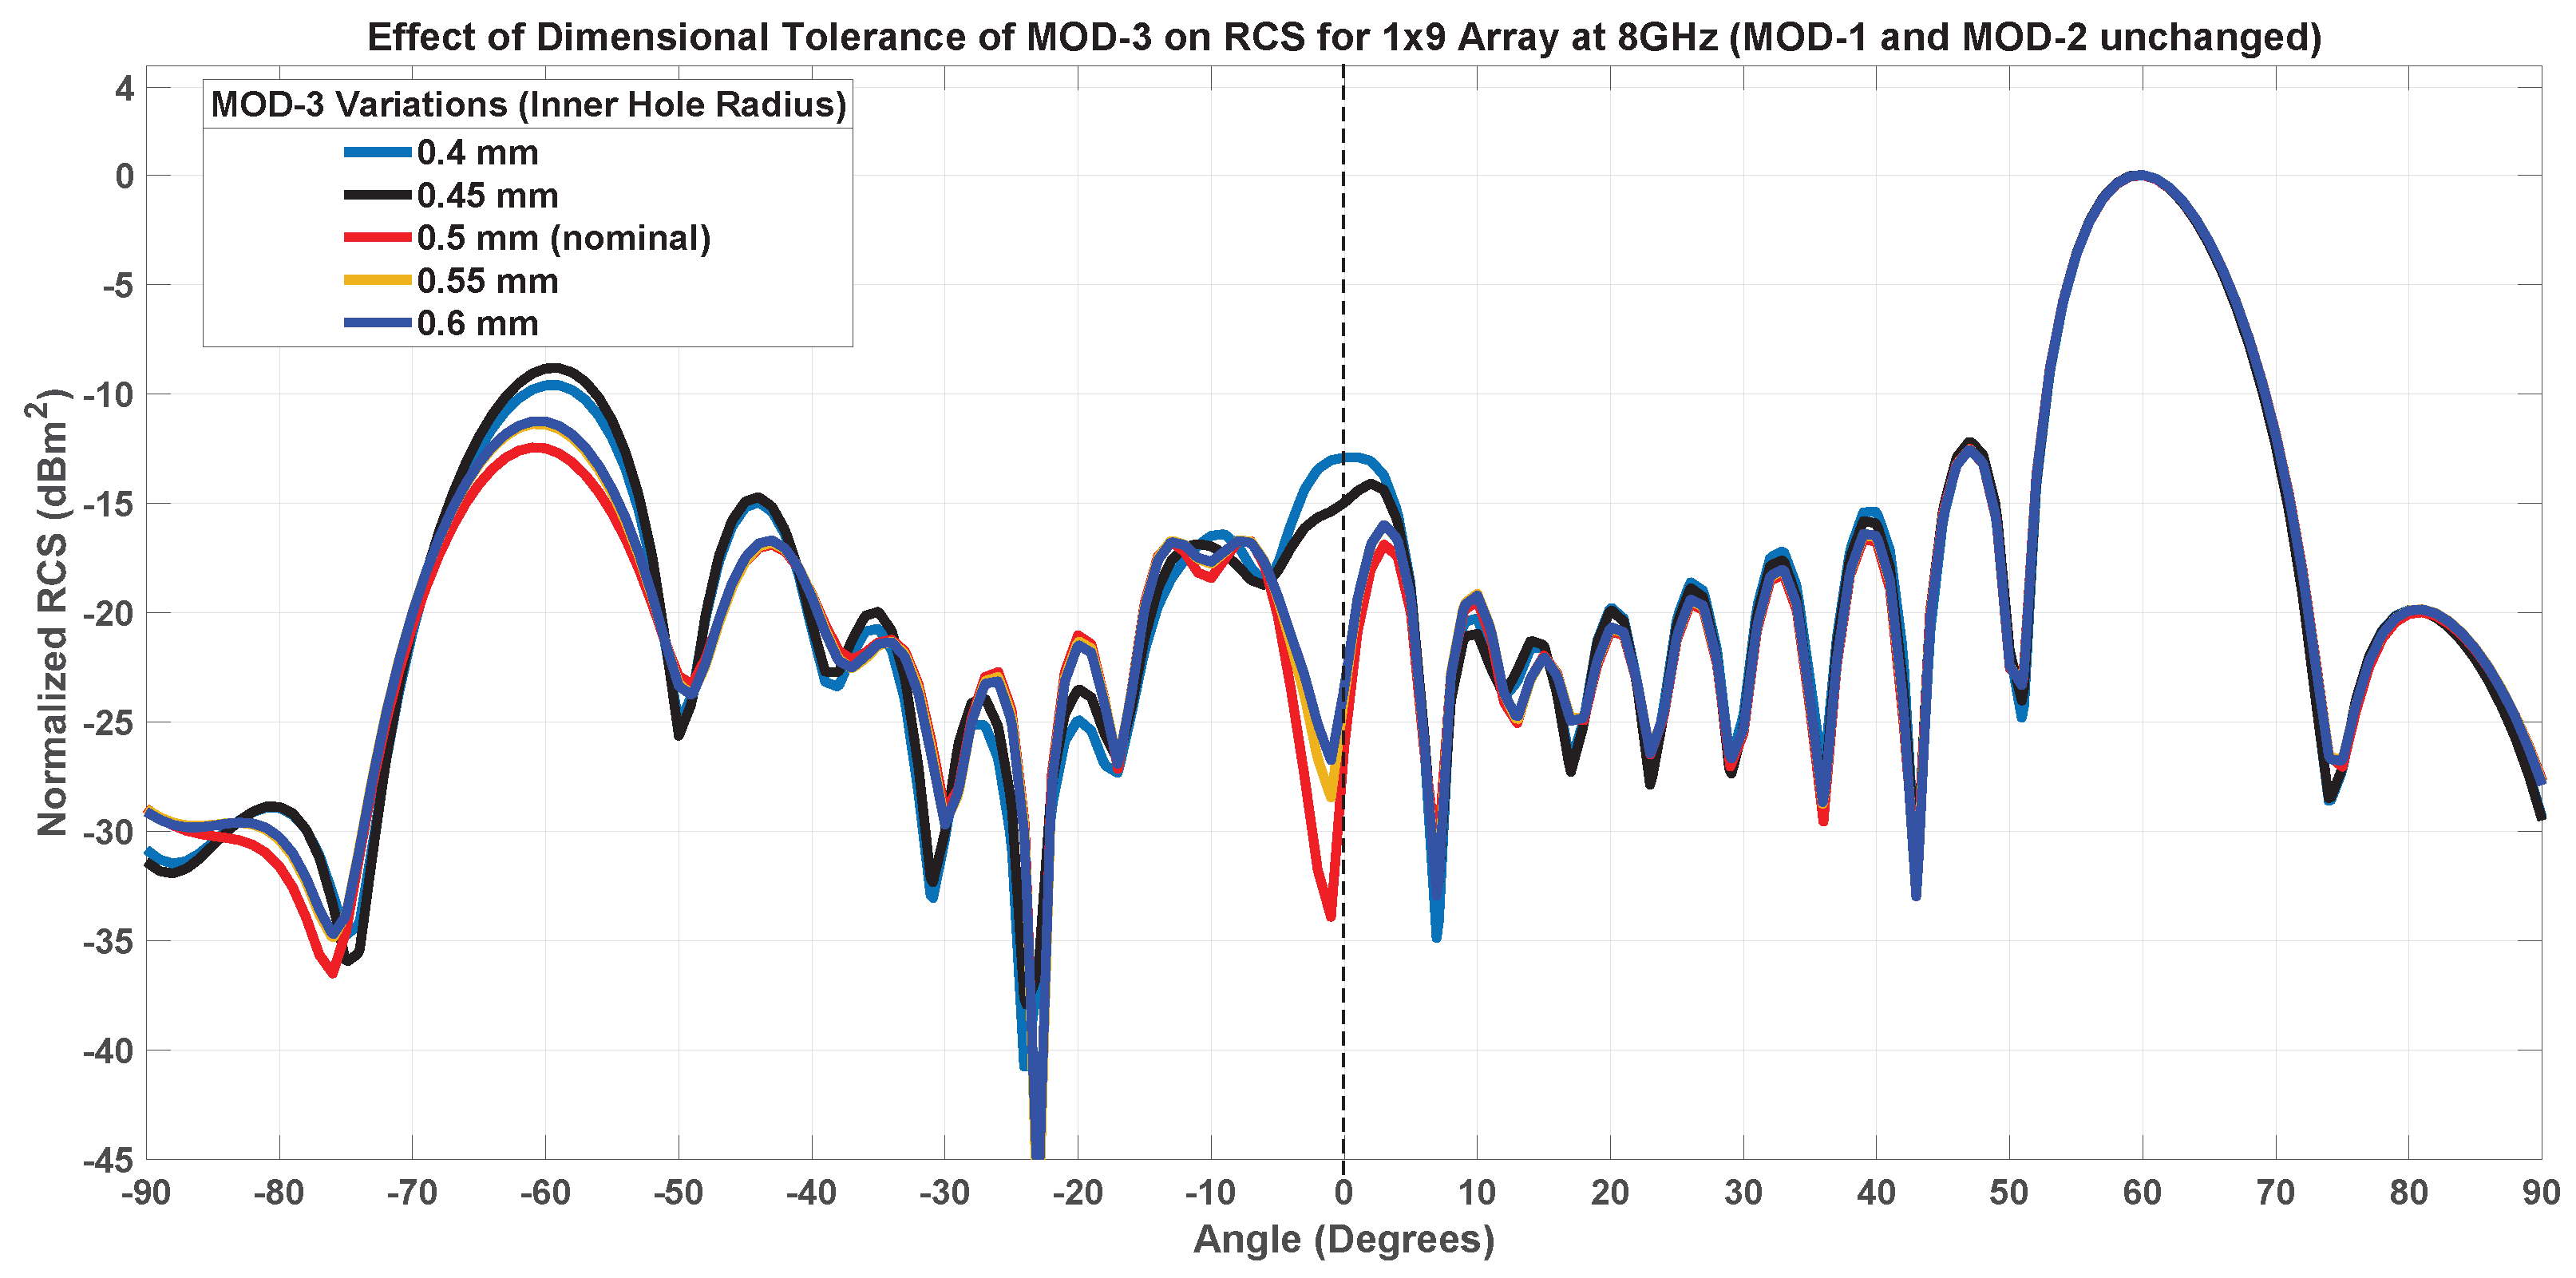
The third geometric parameter considered is the size of the inner patch hole. It was varied between 0.4 mm and 0.6 mm. Figure 33 shows the effect of this variation on the RCS. Holes larger than the nominal one do not affect the RCS. However, when the size decreases, the two parasitic lobes increase, though they remain below the value provided by the PG-based SES of the same size.
Figure 33. Effect of Inner Patch Hole Size Variations on RCS at 8 GHz.
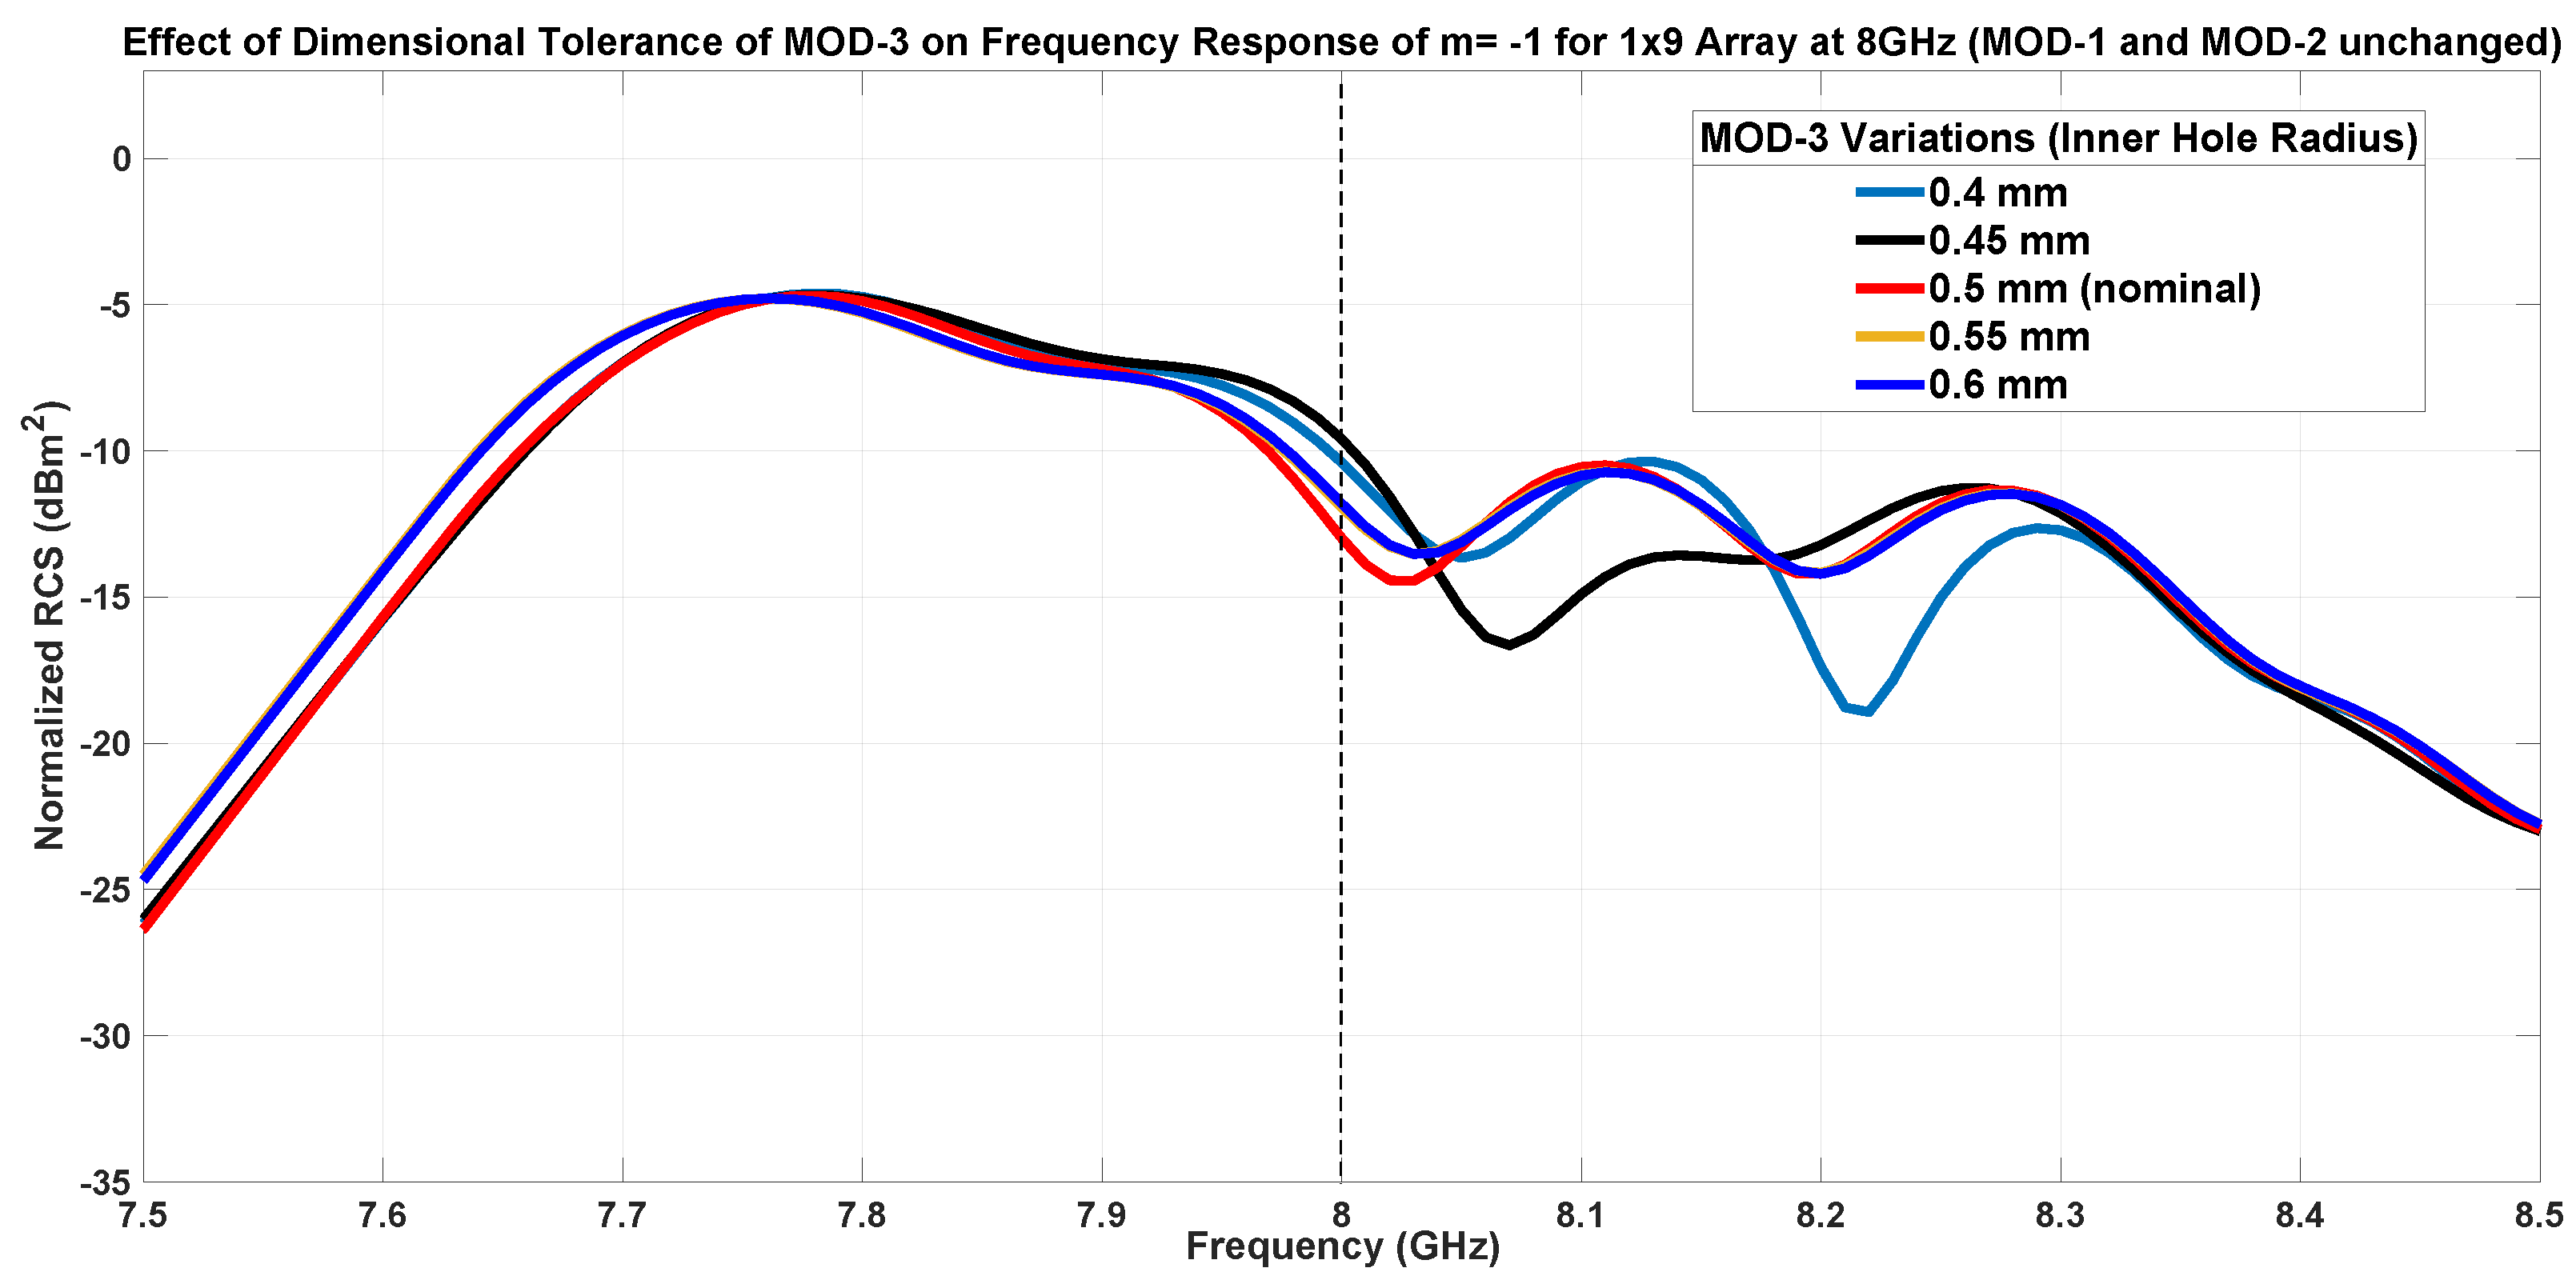
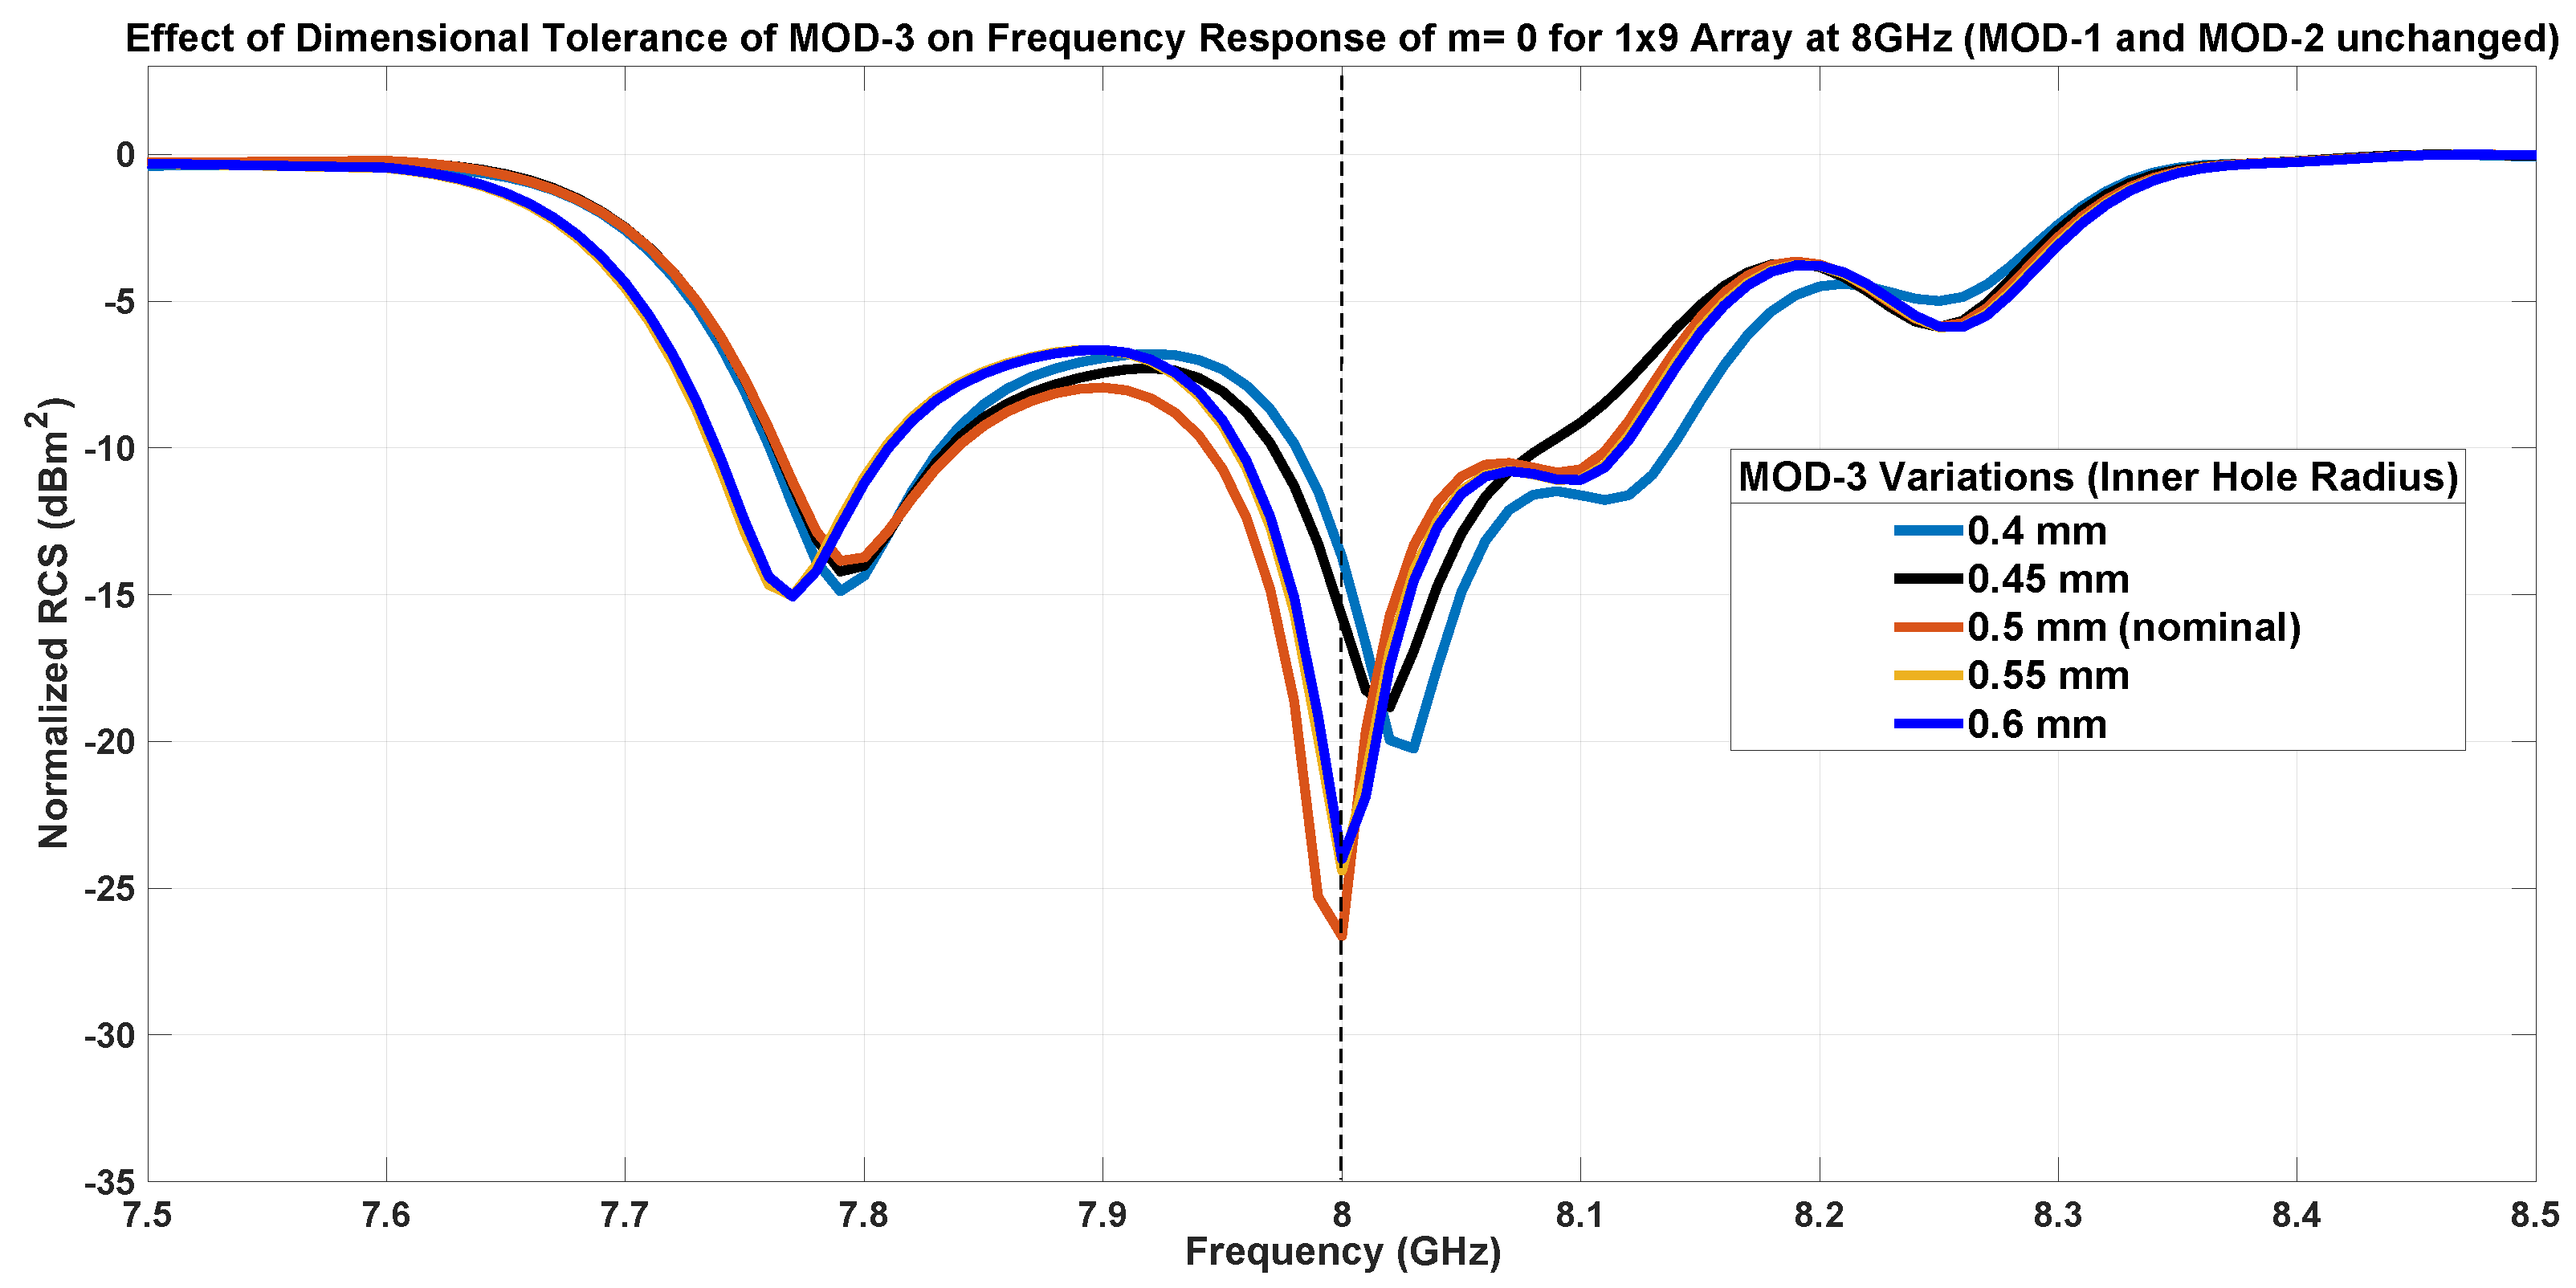
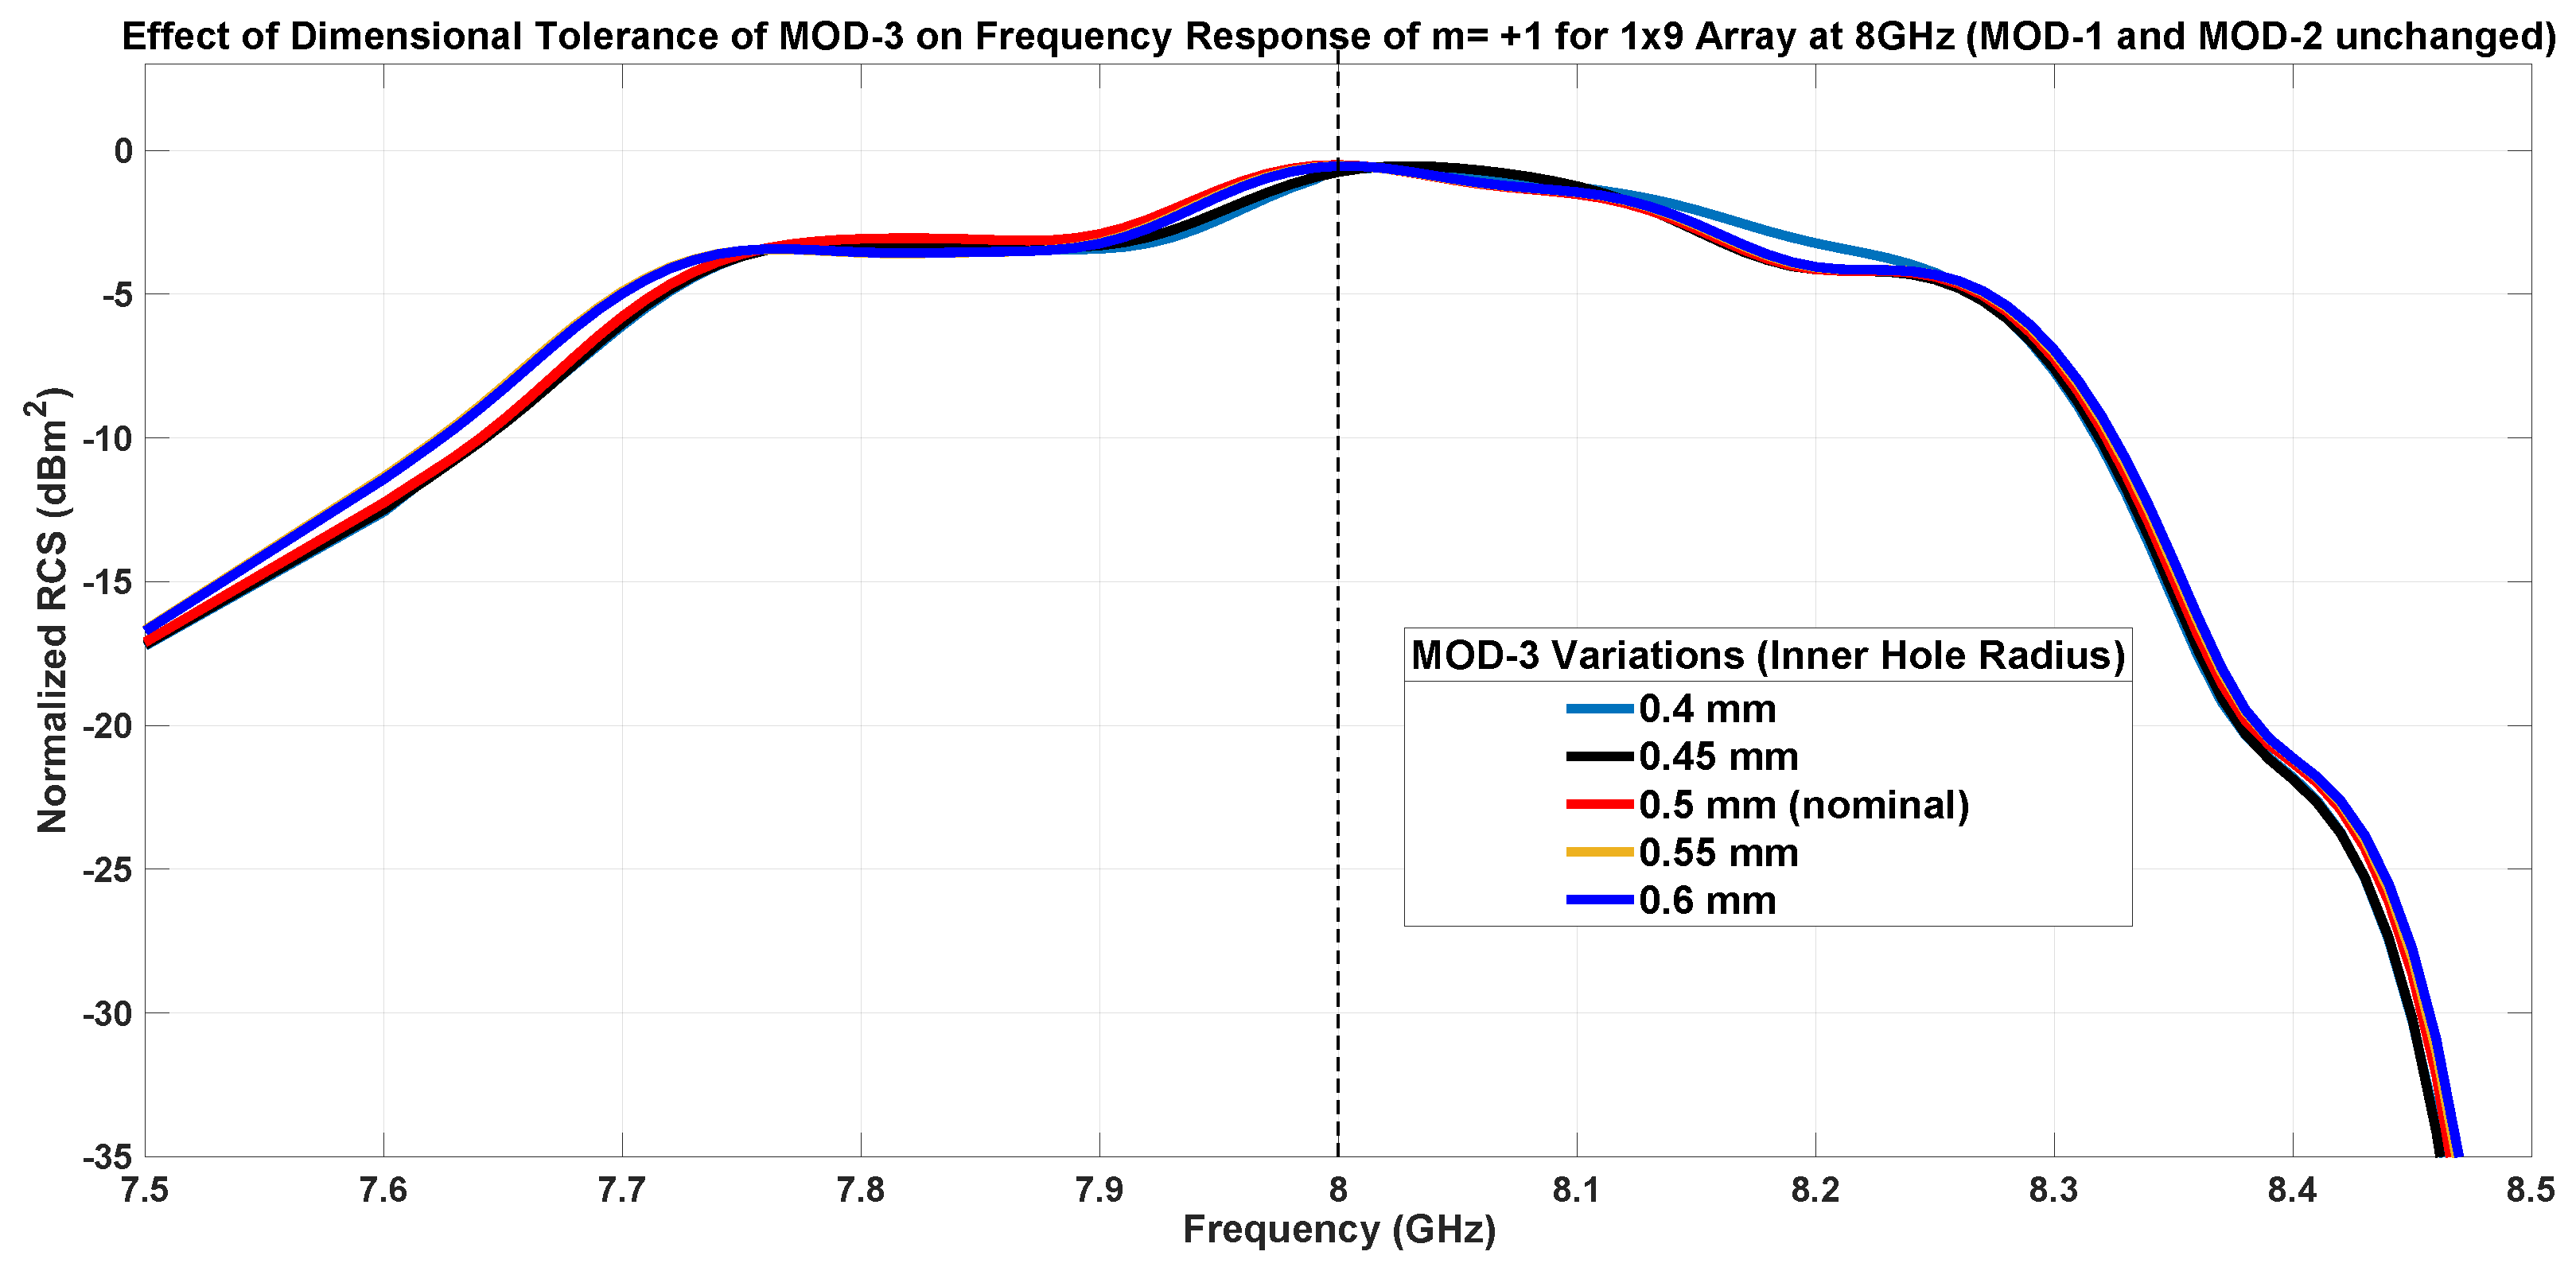
Concerning the effects of varying the inner patch hole on the frequency response of modes, the results are plotted in Figure 34, Figure 35 and Figure 36. As expected from RCS, changing the hole diameter slightly affects the frequency variation of the specular mode as well as the beam pointing in the desired direction. A minor effect can be seen in the frequency response of mode m = 0 , especially for lower hole sizes.
Figure 34. Effect of Inner Patch Hole Size Variations on Frequency Response of Floquet Mode m = 1 .
Figure 35. Effect of Inner Patch Hole Size Variations on Frequency Response of Floquet Mode m = 0 .
Figure 36. Effect of Inner Patch Hole Size Variations on Frequency Response of Floquet Mode m = + 1 .
In conclusion, it is possible to assert that the manufacturing tolerances introduce an acceptable error on the performance of the smart skin and do not invalidate the proposed approach for the parasitic lobes reduction, that stay in any case lower than those resulting from a conventional design. Although the size of the patch is the most critical geometric parameter, it is also the quantity least affected by manufacturing tolerances.

7.2. Method Stability

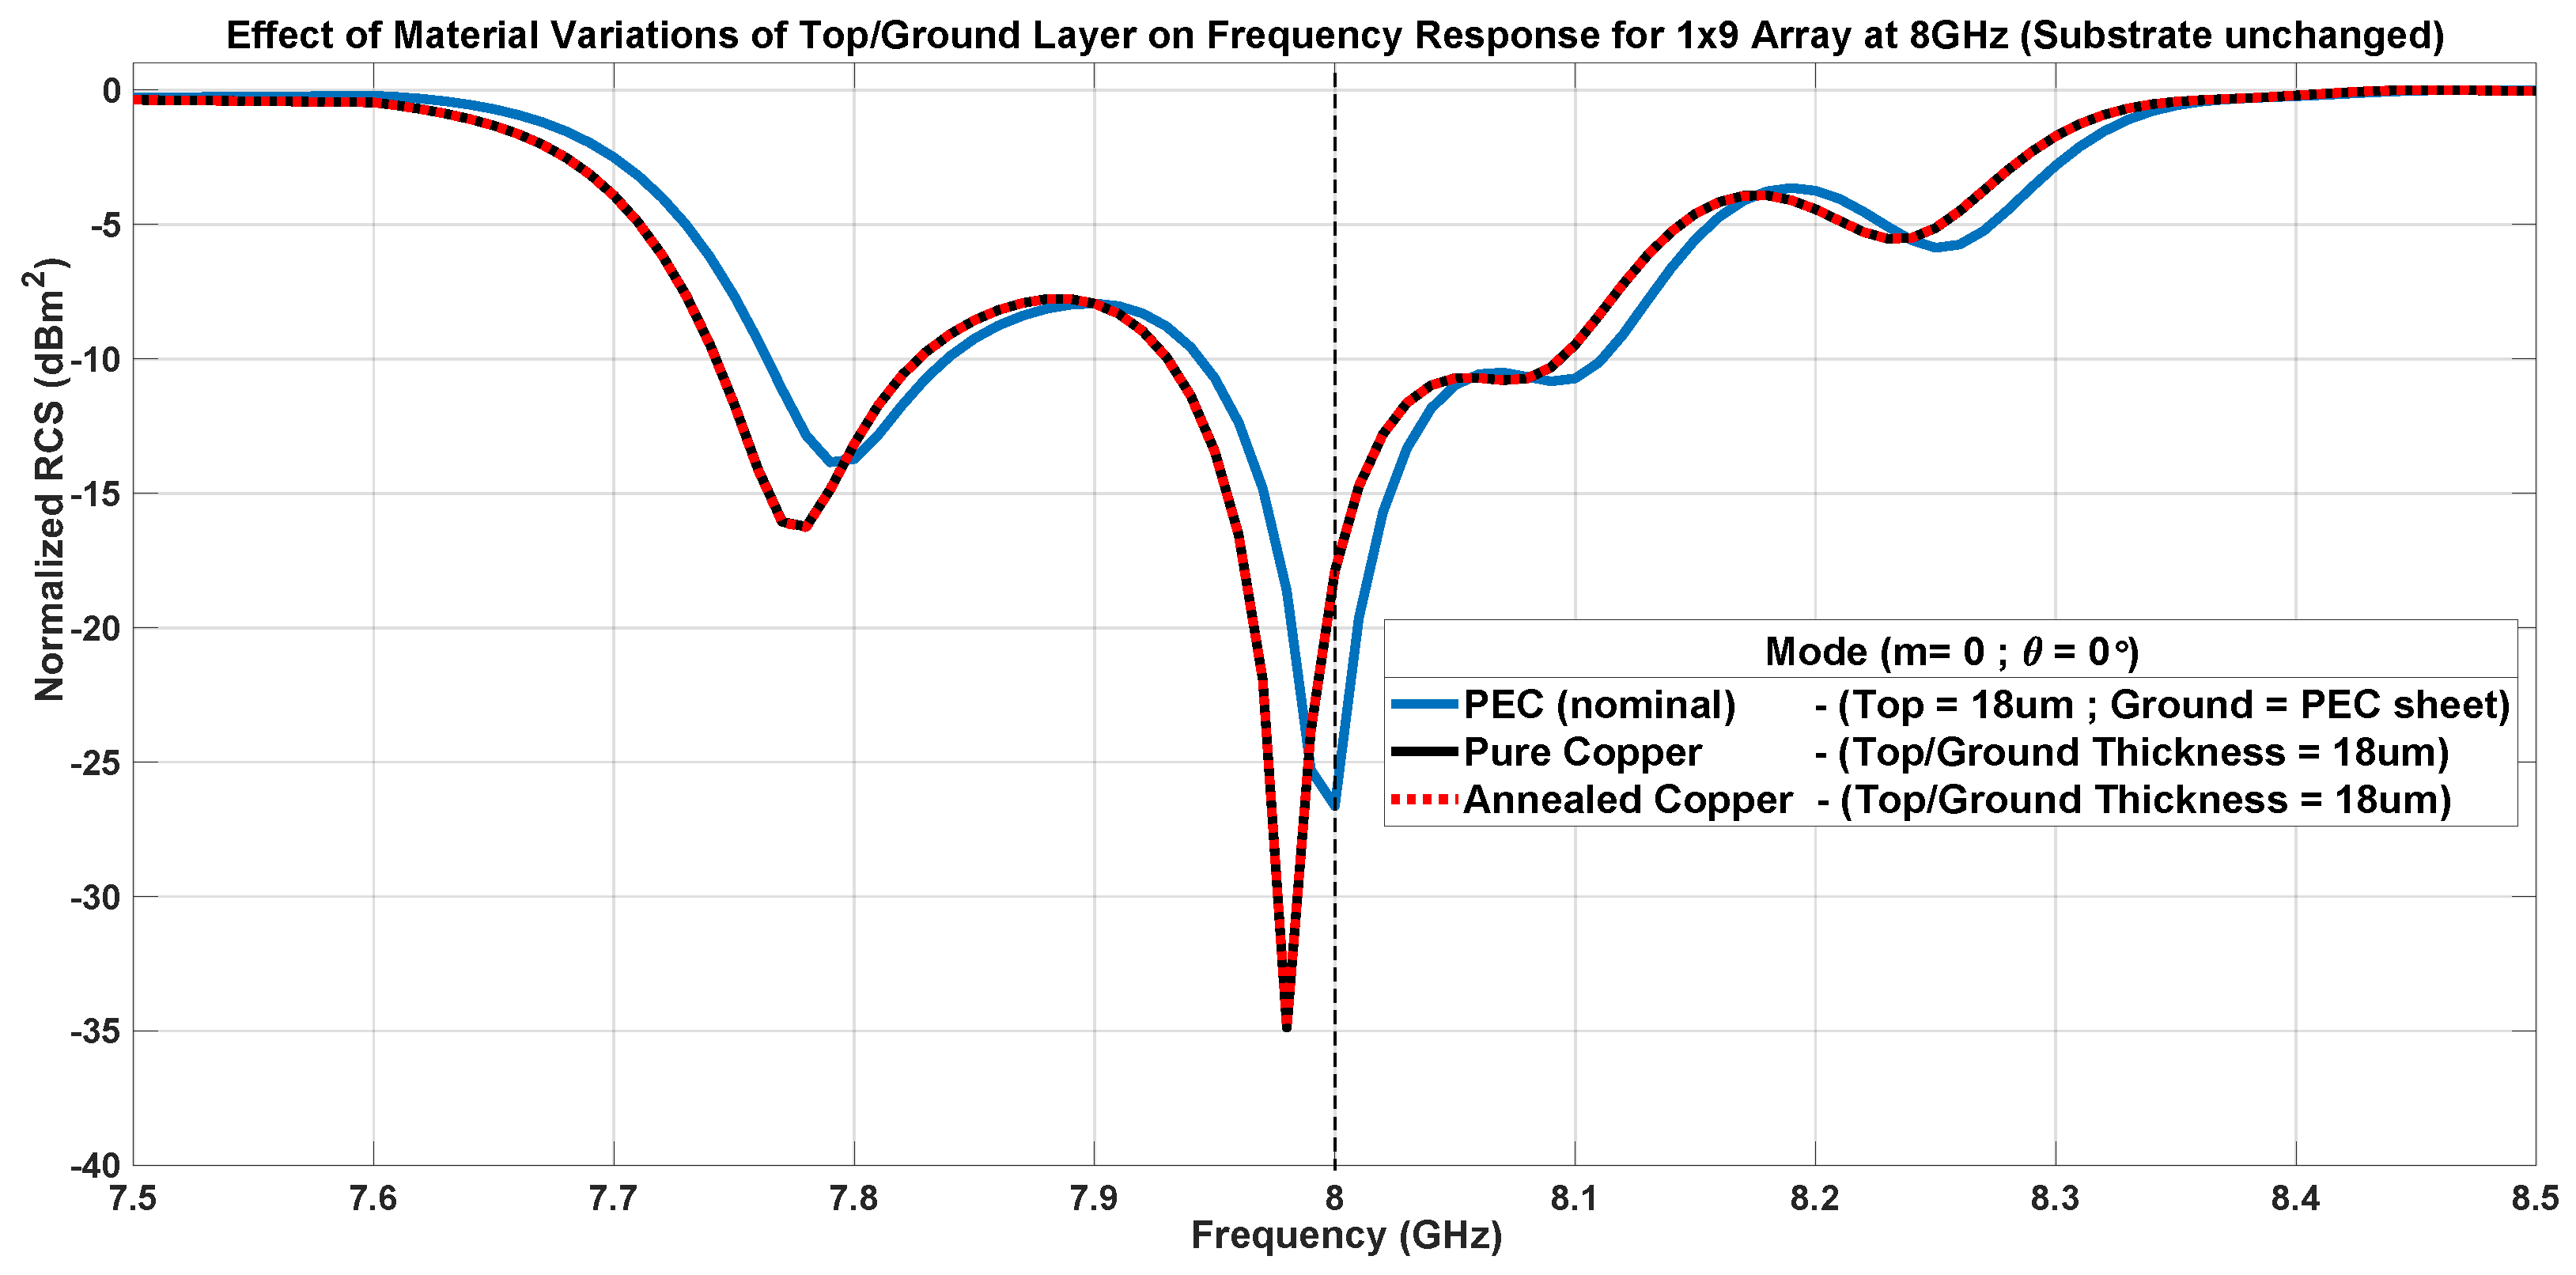
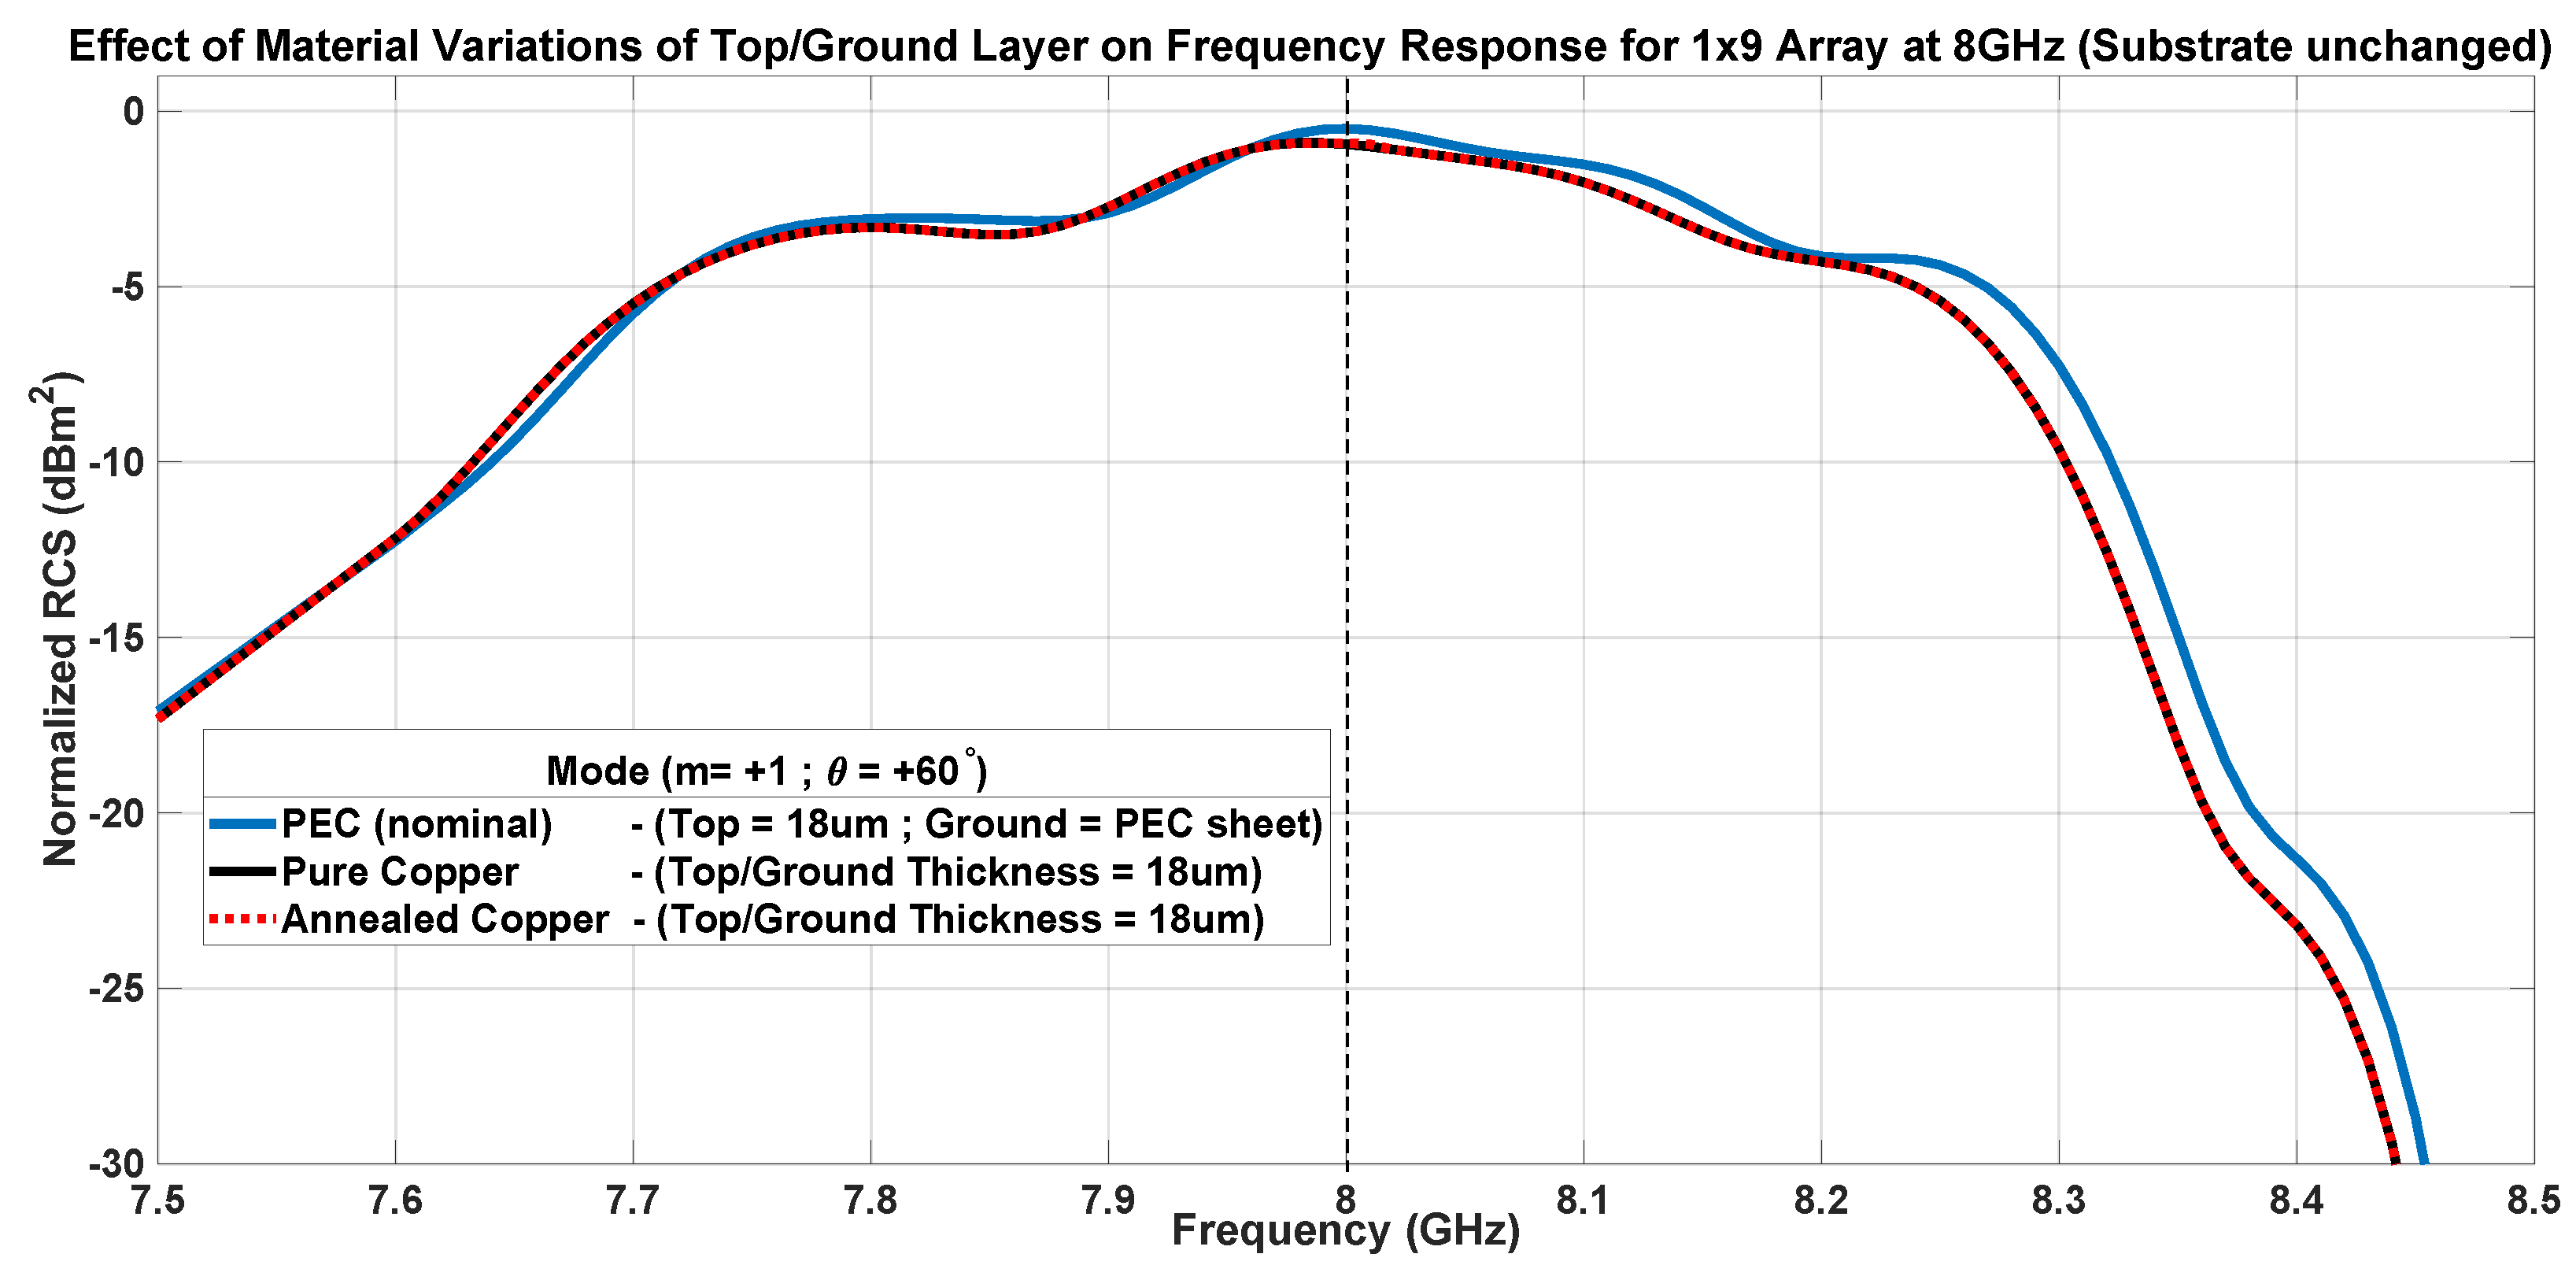
The stability of the method was checked against variations in the materials used to simulate the ground plane and the patches. While the previous sections’ results were obtained using a perfect electric conductor (PEC) for the patches and ground plane, this study substituted PEC with pure copper (electrical conductivity of 5.96 × 10 7 Simon per meter) and annealed copper (electrical conductivity of 5.8 × 10 7 Simon per meter). The substrate and design remained unchanged. In all cases, the thickness of the metallic layers was set equal to that adopted in the previous analysis.
The effect of modeling the conductors with different material is minimal on the RCS as shown in Figure 37 where the curves for pure copper and annealed copper are overlapped and slightly different from the result obtained considering PEC. Similar consideration can emerge from the plots of the frequency behavior of the the principal lobe levels, represented in Figure 38, Figure 39 and Figure 40.
Figure 37. Effect of the use of different material models for the patches and the ground plane on RCS at 8 GHz.
Figure 38. Effect of the use of different material models for the patches and the ground plane on Frequency Response of Floquet Mode m = 1 .
Figure 39. Effect of the use of different material models for the patches and the ground plane on Frequency Response of Floquet Mode m = 0 .
Figure 40. Effect of the use of different material models for the patches and the ground plane on Frequency Response of Floquet Mode m = + 1 .
This analysis provides information about the simulation setup and its effect on the results, improving the replicability of the study and offering insight into the sensitivity of the method to the simulation setup, that appears to be quite limited.

8. Conclusions

In the paper, a novel design approach able to strongly reduce the anomalous reflections that affect the radiation of smart skins has been presented. The proposed method leverages the theory of electromagnetic multipoles to reveal new degrees of freedom and unexplored properties in conventional strategies. First, the unit cells are designed to provide a phase gradient variation within a super-cell. Then, the geometric parameters of the unit cells are modified through non-local symmetry-breaking within super-cell framework to convert the super-cell into a composite meta-molecule. Both local and non-local bi-anisotropy are exploited by utilizing the degrees of freedom offered by the UC and super-cell. An advantage of this approach is the ability to use different sub-geometries of the unit cell to achieve the desired functions of radiation enhancement or suppression. In this way, it is possible to control the radiation of the multipoles into which the field can be decomposed, ensuring that their combination suppresses the parasitic lobes in the RCS pattern. To verify its effectiveness, the proposed technique was applied to 1D SESs with different length. The results of their full-wave numerical analysis confirm their good performance over a bandwidth of about 14 % . In conclusion, the methodology reveals previously the unexploited performance potential in existing methods and simple designs. At the same time, it establishes novel pathways for SES engineering in the microwave and optical frequency domains. The approach enhances SES deployment efficiency by reducing costs through the elimination of expensive, multi-layer materials and sophisticated fabrication processes. Consequently, opportunities arise to develop cost-effective, high-performance, scalable SES solutions that are ideal for 6G system deployment within the SRE framework.

Author Contributions

Conceptualization, S.A.; Methodology, S.A.; Software, S.A.; Validation, S.A.; Formal analysis, S.A.; Investigation, S.A.; Resources, P.P.; Data curation, S.A.; Writing—original draft, S.A.; Writing—review & editing, P.P.; Visualization, S.A.; Supervision, P.P.; Project administration, P.P.; Funding acquisition, P.P. All authors have read and agreed to the published version of the manuscript.

Funding

This work was partially supported by the European Union—Next Generation EU under the Italian National Recovery and Resilience Plan (NRRP), Mission 4, Component 2, Investment 1.3, CUP E13C22001870001, partnership on “Telecommunications of the Future” (PE00000001—program “RESTART”).

Institutional Review Board Statement

Not applicable.

Data Availability Statement

The raw data supporting the conclusions of this article will be made available by the authors on request.

Conflicts of Interest

The authors declare no conflicts of interest.

References

  1. Tishchenko, A.; Khalily, M.; Shojaeifard, A.; Burton, F.; Björnson, E.; Di Renzo, M.; Tafazolli, R. The Emergence of Multi-Functional and Hybrid Reconfigurable Intelligent Surfaces for Integrated Sensing and Communications—A Survey. IEEE Commun. Surv. Tutor. 2024, 27, 2895–2936. [Google Scholar] [CrossRef]
  2. Umer, A.; Müürsepp, I.; Alam, M.M.; Wymeersch, H. Reconfigurable Intelligent Surfaces in 6G Radio Localization: A Survey of Recent Developments, Opportunities, and Challenges. IEEE Commun. Surv. Tutor. 2025. [Google Scholar] [CrossRef]
  3. Zaoutis, E.A.; Liodakis, G.S.; Baklezos, A.T.; Nikolopoulos, C.D.; Ioannidou, M.P.; Vardiambasis, I.O. 6G Wireless Communications and Artificial Intelligence-Controlled Reconfigurable Intelligent Surfaces: From Supervised to Federated Learning. Appl. Sci. 2025, 15, 3252. [Google Scholar] [CrossRef]
  4. Martini, E.; Maci, S. Theory, Analysis, and Design of Metasurfaces for Smart Radio Environments. Proc. IEEE 2022, 110, 1227–1243. [Google Scholar] [CrossRef]
  5. Di Renzo, M. Smart radio environments empowered by reconfigurable intelligent surfaces: How it works, state of research, and the road ahead. IEEE J. Sel. Areas Commun. 2020, 38, 2450–2525. [Google Scholar] [CrossRef]
  6. Ayoubi, R.A.; Moro, E.; Mizmizi, M.; Tagliaferri, D.; Filippini, I.; Spagnolini, U. Optimal Planning for Heterogeneous Smart Radio Environments. arXiv 2024, arXiv:2411.15629. [Google Scholar] [CrossRef]
  7. Lee, J.Y.; Wu, D.; Guo, X.; Tan, J.D.; Yew, T.J.; Ng, Z.N.; Bhuiyan, M.A.S.; Miraz, M.H. 6G communications through sub-Terahertz CMOS power amplifiers: Design challenges and trends. Heliyon 2025, 11, e43393. [Google Scholar] [CrossRef]
  8. Thomas, S.; Virdi, J.S.; Babakhani, A.; Roberts, I.P. A Survey on Advancements in THz Technology for 6G: Systems, Circuits, Antennas, and Experiments. IEEE Open J. Commun. Soc. 2025, 6, 1998–2016. [Google Scholar] [CrossRef]
  9. Oliveri, G.; Zardi, F.; Rocca, P.; Salucci, M.; Massa, A. Building a Smart EM Environment-AI-Enhanced Aperiodic Micro-Scale Design of Passive EM Skins. IEEE Trans. Antennas Propag. 2022, 70, 8757–8770. [Google Scholar] [CrossRef]
  10. Benoni, A.; Capra, F.; Salucci, M.; Massa, A. Toward real-world indoor smart electromagnetic environments–A large-scale experimental demonstration. IEEE Trans. Antennas Propag. 2023, 71, 8450–8463. [Google Scholar] [CrossRef]
  11. Freni, A.; Beccaria, M.; Mazzinghi, A.; Massaccesi, A.; Pirinoli, P. Low-Profile and Low-Visual Impact Smart Electromagnetic Curved Passive Skins for Enhancing Connectivity in Urban Scenarios. Electronics 2023, 12, 4491. [Google Scholar] [CrossRef]
  12. Beccaria, M.; Freni, A.; Mazzinghi, A.; Pirinoli, P. On the features of curved, passive reconfigurable smart electromagnetic skins. Sci. Rep. 2025, 15, 32277. [Google Scholar] [CrossRef]
  13. Huang, J.; Encinar, J. Reflectarray Antennas; Wiley-IEEE Press: Hoboken, NJ, USA, 2007; pp. 1–216. [Google Scholar]
  14. Martinez-de-Rioja, E.; Vaquero, A.F.; Arrebola, M.; Carrasco, E.; Encinar, J.A.; Achour, M. Passive intelligent reflecting surfaces based on reflectarray panels to enhance 5G millimeter-wave coverage. Int. J. Microw. Wirel. Technol. 2023, 15, 3–14. [Google Scholar] [CrossRef]
  15. Li, A.; Singh, S.; Sievenpiper, D. Metasurfaces and their applications. Nanophotonics 2018, 7, 989–1011. [Google Scholar] [CrossRef]
  16. Liaskos, C.; Nie, S.; Tsioliaridou, A.; Pitsillides, A.; Ioannidis, S.; Akyildiz, I. A new wireless communication paradigm through software-controlled metasurfaces. IEEE Commun. Mag. 2018, 56, 162–169. [Google Scholar] [CrossRef]
  17. Yang, F.; Rahmat-Samii, Y. Surface Electromagnetics, With Applications in Antenna, Microwave, and Optical Engineering; Cambridge University Press: Cambridge, UK, 2019. [Google Scholar]
  18. Glybovski, S.B.; Tretyakov, S.A.; Belov, P.A.; Kivshar, Y.S.; Simovski, C.R. Metasurfaces: From microwaves to visible. Phys. Rep. 2016, 634, 1–72. [Google Scholar] [CrossRef]
  19. Tang, W. Subject Editor spotlight on programmable metasurfaces: The future of wireless? IET Electron. Lett. 2019, 55, 360–361. [Google Scholar] [CrossRef]
  20. Hu, J.; Bandyopadhyay, S.; Liu, Y.H.; Shao, L.Y. A review on metasurface: From principle to smart metadevices. Front. Phys. 2021, 8, 586087. [Google Scholar] [CrossRef]
  21. Chen, H.T.; Taylor, A.J.; Yu, N.F. A review of metasurfaces: Physics and applications. Rep. Prog. Phys. 2016, 79, 076401. [Google Scholar] [CrossRef]
  22. Wong, A.M.H.; Christian, P.; Eleftheriades, G.V. Binary Huygens’ metasurfaces: Experimental demonstration of simple and efficient near-grazing Retroreflectors for TE and TM polarizations. IEEE Trans. Antennas Propag. 2018, 66, 2892. [Google Scholar] [CrossRef]
  23. Estakhri, N.M.; Neder, V.; Knight, M.W.; Polman, A.; Alù, A. Visible Light, Wide-angle graded metasurface for back reflection. ACS Photonics 2017, 4, 228. [Google Scholar] [CrossRef]
  24. Xu, G.; Ataloglou, V.G.; Hum, S.V.; Eleftheriades, G.V. Extreme Beam-Forming With Impedance Metasurfaces Featuring Embedded Sources and Auxiliary Surface Wave Optimization. IEEE Access 2022, 10, 28670–28684. [Google Scholar] [CrossRef]
  25. Rabinovich, O.; Epstein, A. Analytical Design of Printed Circuit Board (PCB) Metagratings for Perfect Anomalous Reflection. IEEE Trans. Antennas Propag. 2018, 66, 4086–4095. [Google Scholar] [CrossRef]
  26. Yu, N.; Genevet, P.; Kats, M.A.; Aieta, F.; Tetienne, J.P.; Capasso, F.; Gaburro, Z. Light Propagation with Phase Discontinuities: Generalized Laws of Reflection and Refraction. Science 2011, 334, 333–337. [Google Scholar] [CrossRef]
  27. Elineau, M.; Loison, R.; Méric, S.; Gillard, R.; Pagani, P.; Mazé-Merceur, G.; Pouliguen, P. RCS prediction and optimization for anomalous reflection metasurfaces using Floquet analysis. Int. J. Microw. Wirel. Technol. 2023, 15, 966–974. [Google Scholar] [CrossRef]
  28. Islam, N.A.; Choi, S. Compact folded dipole metasurface for high anomalous reflection angles with low harmonic levels. Sci. Rep. 2020, 10, 18125. [Google Scholar] [CrossRef]
  29. Asadchy, V.S.; Albooyeh, M.; Tcvetkova, S.N.; Díaz-Rubio, A.; Ra’di, Y.; Tretyakov, S.A. Perfect control of reflection and refraction using spatially dispersive metasurfaces. Phys. Rev. B 2016, 94, 075142. [Google Scholar] [CrossRef]
  30. Díaz-Rubio, A.; Asadchy, V.S.; Elsakka, A.; Tretyakov, S.A. From the generalized reflection law to the realization of perfect anomalous reflectors. Sci. Adv. 2017, 3, e1602714. [Google Scholar] [CrossRef]
  31. Asadchy, V.S.; Wickberg, A.; Díaz-Rubio, A.; Wegener, M. Eliminating Scattering Loss in Anomalously Reflecting Optical Metasurfaces. ACS Photonics 2017, 4, 1264–1270. [Google Scholar] [CrossRef]
  32. Ra’di, Y.; Alù, A. Metagratings for Efficient Wavefront Manipulation. IEEE Photonics J. 2022, 14, 2207513. [Google Scholar] [CrossRef]
  33. Popov, V.; Boust, F.; Burokur, S.N. Controlling diffraction patterns with metagratings. Phys. Rev. Appl. 2018, 10, 011002. [Google Scholar] [CrossRef]
  34. Ra’di, Y.; Alù, A. Reconfigurable metagratings. ACS Photonics 2018, 5, 1779–1785. [Google Scholar] [CrossRef]
  35. Panagiotidis, E.; Almpanis, E.; Stefanou, N.; Papanikolaou, N. Multipolar interactions in Si sphere metagratings. J. Appl. Phys. 2020, 128, 093103. [Google Scholar] [CrossRef]
  36. Huang, T.; Yin, L.Z.; Zhao, J.; Liu, P.K. High-order multipoles in all-dielectric metagrating enabling ultralarge-angle light bending with unity efficiency. Nanophotonics 2021, 10, 2859–2873. [Google Scholar] [CrossRef]
  37. Fan, Z.; Shcherbakov, M.R.; Allen, M.; Allen, J.; Wenner, B.; Shvets, G. Perfect diffraction with multiresonant bianisotropic metagratings. ACS Photonics 2018, 5, 4303–4311. [Google Scholar] [CrossRef]
  38. Wang, S.; Chen, K.; Zhang, X.; Dong, S.; Tang, K.; Yang, W.; Zhao, J.; Jiang, T.; Feng, Y. Metagrating-assisted dual-polarized hybrid metalens with near-unity numerical aperture. Phys. Rev. Appl. 2025, 23, 064011. [Google Scholar] [CrossRef]
  39. Niemi, T.; Karilainen, A.O.; Tretyakov, S.A. Synthesis of Polarization Transformers. IEEE Trans. Antennas Propag. 2013, 61, 3102–3111. [Google Scholar] [CrossRef]
  40. Liu, W.; Kivshar, Y.S. Generalized Kerker effects in nanophotonics and meta-optics [Invited]. Opt. Express 2018, 26, 13085–13105. [Google Scholar] [CrossRef]
  41. Lee, J.Y.; Miroshnichenko, A.E.; Lee, R.-K. Reexamination of Kerker’s conditions by means of the phase diagram. Phys. Rev. A 2017, 96, 043846. [Google Scholar] [CrossRef]
  42. Chen, Y.; Fleury, R.; Seppecher, P.; Hu, G.; Wegener, M. Nonlocal metamaterials and metasurfaces. Nat. Rev. Phys. 2025, 7, 299–312. [Google Scholar] [CrossRef]
  43. Estakhri, N.M.; Alù, A. Wave-front transformation with gradient metasurfaces. Phys. Rev. X 2016, 6, 041008. [Google Scholar] [CrossRef]
  44. Saue, T. Post Dirac-Hartree-Fock methods-Properties. In Theoretical and Computational Chemistry; Schwerdtfeger, P., Ed.; Elsevier: Amsterdam, The Netherlands, 2002; Volume 11, pp. 332–400. [Google Scholar]
  45. Alaee, R.; Rockstuhl, C.; Fernandez-Corbaton, I. An electromagnetic multipole expansion beyond the long-wavelength approximation. Opt. Commun. 2018, 407, 17–21. [Google Scholar] [CrossRef]
  46. Grahn, P.; Shevchenko, A.; Kaivola, M. Electromagnetic multipole theory for optical nanomaterials. New J. Phys. 2012, 14, 093033. [Google Scholar] [CrossRef]
  47. Achouri, K.; Caloz, C. Electromagnetic Metasurfaces: Theory and Applications; Wiley-IEEE Press: Hoboken, NJ, USA, 2021. [Google Scholar]
  48. Papasimakis, N.; Fedotov, V.A.; Savinov, V.; Raybould, T.A.; Zheludev, N.I. Electromagnetic toroidal excitations in matter and free space. Nat. Mater. 2016, 15, 263–271. [Google Scholar] [CrossRef]
  49. Poleva, M.; Frizyuk, K.; Baryshnikova, K.; Evlyukhin, A.; Petrov, M.; Bogdanov, A. Multipolar theory of bianisotropic response of meta-atoms. Phys. Rev. B 2023, 107, L041304. [Google Scholar] [CrossRef]
  50. Kaelberer, T.; Fedotov, V.A.; Papasimakis, N.; Tsai, D.P.; Zheludev, N.I. Toroidal Dipolar Response in a Metamaterial. Science 2010, 330, 1510–1512. [Google Scholar] [CrossRef]
  51. Baryshnikova, K.V.; Smirnova, D.A.; Luk’yanchuk, B.S.; Kivshar, Y.S. Optical anapoles: Concepts and applications. Adv. Opt. Mater. 2019, 7, 1801350. [Google Scholar] [CrossRef]
  52. Guo, S.; Talebi, N.; Campos, A.; Kociak, M.; van Aken, P.A. Radiation of Dynamic Toroidal Moments. ACS Photonics 2019, 6, 467–474. [Google Scholar] [CrossRef]
  53. Talebi, N.; Guo, S.; van Aken, P.A. Theory and applications of toroidal moments in electrodynamics: Their emergence, characteristics, and technological relevance. Nanophotonics 2018, 7, 93–110. [Google Scholar] [CrossRef]
  54. Muhammad, N.; Su, Z.; Jiang, Q.; Wang, Y.; Huang, L. Radiationless optical modes in metasurfaces: Recent progress and applications. Light: Sci. Appl. 2024, 13, 192. [Google Scholar] [CrossRef]
  55. Savinov, V.; Fedotov, V.A.; Zheludev, N.I. Toroidal dipolar excitation and macroscopic electromagnetic properties of metamaterials. Phys. Rev. B 2014, 89, 205112. [Google Scholar] [CrossRef]
  56. Wang, X.; Chen, D.; Ma, W.; You, S.; Zhou, M.; Wang, L.; Zhang, Q.; Luo, S.; Zhou, C. Tuning the magnetic toroidal dipole response in dielectric metasurfaces. J. Opt. Soc. Am. B 2023, 40, 560–566. [Google Scholar] [CrossRef]
  57. Maleki, J.; Fathi, D. Refractive index sensor based on fano-magnetic toroidal quadrupole resonance enabled by bound state in the continuum in all-dielectric metasurface. Sci. Rep. 2024, 14, 4110. [Google Scholar] [CrossRef] [PubMed]
  58. Evlyukhin, A.B.; Reinhardt, C.; Evlyukhin, E.; Chichkov, B.N. Multipole analysis of light scattering by arbitrary-shaped nanoparticles on a plane surface. J. Opt. Soc. Am. B 2013, 30, 2589–2598. [Google Scholar] [CrossRef]
  59. Guo, L.; Gao, Y. High-Q Resonances Induced by Toroidal Dipole Bound States in the Continuum in Terahertz Metasurfaces. Crystals 2025, 15, 96. [Google Scholar] [CrossRef]
  60. Ji, J.; Lv, X.; Li, C.; Yang, X.; Guo, Y. Asymmetric Orthogonal Metasurfaces Governed by Toroidal Dipole Bound States in the Continuum. Photonics 2023, 10, 1194. [Google Scholar] [CrossRef]
  61. Algorri, J.F.; Dmitriev, V.; Hernández-Figueroa, H.E.; Rodríguez-Cobo, L.; Dell’Olio, F.; Cusano, A.; López-Higuera, J.M.; Zografopoulos, D.C. Polarization-independent hollow nanocuboid metasurfaces with robust quasi-bound states in the continuum. Opt. Mater. 2024, 147, 114631. [Google Scholar] [CrossRef]
  62. Gupta, M.; Singh, R. Toroidal metasurfaces in a 2D flatland. Rev. Phys. 2020, 5, 100040. [Google Scholar] [CrossRef]
  63. Li, S.-Q.; Crozier, K.B. Origin of the anapole condition as revealed by a simple expansion beyond the toroidal multipole. Phys. Rev. B 2018, 97, 245423. [Google Scholar] [CrossRef]
  64. Zanganeh, E.; Evlyukhin, A.; Miroshnichenko, A.; Song, M.; Nenasheva, E.; Kapitanova, P. Anapole meta-atoms: Nonradiating electric and magnetic sources. Phys. Rev. Lett. 2021, 127, 096804. [Google Scholar] [CrossRef]
  65. Savinov, V.; Papasimakis, N.; Tsai, D.P.; Zheludev, N.I. Optical anapoles. Commun. Phys. 2019, 2, 69. [Google Scholar] [CrossRef]
  66. Miroshnichenko, A.E.; Evlyukhin, A.B.; Yu, Y.F.; Bakker, R.M.; Chipouline, A.; Kuznetsov, A.I.; Luk’yanchuk, B.; Chichkov, B.N.; Kivshar, Y.S. Nonradiating anapole modes in dielectric nanoparticles. Nat. Commun. 2015, 6, 8069. [Google Scholar] [CrossRef] [PubMed]
  67. Yang, Y.; Bozhevolnyi, S.I. Nonradiating anapole states in nanophotonics: From fundamentals to applications. Nanotechnology 2019, 30, 204001. [Google Scholar] [CrossRef] [PubMed]
  68. Gupta, M.; Singh, R. Toroidal versus Fano Resonances in High Q planar THz Metamaterials. Adv. Opt. Mater. 2016, 4, 2119–2125. [Google Scholar] [CrossRef]
  69. Basharin, A.A.; Chuguevsky, V.; Volsky, N.; Kafesaki, M.; Economou, E.N. Extremely high Q-factor metamaterials due to anapole excitation. Phys. Rev. B 2017, 95, 035104. [Google Scholar] [CrossRef]
  70. Totero Gongora, J.S.; Miroshnichenko, A.E.; Kivshar, Y.S.; Fratalocchi, A. Anapole nanolasers for mode-locking and ultrafast pulse generation. Nat. Commun. 2017, 8, 15535. [Google Scholar] [CrossRef]
  71. Wu, P.C.; Liao, C.Y.; Savinov, V.; Chung, T.L.; Chen, W.T.; Huang, Y.W.; Wu, P.R.; Chen, Y.H.; Liu, A.Q.; Zheludev, N.I.; et al. Optical anapole metamaterial. ACS Nano 2018, 12, 1920–1927. [Google Scholar] [CrossRef]
  72. Algorri, J.F.; Zografopoulos, D.C.; Ferraro, A.; García-Cámara, B.; Vergaz, R.; Beccherelli, R.; Sánchez-Pena, J.M. Anapole Modes in Hollow Nanocuboid Dielectric Metasurfaces for Refractometric Sensing. Nanomaterials 2019, 9, 30. [Google Scholar] [CrossRef]
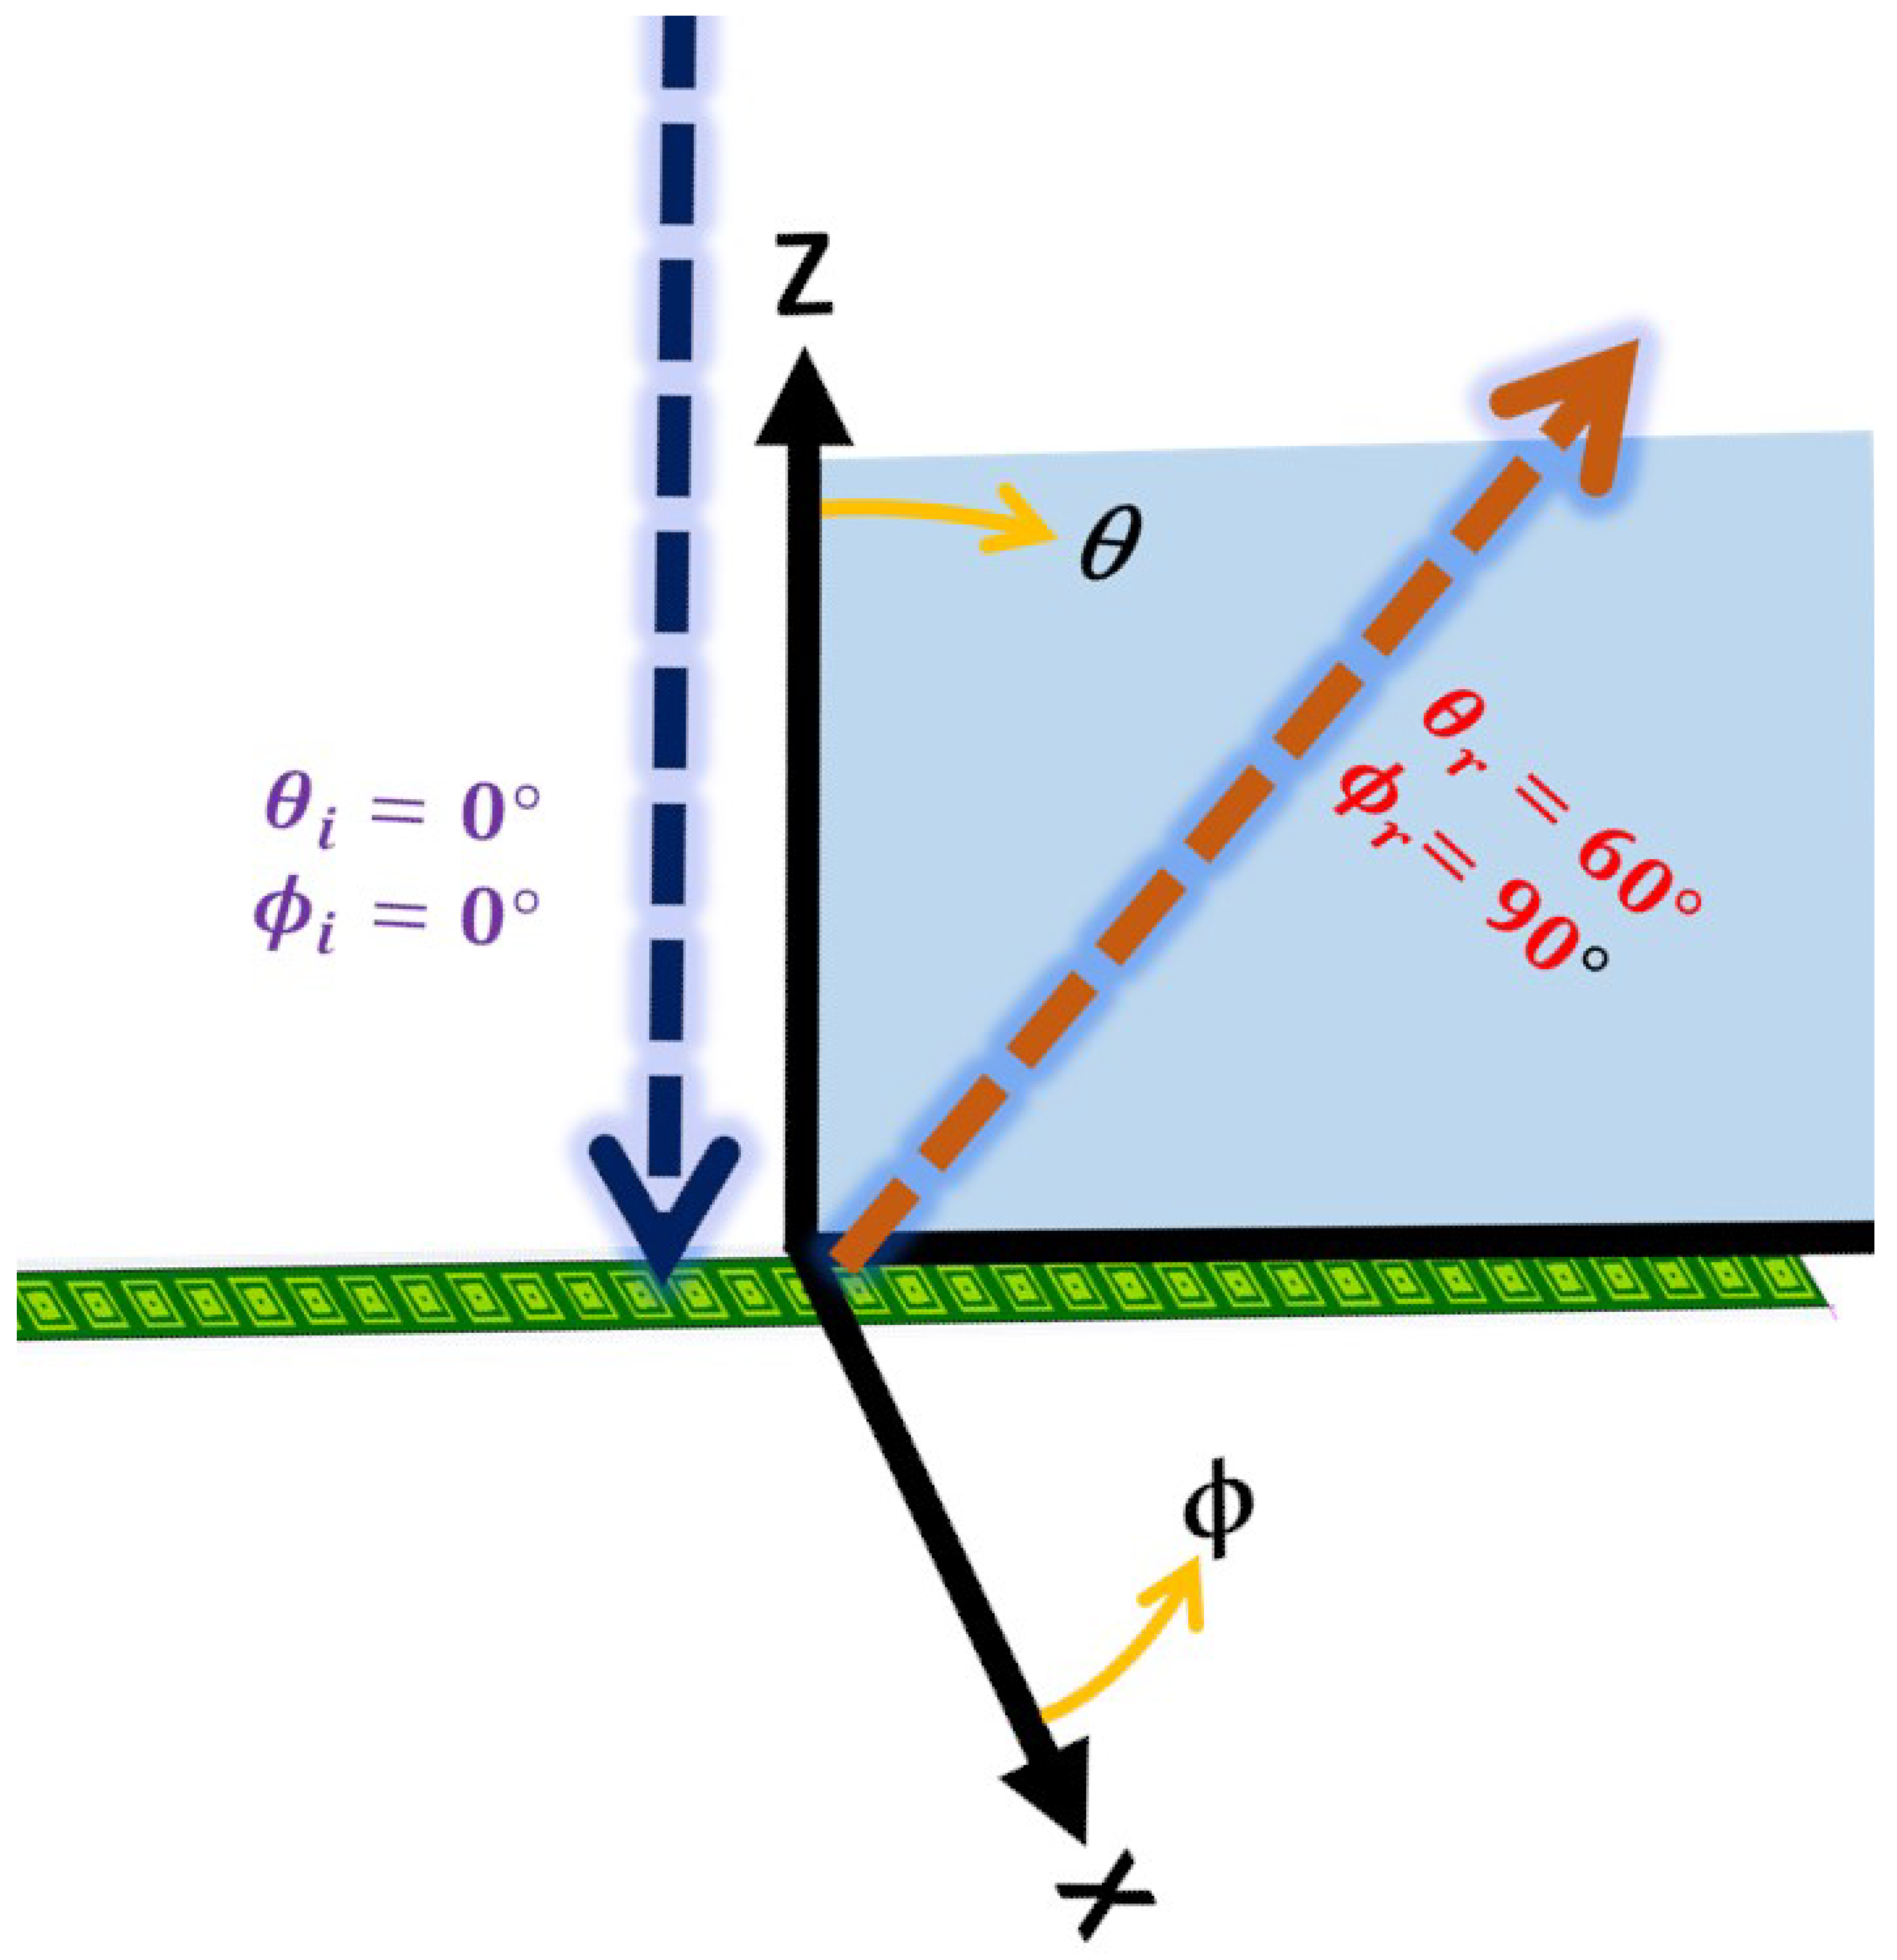
Disclaimer/Publisher’s Note: The statements, opinions and data contained in all publications are solely those of the individual author(s) and contributor(s) and not of MDPI and/or the editor(s). MDPI and/or the editor(s) disclaim responsibility for any injury to people or property resulting from any ideas, methods, instructions or products referred to in the content.

Article Metrics

Citations

Article Access Statistics

Multiple requests from the same IP address are counted as one view.