Article

Risk Assessment for Reducing Thermoset Waste: Predictive Modelling of Water Ageing in Epoxy Infrastructure

by
Marcela Elisabeth Penoff
1,
Guillermina Capiel
1,
Pablo E. Montemartini
1,2 and
Luis A. Miccio
1,3,*
1
Institute of Materials Science and Technology (INTEMA), National Research Council (CONICET), Colón 10850, Mar del Plata 7600, Buenos Aires, Argentina
2
Departamento de Ingeniería Química y en Alimentos, Facultad de Ingeniería, National University of Mar del Plata (UNMdP), Juan B. Justo 4302, Mar del Plata 7600, Buenos Aires, Argentina
3
Departamento Polímeros y Materiales Avanzados: Física, Química y Tecnología, University of the Basque Country (UPV/EHU), P. Manuel Lardizábal 3, 20018 San Sebastián, Spain
*
Author to whom correspondence should be addressed.
Appl. Sci. 2025, 15(22), 11857; https://doi.org/10.3390/app152211857
Submission received: 18 September 2025 / Revised: 21 October 2025 / Accepted: 5 November 2025 / Published: 7 November 2025
(This article belongs to the Special Issue Novel Research on By-Products and Treatment of Waste)

Abstract

Thermoset composites are a fast-growing waste stream that resists conventional reusing routes. Water is the principal ageing agent for epoxy-based thermoset materials that bind high-pressure piping, wind-turbine blades and aircraft skins, yet its action is deceptively complex: a rapid, reversible plasticisation is often followed by a far slower, irreversible chemical hydrolysis. Here we bridge that gap to access a reliable diagnosis inspection. Gravimetric immersion tests (from 8 to 93 °C, up to more than a year) and in situ FTIR spectroscopy were performed on four industrial DGEBA networks (two amine-cured matrices and two anhydride-cured matrices that hydrolyse). This 2 + 2 design isolates reversible from irreversible changes and exposes the individual signatures of diffusion, specific sorption and bond scission. The data are rationalised with a compact three-contribution model that superposes Fickian diffusion through nano-voids, adsorption site saturation through hydrogen bonds and a power-law hydrolysis term sharing global Arrhenius parameters. Since the parameters retain clear physical meaning, the approach can be extrapolated to service temperatures, providing a fast, transparent tool for lifetime prediction and for separating recoverable plasticisation from permanent chemical degradation in critical epoxy infrastructure.

1. Introduction

Epoxy-based polymers and their composites are a critical component of modern infrastructures like aircraft skins or fluid transport pipes, and yet in many cases their long-term performance is often ruled by a silent adversary: water [1,2,3,4,5,6]. Decades of experimental work have shown that the earliest part of their water uptake curve is well described by classical Fickian diffusion [7], whereas subsequent departures from this behaviour have in turn stimulated a wide range of phenomenological models (including stress-dependent diffusivity, history-dependent diffusivity and dual-phase Henry + Langmuir sorption schemes) [8,9,10,11,12,13]. Recent immersion studies on neat epoxies confirm a clear two-stage mass-gain profile: a fast Fickian knee followed by a relaxation shoulder, with both stages being largely reversible once the specimens are dried. Similar multi-stage kinetics have also been observed in filled systems aged at 75–95 °C, although here the mass gain is accompanied by a parallel decline in tensile strength and ester C = O signal, hinting at a chemical change [14]. Current characterisation techniques now leave little doubt that the irreversible part of the sorption curve is governed by hydrolysis. Fourier-transform infrared monitoring during sorption–desorption cycles shows the progressive loss of residual anhydride peaks at 1771 cm−1 in anhydride-cured systems. For highly filled insulating epoxies, hydrolysis of ester linkages generates carboxylic acids that react with Ca2+ at the resin–filler interface, thereby accelerating strength loss and creating preferential moisture pathways [15,16]. These observations point to a mechanistic sequence in which mobile water first enters the network, becomes specifically bound by hydrogen bonding or trapping and finally reacts irreversibly with labile bonds to open the network still further.
However, establishing adequate values for the parameters of any theoretical description of this sequence remains a major obstacle [17]. Some works found about 41 kJ mol−1 for epoxide hydrolysis in acidic media while still other studies quote numbers ranging from 30 kJ mol−1 to above 60 kJ mol−1 depending on pH, temperature window and method [18,19,20]. Discrepancies between isothermal and non-isothermal experiments further complicate the picture, illustrating how strongly experimental conditions, reaction progress and analysis methods influence the extracted model’s parameters. Uncertainty is equally prominent on the sorption side. Site densities and first-order rate constants fitted from mass-uptake curves often vary from one laboratory to another. In this context, density functional theory offers a complementary route by providing independent estimates of hydrogen bond strengths. Calculations consistently place the interaction energy between a water molecule and typical epoxy polar groups in the moderate hydrogen bond regime (in the range of 8 kcal mol−1), which is far above the 0.5 kcal mol−1 threshold for the weakest bonds yet well below the 15 kcal mol−1 characteristic of ion-mediated complexes [21,22,23,24]. These numbers constrain the enthalpy of specific sorption and help discriminate reversible hydrogen bonding from stronger, irreversible chemical reaction events.
The present work aimed to help in addressing these challenges by formulating a compact analytical model in which Fickian diffusion governs the flux of mobile water through micro-voids with Arrhenius-type diffusivity, adsorption kinetics describe the occupation of polar sites and hydrolysis is represented as a reaction-limited power-law accumulation of chemically bound water. The model and the fitting method keep the number of parameters at a minimum while physical meaning is conserved. We purposely selected four representative DGEBA-based networks, which tend to represent widely used classes of networks in the in-service infrastructure and therefore constitute a relevant sample set for durability assessment [10,15]. As a class of materials, DGEBA epoxy resins are a cornerstone of protective coatings [25], offering excellent adhesion and resistance to corrosion, chemicals and light. They are frequently applied in the underground tubing in the oil and gas industry, as well as in heavy machinery, automotive, maritime and aerospace industries to protect against harsh environments and extend their service life [26]. The four selected systems are as follows: two amine-cured matrices that do not hydrolyse under the studied conditions (Jeffamine® D-230 and Ancamine® Y), and two anhydride-cured matrices in which ester groups are prone to hydrolysis (Dicure® 37 and Lindride® 36 K). This 2 + 2 design makes it possible to separate the purely diffusional/plasticisation response from the irreversible hydrolytic contribution and thereby calibrate the individual terms of the analytical model that follows. Our parameter identification algorithm starts by extracting diffusion coefficients from the initial segment of short-term gravimetry, while sorption enthalpies are initialised from density functional estimates of hydrogen bond strength [17,27] and refined against the uptake curve and finally hydrolysis rate constants are seeded with literature activation energies. The purpose of this work is to develop and validate a compact, physically interpretable model that unifies Fickian diffusion, reversible hydrogen bonding and irreversible hydrolysis into a single predictive framework. As a result, our model delivers absorbed and reacted-water profiles that can be fed directly into risk assessment analysis, preserves physical meaning that allows confident extrapolation to service temperatures and provides a diagnostic tool for separating recoverable plasticisation from permanent chemical degradation, thereby guiding resin formulation and protective strategies.

2. Methods

In this section we describe the preparation of four epoxy networks samples massively employed in glass-fibre-reinforced high-pressure tubing currently in service. We then describe the experimental setup for gravimetry experiments at different temperatures. Finally, the three-contribution model that couples Fickian diffusion, adsorption kinetics through hydrogen bonding site saturation and an irreversible hydrolysis term fitted across all conditions with global Arrhenius parameters is also described in detail. Together, these procedures introduce a fitting protocol that combines gravimetry, in situ FTIR spectroscopy and DFT-derived hydrogen bond energies to resolve Fickian, bonded and hydrolytic contributions across multiple epoxy chemistries.

2.1. Materials

In every case the base resin was DER® 383 (Dow Chemical, Buenos Aires, Argentina), a diglycidyl ether of bisphenol A (DGEBA) with an epoxy-equivalent mass of 174.3 g mol−1. The systems were selected by taking into account their base formulation: two anhydride-based systems with curing agents: (1) Lindride® 36 K, methyl-tetrahydrophthalic anhydride (supplied by Lindau Chemicals, Columbia, SC, USA, and pre-catalysed with benzyl-trimethyl-ammonium chloride, Merck, Buenos Aires, Argentina) and (2) Dicure® 319, methyl-tetrahydrophthalic anhydride from Novarchem, Buenos Aires, Argentina [14]; and two amine based systems with curing agents: (1) Ancamine® Y, an aromatic diamine blend of 4,4′-diaminodiphenylmethane and methylenedianiline (Air Products, Buenos Aires, Argentina) and Jeffamine® D-230, an aliphatic poly (propylene-oxide) diamine (gently supplied by Huntsman, Buenos Aires, Argentina) [28,29].
All formulations were prepared at stoichiometric balance (r = epoxy/active hydrogen = 1), thoroughly degassed, poured into silicone moulds and cured at 100 °C for 2 h, followed by a post-curing to ensure complete conversion. After slow cooling to room temperature, the plates were conditioned for at least 48 h in a desiccator before machining.

2.2. Gravimetry

Rectangular-shaped coupons were machined from cast plates of each formulation, their thicknesses (h) were recorded with a micrometre and the specimens were dried under vacuum at 60 °C until successive weightings differed by less than 0.5 mg. Initial masses m0 were then taken on a calibrated analytical balance. Five replicate specimens were tested per condition, providing statistically robust averages for subsequent parameter extraction.
Water uptake was followed gravimetrically by full immersion in sealed glass vessels containing de-ionised water held at temperatures ranging from 8 to 93 °C in temperature-controlled baths. At predetermined intervals the samples were removed, gently blotted with lint-free tissue, weighed within 30 s (the mass was recorded) and re-immersed. The measurement schedule was denser during the first 200 min1/2 mm−1, when diffusion dominates, and progressively widened as the experiment proceeded; the longest runs extended more than 800 min1/2 mm−1, corresponding to more than one year. Mass gain was expressed as Mt = 100∙(mt − m0)/m0 (%) and plotted against the reduced time x = t1/2/L (L = thickness/2) to remove thickness dependence that appears in Fick’s solution for a plane sheet. General gravimetric results (water uptake as a function of reduced time x) for all four epoxy systems are shown in Figure 1.

2.3. Water Absorption Model

The sorption curves were modelled with a three-contribution approach that resolves the total mass gain into physically distinct contributions. The governing expression superposes (i) a Fickian term that captures single-molecule diffusion through the free volume, (ii) a bonded water term whose rate constant describes the progressive filling of polar sites and (iii) a hydrolysis contribution. The exponent 1 < α < 2 accommodates the autocatalytic acceleration frequently observed once chain scission liberates additional hydroxyl groups (see Table 1).
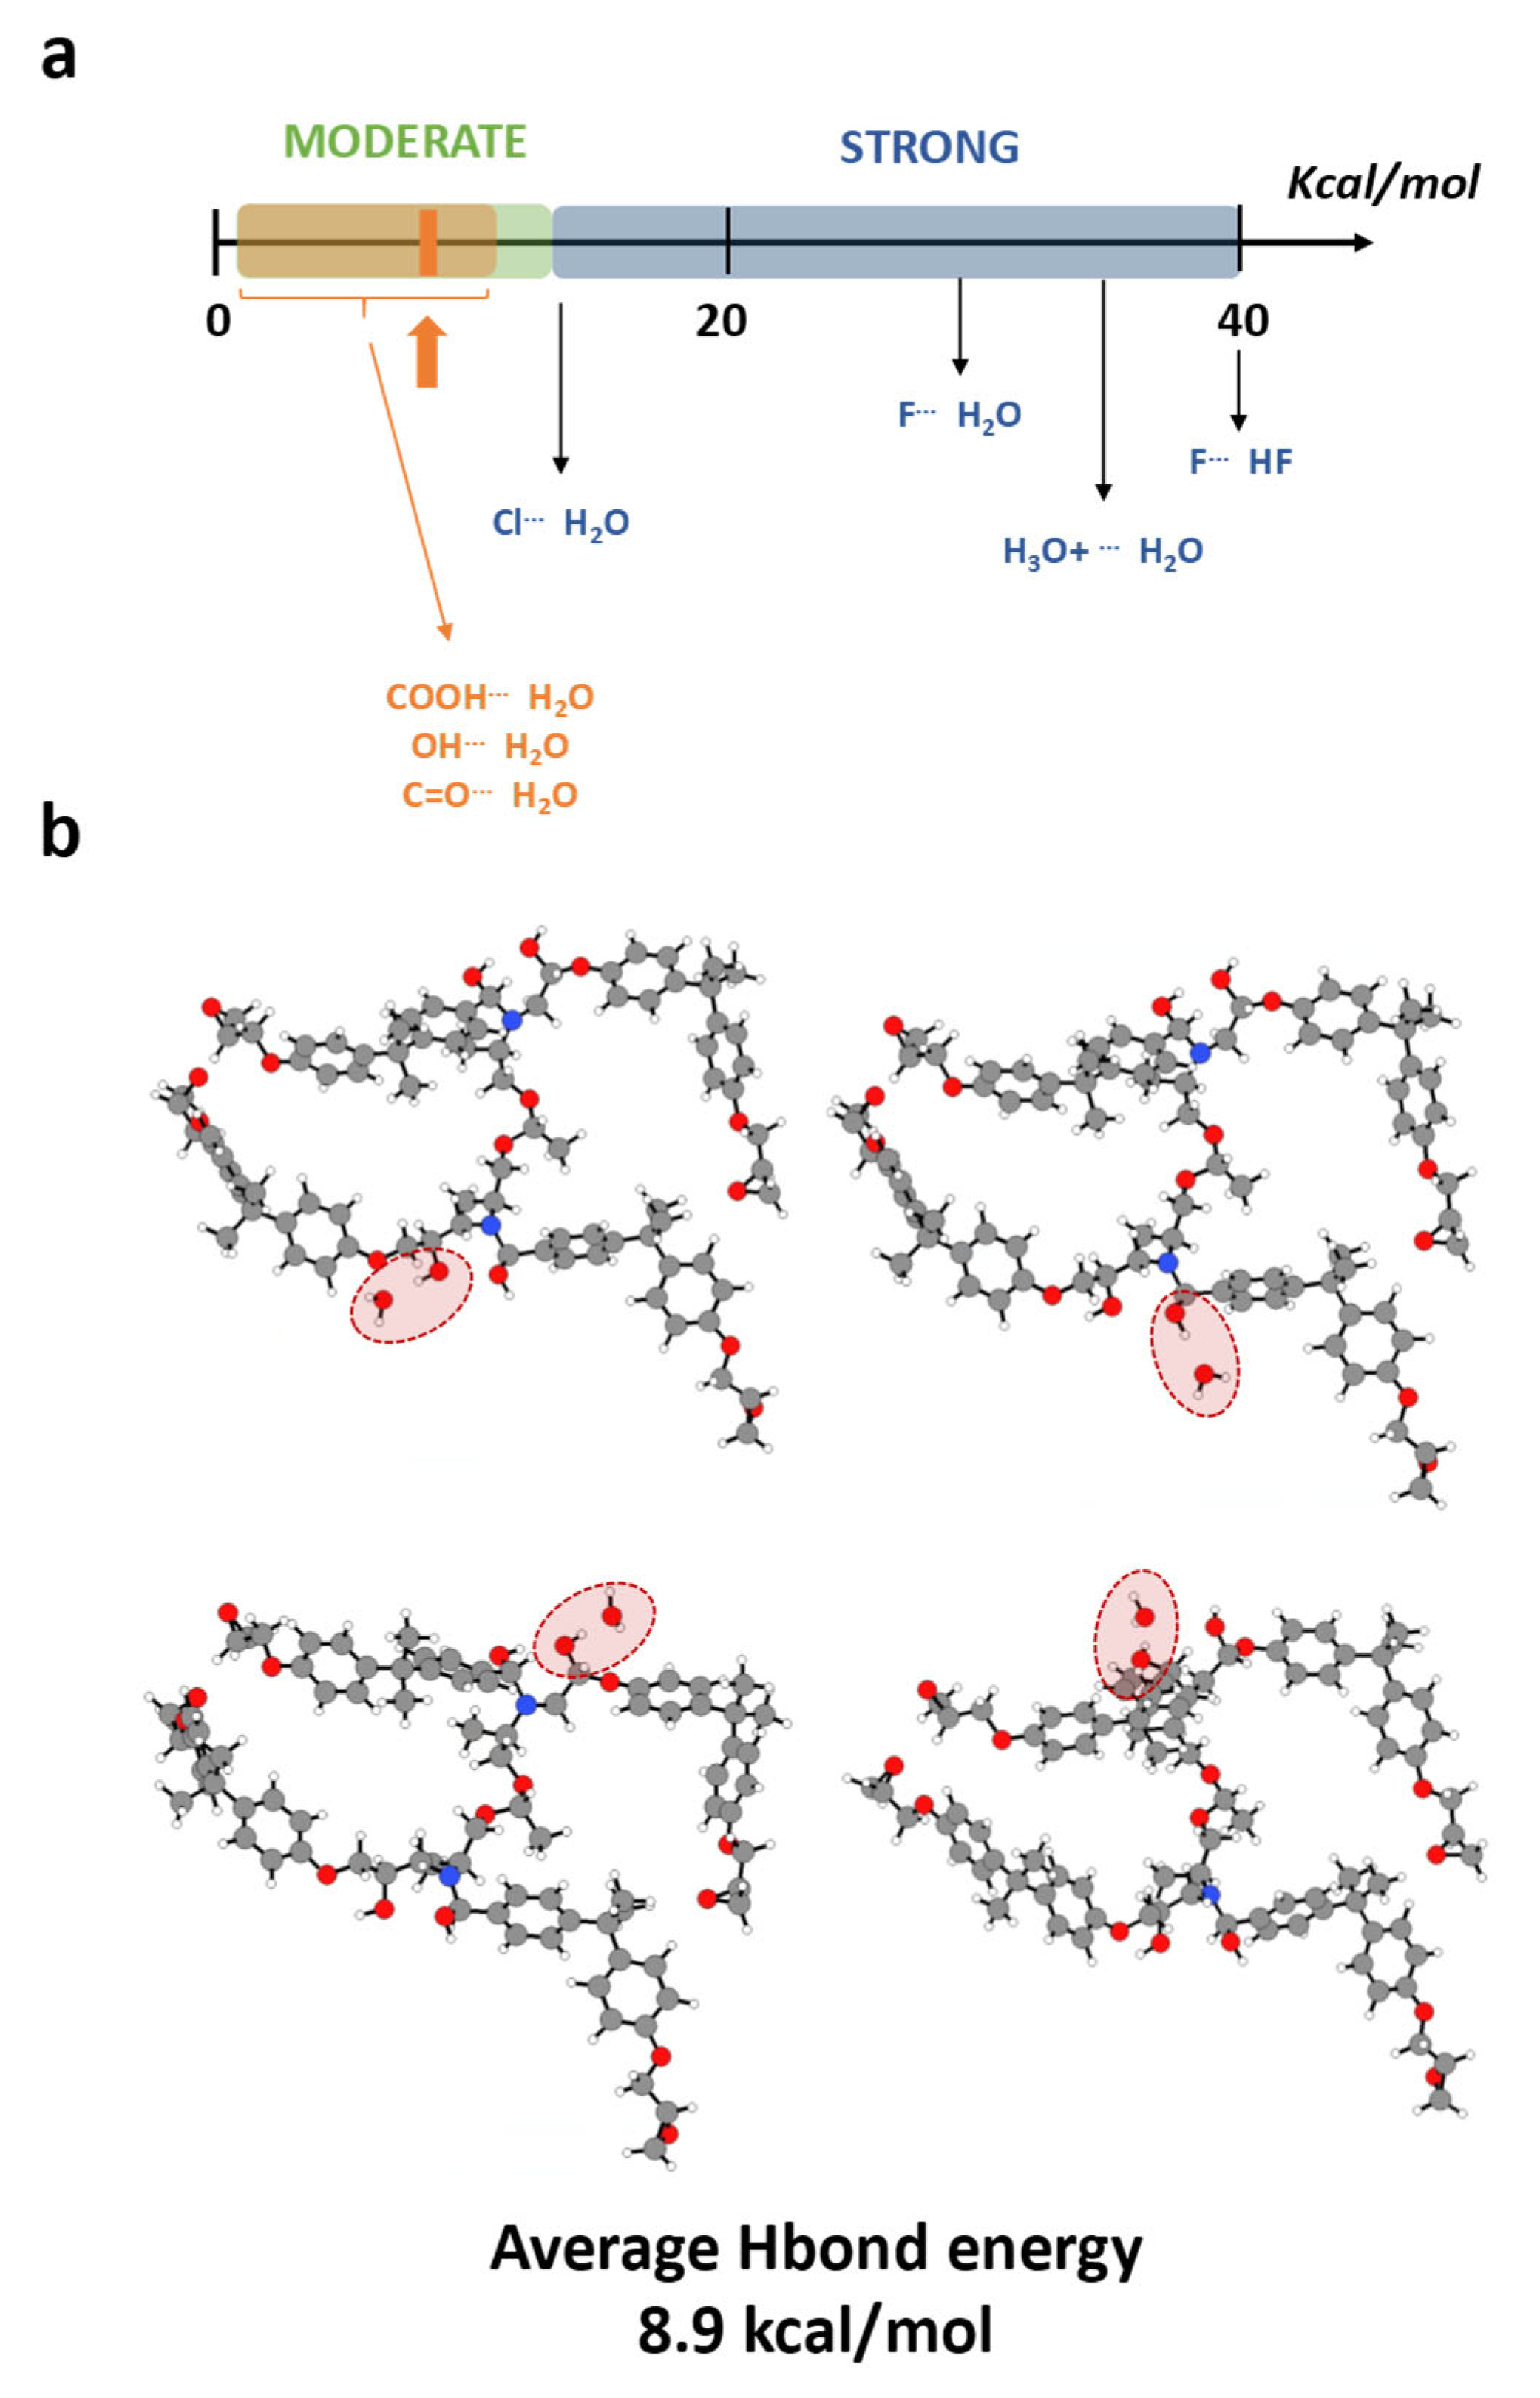
Simultaneous non-linear least-squares fitting of all temperatures is performed with a flattened residual vector, allowing the kinetic prefactors D0 and B and the activation energies EaD and Eab (see typical values found in literature in Figure 2) and Ea to be treated as global material constants, while the mass absorption plateau values remain curve-specific to account for variations in surface finish and free-volume content across specimens. The hierarchical identification procedure begins by extracting the diffusion coefficient from early times segment, then refines the bonded contribution parameters on the concave-down shoulder, and finally adjusts K and α to reproduce the long-time, concave-up tail.
Initial guesses for Ea are taken from the 18–21 kcal mol−1 range reported for anhydride cleavage [18]; those for EaD and Eab are seeded at 3 and 8 kcal mol−1 (respectively) in line with values in epoxies (see Figure 2). All parameters are then refined in the global regression. The optimisation was carried out in Python 3.11 using SciPy’s least squares (method = “trf”, max_nfev = 20,000). We concatenated the residuals of every temperature into a single residual vector, enforcing shared (global) Arrhenius parameters across the full dataset. Fitting quality was evaluated through R2, RMSE and normalised RMSE for every curve, and automatic decomposition plots were employed to show the relative weight of the three mechanisms at each temperature. Since the rate constants share an Arrhenius temperature dependence that is extracted from the full multi-temperature dataset, the resulting parameter set extrapolates to intermediate temperatures without further experiments and can be used directly in any other calculations. The combined procedure therefore outputs the short-time diffusion constant driving the Fickian term, the reversible pseudo-equilibrium uptake from the sorption component and the irreversible mass increment that fixes the hydrolysis term, providing a coherent, physically transparent input package for service-life forecasting.
In Section S1 of the Supplementary Information, a sensitivity analysis shows how the Fickian parameters prevail in the early stage of the process, followed by sorption parameters in intermediate times and in the final phase, reaction parameters dominate (see Figure S1).

3. Results and Discussion

In this section we compare the water absorption behaviour in two classes of neat epoxy networks: epoxy-amine and epoxy-anhydride. The gravimetric results are modelled using a three-component approach, in turn validated through complementary FTIR evidence. We first analyse the reversible sorption exhibited by DGEBA-Jeffamine and DGEBA-Ancamine systems, and then examine the additional hydrolytic contribution observed in DGEBA-Lindride and DGEBA-Dicure.
  • Epoxy-amine networks: no hydrolysis (DGEBA-Jeffamine and DGEBA-Ancamine)
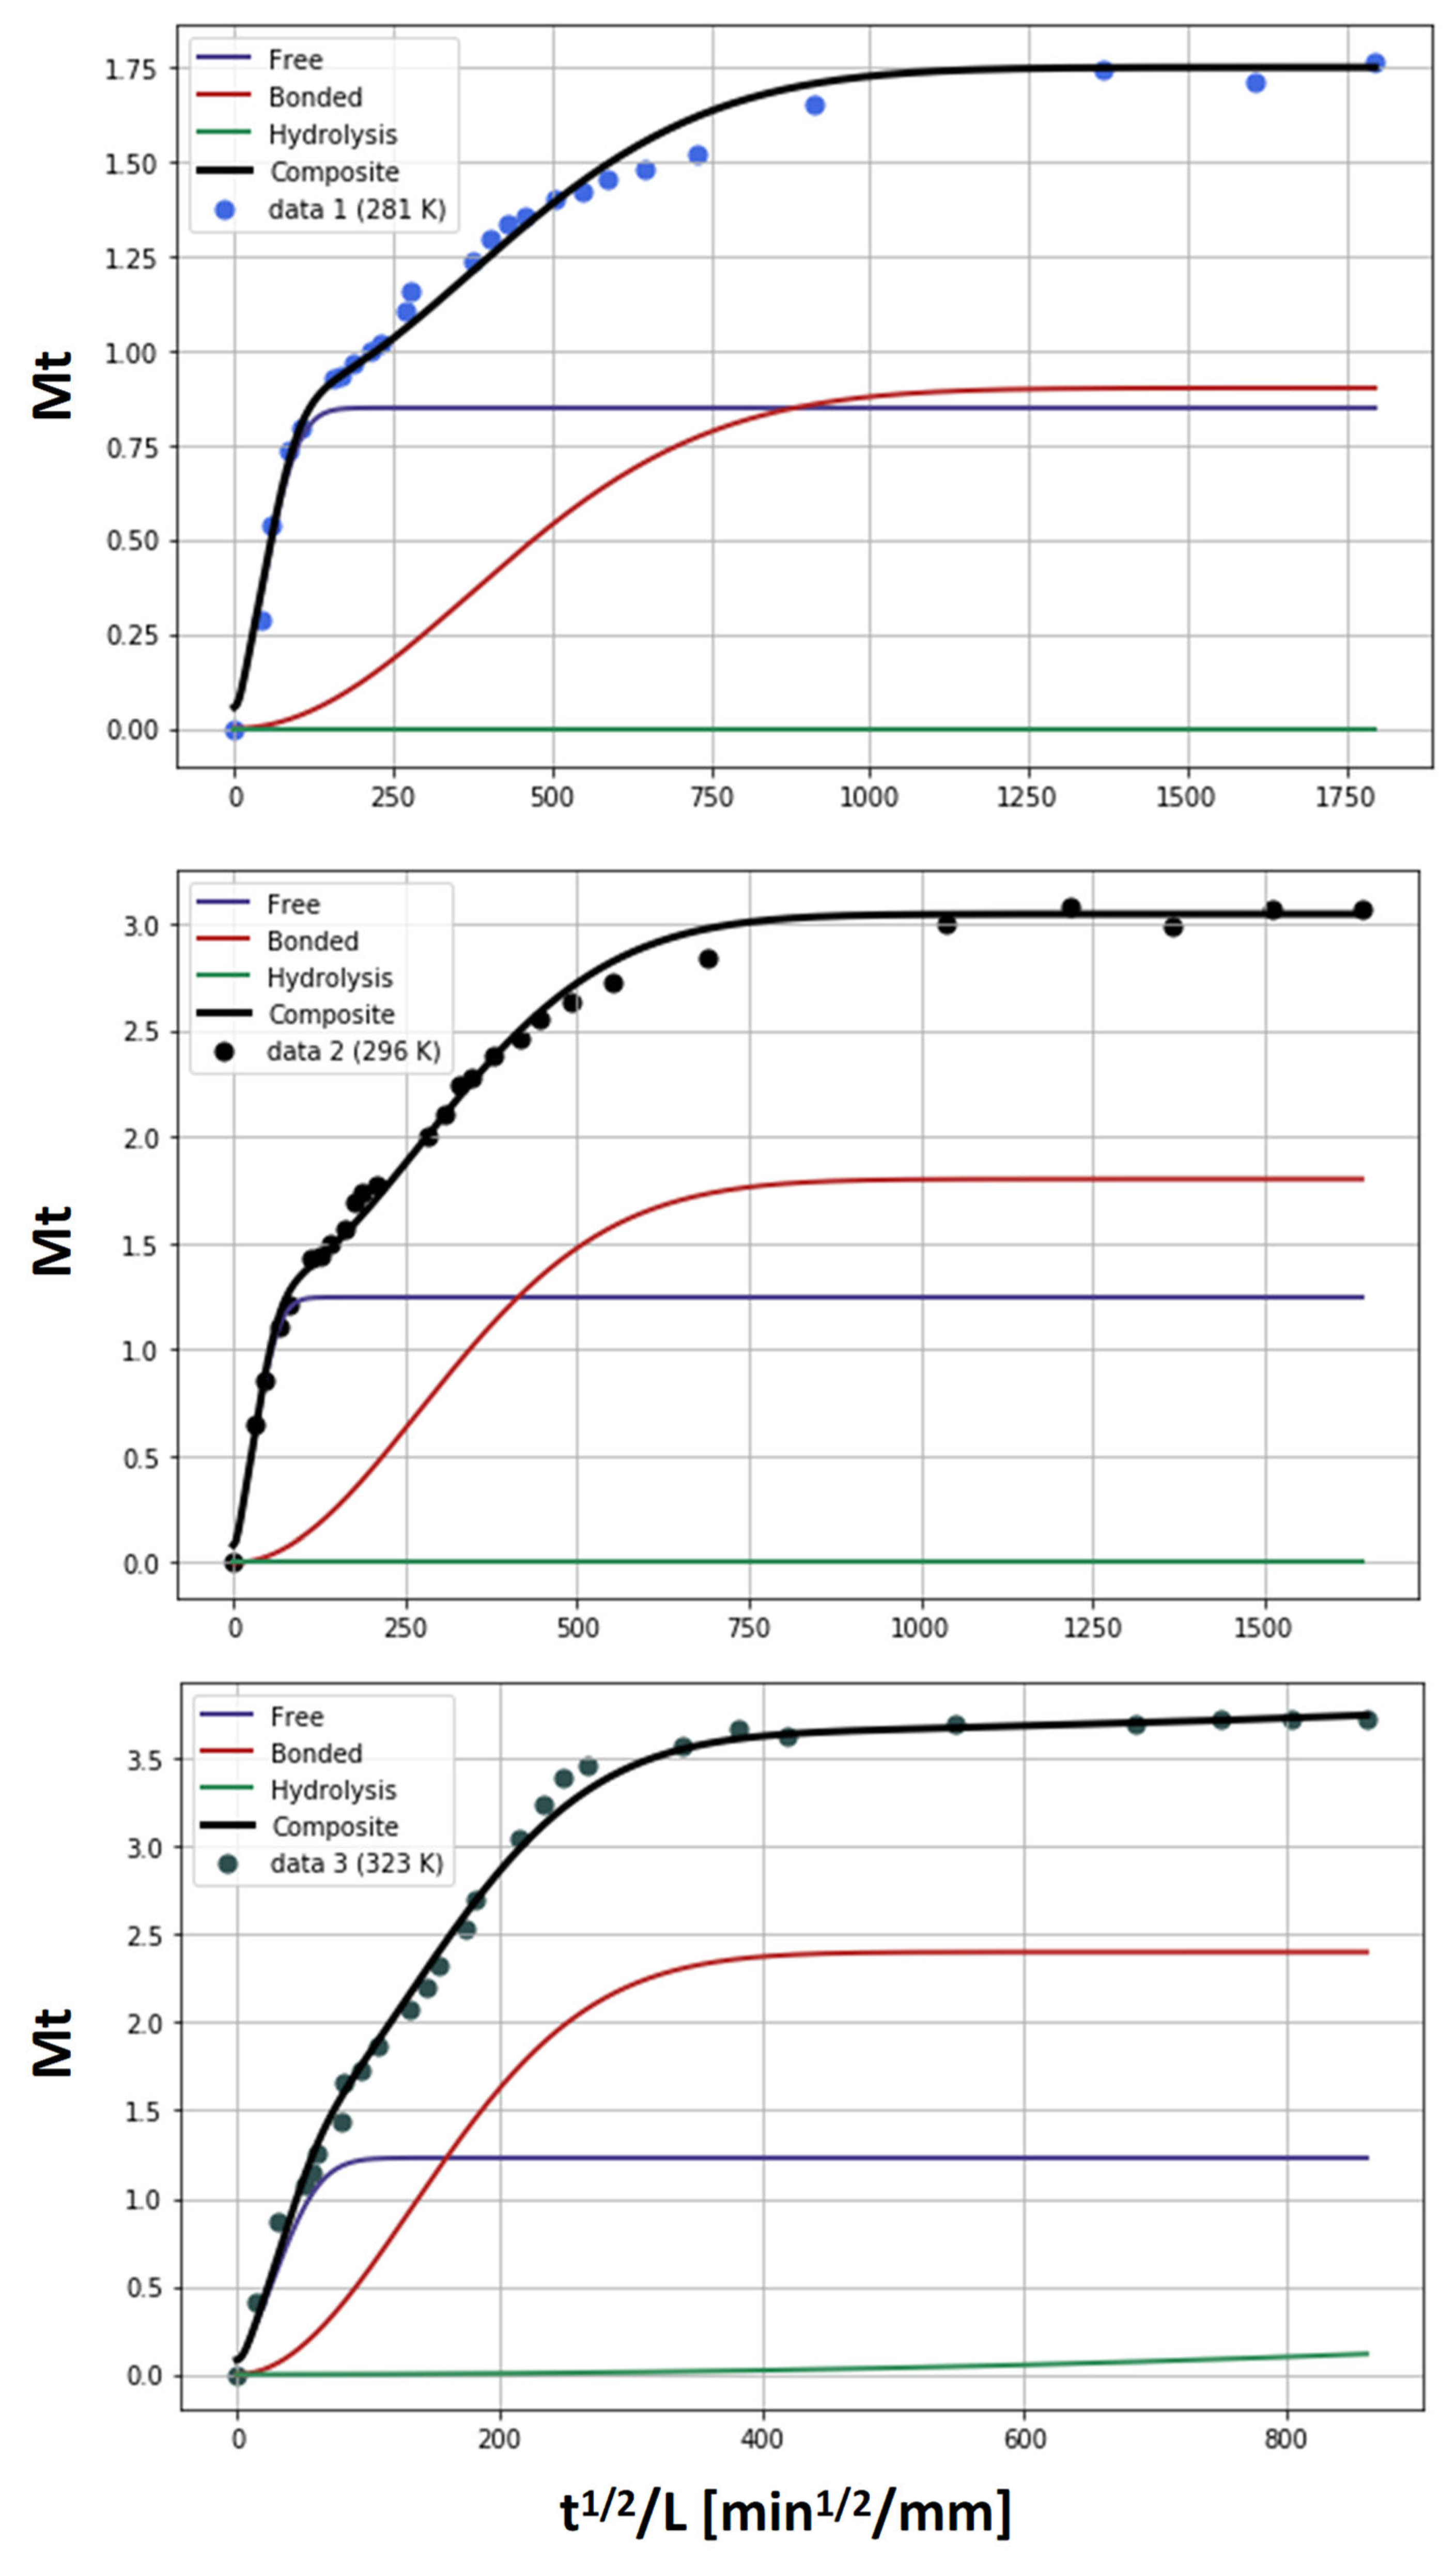
Epoxy-amine chemistries are polar enough to absorb water, yet they show resistance to hydrolysis. As a result, the here studied aromatic and aliphatic amine networks display the typical two-stage uptake curve in which a rapid Fickian knee is followed by a modest sorption shoulder [3,37]. Therefore, water uptake is the result of free water diffusion through the micro-void network, and a saturation of specific polar sites (sorption). Figure 3 shows water uptake as a function of the reduced time (x) for the DGEBA-Jeffamine materials. Both free and bonded water contents increase as the temperature increases, and even at large × values no signs of hydrolysis are observed. Fits performed over the full temperature range reproduce both contributions and no additional mechanism is required once hydrolysis is ruled out.
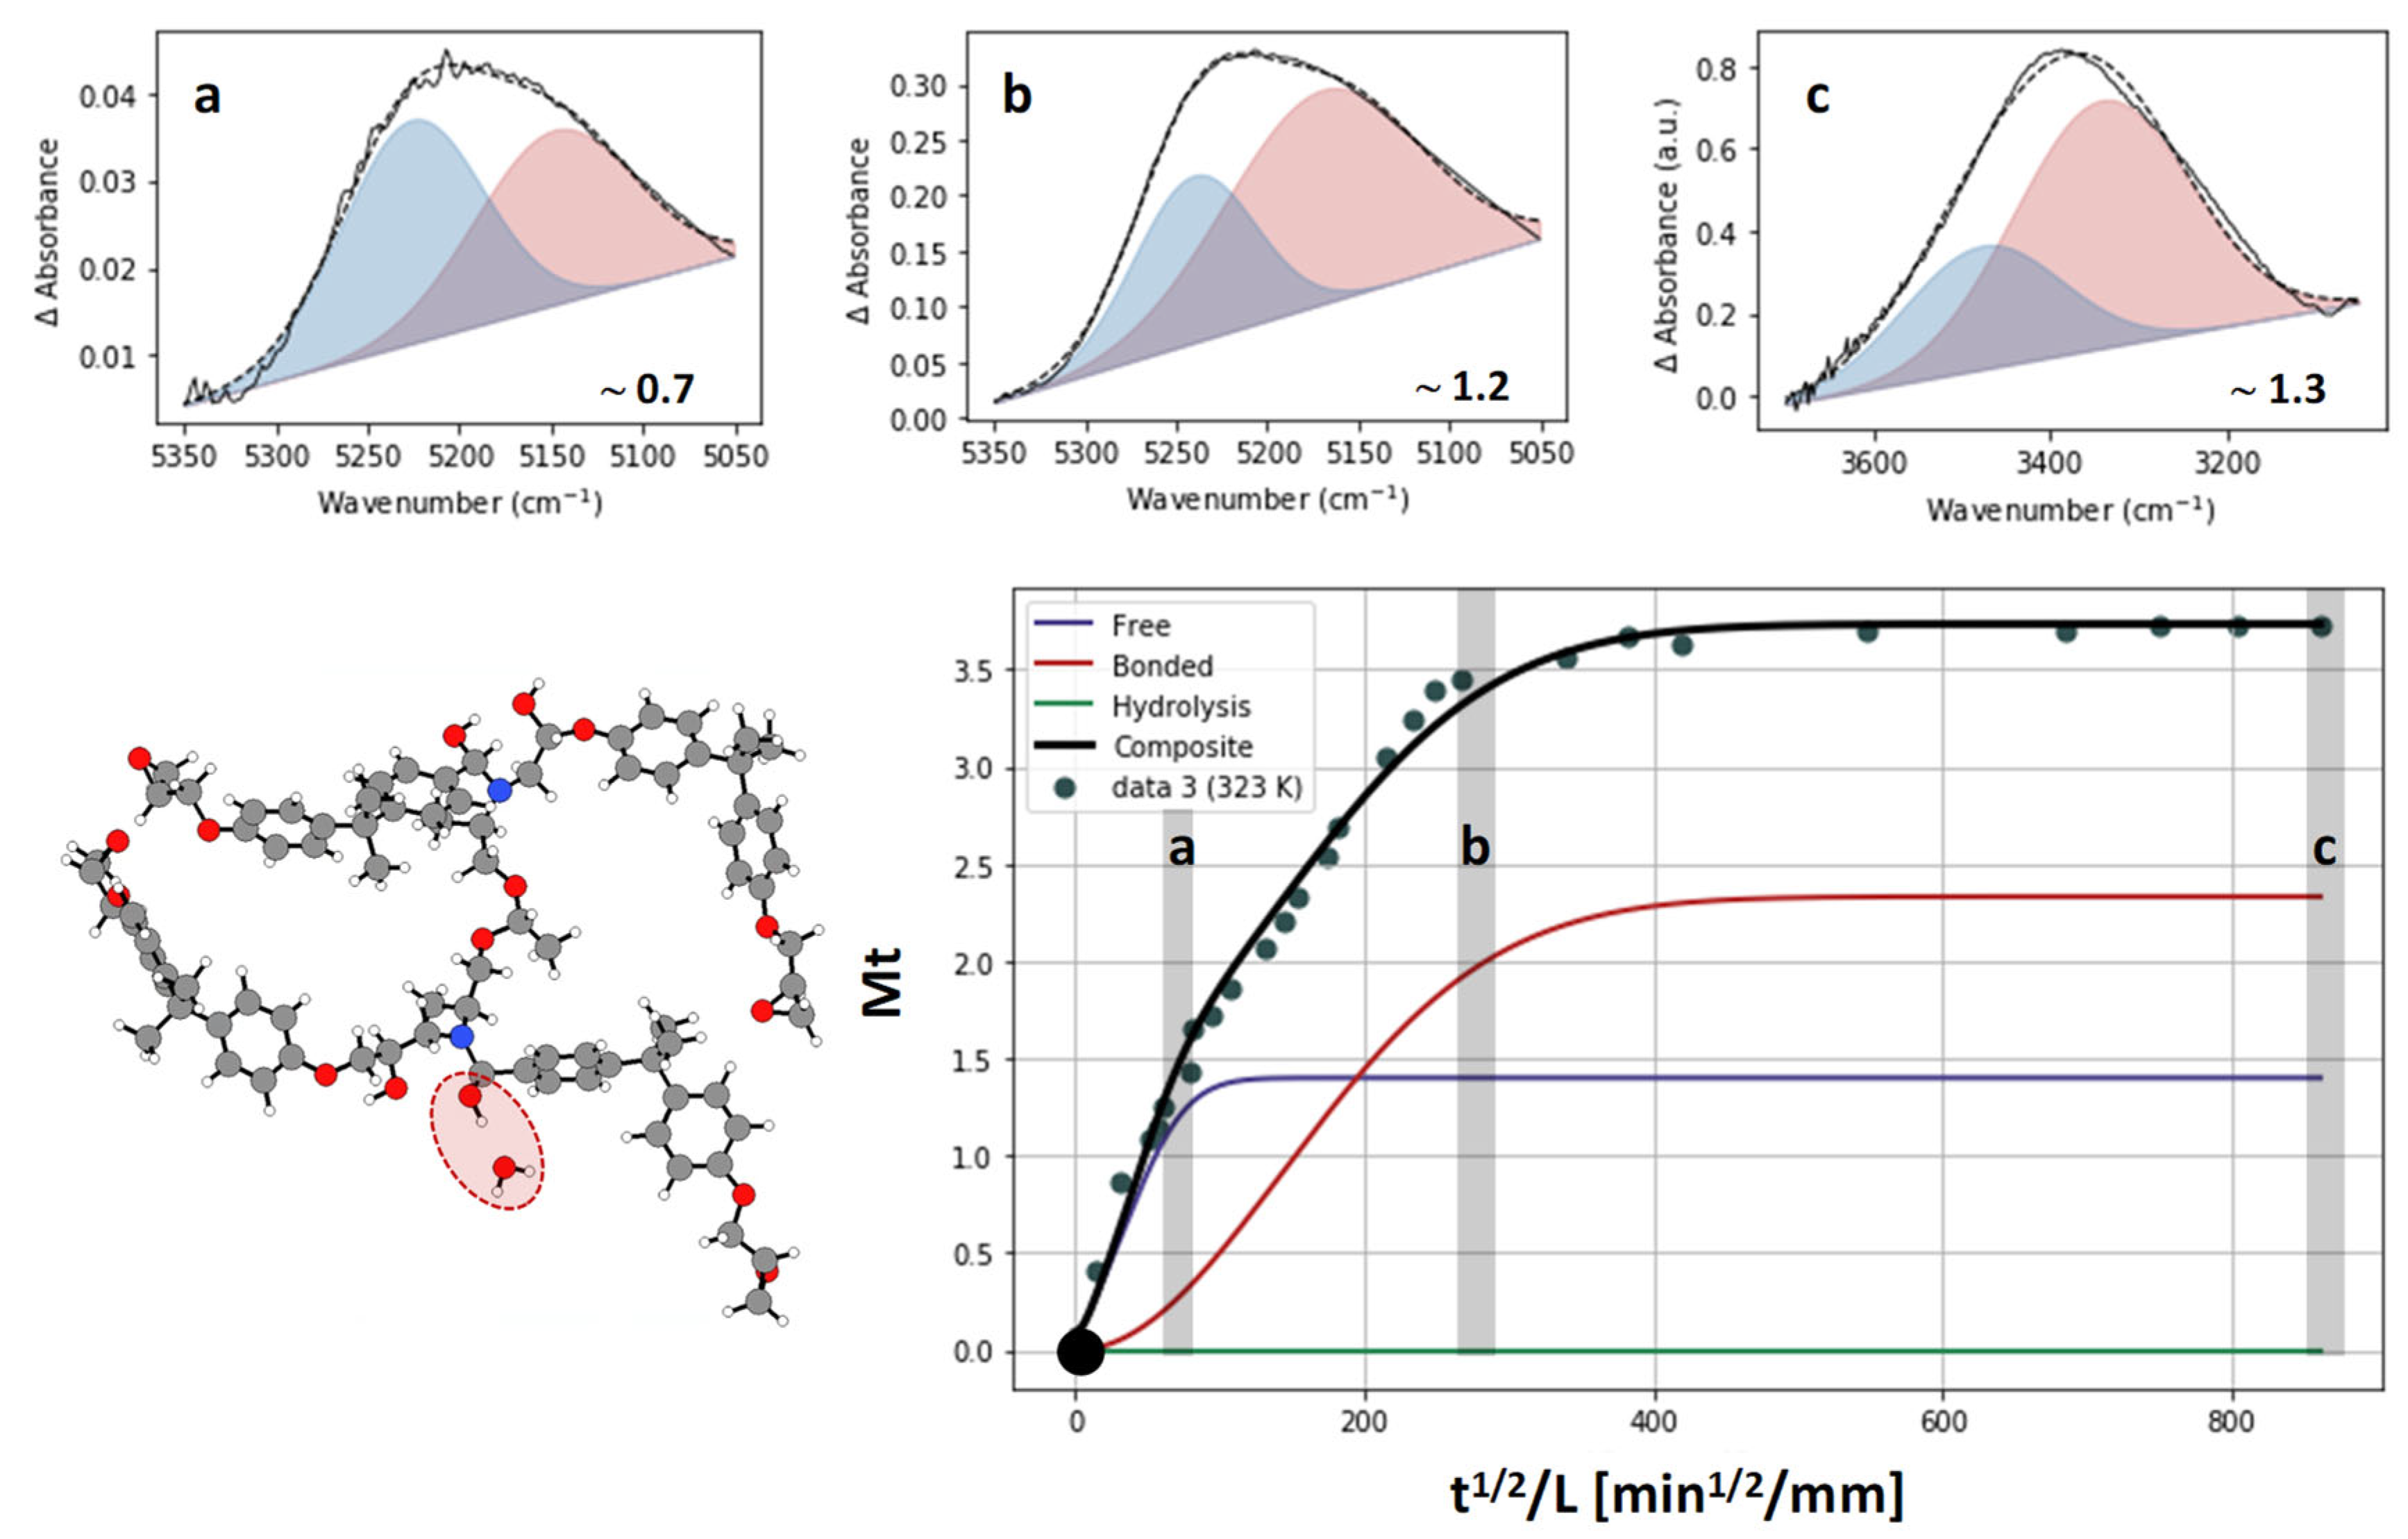
The fitting results of free and bound water closely align with the infrared evidence. FTIR spectra collected in situ reveal a progressive broadening and red-shift of the O-H stretching band, whose deconvolution into high- and low-wavenumber components maps onto the modelled free and bonded fractions, respectively. In particular, the O-H stretching vibration shifts to lower wavenumbers upon hydrogen bond formation, and the band becomes broader and more intense. The OH stretching band around 3400 cm−1 in the IR spectra for liquid water is broad and has been reported to be composed of two to four components [38,39]. The OH stretching frequency was reported to decrease with decreasing hydrogen bond distance among water molecules. Therefore, higher and lower wavenumber components in the OH band correspond to longer and shorter hydrogen bond components, respectively. The longer H bond component is often called “free water,” while the shorter H bond component is known as “bound water” [39,40,41]. Figure 4 shows these signals (both MIR and NIR) at three different points of the absorption process (full time evolution of FTIR spectra can be seen in Figure S2). The dry FTIR spectra has been used as reference, and two peaks have been employed to deconvolute the signal. The shoulder around 5200 cm−1 in the NIR region, assigned to the first overtone of O–H stretching, splits into two sub-bands whose integrated areas track the time-resolved sorption allocation (Figure 4a,b). Simultaneously, the ν(O–H) peak near 3400 cm−1 broadens asymmetrically towards lower wavenumbers without generating new carbonyl or ether signatures (Figure 4c). The superposition of spectroscopic and mass data thus validates the purely reversible interpretation adopted for epoxy-amine networks. These results show that in absence of hydrolysis, the observed peak areas ratio closely correlates free and bonded water content predictions. Analogous results can be appreciated for water absorption fitting in DGEBA-Ancamine system in Section S3 of the Supplementary Information. Figure S3 shows the water uptake comparison between experimental data, contribution models and sum of contributions, and Figure S4 exhibits the model parameter’s values.
  • Absorption with hydrolysis (DGEBA-Lindride and DGEBA-Dicure)
Immersion of the anhydride-cured networks reveals a three-stage trajectory: diffusion, sorption and a late-time, concave-up tail that cannot be reconciled with reversible mechanisms alone. The scission of epoxide-derived ester or anhydride rings is the dominant route by which water becomes irreversibly bound in epoxy networks, and its mechanistic details provide physical meaning to the power-law term in the model. Kinetic studies on model oxiranes show that protonation of the ring oxygen is followed either by a water attack that preserves charge order (A-2 pathway) or by ring opening to a carbonium ion that is subsequently captured by solvent (A-1 pathway) [18,42]. Activation energies cluster around 19 kcal mol−1, but the sign of the activation entropy distinguishes the two routes: ordered, water-assisted A-2 reactions exhibit negative entropies, whereas the looser unimolecular A-1 process shows positive values. These insights explain why irreversible mass gain accelerates after an induction period in bulk resins: once the first scission events generate additional hydroxyl and carboxyl groups, local acidity rises and the reaction shifts toward the faster, autocatalytic branch. Thus, the exponent between one and two in the power-law term indicates that product formation helps drive further reaction (a condensed way to capture autocatalytic growth without over-parameterising). FTIR observations confirm that the irreversible mass gain recorded for the anhydride network truly originates from chain scission rather than from slow sorption alone [43]. First, bulk NIR spectra display the water band at ~5250 cm−1; at up to ~1.5% gravimetric uptake, its area increases linearly with mass, showing that all added weight is physically absorbed water. Beyond that point the gravimetric curve continues to rise while the NIR water band falls below the linear trend, indicating that a growing fraction of the incoming water is consumed by the reaction and thus not registered by the NIR band. Second, MIR of low-molar-mass extracts shows a clear chronology: during the first stage (≤~1.5%) only aromatic and ether signatures of residuals are apparent, whereas as the bulk mass gain rises into the second stage, a new band at ~1710 cm−1 appears, characteristic of carboxylic acids, and the spectra resemble that of a hydrolysed anhydride reference, providing evidence that hydrolysis products form and leach out. Finally, at 93 °C, the bath pH drops steeply when the mass-change rate peaks, corroborating that acidic hydrolysis products migrate into the water rather than remaining trapped in the network.
The results of our model’s application to DGEBA-Dicure gravimetric data (filled dots) are shown in Figure 5, where blue, red and green lines represent Fickian, Sorption and Hydrolysis contributions, respectively. The black line represents the sum of contributions, which as shown closely describes the experimental data. Results for DGEBA-Lindride can be found in Section S4 in the Supplementary Information where Figure S6 compares the experimental and modelled water uptake curves.
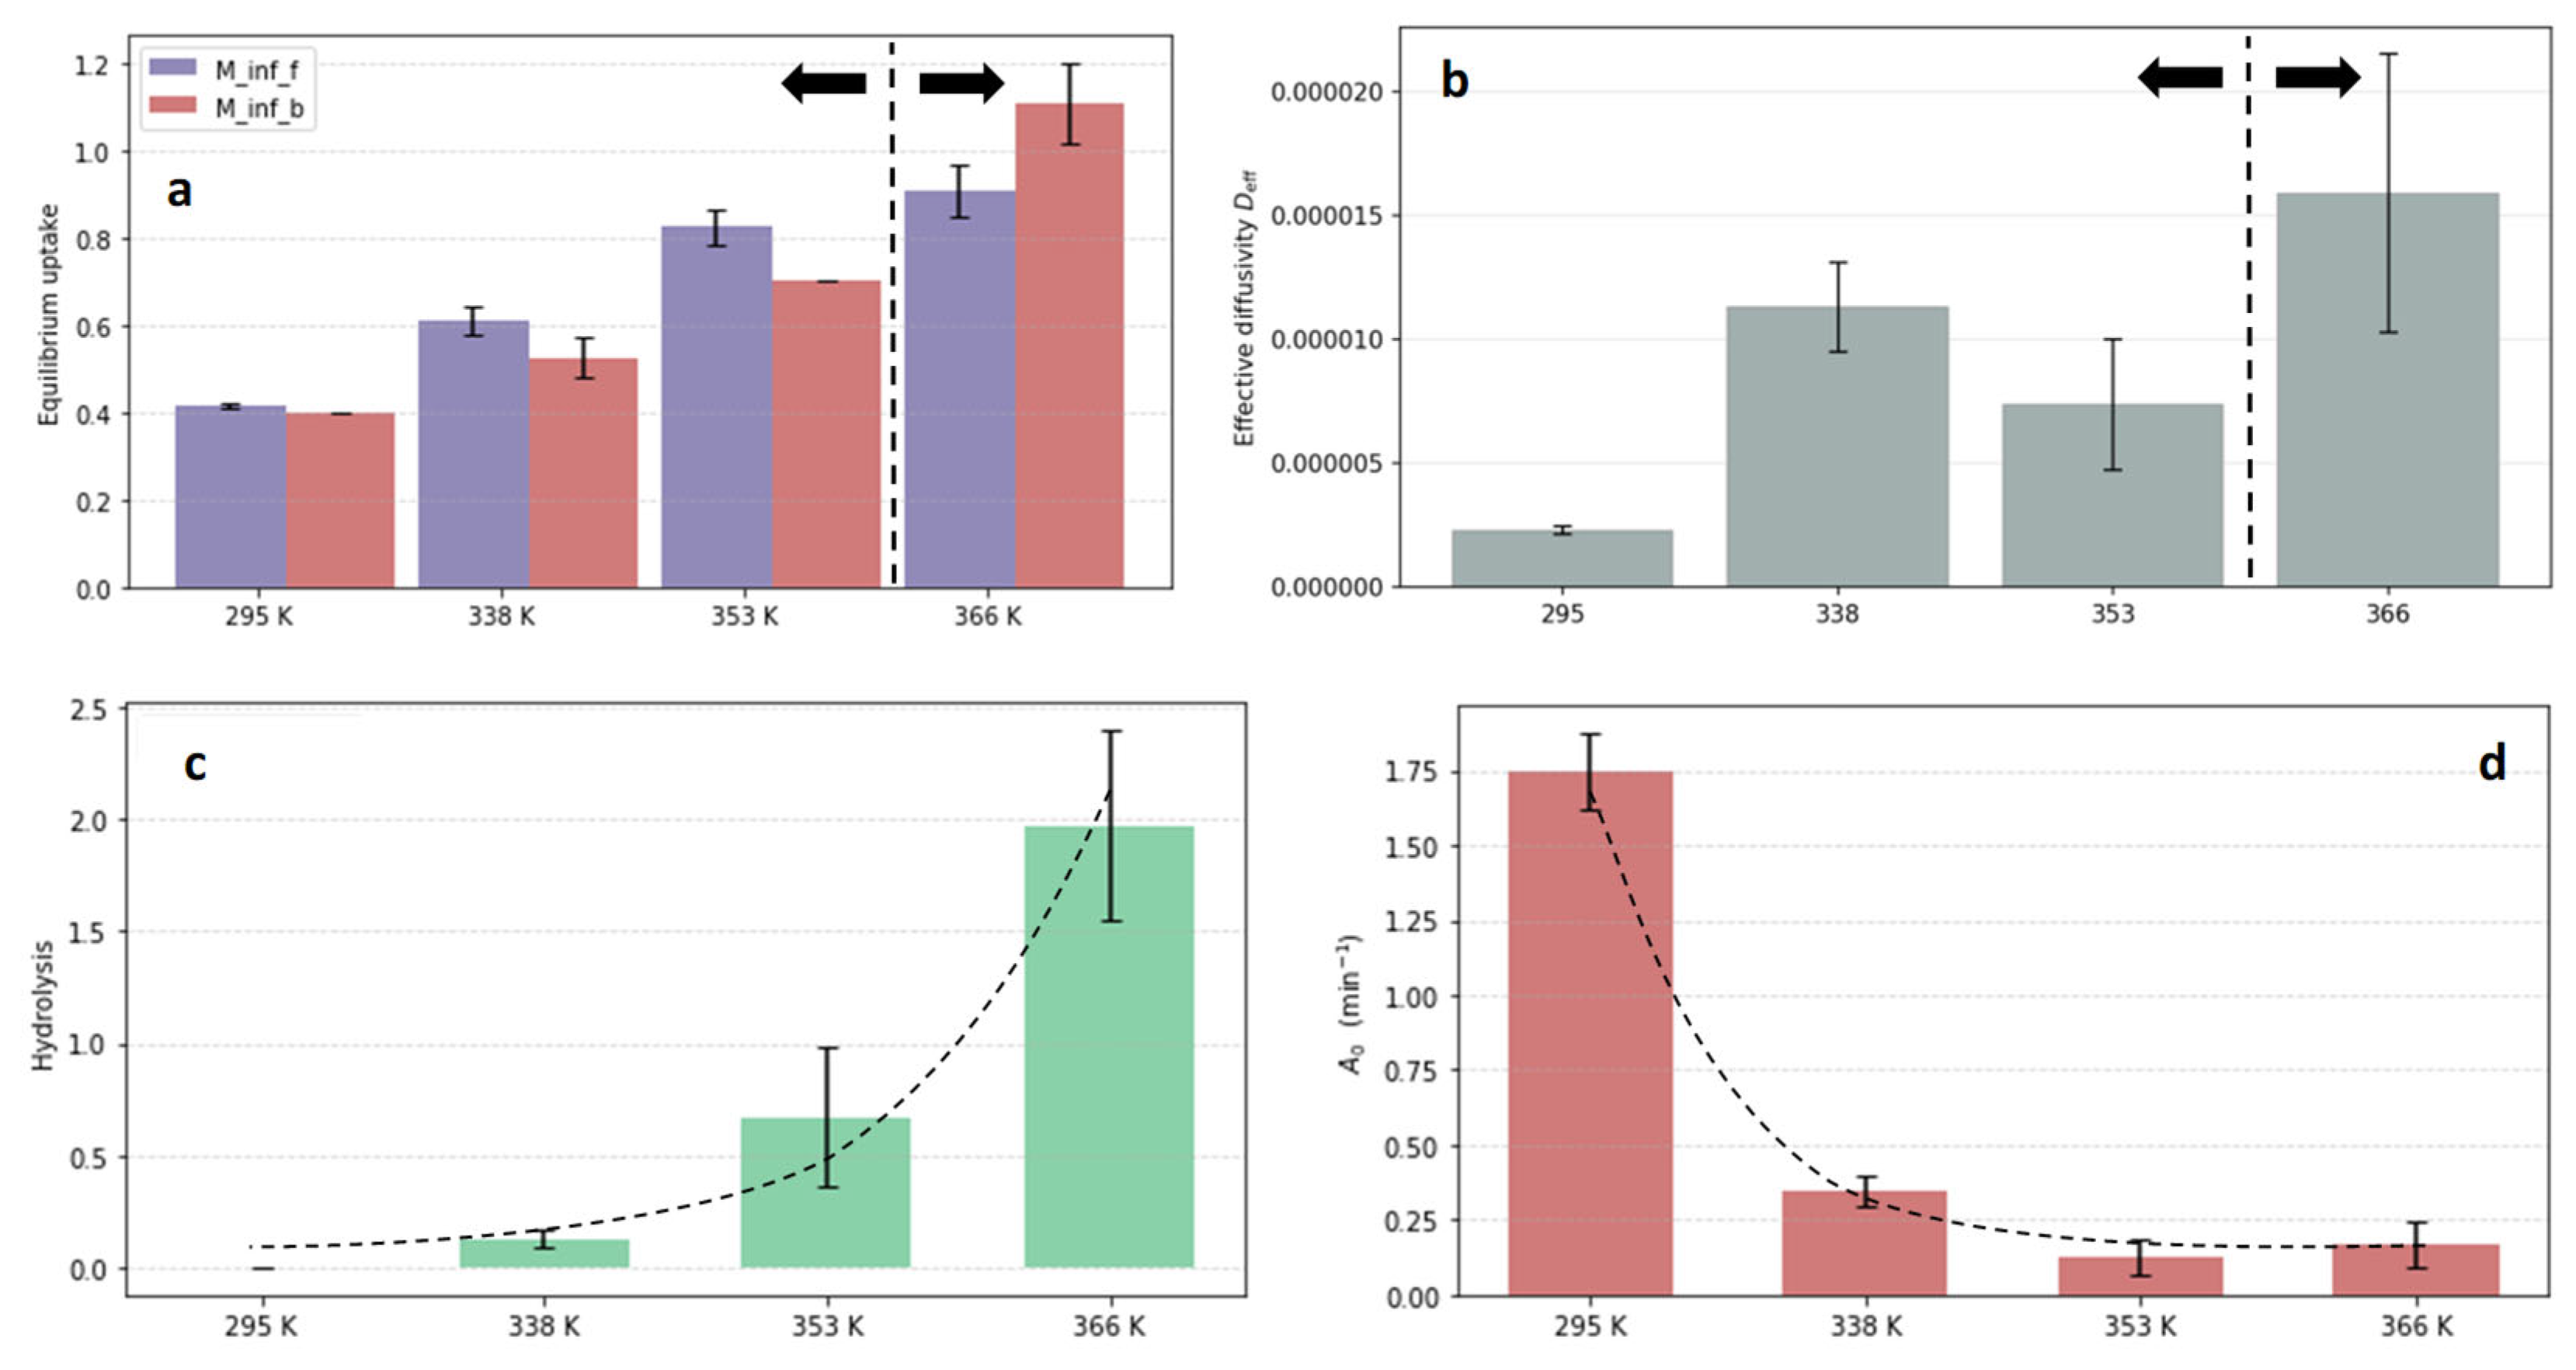
Fitting results are summarised in Figure 6, where the equilibrium uptakes, Deff (early-time effective diffusivity), sorption and hydrolysis parameters are shown as bar plots. In both anhydride networks, Deff increases with temperature yet remains of the same order between chemistries, consistent with transport being controlled primarily by free-volume and segmental mobility rather than specific chemistry (this is also valid for amine-based chemistries). By contrast, the free- and bound-water plateaux (M∞,f and M∞,b) rise with temperature due to progressive plasticisation and thermally activated occupation of polar sites. This effect is more pronounced at Mt values larger than 1.5%, where the plasticisation effect becomes really important (the larger mobility also increases the availability of polar sites, therefore increasing bonded contribution). The glass transition temperature of the samples confirms this statement, as evidenced by the Tg drop after the vertical dashed line for Mt > 1.5 in Figure S7 for the DGEBA-Dicure system. The distinctive signature of the anhydrides is the reaction term. The hydrolysis prefactor K(T) (and the reacted-water increment) grows steeply with temperature, and the extracted activation energy (≈20 kcal mol−1) matches literature values for anhydride/ester cleavage, supporting the physical fidelity of the fit. The late-time acceleration is captured by α > 1, reflecting autocatalysis once initial scission generates additional hydroxyl and acid groups that increase local acidity and further promote bond cleavage. FTIR corroborates this picture: the progressive loss of the anhydride carbonyl at ~1771 cm−1 [43] and the divergence between the NIR water band and the gravimetric mass at long times (see Figure 7) show that a growing fraction of incoming water is consumed by the reaction rather than stored reversibly. Consequently, in anhydrides the NIR “free/bound” decomposition ceases to be accurate at later stages because water is consumed and new OH arises from hydrolysis products (see Section S6).
According to our results, if a container or duct with a 1 cm thick wall was exposed to pure water during service, it would take ~29 years to reach 0.5% from degradative hydrolytic processes at 65 °C (with a total water absorption of 1%). In contrast, the same accumulation of water from hydrolysis would take ~19 years at 80 °C (with a total absorption of 1.25%), and just over a year and a half at 93 °C (with a total absorption of 1.08%, therefore dramatically increasing catastrophic failure chances much sooner in comparison). In summary, the proposed model closely correlates experimental gravimetry and spectroscopy results across four representative networks, distinguishing reversible plasticisation from permanent chemical degradation. The insights gained this way therefore contribute to more reliable forecasts of water uptake and property evolution in epoxy infrastructures exposed to different hygrothermal conditions.

4. Conclusions

A systematic 2 + 2 comparison of amine- and anhydride-cured DGEBA networks has shed light on the reversible and irreversible aspects of water uptake in epoxies. Gravimetric and spectroscopic evidence confirms that amine matrices experience only a reversible two-stage process, whereas anhydride matrices add a hydrolytic stage that steadily consumes ester carbonyls and erodes crosslinking. These observations validate our three-contribution approach: (i) Arrhenius Fickian diffusion through nano-voids, (ii) Sorption occupation of polar sites and (iii) a reaction-limited power-law term for hydrolysis.
Our fitting scheme, seeded with literature and density functional estimates of hydrogen bond energy and literature activation energies for ester cleavage, successfully reproduces full uptake curves for all four networks. The parameters retain clear physical meaning, enabling confident extrapolation across temperatures (8–93 °C) without re-calibration. While the early stage of water uptake in these epoxies follows classical Fickian diffusion, our results demonstrate that the later stages are governed by the sequential transition from reversible sorption to irreversible hydrolysis. The three-term model thus provides a general description of the full sorption trajectory, linking molecular-scale hydrogen bonding to macroscopic degradation behaviour. Therefore, our model allows designers to distinguish recoverable water plasticisation from permanent chemical degradation on the fly. It also offers a diagnostic tool for ranking new resin formulations or barrier coatings by separately quantifying the contributions of diffusion, specific binding and hydrolysis. Future work will extend the approach to fibre-dominated laminates, multi-phase toughened systems and accelerated ageing protocols, aiming ultimately at a unified, chemistry-aware predictive platform for water-driven damage in critical epoxy infrastructure.

Supplementary Materials

The following supporting information can be downloaded at https://www.mdpi.com/article/10.3390/app152211857/s1, Figure S1: Fractional variance of each model parameter for different reduced times. Figure S2: FTIR spectra of thermosetting samples immersed in water. Figure S3: Comparison of the gravimetric experimental data with model curves for DGEBA–Ancamine thermoset. Black solid line corresponds to the sum of the model contributions. Figure S4: Parameters values for the Fick and Sorption contribution models as a function temperature. Figure S5: Comparison of the gravimetric experimental data with model curves for DGEBA–Lindride thermoset. Figure S6: Parameters values for the Fick, Sorption and Hydrolysis contribution models as a function of temperature. Figure S7: Glass transition temperature as a function of water content.

Author Contributions

Conceptualization, L.A.M.; methodology, L.A.M., M.E.P., G.C. and P.E.M.; software, L.A.M.; validation, M.E.P., G.C. and P.E.M.; formal analysis, L.A.M., M.E.P., G.C. and P.E.M.; investigation, L.A.M., M.E.P., G.C. and P.E.M.; resources, L.A.M., M.E.P., G.C. and P.E.M.; data curation, L.A.M., and G.C.; writing—original draft preparation, L.A.M.; writing—review and editing, L.A.M., M.E.P., G.C. and P.E.M.; visualization, L.A.M., M.E.P., G.C. and P.E.M.; supervision, L.A.M. and P.E.M.; project administration, L.A.M., M.E.P., G.C. and P.E.M.; funding acquisition, L.A.M. and P.E.M. All authors have read and agreed to the published version of the manuscript.

Funding

This research received no external funding.

Institutional Review Board Statement

Not applicable.

Informed Consent Statement

Not applicable.

Data Availability Statement

The data that supports the findings of this study are available within the article and in the Supporting Information file (SI). Additional information on the model sensitivity, Lindride results and Ancamine results can be found in the Supplementary Information file (SI), further inquiries can be directed to the corresponding author.

Acknowledgments

We gratefully acknowledge the support of NVIDIA Corporation with the donation of the GPU used for this research.

Conflicts of Interest

The authors declare no conflict of interest.

References

  1. Liao, D.; Gu, T.; Liu, J.; Chen, S.; Zhao, F.; Len, S.; Dou, J.; Qian, X.; Wang, J. Degradation Behavior and Ageing Mechanism of E-Glass Fiber Reinforced Epoxy Resin Composite Pipes under Accelerated Thermal Ageing Conditions. Compos. Part B Eng. 2024, 270, 111131. [Google Scholar] [CrossRef]
  2. Fitriah, S.N.; Abdul Majid, M.S.; Ridzuan, M.J.M.; Daud, R.; Gibson, A.G.; Assaleh, T.A. Influence of Hydrothermal Ageing on the Compressive Behaviour of Glass Fibre/Epoxy Composite Pipes. Compos. Struct. 2017, 159, 350–360. [Google Scholar] [CrossRef]
  3. Zhao, Y.; Ma, P.; Bi, J.; Ma, B.; Zhou, H.; Liu, K.; Geisbush, J.; Wu, H. Mitigating Aging Infrastructure Risks: An Optimized Epoxy Resin System for Water Supply Pipeline Rehabilitation. Polymer 2024, 315, 127791. [Google Scholar] [CrossRef]
  4. Zargarnezhad, H.; Asselin, E.; Wong, D.; Lam, C.N.C. A Critical Review of the Time-Dependent Performance of Polymeric Pipeline Coatings: Focus on Hydration of Epoxy-Based Coatings. Polymers 2021, 13, 1517. [Google Scholar] [CrossRef]
  5. da Rocha, M.L.; Leite, M.C.d.O.; Ferreira, E.P.d.C.; Melo, J.D.D.; Barbosa, A.P.C. Accelerated Aging Effects in Composites Used as Repair for Pipes in Oil Industry. Polym. Compos. 2021, 42, 5918–5929. [Google Scholar] [CrossRef]
  6. Jarrett, W.; Jeffs, S.P.; Korkees, F.; Rawson, M. The Opportunities and Challenges of Hybrid Composite Driveshafts and Their Couplings in the Aerospace Industry: A Review. Compos. Struct. 2023, 320, 117203. [Google Scholar] [CrossRef]
  7. Crank, J. The Mathematics of Diffusion, 2nd ed.; Clarendon Press: Oxford, UK, 1975; ISBN 978-0-19-853344-3. [Google Scholar]
  8. Lin, S.H. Nonlinear Water Diffusion in Unsaturated Porous Solid Materials. Int. J. Eng. Sci. 1992, 30, 1677–1682. [Google Scholar] [CrossRef]
  9. Maggana, C.; Pissis, P. Water Sorption and Diffusion Studies in an Epoxy Resin System. J. Polym. Sci. Part B Polym. Phys. 1999, 37, 1165–1182. [Google Scholar] [CrossRef]
  10. Gillet, C.; Tamssaouet, F.; Hassoune-Rhabbour, B.; Tchalla, T.; Nassiet, V. Parameters Influencing Moisture Diffusion in Epoxy-Based Materials during Hygrothermal Ageing—A Review by Statistical Analysis. Polymers 2022, 14, 2832. [Google Scholar] [CrossRef]
  11. Carter, H.G.; Kibler, K.G. Langmuir-Type Model for Anomalous Moisture Diffusion In Composite Resins. J. Compos. Mater. 1978, 12, 118–131. [Google Scholar] [CrossRef]
  12. Moy, P.; Karasz, F.E. Epoxy-water Interactions. Polym. Eng. Sci. 1980, 20, 315–319. [Google Scholar] [CrossRef]
  13. Soles, C.L.; Yee, A.F. A Discussion of the Molecular Mechanisms of Moisture Transport in Epoxy Resins. J. Polym. Sci. Part B 2000, 38, 792–802. [Google Scholar] [CrossRef]
  14. Capiel, G.; Miccio, L.A.; Montemartini, P.E.; Schwartz, G.A. Water Diffusion and Hydrolysis Effect on the Structure and Dynamics of Epoxy-Anhydride Networks. Polym. Degrad. Stab. 2017, 143, 57–63. [Google Scholar] [CrossRef]
  15. Ma, J.; Yang, Y.; Wang, Q.; Deng, Y.; Yap, M.; Chern, W.K.; Oh, J.T.; Chen, Z. Degradation and Lifetime Prediction of Epoxy Composite Insulation Materials under High Relative Humidity. Polymers 2023, 15, 2666. [Google Scholar] [CrossRef] [PubMed]
  16. El Yagoubi, J.; Lubineau, G.; Traidia, A.; Verdu, J. Monitoring and Simulations of Hydrolysis in Epoxy Matrix Composites during Hygrothermal Aging. Compos. Part A Appl. Sci. Manuf. 2015, 68, 184–192. [Google Scholar] [CrossRef]
  17. Qu, Z.; Sun, F.; Qie, Z.; Gao, J.; Zhao, G. The Change of Hydrogen Bonding Network during Adsorption of Multi-Water Molecules in Lignite: Quantitative Analysis Based on AIM and DFT. Mater. Chem. Phys. 2020, 247, 122863. [Google Scholar] [CrossRef]
  18. Pritchard, J.G.; Siddiqui, I.A. Activation Parameters and Mechanism of the Acid-Catalysed Hydrolysis of Epoxides. J. Chem. Soc. Perkin Trans. 2 1973, 452–457. [Google Scholar] [CrossRef]
  19. Hrudková, H.; Švec, F.; Kálal, J. Reactive Polymers XIV. Hydrolysis of the Epoxide Groups of the Copolymer Glycidylmethacrylate—Ethylenedimethacrylate. Br. Polym. J. 1977, 9, 238–240. [Google Scholar] [CrossRef]
  20. Lin, Y.; Chen, X.; Wang, Z.P. Effects of Hygrothermal Aging on Anisotropic Conductive Adhesive Joints: Experiments and Theoretical Analysis. J. Adhes. Sci. Technol. 2006, 20, 1383–1399. [Google Scholar] [CrossRef]
  21. Parra, R.D.; Streu, K. Hydrogen Bond Cooperativity in Polyols: A DFT and AIM Study. Comput. Theor. Chem. 2011, 967, 12–18. [Google Scholar] [CrossRef]
  22. Filot, I.A.W.; Palmans, A.R.A.; Hilbers, P.A.J.; van Santen, R.A.; Pidko, E.A.; de Greef, T.F.A. Understanding Cooperativity in Hydrogen-Bond-Induced Supramolecular Polymerization: A Density Functional Theory Study. J. Phys. Chem. B 2010, 114, 13667–13674. [Google Scholar] [CrossRef]
  23. De Luca, G.; Gugliuzza, A.; Drioli, E. Competitive Hydrogen-Bonding Interactions in Modified Polymer Membranes: A Density Functional Theory Investigation. J. Phys. Chem. B 2009, 113, 5473–5477. [Google Scholar] [CrossRef]
  24. Wendler, K.; Thar, J.; Zahn, S.; Kirchner, B. Estimating the Hydrogen Bond Energy. J. Phys. Chem. A 2010, 114, 9529–9536. [Google Scholar] [CrossRef] [PubMed]
  25. Fernandes, F.C.; Kirwan, K.; Wilson, P.R.; Coles, S.R. Sustainable Alternative Composites Using Waste Vegetable Oil Based Resins. J. Polym. Environ. 2019, 27, 2464–2477. [Google Scholar] [CrossRef]
  26. Ramón, E.; Sguazzo, C.; Moreira, P.M.G.P. A Review of Recent Research on Bio-Based Epoxy Systems for Engineering Applications and Potentialities in the Aviation Sector. Aerospace 2018, 5, 110. [Google Scholar] [CrossRef]
  27. Bruzzi, E.; Stace, A.J. Experimental Measurements of Water Molecule Binding Energies for the Second and Third Solvation Shells of [Ca(H2O)n]2+ Complexes. R. Soc. Open Sci. 2017, 4, 160671. [Google Scholar] [CrossRef] [PubMed]
  28. Miccio, L.A.; Otegui, J.; Penoff, M.E.; Montemartini, P.E.; Schwartz, G.A. Fluorinated Networks Dynamics Studied by Means of Broadband Dielectric Spectroscopy. J. Appl. Polym. Sci. 2015, 132, 42690. [Google Scholar] [CrossRef]
  29. Miccio, L.A.; Kummali, M.M.; Montemartini, P.E.; Oyanguren, P.A.; Schwartz, G.A.; Alegra, N.; Colmenero, J. Determining Concentration Depth Profiles in Fluorinated Networks by Means of Electric Force Microscopy. J. Chem. Phys. 2011, 135, 064704. [Google Scholar] [CrossRef]
  30. Islam, M.A.; Khan, M.M.R.; Mozumder, M.S.I. Adsorption Equilibrium and Adsorption Kinetics: A Unified Approach. Chem. Eng. Technol. 2004, 27, 1095–1098. [Google Scholar] [CrossRef]
  31. Gupta, V.B.; Drzal, L.T.; Rich, M.J. The Physical Basis of Moisture Transport in a Cured Epoxy Resin System. J. Appl. Polym. Sci. 1985, 30, 4467–4493. [Google Scholar] [CrossRef]
  32. Woo, M.; Piggott, M.R. Water Absorption of Resins and Composites. I. Epoxy Homopolymers and Copolymers. J. Compos. Technol. Res. 1987, 9, 101–107. [Google Scholar] [CrossRef]
  33. McKague, E.L.; Reynolds, J.D.; Halkias, J.E. Swelling and Glass Transition Relations for Epoxy Matrix Material in Humid Environments. J. Appl. Polym. Sci. 1978, 22, 1643–1654. [Google Scholar] [CrossRef]
  34. Yu, L.; Pellechia, P.; Matthews, M.A. Kinetic Models of Concentrated NaBH4 Hydrolysis. Int. J. Hydrogen Energy 2014, 39, 442–448. [Google Scholar] [CrossRef]
  35. Mac Leod, J.M.; Rosei, F. Hydrogen Bonding. In Comprehensive Nanoscience and Technology; Andrews, D.L., Scholes, G.D., Eds.; Elsevier Academic Press: Amsterdam, The Netherlands, 2011; ISBN 978-0-12-374390-9. [Google Scholar]
  36. Meyers, R.A. Hydrogen Bond. In Encyclopedia of Physical Science and Technology; Elsevier: Amsterdam, The Netherlands, 2003; pp. 505–538. ISBN 978-0-12-227410-7. [Google Scholar]
  37. Yang, Q.; Xian, G.; Karbhari, V.M. Hygrothermal Ageing of an Epoxy Adhesive Used in FRP Strengthening of Concrete. J. Appl. Polym. Sci. 2008, 107, 2607–2617. [Google Scholar] [CrossRef]
  38. Yamakita, E.; Nakashima, S. Water Retention of Calcium-Containing Pectin Studied by Quartz Crystal Microbalance and Infrared Spectroscopy with a Humidity Control System. J. Agric. Food Chem. 2018, 66, 9344–9352. [Google Scholar] [CrossRef] [PubMed]
  39. Kudo, S.; Nakashima, S. Changes in IR Band Areas and Band Shifts during Water Adsorption to Lecithin and Ceramide. Spectrochim. Acta Part A Mol. Biomol. Spectrosc. 2020, 228, 117779. [Google Scholar] [CrossRef] [PubMed]
  40. Liu, M.; Wu, P.; Ding, Y.; Li, S. Study on Diffusion Behavior of Water in Epoxy Resins Cured by Active Ester. Phys. Chem. Chem. Phys. 2003, 5, 1848–1852. [Google Scholar] [CrossRef]
  41. Santos, M.C.; Bendiksen, B.; Elabd, Y.A. Diffusion of Liquid Water in Free-Standing Polymer Films Using Pressure-Contact Time-Resolved Fourier Transform Infrared Attenuated Total Reflectance Spectroscopy. Ind. Eng. Chem. Res. 2017, 56, 3464–3476. [Google Scholar] [CrossRef]
  42. Fame, C.M.; Ueda, T.; Ntjam Minkeng, M.A.; Wu, C. Durability of Epoxy and Vinyl Ester Polymers in Wet, Seawater, and Seawater Sea Sand Concrete Environments: Molecular Dynamics Simulations. Constr. Build. Mater. 2024, 451, 138645. [Google Scholar] [CrossRef]
  43. Capiel, G.; Uicich, J.; Fasce, D.; Montemartini, P.E. Diffusion and Hydrolysis Effects during Water Aging on an Epoxy-Anhydride System. Polym. Degrad. Stab. 2018, 153, 165–171. [Google Scholar] [CrossRef]
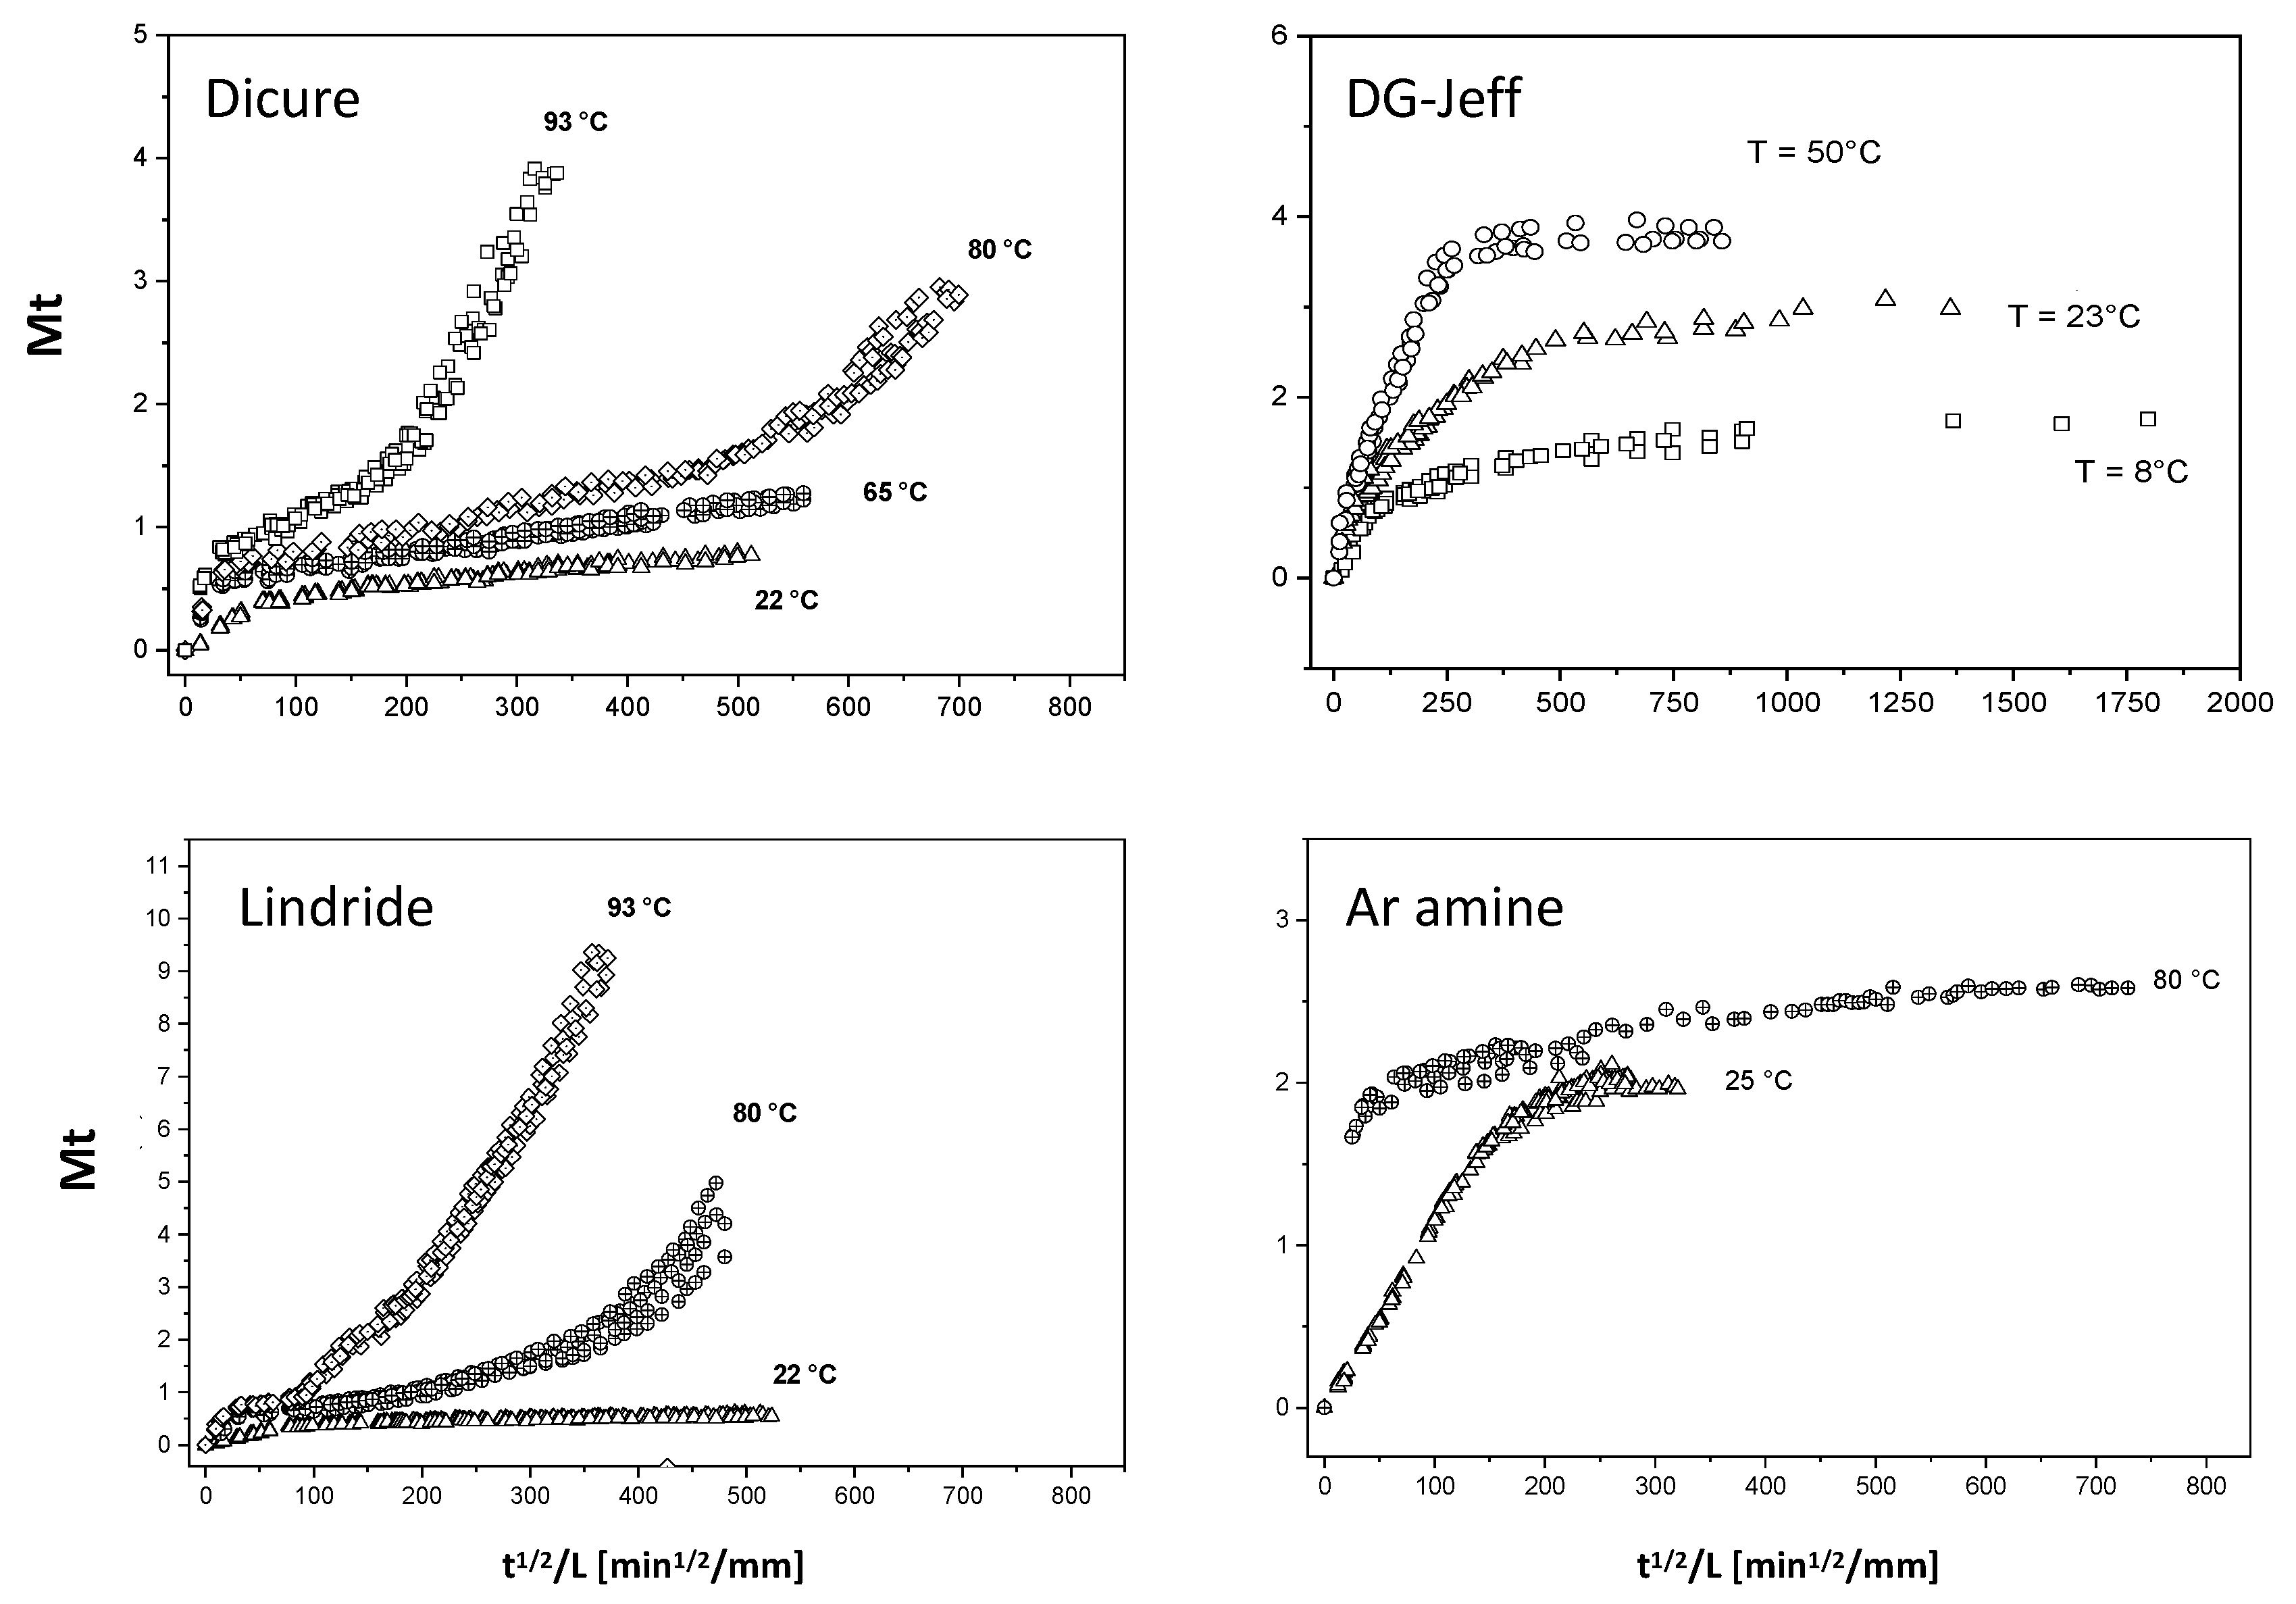
Figure 1. Gravimetry results for our four different systems at temperatures ranging from 8 to 93 °C.
Applsci 15 11857 g001
Figure 2. Schematic picture of H bond strengths involved. (a) The weakest hydrogen bonds considered in the literature are about 0.5 kcal/mol. Most hydrogen-bonded complexes of interest form the group of moderate hydrogen bonds. Water dimers or hydrogen fluoride dimers are typical examples for this group. Other well-known dimers in this group involve carboxylic acids, base pairs of nucleic acids and typical hydrogen bonds forming within or between proteins. The strong hydrogen bonds involve ionic species. Examples include Cl⋯H2O, F⋯H2O, H3O+ ⋯H2O and F⋯HF with interaction energies of about 15, 30, 35 and 40 kcal/mol, respectively [35,36]. (b) MACE (Multi-Atom Cluster Expansion) results at different polymer matrix positions yield activation energies in the range of 8–9 kcal/mol, in excellent agreement with literature values for moderate hydrogen bonding. MACE is a state-of-the-art equivariant graph neural network designed to predict atomistic energies and forces with near-DFT accuracy but at a fraction of the computational cost. By probing the energy landscape associated with the approach and detachment of single water molecules to these sites, the model provided spatially resolved estimates of hydrogen bond strengths and associated activation barriers.
Applsci 15 11857 g002
Figure 3. Percentage water uptake (Mt) as a function of the reduced time for the DGEBA-Jeffamine materials.
Applsci 15 11857 g003
Figure 4. FT-MIR and NIR signals (numbers in bold indicate the areas’ ratio) at three different reduced times (ac) linked to the water uptake curve. On the left lower corner, a schematic of the water interaction with OH groups in the polymer matrix is depicted.
Applsci 15 11857 g004
Figure 5. Fit results for the Dicure anhydride system at 25, 65, 80 and 93 °C. Filled dots represent the experimental data, and blue, red and green lines represent Fickian, Sorption and Hydrolysis contributions, respectively. Black line represents the sum of contributions, which as shown closely describes the experimental data.
Applsci 15 11857 g005
Figure 6. Fit parameters for the Dicure anhydride system at 25, 65, 80 and 93 °C. Vertical dashed lines in (a,b) stand for Mt ≈ 1.5 limit, while dashed lines in (c) (hydrolysis, in Mt %) and (d) (bonded Arrhenius prefactor, min−1) are just a guide for the eyes. All horizontal axes are temperatures (in K).
Applsci 15 11857 g006
Figure 7. FT-NIR signals at three different reduced times (ac) linked to the water uptake curve. The numbers 0.95/1.35/1.5 in the insets (a) to (c) represent the areas’ ratio (bound/free).
Applsci 15 11857 g007
Table 1. Models governing expressions: free and bonded contributions (equivalent to Carter and Kibler model), irreversible hydrolysis contribution and total mass gain expression.
EquationDescription

M f r e e ( t ) = M , f r e e · 1 8 π 2   n e D m 2 π 2 t / L 2 m 2
D = D 0 · e E a D R T
L = h 2   ;   m = 2 n + 1
 
Reversible diffusion of water molecules through free volume; controlled by the effective diffusivity [7].

M b o n d e d ( t ) = M , b o n d e d · [ 1 e k 0   t ]
k 0 = A · e E a b R T
 
Occupation of specific polar sites; reversible sorption [11,30,31].


M H ( t ) = K · t α
K = B · e E a R T
 
 
Irreversible hydrolytic chain scission; temperature-dependent prefactor K(T) and power-law exponent α (α > 1 captures autocatalysis) [32,33,34].

M t t = M f r e e t + M b o n d e d t + M H ( t )
 
Total mass gain (sum of contributions)
Disclaimer/Publisher’s Note: The statements, opinions and data contained in all publications are solely those of the individual author(s) and contributor(s) and not of MDPI and/or the editor(s). MDPI and/or the editor(s) disclaim responsibility for any injury to people or property resulting from any ideas, methods, instructions or products referred to in the content.