1. Introduction
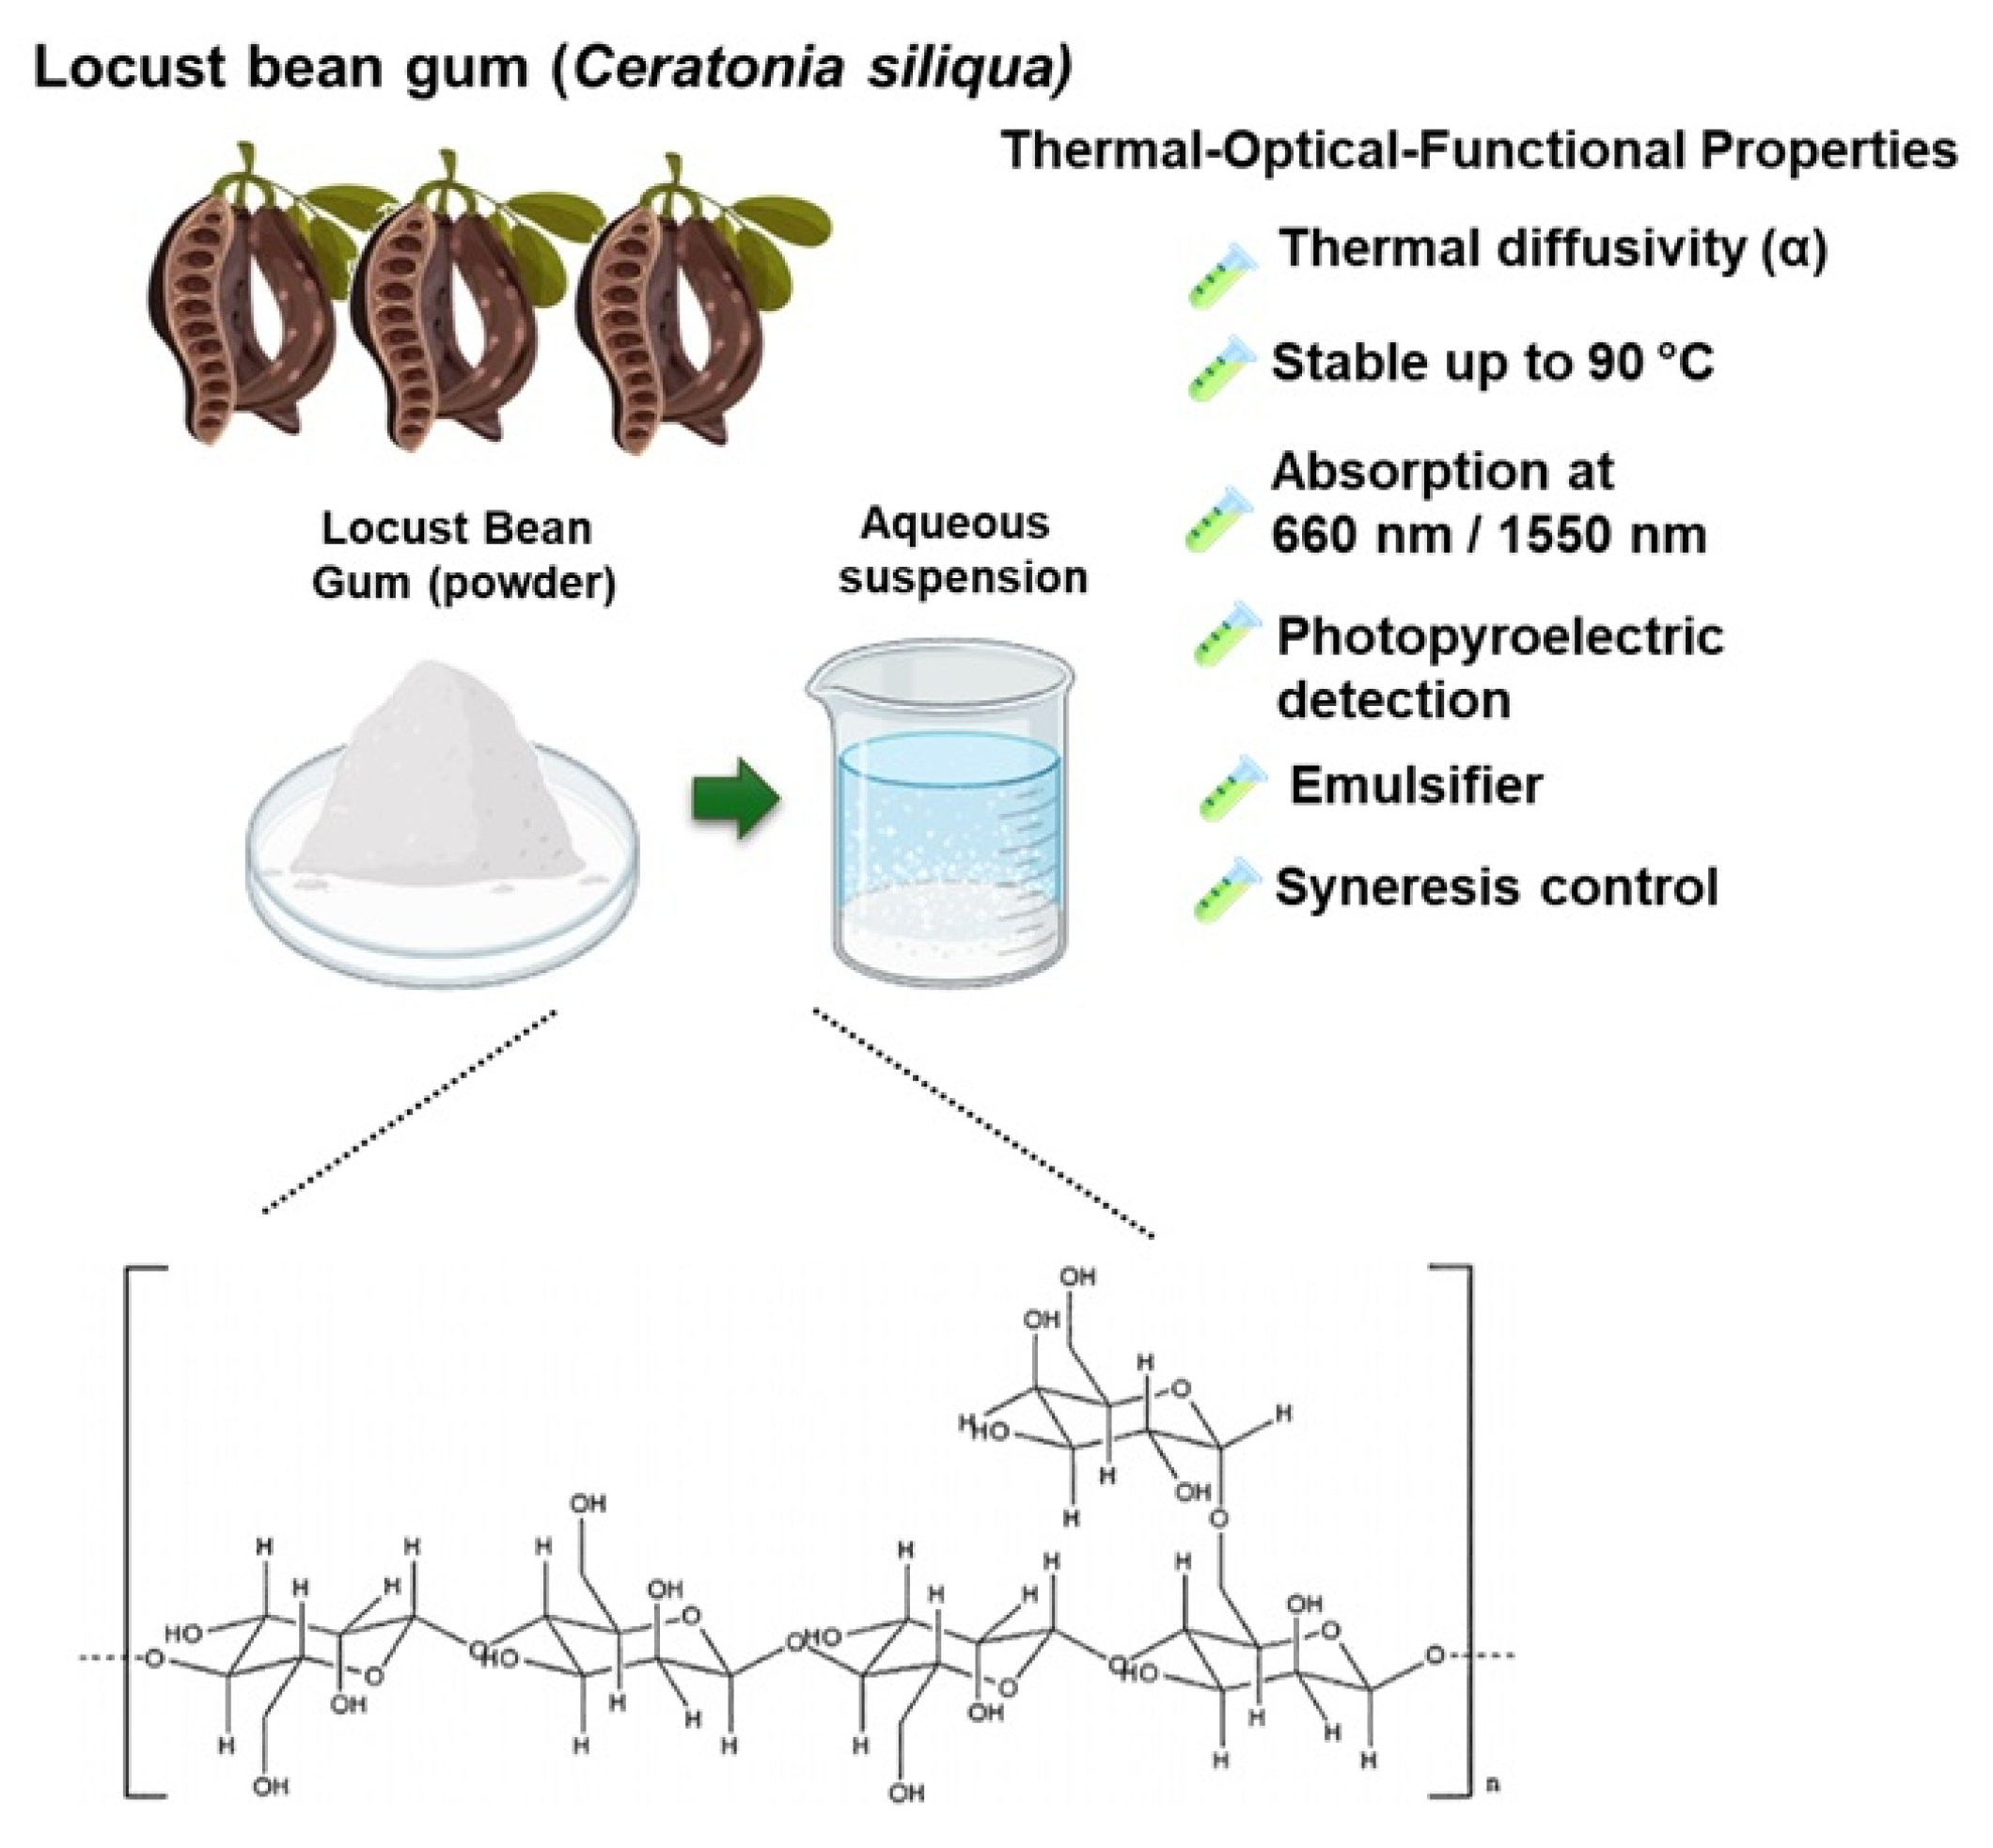
Galactomannans are high-molecular-weight natural polysaccharides composed of a linear chain of β-D-mannopyranosyl units linked by (1 → 4) bonds, to which α-D-galactopyranosyl units are laterally linked by (1 → 6) bonds. Galactomannans stand out for their rheological properties and are widely used in food, pharmaceutical, textile, and cosmetics industries, mainly as thickening, stabilizing, and gel-forming agents. Among the most representative galactomannans are guar gum, tara gum, and locust bean gum (LBG), which are widely studied due to their structural similarity and functional versatility in various applications. These polysaccharides differ primarily in their mannose-to-galactose (M:G) ratios, a key structural feature that significantly affects their physicochemical and rheological properties. Guar gum typically exhibits an M:G ratio of approximately 2:1, tara gum around 3:1, and LBG approximately 4:1 [
1,
2]. The chemical structure of locust bean gum is shown in
Figure 1 to illustrate its linear backbone and sparse galactose substitutions.
Locust bean gum, obtained from the endosperm of the seeds of
Ceratonia siliqua Linn. (
Fabaceae family) is an approved food additive (E410) widely used to generate viscous suspensions, even at low concentrations. This gum is partially soluble in cold water and completely soluble in hot water (above 80 °C). Hydrocolloids could form pseudoplastic solutions with viscosities between 2500 and 3500 mPa·s [
3].
The molecular structure of locust bean gum consists of linear blocks of up to 25 mannose units, with regions substituted and unsubstituted by galactose, which gives it a high structural and functional heterogeneity [
4,
5]. This arrangement favors synergistic interactions with other hydrocolloids, such as κ-carrageenan, xanthan gum, and agar, which allow the formation of cohesive and elastic binary gels, especially useful in food formulations [
6,
7].
The industrial use of locust bean gum has been partially displaced by guar gum, due to its lower cost and greater availability; however, locust bean gum is still highly valued for food applications, including low-calorie products for people with obesity or diabetes, as it acts as a soluble dietary fiber with positive effects on carbohydrate and lipid metabolism [
8,
9]. At a functional level, galactomannans provide soluble fiber to foods, which contributes to lowering blood glucose levels, increasing satiety, improving intestinal motility, and modulating nutrient absorption, with widely documented clinical benefits [
10,
11].
Galactomannans have been extensively studied from a structural, thermal, and rheological point of view (using techniques such as infrared spectroscopy, differential thermal analysis, swelling index, and viscosity measurements). However, little is known about their optical absorption properties, due to the strong optical scattering properties of their suspensions, even at low concentrations, which limits the use of conventional optical spectroscopy for these types of studies [
12,
13]. This limitation motivates the use of photothermal techniques, which detect the heat generated by absorbed modulated light rather than relying on transmitted or reflected light, making them less sensitive to scattering effects. This feature makes photothermal methods, such as the photopyroelectric technique, especially suitable for characterizing polysaccharide suspensions like locust bean gum, where conventional optical methods fail.
Photothermal techniques allow for the determination of fundamental thermophysical properties, such as thermal diffusivity and the optical absorption coefficient. Spectroscopic techniques analyze transmitted radiation and are thus limited by radiation scattering inside the sample. In contrast, the photothermal techniques presented here are based on the absorption of modulated radiation and the subsequent generation and propagation of heat. Photothermal techniques exhibit low sensitivity to scattered radiation and provide experimental criteria that allow the assessment of the extent to which optical scattering affects the reliability of the measurements. These properties represent a significant advantage for the study of materials with high optical absorption or radiation scattering [
14].
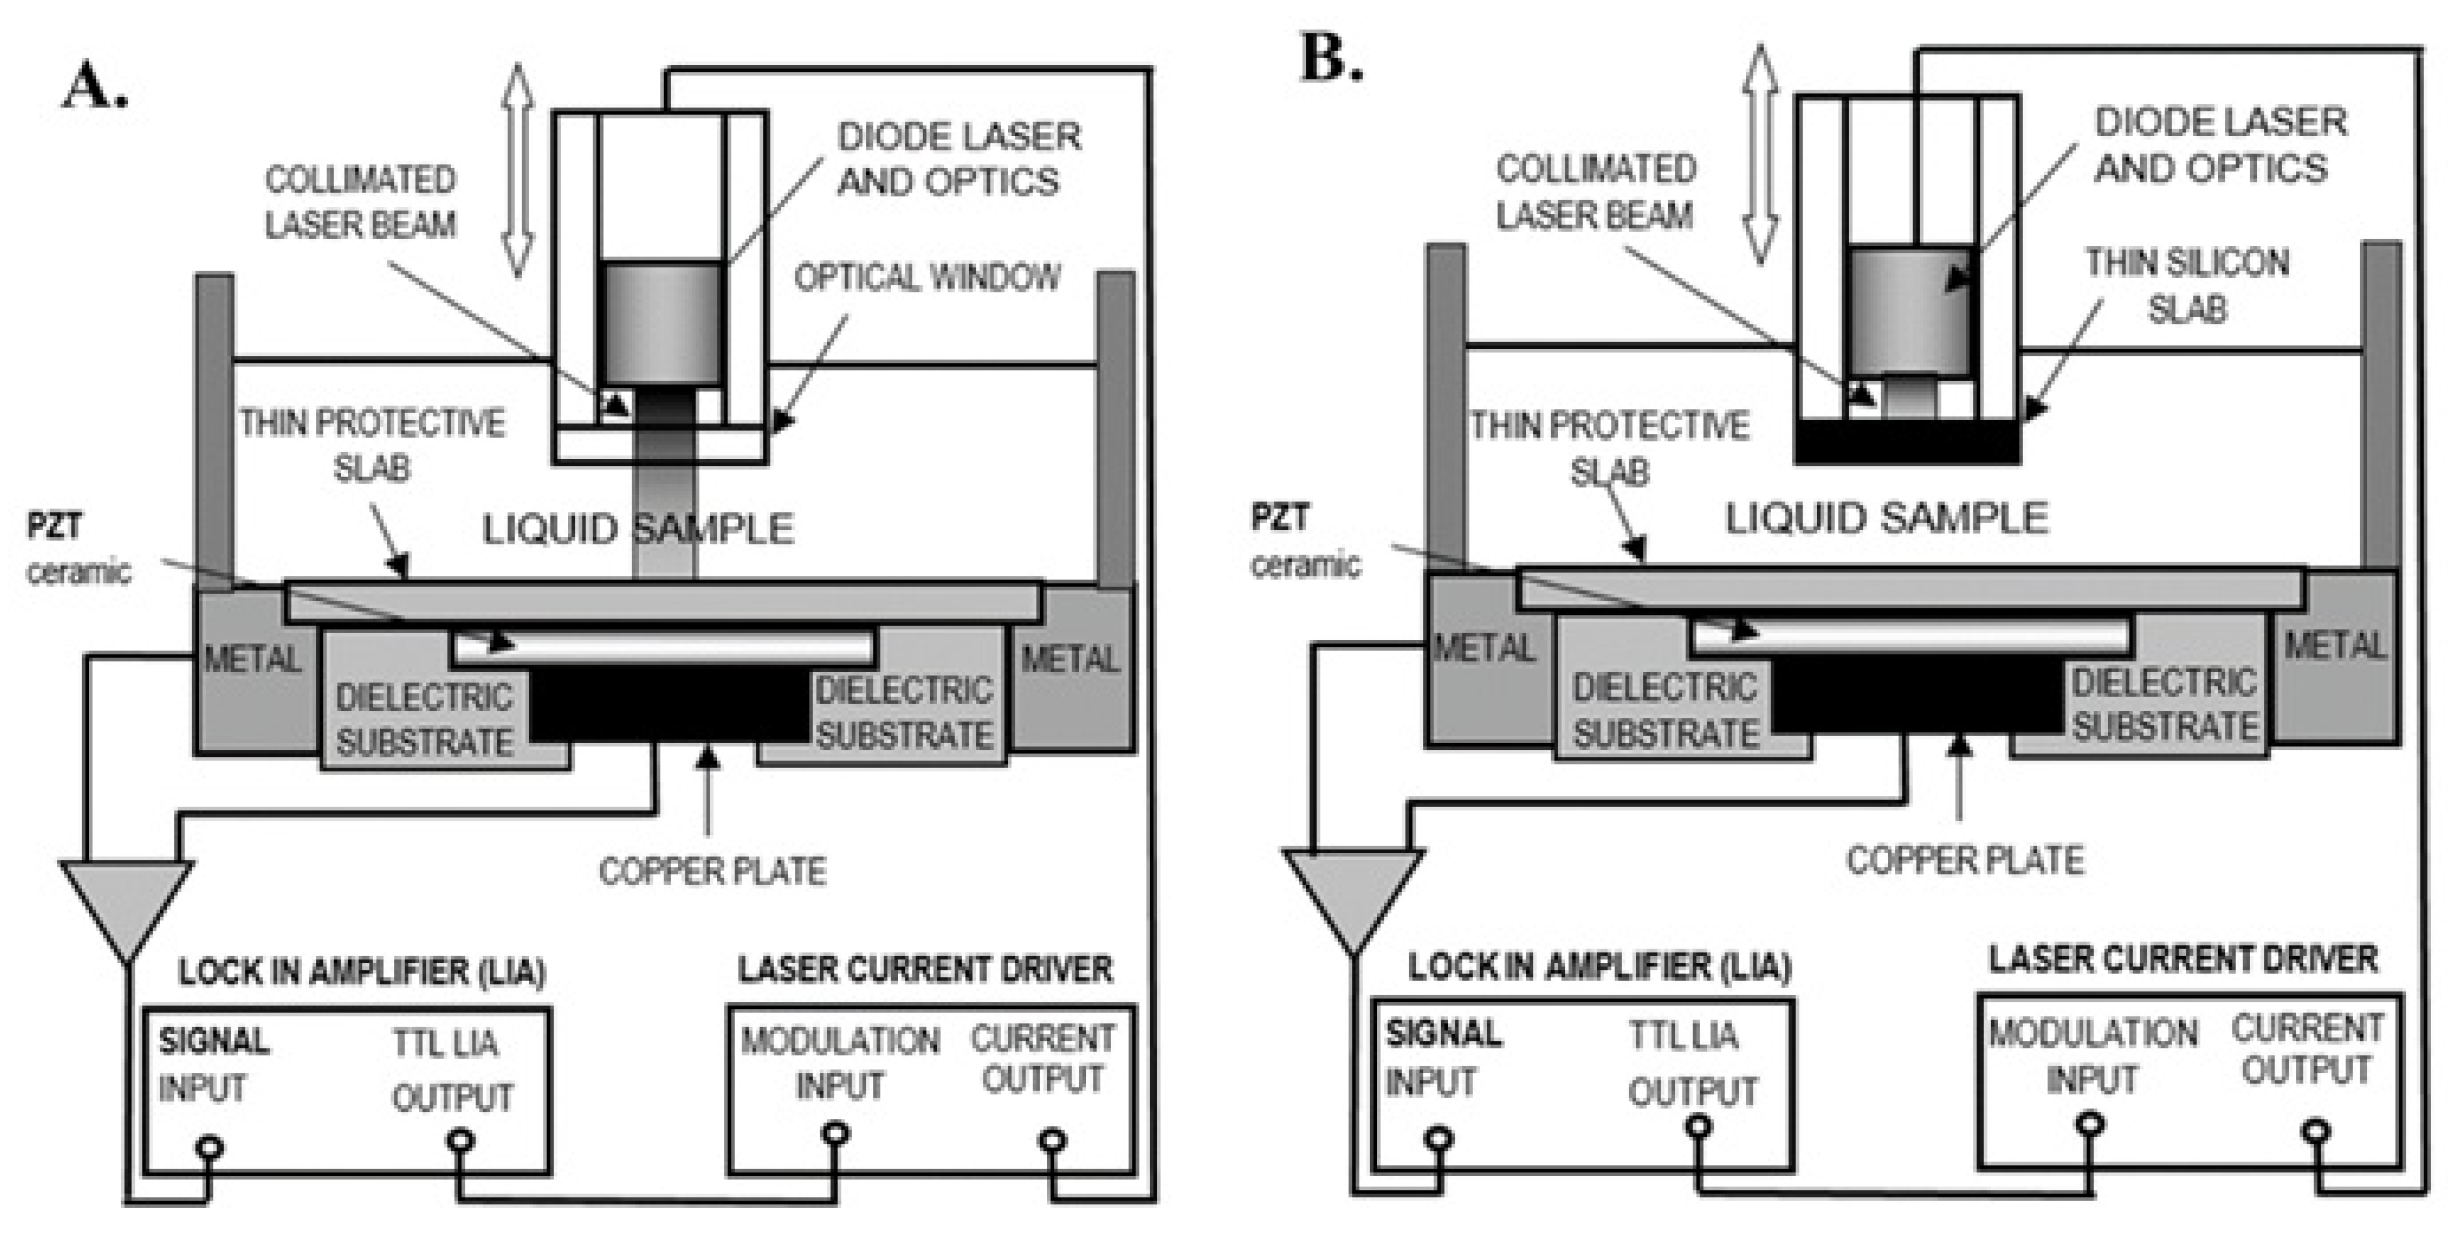
In particular, the photopyroelectric technique employs a modulated light source (typically a laser or LED) that impinges on the sample and is partially absorbed. The absorbed energy is converted into heat through non-radiative relaxation processes, generating a periodic thermal wave within the sample. This thermal wave propagates toward a pyroelectric detector (commonly a PVDF film or PZT foil), which produces an electrical signal proportional to the temperature variation on its volume.
One of the main advantages of photopyroelectric techniques is their low sensitivity to optical scattering. Unlike conventional optical spectroscopy, which relies on the detection of transmitted or reflected light and is therefore highly affected by scattering within the sample, photopyroelectric methods detect the thermal wave generated by absorbed modulated radiation. In this approach, the key measurable quantity is not the scattered light itself, but the heat resulting from non-radiative de-excitation following absorption. As long as part of the incident modulated radiation is absorbed, regardless of whether it has undergone scattering, the generated thermal wave propagates through the sample and reaches the pyroelectric detector. Since thermal diffusion is not affected by optical scattering, the resulting electrical signal remains reliable even in optically turbid or highly scattering media. This makes the method particularly well-suited for the characterization of biopolymers in gel or colloidal form, where traditional optical techniques often fail [
15,
16,
17,
18].
Several studies have demonstrated the successful application of photothermal and photopyroelectric techniques to the characterization of turbid or highly viscous biopolymeric and gelled systems. For example, Pessoa et al. [
19] applied the photopyroelectric technique to monitor gelation and drying processes in alginate gels, successfully measuring both thermal diffusivity and thermal effusivity using appropriate experimental configurations. Furthermore, Yuan et al. [
20] investigated the thermal stability of conformationally modified xanthan gum using thermal aging protocols, showing improved viscosity retention at elevated temperatures evidence that such biopolymers can retain their functional properties under demanding thermal conditions. These examples underscore the applicability and reliability of advanced thermal techniques for characterizing complex biopolymeric systems similar to that studied here, thereby strengthening the justification for employing photopyroelectric methods in the analysis of locust bean gum.
Unlike previous studies, this research represents the first application of the photopyroelectric technique for simultaneous dual-wavelength characterization (at 660 nm and 1550 nm) of locust bean gum in aqueous suspension. Furthermore, it integrates optical analysis with thermal characterization, offering a more comprehensive evaluation of its properties. This approach overcomes common limitations of conventional optical spectroscopy, especially in highly scattering and viscous systems, and provides new perspectives for monitoring and controlling these biopolymers in industrial applications.
Within this context, we performed a thermal and optical characterization of locust bean gum using photopyroelectric techniques, evaluating key parameters such as thermal diffusivity and the optical absorption coefficient. This study offers a complementary approach to the analysis of these biopolymers, which are widely used in industrial, food, and pharmaceutical applications. The determination of thermal diffusivity and the optical absorption coefficient of locust bean gum is important, as these parameters directly influence its behavior in processes involving heat and light transfer, ultimately affecting its performance and functionality in various technological applications.
3. Results
3.1. Optical Characterization
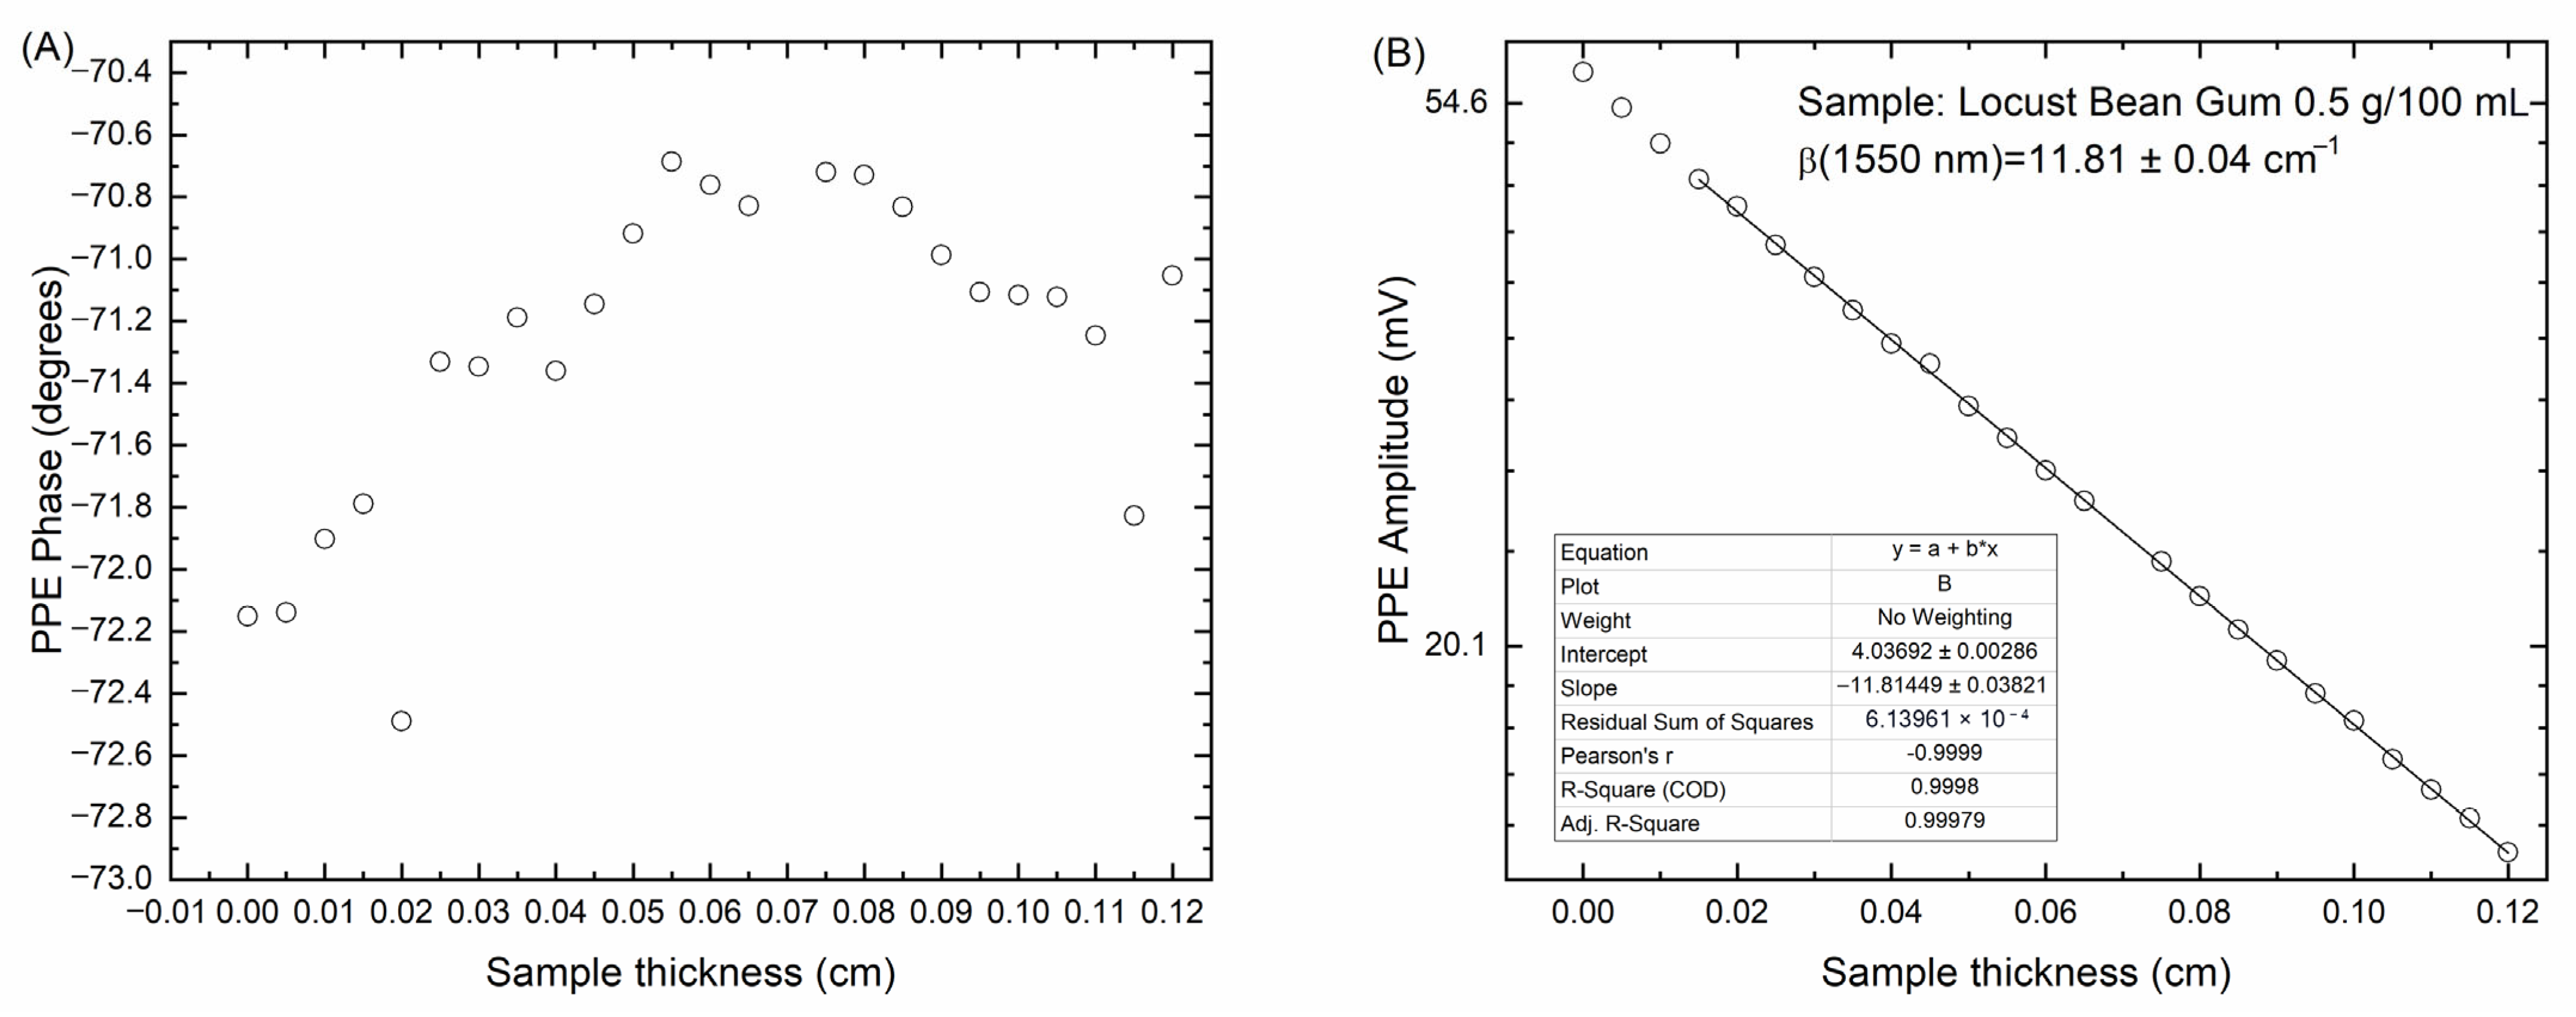
Figure 3 shows typical experimental results for pyroelectric phase and amplitude, as a function of sample thickness, for optical absorption coefficient measurements of LBG (locust bean gum at 0.5 g/100 mL) at 1550 nm. A sample thickness range where photopyroelectric phase remains constant is evident in
Figure 3A, the linear fitting for the pyroelectric amplitude, in semi-log scale, inside this range for measurement of the corresponding optical absorption coefficient for the sample is shown in
Figure 3B.
The corresponding optical absorption coefficients for all samples at the two wavelengths were obtained as the slope of the linear fits, as it was described above. The resulting values are summarized in
Table 1, in columns 2 and 4, corresponding to wavelengths of 660 nm and 1550 nm, respectively. Uncertainties were taken as the ones resulting from the slopes of the linear fits.
As indicated above, the values reported in columns 2 and 4
of
Table 1 correspond to the optical absorption coefficients of the locust bean gum suspensions at the indicated concentrations. However, according to the Beer–Lambert model, these values represent the sum of the absorption coefficients of the gum and the suspension medium, in this case, water. Therefore, to obtain the absorption coefficient of the gum in water exclusively, it is necessary to subtract the coefficient corresponding to water. The adjusted results are presented in columns 3 and 5 of
Table 1 .
This procedure is analogous to the use of a blank in absorbance measurements, where the blank compensates for light energy loss due to the vessel walls and optical scattering within the sample. Though, this latter contribution is impossible to compensate for in suspensions such as those analyzed, due to their remarkable optical scattering properties. In contrast, the photopyroelectric technique used here is sensitive only to radiation absorbed directly and does not have this limitation. Furthermore, the analysis of the photopyroelectric phase criterion allows us to evaluate the influence of optical scattering on the measurement.
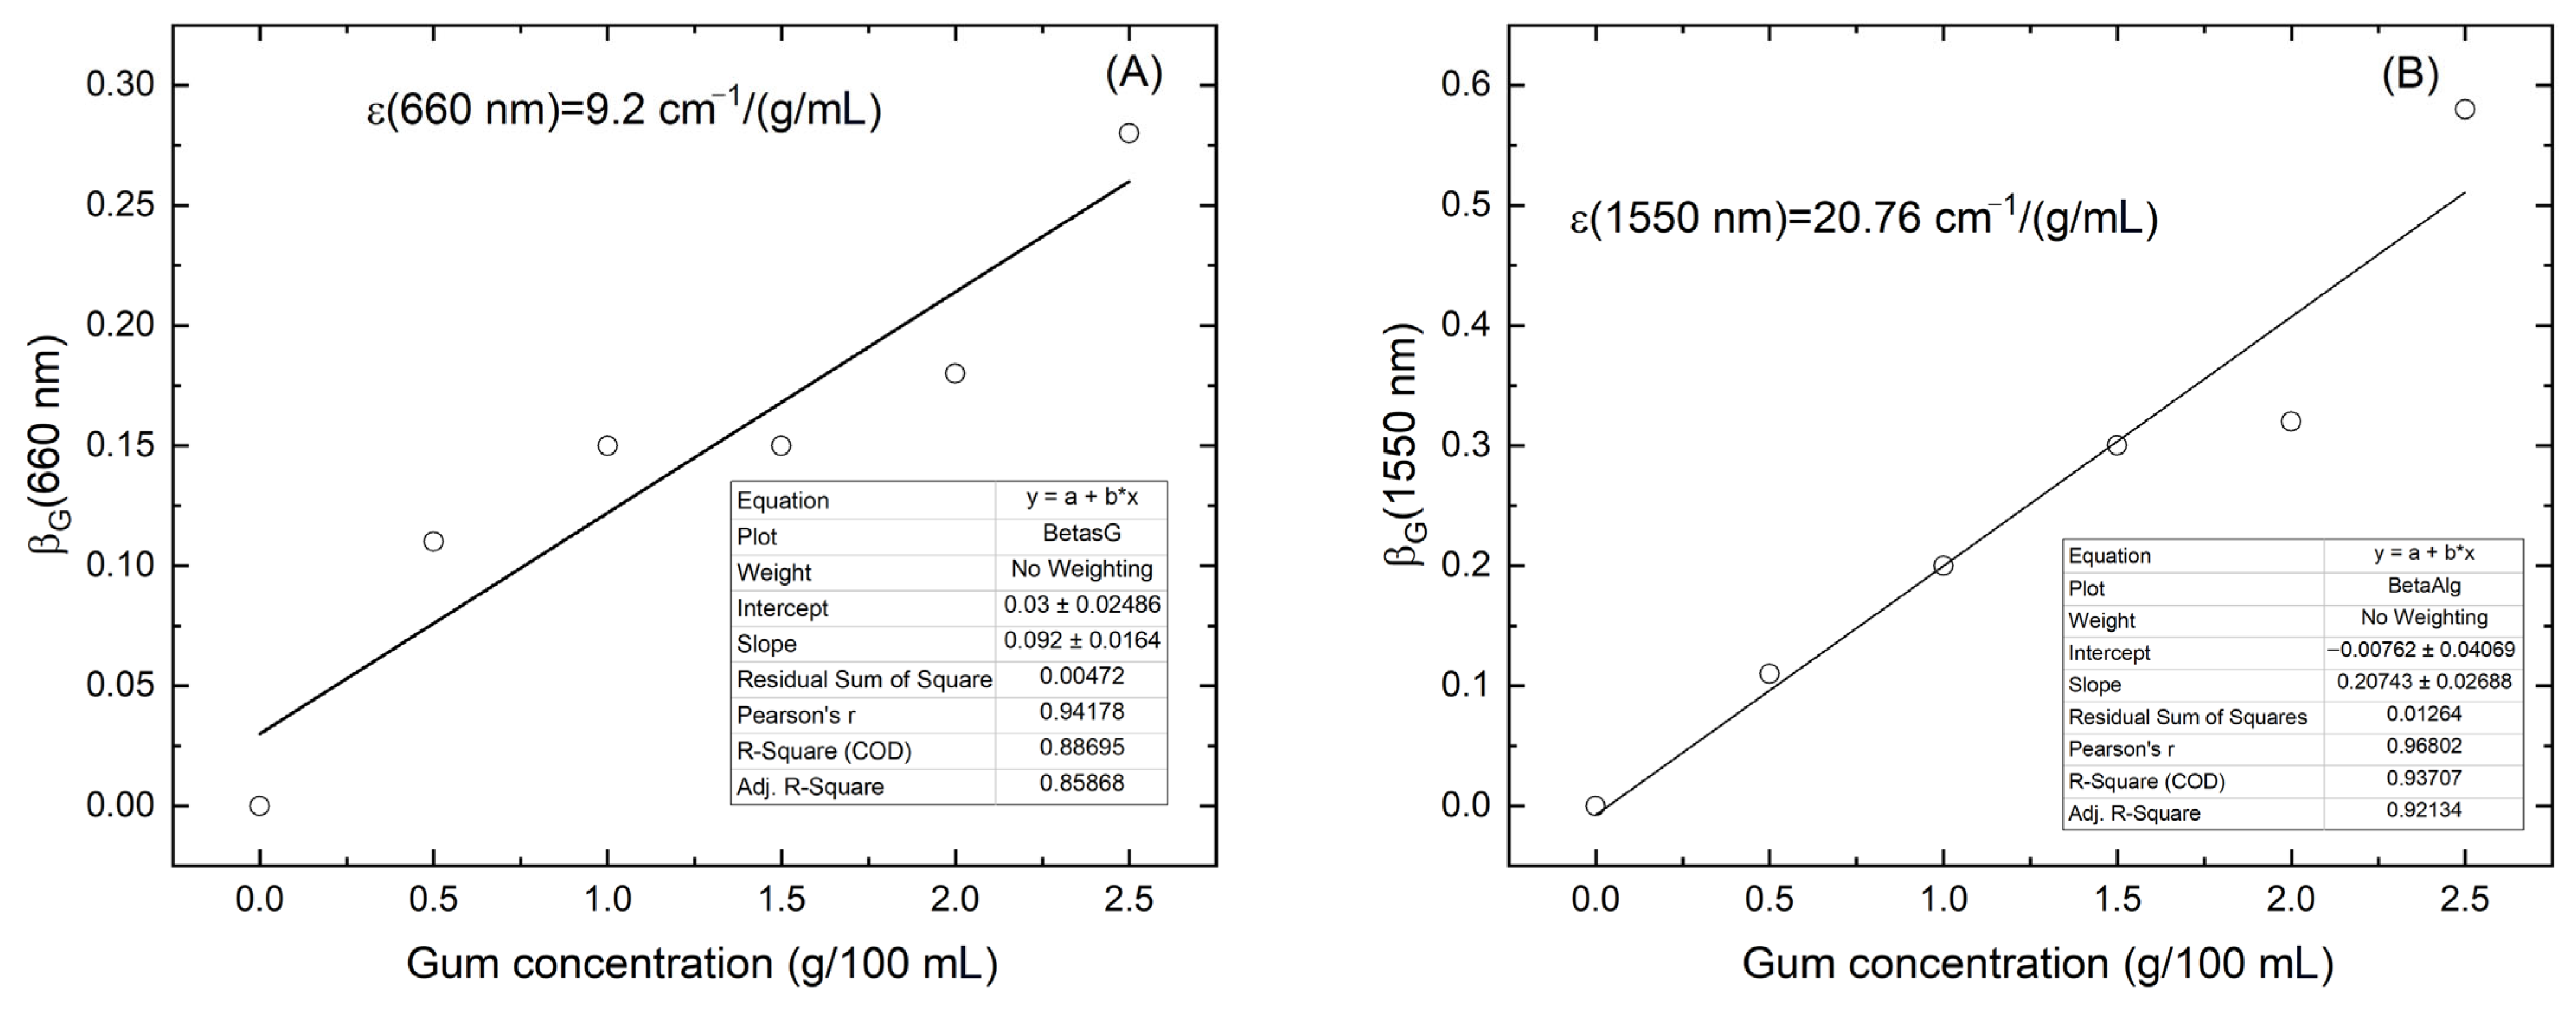
The values of
were plotted as a function of locust bean gum concentration, as shown in
Figure 4A,B for 660 and 1550 nm, respectively. The solid lines in both figures represent the linear fits performed to determine the absorptivity of locust bean gum at these wavelengths:
The
value obtained at 1550 nm was more than twice that at 660 nm, which can be attributed to the overtones of the vibrational modes of the –OH groups present in the gum. This increased absorption at 1550 nm can be attributed to the molecular structure of locust bean gum, which is a galactomannan composed of β-(1 → 4)-linked mannose units with α-(1 → 6)-linked galactose side chains. Each monosaccharide unit contains multiple hydroxyl (–OH) groups, which contribute to strong overtone and combination bands in the near-infrared region, especially around 1450–1550 nm [
25,
26,
27]. The absorption in this region is dominated by the first overtone of the O–H stretching vibration and its combinations with bending modes, which are enhanced by hydrogen bonding and the specific structural conformation of the polymer [
28].
In locust bean gum, the relatively low galactose substitution (mannose-to-galactose ratio ≈ 4:1) results in longer unsubstituted mannose blocks. This favors stronger intermolecular hydrogen bonding and more coherent vibrational coupling, leading to increased overtone absorption intensity due to anharmonicity [
27,
28,
29]. These findings are consistent with previous reports on NIR absorption of polysaccharides, which highlight the role of hydrogen bonding and hydroxyl density in shaping the spectral profile [
23,
30].
In fact, as observed in
Table 1, water also exhibits significant optical absorption at this wavelength [
28,
31].
The determination of the absorptivity of locust bean gum is relevant because it allows the quantification of gum content in suspension by radiation absorption, following the Beer–Lambert Law (Equation (4)):
In our study, the most suitable wavelength is 1550 nm, because it provides a higher absorptivity for locust bean gum, allowing more accurate quantification of the polymer concentration in suspension. Moreover, the photopyroelectric technique at this wavelength effectively compensates for the optical scattering contributions and differentiates the gum’s absorption from that of the aqueous medium, ensuring reliable measurement conditions validated by the constant phase criterion. The experimental procedure consists of obtaining the optical absorption coefficient of the suspension at 1550 nm, following the method described here, and ensuring that the constant phase criterion is met. The gum concentration can thus be estimated by dividing the absorption coefficient by , and expressing the concentration in g/mL. It is important to note that once the absorptivity of the gum in suspension is known, at a particular wavelength, it is not necessary to construct a calibration curve.
Finally, it is worth mentioning that the conventional method for quantifying this type of suspended substances is based on the construction of calibration curves using the radiation scattered by the sample in the visible region of the spectrum. However, the case of gums with physicochemical properties similar to those of locust bean gum is highly problematic because the strong optical scattering inherent to these biopolymer suspensions leads to significant deviations from the Beer–Lambert law. This scattering causes an overestimation of the absorbance values, reducing the accuracy and reproducibility of concentration measurements. Additionally, the heterogeneity and particulate nature of the suspensions contribute to variable scattering effects depending on particle size distribution and concentration, complicating the establishment of reliable and universal calibration curves. Therefore, techniques that measure direct absorption, such as photopyroelectric methods at wavelengths where absorption dominates over scattering, provide more robust and accurate quantification for these complex systems.
3.2. Thermal Characterization of Locust Bean Gum
For the thermal characterization of locust bean gum, we followed a methodology similar to that described for its optical characterization (
Section 2.3.1) but using 15 experimental points.
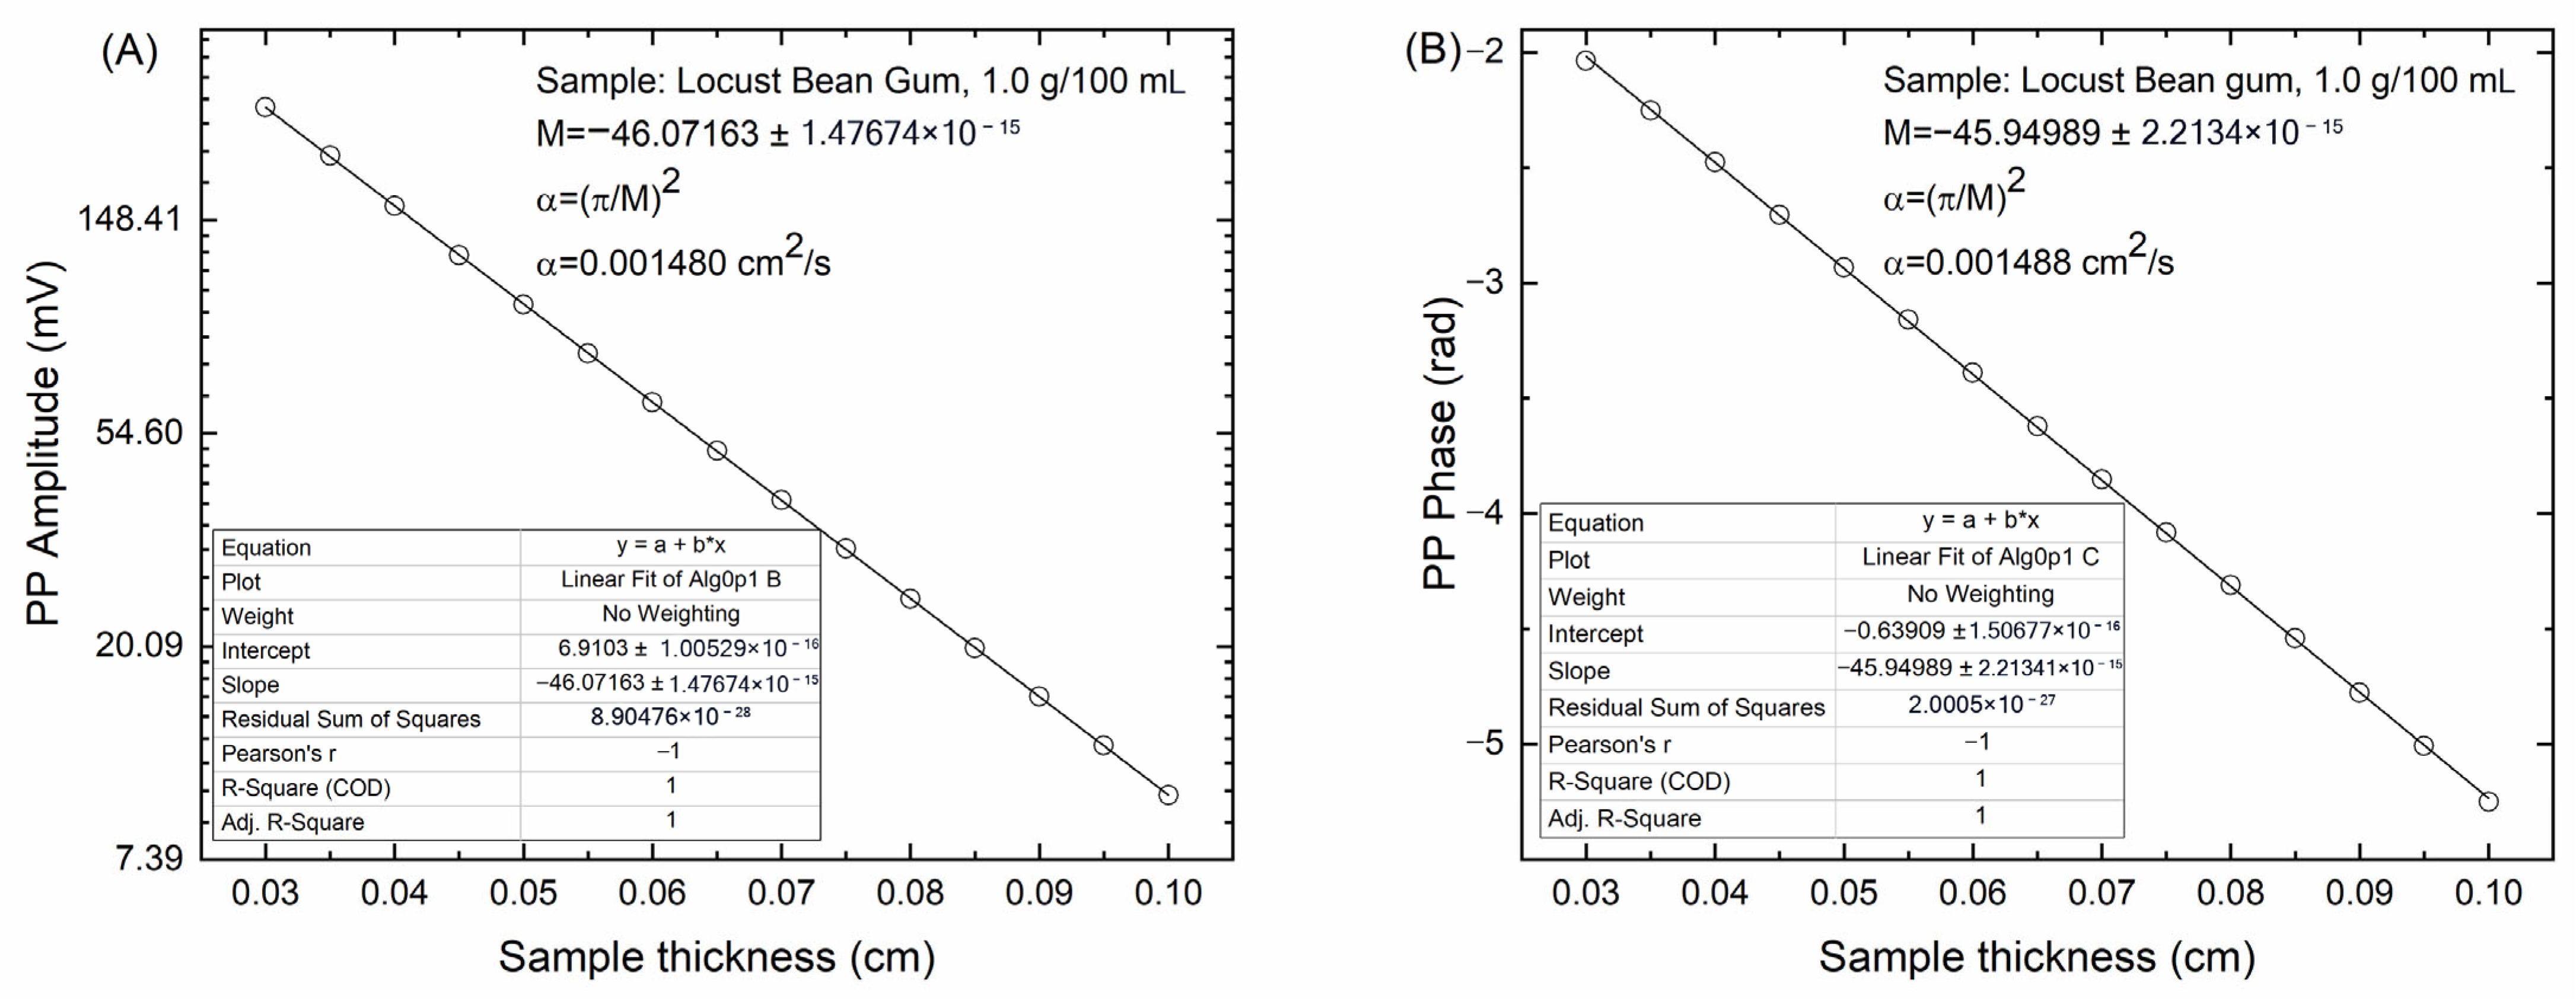
Figure 5 shows the behavior of the photopyroelectric signal in amplitude (
Figure 5A) and phase (
Figure 5B) of the sample containing 1.0 g/100 mL locust bean gum.
A clear linear behavior is observed in both signals, allowing for the determination of the slope M, from which the thermal diffusivity of the locust bean gum sample is calculated using Equation (5). The thermal diffusivity values obtained for the different samples are summarized in
Table 2. Uncertainties were estimated by means of the usual formula for error propagation.
Unlike the optical properties of locust bean gum suspensions, the thermal diffusivity values of the suspensions show only a slight tendency to decrease as the concentration increases, with this decrease being more evident at high gum concentrations. This observation suggests that the thermal diffusivity is relatively insensitive to variations in the amount of gum within the concentration range studied.
These results show that the application of photothermal techniques (photopyroelectric technology, in particular) to measure optical properties overcomes the limitations of traditional spectroscopic techniques, which are affected by the high scattering index of viscous galactomannan solutions, even at low concentrations [
31]. In this context, the 1550 nm wavelength is particularly useful due to its high absorption by water, which generates a stable background signal. The gum’s absorption signal is “superimposed” on this background, allowing for a more reliable reading of the polysaccharide’s absorptivity [
32].
4. Discussion
We have determined that reliable optical detection of gums in suspension is possible at concentrations equal to or greater than 0.5 g/100 mL, specifically at wavelengths of 660 and 1550 nm, at which our methodology was sensitive enough [
32]. These sources of radiation are suitable because they use commercial diode lasers, which are available at affordable prices. The increase in optical absorption as the concentration increases could be explained by two main factors. First, higher concentrations imply a greater density of hydroxyl functional groups per unit volume, which exhibit overtone absorption bands especially at 1550 nm, thus increasing the net absorption. Second, the aggregation or clustering of gum particles at higher concentrations can increase light scattering, effectively extending the optical path and enhancing the probability of photon absorption. This combined effect of chemical group density and particle-induced scattering contributes to the nonlinear behavior observed in absorption as a function of concentration.
Other, perhaps more suitable sources of radiation could be used for the quantification of gums in suspension, especially in the mid-infrared region where –OH groups exhibit intense absorption bands associated with their vibrational modes. Nevertheless, their implementation would require substantial modifications to the experimental system. Among other technical adjustments, these modifications would include the use of optical windows made of materials that are transparent in this spectral region, which would entail a considerable increase in experimental costs.
These results open the possibility of applying this methodology for quantitative analysis of galactomannans in suspension, as part of quality control or characterization processes in many biotechnological and industrial food processing contexts [
33]. Furthermore, the calibration curve-free quantitative method employed here represents a significant advancement in polysaccharide characterization techniques. Its potential universality could streamline analyses across various polysaccharides, reducing calibration complexity and experimental costs. Highlighting and exploring this innovative aspect can substantially enhance the academic impact and practical adoption of photopyroelectric methodologies in polysaccharide research and industry.
Several prior works have demonstrated the effectiveness of photothermal techniques for characterizing biological or turbid systems, providing valuable context for our findings. For instance, Alvarado-Noguez et al. [
34] applied photothermal techniques to characterize
Curcuma longa, a plant-based turbid system, finding that photothermal methods were particularly suitable for materials where conventional spectroscopic techniques are limited by strong scattering. Furthermore, Cruz-San Martin et al. [
35] demonstrated that photopyroelectric configurations are capable of complete thermal characterization (including thermal conductivity and volumetric heat capacity) in liquids such as glycerol or olive oil, using both amplitude and phase fitting. While their media were homogeneous, our study extends the application of this technique to colloidal, optically scattering suspensions.
In our case, the variation in thermal diffusivity across different concentrations of locust bean gum was also minor. This behavior can be attributed more to physical properties such as water-binding capacity, viscosity, and colloidal structure than to the molecular structure itself. However, the specific arrangement of the galactomannan backbone, particularly the mannose-to-galactose ratio, indirectly influences these properties by modulating hydration and molecular packing. Increased water retention raises the effective heat capacity of the system, thus lowering thermal diffusivity, as observed in more hydrated or branched polysaccharide systems like guar gum.
In addition to the references already mentioned, further studies are using photopyroelectric or related photothermal techniques that provide useful benchmarks. In our previous work Balderas et al. [
36], we studied linear alcohols ranging from methanol to decanol using photopyroelectric techniques, demonstrating how molecular structure and the presence of hydroxyl functional groups influence both thermal transport and optical absorption properties. Notably, we observed that absorption increases with molecular size, which is consistent with our current findings at 1550 nm, where –OH overtones in locust bean gum contribute significantly to optical absorption. These parallels support the interpretation that the photopyroelectric technique is sensitive to vibrational modes associated with hydroxyl groups, even in more complex, colloidal systems.
These comparisons highlight the robustness of photopyroelectric techniques in handling complex materials. In particular, the constant phase criterion provides an effective way to validate the quality of optical absorption measurements in scattering media, a challenge also addressed in studies of phantom gels using pulsed photothermal radiometry [
37,
38]. These results support the suitability of our approach and reinforce its potential application in the broader context of biopolymer analysis under conditions where traditional methods are limited.
Unlike previous studies, this research represents the first application of the photopyroelectric technique for simultaneous dual-wavelength characterization (at 660 nm and 1550 nm) of locust bean gum in aqueous suspension. This dual-wavelength approach, combined with thermal characterization, provides a more comprehensive evaluation of the optical and thermal properties of LBG. Such integration enhances the analytical capability beyond what has been previously reported, especially under conditions of high optical scattering and viscosity typical of biopolymeric suspensions. Consequently, this methodology offers new perspectives for process monitoring and quality control in industrial applications where conventional optical methods are often limited. Furthermore, while photopyroelectric techniques have been applied to various biopolymeric and turbid systems, this study uniquely combines simultaneous dual-wavelength measurements with thermal characterization specifically for locust bean gum suspensions. This integrated approach enhances analytical capabilities beyond previous works by providing more detailed and reliable data on both optical and thermal properties under conditions that mimic industrial environments. Consequently, the methodology has clear potential for implementation in process monitoring and quality control, where traditional optical techniques face significant challenges due to scattering and viscosity.
Limitations and Future Perspectives
Despite the positive performance observed with the photopyroelectric technique, there are experimental limitations that must be considered in order to broaden its applicability in future studies. Firstly, the concentration range evaluated (0.5–2.5 g/100 mL) was defined based on preliminary experiments that revealed physical instability in locust bean gum suspensions at concentrations equal to or greater than 3.0 g/100 mL. At these levels, aggregation and lump formation were observed, which hindered proper homogenization of the system and compromised the quality and reliability of the recorded photothermal signals. In this context, although higher concentrations may be relevant for industrial formulations, the main limitation observed lies not in the instrumental sensitivity of the technique, but in the physicochemical properties of the system under study. Future research could focus on developing more effective dispersion strategies or employing experimental conditions with temperature control, with the aim of extending the range of analyzable concentrations in a robust and reproducible manner.
In addition to concentration-related constraints, another relevant limitation of the present study is that all measurements were conducted at room temperature, without evaluating the potential effects of thermal variation. Since both the optical absorption coefficient and thermal diffusivity are potentially temperature-dependent, particularly due to changes in hydrogen bonding and polymer solvent interactions. It would be relevant for future studies to systematically assess these parameters under controlled thermal conditions. This becomes especially important in applications involving thermal processing, such as food pasteurization, formulation stability, or pharmaceutical storage. Finally, it is important to emphasize both the advantages and limitations inherent to the photopyroelectric (PPE) technique itself. One of its main strengths is its low sensitivity to optical scattering, which enables reliable measurements in turbid or highly scattering media conditions under which conventional optical methods often prove inadequate. Additionally, the PPE technique is non-destructive and allows simultaneous thermal and optical characterization using relatively simple and cost-effective instrumentation. However, its spatial resolution is inherently constrained by the thermal diffusion length, and accurate data interpretation requires careful modeling, along with assumptions regarding sample homogeneity near the detection zone. These factors must be taken into account when applying the PPE technique to complex or heterogeneous systems. Moreover, such limitations also influenced the scope of this study, particularly in terms of the number of replicates and statistical treatment of the data. Despite these limitations, the method remains a robust and sensitive analytical tool, particularly well-suited for the characterization of biopolymeric suspensions and other challenging matrices.
