Featured Application
The investigation results demonstrated the feasibility of TiOF2/MnO(OH) and TiO2/Mn3O4 powders synthesized via the impregnation method for photocatalytic applications, especially for the degradation of methylene blue (MB).
Abstract
The heterostructures TiOF2/(0.5–5 wt.%)MnO(OH) attract attention as potential catalysts for pollutant removal from water. In this paper, a novel synthesis route was proposed through the precipitation of MnO(OH) particles out of an alkaline solution on the TiOF2 particles. The formation of manganese oxyhydroxide was confirmed by X-ray diffraction analysis. The presence of manganese in proportions up to 1 wt.% recalculated to MnO(OH) did not affect the morphology of TiOF2/MnO(OH) particles. Higher concentrations of Mn caused the appearance of mostly spherical particles of dimensions ca. 100 nm. The effect of calcination temperatures 300–600 °C on the structure and photocatalytic activity of the particles was analyzed. It was found that calcination of the powder formed TiO2 phase with mainly anatase structure as well as Mn3O4. After calcination at 600 °C, the appearance of fluorine was detected, indicating the formation of fluorinated titanium dioxide. For higher manganese concentrations, the fluorine proportion in F-TiO2 samples decreased. Increased Mn content in TiOF2/MnO(OH) significantly improved its photocatalytic activity, shortening the degradation time and increasing the degradation degree of methylene blue (MB). However, an increase in the calcination temperature decreased the degradation degree of MB. It was found that the optimal concentration of MnO(OH) was 5 wt.%.
1. Introduction
Titanium oxyfluoride TiOF2 is a wide bandgap semiconductor that finds applications in photocatalysis processes removing organic pollutants [1,2] and in lithium-ion batteries [3] due to its favorable chemical, optical, electrochemical, and photocatalytic characteristics. Moreover, it is used as a precursor for the synthesis of F-TiO2 that exhibits photocatalytic properties [4] and for a thermally stable anatase TiO2 photocatalyst [5].
The photocatalytic properties of TiO2 belong to the most explored application since it generates electron–hole pairs under light irradiation, providing active sites for the photocatalytic reactions [6]. It was demonstrated that TiO2/TiOF2 nanosheets exhibited high photocatalytic antibacterial efficiency due to the interface that acted as a transport path from TiO2 to TiOF2 for the photoexcited electrons [7]. Hou and co-authors [8] synthesized g-C3N4/TiOF2 heterostructure with enhanced photocatalytic activity for tetracycline hydrochloride (TCH) degradation under simulated solar light irradiation. Photocatalytic activity of TiOF2/(0.5–10 wt.%)CuO was assessed toward methylene blue (MB) and appeared to be higher than that of F-TiO2/CuO reported in [9].
Among transition metal oxides, manganese dioxide MnO2 is an important component that can increase the photocatalyst activity under visible light due to its narrow band gap, negatively charged surface, and large specific surface area [10,11]. The photocatalytic efficiency of α-MnO2 nanowires in degrading the antibiotic tetracycline was found to be advantageous [12]. Kovinchuk et al. [13] reported the coupling effects of nanoparticles TiO2 and MnO2 on the low-density polyethylene (PE) photocatalytic degradation. Ullah, and co-authors [14], demonstrated promising properties of TiO2 anchored α-MnO2 nanorods as a sunlight-driven photocatalyst for dye degradation. Li and collaborators [15] performed the synthesis of 3D hierarchical MnOx-TiO2 nanostructures with various morphologies and demonstrated their efficiency for photothermocatalysis of toluene and NO under UV light irradiation. They demonstrated the appearance of Mn3O4, Mn2O3, and MnO2 phases, dependent on the synthesis conditions.
Another manganese compound with promising photocatalytic properties is MnO(OH) [16]. Some papers reported high sorption capability of manganese oxyhydroxide compared to manganese oxides [17,18], but not many results are published concerning its photocatalytic properties. Zhao and co-authors [19] reported adsorption of tetracycline on the surface of MnO(OH)-hydroxyapatite nanowires, followed by its catalytic degradation via the generated reactive oxygen species. Ren and collaborators [20] explored a novel RuO2/MnO(OH) heterostructure with respect to the activation of peroxymonosulfate (PMS) for the degradation of organic pollutants like phenol in water. The degradation performance of the RuO2/MnO(OH)/PMS system was found advantageous, including phenol degradation rate, which was 68.8 times higher than that of the MnO(OH)/PMS system, with 98% removal reached after 10 h. Zheng et al. [21] synthesized a radialized nanostructure catalyst consisting of MnO(OH)/MnO2 nanosheets anchored with Pt single atoms and demonstrated its feasibility for indoor formaldehyde (HCHO) degradation. Sui and team [22] found that the presence of manganese vacancies in the γ-MnO(OH) phase significantly improved its catalytic activity toward the degradation of hexanal and its transformation into CO2. They demonstrated the ability to achieve 100% degradation of 15 ppm hexanal at a temperature of 85 °C.
Thus, manganese oxyhydroxide is known for its photocatalytic activity, which attracts scientific interest and is still not well examined. From the practical perspective, the combination of the titanium oxyfluoride with MnO(OH) appears to be promising and advantageous. The photocatalytic potential of such a heterostructure has not been investigated so far, to the best of our knowledge.
In the present paper, the properties of heterostructures TiOF2/(0.5–5 wt.%)MnO(OH) are explored. The particles were synthesized via the precipitation method with different concentrations of manganese in order to assess their effect on the photocatalytic activity towards methylene blue dye (MB). Moreover, the impact of thermal processing on the phase composition and structures, and subsequent photocatalytic activity under daylight, was investigated.
2. Materials and Methods
2.1. Reagents
For the experiments, metallic titanium marked BT1-00 was used, as well as 45.1% HF, nitric acid 56%, 1.35 g/cm3, manganese (II) chloride tetrahydrate, sodium hydroxide, and potassium permanganate. All the substances were delivered by CHEMLABORREACTIV LLC (Brovary, Ukraine) and were classified as chemically pure, without any additional purification. All the solutions were prepared using distilled water.
2.2. Synthesis of TiOF2
Metallic titanium in the amount of 10 g was put into a fluoroplastic vessel, and 30 mL of distilled water was added. After the addition of 60 mL of hydrofluoric acid, complete dissolution of the titanium was reached. Upon completion of the process, concentrated nitric acid was added drop by drop until the solution became discolored. The resulting colorless solution was evaporated in a sand bath until a dry powder of TiOF2 was formed. Like in the previous research [9], the obtained powder consisted of two phases: hexagonal h-TiOF2 space group (R3c) and cubic c-TiOF2 space group (Pm3m). The phases were obtained in a proportion of 2:3, respectively. TiOF2 consisted mainly of agglomerates of predominantly spherical shape with dimensions of up to several microns, formed by spherical particles with a diameter of up to 250 nm.
2.3. Synthesis of TiOF2/MnO(OH) Structures
In total, 5 g of titanium oxyfluoride powder was dispersed in 50 mL of distilled water for 20 min under an ultrasonic field at room temperature. Then, a sample of manganese chloride tetrahydrate was added in amounts of 0.5, 1, 2, and 5 wt.% MnO(OH) along with 20 mL of 10% sodium hydroxide solution. The obtained solution was mixed for 10 min, and then the calculated amount of potassium permanganate was added under continuous stirring. The solution was mixed using a magnetic stirrer for 1 h. After that, the sedimented substance was filtered out, washed several times with distilled water, and dried at a temperature of 60 °C for 24 h. The resulting heterostructures, TiOF2/MnO(OH), had a brown tint of intensity dependent on the manganese content. The samples underwent calcination at different temperatures, 300 °C, 400 °C, 500 °C, and 600 °C, in order to assess the temperature effect on the properties.
2.4. Photocatalytic Tests
The photocatalytic activity of the heterostructures synthesized at different temperatures was assessed by the reaction of methylene blue (MB) dye decomposition under ultraviolet light. For each reaction, 0.1 g of photocatalytic material was well dispersed in 50 mL of an aqueous solution of MB dye, C0 = 5.8 μmol/L. The photocatalyst mixed with dye was placed in an isolated, dark place, ensuring constant room temperature to achieve adsorption or desorption equilibrium.
Experiments on the catalytic decomposition of MB were conducted in a glass vessel at 25 °C with constant shaking. A DKB 9 UV lamp (Lisma, Saransk, Russia) with an effective spectral range of 180–275 nm was used as the irradiation source. The UV radiation intensity was approximately 3 mW/cm2. The lamp was positioned 10 cm above the solution. Before adding the catalyst, the maximum absorbance of the model solution was measured using a UV spectrophotometer in the 200–900 nm range. The pH of the MS solution was 6.5–6.6. Changes in the initial optical density were monitored by taking an aliquot of the solution at specified time intervals. The samples were subjected to spectroscopic analysis. Measurements in the absence of the lamp irradiation were conducted for the first 30 min. After 30 min of incubation, the solution was exposed to UV irradiation of wavelength ≥ 320 nm. The aliquots of equal volumes of reaction mixture were taken after 5, 10, 20, 30, 40, and 60 min to measure the absorption.
The equal aliquots were taken until the reaction mixture became colorless. Before spectroscopic measurements, the collected reaction fractions were centrifuged at 7000 rpm for 10 min to separate any nanomaterial due to background scattering during the measurements. The intensity change in the UV-Vis spectrograph at the characteristic MB peak of 664 nm was subsequently monitored to assess the degradation characteristics of the MB.
2.5. Equipment Used in the Research
The Fourier transform infrared spectroscopy (FTIR) analysis was performed using a Spectrum One FT-IR Spectrometer, made by PerkinElmer (Shelton, CT, USA), with the application of potassium bromide KBr tablets. The spectra in the area of 400–4000 cm−1 were registered at room temperature. Phase composition of the starting powders and the obtained samples was analyzed with the X-ray diffractometer Aeris Research (Malvern Panalytical, Malvern, UK) with a graphite monochromator and Cu Kα radiation.
Morphology of the obtained nanoparticles and their surfaces was analyzed using a scanning electron microscope (SEM) type JSM-6390LV equipped with an energy-dispersive (EDS) detector X-Max 50 (Oxford Instruments Analytical, Oxford, UK). The device provided high-resolution imaging of 15 nm at 1 kV and even 3.0 nm resolution at 30 kV, and enabled elemental identification and quantification.
Determination of MB dye concentration was carried out using a UV-5800 PC spectrophotometer delivered by Metash Instruments (Shanghai, China). The measurement range of the device was 190–1100 nm, and the bandwidth was 2 nm. The spectrometer ensured the wavelength accuracy of ±0.5 nm, while its photometric accuracy was assessed as ±0.3%T.
3. Results
3.1. Synthesis of TiOF2/MnO(OH) Heterostructure
XRD results of the samples obtained by precipitation of manganese oxyhydroxide in the presence of titanium oxyfluoride particles are shown in Figure 1. Reflections from the main phase of titanium oxyfluoride are present with cubic and hexagonal modifications. The proportion of the h-TiOF2:c-TiOF2 phases is around 4:1. In the diagram representing the sample synthesized with 0.5 wt.% manganese oxyhydroxide, no reflection related to MnO(OH) can be distinguished. As the manganese concentration increases to 1 wt.% (in terms of oxyhydroxide) and more, an increase in the intensity of the reflections corresponding to the manganese oxyhydroxide phase is noted. Dimensions and morphology of the particles synthesized with different proportions of MnO(OH) are shown in Figure 2.
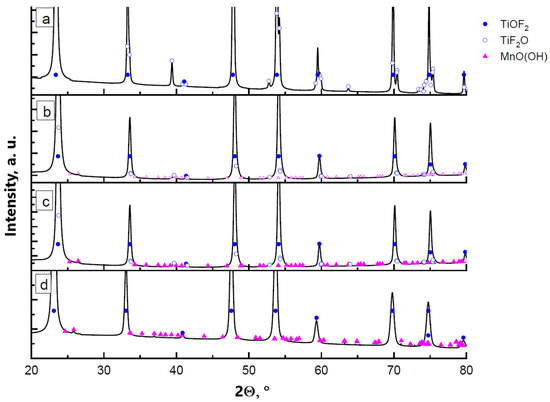
Figure 1.
XRD diagrams of the powder samples synthesized with different content of MnO(OH): (a) 0.5 wt.% MnO(OH); (b) 1 wt.% MnO(OH); (c) 2 wt.% MnO(OH); and (d) 5 wt.% MnO(OH).
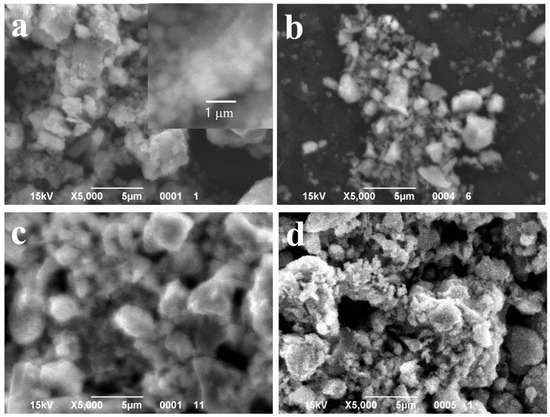
Figure 2.
SEM images of the powder samples synthesized with different content of MnO(OH): (a) 0.5 wt.% MnO(OH); (b) 1 wt.% MnO(OH); (c) 2 wt.% MnO(OH); and (d) 5 wt.% MnO(OH).
SEM images shown in Figure 2 revealed that the content of manganese oxyhydroxide up to 1 wt.% had a very small effect on the particles’ morphology. Figure 2a,b shows large agglomerates made up of spherical particles of diameter 250 nm, similar to TiOF2 powder. At higher concentrations of MnO(OH), small particles of spherical shape and diameters below 100 nm appeared on the surfaces of agglomerates.
Figure 3a shows the IR spectrum of the TiOF2/5 wt.% MnO(OH) heterostructure. Irrespective of the manganese amount, all spectra were identical, and they are not shown in the diagram.
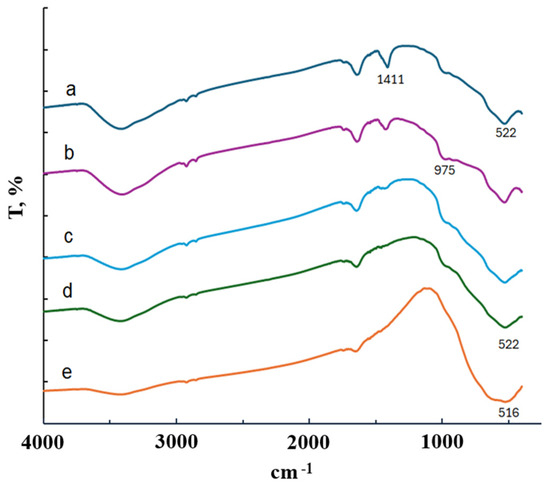
Figure 3.
IR spectra of TiOF2/5 wt.% MnO(OH): (a) before calcination; (b) after calcination at 300 °C; (c) after calcination at 400 °C; (d) after calcination at 500 °C; and (e) after calcination at 600 °C.
The IR spectrum in Figure 3a indicates an absorption band at 1411 cm−1 and a broad absorption band in the 1400–450 cm−1 region. The maxima at 975 cm−1 and 522 cm−1 can be attributed to the Ti–O–F bond and the stretching vibration of Ti–O, respectively [23]. However, absorption bands typical for MnO(OH) around 443 cm−1 and 505 cm−1 [17,18] cannot be distinguished, since they are covered by the strong, broad band of 1400–450 cm−1. A similar effect of band absence was observed in research on MnO(OH)-modified diatomite [24]. The absorption bands typical for MnO(OH) appeared in IR spectra only when its concentration was high, 30 wt.% or more. Thus, in order to keep the proportion of manganese under control, microanalysis was performed. Its results, confirming the real amounts of Mn in the samples, are collected in Table 1.

Table 1.
Results of microanalysis of TiOF2/MnO(OH).
3.2. Effect of the Calcination Temperature
The thermal decomposition process of the samples appeared to be similar for all tested concentrations of manganese. Figure 4 presents an example of XRD diagrams for the TiOF2/5 wt.%MnO(OH) sample calcined in air at different temperatures. The compound MnO(OH) underwent decomposition at temperatures above 200 °C with the formation of Mn3O4. It is worth noting that in the case of low manganese concentrations in TiOF2/0.5 wt.%MnO(OH), there are reflections in the XRD diagram that may be attributed to the Mn2O3 phase. An increase in the manganese content contributed to the oxidation of Mn2O3 to Mn3O4, and thus the XRD diagram mainly shows the Mn3O4 reflections. The results of calculations by the Rietveld method of the phase composition are collected in Table 2. The results demonstrated that the increase in calcination temperature caused an increase in the manganese oxide due to improved crystallinity under elevated temperatures. The hexagonal polymorph h-TiOF2 is unstable at temperatures above 300 °C and converts into the cubic c-TiOF2 phase [25], so that after calcination at 600 °C, no h-TiOF2 is present.
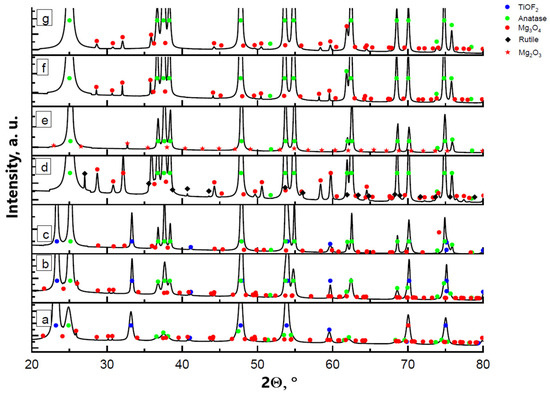
Figure 4.
XRD diagrams of TiOF2/5 wt.%MnO(OH) after calcination at different temperatures: (a) 300 °C; (b) 400 °C; (c) 500 °C; (d) 600 °C; as well as (e) TiOF2/0.5 wt.%MnO(OH) after calcination at 600 °C; (f) TiOF2/1 wt.%MnO(OH) at 600 °C; and (g) TiOF2/2 wt.%MnO(OH) at 600 °C.
Table 2.
Proportion of different phases in TiOF2/MnO(OH).
Titanium oxide TiO2 is formed with anatase structure at temperatures 300–600 °C, as seen in Figure 4a–d. Anatase and rutile phases are both used in photocatalysis, but rutile is more stable in ambient conditions, while the anatase phase is more active [26]. In the case of TiOF2/5 wt.%MnO(OH) after calcination at 600 °C, the appearance of the rutile phase was noted. However, when the manganese content was decreased, the formation of the rutile TiO2 did not occur. A similar phenomenon of the rutile structure formation was observed after the doping of titania with copper oxide [9,27], which was explained by the partial replacement of the Ti4+ ions of ionic radius 0.68 Ả with Cu2+ ones of ionic radius 0.73 Ả in the titanium dioxide structure. The process was accompanied by the densification of the TiO2 lattice, which, in turn, promoted the formation of a more compact crystal structure of rutile. In the presently investigated process, manganese oxide Mn3O4 is formed during the calcination, which contains in its structure Mn3+ ions of ionic radius 0.64 Ả and Mn2+ of ionic radius 0.81 Ả. Due to the close values of the ionic radii of Mn3+ and Ti4+, replacement of titanium ions should be expected in the titania crystal lattice structure. However, the presence of the Mn2+ ion with a much larger ionic radius may prevent ion replacement in the anatase structure.
The IR spectra presented in Figure 3b are in conformity with the XRD results. With the increase in calcination temperature, a reduction in the absorption band intensity at 975 cm−1 is seen, which corresponds with the stretching vibration of the bond Ti–O–F. The IR spectrum of the sample calcined at 600 °C fully corresponds to that of titania. Notably, irrespective of the manganese content, only the anatase phase is formed (Figure 4d–g).
The results of elemental analysis presented in Table 1 showed that during the calcination, the content of fluorine decreased, accompanied by the respective increase in titanium and oxygen content. However, after calcination at 600 °C, a concentration of 2–4 wt.% fluorine indicated formation of fluorinated titanium dioxide F-TiO2 [28]. At the same time, an increase in the manganese concentration caused a decrease in the fluorine in the F-TiO2 samples after calcination. It should be noted that such an effect of manganese on the formation of F-TiO2 differs significantly from the processes of CuO modification [9,23], where higher copper concentration caused an increase in the fluorine content.
SEM images of the particles with different MnO(OH) concentrations are presented in Figure 5, Figure 6 and Figure 7. For the particles with 0.5 wt.% MnO(OH) shown in Figure 5, a decrease in the large agglomerate dimensions can be noted along with the formation of finely dispersed spherical particles with diameters ca. 150–300 nm. An increase in the MnO(OH) content up to 2 wt.% illustrated in Figure 6, with subsequent calcination at 300–500 °C, caused a further decrease in agglomerate dimensions. In addition, after calcination at 600 °C, along with particles of 150–300 nm diameters, the larger ones of ca. 0.5 μm can be seen. Further increase in the MnO(OH) content up to 5 wt.% with subsequent calcination at 300–500 °C caused no significant differences, while after calcination at 600 °C, particles of various shapes up to several micrometers in size were formed.
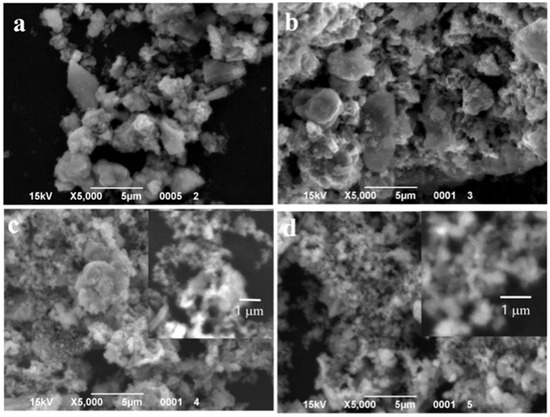
Figure 5.
SEM images of the samples with 0.5 wt.% MnO(OH) after calcination at different temperatures: (a) 300 °C; (b) 400 °C; (c) 500 °C; and (d) 600 °C.
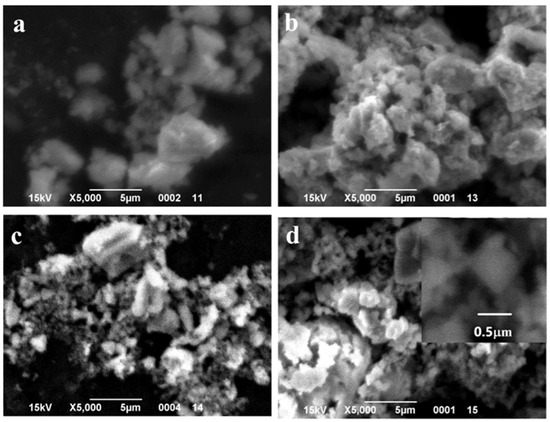
Figure 6.
SEM images of the samples with 2 wt.% MnO(OH) after calcination at different temperatures: (a) 300 °C; (b) 400 °C; (c) 500 °C; and (d) 600 °C.
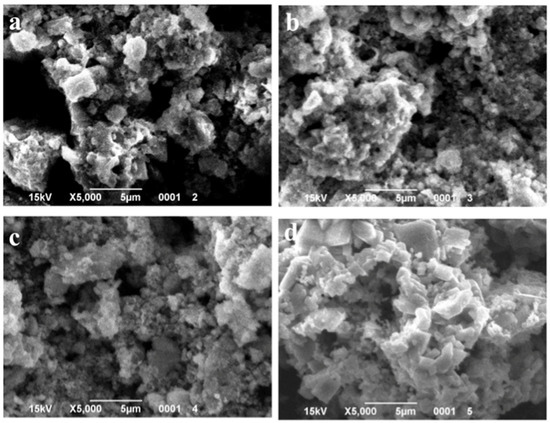
Figure 7.
SEM images of the samples with 5 wt.% MnO(OH) after calcination at different temperatures: (a) 300 °C; (b) 400 °C; (c) 500 °C; and (d) 600 °C.
3.3. Photocatalytic Activity
The powder samples before and after calcination were used to test the photocatalytic activity toward the methylene blue (MB) dye. We found no reason to assume a different reaction sequence for the photocatalytic decomposition of MB than that described by Dariani et al. [29] or Wang and co-authors [30]. Similarly, the effect of pH on MB photodegradation was considered established and well known. Higher values of degradation efficiency η were obtained in alkaline environments than in acidic and neutral ones, in which OH− can react directly with a hole to form a hydroxyl radical [31]. According to this research, high activity of the photocatalyst was demonstrated through high degradation degree of MB in a neutral pH environment.
The samples that did not undergo calcination are denoted as 20 °C in Figure 8, Figure 9 and Figure 10. Diagrams presented in Figure 8 illustrate the effect of the calcination temperatures on MB decomposition kinetics for two manganese concentrations, 0.5 wt.% and 5 wt.%. Clearly, an increase in manganese content significantly increased the decomposition degree and shortened its time. It can be concluded that the photocatalytic process is completed between 10 and 20 min, since after 20 min, very small differences can be noted.
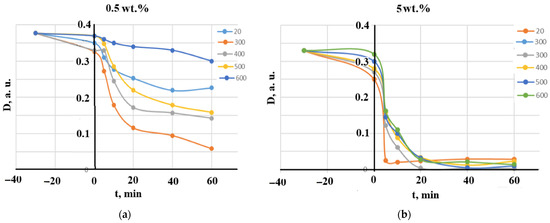
Figure 8.
The effect of the calcination temperatures on MB decomposition kinetics: (a) 0.5 wt.% MnO(OH) and (b) 5 wt.% MnO(OH).
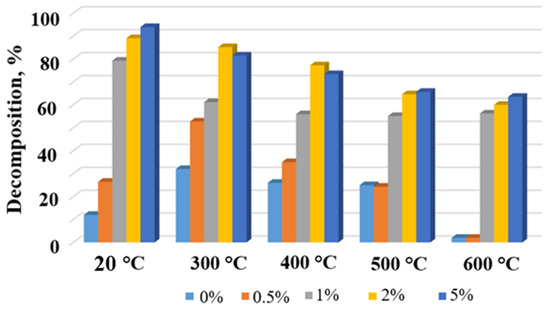
Figure 9.
Degradation degree of MB in the presence of the TiOF2/MnO(OH) particles with different manganese concentrations and after calcination at different temperatures.
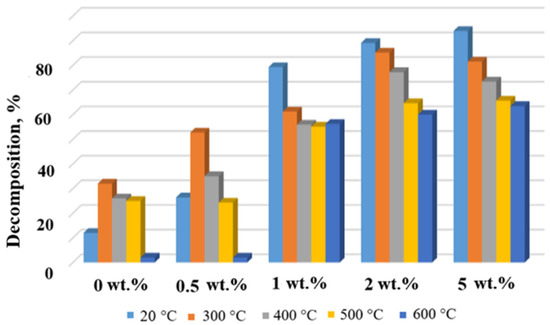
Figure 10.
Degradation degree of MB in the presence of the TiOF2/MnO(OH) particles after calcination at different temperatures.
Histograms in Figure 9 and Figure 10 show the dependence of MB concentration after 10 min of irradiation in the presence of a respective photocatalyst calcined at different temperatures. Evidently, the general trend seen from Figure 9 and Figure 10 indicates a decrease in the degree of MB decomposition with the increase in calcination temperature. This effect is especially seen in the case of Mn concentrations of 1 wt.% and higher. At the same time, for each calcination temperature, higher concentrations of manganese generally ensured higher degrees of MB destruction, with the exceptions of 2 wt.% and 5 wt.% and temperatures 300 °C and 400 °C.
The decreasing trend of the MB decomposition degree with the calcination temperature increase is clearly seen in Figure 8, Figure 9 and Figure 10. It can be explained by the intensification of thermal decomposition of titanium oxyfluoride and manganese oxyhydroxide with the formation of titanium and manganese oxides, respectively. Lower concentrations of the active components resulted in reduced catalytic activity.
Increased content of manganese in the powders calcined at 500–600 °C caused a significant decrease in their photocatalytic activities. From Table 1, it was seen that the elevated temperatures decreased fluorine content, which, in turn, caused a decrease in the MB decomposition degree. Moreover, two concurrent reactions took place, directly related to the presence of the manganese ions. The first one was the oxidation–reduction reaction associated with variable valence of manganese [32], while the second one blocked light absorption and reduced photocatalytic activity due to the effective decomposition of O3 in the presence of a catalyst Mn/TiO2 [33].
The results indicate that titanium oxyfluoride doped with manganese hydroxide is a promising photocatalyst. The results presented in Figure 8 demonstrated completion of the photocatalytic process between 10 and 20 min, while the recent report [34] registered 85% decomposition of MB after 300 min UV irradiation in the presence of TiO2. Similarly, in the paper [9], it was demonstrated that decomposition of MB took 30 min in the presence of TiOF2/CuO. From this perspective, TiOF2/MnO(OH) heterostructures appear to be a competitive alternative.
4. Conclusions
The heterostructures TiOF2/(0.5–5 wt.%)MnO(OH) were synthesized via the impregnation method from alkaline solutions of Mn2+ and MnO4−. Introduction of manganese up to 1 wt.% recalculated to MnO(OH) had no significant effect on the particle morphology, namely, TiOF2/MnO(OH) particles of diameter ca. 250 nm formed large agglomerates. However, when MnO(OH) content was further increased, some small spherical particles of size ca. 100 nm appeared on the surfaces of the agglomerates.
Calcination of TiOF2/MnO(OH) powders caused the formation of TiO2 of anatase structure and Mn3O4. An increase in manganese concentration up to 5 wt.% recalculated to MnO(OH) enabled formation of rutile phase. The phenomenon was attributed to the partial replacement of Ti4+ ions in the titania lattice structure and its respective densification.
Appearance of fluorine after calcination at 600 °C indicated formation of fluorinated titanium dioxide, F-TiO2. It was noted that higher proportions of manganese contributed to the decrease in fluorine concentration.
Photocatalytic activity of the TiOF2/MnO(OH) heterostructures was assessed against MB dye before and after calcination at different temperatures. Increased manganese concentration significantly increased the degree of MB degradation and shortened process duration. However, calcination appeared to be unfavorable, since an increase in its temperature caused decreased photocatalytic degradation of MB. In general, results demonstrated the feasibility of photocatalytic applications of TiOF2/MnO(OH) and TiO2/Mn3O4 powders synthesized via the impregnation method.
The results indicated that the superior photocatalytic activity exhibited by TiOF2/MnO(OH) was achieved without subsequent calcination. It can also be concluded that the optimal proportion of manganese oxyhydroxide was 5 wt.%.
Author Contributions
Conceptualization, D.S. and P.M.; methodology, L.F. and M.R.; software, P.M.; validation, M.R. and P.M.; formal analysis, M.R. and P.M.; investigation, L.F. and V.B.; resources, L.F.; data curation, L.F. and V.B.; writing—original draft preparation, D.S.; writing—review and editing, L.F., M.R., P.M. and V.B.; visualization, M.R. and V.B.; supervision, D.S.; project administration, D.S.; funding acquisition, D.S. All authors have read and agreed to the published version of the manuscript.
Funding
This research was supported by the National Academy of Sciences of Ukraine, grant number 0123U101249.
Institutional Review Board Statement
Not applicable.
Informed Consent Statement
Not applicable.
Data Availability Statement
Data is included in the paper.
Conflicts of Interest
The authors declare no conflicts of interest.
References
- Kowalkińska, M.; Keller, N.; Fresno, F.; Colbeau-Justin, C.; Zielińska-Jurek, A. Insight into charge carrier dynamics and interface design of {001} TiO2 coupled with TiOF2 for photocatalytic degradation of contaminants of emerging concern. Appl. Surf. Sci. 2025, 695, 162893. [Google Scholar] [CrossRef]
- Liu, Y.; Ma, Z. TiOF2/g-C3N4 composite for visible-light driven photocatalysis. Colloids Surf. A Physicochem. Eng. Asp. 2021, 618, 126471. [Google Scholar] [CrossRef]
- Yu, J.; Tang, Q.; Liu, Y.; Zhu, Y.; Zhang, J.; Wang, J.; Li, L. Construction of TiO2/TiOF2 heterojunction as a cathode material for high-performance Mg2+/Li+ hybrid-ion batteries. J. Colloid Interface Sci. 2023, 646, 587–596. [Google Scholar] [CrossRef] [PubMed]
- Sivapatarnkun, J.; Hathaisamit, K.; Pudwat, S. High photocatalytic activity of F-TiO2 on activated carbon. Mater. Today Proc. 2017, 4, 6495–6501. [Google Scholar] [CrossRef]
- Lv, K.; Yu, J.; Cui, L.; Chen, S.; Li, M. Preparation of thermally stable anatase TiO2 photocatalyst from TiOF2 precursor and its photocatalytic activity. J. Alloys Compd. 2011, 509, 4557–4562. [Google Scholar] [CrossRef]
- Palliyalil, A.V.; Ullattil, S.G. TiO2 mesocrystals: Recent progress in synthesis, structure, and photocatalytic applications. Adv. Compos. Hybrid Mater. 2025, 8, 279. [Google Scholar] [CrossRef]
- Chen, Y.; Wang, X.; Zeng, Z.; Lv, M.; Wang, K.; Wang, H.; Tang, X. Towards molecular understanding of surface and interface catalytic engineering in TiO2/TiOF2 nanosheets photocatalytic antibacterial under visible light irradiation. J. Hazard. Mater. 2024, 465, 133429. [Google Scholar] [CrossRef]
- Hou, C.; Niu, M.; Hao, J.; Liu, Q.; Wang, X.; Zhang, M.; Wang, L. Construction of an S-scheme g-C3N4/TiOF2 Heterostructures with abundant O vacancies: Enhanced photocatalytic activity and mechanism insight. J. Alloys Compd. 2023, 938, 168560. [Google Scholar] [CrossRef]
- Sofronov, D.S.; Lebedynskiy, O.M.; Rucki, M.; Frolova, L.A.; Mateychenko, P.V.; Minenko, S.S.; Stawarz, S. A study on synthesis of TiOF2/CuO particles via impregnation method and their further transformation to F-TiO2/CuO. Mater. Sci. Eng. B 2025, 314, 118027. [Google Scholar] [CrossRef]
- Barreca, D.; Gri, F.; Gasparotto, A.; Altantzis, T.; Gombac, V.; Fornasiero, P.; Maccato, C. Insights into the plasma-assisted fabrication and nanoscopic investigation of tailored MnO2 nanomaterials. Inorg. Chem. 2018, 57, 14564–14573. [Google Scholar] [CrossRef]
- Mondal, D.; Das, S.; Paul, B.K.; Bhattacharya, D.; Ghoshal, D.; Gayen, A.L.; Das, K.; Das, S. Size engineered Cu-doped α-MnO2 nanoparticles for exaggerated photocatalytic activity and energy storage application. Mater. Res. Bull. 2019, 115, 159–169. [Google Scholar] [CrossRef]
- Shaly, A.A.; Priya, G.H.; Matharasi, A.; Prabha, A.S.; Linet, J.M. The nature and role of α-MnO2 nanowires in the photocatalytic degradation of the antibiotic tetracycline. Mater. Today Proc. 2022, 68 Pt 3, 282–286. [Google Scholar] [CrossRef]
- Kovinchuk, I.; Haiuk, N.; Lazzara, G.; Cavallaro, G.; Sokolsky, G. Enhanced photocatalytic degradation of PE film by anatase/γ-MnO2. Polym. Degrad. Stab. 2023, 210, 110295. [Google Scholar] [CrossRef]
- Ullah, A.; Rahman, L.; Hussain, S.Z.; Abbas, W.; Tawab, A.; Jilani, A.; Bajwa, S.Z.; Khan, W.S.; Riaz, R.; Hussain, I.; et al. Mechanistic insight of dye degradation using TiO2 anchored α-MnO2 nanorods as promising sunlight driven photocatalyst. Mater. Sci. Eng. B 2021, 271, 115257. [Google Scholar] [CrossRef]
- Li, M.; Wang, Y.; Fan, Y.; Liao, L.; Zhou, X.; Mo, S.; Wang, H. Controllable synthesis various morphologies of 3D hierarchical MnOx-TiO2 nanocatalysts for photothermocatalysis toluene and NO with free-ammonia. J. Colloid Interface Sci. 2022, 608 Pt 3, 3004–3012. [Google Scholar] [CrossRef]
- Li, X.; Wang, J.; Xue, H.; Zhao, L.; Lu, J.; Zhang, H.; Yan, M.; Deng, F.; Hu, C. Tuning α-MnOOH Formation via Atomic-Level Fe Introduction for Superior OER Performance. Adv. Funct. Mater. 2025, 35, 2503360. [Google Scholar] [CrossRef]
- Sofronov, D.; Krasnopyorova, A.; Efimova, N.; Oreshina, A.; Bryleva, E.; Yuhno, G.; Lavrynenko, S.; Rucki, M. Extraction of radionuclides of cerium, europium, cobalt and strontium with Mn3O4, MnO2, and MnOOH sorbents. Process Saf. Environ. Prot. 2019, 125, 157–163. [Google Scholar] [CrossRef]
- Arya, P.; Singh, A.; Singh, I.B. Facile Synthesis of Manganese Oxyhydroxide (MnOOH) Nanowires for the Capacitors Application. Appl. Innov. Res. 2019, 1, 58–61. [Google Scholar]
- Zhao, S.; Zhou, M.; Ren, J.; Zhang, Y.; He, Y.; Wang, R. Synthesis of MnOOH-hydroxyapatite nanowires for degradation of tetracycline. J. Environ. Chem. Eng. 2023, 11, 111577. [Google Scholar] [CrossRef]
- Ren, Z.; Che, X.; Wang, Q.; Zhang, F.; Han, J.; Zhou, C.; Liang, L.; Zhu, J.; Li, Z.; Li, G.; et al. RuO2/MnOOH heterojunctions promotes the formation of high-valent metal-oxo species for ultrafast removal of organic pollutants. Appl. Catal. B Environ. Energy 2025, 371, 125176. [Google Scholar] [CrossRef]
- Zheng, J.Y.; Zhou, K.L.; Zhao, W.K.; Wang, Y.; He, J.; Wang, X.; Wang, H.; Yan, H.; Han, C.B. Enhanced the synergistic degradation effect between active hydroxyl and reactive oxygen species for indoor formaldehyde based on platinum atoms modified MnOOH/MnO2 catalyst. J. Colloid Interface Sci. 2022, 628 Pt B, 359–370. [Google Scholar] [CrossRef]
- Sui, S.; Zhang, P.; Zhang, H.; Cao, R. Low-temperature catalytic degradation of the odorous pollutant hexanal by γ-MnOOH: The effect of Mn vacancies. Chin. J. Catal. 2019, 40, 1525–1533. [Google Scholar] [CrossRef]
- Sofronov, D.S.; Lebedynskiy, O.M.; Rucki, M.; Mateychenko, P.V.; Minenko, S.S.; Shaposhnyk, A.M.; Krzysiak, Z. A novel method of TiOF2 particles synthesis out of fluoride solutions. J. Alloys Compd. 2023, 966, 171646. [Google Scholar] [CrossRef]
- Sofronov, D.; Rucki, M.; Varchenko, V.; Bryleva, E.; Mateychenko, P.; Lebedynskiy, A. Removal of europium, cobalt and strontium from water solutions using MnO(OH)-modified diatomite. J. Environ. Chem. Eng. 2022, 10, 106944. [Google Scholar] [CrossRef]
- Shian, S.; Sandhage, K.H. Hexagonal and cubic TiOF2. J. Appl. Crystallogr. 2010, 43, 757–761. [Google Scholar] [CrossRef]
- Kovačič, Ž.; Likozar, B.; Huš, M. Electronic properties of rutile and anatase TiO2 and their effect on CO2 adsorption: A comparison of first principle approaches. Fuel 2022, 328, 125322. [Google Scholar] [CrossRef]
- Lin, C.-J.; Yang, W.-T. Ordered mesostructured Cu-doped TiO2 spheres as active visible-light-driven photocatalysts for degradation of paracetamol. Chem. Eng. J. 2014, 237, 131–137. [Google Scholar] [CrossRef]
- Dozzi, M.V.; D’Andrea, C.; Ohtani, B.; Valentini, G.; Selli, E. Fluorine-doped TiO2 materials: Photocatalytic activity vs timeresolved photoluminescence. J. Phys. Chem. C 2013, 117, 25586–25595. [Google Scholar] [CrossRef]
- Dariani, R.S.; Esmaeili, A.; Mortezaali, A.; Dehghanpour, S. Photocatalytic reaction and degradation of methylene blue on TiO2 nano-sized particles. Optik 2016, 127, 7143–7154. [Google Scholar] [CrossRef]
- Wang, Y.; Zhang, Y.; Liu, Y.; Wu, Z. Fluorine-induced oxygen vacancies on TiO2 nanosheets for photocatalytic indoor VOCs degradation. Appl. Catal. B Environ. 2022, 316, 121610. [Google Scholar] [CrossRef]
- Göktaş, S. Synergic effects of pH, reaction temperature, and various light sources on the photodegradation of methylene blue without photocatalyst: A relatively high degradation efficiency. Chem. Afr. 2024, 7, 4425–4437. [Google Scholar] [CrossRef]
- Frolova, L.A.; Khmelenko, O.V. The study of Co–Ni-Mn ferrites for the catalytic decomposition of 4-nitrophenol. Catal. Lett. 2021, 151, 1522–1533. [Google Scholar] [CrossRef]
- Zhang, Y.; Wu, M.; Wang, Y.; Kwok, Y.H.; Pan, W.; Szeto, W.; Huang, H.; Leung, D.Y.C. Fluorinated TiO2 coupling with α-MnO2 nanowires supported on different substrates for photocatalytic VOCs abatement under vacuum ultraviolet irradiation. Appl. Catal. B Environ. 2021, 280, 119388. [Google Scholar] [CrossRef]
- Sonu, K.; Puttaiah, S.H.; Raghavan, V.S.; Gorthi, S.S. Photocatalytic degradation of MB by TiO2: Studies on recycle and reuse of photocatalyst and treated water for seed germination. Environ. Sci. Pollut. Res. 2021, 28, 48742. [Google Scholar] [CrossRef] [PubMed]


Disclaimer/Publisher’s Note: The statements, opinions and data contained in all publications are solely those of the individual author(s) and contributor(s) and not of MDPI and/or the editor(s). MDPI and/or the editor(s) disclaim responsibility for any injury to people or property resulting from any ideas, methods, instructions or products referred to in the content. |
© 2025 by the authors. Licensee MDPI, Basel, Switzerland. This article is an open access article distributed under the terms and conditions of the Creative Commons Attribution (CC BY) license (https://creativecommons.org/licenses/by/4.0/).