Abstract
A complex problem when outsourcing personal data for public use is balancing privacy protection with utility, and anonymization is a viable solution to address this issue. However, conventional anonymization methods often overlook global information regarding the composition of attributes in data, leading to unnecessary computations and high utility loss. To address these problems, we propose a curriculum learning (CL)-based, pattern-aware privacy-preserving scheme that exploits information about attribute composition in the data to enhance utility and privacy without performing unnecessary computations. The CL approach significantly reduces time overheads by sorting data by complexity, and only the most complex (e.g., privacy-sensitive) parts of the data are processed. Our scheme considers both diversity and similarity when forming clusters to effectively address the privacy–utility trade-off. Our scheme prevents substantial changes in data during generalization by protecting generic portions of the data from futile anonymization, and only a limited amount of data is anonymized through a joint application of differential privacy and k-anonymity. We attain promising results by rigorously testing the proposed scheme on three benchmark datasets. Compared to recent anonymization methods, our scheme reduces time complexity by 74.33%, improves data utility by 19.67% and 68.33% across two evaluation metrics, and enhances privacy protection by 29.19%. Our scheme performs 82.66% fewer lookups in generalization hierarchies than existing anonymization methods. In addition, our scheme is very lightweight and is 1.95× faster than the parallel implementation architectures. Our scheme can effectively solve the trade-off between privacy and utility better than prior works in outsourcing personal data enclosed in tabular form.
1. Introduction
Massive data outsourcing is vital in the era of big data because it can provide enormous revenue/business opportunities to companies when analyzed with data mining tools. However, data often include sensitive information about individuals (e.g., medical conditions, monthly income), and privacy preservation has become a significant concern when outsourcing data from data-owner environments (e.g., hospitals, banks) to the public domain [1,2]. In data outsourcing, both privacy and utility are equally important to enable knowledge discovery while safeguarding privacy. However, there exists a strong trade-off between privacy and utility (achieving one may sacrifice the other), and there is a pressing demand for practical methods that can simultaneously achieve these two competing goals. In 2023, the U.S. Department of Commerce published a report on effectively preserving the privacy of government data, which cites the ever-increasing demand for privacy preservation in data processing and outsourcing [3].
To address privacy issues in data outsourcing, technical solutions such as encryption, masking, differential privacy (DP), and anonymization are employed. Although DP [4] has become the mainstream solution for privacy preservation due to its strong mathematical guarantees, it often introduces more noise, which can make data less useful to data miners [5]. Encryption is another widely used privacy-preserving method for outsourcing data in the cloud. Other solutions notwithstanding, anonymization has become widely adopted owing to its conceptual simplicity and scalability. Anonymization methods usually modify the values of some attributes in the data to preserve individual privacy while maintaining data utility. Thus far, plenty of methods have been proposed, which are mainly the extensions of three state-of-the-art (SOTA) methods: k-anonymity [6], ℓ-diversity [7], and t-closeness [8]. In these models, strict privacy constraints are enforced to ensure privacy, but the resulting data quality is usually poor. To address the utility issues in these models, many derivative methods have been proposed. Notably, some methods cluster similar users and subsequently apply generalization to preserve both privacy and utility [9]. Though such methods improve on prior methods, they still face three critical problems.
- Most clustering-based anonymity methods often ignore valuable knowledge about the composition of attributes in the data and perform extensive (but often unnecessary) sequences of operations while anonymizing data, particularly when clustering users, leading to significant time overhead from irrelevant computations. Also, to accelerate clustering, some methods delete infrequent parts (e.g., complex parts) of the data, which can lead to incorrect conclusions and unfair decisions in real-world scenarios [10].
- Prior methods do not check for the possibility of general patterns in the data (e.g., portions that do not violate individual privacy [11]) to protect some parts of the data from the generalization process. Neglecting the possibility of such general patterns and instead processing all the data can lead to excessive lookups in the generalization hierarchies and significant information loss. Although there are some methods for protecting the privacy of time-series data that take into account data patterns, such data lacks personally identifiable information. Furthermore, the data generalization process in those methods is not adaptive to pattern information.
- Most methods do not ensure adequate diversity in the sensitive attribute (SA) column, and perform generalization in a fixed manner, which can lead to a significant loss of granularity [12,13]. Generalization performed rigidly without considering SA diversity is problematic because it exposes users to privacy issues when data are skewed and incurs hefty utility losses when data are balanced.
To address the above problems in prior methods, we propose and implement curriculum learning (CL) combined with a pattern-aware, highly efficient, privacy-preserving scheme for outsourcing data without compromising privacy and data usability. The main idea is to exploit the information about the composition and structure of attributes in the data by using the CL approach to sort the data by complexity before clustering. By doing so, unnecessary computational operations are avoided during clustering, as a reasonable quantity of data naturally clusters owing to row-wise similarities in attribute values. In data generalization, we divide the data into general and specific parts, so that anonymity is applied only to the specific parts that are more prone to privacy leaks, rather than unnecessarily distorting the entire dataset as most previous methods do. By restricting unneeded changes in anonymized data, adequate knowledge is preserved for information consumers while safeguarding privacy. The proposed scheme is the maiden attempt to address three key problems in prior clustering-based methods while ensuring superiority in terms of utility, privacy, and computational time. Our scheme is most suitable for personal data presented in tabular form, with data size remaining static. Our key contributions are explained below.
- This paper proposes a novel curriculum learning (CL) and pattern-aware privacy protection scheme that effectively meets the growing demand for privacy and data usability while preventing unnecessary computational operations.
- To prevent unnecessary computation while clustering users, we propose a CL-based procedure to sort the data based on complexities; the portion with high cohesion is considered naturally clustered and is not processed further to speed up the clustering process.
- To solve the problem of extensive lookups in generalization hierarchies and to limit heavier changes in the data, we devise an intelligent abstract-and-preserve strategy. Our strategy exploits the correlations among attributes to separate general patterns (population-level information) from specific patterns (sample-level information). Differing from previous work, we apply anonymity only to specific portions (the riskier ones) rather than to the entire dataset.
- To tackle the privacy preservation problem without losing guarantees on data usability, we consider diversity and pattern information in each cluster and make the generalization process adaptive based on them. If diversity requirements are met in a cluster, the fewest changes are made, and vice versa. We transform numeric data via the Laplace mechanism (LM) with a variable , and we apply the least generalization possible to the categorical part in most clusters, considering diversity and patterns.
- Experimentation across three benchmark datasets proves the efficacy of our scheme in real-world scenarios. Our scheme significantly outperforms the recent SOTA methods across three crucial objectives: privacy, data usability, and computing time.
The rest of this paper is structured as follows. Section 2 provides background related to the subject matter in this paper and discusses relevant SOTA studies. Section 3 provides an overview of the data, the system model, the privacy model, and the threat model. Section 4 explains the proposed scheme and its technical steps in detail. The performance evaluation and results from using real-world benchmark datasets are given in Section 5, and the results are contrasted and evaluated. Section 6 summarizes the challenges addressed in SOTA privacy methods, robustness, applicability of the proposed scheme for practical use in the modern era, and applicability to large or high-dimensional datasets. We conclude this paper in Section 7.
2. Background and Related Work
Privacy is all about hiding sensitive information from the general public. Sensitive information can include contracted diseases, monthly income, sexual preferences, and/or religious/political views. Privacy has many shades and is very hard to define firmly. With the advent of legal measures (i.e., privacy laws), privacy preservation has become a must for data owners who collect and process personal data. This work falls within the scope of information privacy, which concerns personal data primarily presented in tabular form. Tabular data can enclose different kinds of attributes for individuals. For example, in healthcare data, there is an individual’s medical history, birth date, age, etc. Table 1 presents an example of personal data enclosed in tabular form. Specifically, it shows information on nine individuals ( to ), where each row corresponds to one person and each column represents a single type of information.

Table 1.
Overview of tabular/relational data.
In the privacy literature, attributes can be divided into four distinct categories: explicit identifiers (EIs), non-sensitive attributes (NSAs), SAs, and quasi-identifiers (QIs). Definitions of each attribute type with examples are discussed in Arshad et al. [14]. Table 1 breaks down as follows: (name → EI), (sex, age, race → QI), (disease→ SA), (height → NSA). All these attributes are processed differently during anonymization. EIs are removed, QIs are generalized/noised, and SAs are published as is. NSAs are usually not collected from users. In some cases, NSAs are also released in pure form in anonymized data, as they have minimal impact on privacy.
It is worth noting that releasing anonymized data, especially those with sensitive information and many QIs, is inherently risky. However, in the current data-driven era, the demand for precise analytics (e.g., data-driven products, personalized service) has increased manifold, and current anonymization solutions are under huge criticism due to two key problems (https://standards.ieee.org/industry-connections/activities/synthetic-data/, accessed on 25 August 2025): (1) all directly identifiable parts of the data are removed before anonymization, and (2) the remaining data are heavily distorted, leading to poor contribution in open science or innovation. Considering these drawbacks, the researchers are exploring alternative solutions to make data ready for precise analytics without compromising privacy. Recently, synthetic data (SD) has emerged as an alternative to releasing synthesized datasets, especially those containing sensitive information and many QIs [15]. SD is legally compliant and not inherently risky, even if directly identifying information is retained in it. Conversely, some researchers have suggested ways to skip heavier anonymization when a particular QI is unavailable in some public repositories [16]. In this work, we consider a few attributes as QIs, remove the EI before anonymization, and apply selective anonymization by exploiting the attribute composition in the data with respect to privacy risks. Based on the above research trends and the considerations required for the anonymization process, the anonymized data are not inherently risky.
Anonymization plays a vital role in secondary data use and enables unconstrained analysis. Numerous advanced techniques, such as local differential privacy, (,)-differential privacy, and homomorphic encryption, offer stronger privacy and utility guarantees and can be applied to similar scenarios. However, these techniques are mostly suited to crowd-sourced data collection [17], query execution (constrained analysis), or data security when transferred from one environment to another. In contrast, anonymization is well suited to scenarios in which data are already aggregated and data owners intend to release them in full form for analytical purposes. Lastly, after processing, the anonymized data can be used for diverse downstream tasks (e.g., training classifiers, performing statistical analysis).
Thus far, several studies have been published on anonymization, addressing many critical problems in this field. We provide a concise review of papers that integrate clustering methods with anonymization to enhance utility or reduce information loss (IL), as well as methods to reduce computational overhead. Moqurrab et al. [18] developed a framework to resolve the privacy–utility trade-off by using stratified sampling and generalization methods in e-health scenarios. Onesimu et al. [19] developed a clustering-based method for privacy-preserving data collection to protect against privacy attacks. The proposed method offered greater utility in defending against three basic and three advanced attacks. Xia et al. [20] developed a clustering algorithm based on a binary tree to cluster users and reduce IL. However, their proposed method did not account for diversity in SAs, and therefore, SAs could be leaked. Similarly, another study combined the k-member algorithm with k-nearest neighbors () to analyze the impacts of anonymization [21]. Sadeghi-Nasab et al. [22] developed a clustering-based solution using the Apache Flink framework to anonymize data streams from IoT devices. The proposed framework could smartly tackle leftover data from clustering while reducing IL. Amiri et al. [23] proposed a method that combined k-anonymity and t-closeness to enhance data utility without compromising privacy guarantees against background knowledge attacks. However, the proposed method may incur higher IL when data are skewed. Majeed and Hwang devised a hybrid method that combined generalization and DP to yield better utility and privacy in data outsourcing scenarios [24].
Due to the complexity of the anonymization process, several approaches have been proposed to address this critical problem. Zhang et al. [25] addressed the high overhead of anonymizing multidimensional data using MapReduce. Mehta and Rao [26] developed a scalable anonymization scheme based on k-anonymity and ℓ-diversity to reduce computing time. Azad et al. [27] explored the concept of offloading in data anonymization and proposed a framework to outsource some complex anonymity operations to third parties to reduce the computational burden. Kim [28] developed a modified version of k-anonymity to minimize computational overhead while preserving privacy and utility in set-valued data. Recently, some approaches have explored data partitioning strategies to reduce computational overhead when processing big data [29]. Several algorithms have been devised, such as adaptive k-anonymity (AKA) [30], random k-anonymous (RKA) [31], attribute-focused anonymization (AFA) [32], utility-preserving anonymization (UPA) [33], multi-attribute clustering and ()-anonymity (MCKLA) [34], and scalable distributed anonymization (SDA) [35], to address the problem of utility and computing time simultaneously.
We affirm the contributions of existing methods, but they do not identify naturally clustered parts of the data when forming classes/clusters. Therefore, computing time can still be very high owing to extensive (but mostly irrelevant) computations. Furthermore, they anonymize each value of each attribute and do not identify any general patterns in the data, preserving them as is, leading to significant utility and granularity losses. However, some hybrid frameworks, such as MCKLA, UPA, and SDA, enhance data utility by improving clustering. These methods apply uniform generalization without adapting to general patterns or diversity information, leading to higher utility loss. Also, no additional measures/attempts have been incorporated into these methods to prevent heavier changes in anonymized data. This work targets these concerns as our main contributions and elaborates on them throughout the paper.
3. Preliminaries and the System Model
3.1. Data Overview
Let denote a real-world dataset, where represents the ith user (i.e., tuple/record in T) with n attributes, =. Consider a scenario in which attributes are treated as basic demographics, and one is the SA, denoted Y, with q unique values. The records in T are modeled by in which denotes the jth attribute value of the ith user. For attribute , is modeled as the domain, where and denote ’s value and cardinality, respectively. In simple terms, T can be viewed as a matrix of dimensions, where N denotes the number of rows/records, and n refers to the number of columns/attributes. Equation (1) expresses an overview of the generic structure for N tuples in T.
3.2. The System Model
In this work, we assume a generic data outsourcing case with four actors (record owners, data owners, data publishers, and analysts) as illustrated in Figure 1. For simplicity, we refer to record owners as users in this paper. Users offer their data (in the form of tuples/records) to data owners. The data owners manage the data collected from N users. Afterward, the scrambled data are outsourced either by the data owners or by data publishers and are acquired by data analysts for analytics. The knowledge gained from the outsourced data is employed to enhance real-world services (e.g., medical services). There is an adversary (some analyst) whose ambition is to jeopardize user privacy in outsourced data by utilizing auxiliary information. Each user in the system can hold either distinct or identical values in the attributes. For instance, if , then 80 users might have identical values for attributes, <M, white, US, teaching, married>, and 20 users might have different values for these attributes. In this situation, we can regard the data of the 80 users as naturally clustered. Our goal is to implement an anonymity scheme for data outsourcing that identifies naturally clustered data and general patterns that apply to many users, thereby reducing overgeneralization and computational overhead. We aim to protect specific privacy-endangering patterns from adversaries while releasing general patterns as is for analytics. We assume the dataset (T) is fixed in size and available in tabular form.
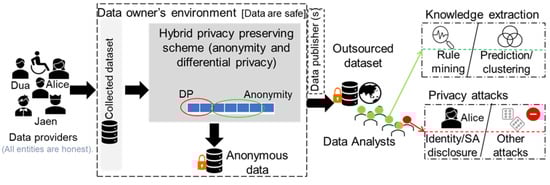
Figure 1.
Schematic of the system model for this study.
3.3. Threat Model
We assume that most actors in the considered system are honest. They perform only the desired activities and assist in accomplishing pertinent tasks in the outsourced data. However, some data analysts can be semi-honest and threaten users’ privacy. Although data are free of all types of EI, QIs can still be obtained from external sources, and such amalgamations can uniquely identify people [36]. Hence, our scheme is susceptible to identity attacks and allied SA disclosure attacks in five ways: (i) half the QIs are known to the adversary, who might try to determine the remaining ones to cause identity disclosure; (ii) all QIs are known to the adversary, who might attempt to link a user in the data to find an SA; (iii) the adversary might know the SA of the target user and might attempt to find QIs to breach privacy; (iv) the adversary might know half of the QIs and an SA and intends to determine the remaining QIs to cause identity disclosure; and (v) the adversary might have access to detailed data on target users from external sources, and can then link the data to infer their identities or SAs. Thus, we aim to preserve users’ privacy against sophisticated privacy perils from the data outsourcing process. Lastly, the attacker might engage in adversarial behavior, such as counteracting the anonymization procedure by analyzing patterns, correlations, or the clustering process itself. However, this situation can occur when the anonymization process is offloaded to untrusted environments, as data owners may have limited resources. In this work, we assume that the data owner is trustworthy, that the anonymization procedure is performed within the data owner’s premises, and that the adversary cannot counteract the anonymization procedure. Lastly, we assume that the adversary’s information is not included in the data (as shown in the system model), which might lead to some adversarial actions after data release. The system model considered in this work closely resembles a realistic setting in which data owners (e.g., insurance companies, hospitals, banks, etc.) aggregate data from clients/affiliates over a specific period and then release it to third parties for analytics or knowledge discovery. The system model is advantageous for extracting valuable knowledge from the data, which can be used to enhance the quality of real-world services.
3.4. Privacy Model
Our scheme amalgamates DP and k-anonymity to produce an anonymized version of the real data. Specifically, we employ the Laplace mechanism and a generalization technique. The reason to use both methods is to provide higher utility along with privacy. Both models’ definitions are as follows.
Definition 1
(k-anonymity). An anonymized/sanitized table, , derived from real table T is said to be k-anonymous if each tuple has at least k similar tuples in each cluster.
An example of 3-anonymity (e.g., ) applied to a country attribute with six tuples is given as follows.
Definition 2
(Laplace mechanism). The Laplace mechanism is used to achieve ϵ-DP, in which function F’s output on T takes a real-number vector form. It adds noise ϕ to each numeric QI value to yield output to guarantee ϵ-DP. Noise ϕ is drawn from a Laplace distribution with scale () and mean 0.
Algorithm is -DP only when Equation (3) holds:
where is the noise according to the LM. An example of the LM applied to age attribute with six tuples is
The rationale for employing both these models (k-anonymity and DP) is to generate anonymous data that closely approximates the real data. For example, an age value with additive noise is closer to realistic values than the generalized intervals. Similarly, the generalized categorical QI values are more semantically consistent with the real values. Also, the k-anonymity concept, along with diversity preservation in each cluster, protects identity and SA disclosure more effectively than DP alone. The joint use of these methods is more effective at balancing utility and privacy than DP/k-anonymity alone.
4. The Proposed Privacy-Preserving Scheme
In this section, we detail our CL- and pattern-aware, highly efficient scheme for privacy-preserving mixed-data outsourcing (PPDO). Figure 2 presents the workflow of the proposed scheme. The main notations in the proposed scheme are in Table 2. We propose a novel scheme that combines CL with the pattern-aware k-anonymous–DP method. CL is adopted to prevent irrelevant computations during clustering; the pattern concept is proposed to allow some data to evade anonymization, and we consider diversity to preserve privacy alongside utility. The anonymous data are curated with the joint application of -DP and k-anonymity. The Laplace mechanism of -DP ensures higher indistinguishability in the numerical part and preserves better utility than the generalization interval. In contrast, the limited generalization of the categorical part ensures sufficient mapping for target records exposed to the adversary, preventing explicit identity disclosure. The SA diversity is also considered in the cluster formation process, thereby preventing SA disclosure. To the best of the authors’ knowledge, all these methods are applied jointly for the first time to produce a good quality in a very efficient way.
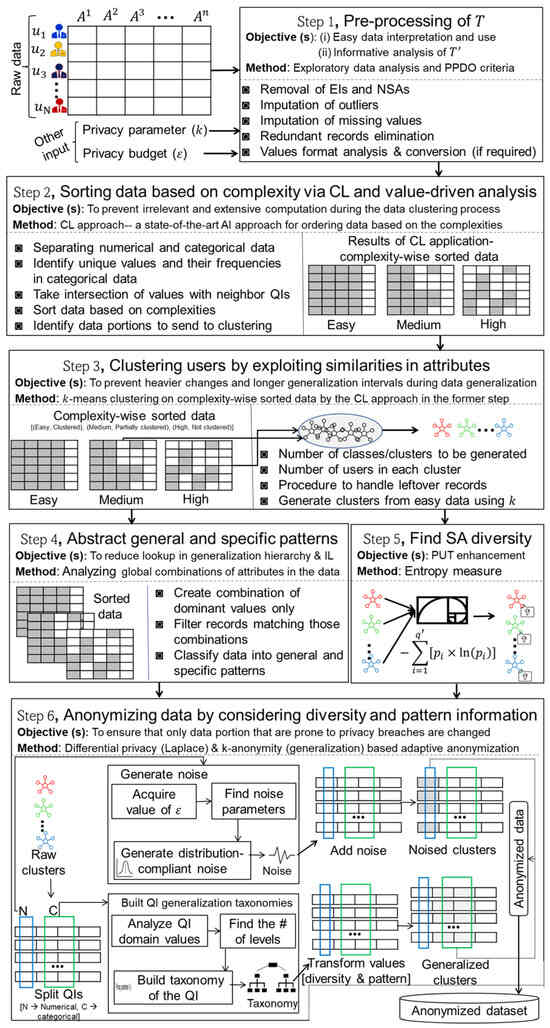
Figure 2.
Conceptual overview of the proposed privacy-preserving scheme.
Table 2.
Important notations used in the text.
As shown in Figure 2, there are six main steps in the proposed privacy-preserving scheme. In the initial step (Section 4.1), data are pre-processed according to the standard criteria for PPDO, and quality-related issues are addressed. In the second step (Section 4.2), CL is applied to sort data in terms of complexity (i.e., ) before clustering. In the third step (Section 4.3), T is divided into clusters via the k-means algorithm. In the fourth step (Section 4.4), data are divided into (low-privacy issues) and (high-privacy issues) by exploiting global combinations of QIs. In the fifth step (Section 4.5), the diversity of SAs in a cluster is computed. In the sixth step (Section 4.6), LM and generalization are jointly applied to create . It is worth noting that we make generalizations adaptive based on SA diversity and patterns, whereas existing methods anonymize entire parts of T. Next, we discuss all these steps in more detail.
4.1. Pre-Processing T
To increase data reliability and to prevent incorrect analyses from , we pre-process T by using data engineering as well as PPDO criteria. In any T, there can be four types of attributes, as discussed above. These types are mostly determined by association with a specific individual, their presence in external sources, and any privacy requirements [37]. Depending upon the scenario, the types of attributes differ in T, and some types of attributes (i.e., NSAs, EIs) may or may not be available. After identifying the attribute types present in T, two types (NSAs denoted with W and EIs denoted with Z) are removed from the data.
The first type of attribute does not offer greater utility (in some cases, W can be published as is), and the latter is removed from T to reduce privacy concerns. The modified shape of T becomes , and Equation (1) is modified as follows:
where denotes the jth QI value of the ith user in T.
After giving T a precise structure, pre-processing is applied to further improve its quality. Data pre-processing is vital to making data governance/interpretation easier. We address three critical problems in T by considering its nature. The procedure for outlier handling (OH) and missing value imputation (MVI) uses average and rare categorical values. We remove duplicates from T using information about the indexes and values of X and Y. For two users, and , if ∀ and indexes of these users are i and , respectively, then these users are considered duplicates. If two users with similar attributes are located in another index, we treat them as two different users with the same attributes. We also perform type checks using to make sure values are consistent with the attribute type in each column. The above steps help obtain a clean T.
4.2. Complexity-Wise Data Sorting Using the CL Approach
To prevent unnecessary computation in T-anonymization, we adopt a CL approach [38] because it can sort data by complexity, which the underlying model can easily perceive. CL gives data meaningful order and structure, and therefore, processing can be an order of magnitude faster than conventional approaches (i.e., those that do not provide order/shape). In the AI community, CL is an emerging paradigm that offers promising solutions for training complex models with reduced computational cost. In the anonymization domain, a similar concept is highly demanding, as clustering approaches like k-means spend a lot of time extracting commonalities among tuples, which could otherwise be captured beforehand with CL-like approaches. To the best of our knowledge, we are the first to employ CL in the anonymization domain to speed up clustering by identifying already clustered portions. It is worth noting that CL functions primarily as a data pre-sorting heuristic in our scheme, not as a learning-based optimization framework.
We apply CL to divide T into three parts () based on complexity. The complexity criterion is cohesion between records, which decreases from top to bottom, and we refer to this as easy to complex. The easy data have higher cohesion, and the complex data have lower cohesion. We utilize this complexity concept in two distinct ways: (1) clustering, which identifies parts of data that are inherently clustered, and distance/similarity is not computed during clustering; and (2) data generalization, which separates general patterns from specific ones to reduce the degree of generalization, thereby improving the privacy–utility–efficiency triad. The main idea is to identify and separate the parts that are naturally clustered (e.g., values in the row are the same), compared to those that are not, or partially, clustered. For example, if there are three categorical QIs, and each QI has a value that repeats across many rows, then it is considered clustered data and can be skipped by clustering algorithms. In our scheme, only some parts of the data are sent to the clustering algorithm rather than the entire T to speed up the process. The CL workflow is demonstrated in Figure 3, and the corresponding pseudocode is in Algorithm 1.
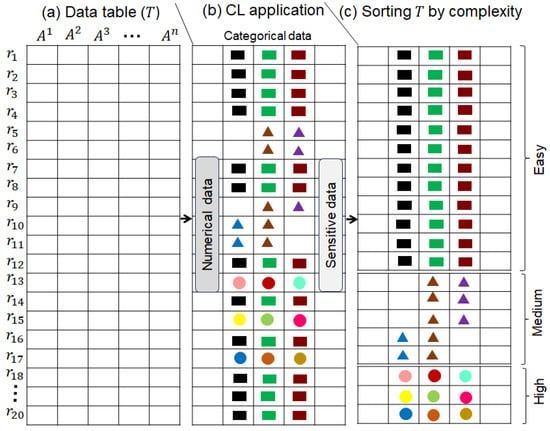
Figure 3.
Sorting T by complexity via the CL approach: easy (naturally clustered data), medium (partially clustered), and high (not clustered).
In Algorithm 1, T with N records is given as input, and the three partitions ( sorted by complexity) are returned as output. The key concepts of Algorithm 1 are recognizing QIs that are categorical and identifying the most frequent values. In Algorithm 1, we consider mixed data, and the type of each QI can be either numerical or categorical. Further, there is no untyped QI, and therefore, all relevant QIs can be processed. Later, templates are created by taking the intersection of the most dominant values across QIs to map records from T based on them. For example, if there are two QIs and ten users, with six users sharing the same value for both QIs, the respective values will become a template. Specifically, we identify the most occurring values in each QI and create a template. The template is a kind of rule spanning multiple categorical QIs. In this work, we used the top two values for each QI to create a template. The template for the race and country QI can be . The records are mapped to the respective template by matching the values between the template and the records. It is worth noting that the frequency of the dominant value can differ across datasets, and therefore the proportions of records in , , and can differ. Later, records that have all similar values row-wise are regarded as naturally clustered and are added to . Records that have few common values are identified and added to . Lastly, the records with nothing in common row-wise are added to . In the end, the algorithm returns all three partitions of T for further processing.
In a nutshell, Algorithm 1 creates three partitions of T: fully clustered, partially clustered, and not clustered. In Algorithm 1, the global information regarding the composition of QI’s value is used, and correlations between all samples are considered when classifying data. Specifically, correlations are computed across the entire dataset to reduce the risk of de-anonymization in subsequent steps. However, the size of each partition is always greater than k, so when data are divided into clusters/classes, local information about patterns is further analyzed within each cluster to reduce over-generalization of QIs with general patterns and higher diversity in the SA column. The complexity of Algorithm 1 is , where N is the number of records in T, is the number of categorical QIs, and R is the number of templates. Since R and have a constant upper bound, the overall complexity of Algorithm 1 is . Since each record is mapped to a single template at a time, searches and mappings for other templates are not performed, thereby preventing expensive intersection operations. However, computational complexity can increase when dealing with high-dimensional data (e.g., more records and a large number of categorical QIs).
| Algorithm 1: using CL |
|
The real CL approach sorts data based on complexity and trains models on progressively harder examples. We adopt a similar approach, sorting records by complexity and processing only the more complex ones with the underlying model (e.g., k-means in our case). Also, in the second phase, the more challenging examples/records are privacy-risky and are therefore processed only with the anonymization model. In summary, we sort data based on complexity. Subsequently, the more complex parts of the data are fed into k-means and generalization models, verifying the use of the CL approach with slight modifications. To the best of the authors’ knowledge, this is the first work that exploits the complexity concept in two different ways (preventing irrelevant similarity/distance computation in the clustering process and skipping anonymity on general patterns to enhance data utility in the anonymization process).
4.3. Clustering Users Using K-Means Algorithm
To enhance utility and reduce heavy information loss, users should be grouped into clusters based on their similarities. Not accounting for similarities among QI values in the clustering process is not a helpful approach for improving utility/IL. Figure 4 provides an overview of generalized values for the QI of race with and without the clustering. Referring to Figure 4, the data are overly generalized when clustering is not performed, resulting in a high utility loss.
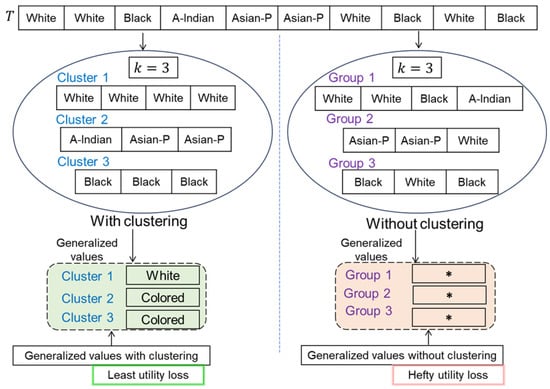
Figure 4.
Overview of generalized values with and without clustering (The * shows the suppressed value, where the original value gets hidden completely).
From the analysis, we can see that IL is hefty when values are not passed through the clustering process. In contrast, IL is the least when values do go through clustering. In this paper, we implement a k-means clustering algorithm to reduce IL by ensuring k-anonymity. Specifically, users are grouped into clusters based on similarities with respect to QIs. In each cluster, there are at least k users to preserve privacy. The pseudocode of the method used to cluster users is in Algorithm 2. The rationale for using the k-means clustering algorithm is to generate non-overlapping (i.e., hard) clusters; the number of clusters can be easily estimated based on the privacy parameter k, leading to better computational efficiency due to fewer data and outlier-free data.
In Algorithm 2, and k are the input, and is the output. Initially, the total number of clusters for each data partition is determined. In this work, the size of the partitions (e.g., ) and privacy parameter (k) were jointly used to find the number of clusters, as shown on the 2nd line of Algorithm 2. If the size of is 32,610 and , then the number of clusters is ≈10,870 as per the k-anonymity criteria. We also optimized the number of clusters to reduce information loss by keeping more than k and fewer than records. Afterwards, cluster centers are randomly chosen, and records are mapped to each cluster. Once all records are mapped to each cluster per the k-anonymity criteria, the clustering process stops. In the end, a set of clusters is returned, each containing at least k users. The records in are partitioned according to the k-anonymity criteria, and the resulting clusters are added to . Because most records in are partially clustered, the clustering process is fast compared to the traditional k-means clustering algorithm. Furthermore, the set is naturally clustered and is not sent for clustering, thereby significantly reducing the clustering overhead. The overall complexity of Algorithm 2 is , where N is the dataset size, is the number of clusters, and is the number of iterations. As stated earlier, the size of the data to be fed to the clustering process is reduced by skipping , and therefore, the other two variables are also optimized (e.g., the number of initial clusters is smaller, and fewer iterations are required to converge the clustering process). By optimizing data size and sending only selective parts of the data to the clustering process, computational efficiency is maintained. Next, we discuss the process of identifying general and specific patterns from T.
| Algorithm 2: using the k-means algorithm |
|
4.4. Identifying General and Specific Patterns in T
After clustering users, we analyze general () and specific () patterns to address the privacy/utility trade-off effectively. The main idea is to abstract a general data portion that is not prone to privacy leaks and can bypass the anonymity process. In contrast, specific patterns can apply to some communities and are therefore prone to privacy leaks, requiring anonymity [11]. To the best of our knowledge, none of the previous methods have considered this concept, and in most cases, all parts of T are anonymized, leading to hefty IL. Through experiments, we found that 85.42% of the records in the benchmark Adult dataset have White as the race value, which can be regarded as a general pattern because it applies to many users in the dataset. Since it is a frequently occurring value, a considerable number of clusters will have White in the race column, and applying anonymity to it makes no sense because it would lead to a higher IL. These kinds of general patterns can be preserved as is in to retain higher utility; they do not pose a privacy risk because the numeric portion of T is anonymized, and the SA column has diversity. In contrast, the least occurring values can represent small communities and are prone to privacy leaks [11].
Through experiments, we found that fewer than 1% of records in the Adult dataset have Amer-Indian-Eskimo and Other as race values, which can be regarded as a specific pattern because it applies to some users in the dataset. Other methods delete such portions of infrequent/complex data, which is not the ideal solution in real-world scenarios [10], primarily when is intended for resource allocation/planning, decision-making, and fund allocation. It is worth noting that does not lead to privacy disclosure because numerical data are noised with DP, and the SA column has heterogeneous values. If an attacker attempts to link user XYZ based on categorical QIs, the target user cannot be singled out from . To prove this, in Table 3, we present a 3-anonymous version of the data in Table 1.
Table 3.
Three-anonymous version of the data in Table 1.
In this example, users are grouped into clusters of three, and only a limited portion is anonymized owing to higher diversity in the disease column. In this small portion of data, sex shows F as the general pattern, while race shows White. Hence, their values can be preserved in their original form to minimize changes to the data. Based on this analysis, it is fair to say that low-level anonymization by identifying general patterns does not pose a risk to privacy, whereas the utility is very high. In contrast, other approaches do not identify general patterns and therefore tend to entirely hide the values of most QIs in a cluster when different values emerge in them. In the same set of records, values for race and sex in clusters 1 and 3 will be replaced with * under existing methods, potentially leading to higher IL. produced with these existing methods cannot contribute to innovation/knowledge because most parts of the data are exceedingly anonymized. In contrast, our scheme identifies general patterns and reduces anonymity, yielding data of superb quality for information consumers.
Remark 1.
Most QIs in the general pattern portion have lower significance values and provide group-level information, offering strong resilience against identity and SA disclosure attacks.
Proof.
As discussed in Zhang et al. [39], each attribute/QI affects the identity revelation process differently in anonymized data. The QIs with more unique values can have a higher significance score (denoted with (jth QI/attribute) in Zhang et al. [39]) for the respective QI and vice versa. Given three users , , and with two QIs, age and race, where the value of age = {23, 24, 25} and race = {white, black, white}. Now, if and are calculated based on the values mentioned above, then they will be 3 and 2.4 for age and race, respectively. Based on the analysis, age is more crucial for identifying users than race, as it has more unique values. In our scheme, the general pattern encompasses most of the QIs with similar values and, accordingly, lower significance values, thereby reducing the risk of identity and SA disclosure. In contrast, the specific pattern has most QIs with diverse values, which can yield very high significance values, leading to explicit identity and SA disclosure. Based on these findings, it is clear that the specific pattern requires more anonymity than the general patterns do. Based on the above analysis, it is shown that general patterns are less risky in terms of privacy, and lower anonymity does not lead to privacy disclosure in data outsourcing. □
Next, we discuss the process of computing diversity in the SA column for each cluster to better preserve privacy against SA disclosures.
4.5. Computing Diversity of Clusters in SA Column
To effectively preserve privacy and to enhance utility in , retaining a higher diversity in the SA column is imperative. However, most of the existing methods do not consider in the SA column, which can lead to two main problems in : (i) SA disclosures can inevitably occur, and (ii) utility losses can be high due to needless anonymization even if is high [30,31,32,33]. In this work, we employ the entropy concept to measure in the SA column for each cluster to estimate the level of uncertainty with respect to SA disclosure. We base the generalization process on to pay ample attention to low clusters. Also, minimal anonymity is applied to clusters having a high . The of cluster can be calculated via Equation (7):
The value of ranges between 0 and 1, with 1 being most suitable for higher privacy. In contrast, a value of 0 for is highly problematic for privacy because attackers can infer an SA with minimal effort since all SA values are the same in the cluster. Equation (8) presents the three cases of low, medium, and high for three clusters, , and , respectively.
In the above analysis, has a higher , and therefore, the SA disclosure probability is low. However, SAs from and can be leaked with the probability of 1 and 0.66 (for SA value = 0), respectively. We identify unique values of SAs in each cluster, compute their frequencies, and use Equation (7) to compute for the respective clusters. Next, we discuss the data anonymization process via joint application of LM and adaptive generalization to effectively balance privacy and utility in .
4.6. Data Anonymization via LM and Adaptive Generalization
In the last step, the actual values of QIs are transformed into new values that are semantically related. In this work, we amalgamate LM and generalization to transform T into . Anonymization of NA and is shown in Equations (9) and (10):
where is the amount of noise determined by LM using the privacy budget () and sensitivity (), and
where is the generalized value determined from the generalization hierarchy. If is not generalized (e.g., values are preserved in real form), then .
The pseudocode applied to anonymize clustered data using LM and generalization methods is given in Algorithm 3. In this algorithm, are the inputs, and is the output. In Algorithm 3, G and S refer to templates of general and specific patterns, respectively. For non-uniform treatment of data, two values (e.g., (high) and (low)) are used. At the outset, the of each cluster is computed, and if is high, then pattern information is analyzed to anonymize . If is low and specific patterns exist, relatively high anonymity is applied to . Afterward, LM with a relatively high is applied to add noise to to transform the data. In the clusters where anonymity in CA is skipped, a higher is applied and vice versa. In our scheme, the is value-based (per attribute/QI). In the end, the results of both techniques are combined to produce the final . The produced with our scheme truly preserves the semantics of T, and it can be highly useful for downstream tasks. The complexity of Algorithm 3 is , where is the clustered data, N is the dataset’s size, and k is the privacy parameter. The two parameters ( and k) have a constant upper bound, and the overall complexity is . In Algorithm 3, the diversity threshold was tuned empirically, and LM was applied independently to each numerical QI. Our scheme is expected to prevent wrong decisions/conclusions and is viable for meeting the growing demand for high-quality data in data-driven applications.
In our scheme, two privacy budgets () are used across partitions to curate a noisy version of real data, which compose under the parallel composability property of -DP [40]. According to the composability property of -DP, given datasets , and is any subset of dataset T, with algorithms and their privacy budgets , assuming the randomization strategy of any two algorithms is independent of each other, then provides max()-DP. In contrast, the generalization is always performed using either level 0 or 1, and formal bounds of generalization levels are , where L denotes the generalization interval.
| Algorithm 3: using LM and G |
|
5. Performance Evaluation
In this section, we evaluate and compare the performance of our scheme on real-world benchmark datasets, focusing on privacy preservation, utility enhancement, lookup reduction to generalization hierarchies, and time overhead. Concise details on the three real-world datasets, the experimental settings, evaluation metrics, baselines, and a comparative analysis with SOTA methods are given below.
5.1. Datasets
We employed three real-world and benchmark datasets (Adult [41], Careplans [42], and Diabetes [43]) in the experimental evaluation of our scheme. All datasets are openly available and have been extensively used in the performance evaluation of many privacy models. Brief details of each dataset are as follows. The Adult dataset contains various demographic data, with income as an SA. The Careplans dataset is a medical dataset that encompasses various demographics and medical expenses (classified into four categories). The Diabetes dataset is another benchmark medical dataset, with diabetes status as an SA, along with many other demographic information and clinical features as QIs. All datasets have mixed QIs, and SA cardinalities are two, four, and two, respectively. Most datasets are imbalanced with respect to SA values, having an imbalance ratio of 3.15, 2.72, and 2.01 in Adults, Diabetes, and Careplans, respectively. The imbalance ratio of 3.15 indicates that the major SA value is occurring 3.15× more than the minor SA value. The chosen datasets are from diverse domains, such as census data, electronic health records, and disease. The dataset sizes, in terms of records, are 32.5K, 12.3K, and 101.7K for Adults, Careplans, and Diabetes, respectively. Given their reasonable size and modest imbalance, as discussed above, these datasets adequately represent broader real-world scenarios.
5.2. Implementation Setup
The proposed scheme was implemented on a notebook with an Intel Core i5-3320M CPU clocked at 2.60 GHz running Windows 10 with 8 GB of RAM. Python v3.13.3, with built-in packages, was used for the implementation. It is worth noting that all datasets had some quality-related issues; therefore, we pre-processed them before using them in the experiments. We employed CL on each dataset and identified the portions for . In the Adults dataset, 5.07% and 10.31% of the data were in and , respectively. The remaining data were part of . In the Careplans dataset, 24.70% and 32.47% of the data were part of and , respectively. In that dataset, about 42.83% of the data belonged to . In the Diabetes dataset, 12.30% and 13.52% of the data were in and , respectively. About 74.18% of the data were part of . From the results, observe that a significant quantity of data was not processed at clustering time because they naturally clustered, which helped reduce time overhead. During the experiments, we used seven values of k ranging from 5 to 200 and two distinct values of . We set to 0.65 for binary SA datasets and 0.60 for datasets with higher SA cardinality than two. The was set to 0.3 (risky part) and 0.5 (less risky part), respectively. The k values were chosen as per the baseline, as most baselines tend to evaluate privacy/utility strength from small to large k. The values were tuned empirically; an between zero and one is considered more secure in terms of privacy guarantees. Furthermore, our scheme is based on k-anonymity, and the number of users in each cluster were ≥k and <2k. Each experiment was repeated five times, and the reported results are the average of five runs.
5.3. Evaluation Metrics and Baselines
We compared the performance of our scheme with six recent SOTA algorithms: AKA [30], RKA [31], AFA [32], UPA [33], MCKLA [34], and SDA [35]. To the best of our knowledge, these are highly relevant and recent SOTA algorithms for data outsourcing. Also, these algorithms have developed practical methods to enhance utility and, therefore, are the best candidates for comparison. Lastly, some methods, such as SDA, employ parallel implementations to speed up the anonymity process and were therefore reliable candidates for comparison with our scheme, as we made data-related enhancements in our pipeline to accomplish a similar goal. Based on the above considerations, we contrasted our scheme against these six SOTA algorithms. Although some privacy-preserving synthetic data generation methods have emerged, they generate anonymous data by jointly combining a generative model and an anonymity/DP model; therefore, they were not ideal for direct comparisons with our scheme. We created distinct variants of from all datasets via k and compared the results of these methods fairly via four evaluation metrics: SA disclosure risk (), information loss (), query accuracy (), and time overhead. The formalization of the evaluation metrics is given below.
In (11), is background knowledge, and shows tuples in anonymous form that relate to . It is hard to know which tuple/portion of T is exposed to an adversary; therefore, we assumed a worst-case setting in which any record could be exposed to determine an SA of a user.
In (12), l is the actual generalization level, and is the total number of levels in H. if QI values are not generalized in a cluster. The two possibilities for are in Equation (13).
The metric is formalized in Equation (14):
where denotes the maximum number of clusters yielding correct results against aggregated queries in , and denotes the total number of clusters.
encloses anonymized clusters from all three partitions (, , and ). The experiments were conducted across all clusters, not just the anonymized ones, as most data underwent noise and generalization, except for some categorical QIs that exhibited general patterns. Only generalization was performed selectively (e.g., considering diversity and pattern information); the noise addition was consistently applied to the numerical part of all clusters, so all clusters had some form of perturbation.
5.4. Privacy Comparisons
In the first set of experiments, we compared the performance of our scheme with respect to privacy preservation. Specifically, we drew of diverse types from T and evaluated the effectiveness of our scheme with respect to privacy preservation using the metric. The metric evaluates disclosure risk in scenarios where attackers know the QIs, either fully or partially, and want to infer SA, not vice versa. To evaluate the disclosure risk in the opposite case (e.g., where attackers know the SA and want to infer QIs), we calculated the probability from successful matches in the anonymized data. Specifically, we encoded the data exposed to the adversary in a pandas DataFrame and matched it with the anonymized data. Subsequently, the number of successful matches was counted, and the probability of disclosure was computed. An example of the code that finds the correct matches (or linked data) is given as follows: linked_data = pd.merge(df, external_knowledge, on = [‘age’, ‘workclass’, ‘education’, ‘sex’, ‘income’], how = ‘left’). Once the linked data were determined, the probability was computed via . If the matches spanned multiple clusters, we calculated individually and took the average of the results.
At the time of data anonymization, it is challenging to quantify the adversary’s skills and knowledge regarding the real data. Similarly, it is difficult to gauge the adversary’s background knowledge. The standard practice is to expose a set of records (assuming them to be background knowledge of the adversary) or different parts of records (as listed in the threat model) and assess the disclosure risk accordingly. In some cases, a certain percentage of records is extracted from real data, and a linking attack is performed to determine whether those records can be recovered from the anonymized data. We made five realistic assumptions about the data composition that an adversary might know, and we measured the disclosure risk accordingly. The rigorous testing of our scheme’s privacy strength against five realistic assumptions and various attacks (linking, background, and guessing) mimicked real-world settings. We tested all five scenarios listed in the threat model to prove the efficacy of our scheme regarding privacy preservation in . The privacy protection results obtained from the experiments are illustrated in Figure 5.
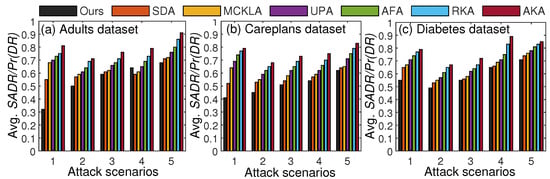
Figure 5.
Privacy comparisons with SOTA methods based on and .
From the results, we can see that the last scenario had a higher in most cases owing to data linking with . In each scenario, the quantity of data exposed varied, and the corresponding was measured. From the comparative analysis, our scheme yielded lower values of and in most cases compared to recent SOTA methods. These improvements came from using diversity information in SAs and from paying close attention to specific patterns prone to privacy leaks. In most existing methods, diversity information was not considered, and thus, the was higher in most cases. The average of the results for five attack scenarios is given in Table 4. As shown in Table 4, our scheme, on average, yielded lower across datasets.
Table 4.
Avg. results: the proposed scheme vs. SOTA methods.
To further enhance the validity and to ensure the results were robust, we added the statistical validation of for five attack scenarios using 95% confidence interval (CI) in Table 5. From the results, it can be observed that our scheme yielded a narrower gap than most baselines across datasets.
Table 5.
Ninety-five percent CI results: the proposed scheme vs. SOTA methods.
In addition, we tested the privacy-preserving capabilities of our scheme by varying k and , achieving better results than most SOTA methods. On average, our scheme showed 12% or higher improvements in each test. Based on the results, we conclude that our scheme is an ideal candidate for preserving privacy in mixed-data outsourcing. Next, we present the privacy analysis across varying k values for three commonly encountered attacks (e.g., 2, 4, and 5). Specifically, we identified three commonly encountered privacy attacks on anonymized data and demonstrated the corresponding privacy disclosures. We exposed some data for each attack and compared the privacy disclosure from the anonymized data created with seven different k values. It is worth noting that the imbalance in the data can also impact the privacy analysis, and therefore, we exposed data from both parts (e.g., balanced and imbalanced) to analyze the privacy strengths of our proposed scheme. To better assess the privacy strength, we used small and large k values. To provide privacy analysis across varying k values, we selected three privacy attacks (e.g., attack 2, attack 4, and attack 5) discussed in the threat model.
The rationale for choosing these threats is to provide privacy analysis in more realistic settings. For instance, attack 2 is commonly encountered because demographics are primarily available in the external repository, but the SA is hidden (it is mainly with the data owners). When data owners release data, it can encompass both QIs and SA. Therefore, adversaries can be curious to know the SA of the target person. Similarly, in attack 4, the adversary might know half of the QIs and the SA value, but cannot infer the true identity/SA because data undergo modifications during the anonymization process. Lastly, in attack 5, there are myriad external data sources, and therefore, linking is the more obvious attack that can be performed on the outsourced data via correlation. The concise details of the attacks are: (attack 2) all QIs are known to the adversary, who might attempt to link a user in the data to find an SA; (attack 4) the adversary might know half of the QIs and an SA and intends to determine the remaining QIs to breach privacy; and (attack 5) the adversary might have access to detailed data on target users from external sources and can then link the data to infer their identities or SAs. All three chosen attacks are practical and can lead to a more realistic assessment of risks associated with data publishing. Figure 6 presents the privacy results and comparisons with SOTA methods as k varies.
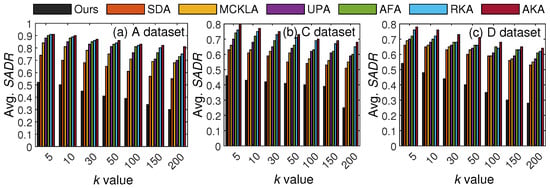
Figure 6.
Privacy protection results with varying k (in attack 2 scenario): the proposed scheme vs. SOTA methods.
Referring to Figure 6, the disclosure risk (e.g., ) decreases with k as data become more general, and diversity increases in the SA column when k is high. However, the imbalance in the SA column can still contribute to the higher , and those methods that do not consider SA diversity during anonymization can expose the SA more easily. For a lower k, our method shows slightly higher disclosure, as many classes cannot meet the required diversity due to imbalance in the SA column, particularly in the A and D datasets. However, in real-world settings, a higher k is typically used; therefore, the resulting from our scheme is acceptable. These results verify the superiority of our scheme in terms of privacy protection across varying values of k in most cases.
Figure 7 presents the privacy protection results across seven different values of k. In this scenario, the disclosure risk is not very high, as the adversary needs to identify multiple QIs to compromise privacy. Referring to Figure 7, it can be seen that the disclosure risk for all methods decreases with k as uncertainty increases. However, the proposed scheme yielded better privacy protection in this attack scenario. Even though some parts of the data were unmodified, the linkage was complex owing to three generalization types (i.e., skipped, minimal, and maximal). Lastly, the disclosure risk from the C dataset was low, owing to a greater number of QIs and a balanced SA distribution. These results verify the robustness of the proposed scheme against contemporary privacy attacks.
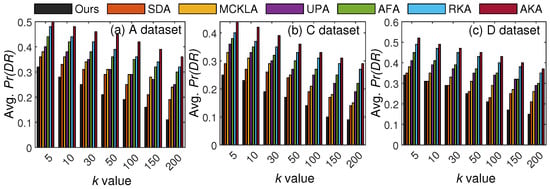
Figure 7.
Privacy protection results with varying k (in attack 4 scenario): the proposed scheme vs. SOTA methods.
In the last experiments, we evaluated the effectiveness of our scheme in protecting privacy across seven k values against linking attacks (e.g., attack 5). The empirical results from the three datasets are shown in Figure 8.
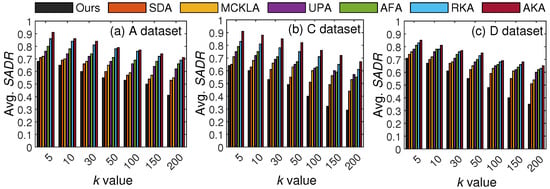
Figure 8.
Privacy protection results with varying k (in attack 5 scenario): the proposed scheme vs. SOTA methods.
Referring to Figure 8, it can be seen that the SA disclosure risk for all methods decreases with k due to higher uncertainty in the QI part and greater diversity in the SA part. However, the privacy methods that ignore SA diversity have relatively higher disclosure risk. In this setting, the SA disclosure risk from the C dataset is relatively low, owing to a higher number of SA values and a balanced SA distribution. In realistic scenarios, when a lot of information is readily available to an adversary about the real data, the residual risks (e.g., correlation/linkage under strong auxiliary knowledge) are high. However, the general patterns, SA diversity, numerical noise, and generalization of the categorical part in our scheme can effectively mitigate residual risks arising from auxiliary knowledge. These results verify the robustness of the proposed scheme in terms of privacy protection against contemporary privacy attacks.
The experimental results given in Figure 6, Figure 7 and Figure 8 verify the efficacy of the proposed scheme in terms of privacy protection when either QI, SA, or both of them are exposed to an adversary. These improvements were achieved by employing different mechanisms (noise, generalization, diversity, and pattern analysis) during anonymization. Through experiments, we found that when data were imbalanced, a higher k provided better privacy. In contrast, when data were balanced, then a small k could also provide reasonable privacy guarantees in most cases. In addition, the higher cardinality of SA values could also increase uncertainty for the adversary, and the number of privacy disclosures could decrease. However, when the number of unique values in the SA column was too few and their distribution was skewed, privacy protection became hard. Hence, it is vital to analyze the data characteristics for both QIs and SAs when selecting feasible values for privacy parameters. Our scheme provides better privacy protection across most attack scenarios. Specifically, it yields higher indistinguishability with respect to numerical QIs and adequate generalization with respect to categorical QIs and provides quantifiable privacy guarantees. However, the poor parameter choice (e.g., higher and lower k) may degrade its performance in terms of measurable privacy.
5.5. Utility Comparisons
In the second set of experiments, we compared the utility results of our scheme with existing methods using two evaluation metrics. Specifically, we measured and compared and results with those of existing SOTA methods. Both these metrics have been widely used to calculate the utility of the resulting . Figure 9 presents the results obtained from different values of k.
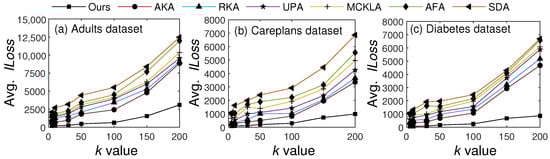
Figure 9.
Utility comparisons with existing SOTA methods based on .
In Figure 9, the value increased along with k due to an increase in anonymization. However, our scheme maintained at a much lower level than the SOTA methods in most cases. The main reason for these better results with our scheme is fewer generalizations. Whereas all existing methods anonymize the entire T, our method anonymizes only privacy-sensitive portions of T. It is worth noting that can rapidly increase as data are generalized to higher levels of the generalization hierarchy. With five levels in the hierarchy, the incurred for one QI is {level 1: , level 2: , level 3: , level 4: , and level 5: , where is the importance score of the respective QI. The lowest level has the least per QI; therefore, the overall is lower in our scheme than in other methods. To enhance the reliability of the reported performance gains in , we report variance analyses across five runs for two k values across three datasets. In the Adults dataset, the variance at and was 1.37 and 8.84, respectively. In the Careplans dataset, the variance at and was 1.16 and 3.25, respectively. In the Diabetes dataset, the variance at and was 0.57 and 0.70, respectively.
In the next set of experiments, we evaluated and compared our scheme in terms of results. The primary purpose of assessing our scheme with respect to QA was to demonstrate its effectiveness in data mining. We executed various aggregate queries on and analyzed the results by using both T and . One exemplary query that was executed on the Careplans dataset was as follows: SELECT COUNT(*) from Careplansdataset WHERE race=‘asian’GROUP BY healthcare_expenses. Specifically, we computed the query error for each query and counted the clusters that were giving reliable results. The results and their comparisons for seven different values of k are in Figure 10.
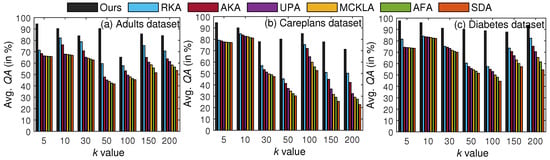
Figure 10.
k-wise results (in %): the proposed scheme vs. SOTA methods.
From the results, note that results have no apparent increase/decrease trend because different queries involving numerical QIs only, categorical QIs only, and mixed-type QIs were submitted for each k value. However, the proposed scheme yielded highly accurate results compared to the SOTA methods. The main reasons for the better results are restricted anonymity and not using suppression (e.g., replacing QI values with ∗) in . These results verify the efficacy of our scheme for data mining and analytics.
The average results for each dataset are in Table 6. The abbreviations from A∼C refer to Adults, Careplans, and Diabetes, respectively. From the results, we can see that across all datasets, our scheme achieved higher query accuracy than its counterparts.
Table 6.
Avg. results (in %): the proposed scheme vs. SOTA methods.
The experimental results in Figure 9 and Figure 10 and Table 6 validate the claims concerning utility enhancement in . These improvements came from preserving general patterns and minimally distorting the data. We believe our scheme can greatly contribute to preventing data-specific biases as well as wrong conclusions when is employed in real services. To provide a more holistic view of utility preservation, we also compared the classification accuracy () on downstream tasks (e.g., using anonymized data for prediction). Specifically, we trained a random forest (RF) classifier on T and and computed the accuracy using the following Equation (15) for seven different k and two values.
where and refer to true positive and true negative, respectively. T is the size of the datasets. As the size of both datasets is identical, the denominator does not need to be changed while computing for .
Figure 11 presents the comparative analysis of between real data and anonymous data. From the results, it can be seen that decreases with k owing to more generalization. However, our scheme performs minimal generalization and adds controlled noise; therefore, the of the anonymous data is very close to that of the real data, underscoring the efficacy of the proposed scheme in data mining applications.
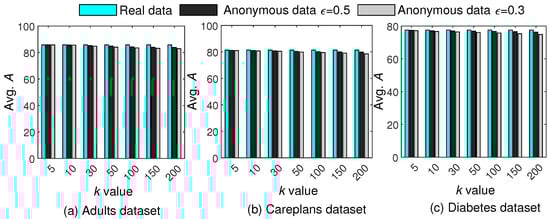
Figure 11.
Comparisons of against real and anonymous data for different k and values.
5.6. Generalization Lookups and Computing Complexity Comparisons
In these experiments, we demonstrate the superiority of our scheme in reducing generalization lookups and computational complexity.
5.6.1. Generalization Lookups Comparisons
The proposed scheme divides the data into specific and general patterns, and the latter are skipped during anonymization. Therefore, the lookups into the generalization hierarchies are significantly reduced, whereas all existing methods anonymize all parts of T, leading to a huge number of lookups in the hierarchies. For example, if and , then lookups into generalization hierarchies will be performed by existing methods. In contrast, the proposed scheme does not anonymize general patterns; therefore, the lookups can be or , leading to significant improvements in data utility and computing time. Figure 12 presents comparisons of generalization lookups on the three benchmark datasets. Since all baselines considered in this work anonymize all the QIs in T, we refer to them collectively as Baseline in the comparisons.
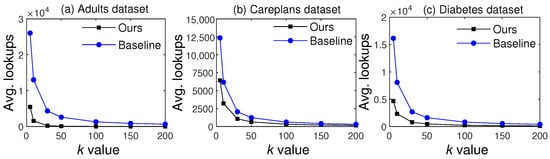
Figure 12.
Comparisons of lookups against the SOTA baseline methods.
From the results, we can see that lookups decreased with an increase in k due to a decrease in the number of clusters. However, our scheme had significantly fewer lookups than the SOTA methods for all three datasets. These results verify the significance of our scheme in reducing unnecessary lookups, thereby significantly enhancing utility and computing efficiency.
5.6.2. Time Overhead Comparisons
In the last set of experiments, we evaluated and compared the computing time with recent SOTA methods. We identified the main steps, such as clustering users using k-anonymity criteria, diversity analysis, DP application, and generalization, and computed the overall time required for the entire process. It is worth noting that some steps (such as clustering users) are more computationally intensive, owing to distance computation and center updating. Figure 13 illustrates average computing times for seven different values of k across three datasets.
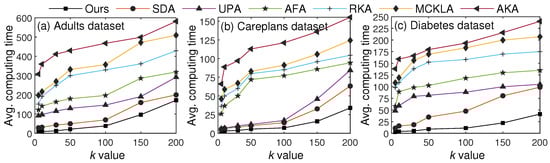
Figure 13.
Comparisons against SOTA methods in terms of computing time.
From the results, we can see that the computing time increased with k for all algorithms, due to an increase in the cluster size. However, our proposed scheme yielded computing time comparable to the other algorithms by applying the CL approach, which sends the fewest data for clustering. Furthermore, only some parts of T are anonymized, whereas all other algorithms anonymize the entire T. By identifying patterns and not processing some data, our scheme incurs less overhead than the other algorithms. These results verify the paper’s assertion about time overhead, which is very small compared to that of SOTA algorithms. The results indicate that the proposed scheme is very low-cost and has a minimal time overhead compared to recent SOTA algorithms.
Recently, some parallel implementation (PI) architectures have been proposed to reduce the computational overhead of anonymization. To that end, we compared our algorithm with both PI and non-PI (NPI) architectures, and the results are in Table 7. From the results, observe that our scheme required less computing time than both implementations with all three datasets.
Table 7.
Avg. computing times: proposed scheme versus PI and NPI architectures.
We computed time complexity by performing clustering without using the CL approach and anonymizing all parts of the data, as all baselines do, followed by optimized clustering and anonymization of only necessary parts using pattern information. Specifically, the improvements in time complexity occurred when distance/similarity was not computed for highly cohesive parts of the data, and no lookups were performed for records that matched the general pattern. It is worth noting that when implementation changes (e.g., k-means to DBSCAN) or optimized hardware is used, these improvements can vary. Further, the size and composition of QIs can also affect the time improvements in realistic scenarios. From the results and comparisons above, we can see that our scheme yielded better privacy, utility, and computing time than six recent SOTA algorithms. This shows that our scheme can be a better choice for mixed-data outsourcing when a greater balance of privacy and utility is desired, along with reduced computation.
5.7. The Impact of Parameter on Privacy and Utility
In these experiments, we comprehensively assessed the impact of the parameter on privacy and utility. The parameter can significantly affect the amount of noise added to the data. When the value is small, the amount of noise is very high, leading to robust privacy guarantees at the expense of utility. In contrast, a higher value of yields more utility but low privacy [44]. To effectively resolve the trade-off, it is paramount to exploit data characteristics to determine a feasible value for . In this work, the Laplace mechanism of DP, which is better suited to numerical QIs, was adopted to add noise to the numerical portion of the data. In the first set of experiments, we demonstrate the impact of the parameter on data distribution by choosing one numerical QI from the adult data in Figure 14. Referring to Figure 14, it can be seen that the distribution becomes balanced when is high due to a reduction in the noise. However, the distributions are highly inaccurate at the lower value of . This work applied the Laplace mechanism only to the numerical parts of the data, and the resulting distribution loss was not very high, leading to better utility. Privacy was protected using noisy, generalized data and SA diversity.
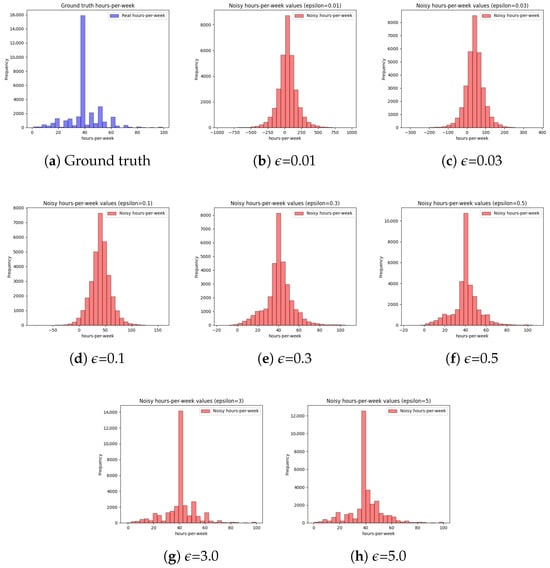
Figure 14.
Impact of varying privacy budget on values distribution (hours-per-week attribute of the adults dataset). (For small , the privacy strength is high while the utility is low. In contrast, a higher provides more utility at the expense of privacy [45]).
To verify the efficacy of the proposed scheme, we analyzed the impact of two values on privacy and utility. The main reason to use a relatively high is that the categorical QIs dominate most datasets. In the threat model, we considered an adversarial setting in which the adversary knew some QIs and aimed to identify the correct SA for the target person. In that case, we assumed that those QIs were numerical and that the adversary knew them correctly. Subsequently, the adversary linked their data to the anonymized data produced by our scheme, thereby compromising privacy. As stated earlier, the adversary needed to correctly figure out the categorical QIs as well to compromise privacy; therefore, we considered two settings of generalization (i.e., skipped, minimal) and (i.e., minimal, maximal generalization) for each value and evaluated the probability of disclosure. The skipped generalization case occurred when generalization was not applied due to the general pattern and higher diversity in the SA column. In the minimal generalization case, the real values were replaced by their direct ancestors in the generalization hierarchy. In the last case, the generalization was performed at higher levels of the generalization hierarchy to protect privacy effectively.
When was small, the minimal and maximal generalizations were applied. In contrast, skipped and minimal generalizations were applied when was large due to high diversity. To evaluate privacy strength for two values, we exposed certain records and attempted to identify the correct matches in the anonymized data. An example of an exposed record can be as follows: <Name = Huang, age = 34, Gender = Female, Race = White, Country = USA, income = ? (unknown)>. In this attack scenario, we assumed that SA was not publicly available, but QIs were available to the adversary. We partitioned the datasets into five equal parts and selected a subset of records from each partition. Subsequently, we matched those records to their respective clusters and computed the disclosure risk as a probability. The experimental results obtained from these experiments on the three datasets using two distinct values are given in Table 8.
Table 8.
Avg. by varying parameter.
Referring to Table 8, it can be observed that the Careplans dataset has a lower due to more unique SA values, and distributions are mostly balanced. In contrast, the higher in the other two datasets is due to greater imbalance and fewer unique SA values. In terms of , the lower value has a lower due to more noise and vice versa. From the results, it can be seen that the is not very high for both imbalanced and balanced datasets, indicating the efficacy of our scheme in realistic scenarios. In practice, the will decrease significantly when the categorical part of the data is also considered in experiments.
In the next set of experiments, we quantified the utility loss for each dataset based on the two values. Specifically, we determined the level of the generalization hierarchy on which the noisy value map operated and then calculated using the formula given in Equation (13). It is worth noting that each value of the numerical QIs was noisy and therefore, there was some loss of information. However, applying two values and considering other data characteristics reduced the noise, and therefore the was not very high. Table 9 presents the experimental results that were obtained from three datasets. Across all datasets, there were few numerical QIs, so the overall was not very high.
Table 9.
Avg. by varying parameter.
Referring to Table 9, a higher yielded higher utility (lower ) across datasets. In contrast, higher values yielded lower utility loss. However, the distinct values of and the greater portions of the general patterns reduced noise, and the utility loss was not very high across all datasets. Most existing methods use a single value of and do not classify data based on privacy risk, which can lead to greater utility loss. These results underscore the efficacy of our method for data mining and knowledge extraction from anonymized data.
In this work, we used two values of for each data partition to balance privacy and utility. The value is more sensitive between zero and one, as utility dominates privacy when in most cases [46]. In this work, we classified into two intervals, 0–1 and 0–0.5, and took the average to find the for each partition. Since the records in general patterns are not very risky, a relatively higher was employed, and vice versa. Our idea of employing distinct aligns with recent trends in using non-uniform noise in DP [47]. The chosen values satisfy the properties of the privacy–utility curve and enable controlled noise to be added to the data. The experimental results are given in Figure 14, and Table 8 and Table 9 prove that a higher can produce data of higher utility at the expense of privacy. Similarly, a lower can provide robust privacy guarantees at the expense of utility. The proposed scheme exploits other characteristics of the attributes to balance this trade-off between utility and privacy effectively.
Ablation study: Different components (i.e., CL-based data sorting, pattern-aware generalization, and DP noise schedule) in our scheme contributed differently to the enhanced utility, privacy, and computing time. To show the differential impact of each component, we conducted an ablation study, and the corresponding results are given in Table 10. From the results in Table 10, it can be seen that CL-based data sorting contributed more to time reduction during clustering and generalization. In contrast, customized anonymity operations (generalization and noising) contributed more to utility and privacy results. It is worth noting that another component (e.g., diversity consideration in the clustering process) also resulted in an additional 3.88% gain in privacy. These results verify the complimentary role of each component in balancing the privacy–utility–efficiency triad.
Table 10.
Ablation study results: average improvements in privacy–utility–efficiency triad.
6. Discussion
In this section, we summarize the challenges addressed in SOTA privacy methods, robustness, applicability of the proposed scheme in modern data outsourcing scenarios, and applicability of the proposed scheme to large/high-dimensional datasets.
6.1. Challenges Addressed
Our scheme addresses five crucial challenges of SOTA privacy-preserving techniques.
- It prevents unnecessary computational operations (distance calculations and hierarchy look-ups) in two key steps (clustering and generalization) of the anonymization pipeline, which have remained unexplored as data-level solutions in the current privacy literature.
- It links a cross-disciplinary approach (i.e., CL) with the anonymization domain for the first time to classify data with respect to privacy disclosure. In contrast, existing approaches treat all data equally with respect to privacy risk, leading to greater distortion and higher computational overhead.
- It offers practical, data-level solutions to achieve anonymity quickly, whereas existing work relies on complex approaches such as MapReduce or parallel computing architectures to achieve the same goal.
- It bridges the gap between syntactic and semantic privacy methods by adopting relevant mechanisms from both to provide an adaptive solution that restricts data modifications. In contrast, existing methods uniformly perform noising/generalization across all parts of the data.
- It simultaneously resolves trade-offs among three objectives (privacy, utility, time), whereas SOTA syntactic privacy methods (particularly clustering-based) mainly resolve trade-offs among only two (utility and time, utility and privacy, or privacy and time).
6.2. Robustness Offered
Our scheme is robust against diverse privacy attacks and utility metrics compared to SOTA clustering-based privacy techniques. For instance, it provides a solid defense against a strong adversary when different parts/attributes of the data are exposed. In contrast, existing methods assess privacy risks only to a limited extent, with greater emphasis on data utility. Furthermore, some studies do not assess privacy risk and instead base their evaluations on the definitions of privacy models (e.g., ℓ-diversity, k-anonymity, t-closeness, (, k)-anonymity, etc.). In contrast, we designed five attack scenarios and rigorously evaluated the privacy risks. We evaluated different combinations of QIs and SA values to analyze privacy risks under attacks and varying k values. Based on experimental analysis and comparisons with six SOTA privacy techniques, our scheme demonstrated greater robustness in privacy protection. From a utility perspective, it yielded lower and higher , demonstrating its effectiveness in modern data-driven applications where less distorted data are in high demand. Based on strong privacy guarantees against five different attacks and improved utility on two crucial data mining tasks, it is fair to say that the proposed scheme offers reasonable robustness within its designated scope. Lastly, the proposed scheme maintains the semantics of real data in anonymized data, making fairness implications negligible when “general patterns” dominate some groups.
6.3. Applicability Required for Practical Use in the Modern Era
Modern privacy techniques are exploring practical ways to reduce strict privacy levels to optimize utility in data-driven scenarios. Accordingly, the following novel trends have emerged recently in the privacy domain to either meet the demand of utility or to foster the use of data for personalized services while safeguarding privacy.
- Recent studies empower users to decide the sensitivity of their data, as treating all data as sensitive and ensuring equal protection for all significantly degrade data utility in modern analytic applications [2].
- Some recent studies exploit original data characteristics to limit the use of uniform or personalized strategies, thereby preventing wasted utility on attributes that do not require stringent anonymity operations [48].
- Some recent studies suggest reducing generalization/obfuscation to optimize utility without risking privacy by checking the availability of attributes in public domains/repositories [16].
- Some recent studies optimize data utility without risking privacy by exploiting data characteristics (fragmentation, column analysis, and other optimizations) and attribute relevance with respect to privacy and utility [49].
In line with modern trends, our scheme also explores data characteristics at a fine-grained level and adopts optimized operations for the two categories of privacy methods (e.g., DP and anonymization) to resolve the utility–privacy paradox. Our scheme abstracts and skips some data during anonymization, which can be handy for data-driven services because not all data are risky, as discussed in recent studies. It accounts for diversity in the SA column to make generalizations more adaptive, preserving more knowledge in the data without risking privacy. It uses two values to ensure that only a feasible amount of noise is added to the data, rather than a single value, as most conventional methods employ. It verifies robustness against a broad array of privacy attacks suited to this modality (e.g., tabular) while yielding higher utility. It identifies the risky parts of the data and adds more noise/generalization to improve privacy, ensuring its applicability to modern scenarios where some users may want strict privacy. The query-based analysis yielding higher aligns with recent data mining trends, in which analysts expect statistically valid answers from data published by data owners. The dynamic solution, empowered by a cross-disciplinary approach and data modification tailored to specific needs, is well-suited to real-world scenarios encountered in modern applications. Based on the above trends and our scheme’s in-depth analysis, it is fair to say that our scheme meets the practical applicability requirements for modern data outsourcing scenarios. Recently, synthetic-data-based methods have outperformed anonymity and DP-based methods in data outsourcing scenarios [15]. However, curating high-fidelity data remains challenging, and the computational overhead of generative models is substantial. The application of the proposed scheme to augmented data (synthetic and real) is a plausible extension of this work.
6.4. Applicability to Large or High-Dimensional Datasets
The efficacy of the proposed scheme was verified on three modest-sized datasets, and the results were superior in both utility and privacy for secondary data use. The Diabetes dataset has more than 100K records and is sufficient to demonstrate the generalizability of our scheme to high-dimensional datasets. Our scheme can be applied to any large or high-dimensional dataset without oversimplifying the data distributions or relationships. In our scheme, records are mapped to three partitions by exploiting composition-related information in categorical QIs, and the partitions differ in the number of records. In high-dimensional data and with loosely connected QIs, there is a chance of more records in the partially clustered and unclustered partitions. In contrast, if the data are high-dimensional and many categorical QIs are interconnected, the first partition (i.e., naturally clustered) can contain more records than the other two. In our scheme, the categorical QIs were used for data partitioning, while the numerical QIs were noised using the DP model. In some cases, when the number of numerical QIs is higher, the distribution disparity can be slightly high, which can be reduced by using a larger and exploiting SA diversity information. It is worth noting that the complexity of some steps can increase when the dataset size is large or it contains more QIs. Lastly, some parameters may need to be tuned based on dataset size or dimensionality to resolve the privacy–utility trade-off effectively.
7. Conclusions and Future Work
In this paper, we proposed a curriculum-based, pattern-aware, low-cost privacy-preserving scheme for mixed-data outsourcing that maintains guarantees on privacy, utility, and computing overhead. Our scheme reduces unnecessary computations in cluster generation and data generalization by leveraging the CL approach and pattern information. In our scheme, some parts of the data are processed and anonymized, whereas existing methods unnecessarily process and anonymize the entire dataset. Our concept of applying anonymity to only the vulnerable parts of the data aligns with modern trends, as not all attributes/records are sensitive [2]. We designed an abstract-and-preserve strategy to preserve generic patterns in the anonymized data, enhancing utility without compromising privacy. Our scheme considers the diversity of SA in the cluster-generation process to preserve user privacy. Empirical results showed that our scheme is low-cost in terms of computation time, better resists privacy disclosures, and provides significantly higher data utility. This paper introduced a new perspective in the privacy literature by creating synergies between the latest AI techniques and anonymization methods to reduce computational overhead and overgeneralization effectively. In summary, this study highlighted a critical and immediate need to prevent redundant distance/similarity computations during clustering and unnecessary data generalization in data outsourcing scenarios, thereby enabling the secondary use of data. The effective application of the proposed scheme in practical settings can lead to high-quality data outsourcing, ultimately contributing to advancing science (e.g., testing and creating hypotheses, policy-making, etc.) and influencing societies (improving people’s lifestyles with enhanced data-driven services). Our approach offers an algorithmic solution to classify data as vulnerable or non-vulnerable, leveraging the first successful synergy of CL and pattern information. This combination (the joint use of CL and pattern information) has remained unexplored in the recent privacy literature. Our scheme can pave the way for integrating advanced AI approaches with conventional anonymity methods to address critical problems/trade-offs in real-world scenarios.
As for future work, our scheme can be extended to preserve users’ privacy with multiple SAs rather than a single one. The current clustering method can be replaced with more advanced density-based clustering algorithms, such as DBSCAN and (H)DBSCAN, to further improve privacy and utility results. Lastly, the proposed scheme can be optimized to fit the secret specification scenario (e.g., when users determine the sensitivity of their data) [2]. This adjustment (secret specification scenario) aims to verify the feasibility of three partitions further and explore possible extensions to more partitions, resolving the privacy–utility trade-off in complex datasets.
Author Contributions
Conceptualization, A.M. and S.O.H.; Methodology, A.M. and K.L.; Software, A.M. and K.L.; Investigation, A.M., K.L. and S.O.H.; Resources, S.O.H.; Data curation, A.M. and K.L.; Writing—original draft, A.M., K.L. and S.O.H.; Writing—review & editing, A.M. and S.O.H.; Visualization, A.M. and K.L.; Supervision, S.O.H.; Funding, A.M. All authors have read and agreed to the published version of the manuscript.
Funding
This work was supported by the National Research Foundation of Korea (NRF) grant funded by the Korea government (Ministry of Science and ICT) (No. RS-2024-00340882) and also supported by the Gachon University research fund of 2025 (GCU-202503400001).
Institutional Review Board Statement
Not applicable.
Informed Consent Statement
Not applicable.
Data Availability Statement
Publicly available datasets were used in evaluation.
Acknowledgments
The authors sincerely thank the seven reviewers who thoroughly evaluated this article and provided very constructive feedback, which significantly enhanced the quality of this article.
Conflicts of Interest
The authors declare no conflicts of interest.
References
- Wieringa, J.; Kannan, P.; Ma, X.; Reutterer, T.; Risselada, H.; Skiera, B. Data analytics in a privacy-concerned world. J. Bus. Res. 2021, 122, 915–925. [Google Scholar] [CrossRef]
- Chen, J.; Hu, C.; Liu, Z.; Xiang, T.; Hu, P.; Yu, J. Secret Specification Based Personalized Privacy-Preserving Analysis in Big Data. IEEE Trans. Big Data 2025, 11, 774–787. [Google Scholar] [CrossRef]
- Garfinkel, S.; Near, J.; Dajani, A.; Singer, P.; Guttman, B. De-Identifying Government Datasets: Techniques and Governance; National Institute of Standards and Technology (NIST): Gaithersburg, MD, USA, 2023. [Google Scholar]
- Dwork, C. Differential privacy. In Proceedings of the International Colloquium on Automata, Languages, and Programming, Venice, Italy, 10–14 July 2006; Springer: Berlin/Heidelberg, Germany, 2006; pp. 1–12. [Google Scholar]
- Domingo-Ferrer, J.; Sánchez, D.; Blanco-Justicia, A. The limits of differential privacy (and its misuse in data release and machine learning). Commun. ACM 2021, 64, 33–35. [Google Scholar] [CrossRef]
- Samarati, P. Protecting respondents identities in microdata release. IEEE Trans. Knowl. Data Eng. 2001, 13, 1010–1027. [Google Scholar] [CrossRef]
- Machanavajjhala, A.; Kifer, D.; Gehrke, J.; Venkitasubramaniam, M. l-diversity: Privacy beyond k-anonymity. ACM Trans. Knowl. Discov. Data (TKDD) 2007, 1, 3-es. [Google Scholar] [CrossRef]
- Li, N.; Li, T.; Venkatasubramanian, S. t-closeness: Privacy beyond k-anonymity and l-diversity. In Proceedings of the 2007 IEEE 23rd International Conference on Data Engineering, Istanbul, Turkey, 15–20 April 2007; IEEE: New York, NY, USA, 2006; pp. 106–115. [Google Scholar]
- Bi, R.; Guo, D.; Zhang, Y.; Huang, R.; Lin, L.; Xiong, J. Outsourced and Privacy-Preserving Collaborative K-Prototype Clustering for Mixed Data via Additive Secret Sharing. IEEE Internet Things J. 2023, 10, 15810–15821. [Google Scholar] [CrossRef]
- Abbasi, A.; Mohammadi, B. A clustering-based anonymization approach for privacy-preserving in the healthcare cloud. Concurr. Comput. Pract. Exp. 2022, 34, e6487. [Google Scholar] [CrossRef]
- Strobel, M.; Shokri, R. Data privacy and trustworthy machine learning. IEEE Secur. Priv. 2022, 20, 44–49. [Google Scholar] [CrossRef]
- Jha, N.; Vassio, L.; Trevisan, M.; Leonardi, E.; Mellia, M. Practical anonymization for data streams: Z-anonymity and relation with k-anonymity. Perform. Eval. 2023, 159, 102329. [Google Scholar] [CrossRef]
- Sowmyarani, C.; Namya, L.; Nidhi, G.; Kumar, P.R. Analysis and Optimization of Clustering-based Privacy Preservation using Machine Learning. In Proceedings of the 2023 International Conference for Advancement in Technology (ICONAT), Goa, India, 24–26 January 2023; IEEE: Piscataway, NJ, USA, 2023; pp. 1–4. [Google Scholar]
- Arshad, R.; Asghar, M.R. Characterisation and quantification of user privacy: Key challenges, regulations, and future directions. IEEE Commun. Surv. Tutor. 2024, 27, 3266–3307. [Google Scholar] [CrossRef]
- Razi, Q.; Datta, S.; Hassija, V.; Chalapathi, G.; Sikdar, B. Privacy Utility Tradeoff Between PETs: Differential Privacy and Synthetic Data. IEEE Trans. Comput. Soc. Syst. 2024, 12, 473–484. [Google Scholar] [CrossRef]
- Borrero-Foncubierta, A.; Rodriguez-Garcia, M.; Muñoz, A.; Dodero, J.M. Protecting privacy in the age of big data: Exploring data linking methods for quasi-identifier selection. Int. J. Inf. Secur. 2025, 24, 37. [Google Scholar] [CrossRef]
- Thedchanamoorthy, G.; Bewong, M.; Mohammady, M.; Zia, T.; Islam, M.Z. Ud-ldp: A technique for optimally catalyzing user driven local differential privacy. Future Gener. Comput. Syst. 2025, 166, 107712. [Google Scholar] [CrossRef]
- Moqurrab, S.A.; Naeem, T.; Malik, M.S.; Fayyaz, A.A.; Jamal, A.; Srivastava, G. UtilityAware: A Framework for Data Privacy Protection in e-Health. Inf. Sci. 2023, 643, 119247. [Google Scholar] [CrossRef]
- Onesimu, J.A.; Karthikeyan, J.; Sei, Y. An efficient clustering-based anonymization scheme for privacy-preserving data collection in IoT based healthcare services. Peer-to-Peer Netw. Appl. 2021, 14, 1629–1649. [Google Scholar] [CrossRef]
- Xia, Y.; Zhao, T.; Lv, Y.; Li, Y.; Yang, R. Hierarchical DP-K Anonymous Data Publishing Model Based on Binary Tree. In Proceedings of the 2023 25th International Conference on Advanced Communication Technology (ICACT), Pyeongchang, Republic of Korea, 19–22 February 2023; IEEE: Piscataway, NJ, USA, 2023; pp. 102–110. [Google Scholar]
- Kanade, D.M.; Sane, S.S. Evaluating the Effectiveness of Clustering-Based K-Anonymity and KNN Cluster for Privacy Preservation. Int. J. Intell. Syst. Appl. Eng. 2023, 11, 85–93. [Google Scholar]
- Sadeghi-Nasab, A.; Ghaffarian, H.; Rahmani, M. Apache Flink and clustering-based framework for fast anonymization of IoT stream data. Intell. Syst. Appl. 2023, 20, 200267. [Google Scholar] [CrossRef]
- Amiri, F.; Khan, R.; Anjum, A.; Syed, M.H.; Rehman, S. Enhancing Utility in Anonymized Data against the Adversary’s Background Knowledge. Appl. Sci. 2023, 13, 4091. [Google Scholar] [CrossRef]
- Majeed, A.; Hwang, S.O. Differential Privacy and k-Anonymity-Based Privacy Preserving Data Publishing Scheme with Minimal Loss of Statistical Information. IEEE Trans. Comput. Soc. Syst. 2023, 11, 3753–3765. [Google Scholar] [CrossRef]
- Zhang, X.; Qi, L.; Dou, W.; He, Q.; Leckie, C.; Kotagiri, R.; Salcic, Z. MRMondrian: Scalable multidimensional anonymisation for big data privacy preservation. IEEE Trans. Big Data 2017, 8, 125–139. [Google Scholar] [CrossRef]
- Mehta, B.B.; Rao, U.P. Improved l-diversity: Scalable anonymization approach for privacy preserving big data publishing. J. King Saud Univ. Comput. Inf. Sci 2022, 34, 1423–1430. [Google Scholar] [CrossRef]
- Azad, M.W.A.; Sarwar, S.; Taki, S.U.; Mastorakis, S. The Case for the Anonymization of Offloaded Computation. arXiv 2023, arXiv:2305.07803. [Google Scholar] [CrossRef]
- Kim, S.S. A New Approach for Anonymizing Transaction Data with Set Values. Electronics 2023, 12, 3047. [Google Scholar] [CrossRef]
- Ge, Y.F.; Wang, H.; Bertino, E.; Zhan, Z.H.; Cao, J.; Zhang, Y.; Zhang, J. Evolutionary dynamic database partitioning optimization for privacy and utility. IEEE Trans. Dependable Secur. Comput. 2023, 21, 2296–2311. [Google Scholar] [CrossRef]
- Arava, K.; Lingamgunta, S. Adaptive k-anonymity approach for privacy preserving in cloud. Arab. J. Sci. Eng. 2020, 45, 2425–2432. [Google Scholar] [CrossRef]
- Song, F.; Ma, T.; Tian, Y.; Al-Rodhaan, M. A new method of privacy protection: Random k-anonymous. IEEE Access 2019, 7, 75434–75445. [Google Scholar] [CrossRef]
- Onesimu, J.A.; Karthikeyan, J.; Eunice, J.; Pomplun, M.; Dang, H. Privacy preserving attribute-focused anonymization scheme for healthcare data publishing. IEEE Access 2022, 10, 86979–86997. [Google Scholar] [CrossRef]
- Srijayanthi, S.; Sethukarasi, T. Design of privacy preserving model based on clustering involved anonymization along with feature selection. Comput. Secur. 2023, 126, 103027. [Google Scholar] [CrossRef]
- Fan, Y.; Shi, X.; Zhang, S.; Tong, Y. Anonymous Methods Based on Multi-Attribute Clustering and Generalization Constraints. Electronics 2023, 12, 1897. [Google Scholar] [CrossRef]
- di sabrina Vimercati, S.D.C.; Facchinetti, D.; Foresti, S.; Livraga, G.; Oldani, G.; Paraboschi, S.; Rossi, M.; Samarati, P. Scalable Distributed Data Anonymization for Large Datasets. IEEE Trans. Big Data 2022, 9, 818–831. [Google Scholar] [CrossRef]
- Yang, T.; Cang, L.S.; Iqbal, M.; Almakhles, D. Attack Risk Analysis in Data Anonymization in Internet of Things. IEEE Trans. Comput. Soc. Syst. 2023, 11, 4986–4993. [Google Scholar] [CrossRef]
- Sadhya, D.; Chakraborty, B. Quantifying the Effects of Anonymization Techniques over Micro-databases. IEEE Trans. Emerg. Top. Comput. 2022, 10, 1979–1992. [Google Scholar] [CrossRef]
- Kesgin, H.T.; Amasyali, M.F. Cyclical curriculum learning. IEEE Trans. Neural Netw. Learn. Syst. 2023, 35, 12864–12872. [Google Scholar] [CrossRef] [PubMed]
- Zhang, C.; Jiang, H.; Wang, Y.; Hu, Q.; Yu, J.; Cheng, X. User identity de-anonymization based on attributes. In Proceedings of the International Conference on Wireless Algorithms, Systems, and Applications, Harbin, China, 23–25 June 2019; Springer: Berlin/Heidelberg, Germany, 2019; pp. 458–469. [Google Scholar]
- McSherry, F.D. Privacy integrated queries: An extensible platform for privacy-preserving data analysis. In Proceedings of the 2009 ACM SIGMOD International Conference on Management of Data, Providence, RI, USA, 29 June–2 July 2009; pp. 19–30. [Google Scholar]
- Newman, D. UCI Repository of Machine Learning Databases, University of California, Irvine. 1998. Available online: https://archive.ics.uci.edu/ (accessed on 5 June 2025).
- El Ouazzani, Z.; Braeken, A.; El Bakkali, H. Proximity Measurement for Hierarchical Categorical Attributes in Big Data. Secur. Commun. Netw. 2021, 2021, 6612923:1–6612923:17. [Google Scholar] [CrossRef]
- Sujatha, K.; Udayarani, V. Chaotic geometric data perturbed and ensemble gradient homomorphic privacy preservation over big healthcare data. Int. J. Syst. Assur. Eng. Manag. 2021, 12, 1–13. [Google Scholar] [CrossRef]
- Li, Y.; Liu, Y.; Li, B.; Wang, W.; Liu, N. Towards practical differential privacy in data analysis: Understanding the effect of epsilon on utility in private erm. Comput. Secur. 2023, 128, 103147. [Google Scholar] [CrossRef]
- Domingo-Ferrer, J.; Sánchez, D. How to Get Actual Privacy and Utility from Privacy Models: The k-Anonymity and Differential Privacy Families. arXiv 2025, arXiv:2510.11299. [Google Scholar] [CrossRef]
- Jiang, H.; Yu, H.; Cheng, X.; Pei, J.; Pless, R.; Yu, J. Dp2-pub: Differentially private high-dimensional data publication with invariant post randomization. IEEE Trans. Knowl. Data Eng. 2023, 35, 10831–10844. [Google Scholar] [CrossRef]
- Liu, J.; Hu, Y.; Guo, X.; Liang, T.; Jin, W. Differential privacy performance evaluation under the condition of non-uniform noise distribution. J. Inf. Secur. Appl. 2022, 71, 103366. [Google Scholar] [CrossRef]
- Chen, Z.; Yao, L.; Hu, H.; Wu, G. η-Inference: A Data-Aware and High-Utility Privacy Model for Relational Data Publishing. IEEE Trans. Dependable Secur. Comput. 2025, 22, 4086–4102. [Google Scholar] [CrossRef]
- Amiri, A. Maximizing data utility while preserving privacy through database fragmentation. Expert Syst. Appl. 2025, 273, 126873. [Google Scholar] [CrossRef]


Disclaimer/Publisher’s Note: The statements, opinions and data contained in all publications are solely those of the individual author(s) and contributor(s) and not of MDPI and/or the editor(s). MDPI and/or the editor(s) disclaim responsibility for any injury to people or property resulting from any ideas, methods, instructions or products referred to in the content. |
© 2025 by the authors. Licensee MDPI, Basel, Switzerland. This article is an open access article distributed under the terms and conditions of the Creative Commons Attribution (CC BY) license (https://creativecommons.org/licenses/by/4.0/).