Article

Non-Steady-State Coupled Model of Viscosity–Temperature–Pressure in Polymer Flooding Injection Wellbores

1
The Key Laboratory of Enhanced Oil and Gas Recovery of Educational Ministry, Northeast Petroleum University, Qinhuangdao 066000, China
2
School of Petroleum Engineering, Northeast Petroleum University, Daqing 163000, China
*
Author to whom correspondence should be addressed.
Appl. Sci. 2025, 15(21), 11831; https://doi.org/10.3390/app152111831
Submission received: 10 October 2025 / Revised: 1 November 2025 / Accepted: 4 November 2025 / Published: 6 November 2025
(This article belongs to the Section Applied Thermal Engineering)

Abstract

Polymer solutions play a crucial role in the polymer flooding process by influencing the flow characteristics of formation fluids and enhancing recovery efficiency. Their properties are influenced by the transient coupling of temperature, pressure, and viscosity, yet the underlying patterns remain unclear. This study establishes a non-steady-state coupling model of polymer temperature–pressure–viscosity in wellbores, solved numerically using a staggered-grid fully implicit scheme in Matlab. At a depth of 1000 m, the polymer viscosity is measured in the field as 102.12 mPa·s, while the simulated value is 107.46 mPa·s (4.97% error), indicating good agreement with the wellbore viscosity distribution. Wellbore temperature is the dominant factor, whereas injection pressure has minor effects. Injection flow rate governs heat exchange with the formation; low flow causes larger temperature and viscosity fluctuations, while high flow leads to insufficient heat transfer. With prolonged injection, wellbore temperature approaches dynamic equilibrium, viscosity decreases, and sand-carrying capacity weakens. These findings provide theoretical guidance for optimizing polymer flooding.

1. Introduction

With the continuous growth of global energy demand, conventional oil and gas extraction methods are no longer sufficient to meet supply requirements. Polymer flooding has been widely applied to enhance oil and gas recovery from low-permeability reservoirs [1,2,3,4,5,6,7,8]. Polymer solutions can significantly increase the viscosity of injected water, improve the mobility ratio during the displacement process, and thus enhance sweep efficiency and oil recovery [9,10,11,12]. Nevertheless, the flow of polymer solutions in the wellbore involves the dynamic coupling of multiple physical properties, such as temperature, pressure, and viscosity. The transient evolution of these properties directly affects wellbore injection efficiency [13,14,15]. Polymer flooding, as a mature and economically viable tertiary oil recovery technology, has been widely applied in various oil fields across China. The research conducted by MI Magzoub et al. [16] indicates that cross-linked polymers have excellent stability and adaptability as well as leakage-blocking materials in high-temperature and high-pressure wellbore environments. This, in turn, reflects the application potential of polymer systems in complex wellbore conditions.
Besides wellbore strengthening, researchers have also conducted extensive studies on the rheological properties, flow laws, and wellbore adaptability of polymers during the process of enhancing oil recovery. Yang Wang et al. [17] proposed a novel two-phase numerical well test model. This model can better describe the viscoelasticity and nonlinear flow characteristics of polymers, and analyzes the multiple influencing factors of near-wellbore blockage on the polymer flooding process, including the blockage degree (intra-zone permeability), blockage range (composite radius), and the polymer flooding front radius. The research results show that the polymer viscoelasticity has a significant impact on the transition section of the type curve. At the same time, the near-wellbore blockage effect and the influence of polymer concentration distribution on the well logging curve exhibit a high degree of similarity.
Due to the formation of complex spatial structures between and within the molecules of high-viscosity polymer solutions, significant viscosity loss rates occur in the region near the injection end of the wellhead [18,19,20,21,22,23]. Yang Lian et al. [24], based on COMSOL simulation results, indicated that in the application of oil fields, reasonably controlling the injection and production intensity and the concentration of the polymer solution is of crucial significance for maximizing the oil recovery rate. Furthermore, Wang Yang et al. [25] established a transient analysis model for the pressure of oil–water two-phase flow in polymer-driven fracture wells, and solved it using the finite volume difference method and Newton iteration method. This study explored the effects of fracture conductivity coefficient, injection and initial polymer concentration, and water saturation on the type curves, and verified the reliability and applicability of the model.
Furthermore, Konyukhov et al. [26] developed a mathematical and numerical model. This model encompasses the complete differential equations for controlling the non-steady two-phase three-component flow in the reservoir, as well as the quasi-steady heat and mass transfer equations in the working channels of the well and pump. The study was solved using the finite difference method and iterative algorithm, combined with parallel computing technology. The results showed that parallelized computing could significantly improve performance. Meanwhile, Long Peng et al. [27] emphasized that establishing and analyzing the dynamic coupling model of wellbore heat transfer is crucial for solving the transient flow problems between the reservoir and the wellbore. The multiphase flow, temperature and pressure in the wellbore are continuously changing, which directly affects the production life and recovery rate. Finally, JianChun Guo et al. [28] established a non-steady temperature–pressure coupled model of the wellbore. This model calculates the fluid properties by calling the Nist Refprop(version 9.1) software in Matlab and precisely solves the temperature and pressure distribution in the wellbore using the cyclic iterative method.
During polymer flooding, the temperature changes within the wellbore can affect the viscosity of the fluid. The viscosity changes further influence the Reynolds number, which in turn determines the magnitude of the friction coefficient. Changes in the friction coefficient lead to pressure drop, thereby causing fluctuations in the pressure within the wellbore. The generation of pressure differences forms an internal heat source, which in turn affects the temperature distribution. During on-site construction, it is usually difficult to achieve precise measurement of the viscosity values within the wellbore. Additionally, studies on the temperature, pressure and viscosity distribution patterns of polymer flooding within the wellbore are still relatively scarce. Based on this, this paper constructs a non-steady-state temperature–pressure–viscosity coupled model for polymer flooding in wellbores, and uses the “catch-up method” to iteratively solve the staggered-grid fully implicit discretization format, thereby achieving high-precision calculation of the temperature and viscosity distribution of the polymer solution within the wellbore. In terms of time discretization, this paper adopts the fully implicit difference method to enhance computational stability and adapt to the requirements of solving problems with strong nonlinearity or stiffness, thereby ensuring the accuracy of the results. Therefore, this study not only deepens the understanding of the coupling mechanism of heat transfer and rheology of polymer flooding solutions in the wellbore, but also provides theoretical basis and method references for the optimization of on-site polymer flooding operations and the improvement of recovery rate.

2. Structural Model Analysis

The research methods for wellbore heat transfer can be mainly classified into two types: steady-state and non-steady-state. Steady-state wellbore heat transfer refers to the situation where after a certain period of time during the heat transfer process, the temperature distribution within the wellbore tends to stabilize, and the temperature at each point and the heat flux and other parameters remain constant [29,30,31,32].
In contrast, non-steady-state wellbore heat transfer refers to the heat transfer process where the temperature distribution and thermal properties parameters change continuously over time. When the wellbore is just started or is subjected to sudden changes in external conditions (such as changes in injection temperature or injection flow rate), it is usually in the non-steady-state heat transfer stage [33,34,35,36]. In most field conditions, wellbore heat transfer is non-steady. When the interrelationship between temperature and pressure is not taken into account, the temperature and pressure calculations are decoupled; if their relationship is considered, the calculation process becomes coupled. Currently, many non-steady-state heat transfer models for polymer flooding wellbores are difficult to effectively handle the interaction among fluid temperature, pressure, and viscosity, especially in transient conditions, where the solution of the three is extremely complex. Therefore, general non-coupled constant-property models cannot accurately solve such problems.
Based on this, this paper uses the continuity equation, momentum equation, and energy conservation law to establish a coupled model of non-steady-state temperature–pressure–viscosity for polymer flooding in wellbores. This model adopts the staggered-grid fully implicit discretization method and uses Matlab to numerically iterate and solve the temperature and viscosity of the polymer solution, achieving high-precision calculation.
Since this study only considers the polymer injection process and does not involve the extraction of crude oil, the longitudinal structure of the wellbore physical model is divided into the formation, cement sheath and casing, and is presented as axially symmetric distribution with the casing center as the origin, as shown in Figure 1. Most polymers belong to non-Newtonian fluids. Under the influence of external temperature and pressure, except for significant changes in viscosity, other thermal physical parameters remain basically unchanged. Therefore, this study only focuses on the coupling effect among temperature, pressure and viscosity.

3. Mathematical Model Development

3.1. Model Assumptions

Due to the complex flow process of the polymer within the casing, the following assumptions are made for the model in this paper:
  • Before the injection of fluid, the fluid inside the casing had reached a thermal equilibrium state with the formation.
  • The temperature and pressure at the same horizontal section within the casing are the same.
  • Throughout the entire construction process, the injection flow rate, injection temperature and injection pressure remained constant
  • Below the surface lies the constant-temperature layer; after reaching a certain depth, the temperature of the strata changes linearly with depth.
  • Apart from viscosity, the thermal physical parameters of the polymer solutions remain constant in the wellbore.

3.2. Wellbore Temperature–Pressure–Viscosity Coupling Model

3.2.1. Casing Heat Transfer Model

The heat within the fluid control unit of the casing can be divided into three components:
(1)
In the axial direction, the net heat transfer caused by fluid flow, that is, the difference between the heat entering and the heat leaving.
(2)
In the radial direction, the heat generated by the convective heat transfer between the fluid and the casing wall.
(3)
According to the law of conservation of energy, within a unit of time, the difference between the heat flowing into and out of the control unit is equal to the increase in the energy of the control unit.
The equation can be represented by Equation (1) [28] (in Chinese):
Q m π r 1 2 ρ 1 v 1 c 1 T 1 z + 2 h 1 T 2 T 1 r 1 = ρ 1 c 1 T 1 t
In the equation, Qm represents the heat generated per unit length within the casing, W/m; ρ1 represents the density of the polymer, kg/m3; v1 represents the aggregated flow velocity, m/s; c1 represents the specific heat capacity of the polymer, J/(kg·°C); T1 represents the polymer temperature, °C; T2 represents the temperature of the casing wall, °C; h1 represents the convective heat transfer coefficient of the inner wall of the casing, W/(m2·°C); z represents the depth, m; t represents time, s.

3.2.2. Pressure Drop Model

According to Equation (7) in the model proposed by Guo et al. [28] (in Chinese), based on the continuity equation and the motion equation, the formula for the unit pressure drop when the polymer is injected and flows in the casing is:
p 1 z = ρ 1 g f ρ 1 v 1 2 2 d 1 ρ 1 v 1 2 2 z ρ 1 v 1 t
In the equation, p1 represents the fluid pressure within the casing, MPa; d1 represents the inner diameter of the casing, m; g represents the acceleration due to gravity, g = 9.8 m/s2; f represents the frictional resistance coefficient, which is dimensionless.

3.2.3. Other Parameters

(1)
Reynolds number
The flow condition of the fluid inside the casing is characterized by the Reynolds number:
R e = 2 ρ 1 v 1 r 1 μ 1
In the equation, µ1 represents the viscosity of the fluid inside the casing, Pa·s; when Re < 2300, the fluid is in a laminar flow state; when Re ≧ 4000, the fluid is in a turbulent state; when 2300 < Re < 4000, the flow may be laminar or turbulent, depending on the flow environment, and this region is called the transition zone.
(2)
Prandtl number
The influence of fluid properties within the casing on heat transfer is characterized by the Prandtl number:
P r = c p μ 1 λ 1
In the equation, cp represents the specific heat capacity of the fluid at constant pressure, J/(kg·°C); λ1 represents the thermal conductivity of the fluid inside the casing.
(3)
Friction factor
Chen proposed an explicit formula for calculating the friction coefficient, which is applicable to all Reynolds numbers and pipe wall roughness conditions. In the calculation of fluid flow resistance, this formula can provide high calculation accuracy [37]:
1 f = 2 lg R a / d 1 3.7065 5.0452 R e lg R a / d 1 1.1098 2.8257 + 5.8506 R e 0.8981
In the equation, Ra represents the average roughness of the inner wall of the casing, m; f represents the friction coefficient.
(4)
Fluid velocity
The turbulent structure near the pipe wall can be divided into three regions: the near-wall viscous layer, the transition zone, and the turbulent core region. At a unit cross-section, the instantaneous flow velocity u in the turbulent core region is calculated based on two parameters: the characteristic velocity u* and the characteristic length y* [38] (in Chinese):
u ¯ = u * 2.5 ln r 1 y * + 5.5
In the equation:
u * = τ 0 ρ 1 y * = μ 1 τ 0 ρ 1 τ 0 = 0.0791 R e 0.25 ρ 1 q 2 L π r 1 3
In the equation, τ0 represents the wall shear force, Pa; L represents the length of the pipe section, m.
(5)
Frictional Internal Heat Source
During the fracturing process, the work conducted by the fluid’s viscosity force generates a heat source due to friction. By combining this with the expression of the frictional pressure drop gradient ΔPf, it can be further simplified as:
Q m = Δ P f q
In the equation, Qm represents the internal heat source due to friction, W/m; ΔPf represents the gradient of frictional pressure drop, Pa/m; q represents volumetric flow rate, m3/s.
(6)
Casing Internal Convective Heat Transfer Coefficient
Assuming that the heat exchange between the fluid inside the shell and the shell wall is a forced convective heat transfer process, based on the model Formula (8) proposed by Guo et al. [28] (in Chinese), the vertical circular tube heat transfer model is adopted for analysis and calculation:
h 1 = 0.027 λ 1 R e 0.8 P r n d 1
In the equation, d1 represents the diameter of the casing, W/(m·°C); n represents the exponent. When the fluid is heated, n = 0.4; when the fluid is cooled, n = 0.3.

3.3. Model Solving Methodology

3.3.1. Viscosity–Temperature Model

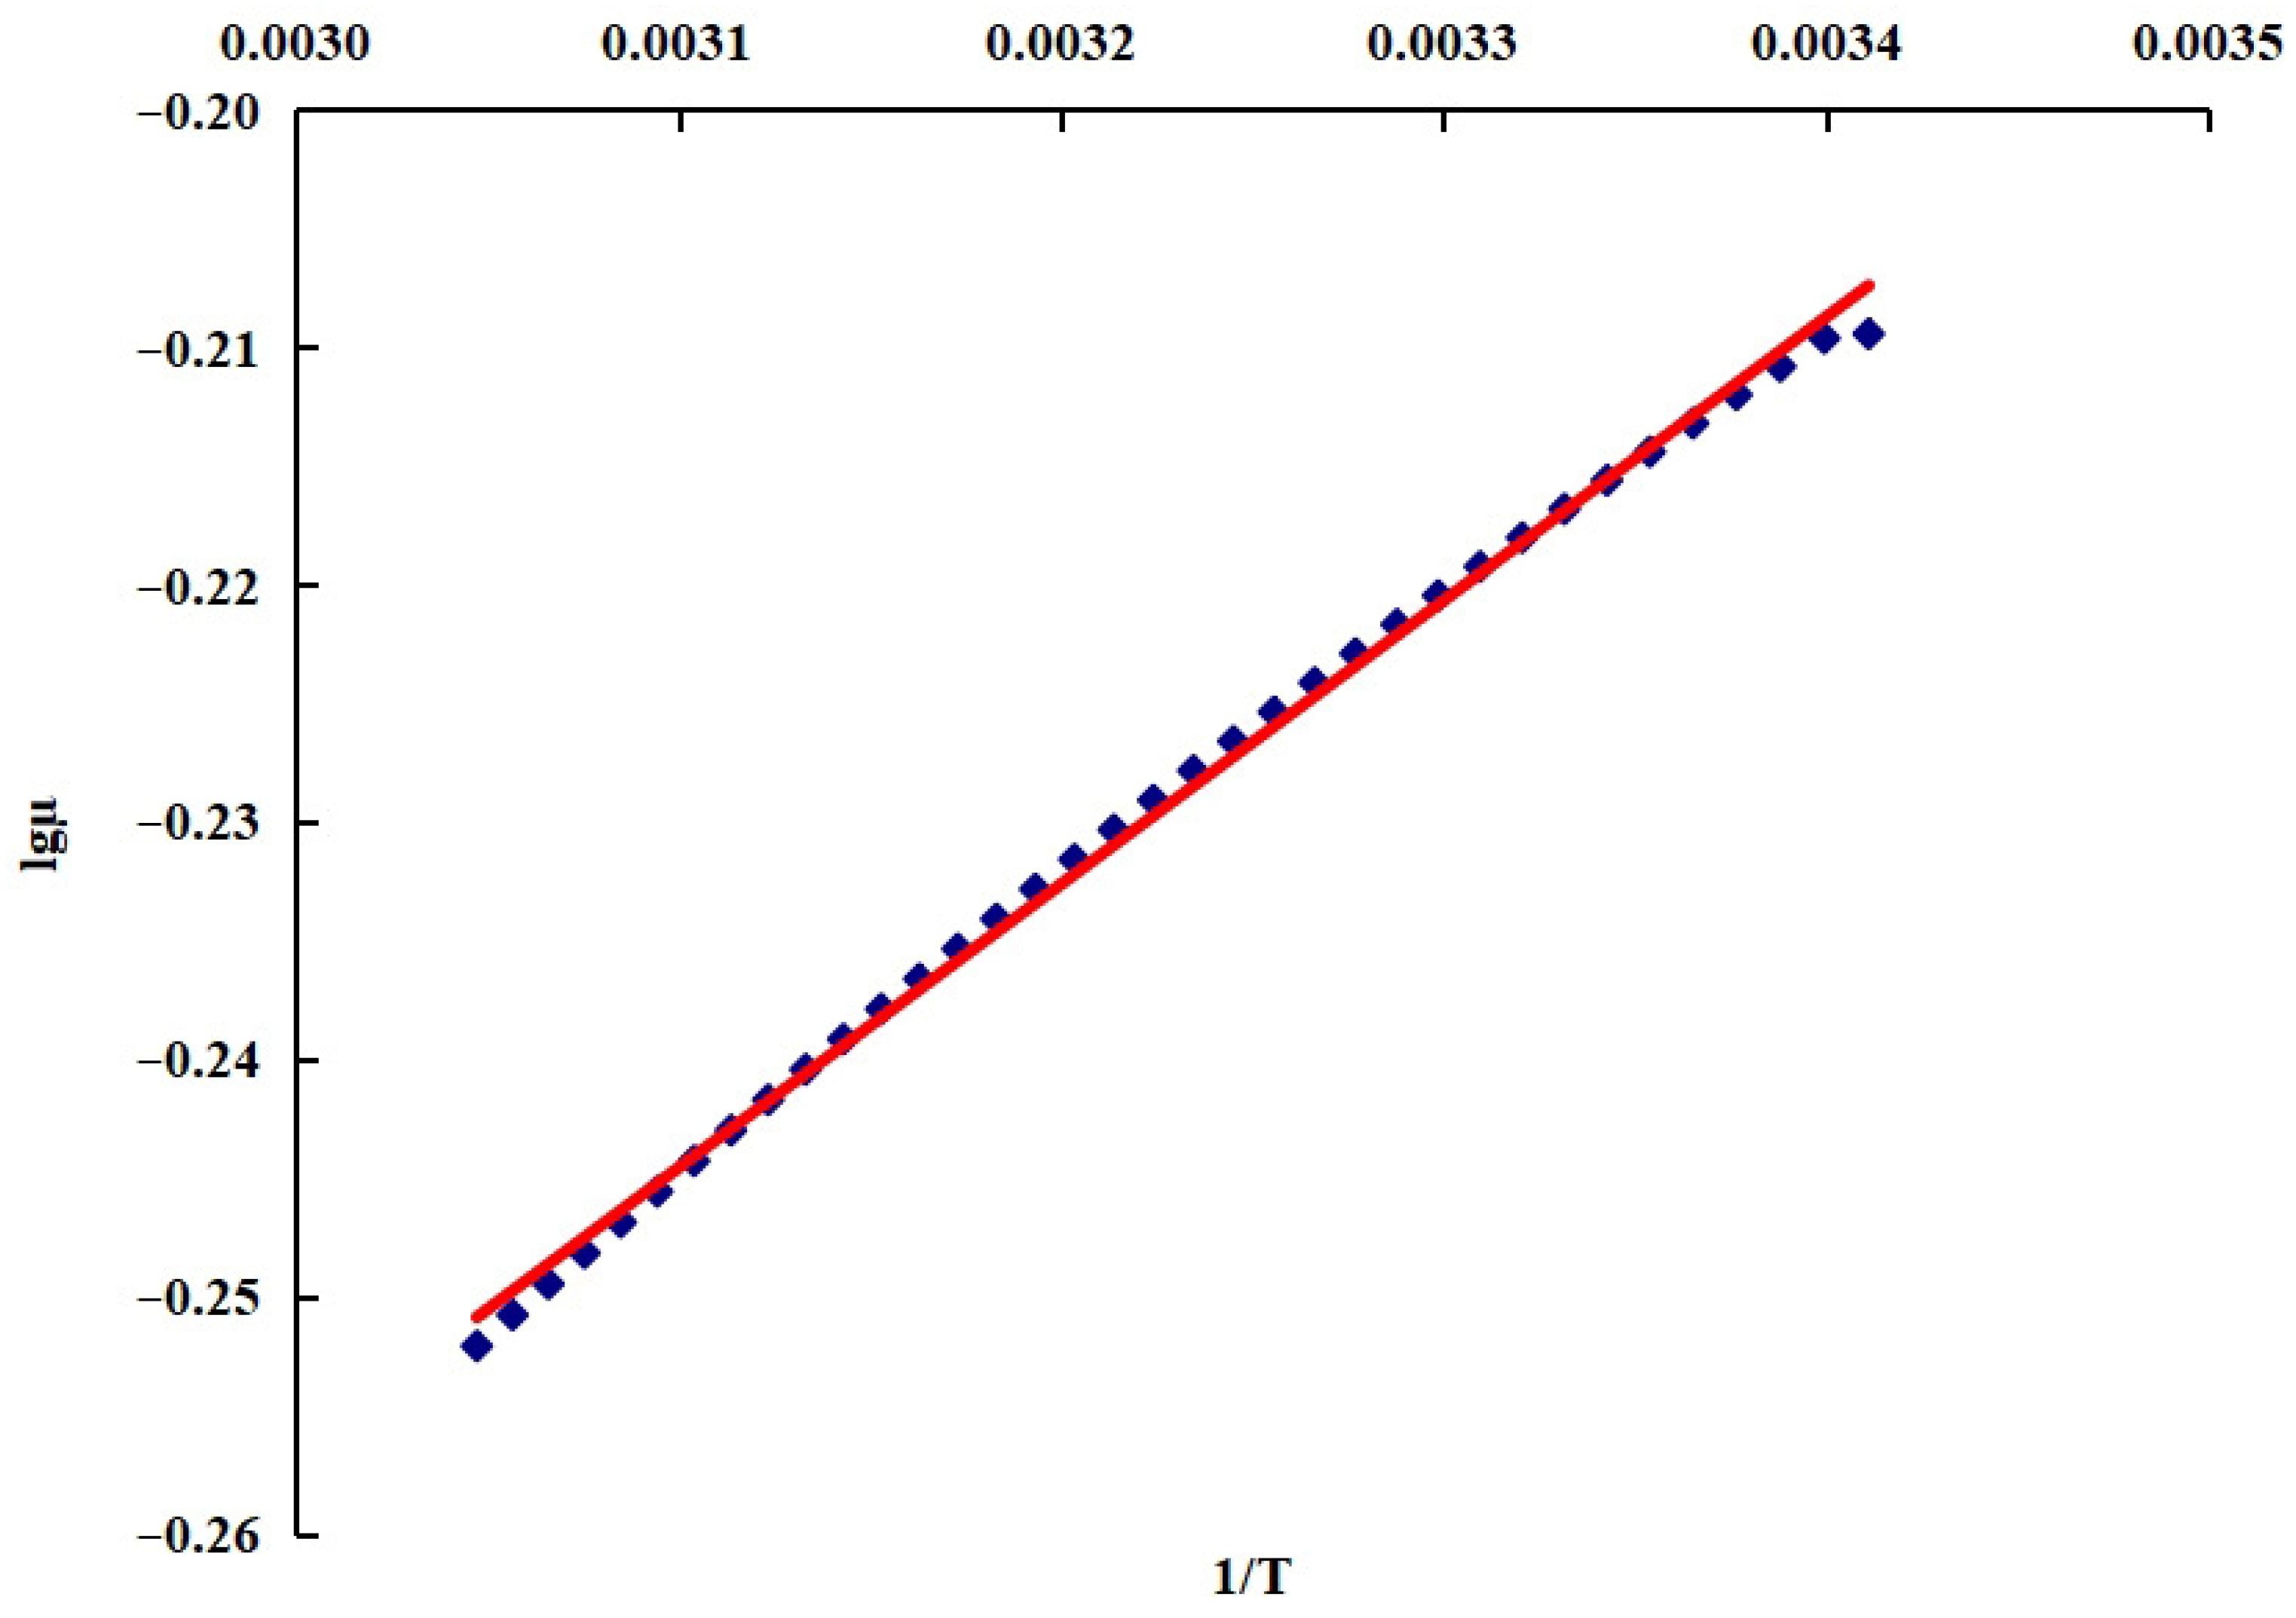
In order to quantitatively characterize the dependence of polymer solution viscosity on temperature, viscosity–temperature data of water-soluble polyacrylamide obtained from the polymer–surfactant binary flooding block in Well 16 of the Jingcai Production Plant, Liaohe Oilfield, were subjected to linear fitting, and the viscosity–temperature correlation was established, as shown in Figure 2:
lg μ = A + B T
In the equation:
A = 0.550527 B = 100.010446
In the equation, µ represents the viscosity of the current polymer solution, Pa·s; T represents the current temperature of the polymer solution, K.

3.3.2. Solution Methodology

The non-steady-state temperature–pressure–viscosity coupling model for polymer wellbore flooding not only requires dual iterative solutions for temperature and pressure, but also demands precise calculations of continuity equations, momentum equations, and energy conservation equations. In the model, the fluid inside the casing conducts longitudinal heat transfer along the direction of the formation, while also experiencing convective heat transfer with the casing wall in the radial direction. Therefore, the temperature at a certain node is interrelated with the temperature of its adjacent nodes. Moreover, the viscosity of the polymer fluid constantly changes with the variations in temperature and pressure, which further increases the complexity of the numerical iterative calculations.
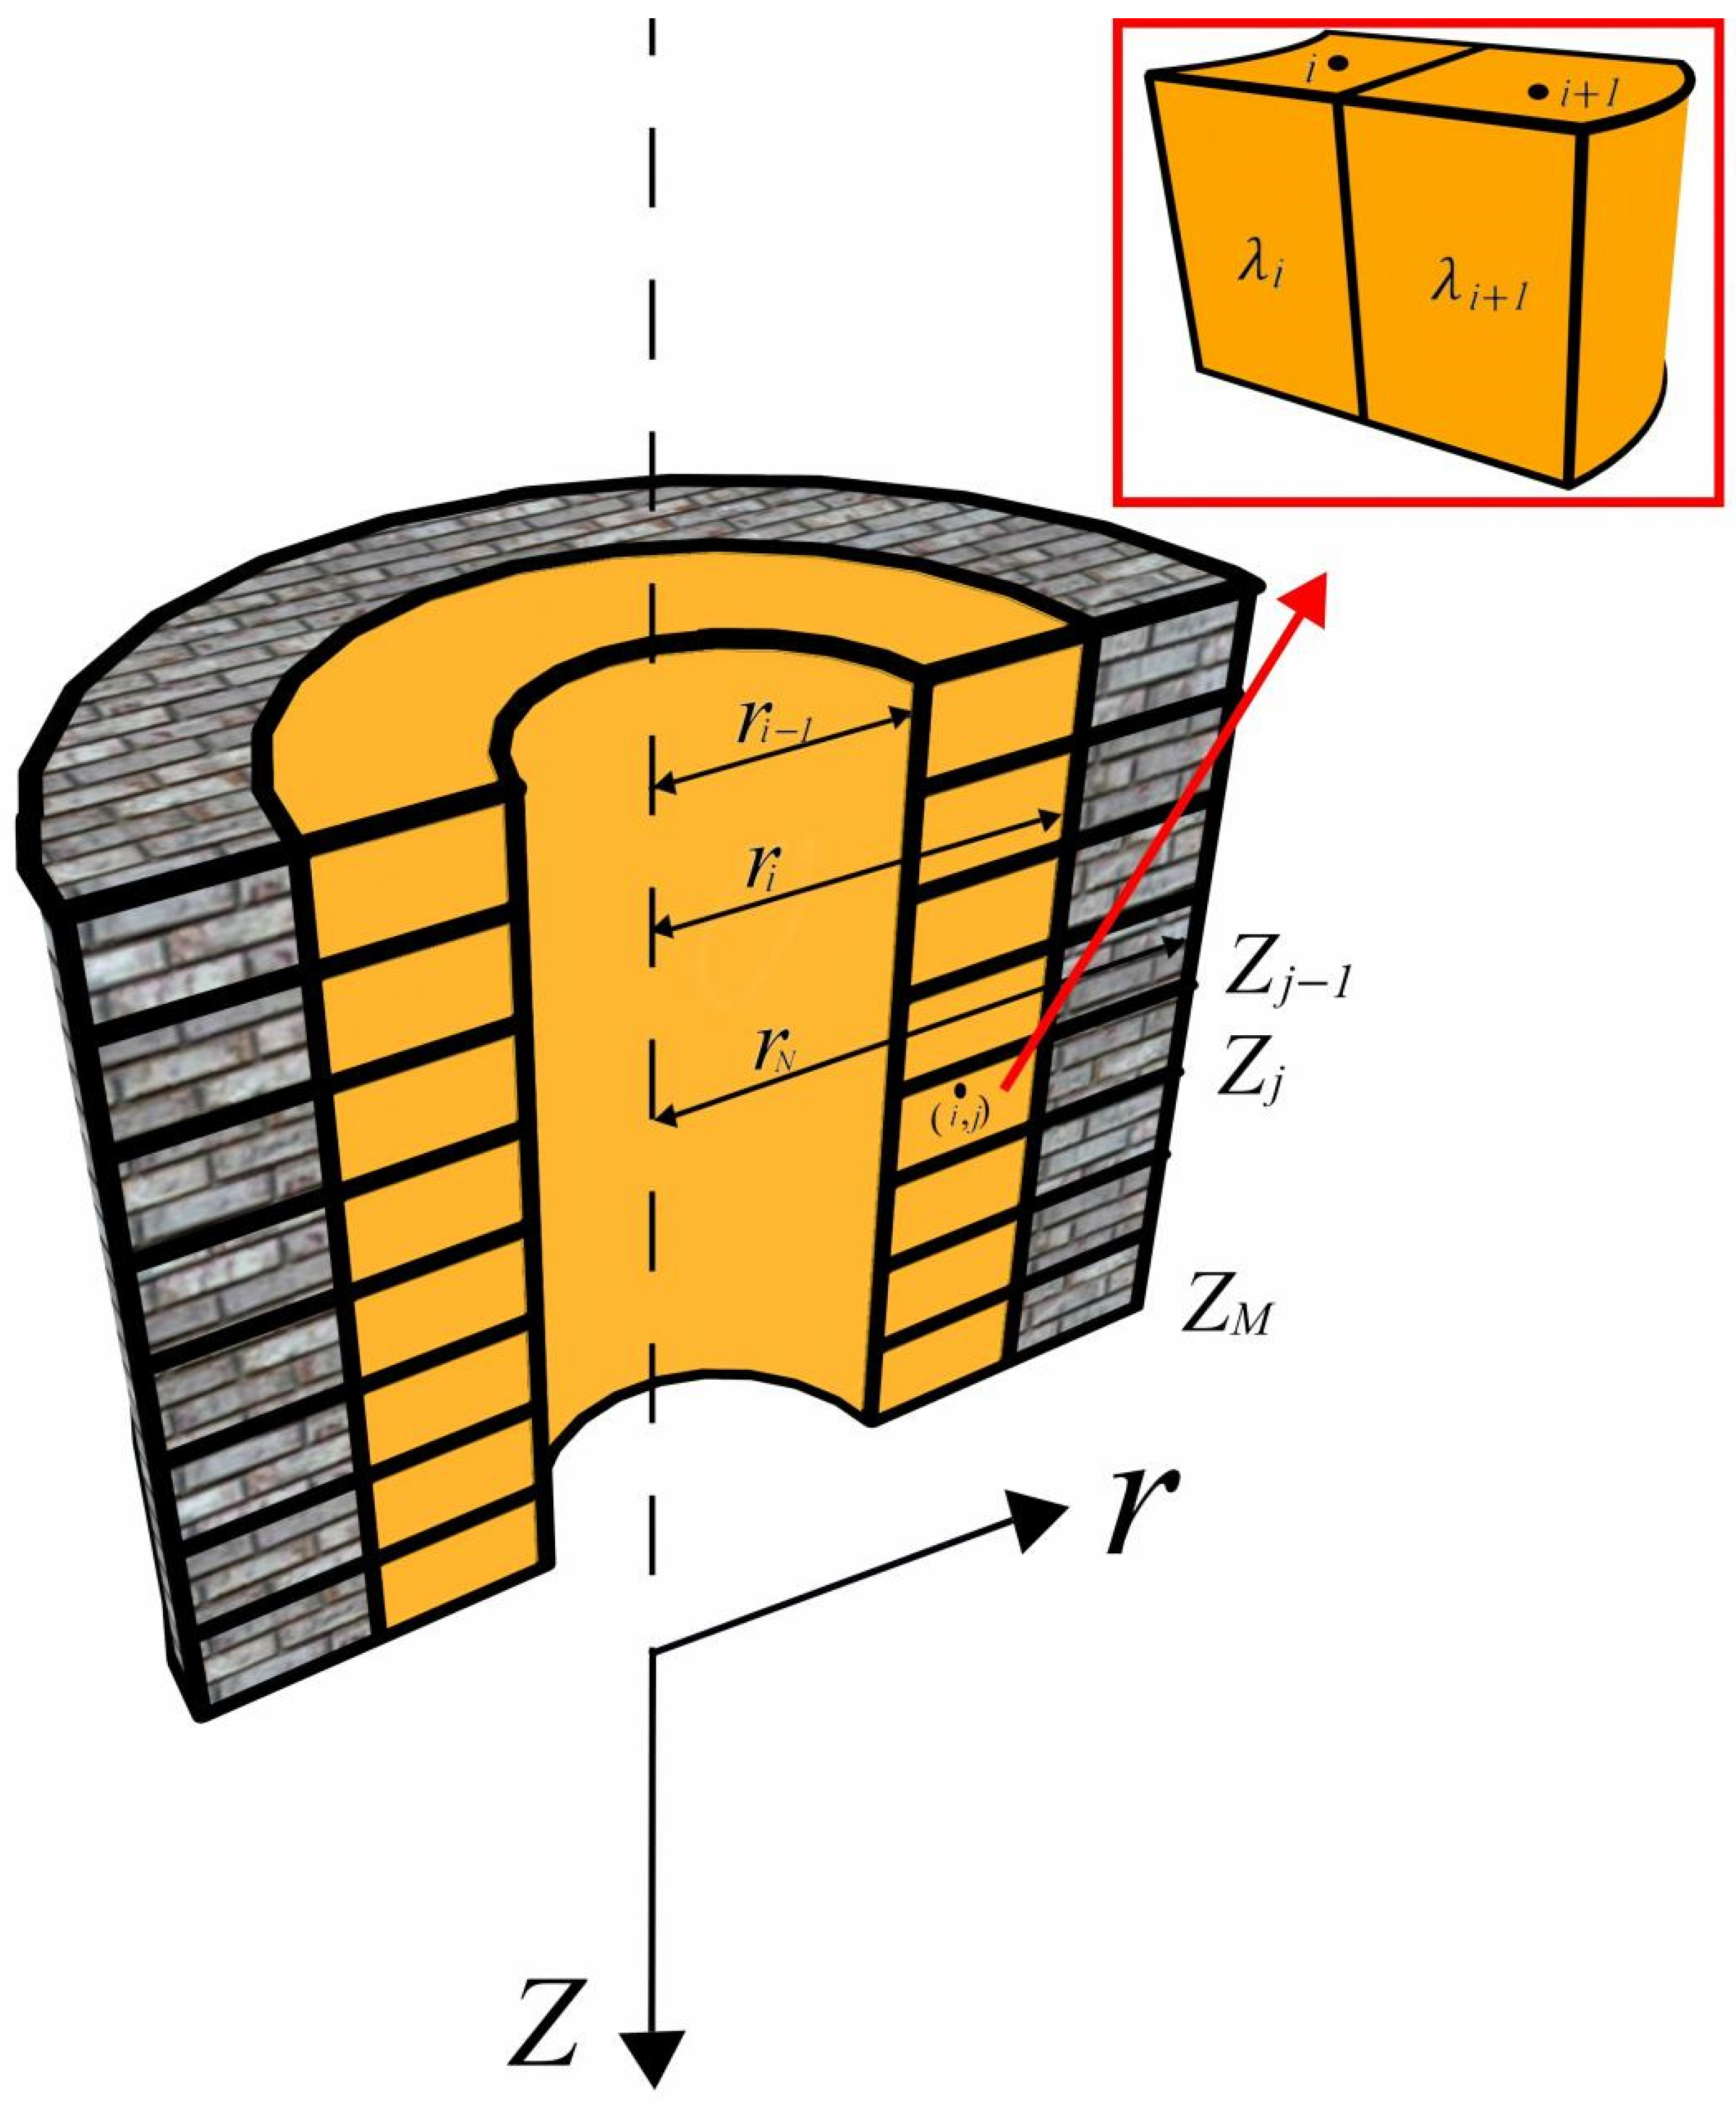
Due to the strong nonlinear coupling among temperature, pressure, and viscosity, the governing equations cannot be solved analytically. Therefore, a fully implicit finite difference scheme combined with the Thomas algorithm was employed to obtain numerical solutions. The mesh division of the model is shown in Figure 3. Here, the temperature and pressure are distributed at the center of the element nodes, while the velocity is distributed at the upper and lower interfaces of the element nodes. The spatial terms are discretized using the central difference method, and the time terms are discretized using the forward difference method. After discretization, the problem can be transformed into a set of tridiagonal equations along different directions. The “chasing method” [39] (Thomas algorithm) is employed to iteratively solve the alternately directionally discretized equations within two time steps, thereby obtaining the temperature distribution of the wellbore and the surrounding formation. Due to the coupling of the fluid’s temperature, pressure, viscosity, and velocity, the calculation for each time step uses the result of the previous time step as the initial condition. To ensure convergence, the time step was set to 1 min, and the relative convergence error of velocity and viscosity was controlled within 0.0001.
In this study, the physical model is assumed to be axisymmetric with respect to the central axis of the casing. Vertically, the wellbore is evenly divided into M elements, each with a length of Z. Radially, a non-uniform grid is adopted, consisting of N elements with radii ri (i = 1, 2, …, N). Here, i = 1 represents the inner wall of the casing, i = 2 the outer wall of the casing, i = 3 the outer wall of the cement sheath, and i ≧ 4 the formation. The radial discretization satisfies ri = kri−1, where k is the geometric ratio constant.

3.3.3. Computational Solution Procedure

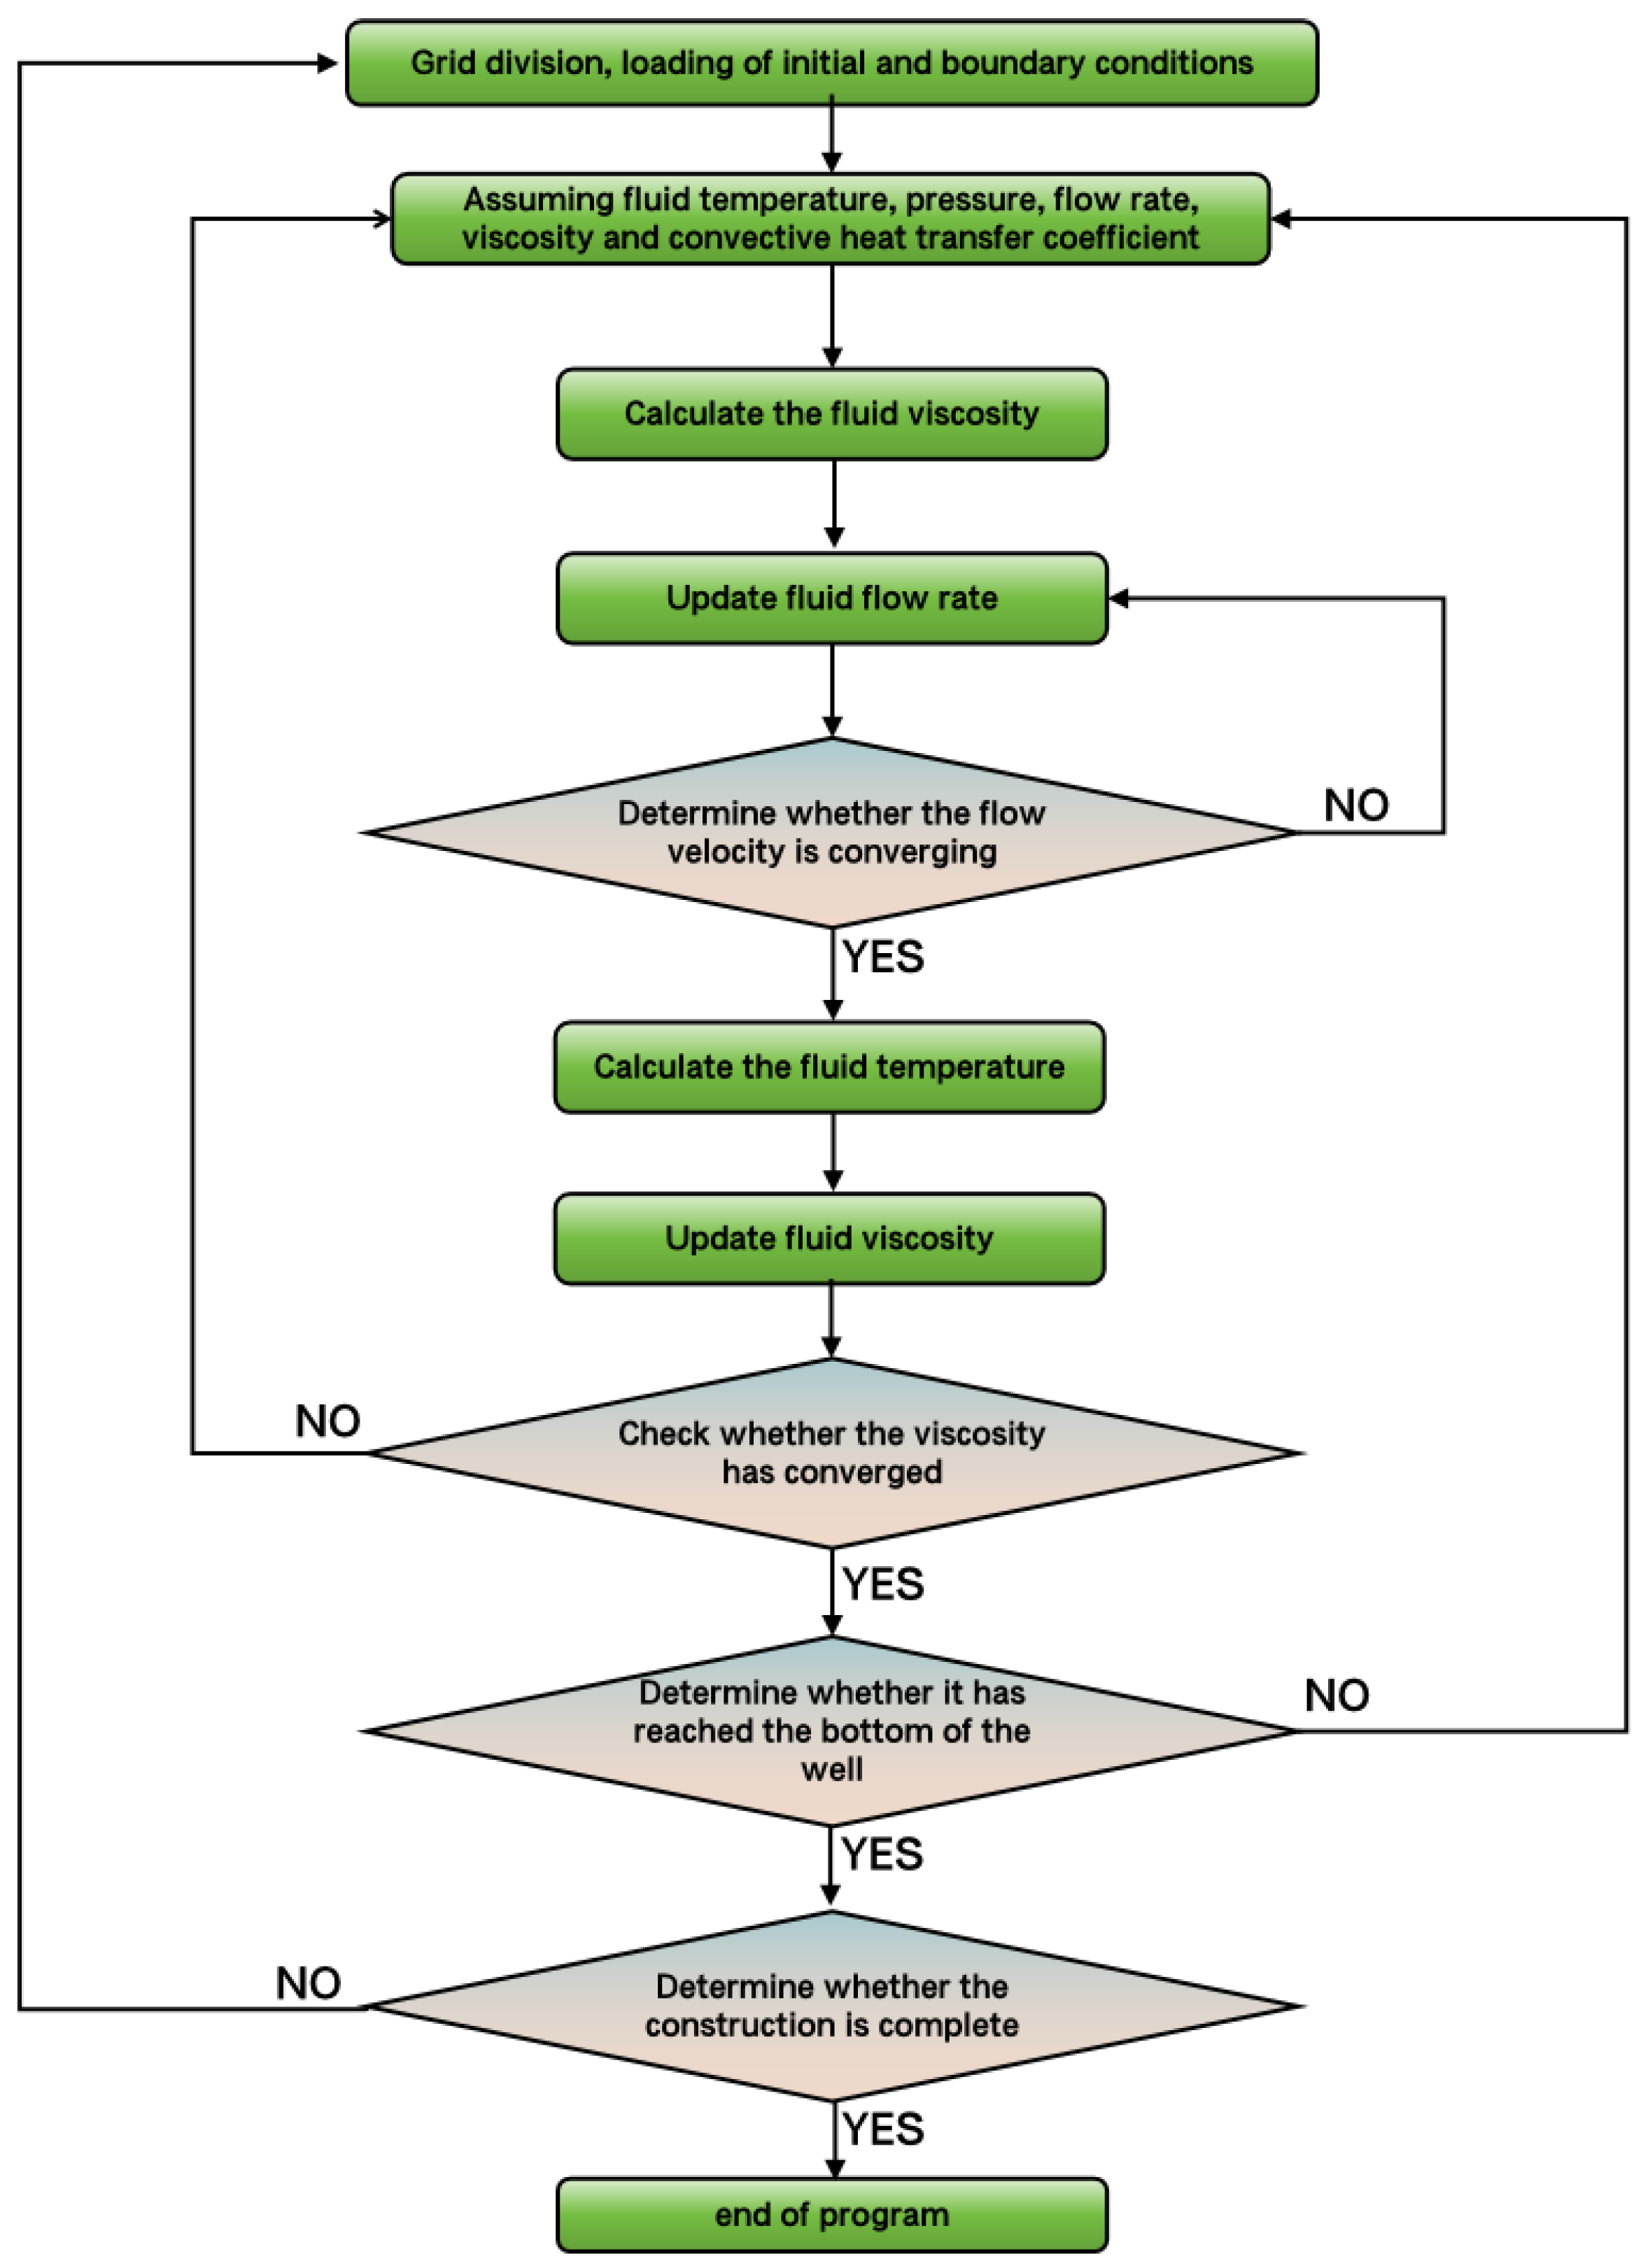
This paper uses a numerical algorithm that combines viscosity and flow rate iterations to solve the established unsteady coupled model. That is, the pressure is determined by iterating the flow rate, and the initial value of the assumed value is determined by iterating the viscosity. The model calculation process is shown in Figure 4. First, based on the division of the regional discrete grid, the corresponding boundary conditions and initial conditions are loaded; then, the coupling calculation is carried out, starting from the wellhead until the bottom of the well is reached. The calculation results of the above process are used as the initial conditions for the next time step, and the steps of the previous time step are repeated until the construction is completed.

4. Analysis of Model Results

4.1. Case Study

At present, the available data on polymer flooding injection wellbores is relatively scarce. Therefore, based on the operational conditions of the polymer–surfactant binary flooding block in Well 16 of the Jingcai Production Plant, Liaohe Oilfield, this study considers the polymer solution to be water-soluble polyacrylamide and specifies the relevant basic wellbore parameters, as summarized in Table 1. On this basis, numerical simulation is carried out using the method of fluid injection through the casing to analyze the changes in the temperature and pressure fields within the wellbore during the polymer flooding process, and to explore its impact on the fluid viscosity.
As shown in Figure 5, the temperature of the polymer solution gradually increases with the increase in depth. This is because the initial injection temperature of the polymer solution is higher than the constant temperature of the formation (25 °C). In the upper part of the wellbore, the solution undergoes heat exchange with the surface and the surrounding rock, transferring heat outward. Due to the sufficient time and space for heat exchange, the heat is fully released, resulting in a decrease in temperature in the shallow area. As the depth increases further, the geothermal temperature gradually rises and exceeds the temperature of the polymer solution, causing the temperature of the solution to slowly rise again. The trend of the viscosity change in the polymer solution is opposite to the temperature distribution. As the well depth increases, the viscosity of the solution first increases and then decreases, presenting a clear nonlinear characteristic. According to the sampling results from the polymer–surfactant binary flooding block in Well 16 of the Jingcai Production Plant, Liaohe Oilfield, at a depth of 1000 m, the measured viscosity of the polymer solution is 102.12 mPa·s, while the numerical simulation result is 107.46 mPa·s, with a relative error of 4.97%. This deviation mainly stems from the non-uniform distribution within the solution, making it difficult for the measured sample to accurately reflect the average viscosity level in the wellbore.

4.2. Effect of Injection Temperature on Polymer Flooding Wellbore

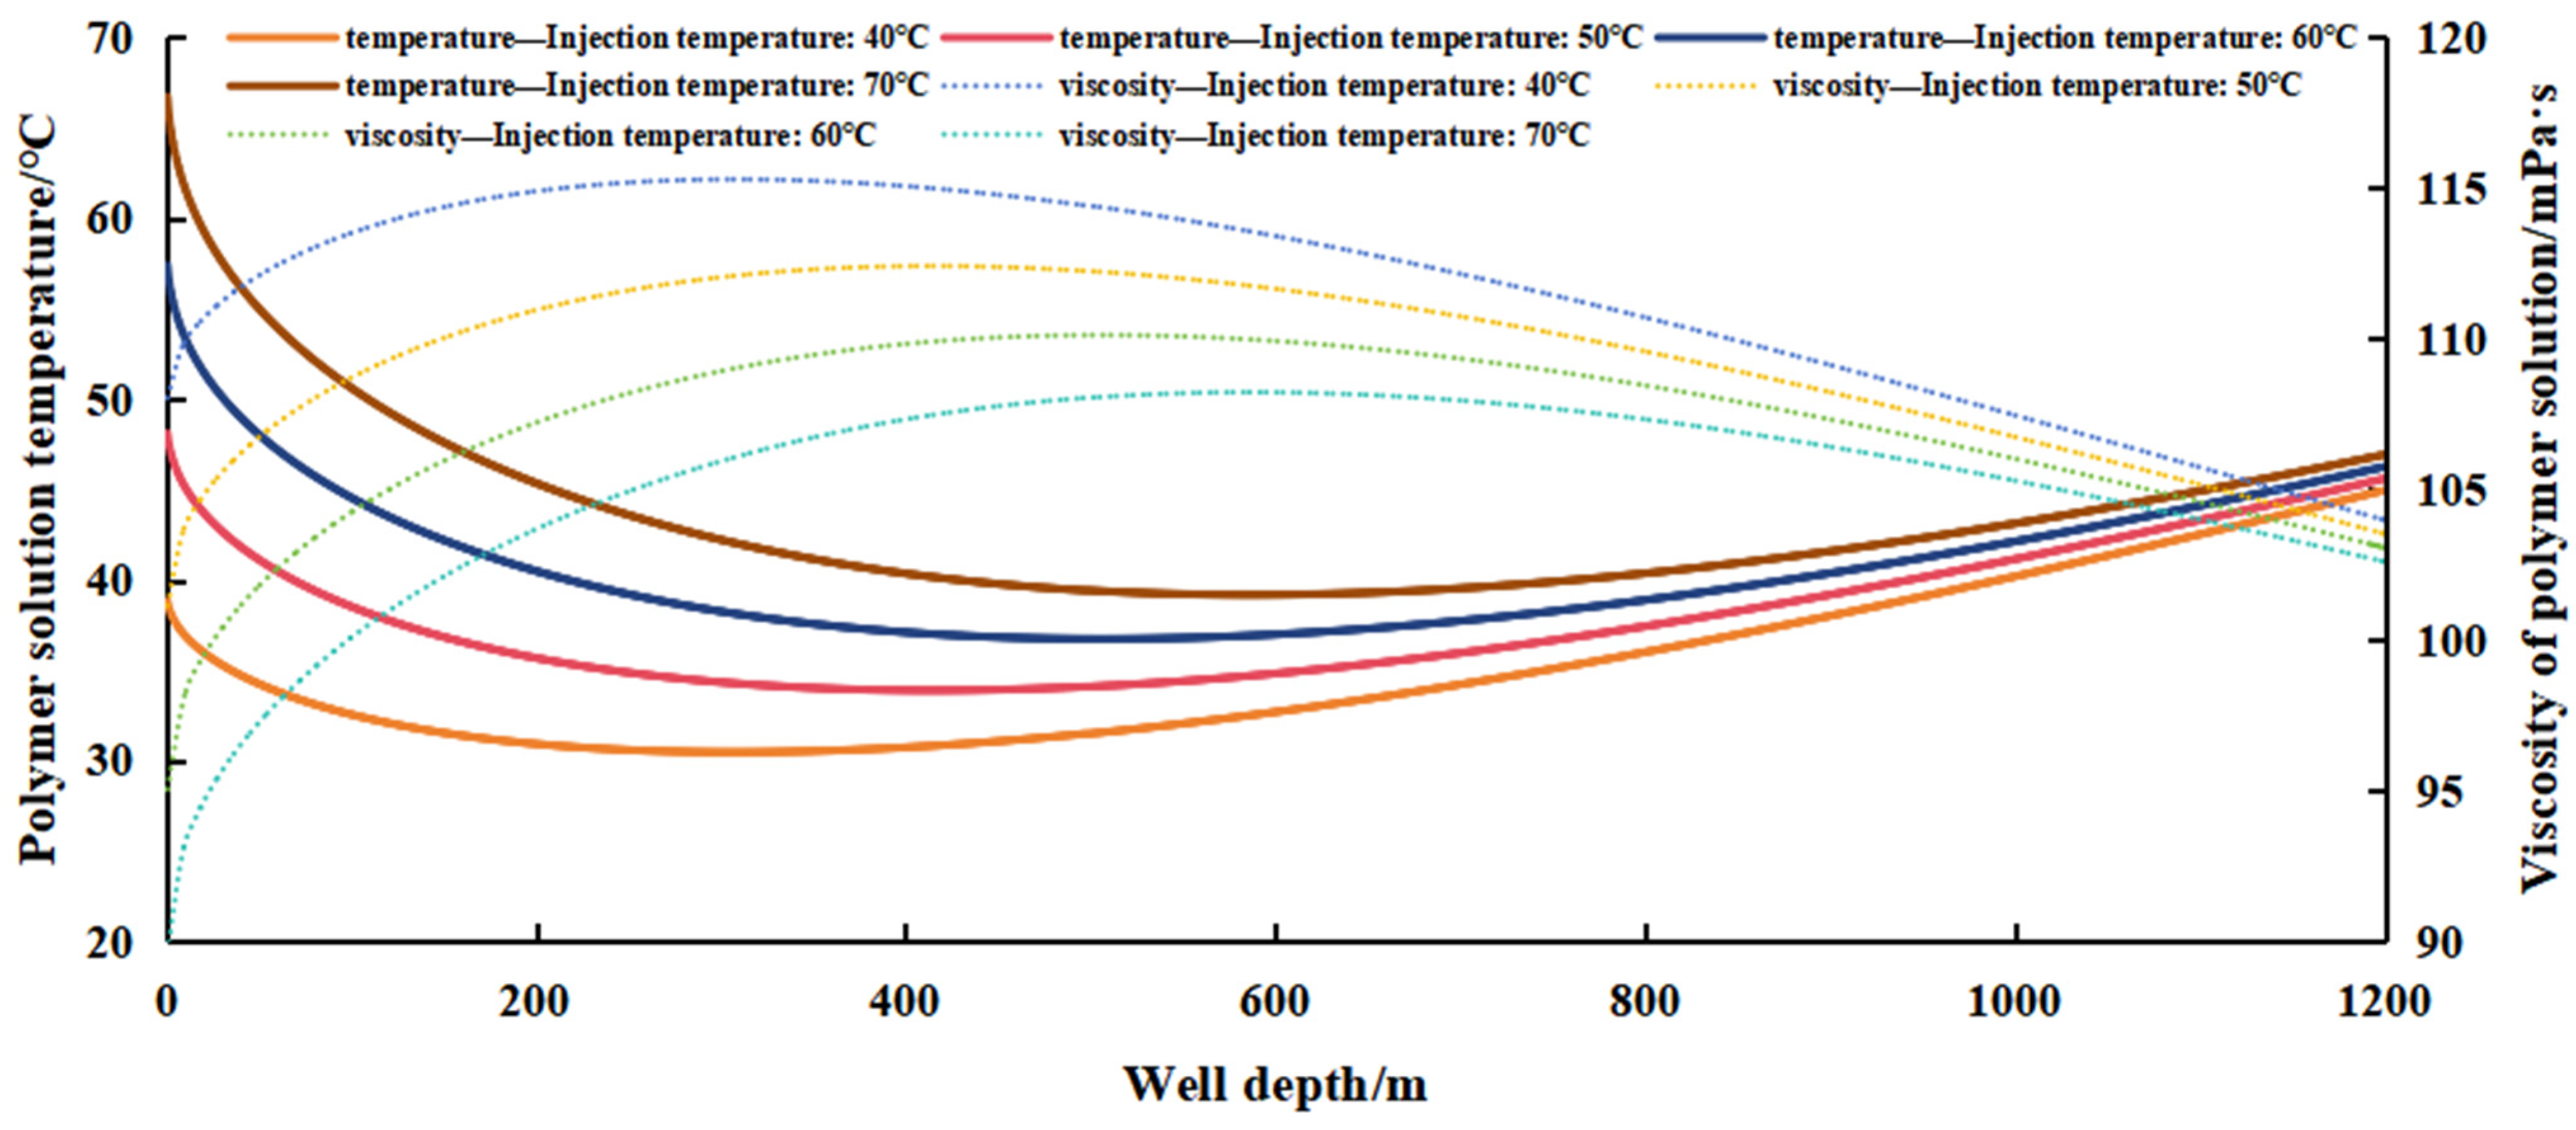
Set the injection duration to 240 min, and the injection temperatures are 40 °C, 50 °C, 60 °C, and 70 °C. As can be seen from Figure 6’s comparison, the injection temperature has a significant impact on the temperature field and viscosity distribution of the wellbore fluid. As the depth increases, this influence gradually weakens. This trend is consistent with the conclusion obtained by Zhen Yang in the CO2 injection model [40]. The higher the injection temperature, the overall upward shift in the wellbore temperature curve, while the viscosity curve shifts overall downward. However, in the deep part of the wellbore, the temperature and viscosity curves under different injection temperatures gradually tend to be consistent, indicating that the geothermal gradient plays a dominant role in the deep part. Specifically, the viscosity of the polymer solution first increases in the temperature range where the depth decreases; when the deep temperature rises, the viscosity decreases accordingly, presenting a “first increase then decrease” trend. This law reveals the coupling relationship between temperature and viscosity, indicating that temperature changes are the main controlling factor affecting the viscosity distribution of the polymer solution during the wellbore flow process.

4.3. Effect of Injection Pressure on Polymer Flooding Wellbore

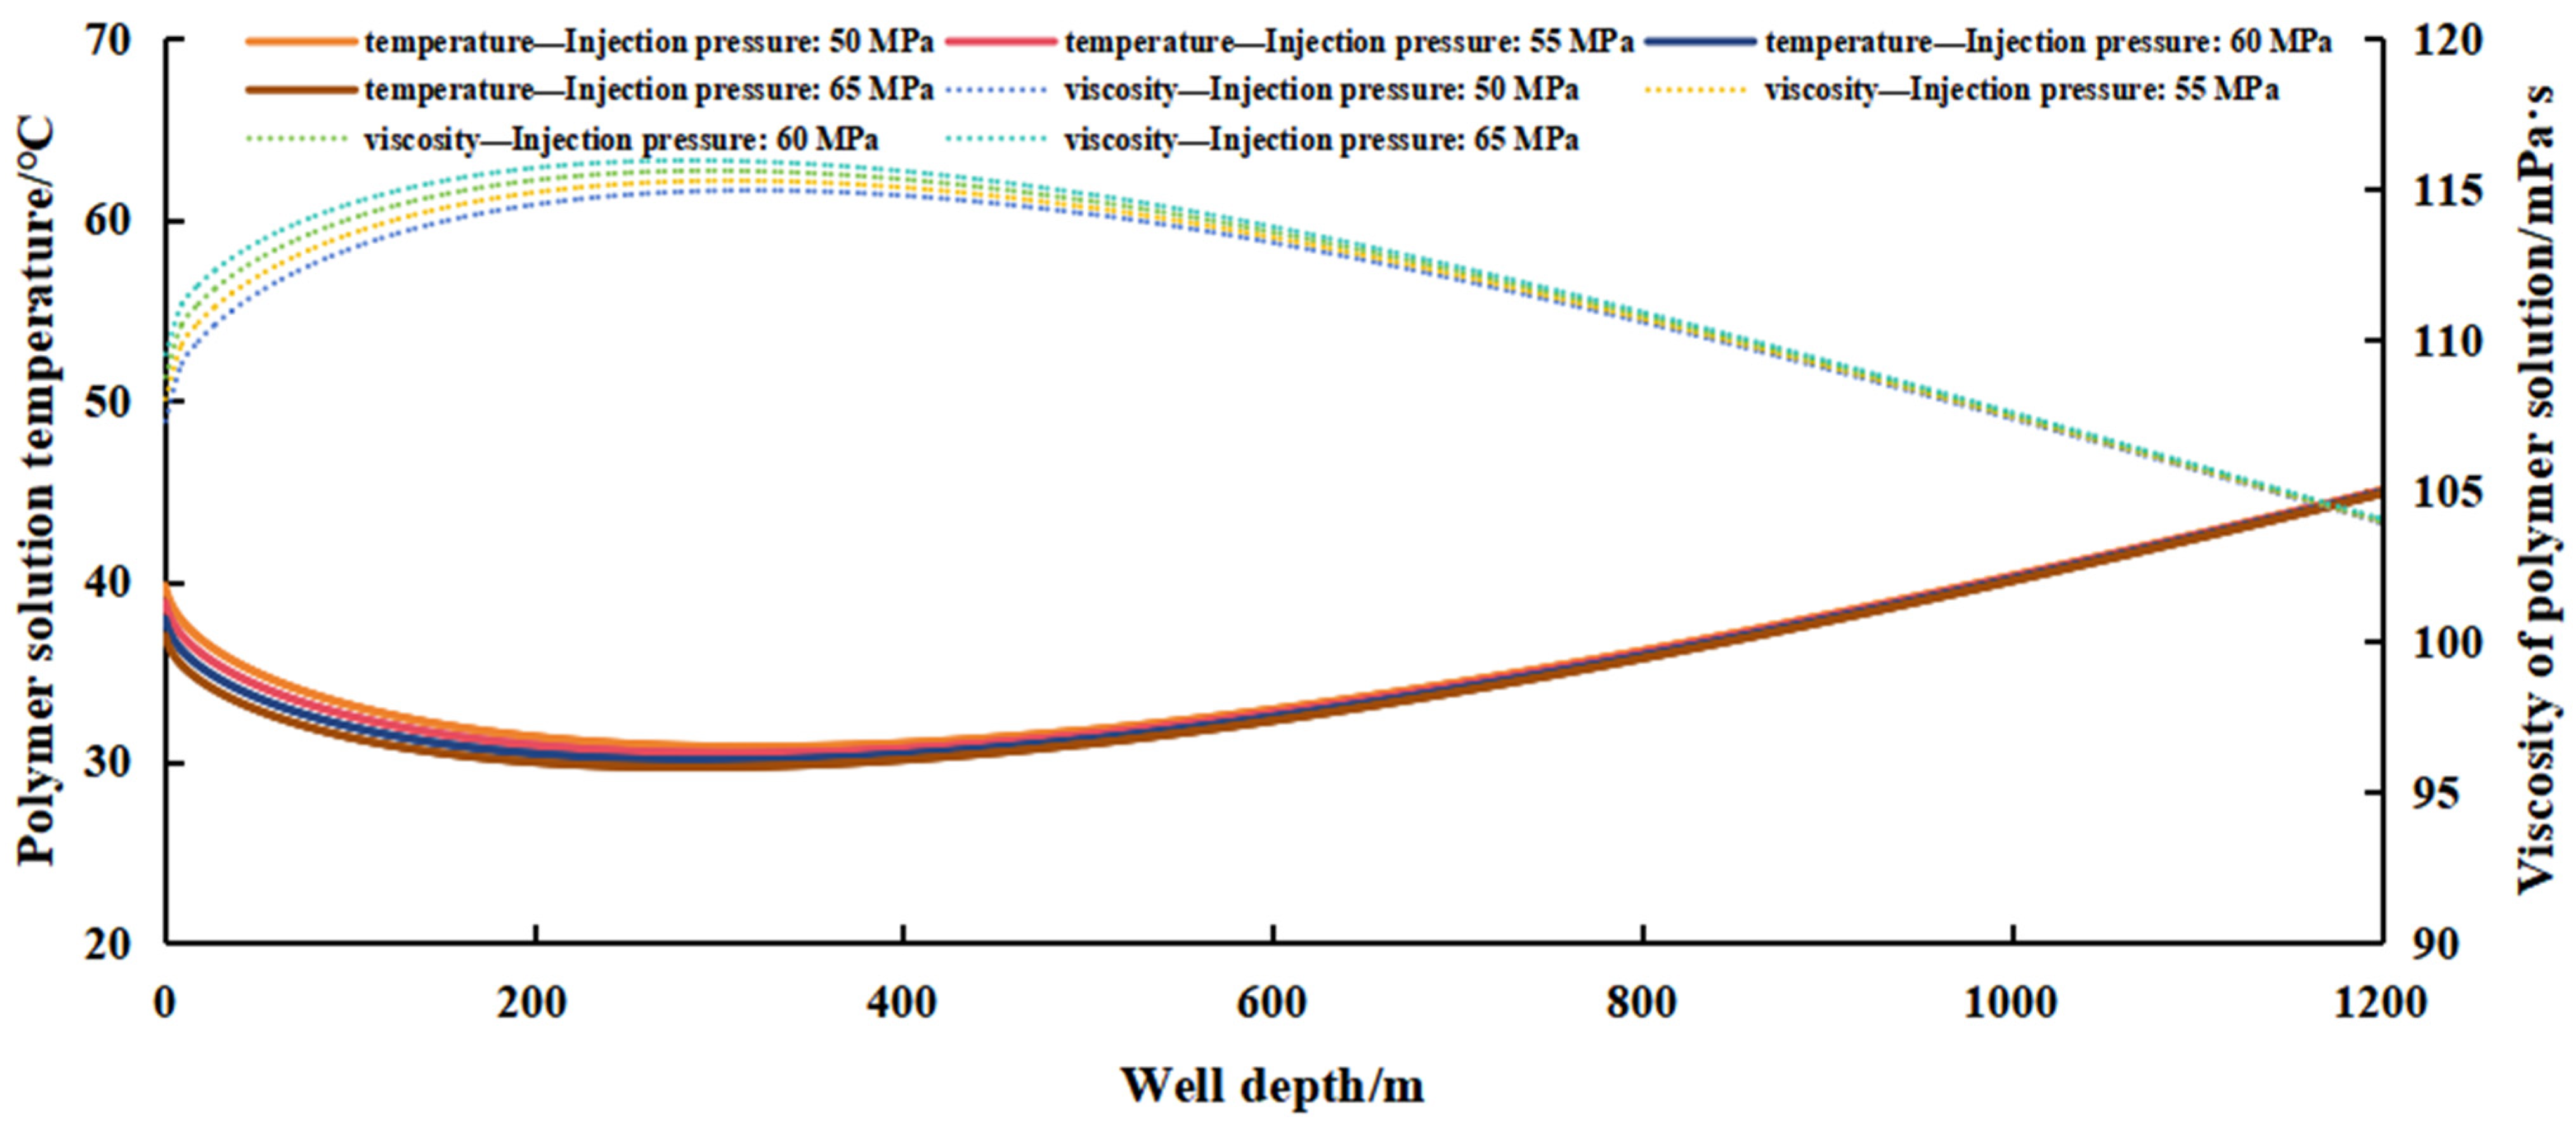
In the simulation, the injection pressures were set at 50 MPa, 55 MPa, 60 MPa, and 65 MPa, respectively. As shown in Figure 7, the increase in injection pressure had relatively limited effects on the wellbore temperature and fluid viscosity. This is mainly because the higher injection pressure accelerated the flow rate of the polymer solution, thereby reducing the heat exchange with the surrounding environment, resulting in a smaller temperature change. At the same time, the injection pressure itself had a limited effect on the increase in viscosity, and the slight change in temperature further weakened the influence of pressure on viscosity. Therefore, on the entire wellbore scale, this change was not significant and could be almost ignored. Similar conclusions were also verified in the research of Zhen Yang [40].

4.4. Effect of Injection Rate on Polymer Flooding Wellbore

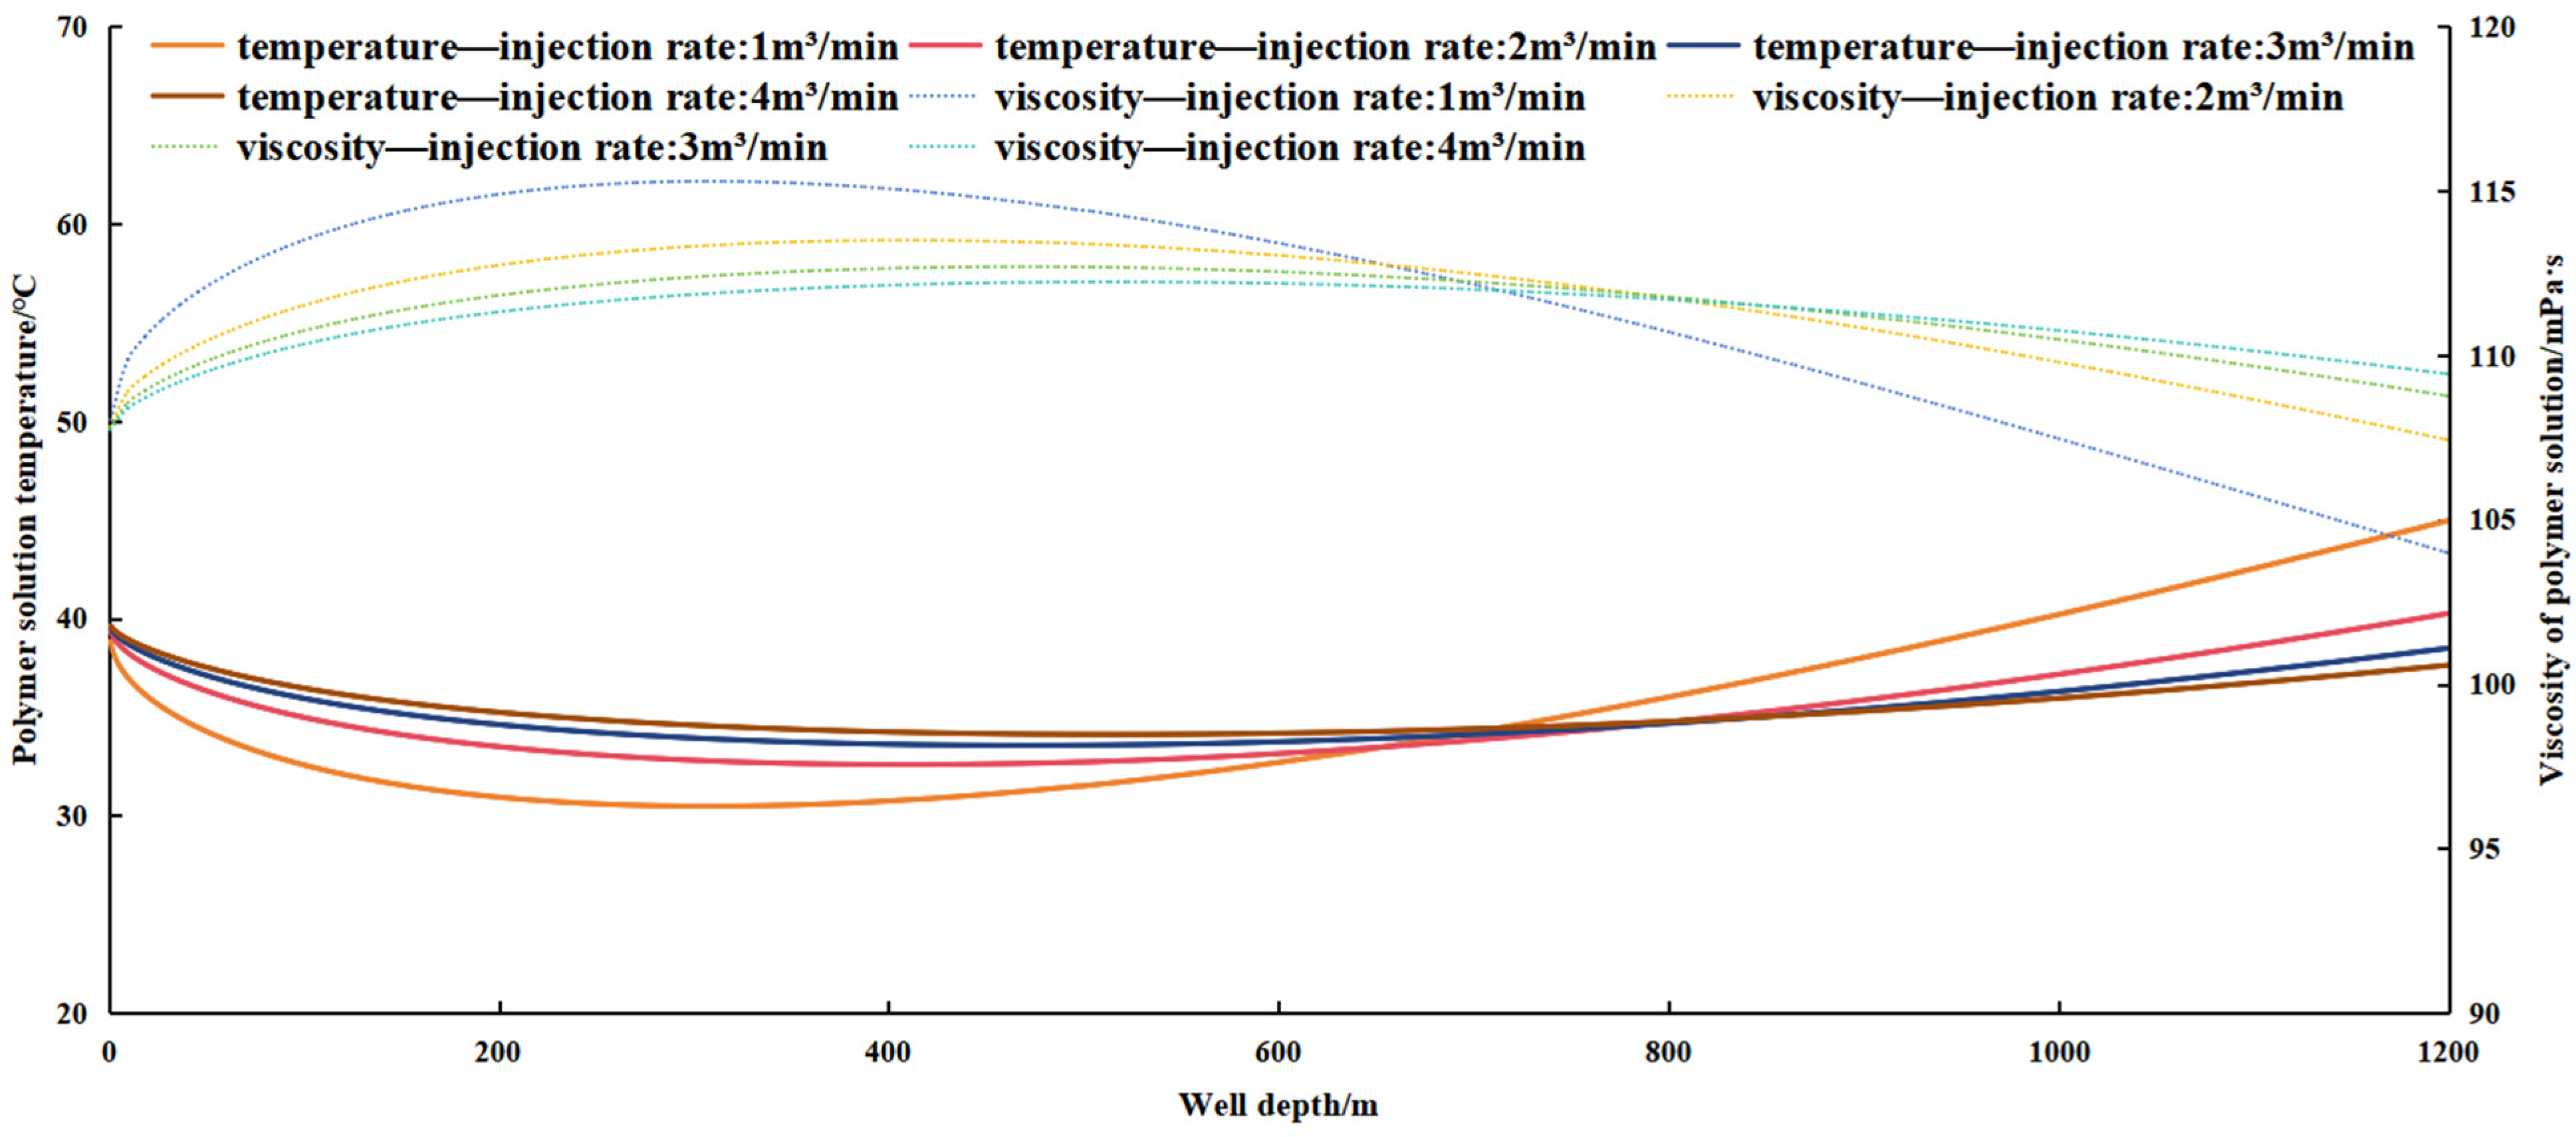
As shown in Figure 8, the injection flow rate of the polymer solution is one of the main factors affecting the temperature field of the wellbore. Under low flow conditions, the fluid stays in the wellbore for a longer time, and there is sufficient heat exchange with the formation. Since the injection temperature (40 °C) is higher than the constant temperature section temperature (25 °C), the fluid cools rapidly in the shallow layer, and the temperature drops rapidly, thus reaching the turning point of thermal equilibrium at a relatively shallow depth. Subsequently, the fluid has sufficient time to be heated by geothermal energy in the deep layer, and the temperature significantly rises, with the well bottom temperature approaching the original formation temperature. On the contrary, in high flow conditions, the fluid flow rate is faster, and the residence time is shorter, resulting in insufficient heat exchange, and the cooling process is suppressed, causing the temperature to drop slowly, leading to the thermal equilibrium turning point appearing at a deeper depth. At the same time, the heating time of the deep fluid is shorter, causing the well bottom temperature to be lower than the formation temperature, and the overall temperature curve shows a lower and more gradual trend.
Since the temperature of the polymer solution has a dominant influence on its viscosity, under low flow conditions, the viscosity of the polymer solution shows a significant “first increasing then decreasing” trend. In contrast, under high flow conditions, the change in viscosity is smaller, but it still exhibits the “first increasing then decreasing” characteristic. This indicates that the residence time of the fluid and the intensity of heat exchange play important roles in regulating the viscosity distribution.

4.5. Effect of Injection Duration on Polymer Flooding Wellbore

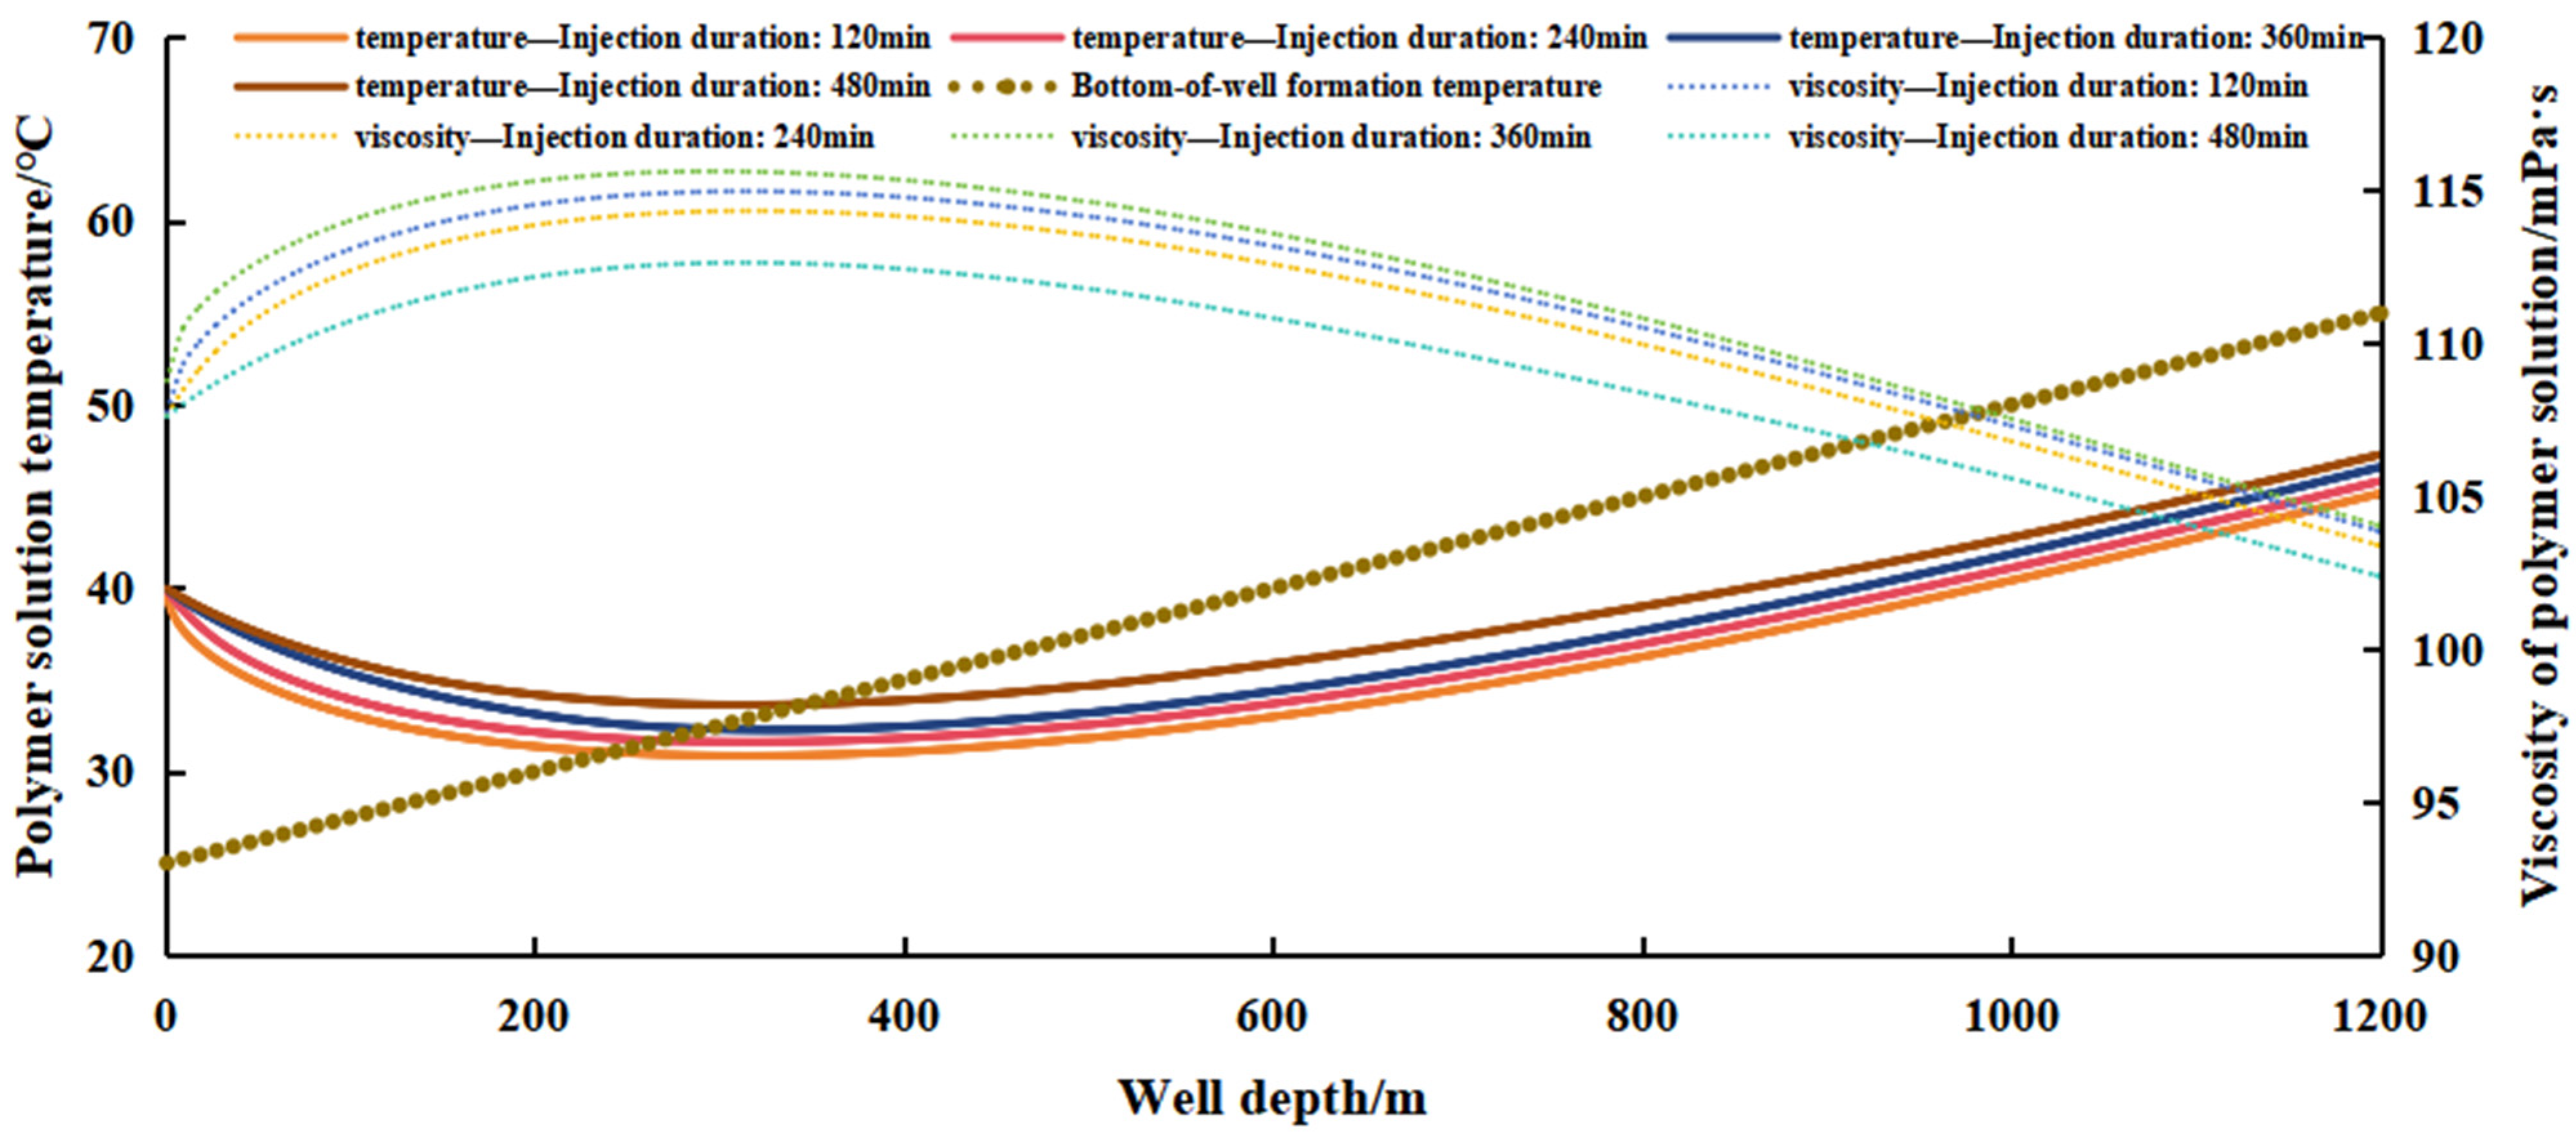
During the entire construction period, the polymer solution was continuously injected into the wellhead. As shown in Figure 9, in the initial stage of injection, the temperature of the polymer solution in the front section of the wellbore dropped rapidly. This phenomenon was driven by the combined effect of the initial maximum temperature difference and vertical heat conduction. As the injection time extended, the simulation results indicated that the temperature curve of the fluid in the wellbore shifted upward overall, while the temperature curve of the front section tended to become more stable, and the cooling rate significantly slowed down. This indicates that prolonged injection gradually led to a dynamic balance in the heat exchange between the wellbore and the formation. In the front section, the heat lost by the fluid was nearly balanced with the heat gained from the deep formation, resulting in a decrease in the temperature change rate and an overall increase in temperature. At the same time, the viscosity of the polymer solution in the wellbore decreased overall over time during the construction process, posing certain challenges to its sand-carrying capacity.

5. Conclusions

This paper constructs a non-steady-state coupled model of temperature–pressure–vviscosity for polymer wellbore flooding, and uses the staggered-grid fully implicit discretization method combined with Matlab for numerical iterative solution. Through this model, the influence laws of injection temperature, injection pressure, injection flow rate, and construction duration on the temperature and viscosity distribution in the wellbore are systematically analyzed. The research results show that the measured viscosity of the polymer solution at 1000 m in the wellbore is 102.12 mPa·s, and the simulation value is 107.46 mPa·s, with an error of approximately 4.97%. The difference mainly stems from the uneven distribution of the fluid within the system. Injection temperature has the most significant impact on the temperature field in the wellbore and the viscosity distribution of the polymer solution. It determines the shallow temperature drop amplitude and the deep temperature rise trend. In contrast, injection pressure has a limited effect on temperature and viscosity, and can be approximated to be ignored in the calculation. Injection flow rate directly affects the heat exchange between the polymer solution and the formation, thereby controlling the turning point position of the temperature curve and the bottom-hole temperature level. The extension of the construction time causes the temperature field in the wellbore to shift upward as a whole and gradually reach dynamic equilibrium, while the viscosity of the polymer solution decreases overall over time, which poses certain challenges to its sand-carrying performance.
In conclusion, temperature is the primary controlling factor determining the viscosity distribution of polymer solutions. The injection flow rate and the duration of the operation jointly regulate the thermodynamic process in the wellbore, while the influence of injection pressure is relatively small. The conclusions drawn from this study can provide a reference for optimizing the parameters of polymer flooding operations in the field, and lay a theoretical foundation for further research on the coupling mechanism of heat, flow, and mechanics in the wellbore of polymer flooding wells.

Author Contributions

Conceptualization, Y.H.; Methodology, Y.H.; Software, Y.H.; Validation, J.F.; Formal analysis, F.L.; Investigation, X.Z. (Xinlei Zhang); Resources, X.Z. (Xuesong Zhang); Data curation, J.F. and X.Z. (Xinlei Zhang); Writing—original draft, Y.H.; Writing—review & editing, M.H.; Visualization, J.F. and F.L.; Supervision, M.H.; Project administration, X.Z. (Xuesong Zhang); Funding acquisition, M.H. All authors have read and agreed to the published version of the manuscript.

Funding

This research received no external funding.

Data Availability Statement

The data that support the findings of this study are available from the corresponding author upon reasonable request.

Conflicts of Interest

The authors declare no conflict of interest.

References

  1. Zhang, Y.; Feng, Y.; Li, B.; Han, P. Enhancing oil recovery from low-permeability reservoirs with a self-adaptive polymer: A proof-of-concept study. Fuel 2019, 251, 136–146. [Google Scholar] [CrossRef]
  2. Mishra, S.; Bera, A.; Mandal, A. Effect of polymer adsorption on permeability reduction in enhanced oil recovery. J. Pet. Eng. 2014, 2014, 395857. [Google Scholar] [CrossRef]
  3. Chen, X.; Li, Y.; Sun, X.; Liu, Z.; Liu, J.; Liu, S. Investigation of polymer-assisted CO2 flooding to enhance oil recovery in low-permeability reservoirs. Polymers 2023, 15, 3886. [Google Scholar] [CrossRef]
  4. Zhang, X.; Li, B.; Pan, F.; Su, X.; Feng, Y. Enhancing oil recovery from low-permeability reservoirs with a thermoviscosifying water-soluble polymer. Molecules 2021, 26, 7468. [Google Scholar] [CrossRef]
  5. Yang, Y.; Wang, Y.; Liu, Y.; Liu, P. Enhancing oil recovery in low-permeability reservoirs using a low-molecular-weight amphiphilic polymer. Polymers 2024, 16, 1036. [Google Scholar] [CrossRef]
  6. Song, H.; Ghosh, P.; Bowers, A.; Niu, F.; Mohanty, K. Low-salinity polymer flood for enhanced oil recovery in low-permeability carbonates. SPE J. 2024, 29, 443–454. [Google Scholar] [CrossRef]
  7. Lu, G.; Bao, C.; Xie, K.; Cao, W.; Liu, Y.; Zhang, Y.; Wang, X.; Zhang, J. Enhanced oil recovery mechanisms of polymer flooding in a heterogeneous oil reservoir. Pet. Explor. Dev. 2021, 48, 169–178. [Google Scholar] [CrossRef]
  8. Zhang, X.; Fan, Z.; Cai, L.; Fu, Y.; Liu, J.; Liu, Q.; Tong, Q.; Qiao, S.; Sun, A. Polyacrylamide structural instability and degradation induced by nanobubbles: A molecular simulation study. Phys. Fluids 2025, 37, 026601. [Google Scholar] [CrossRef]
  9. Juárez, J.L.; Bertin, H.; Omari, A.; Romero, C.; Bourdarot, G.; Jouenne, S.; Morel, D.; Neillo, V. Polymer Injection for EOR: Influence of Mobility Ratio and Slug Size on Final Oil Recovery. In SPE Europec Featured at EAGE Conference and Exhibition; SPE: London, UK, 2020; pp. 1–9. [Google Scholar] [CrossRef]
  10. Firozjaii, A.M.; Saghafi, H.R. Review on chemical enhanced oil recovery using polymer flooding: Fundamentals, experimental and numerical simulation. Petroleum 2020, 6, 115–122. [Google Scholar] [CrossRef]
  11. Davarpanah, A. Parametric Study of Polymer-Nanoparticles-Assisted Injectivity Performance for Axisymmetric Two-Phase Flow in EOR Processes. Nanomaterials 2020, 10, 1818. [Google Scholar] [CrossRef] [PubMed]
  12. Aitkulov, A.; Mohanty, K.K. Investigation of alkaline-surfactant-polymer flooding in a quarter five-spot sandpack for viscous oil recovery. J. Pet. Sci. Eng. 2019, 175, 706–718. [Google Scholar] [CrossRef]
  13. Tie, L.; Yu, M.; Li, X.; Liu, W.; Zhang, B.; Chang, Z.; Zheng, Y. Research on polymer solution rheology in polymer flooding for Qikou reservoirs in a Bohai Bay oilfield. J. Pet. Explor. Prod. Technol. 2019, 9, 703–715. [Google Scholar] [CrossRef]
  14. Yang, L.; Li, B.; Chen, X.; Yu, L.; Jing, F.-M.; Zhang, D. Experimental and numerical study of the rheological characteristics and flow law of water-based drilling fluids in high-temperature and high-pressure wellbores. J. Hydrodyn. 2024, 36, 954–967. [Google Scholar] [CrossRef]
  15. Ramirez, A. Numerical Investigation of Polymer Injection Effects on Geomechanical Reservoir Properties During Enhanced Oil Recovery. 2017. Available online: https://hdl.handle.net/11124/172043 (accessed on 1 November 2025).
  16. Magzoub, M.I.; Salehi, S.; Hussein, I.A.; Nasser, M.S. Loss circulation in drilling and well construction: The significance of applications of crosslinked polymers in wellbore strengthening: A review. J. Pet. Sci. Eng. 2020, 185, 106653. [Google Scholar] [CrossRef]
  17. Wang, Y.; Yang, S.L.; Xie, H.; Jiang, Y.; Cheng, S.Q.; Zhang, J. Dynamic characterization of viscoelasticity during polymer flooding: A two-phase numerical well test model and field study. Pet. Sci. 2025, 22, 2493–2501. [Google Scholar] [CrossRef]
  18. Sandiford, B.B. Laboratory and field studies of water floods using polymer solutions to increase oil recoveries. J. Pet. Technol. 1964, 16, 917–922. [Google Scholar] [CrossRef]
  19. Smith, J.E. Closing the lab-field gap: A look at near-wellbore flow regimes and performance of 57 field projects. In Proceedings of the SPE Improved Oil Recovery Conference, Tulsa, OK, USA, 17–19 April 1994; Society of Petroleum Engineers: Richardson, TX, USA, 1994. SPE-27774-MS. [Google Scholar] [CrossRef]
  20. Muruaga, E.; Flores, M.; Norman, C.; Romero, J.L. Combining bulk gels and colloidal dispersion gels for improved volumetric sweep efficiency in a mature waterflood. In Proceedings of the SPE Improved Oil Recovery Conference, Tulsa, OK, USA, 24–28 April 2008; Society of Petroleum Engineers: Richardson, TX, USA, 2008. SPE-113334-MS. [Google Scholar] [CrossRef]
  21. Dobrynin, A.V.; Sayko, R.; Colby, R.H. Viscosity of polymer solutions and molecular weight characterization. ACS Macro Lett. 2023, 12, 773–779. [Google Scholar] [CrossRef] [PubMed]
  22. Pearson, J.R.A.; Tardy, P.M.J. Models for flow of non-Newtonian and complex fluids through porous media. J. Non-Newton. Fluid Mech. 2002, 102, 447–473. [Google Scholar] [CrossRef]
  23. Sun, G.; Li, D.; Zhang, D.; Xu, T.H. Study on improving viscosity of polymer solution based on complex reaction. IOP Conf. Ser. Mater. Sci. Eng. 2018, 369, 012045. [Google Scholar] [CrossRef]
  24. Yang, Y.; Shu, Z.; Ye, Z.; Wang, X.; Wang, Z.; Liang, S. An improved study of near-well zone flooding for polymer solution through the mechanical shearing and Forchheimer flow simulation. Mater. Today Commun. 2024, 38, 107634. [Google Scholar] [CrossRef]
  25. Yang, W.; Yu, H.; Fan, N. Transient pressure analysis of polymer flooding fractured wells with oil-water two-phase flow. Pet. Explor. Dev. 2023, 50, 175–182. [Google Scholar] [CrossRef]
  26. Konyukhov, V.M.; Konyukhov, I.V.; Chekalin, A.N. Numerical modeling and parallel computations of heat and mass transfer during polymer flooding of non-uniform oil reservoir developing by system of producing and injecting wells. In Proceedings of the Journal of Physics: Conference Series, Moscow, Russia, 15–17 October 2019; IOP Publishing: Bristol, UK, 2019; Volume 1158, p. 032018. [Google Scholar] [CrossRef]
  27. Peng, L.; Han, G.; Chen, Z.; Pagou, A.L.; Zhu, L.; Abdoulaye, A.M. Dynamically coupled reservoir and wellbore simulation research in two-phase flow systems: A critical review. Processes 2022, 10, 1778. [Google Scholar] [CrossRef]
  28. Guo, J.; Zeng, J. Unsteady-state temperature-pressure coupling model for fractured wellbores under supercritical carbon dioxide pressure. Chin. J. Pet. 2015, 36, 203–209. [Google Scholar] [CrossRef]
  29. Aarvik, A.; Djuve, S.; Valle, A. Steady state calculations of wellbore and wellhead temperatures. In Proceedings of the BHR International Conference on Multiphase Production Technology, Edinburgh, UK, 23–25 June 2009; BHR Group: Cranfield, UK, 2009. BHR-2009-E1. [Google Scholar]
  30. Hasan, A.R.; Kabir, C.S.; Wang, X. A robust steady-state model for flowing-fluid temperature in complex wells. SPE Prod. Oper. 2009, 24, 269–276. [Google Scholar] [CrossRef]
  31. Abdelhafiz, M.M.; Hegele, L.A., Jr.; Oppelt, J.F. Numerical transient and steady state analytical modeling of the wellbore temperature during drilling fluid circulation. J. Pet. Sci. Eng. 2020, 186, 106775. [Google Scholar] [CrossRef]
  32. Zhang, S.; Fu, J.; Peng, C.; Su, Y.; Zhang, H.; Yang, M. The analysis of transient temperature in the wellbore of a deep shale gas horizontal well. Processes 2024, 12, 1402. [Google Scholar] [CrossRef]
  33. Zhao, X.; Yang, N.; Liang, H.; Wei, M.; Ma, B.; Qiu, D. The Wellbore Temperature and Pressure Behavior during the Flow Testing of Ultra-Deepwater Gas Wells. Fluid. Dyn. Mater. Proc. 2024, 20, 2523–2540. [Google Scholar] [CrossRef]
  34. Tang, L.; Luo, P. The effect of the thermal stress on wellbore stability. In Proceedings of the SPE Oil and Gas India Conference and Exhibition, New Delhi, India, 17–19 February 1998. SPE-39505-MS. [Google Scholar] [CrossRef]
  35. Yu, S.; Du, A.; Ye, C.; Xiang, J.; Chen, Y.; Guo, Y.; Shen, L. Temperature and Pressure Profiles during Prolonged Working Fluid Injection in Wellbores: Mechanisms and Key Influencing Factors. Fluid. Dyn. Mater. Proc. 2025, 21, 1623–1639. [Google Scholar] [CrossRef]
  36. Wei, W.; Wang, M.; Cheng, J.; Hu, Y.; Li, Y.; Zheng, J. Digital twinning of temperature fields for modular multilayer multiphase pipeline structures. Digital Twin. 2025, 4, 2530307. [Google Scholar] [CrossRef]
  37. Chen, N.H. An explicit equation for friction factor in pipe. Ind. Eng. Chem. Fundam. 1979, 18, 296–297. [Google Scholar] [CrossRef]
  38. Huang, W.X. Engineering Fluid Mechanics; Chemical Industry Press: Beijing, China, 2010. (In Chinese) [Google Scholar]
  39. Jia, J.; Sogabe, T.; Li, S. A generalized symbolic Thomas algorithm for the solution of opposite-bordered tridiagonal linear systems. J. Comput. Appl. Math. 2015, 290, 423–432. [Google Scholar] [CrossRef]
  40. Yang, Z.; Yan, W.; Lv, W.; Tang, Q.; Duan, J.; Li, M.; Zhou, P.; Li, J.; Yang, T. Study on the phase state and temperature-pressure distribution of CO2 injection wellbore and its effect on tubing stress conditions. Geoenergy Sci. Eng. 2024, 241, 213155. [Google Scholar] [CrossRef]
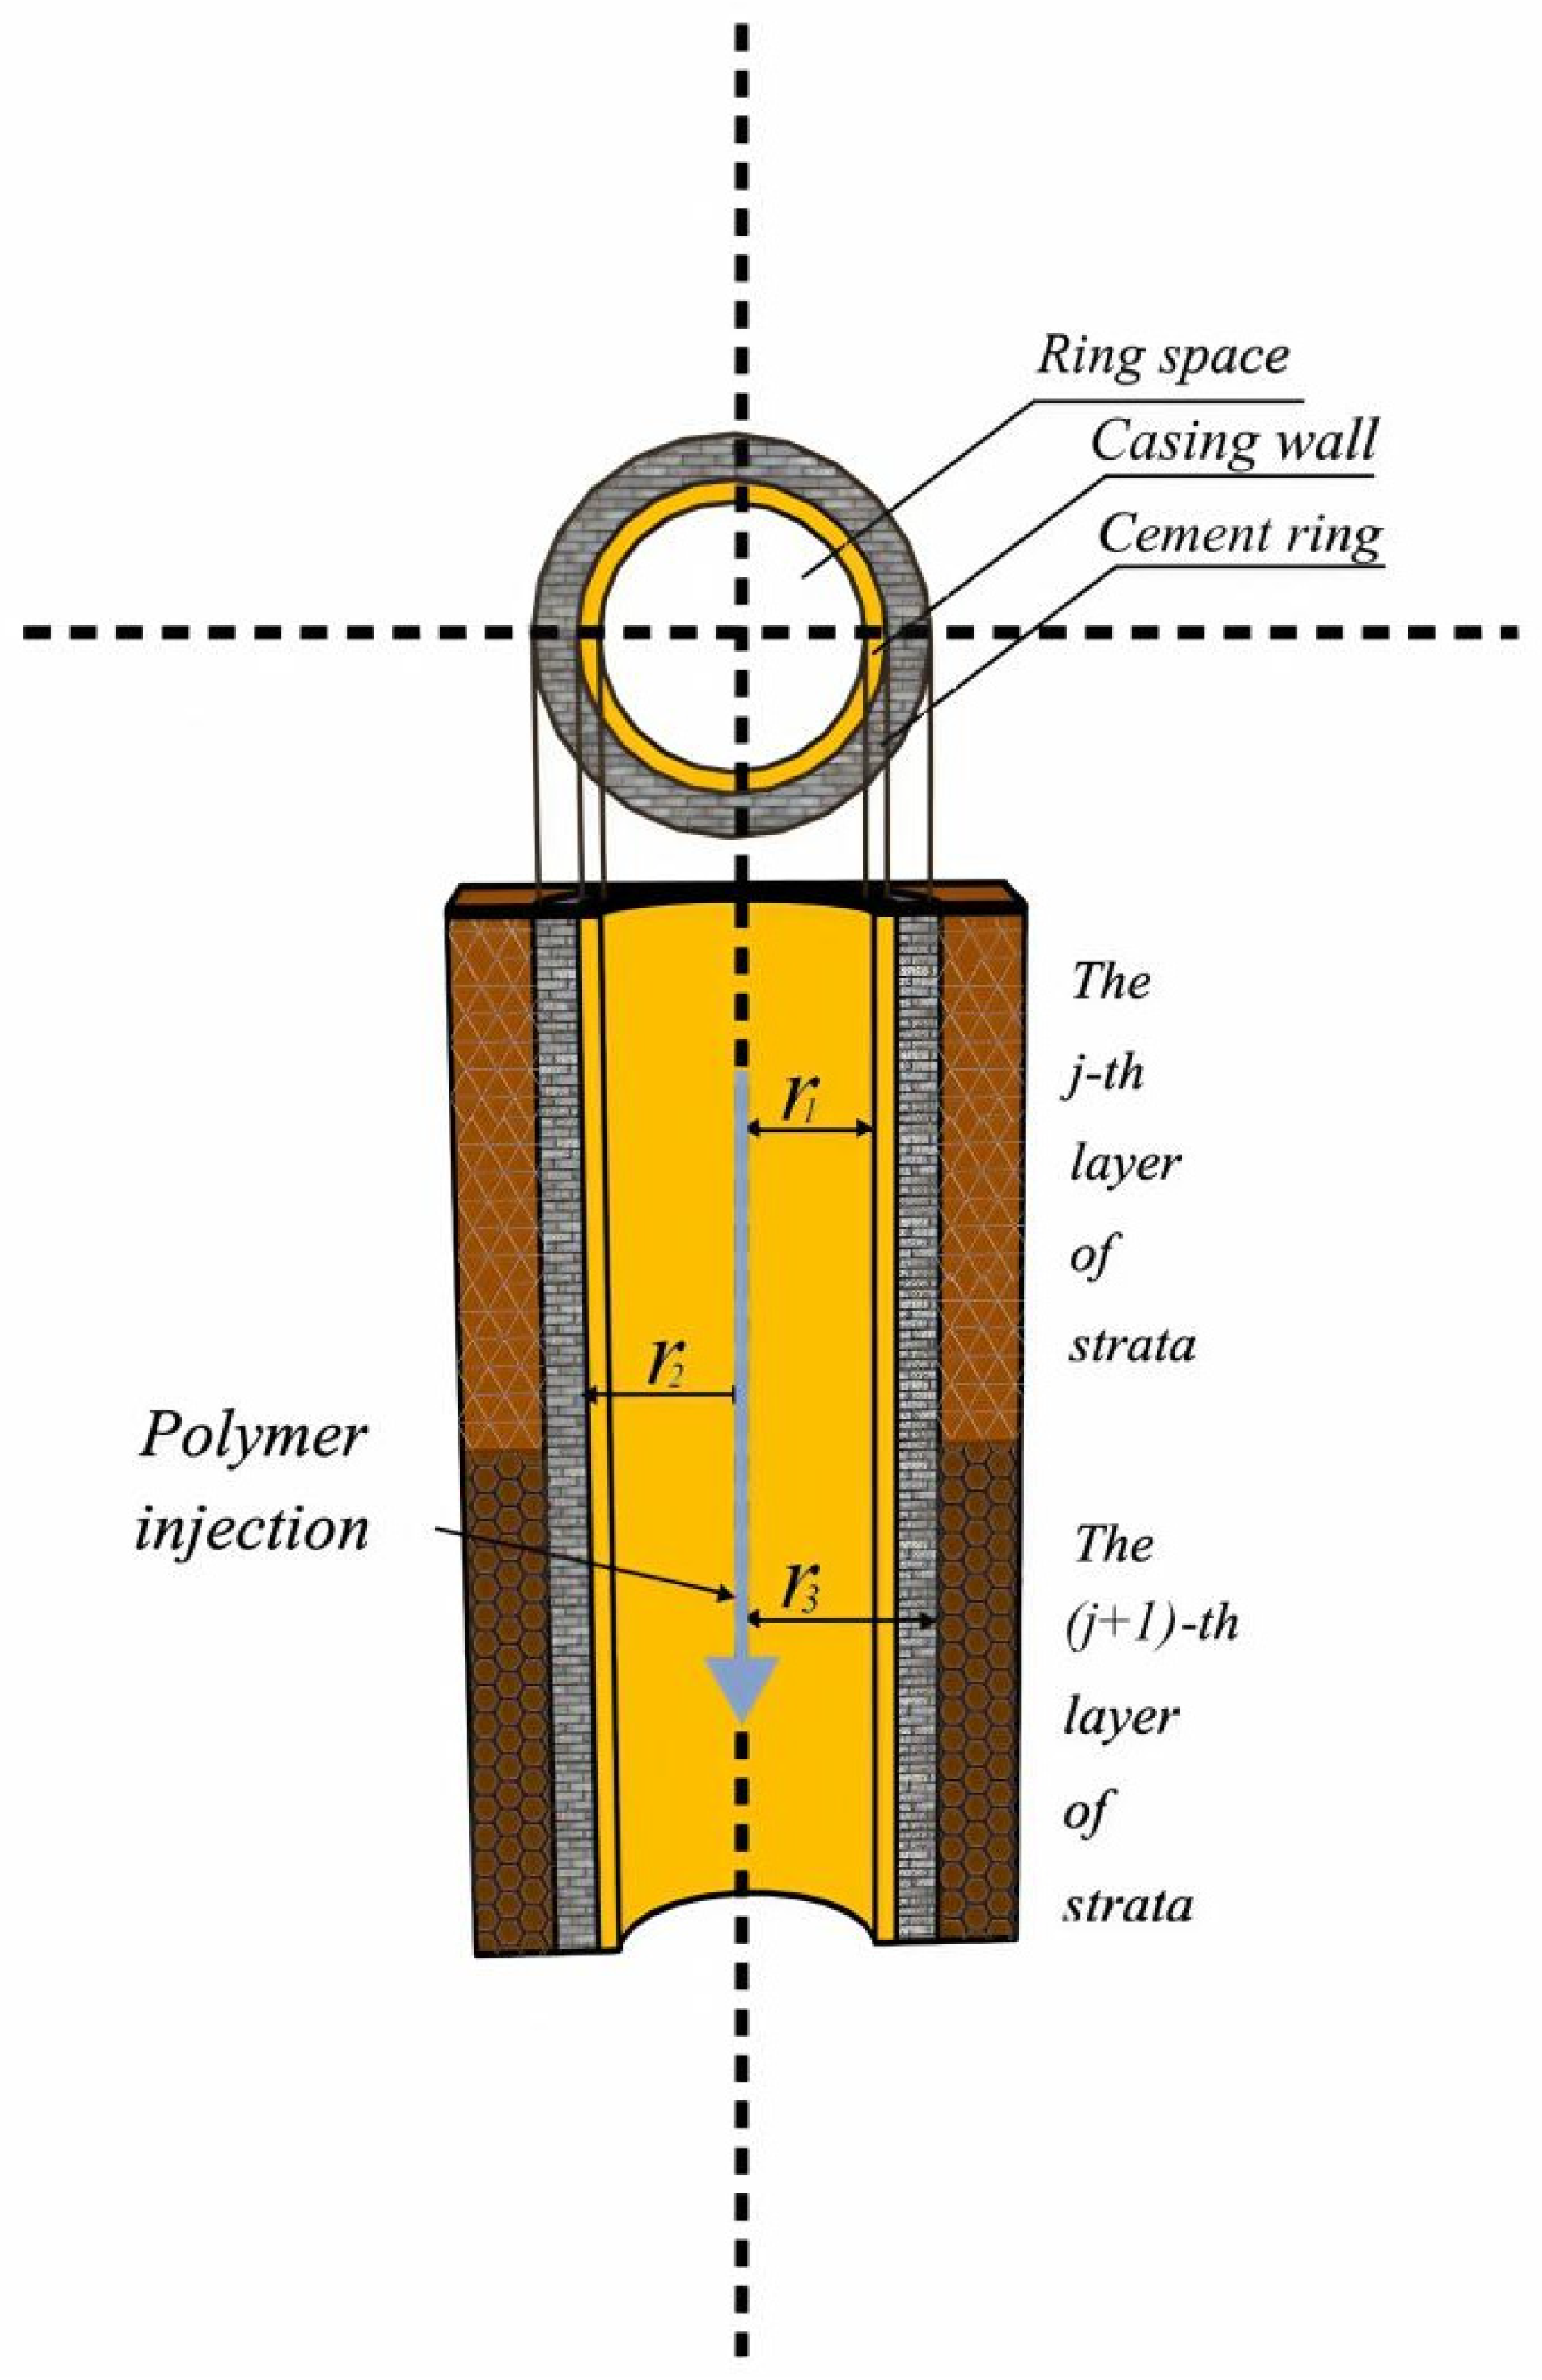
Figure 1. Radial Distribution Map of Well Shaft. Note: r1 represents the inner radius of the casing, in meters; r2 represents the outer radius of the casing, in meters; r3 represents the outer radius of the cement ring, in meters.
Applsci 15 11831 g001
Figure 2. Viscous-Temperature Fit Curve Chart. Note: The blue dotted line represents the experimental data, while the red solid line is the fitted curve.
Applsci 15 11831 g002
Figure 3. Grid Cell Division. Note: M represents the maximum number of longitudinal unit nodes. λ represents the radial element block. The yellow part represents the casing, and the outer layer of it is the cement ring.
Applsci 15 11831 g003
Figure 4. Coupling Model Calculation Block Diagram.
Applsci 15 11831 g004
Figure 5. Temperature and viscosity distributions in the wellbore at 240 min and measured viscosity data at 1000 m.
Applsci 15 11831 g005
Figure 6. Temperature and Viscosity Distributions in the Wellbore under Different Injection Temperatures.
Applsci 15 11831 g006
Figure 7. Temperature and Viscosity Distributions in the Wellbore under Different Injection Pressure.
Applsci 15 11831 g007
Figure 8. Temperature and Viscosity Distributions in the Wellbore under Different Injection Flow Rates.
Applsci 15 11831 g008
Figure 9. Temperature and Viscosity Distributions in the Wellbore under Different Injection Durations.
Applsci 15 11831 g009
Table 1. Basic Parameter List.
ParametersValueParametersValue
Reservoir depth1200 mFluid Specific Heat Capacity4.2 J/(kg·K)
Total construction time240 minInner Diameter Ratio (Dimensionless)1.6
Injection rate0.05 m3/minCasing Inner Diameter0.0809 m
Injection temperature40 °CCasing Outer Diameter0.0909 m
Injection pressure60 MPaCement Sheath Outer Diameter0.1209 m
Average Casing Roughness0.0000153 mCasing Density7800 kg/m3
Geothermal Gradient0.03 °CCement Sheath Density1900 kg/m3
Isothermal Point Depth20 mSpecific Heat Capacity445.5 J/(kg·K)
Isothermal Point Temperature25 °CSpecific Heat Capacity880.6 J/(kg·K)
Fluid Density1000 kg/m3Casing Thermal Conductivity45 W/(m·K)
Fluid Thermal Conductivity0.59 W/(m·K)Cement Sheath Thermal Conductivity1.2 W/(m·K)
Disclaimer/Publisher’s Note: The statements, opinions and data contained in all publications are solely those of the individual author(s) and contributor(s) and not of MDPI and/or the editor(s). MDPI and/or the editor(s) disclaim responsibility for any injury to people or property resulting from any ideas, methods, instructions or products referred to in the content.