Article

Lung Opacity Segmentation in Chest CT Images Using Multi-Head and Multi-Channel U-Nets with Partially Supervised Learning

1
Graduate School of Sciences and Technology for Innovation, Yamaguchi University, Yamaguchi 755-8611, Japan
2
Institute for Radiation Science/Graduate School of Medicine, The University of Osaka, Osaka 565-0871, Japan
*
Author to whom correspondence should be addressed.
Appl. Sci. 2025, 15(19), 10373; https://doi.org/10.3390/app151910373
Submission received: 1 September 2025 / Revised: 19 September 2025 / Accepted: 23 September 2025 / Published: 24 September 2025
(This article belongs to the Special Issue Pattern Recognition Applications of Neural Networks and Deep Learning)

Abstract

There has been a large amount of research applying deep learning to the medical field. However, obtaining sufficient training data is challenging in the medical domain because annotation requires specialized knowledge and significant effort. This is especially true for segmentation tasks, where preparing fully annotated data for every pixel within an image is difficult. To address this, we propose methods to extract useful features for segmentation using two types of U-net-based networks and partially supervised learning with incomplete annotated data. This research specifically focuses on the segmentation of diffuse lung disease opacities in chest CT images. In our dataset, each image is partially annotated with a single type of lung opacity. To tackle this, we designed two distinct U-net architectures: a multi-head U-net, which utilizes a shared encoder and separated decoders for each opacity type, and a multi-channel U-net, which shares the encoder and decoder layers for more efficient feature learning. Furthermore, we integrated partially supervised learning with these networks. This involves employing distinct loss functions to both bring annotated regions (ground truth) and segmented regions (predictions) closer, and to push them apart, thereby suppressing erroneous predictions. In our experiments, we trained the models on partially annotated data and subsequently tested them on fully annotated data to compare the segmentation performance of each method. The results show that the multi-channel model applying partially supervised learning achieved the best performance while also reducing the number of weight parameters.

1. Introduction

Computer-aided diagnosis (CAD) has been developed to assist physicians by providing a second opinion, in order to reduce their workload. Recently, as deep learning performance has increased rapidly, it has been applied to CAD system research [1,2,3]. However, a fundamental challenge still remains: effective deep learning models require not only a vast amount of data but also high-quality annotation. This is particularly difficult in the medical field, where obtaining a sufficient volume of labeled data for training is a significant problem [4]. The annotation process is a labor-intensive task that demands specialized medical expertise, making it both time-consuming and expensive. For CAD systems to become a widespread and practical tool in the future, it is crucial to develop methods that can learn effectively from limited labeled data. Therefore, many research efforts deal with advanced learning paradigms such as semi-supervised, weakly supervised, and self-supervised learning, which can extract useful features from a limited amount of data and annotations [5,6,7].
Based on the above background, we focus on learning from partially annotated data, rather than relying on fully annotated data. Partially supervised learning is a machine learning paradigm that addresses the common challenge of limited labeled data. Unlike traditional supervised learning, which requires a complete set of labels, partially supervised learning is implemented on a dataset where only some parts of the data are labeled. By effectively leveraging these limited annotations, the model can efficiently learn generalized knowledge from the labeled examples. This approach is particularly valuable in domains where data annotation is costly and time-consuming, as it allows us to build robust models without the need for exhaustive labeling efforts. As part of deep learning research with partially annotated data, we study a segmentation task for diffuse lung diseases on chest computed tomography (CT) images. Many studies on segmentation have been conducted using chest CT images as input to segmentation networks.
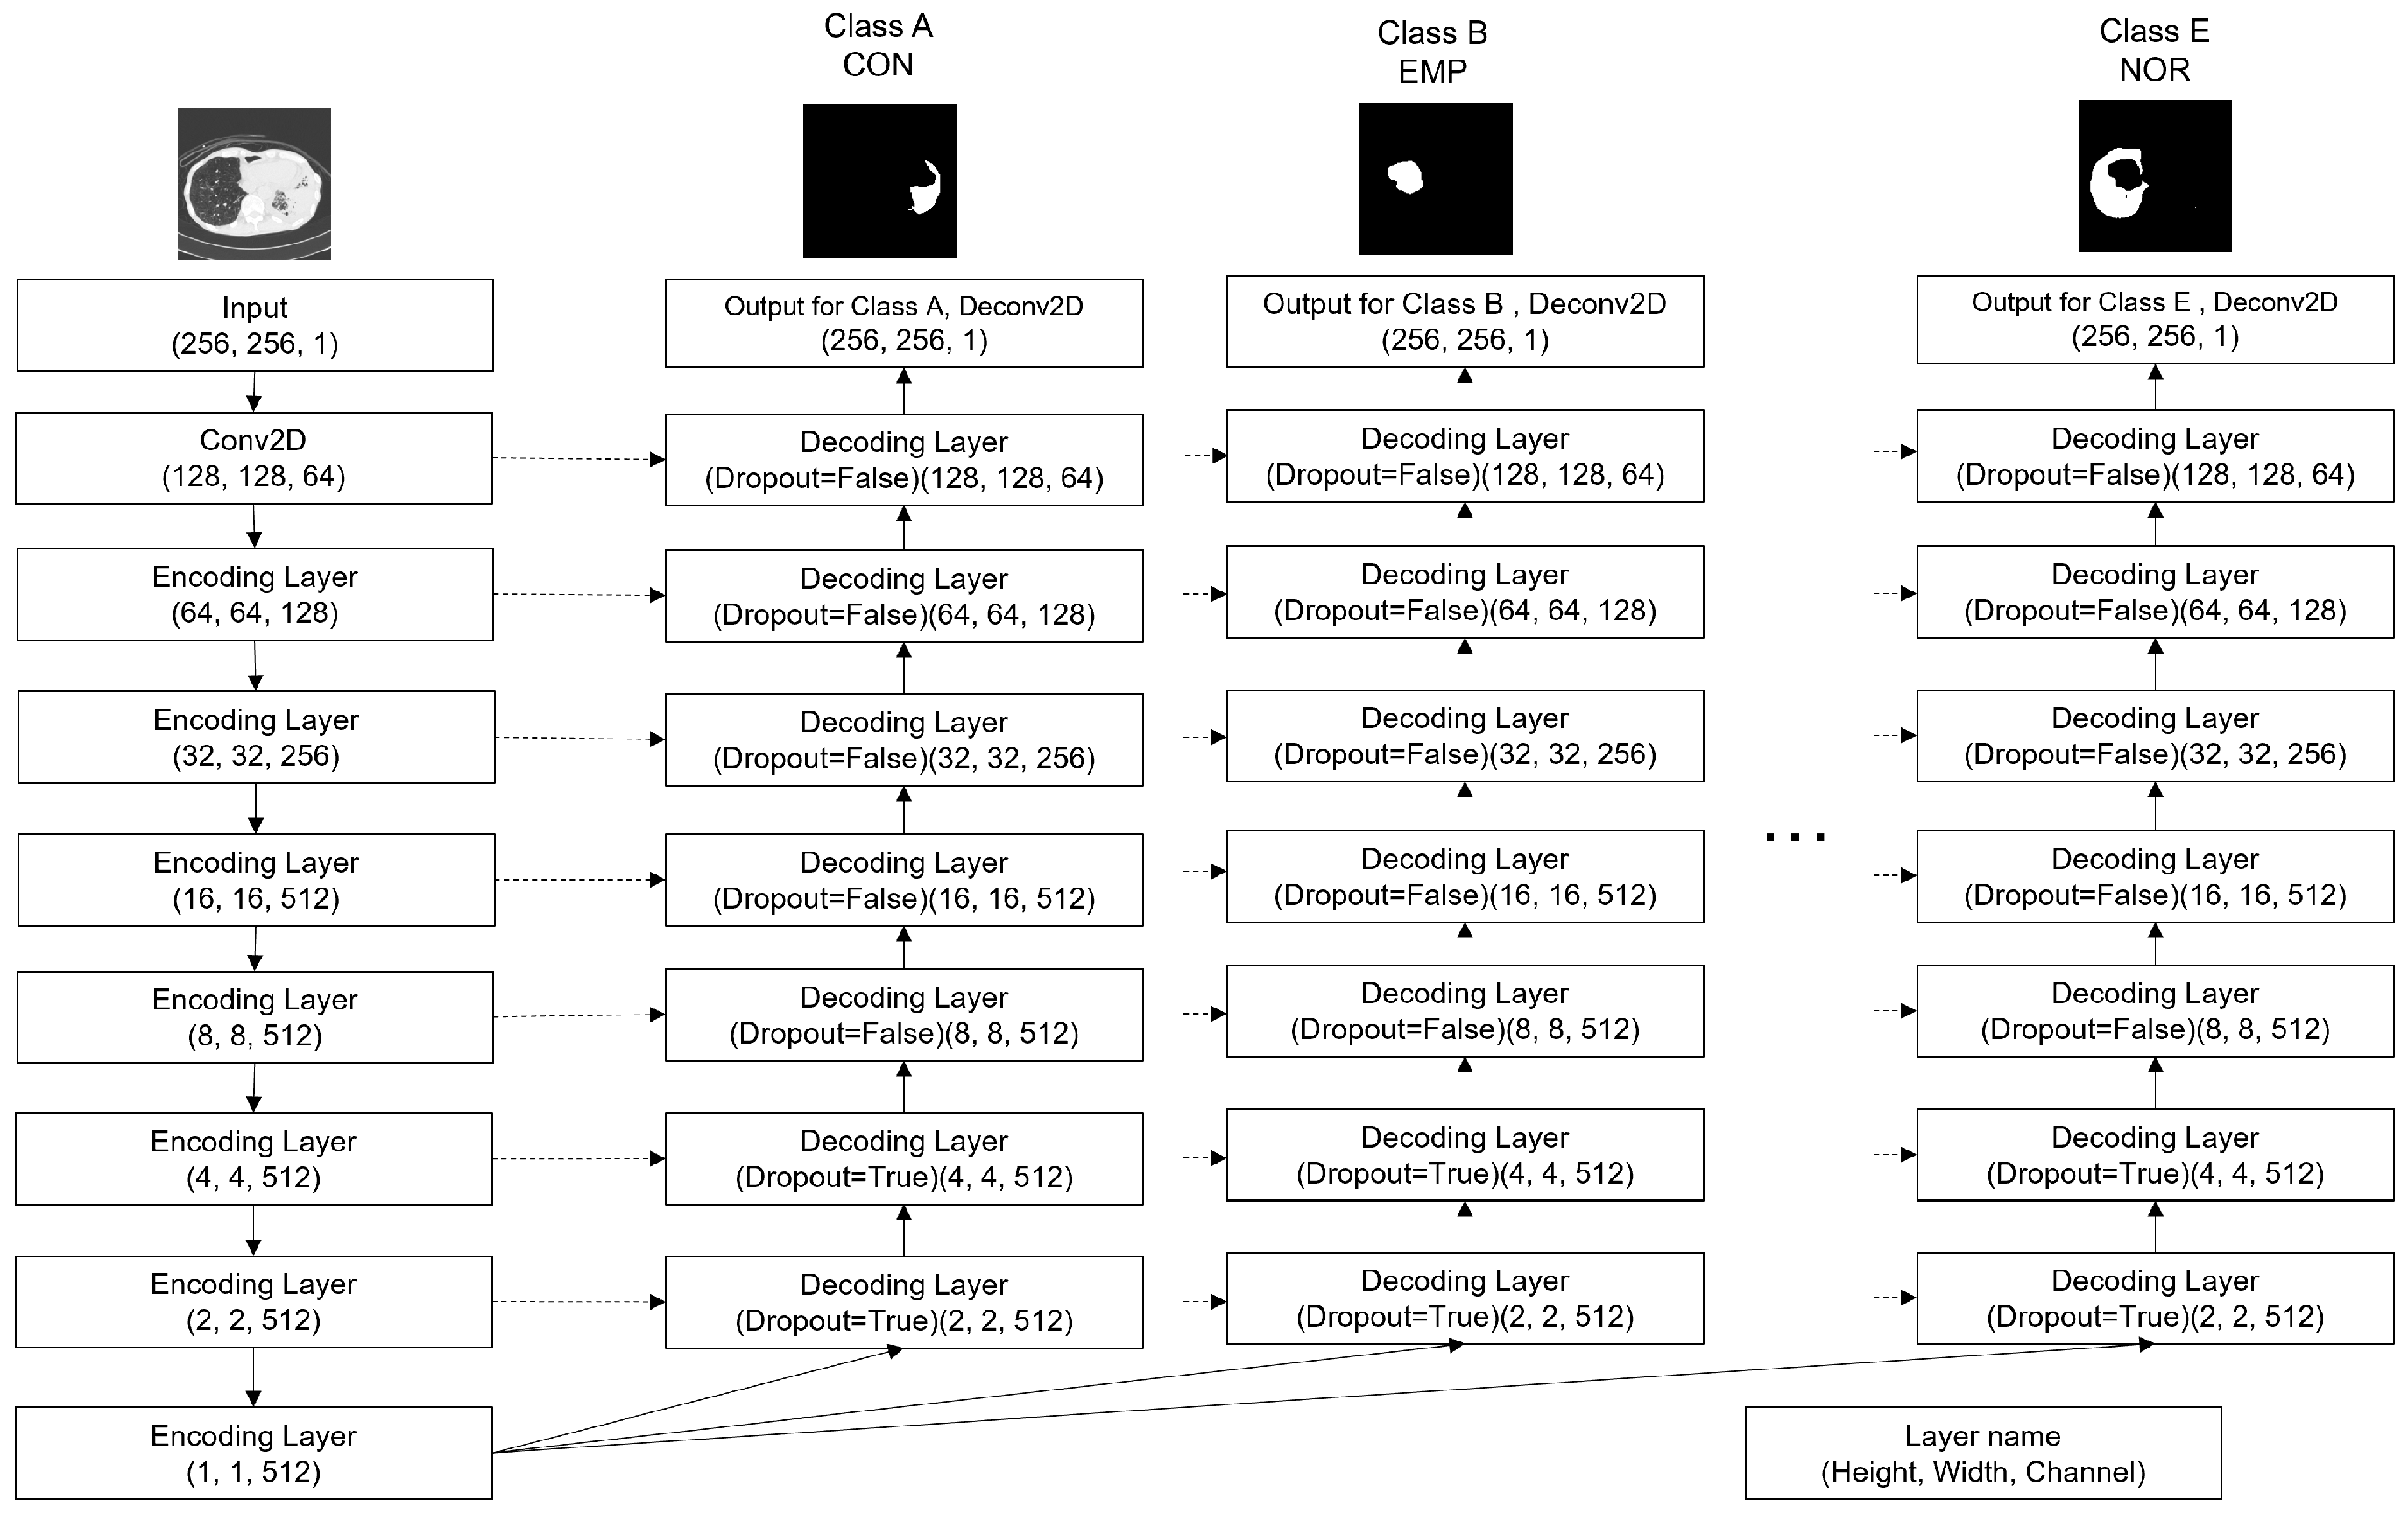
In our study, we deal with a dataset in which each CT slice (image) is annotated with only a single representative opacity among one normal and four abnormal opacities. In these partially annotated CT images, some parts of the lung regions are annotated with a certain opacity (class) label, but the remaining regions are not annotated, meaning that their class labels are unknown. In this case, to achieve multi-class segmentation of the five opacities, one approach is to build independent segmentation models specialized for each opacity. For example, Nguyen et al. proposed a segmentation model for ground-glass opacity (GGO) in [8], Akila Agnes et al. for lung nodules in [9], and Hoang et al. for COVID-19 and interstitial lung disease opacities in [10]. Much of the research in this area focuses on a single target opacity class or combines multiple classes into one. In this study, as a baseline model, five independent segmentation models are created, and their predictions are combined to generate the final result; that is, ensemble learning is implemented with one-versus-the-rest classifiers. The ensemble model in Figure 1 shows an overview of the model structure, where independent models are designed for each task (each class segmentation).
When independent segmentation models are constructed, each model only learns the features of the target opacity to be segmented, which makes it difficult to clarify the differences between the features of other opacities, especially when dealing with multi-opacity segmentation. Therefore, we propose two types of distinct model structures based on U-net [11] with partially supervised learning to learn the features of five types of lung opacities effectively. This paper is an extended version of [12]. One of the model structures is a multi-head U-net, which utilizes a shared encoder and separate decoders corresponding to each class. By using the shared encoder, the multi-head U-net extracts useful features that can classify different opacities compared to the standard U-net. The other is a multi-channel U-net, which shares encoder and decoder layers for the training of every class. The multi-channel U-net not only extracts useful features like the multi-head U-net, but also the network structure becomes very compact compared to the standard U-net and the multi-head U-net. However, to make use of the partially annotated data, a specific learning algorithm for the annotated data is necessary. The multi-head and multi-channel U-nets are combined with partially supervised learning. The partially supervised learning used in this study can utilize a given label, for example, class “A”, not only for the training of the segmentation function of class A, but also for that of class B, C, and so on. Figure 1 also shows an overview of the multi-head and multi-channel models, where we can see that some layers are shared by multiple tasks and some layers are distinctively given for each task. Therefore, in terms of the weight sharing ratio, the highest ratio is found in a multi-channel model, followed by a multi-head model, and then an ensemble model.
In summary, the objective of this paper is as follows. (1) Segmentation ability is compared between the U-net, the multi-head U-net, and the multi-channel U-net to discover the effective structure for the multi-class opacity segmentation in chest CT images. (2) The effectiveness of the combination of each U-net structure and partially supervised learning is verified. (3) The effectiveness of sharing the layers is verified by considering both the segmentation performance and the number of weight parameters needed for each structure.

2. Materials and Methods

2.1. Dataset

The chest CT images used in this paper were provided by Yamaguchi University Hospital, Japan. The CT images were taken by a SOMATOM Sensation 64, SIEMENS, and each image size is 512 × 512 pixels. The total number of CT slices partially annotated by the board-certified radiologists is 611, including 150 consolidation (CON), 163 emphysema (EMP), 114 ground-glass opacity (GGO), 129 honeycombing (HCM), and 55 normal (NOR) images. Note that each image was assigned a representative class label, but may contain other classes that were not annotated. Figure 2 shows CT image examples of five types of opacities and partially annotated regions. Throughout this study, different colors were used to represent each opacity region (CON: red, EMP: green, GGO: blue, HCM: light blue, NOR: yellow). The images were resized to 256 × 256 pixels when inputting them to the segmentation models. The mean age of the cases was 61.9, with a standard deviation of 14.9, a maximum value of 88, a minimum of 13, and a median of 64. The size of the thoracic region relative to the whole image (original size 512 × 512 ) was 0.832 on average, with a standard deviation of 0.036. As described above, Figure 2 shows examples of the partial annotations, which were used for training. In each image, only a single class is annotated with a single color, and the uncolored regions are not labeled. On the other hand, Figure 3 shows examples of fully annotated images where multiple classes of opacities within the lung field are fully annotated. Our study used 16 fully annotated images for testing and aimed to verify whether a model trained on partially annotated data could perform full annotation.

2.2. Methods

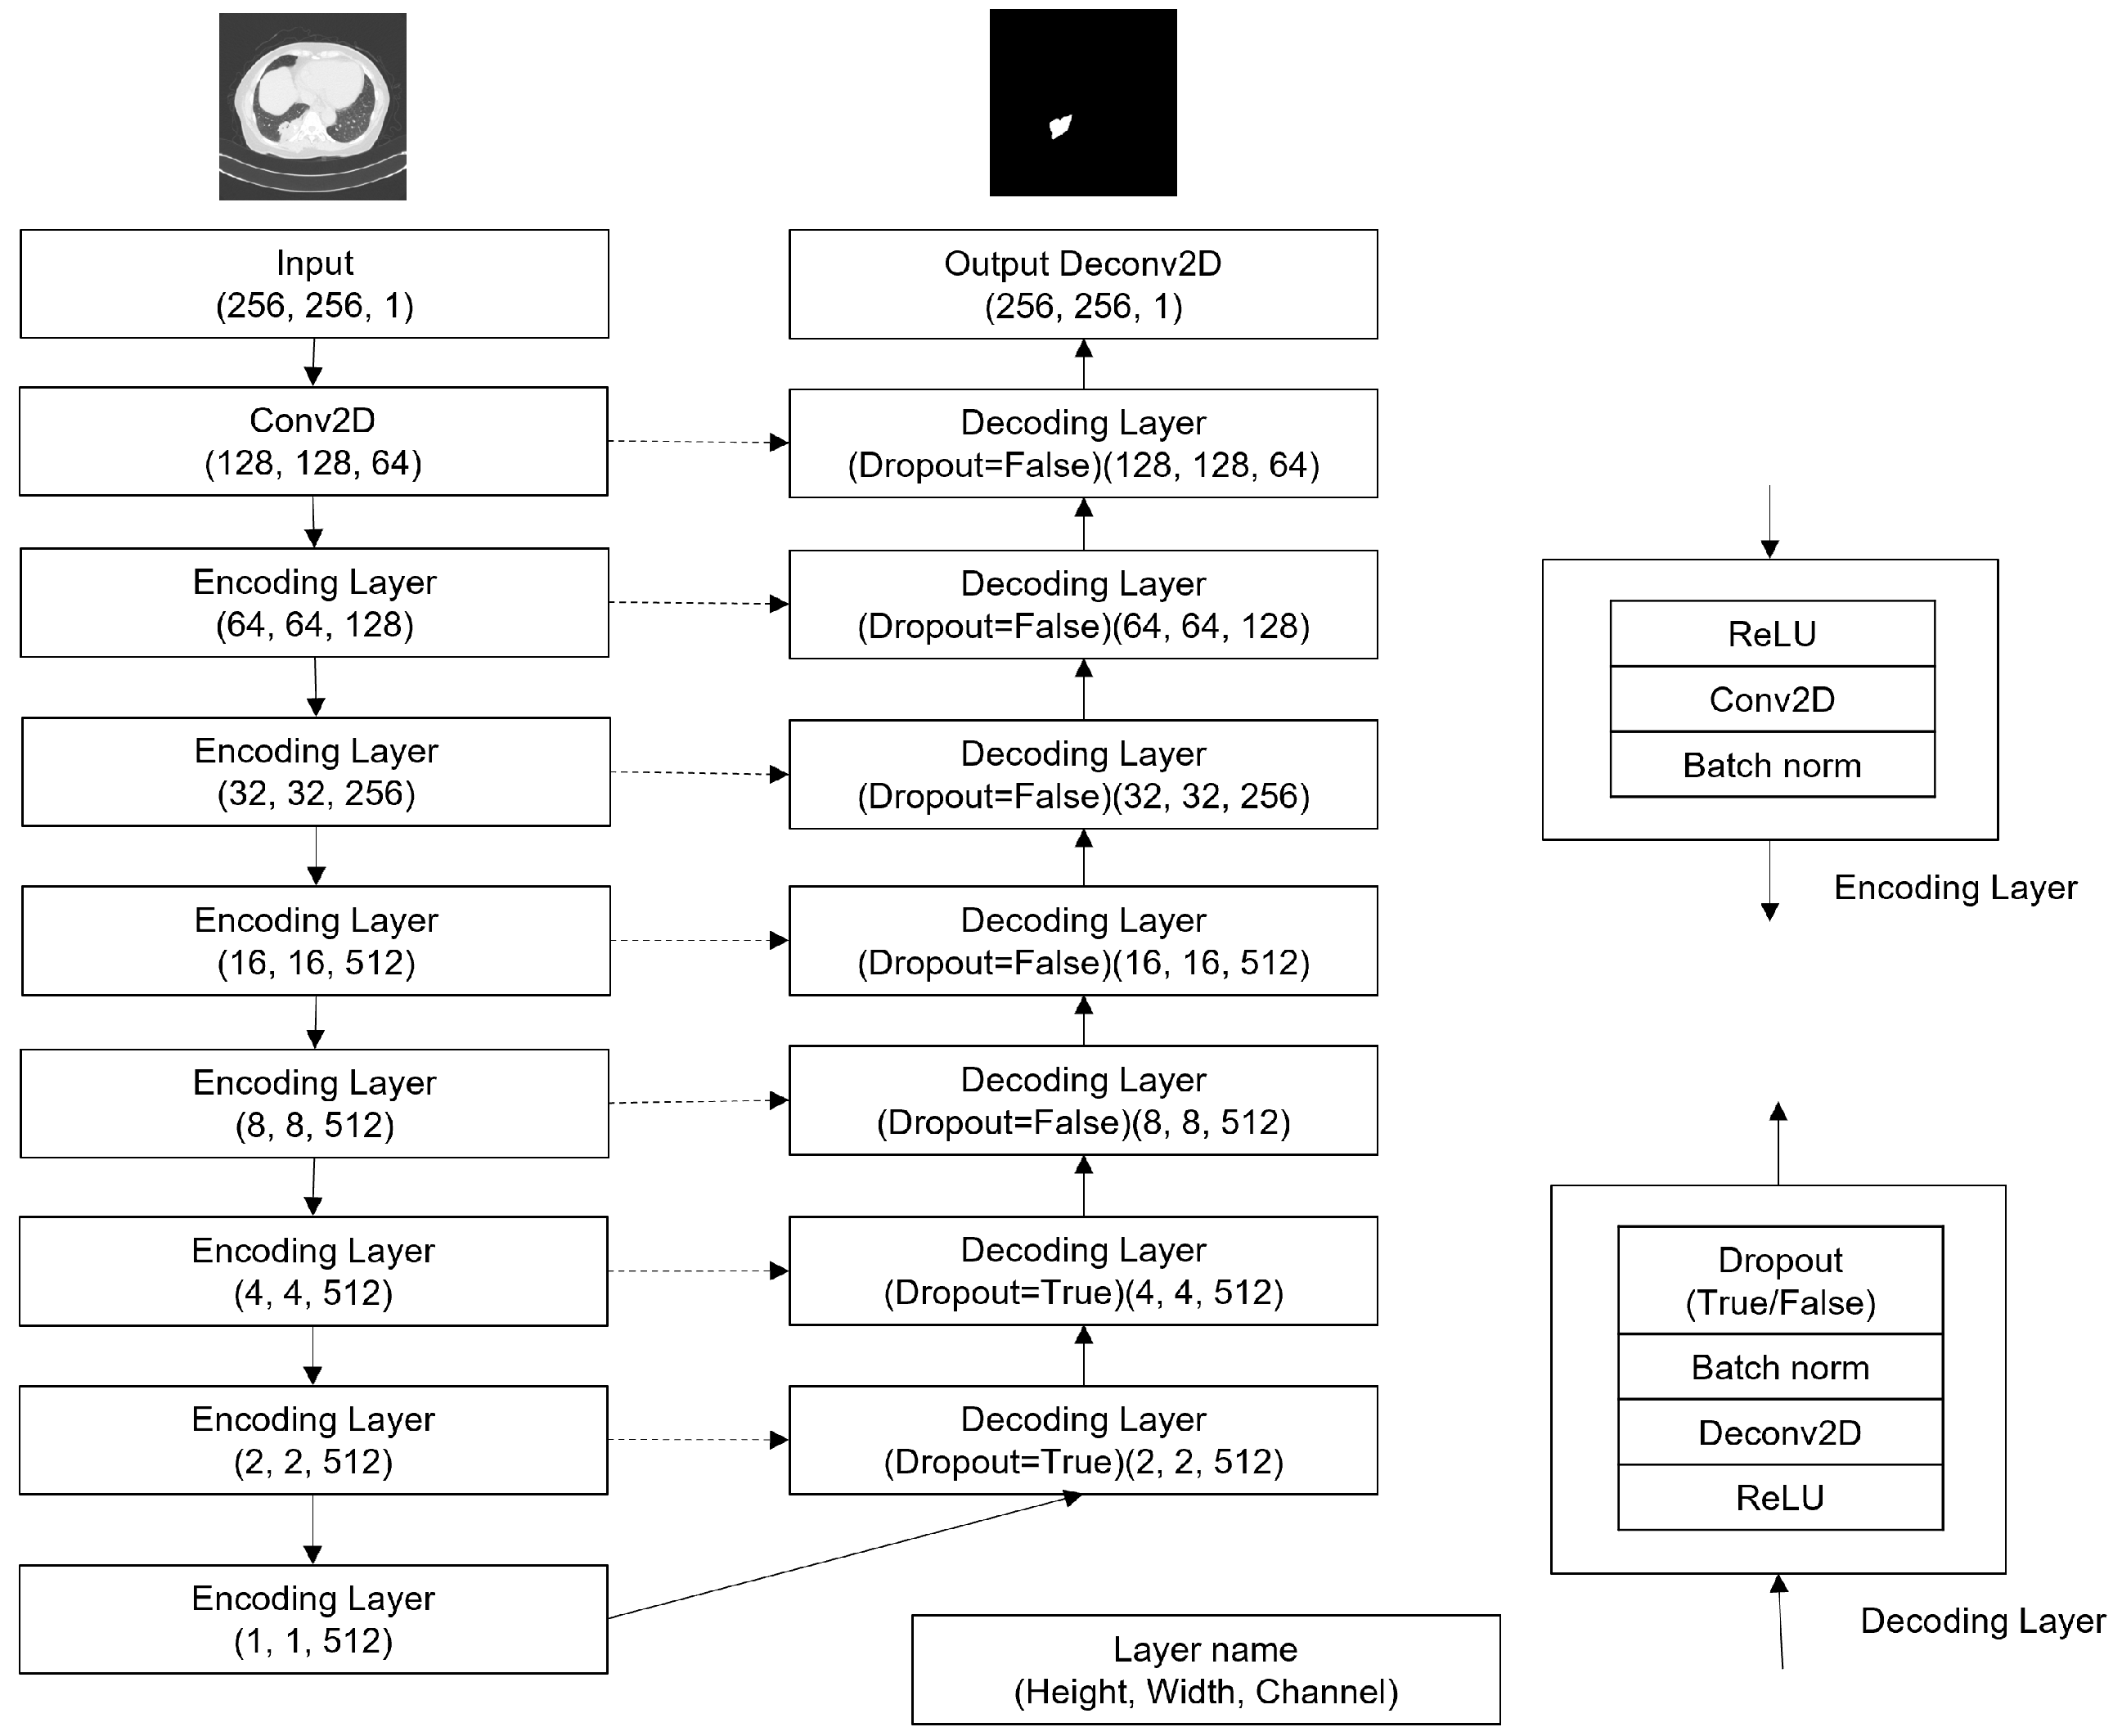
After the standard U-net structure built for the segmentation task dealt with in this paper is explained, the structures and the features of the multi-head U-net and multi-channel U-net are explained. U-net is an encoder–decoder model for segmentation proposed in 2015. The structure of the U-net used in this paper is shown in Figure 4, where the input is a chest CT image and the output is a mask image (segmentation map) representing the opacity regions. The activation function of the last layer is the sigmoid function for all the models. The encoder consists of one convolution layer and seven encoding layers, and the decoder consists of seven decoding layers and one deconvolution layer. The encoding layer consists of the ReLU activation function, convolution, and batch normalization. The decoding layer consists of ReLU, deconvolution, batch normalization, and dropout. The encoder extracts image features by convolution, and the decoder generates mask images by deconvolution. U-net has a mechanism for sending encoder information to the decoder called skip connections. Skip connections enable the U-net to make highly accurate predictions while preserving object-location information. Therefore, U-net is suitable for the medical field where location information is important.

2.3. Multi-Head U-Net

The multi-head U-net shares the encoding layers of the model. The decoding layers are not shared, and each decoding layer outputs a mask image corresponding to each class. The structure of the multi-head U-net is shown in Figure 5. The encoder consists of one convolution layer and seven encoding layers, the same as the standard U-net; however, the decoder consists of five partial networks, each of which consists of seven decoding layers and one deconvolution layer. When a standard U-net is applied to the training of partially annotated data, we have to create several distinct one-versus-the-rest classifiers. Therefore, a classifier of one class cannot learn the features of other classes. On the other hand, the multi-head U-net can learn features of other classes due to the encoder sharing. The decoder network has several sets of decoding layers, each of which is specialized to generate a mask for the corresponding class.

2.4. Multi-Channel U-Net

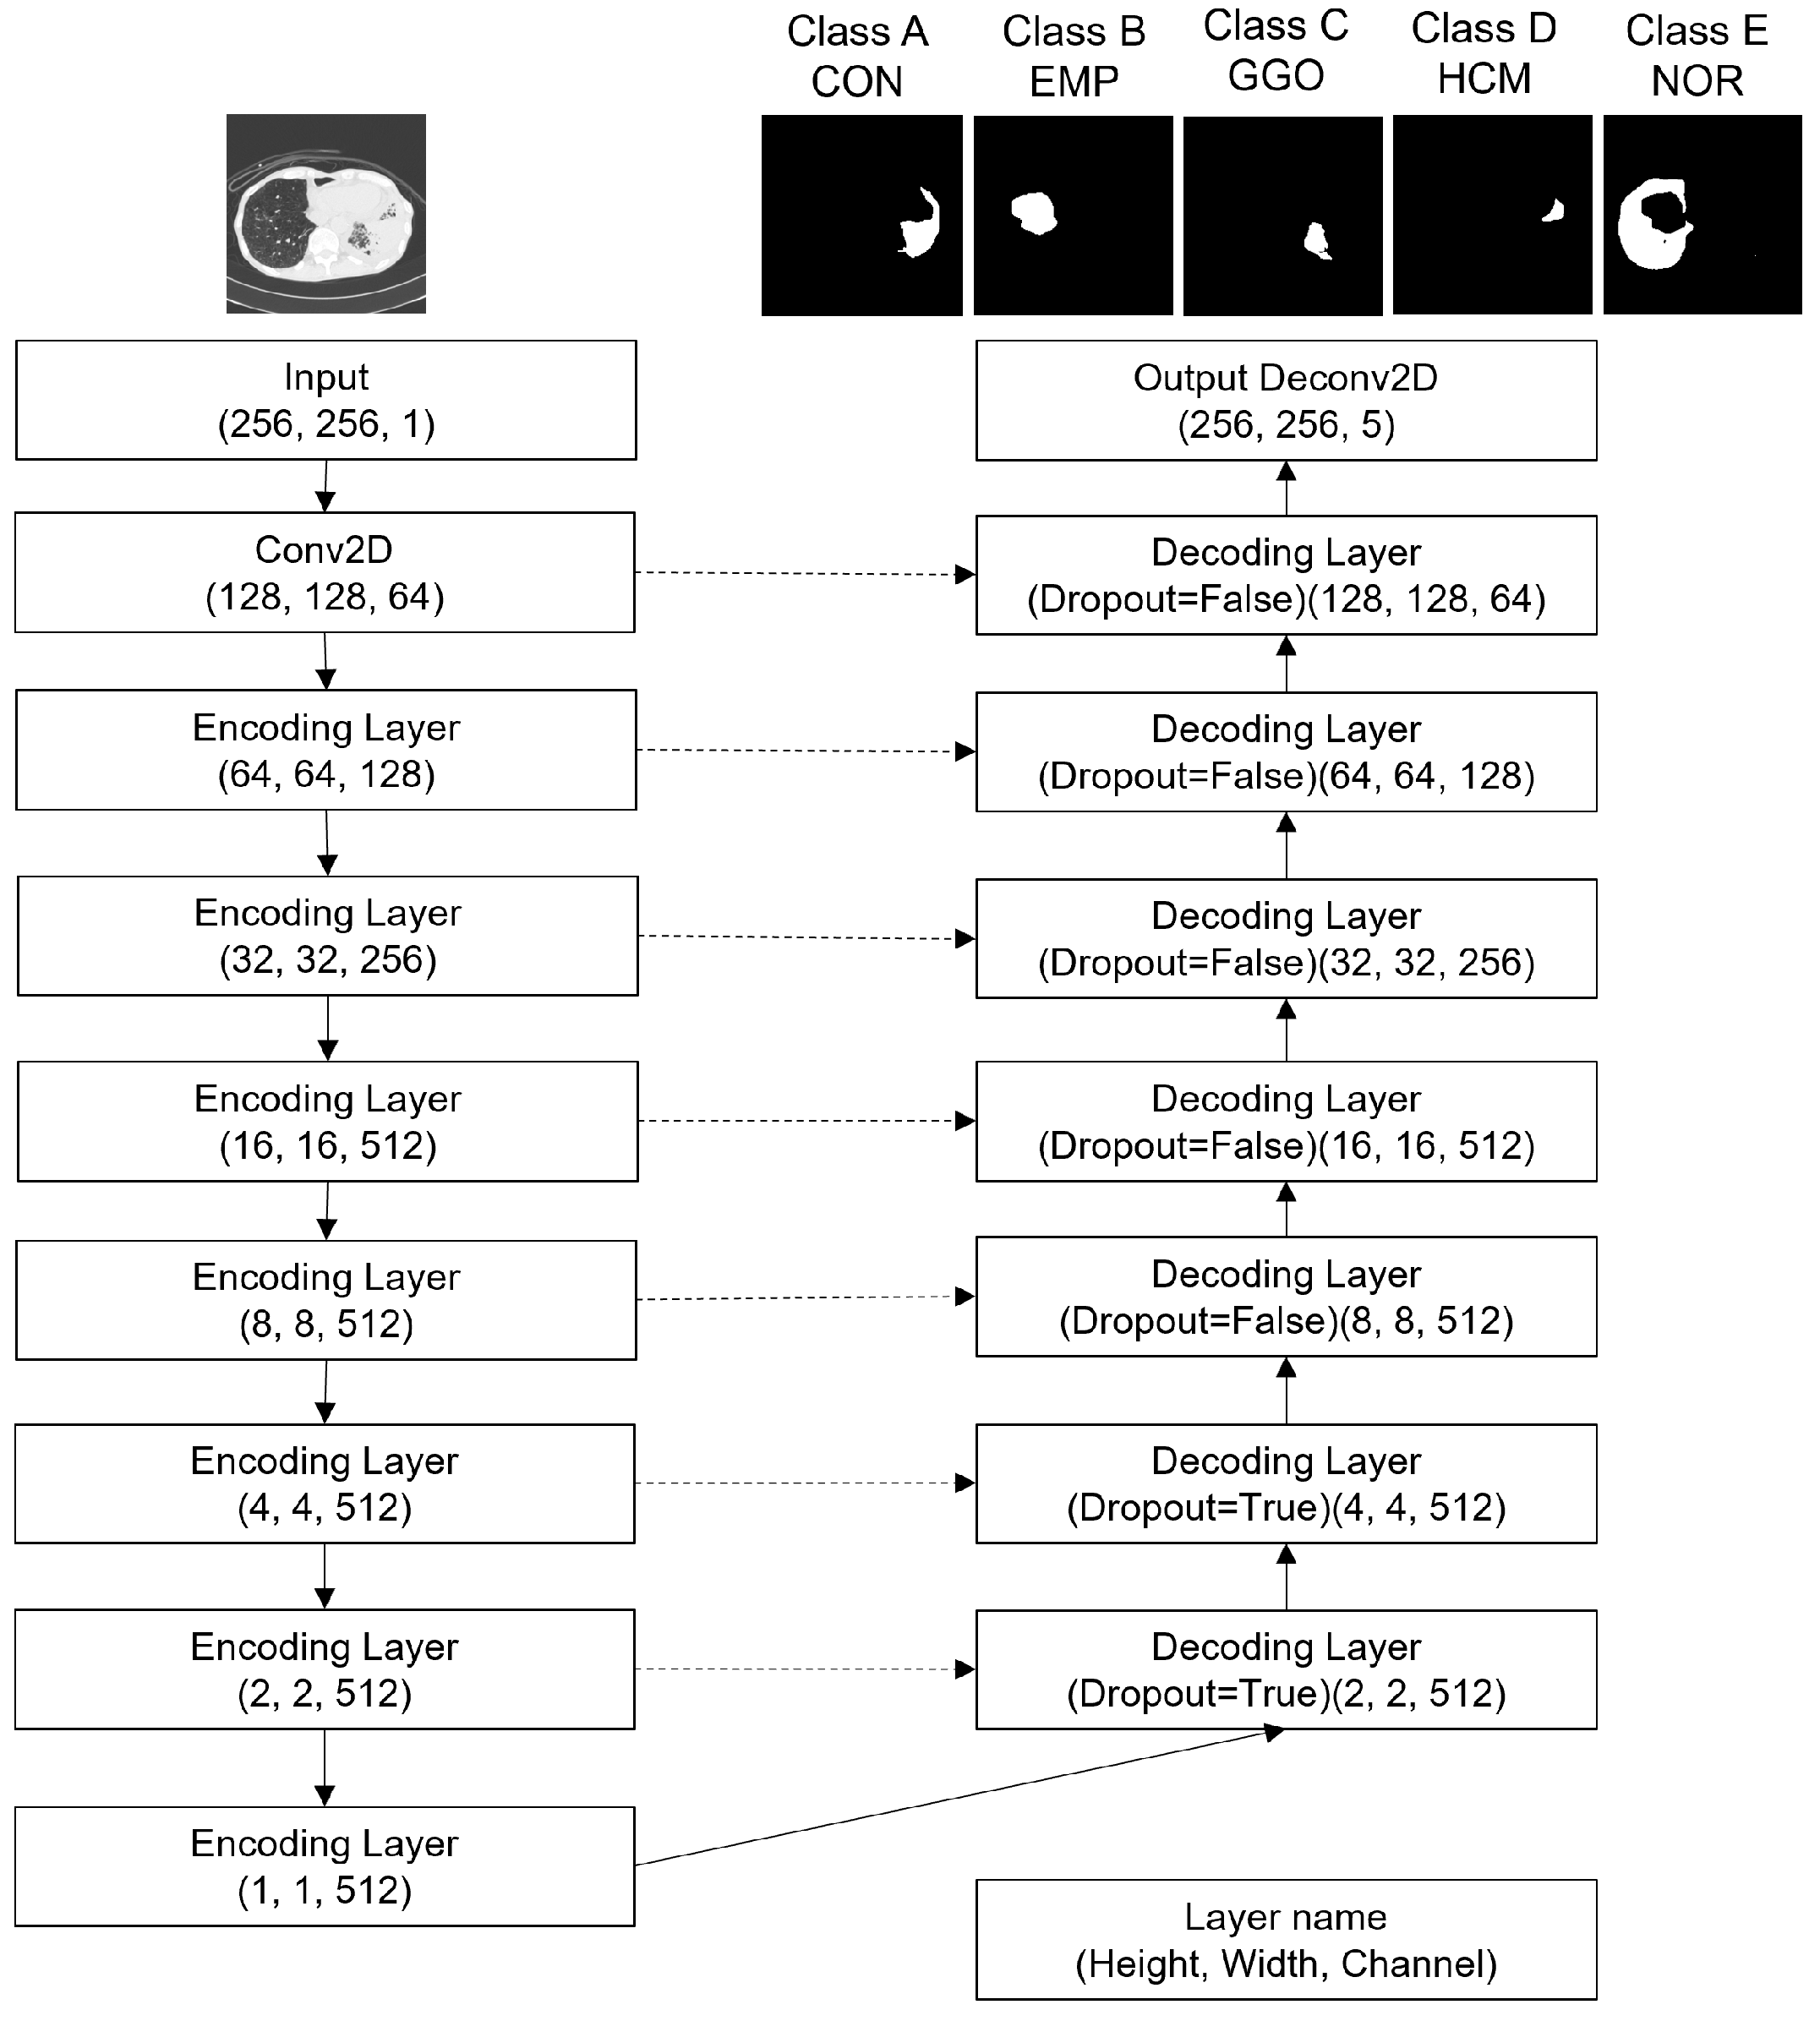
In recent years, there have been many studies supporting the usefulness of a model in which not only the encoder but also the decoder are shared across all classes [13,14]. Therefore, we also designed a multi-channel U-net in which the decoder as well as the encoder are shared by all the classes. The structure of the multi-channel U-net is shown in Figure 6. The encoder consists of one convolution layer and seven encoding layers; the decoder consists of seven decoding layers and one deconvolution layer; and the output layer generates five mask images, each of which corresponds to the segmentation results of each class. In the multi-channel U-net, the decoder layers are also shared across all the classes to generate a segmentation mask, to maximize the use of various features, including information from all the classes extracted in the encoder. This allows the encoder and decoder to consistently learn information from all the classes, and the model can make a segmentation mask with fewer regions of misclassification for images that contain multiple classes. Therefore, the differences between the multi-channel and multi-head U-nets are as follows. The multi-channel U-net shares the information between the classes as much as possible in both the encoder and decoder, while the multi-head U-net shares the information between classes in the encoder, and the decoder specializes in the segmentation of each class.
While the multi-channel U-net extends the standard U-net by having a multi-channel output, this study uses partially annotated data, where each image is labeled with only a single class. Therefore, we cannot train it in the same way as the case where fully annotated data are given. A partially supervised learning approach, explained in the next subsection, is an efficient method for training the multi-channel U-net (and multi-head U-net) under this condition.

2.5. Partially Supervised Learning (Two-Loss Learning)

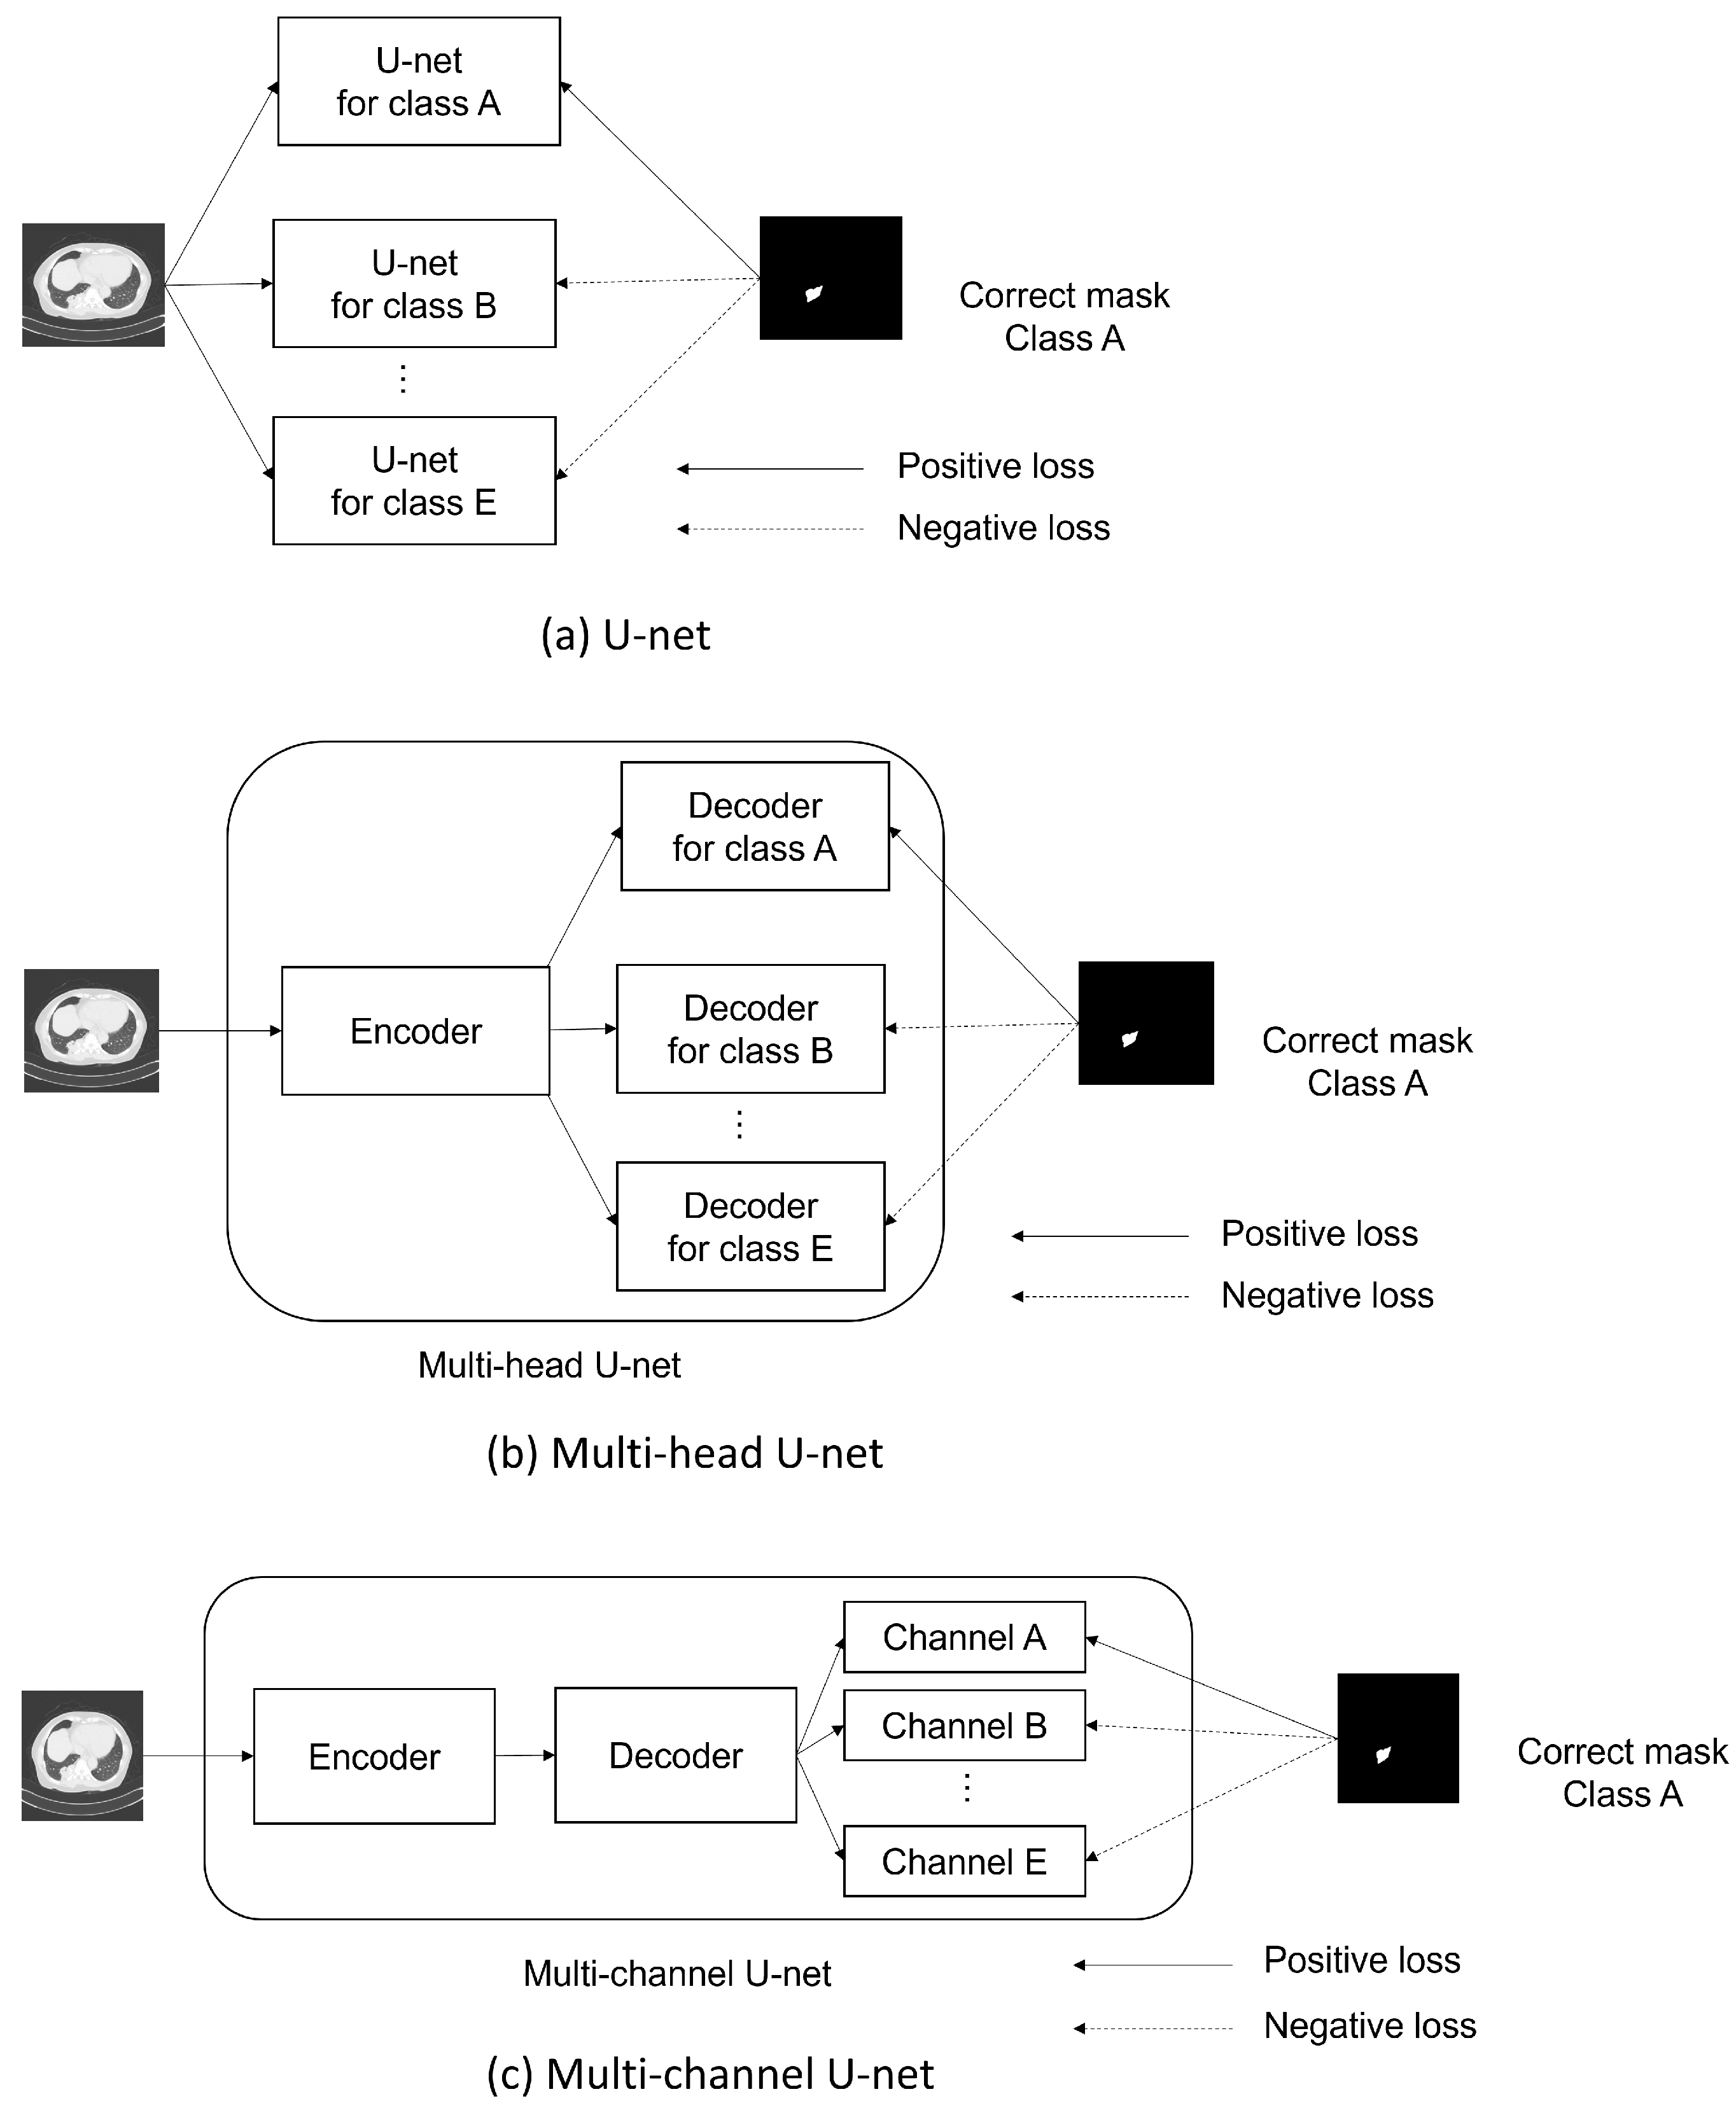
In this paper, the partially supervised learning algorithm proposed in [15] is modified to fit the training of multi-head and multi-channel networks. The basic concept of the learning algorithm is as follows. In our method, only the annotated regions are used. Thus, when the annotated class label on an image is “A”, for example, a positive loss function is applied to the output mask of class A, while a negative loss function is applied to the mask of the other classes. Figure 7 shows how to apply the positive and negative loss functions to each model. The two loss functions are designed to increase or decrease the similarity between the predicted and the correct (annotated) masks. The positive and negative loss functions are defined by Equations (1) and (2), respectively.
L ( y , ŷ ) = { H ( y , ŷ ) , i f   c l a s s   y   =   c l a s s   ŷ (1) 1 4 · λ · H ( y , ŷ ) , i f   c l a s s   y     c l a s s   ŷ , (2)
where y , y ^ , and H ( . ) denote the ground-truth class label, an assigned class label for the output mask, and a cross-entropy loss function, respectively. 1 4 · λ is a parameter that determines the balance between Equations (1) and (2), where 1 4 is given because the positive loss is calculated for one class and the negative loss is calculated for the remaining four classes. The value of λ was set at 0.001 experimentally. Next, the meaning of these loss functions is explained using an example. When the model trains on an image with partial annotation of class A, the weights of the layers related to class A and the layers shared by all the classes learn with Equation (1) in order to increase the similarity between the annotated and segmented regions. On the other hand, other layers that are related to other classes, not class A, and the shared layers learn with Equation (2) in order to decrease the similarity between the annotated and segmented regions. In this study, we call the standard cross-entropy-based learning with only Equation (1) “one-loss learning” and the proposed partially supervised learning with Equations (1) and (2) “two-loss learning”. By applying two-loss learning, even in the ensemble model (the standard U-net) that uses multiple networks, each network can be trained not only on the images of the assigned class, but also on the images of the other classes by the negative loss function, which is also the benefit of the two-loss learning (Figure 7a). Therefore, in the experiments, in addition to the standard U-net with one-loss learning, that with two-loss learning is also implemented for comparison. Figure 7b shows how to apply positive and negative losses to the multi-head U-net. When the input image belongs to class A, the shared encoder layers and the decoder layers for class A segmentation are trained by the positive loss function, and the shared encoder layers and the decoder layers for the other classes (class B, C, D, and E) are trained by the negative loss function. Figure 7c shows the case of the multi-channel U-net. The multi-channel U-net generates a multi-channel segmentation map, each channel of which corresponds to a class. When the input image belongs to class A, the positive loss is calculated between the correct mask and the generated image of class A. The negative loss is calculated between the correct mask (class A) and the generated images of the other classes (classes B, C, D, and E).

3. Experiments

We conducted experiments where one-loss and two-loss learning were applied to three different U-net architectures: the standard U-net, the multi-head U-net, and the multi-channel U-net. The segmentation performance of these six models was then compared. As described in Section 2.1, the total number of partially annotated images was 611, including 150 consolidation (CON), 163 emphysema (EMP), 114 ground-glass opacity (GGO), 129 honeycombing (HCM), and 55 normal (NOR) images. The models were trained on the partially annotated images and tested on 16 fully annotated ones. The segmentation performance (Dice coefficient) averaged over five independent trials was then evaluated.

3.1. Training Procedure

The training procedure for each model is explained in this subsection. Note that random parallel translation and rotation were applied to the images as data augmentation.

3.1.1. U-Net

(One-loss learning)
1.
Five U-nets (Figure 4) are created with random weight initialization.
2.
Five U-nets are independently trained on the partially annotated images of each target class for 100 epochs using the positive loss function.
(Two-loss learning)
1.
Five U-nets are created with random weight initialization.
2
For training data of a single target class, each U-net executes one epoch of two-loss learning, changing the target class one by one (a total of five epochs is implemented in this step).
3.
Step 2 is repeated 100 times.

3.1.2. Multi-Head and Multi-Channel U-Net

(One-loss learning)
1.
A model (multi-head: Figure 5; multi-channel: Figure 6) is created with random weight initialization.
2.
The model is trained on the partially annotated images for 100 epochs using the positive loss function. Note that the weight update is implemented only on the layers that are related to the class of the input image (multi-head: encoder only; multi-channel: both encoder and decoder).
(Two-loss learning)
1.
A model is created with random weight initialization.
2.
Then, the model is trained on the partially annotated images. In detail, for training data of a single target class, the model executes one epoch of two-loss learning, changing the learning target class one by one (a total of five epochs is implemented in this step).
3.
Step 2 is repeated 100 times.
All the above methods used a batch size of 16, and the Adam optimizer [16] for error back propagation.

3.2. Testing Procedure

3.2.1. Prediction Ensemble

All the models generate five segmentation masks, each corresponding to one of the five classes. Then, the resulting regions may overlap between classes, meaning a single pixel can have multiple opacity labels. This makes it difficult to determine which opacity the pixel ultimately belongs to. To address this issue, we examined the output values for each opacity at every pixel within the overlapped regions. The opacity label with the highest output value was then prioritized. Furthermore, in computer-aided diagnosis, it is crucial to avoid missing lesions, that is, not to misclassify an anomaly as normal. Therefore, in cases where normal and abnormal labels compete within an overlapped region, we prioritize the abnormal classification result, regardless of the output values.

3.2.2. Evaluation Metric

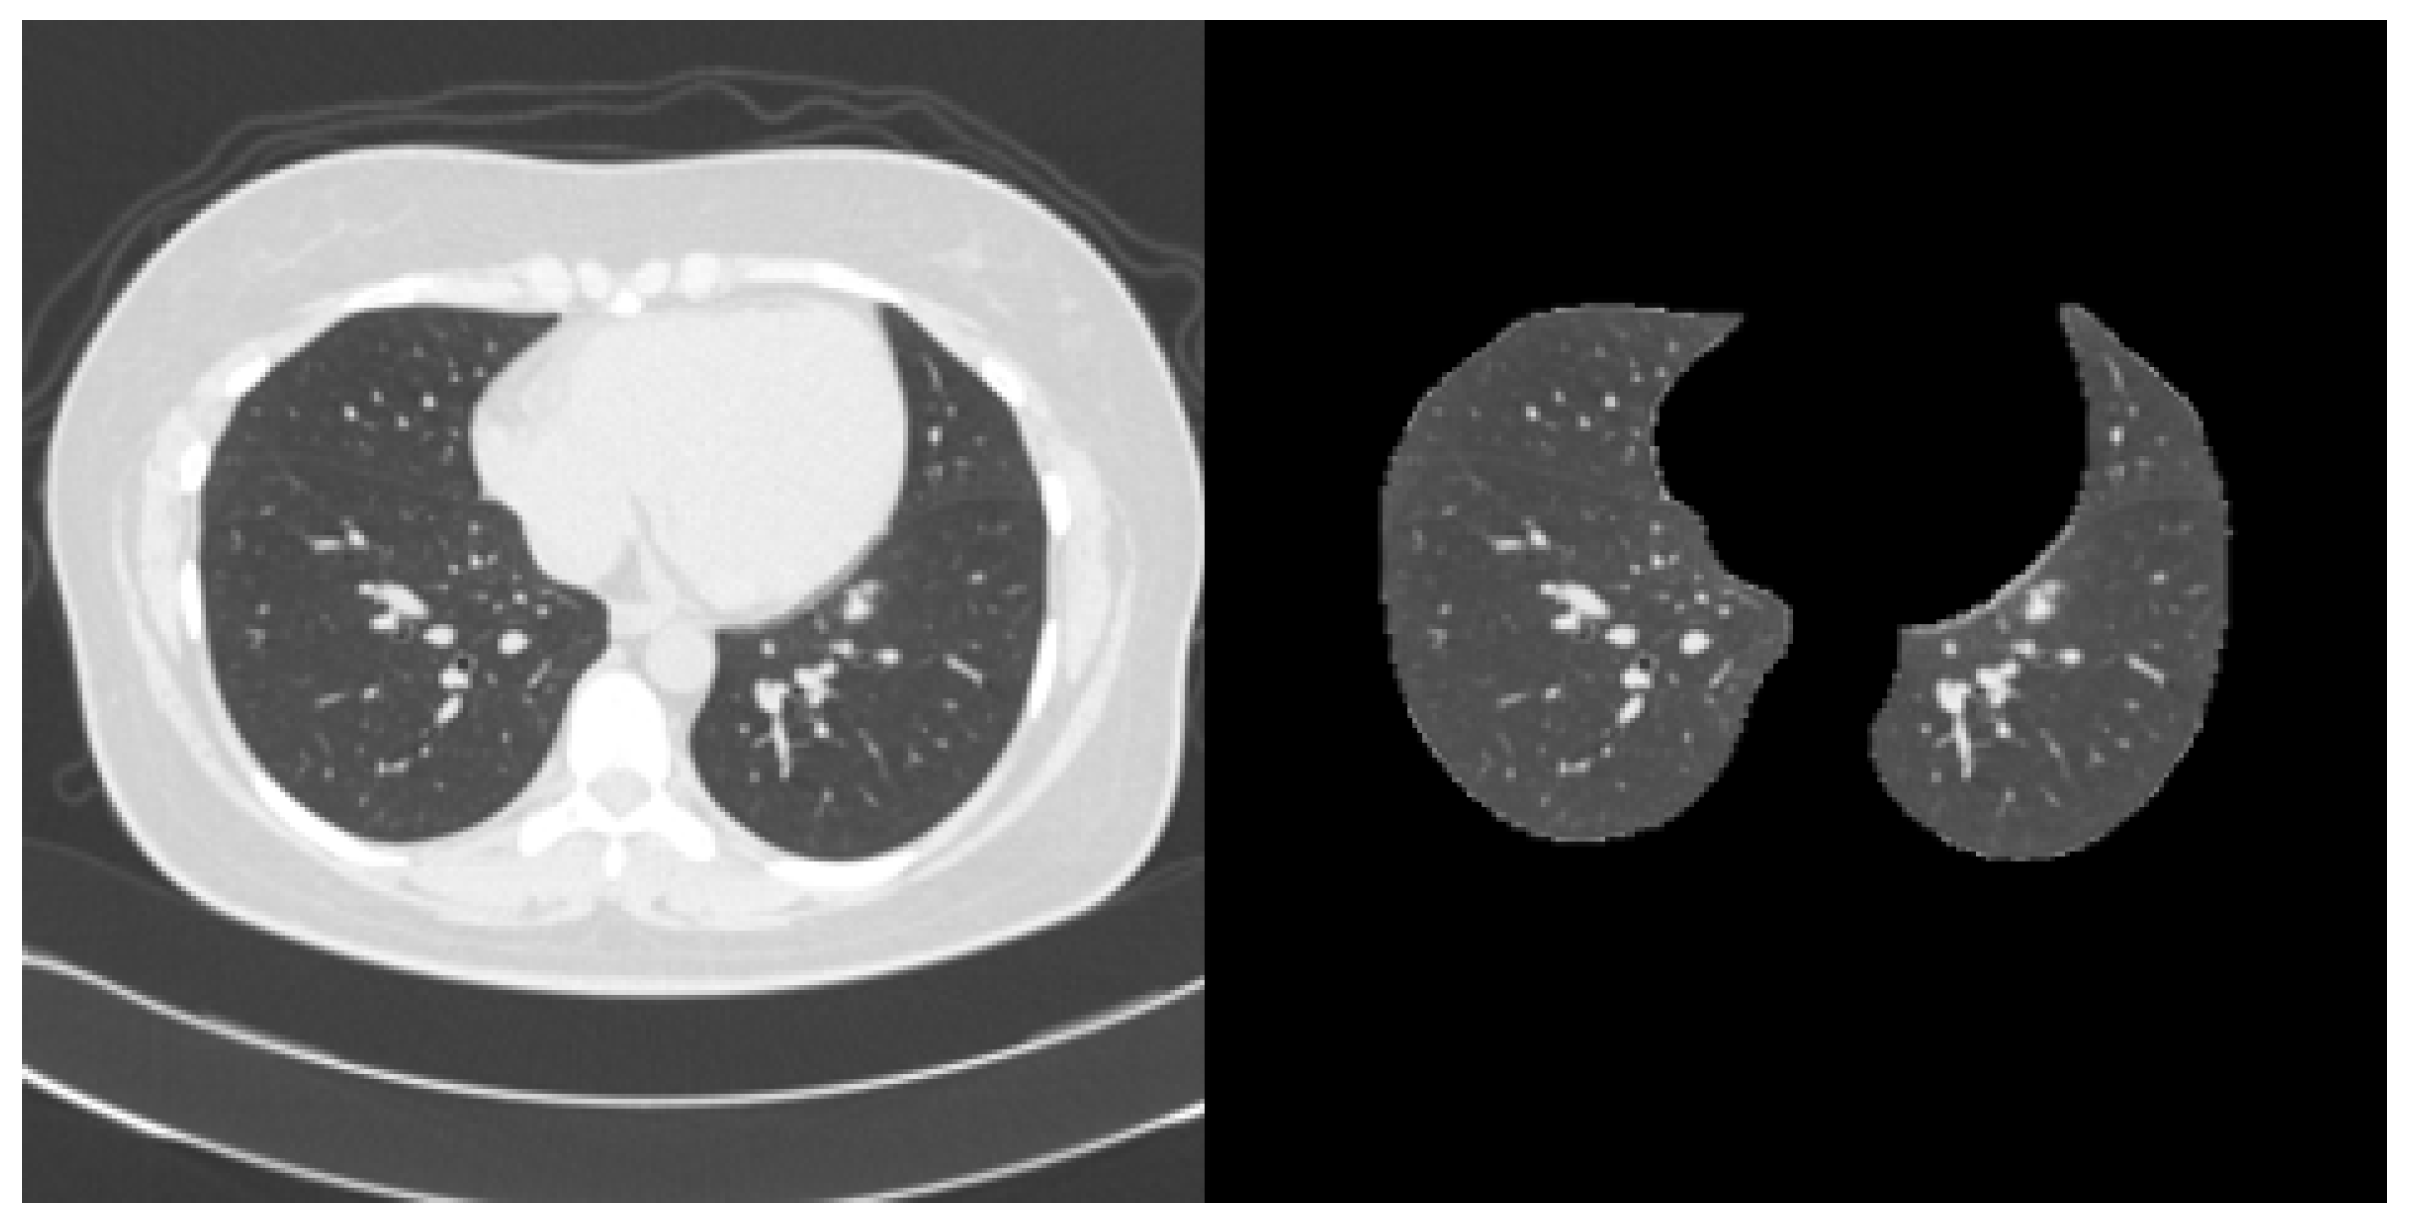
During testing, after a segmentation mask was obtained from each model, the segmentation performance was evaluated on the lung fields. Here, the lung fields were extracted by Lungmask [17]. Despite its simple structure based on a U-net, it demonstrated high lung field extraction performance by pre-training with a large amount of diverse data. An example of the lung field extraction is shown in Figure 8. Then, the segmentation performance was measured by a Dice coefficient, defined by Equation (3):
Dice ( X , Y ) = 2 | X Y | | X | + | Y | ,
where X denotes the opacity region predicted by the model and Y denotes the ground-truth opacity region.

3.3. Results

Table 1 shows the number of trainable weights and the mean Dice coefficients obtained by each method. From Table 1, the multi-channel U-net has the fewest weights for both one-loss and two-loss learning, followed by the multi-head U-net, and finally the U-net. The Dice coefficient also improved in that same order.
The multi-channel U-net shares all the layers, while the multi-head U-net only shares the encoder part. In contrast, the U-net uses a completely separate model for each opacity, with no shared layers. This suggests that using the shared weights as much as possible for training and testing allows the model to better incorporate information from the classes other than the target class. This, in turn, improves segmentation performance for fully annotated data where multiple opacities are contained. Furthermore, the more weights are shared across the classes, the more weights are reduced, making the multi-channel U-net superior from the perspective of GPU memory usage as well. The standard deviation is relatively large because the segmentation difficulty varies across testing data.
Within the same model structures, the two-loss learning consistently shows a better Dice coefficient than the one-loss learning. With the two-loss learning, we not only train the model to segment regions that should be segmented using the positive loss function, but we also train it to avoid segmenting regions that should not be segmented, based on the non-target class annotations using the negative loss function. Therefore, while the ability to correctly classify class “A” as class A remains, the possibility of misclassifying class “B” as class A is reduced, leading to improved performance. The multi-head U-net improves the Dice coefficient from 0.410 to 0.609, while the multi-channel U-net improves it from 0.576 to 0.643. Although the Dice coefficient obtained by the multi-channel U-net is better than the multi-head U-net, the multi-head U-net shows a greater improvement in performance than the multi-channel U-net. This is because the negative loss function contributes to updating the decoding layers to avoid misclassification, while the multi-channel U-net can originally utilize multi-class information for updating the decoding layers through layer sharing.
In our study, we prevented the model from erroneously suppressing true lesions by using only the labeled regions for training and excluding the unlabeled regions from the learning process. This approach ensures that the training of the models is not negatively affected even if unlabeled regions contain lesions other than those annotated in the image. In our experiments, we have shown that the proposed two-loss learning method improves the Dice coefficient, which indicates an enhancement in the segmentation performance of the models. Regarding the suppression of false negatives (missed diagnoses), our study adopts a prediction method that prioritizes positive labeling over negative labeling. This method contributes to preventing an increase in the false-negative rate.
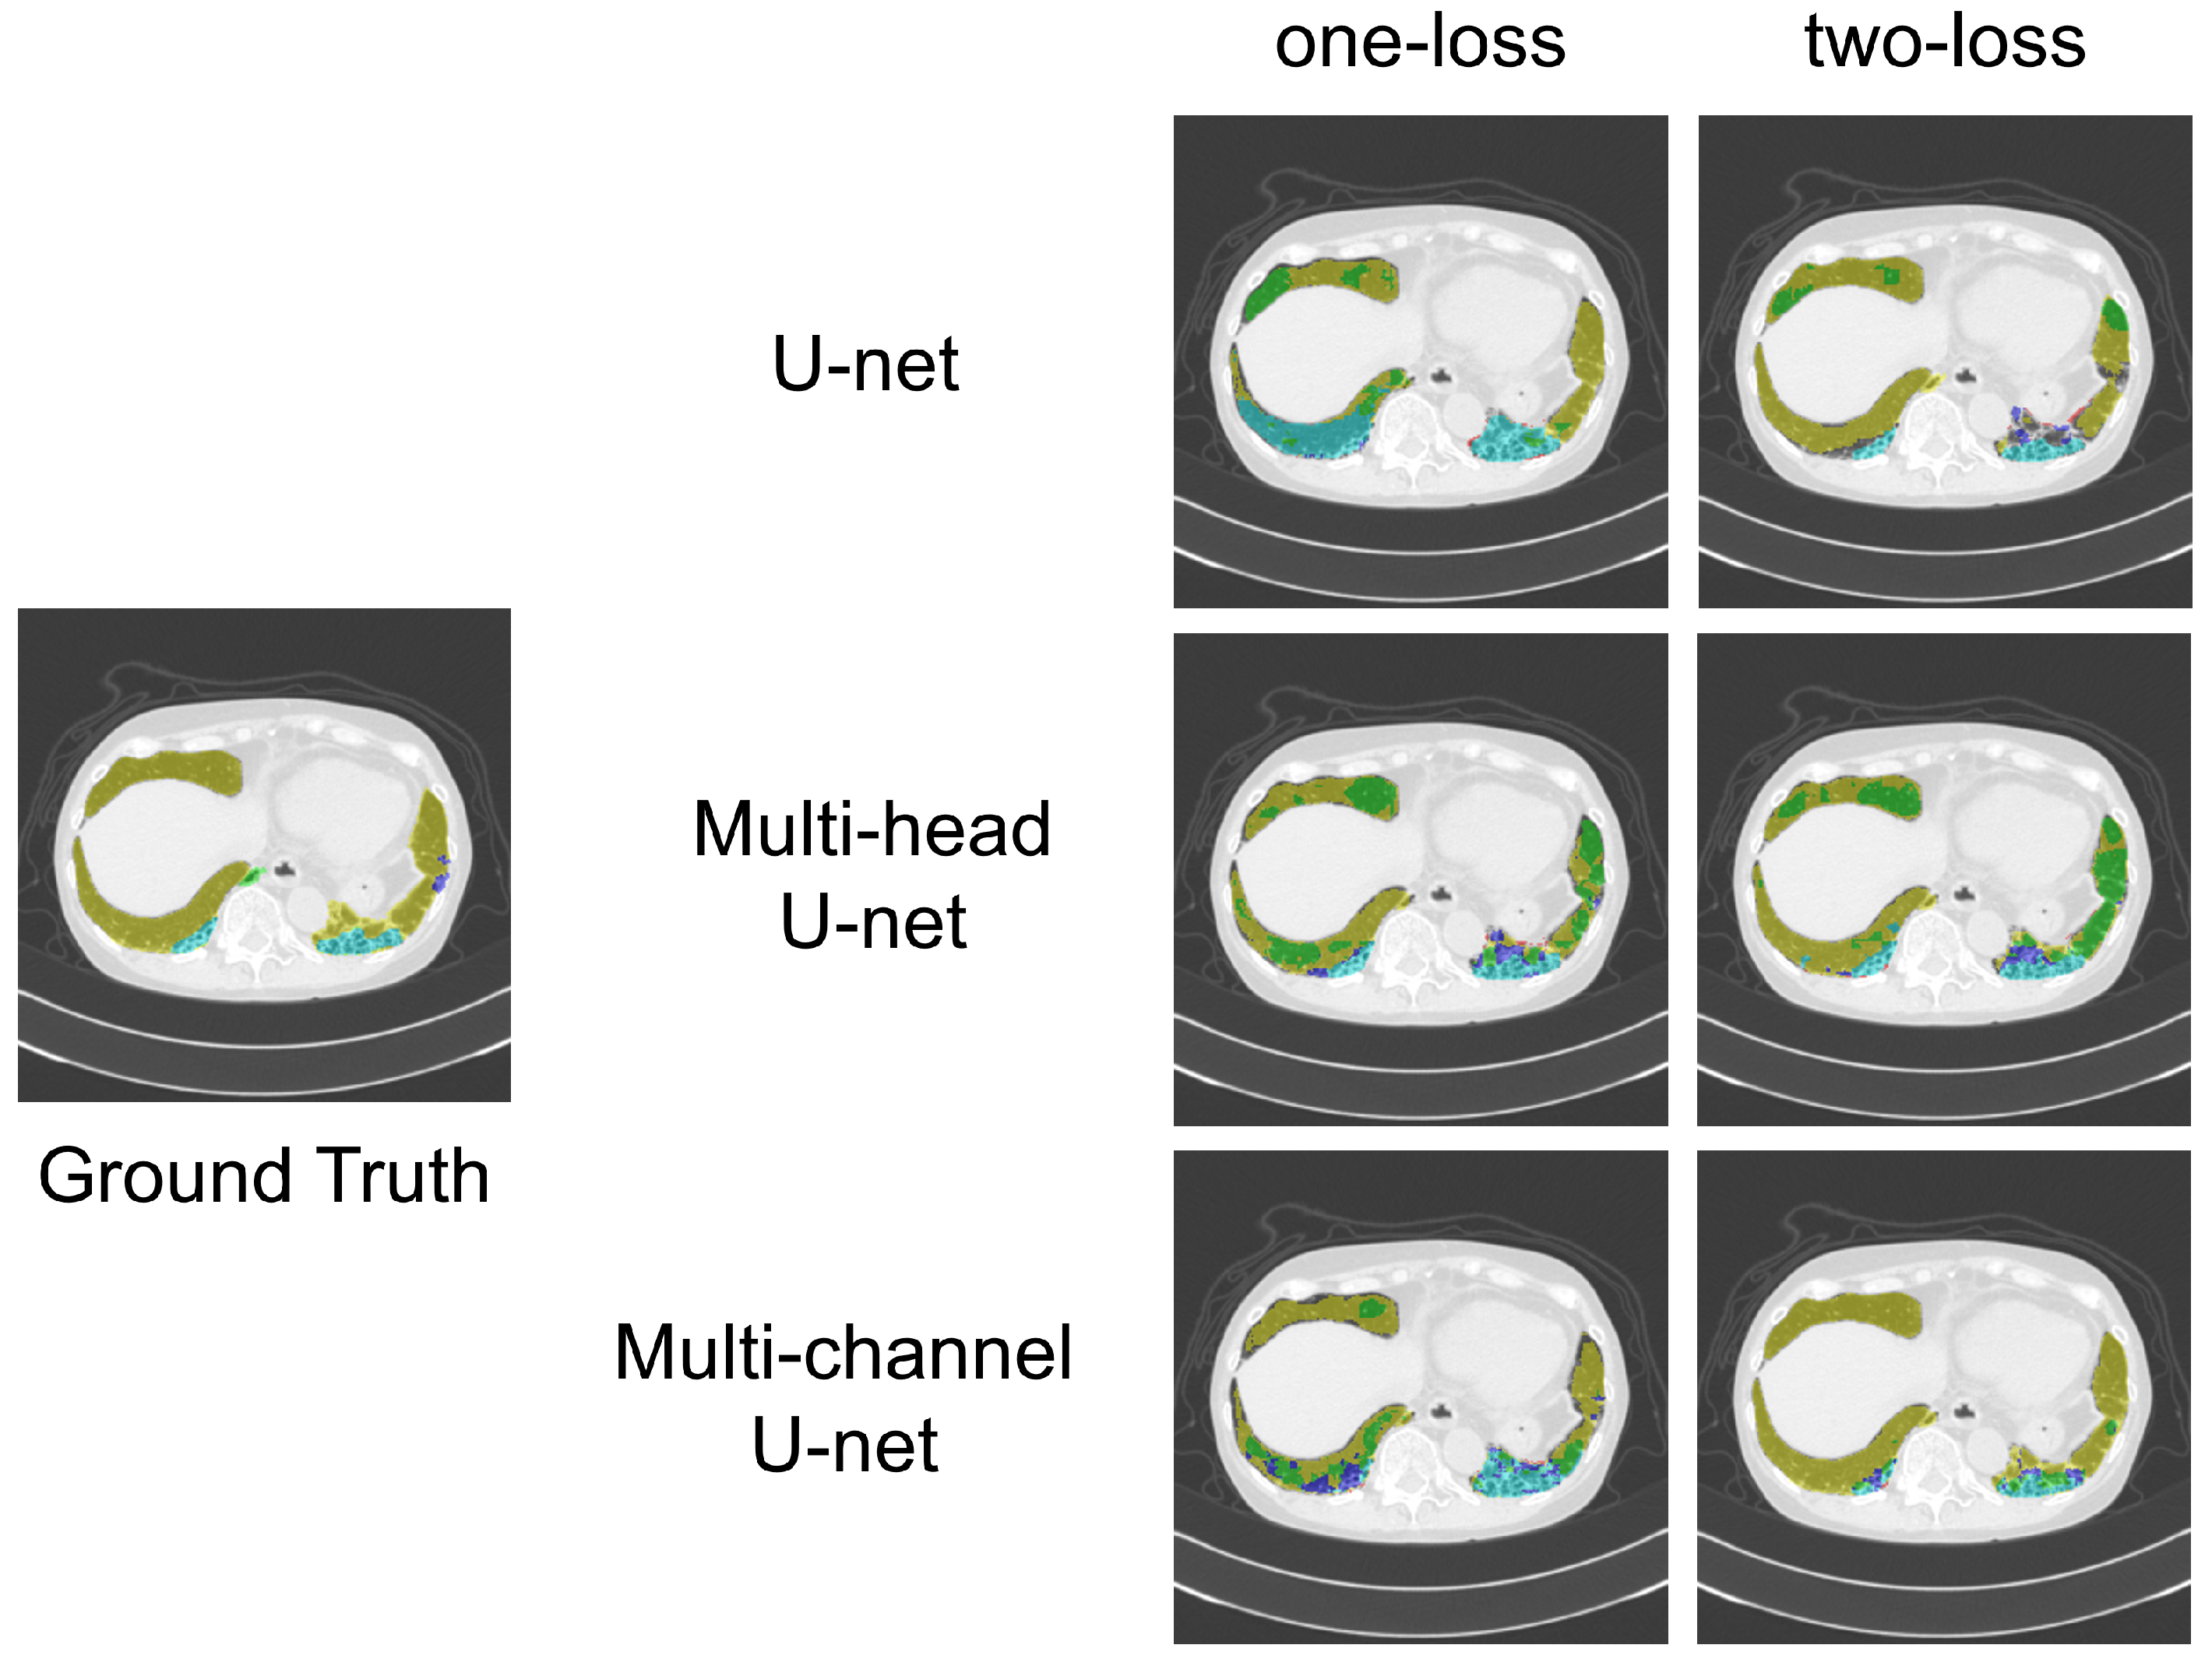
Figure 9 provides an example of the segmentation results obtained by each method, alongside the ground-truth image. From this, we can qualitatively observe that the multi-channel U-net with two-loss learning produced the segmentation mask most similar to the ground truth.
Next, the appropriate number of shared layers is investigated. Both the multi-head and multi-channel U-nets have seven decoding layers, and the multi-head U-net does not share any decoding layers, while the multi-channel U-net shares all the decoding layers. Thus, in this subsection, the segmentation performance is compared by changing the number of shared layers. Table 2 shows the mean Dice coefficients obtained by the models with different numbers of shared decoding layers. When the number of shared layers is zero, it is the multi-head U-net, and when it is seven, it is the multi-channel U-net. From Table 2, we find that the multi-head U-net and multi-channel U-net achieved higher Dice coefficients than the other settings. The models with an intermediate number of shared decoding layers showed lower performance, and in particular, three and four shared layers showed the worst performance. This drop in performance is likely due to the loss of the distinct advantages of both the multi-head and multi-channel architectures. The multi-head structure benefits from having class-independent decoding layers, which allows it to learn weights specialized for each class. Conversely, the multi-channel structure benefits from shared decoding layers across classes, enabling it to learn weights that consider all class-specific features. As the number of shared layers is close to zero, the model gains the advantage of a multi-head structure. As the number is close to seven, it gains the advantage of a multi-channel structure. However, we found that sharing layers to an intermediate extent, such as three or four, can lead to a performance decrease, as it fails to effectively leverage either the class-specific features or the features common to all classes. The above explanation provides an answer to the concern that the extreme weight-sharing scheme of the multi-channel U-net could potentially obscure the distinct features of morphologically different opacities. The results in Table 2 indicate that the multi-channel U-net performed the best, which suggests that the multi-channel U-net can clarify the differences between classes by embedding all class-specific information rather than obscuring the distinct features. Therefore, we conclude that the multi-channel U-net that shares as many decoding layers as possible yields the best results. Note that, for the purpose of evaluating the fundamental segmentation performance, our paper consistently uses the Dice coefficient as the standard evaluation metric for segmentation.
We discuss whether decoupling some of the decoder blocks could alleviate this gradient conflict. As shown in Table 2, the fully shared multi-channel U-net still yielded the best performance. This suggests that the benefit of learning comprehensive features across all classes outweighs any potential negative effects from the gradient conflict. Additionally, to address the possibility that the negative gradients might be stronger than the positive ones, we introduced a weighting scheme into our loss function. Specifically, we weighted the loss from non-target channels by a factor of λ / 4 compared to the target channel to balance the gradients.
We summarize the specific contributions and rationale behind the multi-head and multi-channel U-net designs by outlining their similarities and differences.
  • Similarities: Both the multi-head and multi-channel U-nets were designed to share a common goal: To efficiently encode opacity features for all classes by using a shared encoder.
  • Differences and rationale for choosing the multi-channel U-net: The key differences between the two models lie in their decoders and the way loss functions are backpropagated.
    Multi-head U-net: This design uses separate decoders for each class, which enables the creation of segmentation maps specialized for each class. However, the backpropagation of loss functions from other classes does not reach a given decoder, limiting the flow of information.
    Multi-channel U-net: This design employs a shared decoder. While this may not create decoders specifically tailored to each class, it allows the backpropagation of loss functions from all the classes to the decoder layers.
In our study, which deals with data that have a limited number of annotations, it was crucial to propagate the information from both positive and negative loss functions to as many layers of the network as possible. This ensures sufficient weight learning, which in turn improves segmentation performance. By sharing information across all the classes, our multi-channel approach enables the network to capture a broader range of features present in CT images, rather than specializing in specific opacity information.
From a comparative perspective, experiments with other semi-supervised and self-supervised learning methods, such as pseudo-labeling and contrastive learning, could also be considered. However, our study was specifically focused on evaluating the utility of multi-head and multi-channel architectures against a standard U-net. We also aimed to propose a “two-loss learning method” specifically designed for partially annotated data, and to verify the performance difference with and without our proposed method. Introducing pseudo-labeling or contrastive learning into this specific problem setting, that is, only parts of an image are annotated, would require certain extensions to the existing methods. For this reason, we did not include them as a direct comparison in this paper. In the future, we plan to combine our method with techniques such as pseudo-labeling and contrastive learning to further enhance segmentation performance, rather than simply comparing them. For example, if the generated pseudo-labels are used for partially supervised learning, the performance would be improved. Nevertheless, the comparison with other methods is an important issue, which is a limitation of the paper and should performed as future work.

4. Conclusions

This paper proposed multi-head and multi-channel models designed with a partially supervised learning approach, allowing for effective learning from partially annotated data. We also evaluated the segmentation performance and characteristics of each model. The proposed model structures are based on U-net, and share the encoding and/or the decoding layers for the training of all the classes. The partially supervised learning method uses two loss functions designed to increase or decrease the similarity between the predicted (segmented) and labeled (annotated) regions. From the experimental results of multi-class segmentation of diffuse lung diseases in chest CT images, the multi-channel model trained with two-loss learning showed the best Dice coefficient and required the least number of model weights to be trained. In the future, we would like to further improve the segmentation performance. In [18,19], for example, by inputting a vector that represents a target class, the corresponding segmentation map for that class is generated. We would like to combine this kind of prompt-oriented network structure and the partially supervised learning to verify the applicability to chest CT segmentation, and also reduce the number of weights that should be trained for a limited number of annotated data.

Author Contributions

All the authors directly participated in the preparation of this manuscript and have read and approved the final version submitted. S.M. and T.H. contributed to the construction of the models, experiments, and writing the manuscript. S.I. and S.K. contributed to the data analysis, discussion of the results, and writing of the manuscript. All authors have read and agreed to the published version of the manuscript.

Funding

This research was funded by JSPS KAKENHI Grant Number JP22K12152.

Data Availability Statement

The original contributions presented in this study are included in the article. Further inquiries can be directed to the corresponding author.

Acknowledgments

This article is a revised and expanded version of a paper entitled Segmentation of Diffuse Lung Diseases in Computed Tomography Images Using Partially Supervised Learning: A Model Construction and Learning for Feature Extraction Considering Lung Opacities, which was presented at The Thirtieth International Symposium on Artificial Life and Robotics 2025, Beppu, Oita, Japan, 22–24 January 2025.

Conflicts of Interest

The authors declare no conflicts of interest.

References

  1. Yeasmin, M.N.; Al Amin, M.; Joti, T.J.; Aung, Z.; Azim, M.A. Advances of AI in image-based computer-aided diagnosis: A review. Array 2024, 23, 100357. [Google Scholar] [CrossRef]
  2. Fujita, H. AI-based computer-aided diagnosis (AI-CAD): The latest review to read first. Radiol. Phys. Technol. 2020, 13, 6–19. [Google Scholar] [CrossRef] [PubMed]
  3. Xing, Z.; Ye, T.; Yang, Y.; Liu, G.; Zhu, L. Segmamba: Long-range sequential modeling mamba for 3d medical image segmentation. In Proceedings of the International Conference on Medical Image Computing and Computer-Assisted Intervention, Marrakesh, Morocco, 6–10 October 2024; Springer: Cham, Switzerland, 2024; pp. 578–588. [Google Scholar]
  4. Litjens, G.; Kooi, T.; Bejnordi, B.E.; Setio, A.A.A.; Ciompi, F.; Ghafoorian, M.; van der Laak, J.A.; van Ginneken, B.; Sánchez, C.I. A survey on deep learning in medical image analysis. Med. Image Anal. 2017, 42, 60–88. [Google Scholar] [CrossRef] [PubMed]
  5. Rani, V.; Kumar, M.; Gupta, A.; Sachdeva, M.; Mittal, A.; Kumar, K. Self-supervised learning for medical image analysis: A comprehensive review. Evol. Syst. 2024, 15, 1607–1633. [Google Scholar] [CrossRef]
  6. Zhou, B.; Khosla, A.; Lapedriza, A.; Oliva, A.; Torralba, A. Learning deep features for discriminative localization. In Proceedings of the IEEE Conference on Computer Vision and Pattern Recognition, Las Vegas, NV, USA, 27–30 June 2016; pp. 2921–2929. [Google Scholar]
  7. Gerdprasert, T.; Mabu, S. Pseudo-LabelingWith Contrastive Perturbation Using CNN & ViT for Chest X-ray Classification. In Proceedings of the 2023 IEEE 13th International Workshop on Computational Intelligence and Applications (IWCIA), Hiroshima, Japan, 11–12 November 2023; IEEE: Piscataway, NJ, USA, 2023; pp. 65–69. [Google Scholar]
  8. Nguyen, Q.H.; Hoang, D.A.; Pham, H.V. Combination of 2D and 3D nnU-Net for ground glass opacity segmentation in CT images of Post-COVID-19 patients. Comput. Biol. Med. 2025, 195, 110376. [Google Scholar] [CrossRef] [PubMed]
  9. Akila Agnes, S.; Arun Solomon, A.; Karthick, K. Wavelet U-Net++ for accurate lung nodule segmentation in CT scans: Improving early detection and diagnosis of lung cancer. Biomed. Signal Process. Control 2024, 87, 105509. [Google Scholar] [CrossRef]
  10. Hoang-Thi, T.N.; Vakalopoulou, M.; Christodoulidis, S.; Paragios, N.; Revel, M.P.; Chassagnon, G. Deep learning for lung disease segmentation on CT: Which reconstruction kernel should be used? Diagn. Interv. Imaging 2021, 102, 691–695. [Google Scholar] [CrossRef] [PubMed]
  11. Ronneberger, O.; Fischer, P.; Brox, T. U-net: Convolutional networks for biomedical image segmentation. In Proceedings of the International Conference on Medical Image Computing and Computer-Assisted Intervention, Munich, Germany, 5–9 October 2015; Springer: Cham, Switzerland, 2015; pp. 234–241. [Google Scholar]
  12. Hamada, T.; Mabu, S.; Ikebe, S. Segmentation of Diffuse Lung Diseases in Computed Tomography Images Using Partially Supervised Learning: A Model Construction and Learning for Feature Extraction Considering Lung Opacities. In Proceedings of the Thirtieth International Symposium on Artificial Life and Robotics, Beppu, Japan, 22–24 January 2025. [Google Scholar]
  13. Liu, H.; Xu, Z.; Gao, R.; Li, H.; Wang, J.; Chabin, G.; Oguz, I.; Grbic, S. COSST: Multi-Organ Segmentation With Partially Labeled Datasets Using Comprehensive Supervisions and Self-Training. IEEE Trans. Med. Imaging 2024, 43, 1995–2009. [Google Scholar] [CrossRef] [PubMed]
  14. Xie, Y.; Zhang, J.; Xia, Y.; Shen, C. Learning From Partially Labeled Data for Multi-Organ and Tumor Segmentation. IEEE Trans. Pattern Anal. Mach. Intell. 2023, 45, 14905–14919. [Google Scholar] [CrossRef] [PubMed]
  15. Suzuki, Y.; Kido, S.; Mabu, S.; Yanagawa, M.; Tomiyama, N.; Sato, Y. Segmentation of Diffuse Lung Abnormality Patterns on Computed Tomography Images using Partially Supervised Learning. Adv. Biomed. Eng. 2022, 11, 25–36. [Google Scholar] [CrossRef]
  16. Kingma, D.P.; Ba, J. Adam: A Method for Stochastic Optimization. In Proceedings of the 3rd International Conference on Learning Representations, ICLR 2015, San Diego, CA, USA, 7–9 May 2015; Conference Track Proceedings. Bengio, Y., LeCun, Y., Eds.; 2015. [Google Scholar]
  17. Hofmanninger, J.; Prayer, F.; Pan, J.; Röhrich, S.; Prosch, H.; Langs, G. Automatic lung segmentation in routine imaging is primarily a data diversity problem, not a methodology problem. Eur. Radiol. Exp. 2020, 4, 50. [Google Scholar] [CrossRef] [PubMed]
  18. Deng, R.; Liu, Q.; Cui, C.; Asad, Z.; Yang, H.; Huo, Y. Single Dynamic Network for Multi-label Renal Pathology Image Segmentation. In Proceedings of the 5th International Conference on Medical Imaging with Deep Learning, Zurich, Switzerland, 6–8 July 2022; Konukoglu, E., Menze, B., Venkataraman, A., Baumgartner, C., Dou, Q., Albarqouni, S., Eds.; Proceedings of Machine Learning Research. PMLR: Cambridge, MA, USA, 2022; Volume 172, pp. 304–314. [Google Scholar]
  19. Ye, Y.; Xie, Y.; Zhang, J.; Chen, Z.; Xia, Y. UniSeg: A Prompt-Driven Universal Segmentation Model as Well as A Strong Representation Learner. In Proceedings of the Medical Image Computing and Computer Assisted Intervention—MICCAI 2023, Vancouver, BC, Canada, 8–12 October 2023; Greenspan, H., Madabhushi, A., Mousavi, P., Salcudean, S., Duncan, J., Syeda-Mahmood, T., Taylor, R., Eds.; Springer: Cham, Switzerland, 2023; pp. 508–518. [Google Scholar]
Figure 1. Comparison of the structure of ensemble, multi-head, and multi-channel models.
Applsci 15 10373 g001
Figure 2. Examples of partially annotated images. CON: consolidation (red), EMP: emphysema (green), GGO: ground-glass opacity (blue), HCM: honeycombing (light blue), NOR: normal (yellow).
Applsci 15 10373 g002
Figure 3. Examples of fully annotated images. consolidation (CON): red, emphysema (EMP): green, ground-glass opacity (GGO): blue, honeycombing (HCM): light blue, normal (NOR): yellow.
Applsci 15 10373 g003
Figure 4. Structure of U-net. This is an example of a U-net specialized for consolidation. Thus, if consolidation opacity is contained in the input image, the output mask image shows the consolidation region.
Applsci 15 10373 g004
Figure 5. Structure of multi-head U-net.
Applsci 15 10373 g005
Figure 6. Structure of multi-channel U-net.
Applsci 15 10373 g006
Figure 7. Overview of two-loss learning using positive and negative loss functions of (a) U-net, (b) multi-head U-net, and (c) multi-channel U-net.
Applsci 15 10373 g007
Figure 8. Result of lung field extraction by lungmask. Left: original CT; right: extracted lung field.
Applsci 15 10373 g008
Figure 9. An example of the ground-truth image and segmentation images. consolidation (CON): red, emphysema (EMP): green, ground-glass opacity (GGO): blue, honeycombing (HCM): light blue, normal (NOR): yellow.
Applsci 15 10373 g009
Table 1. The number of trainable weights and mean Dice coefficient (mean ± standard deviation) for testing data.
Model NameNumber of WeightsOne-Loss LearningTwo-Loss Learning
U-net165,849,930 0.383 ± 0.131 0.560 ± 0.205
Multi-head U-net62,667,653 0.410 ± 0.168 0.609 ± 0.156
Multi-channel U-net28,276,869 0.576 ± 0.208 0.643 ± 0.170
Table 2. Mean Dice coefficients (mean ± standard deviation) of the models with different numbers of shared decoding layers.
Number of Shared Decoding LayersDice Coefficient
0 (Multi-head U-net)0. 609 ± 0.156
1 0.564 ± 0.186
2 0.562 ± 0.182
3 0.472 ± 0.213
4 0.482 ± 0.191
5 0.574 ± 0.158
6 0.530 ± 0.156
7 (Multi-channel U-net) 0.643 ± 0.170
Disclaimer/Publisher’s Note: The statements, opinions and data contained in all publications are solely those of the individual author(s) and contributor(s) and not of MDPI and/or the editor(s). MDPI and/or the editor(s) disclaim responsibility for any injury to people or property resulting from any ideas, methods, instructions or products referred to in the content.