Abstract
The creation of simulation-ready digital twins for real-world simulations is hindered by two key challenges: the lack of widely consistent, application-ready open access terrain data and the inadequacy of conventional evaluation metrics to predict practical, in-engine performance. This paper addresses these challenges by presenting an end-to-end, open-data pipeline that generates simulation-ready terrain and procedural 3D objects for the Unity engine. A central finding of this work is that the architecturally advanced Swin2SR transformer exhibits severe statistical instability when applied to Digital Elevation Model (DEM) data. We analyze this instability and introduce a lightweight, computationally efficient stabilization technique adapted from climate science—quantile mapping (qmap)—as a diagnostic remedy which restores the model’s physical plausibility without retraining. To overcome the limitations of pixel-based metrics, we validate our pipeline using a three-axis evaluation framework that integrates data-level self-consistency with application-centric usability metrics measured directly within Unity. Experimental results demonstrate that qmap stabilization dramatically reduces Swin2SR’s large error (a 45% reduction in macro RMSE from 47.4 m to 26.1 m). The complete pipeline, using a robust SwinIR model, delivers excellent in-engine performance, achieving a median object grounding error of 0.30 m and real-time frame rates (≈100 FPS). This study provides a reproducible workflow and underscores a crucial insight for applying AI in scientific domains: domain-specific stabilization and application-centric evaluation are indispensable for the reliable deployment of large-scale vision models.
1. Introduction
Digital Twins (DTs) are increasingly vital for simulation and planning. Their usability hinges on functionally plausible, simulation-ready terrain as the foundational layer [1,2,3]. In applications such as autonomous driving simulation and disaster response, the geomorphological plausibility (i.e., the believability of landforms) and continuity of the terrain directly govern critical performance outcomes [4,5,6].
However, creating usable DTs is hampered by a significant data gap: a globally consistent, open-access Digital Elevation Model (DEM), a gridded map of ground elevation, is not available at the desired 10-m resolution. The most widely used open-access DEM dataset, the Copernicus GLO-30 (COP-30), provides 30 m resolution [7,8,9,10]. Beyond being coarse, it can introduce simulation-breaking artifacts (e.g., blocky discontinuities, non-physical vehicle dynamics) that undermine DT validity.
To bridge this resolution gap, the field has increasingly turned to deep learning-based super-resolution (DEM-SR) to generate high-resolution terrain from low-resolution sources [11,12,13,14]. However, two often-overlooked issues limit practical usability: (i) reliance on pixel metrics (e.g., PSNR) that do not guarantee physics-engine stability [15,16], and (ii) distributional shift when 8-bit, natural-image models are applied to unbounded, floating-point DEMs, yielding statistically unstable, physically implausible outputs [17]. We address these challenges with an end-to-end, open-data pipeline Figure 1.
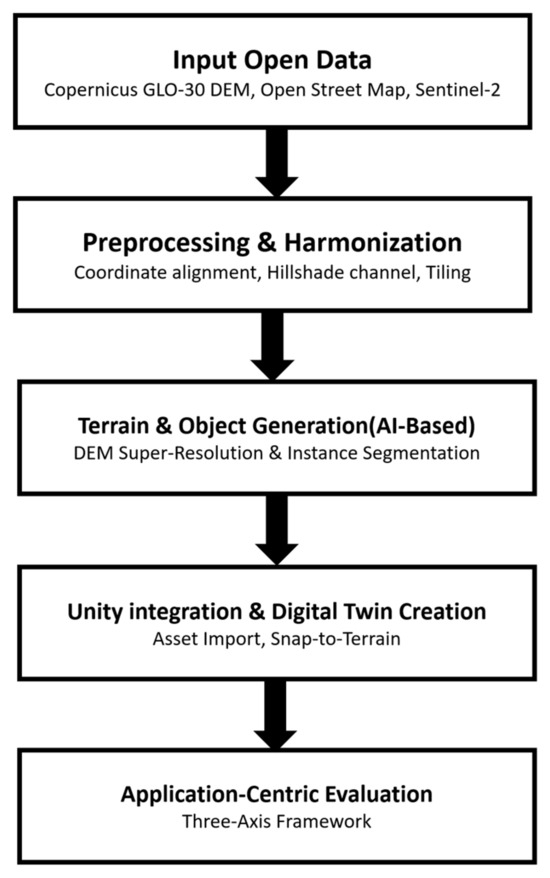
Figure 1.
High-level workflow of the proposed pipeline.
Using this framework, we develop and validate an automated pipeline leveraging open data from COP-30, OpenStreetMap (OSM), and Sentinel-2 [18]. We introduce a three-axis evaluation linking data-level fidelity to Unity in-engine performance [19,20]. To address distributional shift, we diagnose Swin2SR instability and apply lightweight quantile mapping (qmap) stabilization [21,22]. Our contributions are summarized as follows:
- End-to-end pipeline: We present a reproducible, open-data-driven pipeline for generating terrain and procedural object layers, including a codified standard operating procedure (SOP).
- Application-centric evaluation: We propose an evaluation methodology that links abstract image quality to tangible, in-engine performance.
- Model stability analysis and remedy: We systematically analyze the distributional shift of the Swin2SR model on DEM data and propose a new lightweight post-processing technique (qmap + cal) to restore its practical usability.
- Scalable object-layer generation: We integrate an OSM-first approach with instance segmentation assistance to produce lightweight 3D assets accurately registered to the terrain.
Scope of this work. We rely exclusively on open-access data, validate simulation-ready usability via a three-axis framework, and do not claim absolute accuracy against high-precision references (e.g., LiDAR) or cover safety-critical applications. The remainder of this paper is organized as follows. Section 2 reviews the technical background of DEM-SR, the limitations of existing evaluations, and the relationship between SwinIR and Swin2SR. Section 3 details the proposed pipeline, DEM-SR stabilization, object-layer generation, and the three-axis metrics. Section 4 presents quantitative and qualitative results across diverse regions. Section 5 discusses the implications, limitations, and operating guidelines, and Section 6 concludes.
2. Background
This section reviews the technical landscape to establish the context for our proposed pipeline and to justify its key design choices. We first trace the methodological evolution of DEM-SR and highlight the limitations of prevailing evaluation practices, which motivate our application-centric approach. Next, we analyze the relationship between SwinIR and Swin2SR—the core models under comparison—and detail the operational challenges of tiled inference, such as boundary artifacts and distributional shifts. Finally, we compare established approaches for object-layer generation to rationalize our OSM-first strategy and formally introduce the evaluation framework that underpins this work.
2.1. DEM Super-Resolution (DEM-SR)
DEM-SR is typically trained on synthetically downsampled data and judged by pixel-similarity metrics. This overlooks application-critical factors: geomorphological fidelity, tiling boundary artifacts, and statistical stability that govern in-engine performance.
Methodologically, DEM-SR has advanced from classical interpolation, through Convolutional Neural Network (CNN)-based methods, to modern Transformer-based architectures [23]. Transformers, in particular, employ windowed self-attention mechanisms to capture long-range spatial dependencies, resulting in improved coherence and consistency [24]. Table 1 provides a comparative overview of these methods.

Table 1.
Representative DEM-SR methods and operating considerations.
Swin2SR represents a direct architectural advancement over SwinIR, designed to improve training stability and reduce data dependency, and is therefore theoretically expected to deliver superior performance [25]. However, since these models are predominantly optimized for 8-bit natural images, they can exhibit unexpected behaviors when applied to DEMs, which consist of unbounded physical data. Two technical challenges are particularly critical. First, processing large geographic areas in tiles can introduce boundary artifacts due to normalization layers and edge effects [26]. Second, vision models applied to remote sensing data often suffer from distributional shift, where the model generates outputs with statistical properties that deviate significantly from the source distribution, thereby distorting the prediction’s scale and bias [27]. These challenges directly motivate the stabilization post-processing technique proposed in this study. In our experiments, vanilla Swin2SR is included as a diagnostic stress-test for distribution-shift on DEMs, while SwinIR (+cal) remains the recommended model for deployment under open-data constraints.
Meanwhile, incorporating auxiliary information, such as a hillshade (HS) map, as an additional input channel is a form of explicit feature engineering. This provides the model with first-order derivative cues (i.e., slope information), promoting the preservation of geomorphologically critical features such as ridgelines and valleys. Building on this review, we adopt SwinIR as a robust baseline, diagnose the instabilities of Swin2SR on DEM data, and establish an operational standard that addresses both tiling artifacts and distributional shift.
2.2. Object Layer Generation: Extraction and Procedural Modeling
The generation of object layers for digital twins (e.g., buildings and roads) involves three main steps: extraction, vectorization, and 3D procedural modeling. While deep learning–based instance segmentation (IS) has proven effective in extracting footprints from satellite imagery, our pipeline prioritizes OpenStreetMap (OSM) as the primary data source. OSM is selected for its global coverage and, importantly, its built-in topological structure, which is essential for constructing connected road networks and coherent urban layouts with minimal post-processing [28]. This strategy improves the scalability and consistency of our pipeline while reducing computational overhead.
To address regions with sparse or missing OSM coverage, Sentinel-2–based IS is employed in a supplementary role for gap filling and quality assurance (QA). Several segmentation paradigms are considered. U-Net has been widely applied in biomedical and remote sensing domains for semantic segmentation [29]. DeepLab and its variants (e.g., DeepLabv3+) employ atrous convolution and encoder–decoder refinements to capture multiscale context and sharpen boundaries [30,31]. Mask R-CNN extends region-based CNNs with a mask prediction branch, providing accurate instance-level extraction [32]. More recently, prompt-based models such as the Segment Anything Model (SAM) have demonstrated strong cross-domain mask proposal capabilities, making them valuable for QA and data-scarce contexts [33].
The vectorized footprints from both OSM and IS outputs are then converted into lightweight 3D meshes via extrusion and spline-based procedural modeling. Here, “lightweight” refers to minimizing polygon count while preserving geometric fidelity, enabling efficient rendering in real-time environments such as Unity. This ensures not only computational efficiency but also seamless integration into the digital twin framework. A comparative overview of the OSM-first approach is provided in Table 2. Given the non-negotiable requirement for routable, topologically consistent road networks in DTs, we adopt an OSM-first policy; instance segmentation is used only as a gap-filling and QA-assist, not as a standalone, segmentation-first pipeline.
Table 2.
Segmentation, vectorization, and proceduralization—approach comparison and DT suitability.
2.3. Evaluation Framing and Operating Standards
To overcome the limitations of conventional metrics, we design our evaluation around a three-axis framework (introduced in Section 1). This framework provides a com-prehensive assessment that links low-level data fidelity (self-consistency) and geomor-phological accuracy (slope and curvature) with high-level functional performance in Uni-ty (usability metrics) [34]. Table 3 highlights how our design choices differ from prior practices, such as those overly reliant on pixel-centric metrics or segmentation-first object generation, and summarizes the specific improvements contributed by each element of the pipeline [35].
Table 3.
Differences from prior practice and improvements in this work.
- Self-consistency: We downscale the 10 m predictions to 30 m via area-averaging and then assess their statistical consistency against the original COP-30 source using Root Mean Square Error (RMSE), Mean Absolute Error (MAE), Bias, R2, and Slope metrics.
- Geomorphometry: We compute the RMSE of slope and curvature on a common Universal Transverse Mercator (UTM) grid to quantify the preservation of terrain morphology.
- Unity-native usability: We directly record in-engine metrics within Unity—including z-offset, lateral-offset, seam score, roll-RMSE, frame rate (frames per second, FPS), and collision rate—to validate the practical applicability of the final digital twin assets.
3. Methodology
3.1. End-to-End Pipeline Overview
This study details a pipeline that initiates by applying ×3 DEM-SR to COP-30 data, generating a nominal 10 m DEM. In parallel, it constructs 3D object layers (buildings and roads) from open vector data (OSM) for the same regions. The resulting terrain and object assets are then integrated into Unity, where their practical applicability is validated using the three-axis evaluation framework. Figure 2 provides a visual representation of this entire workflow, detailing the progression from (a) DEM-SR, through (b) OSM-centric object layer generation, to (c) Unity integration and native evaluation. A central objective is to analyze the instability exhibited by the Swin2SR model and to verify the effectiveness of our proposed stabilization techniques. Scalability: the pipeline is tile-parallel and stateless, with all stages operating on streamed chunks (no global mosaicking), so end-to-end throughput scales linearly with CPU/GPU workers and I/O bandwidth.
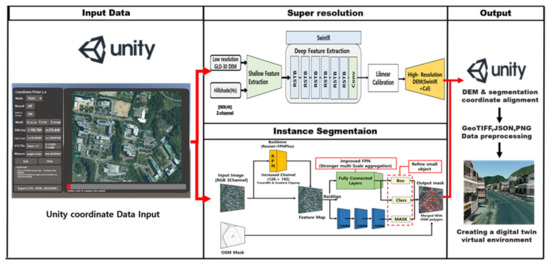
Figure 2.
Overall System Architecture for DEM Super-Resolution and Instance Segmentation.
3.2. Data Harmonization and Preprocessing
To ensure the robustness of our findings across diverse geomorphological settings, we selected six Regions of Interest (ROIs), including urban, mountainous, and coastal areas Figure 3.
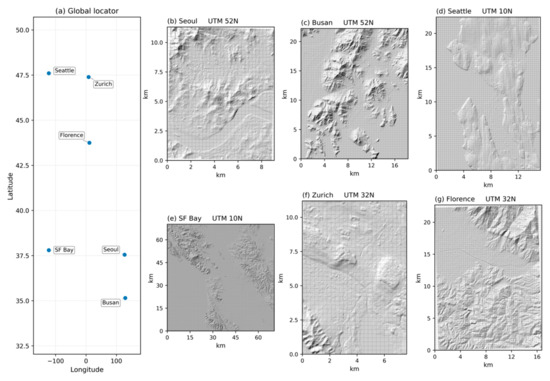
Figure 3.
Selected ROIs and grid configuration.
For consistency, all data preprocessing and evaluations conformed to the WGS 84 reference frame and the UTM projection, and to the EGM2008 geoid (vertical datum) [36,37,38]. All raster data were aligned using GDAL pixel snapping [39]. The hillshade (HS) channel was generated in UTM space with fixed parameters (Table 4). To minimize misalignment, we correct residual shifts greater than 0.5 pixel using normalized cross-correlation (NCC)–based sub-pixel registration before sampling. To mitigate boundary artifacts during tiled inference, we adopted Hann window feathering over tile overlaps (64-pixel overlap, symmetric Hann-weighted mean) as a standard operating procedure (SOP) [40]. Table 4 summarizes the core parameters and tools used for these procedures.
Table 4.
Key settings for preprocessing and tiling.
3.3. DEM-SR and Stabilization Post-Processing Chain
Our DEM-SR stage performs a ×3 upsampling using a two-channel input (DEM + HS). As established in Section 2, state-of-the-art vision models can cause severe distributional shifts when applied to unbounded physical data like DEMs. To address these instabilities, we introduce and validate the following stabilization post-processing chain.
We adapt quantile mapping (qmap), a technique widely used in climate science, as a post-processing step [41,42,43]. In this context, qmap serves as a physical constraint. Conceptually, the process is analogous to color grading a photograph by forcing its color histogram to match a reference, thereby preserving fine details while correcting the overall distribution. It uses the cumulative distribution function (CDF) of the original coarse DEM as a target lookup table and transfers this distribution to the SR output. This re-anchors the model output to a realistic statistical distribution, mitigating Swin2SR’s instability.
Operationally, this is implemented as follows, addressing the reviewer’s query on implementation (1): First, we generate a 30 m downscaled version of the 10 m SR prediction (which we call SR_30m) using area-averaging. Second, we compute the value percentiles (using 100 quantiles) from this SR_30m (as the source distribution, xp) and the original 30 m COP-30 DEM (which we call GT_30m) (as the target distribution, yp). Finally, the np.interp function is used to map the original 10 m SR output (which we call SR_10m), pixel by pixel, to the new distribution based on this xp-to-yp lookup table.
While qmap corrects the overall distribution, linear calibration (cal) fine-tunes residual bias and slope errors, as shown in Equation (1):
Here, is the SR prediction (output from the previous qmap step, if applicable). The parameters (scale) and (bias) are not arbitrary but are derived empirically for each ROI, addressing the reviewer’s queries (2) and (3). We perform an Ordinary Least Squares (OLS) linear regression between the 30 m downscaled SR output (SR_30m) and the 30 m COP-30 source DEM (GT_30m) to find the slope (a) and intercept (b) of the best-fit line, which has the form SR_30m = a GT_30m + b.
The calibration in Equation (1) then applies the inverse of this detected systematic error: s is set to (1/a), and c is set to (−b/a). This process fine-tunes the output, forcing its aggregate slope and bias to align more closely with the original source data Note that qmap was applied only to Swin2SR as a diagnostic stabilization; SwinIR results are reported without qmap (cal only) because no instability was observed. To systematically evaluate these stabilization techniques, we compare five model configurations under identical conditions Table 5.
Table 5.
DEM-SR configurations.
3.4. Object-Layer Generation and Unity Integration
The procedural generation of object layers and their grounding rules are crucial for creating coherent virtual environments. Figure 4 illustrates this workflow, from initial extrusion to the final application of a Snap-to-Terrain rule.
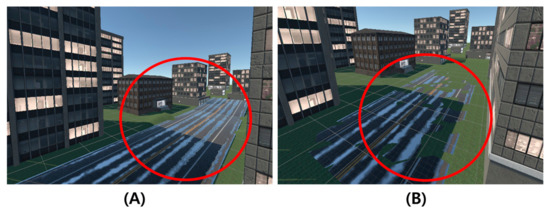
Figure 4.
Procedural outputs: (A) Building extrusion and road spline generation; (B) Snap-to-Terrain residual visualization.
Buildings. Starting from OSM polygons, we generate meshes by removing topological errors and performing vertical extrusion. Heights are determined primarily from OSM tags or, if unavailable, through a locally adjusted heuristic. Height-heuristic policy: when OSM height or levels are missing, we apply a fixed per-level height calibrated on a small local sample and cap extreme outliers using building-footprint area and neighborhood percentiles, with all heuristic heights treated as relative to local ground rather than absolute elevations.
Roads. OSM centerlines are resampled, and topological errors are repaired using skeletonization and graph-based methods. The cleaned lines are then proceduralized into Bézier ribbon meshes.
Snap-to-Terrain. The planimetric coordinates of all procedural meshes are preserved, while each vertex’s elevation is reset by bilinear sampling from the 10 m SR-DEM. This ensures objects are correctly grounded on the high-resolution terrain, with additional constraints to prevent artifacts like mesh twisting. Grounding is performed only after CRS/datum consistency is verified; elevations are sampled from the SR-DEM referenced to EGM2008, and any OSM-provided heights are converted to the same datum, while heuristic heights (when tags are absent) are treated relative to local ground.
Auxiliary Segmentation. While OSM is the primary source, an IS branch is employed to fill OSM gaps and support QA. We adopt Mask R-CNN with an enhanced FPNPlus backbone. The model is specifically tuned to improve recall for small buildings and to ensure numerical stability during training in a small-batch regime [44].
Design Rationale. These settings are chosen to capture small buildings reliably while maintaining stability. Applying identical vectorization and extrusion rules to both OSM and segmentation outputs preserves pipeline uniformity. The final object layers are exported as GeoJSON, imported into Unity, and reconstructed as meshes, with rendering profiles held constant for fair comparisons [45].
3.5. Metrics and Logging Principles
Our evaluation adheres to the three-axis framework, which maps directly to the quantitative results in Section 4. The three-axes are:
- Self-consistency: We measure the statistical agreement of the downscaled SR output with the original source data using metrics like RMSE, MAE, and Bias.
- Geomorphometry: We assess morphology preservation by computing the RMSE of slope and curvature on a common UTM grid.
- Unity-native usability: We validate practical applicability by directly recording in-engine metrics like z-offset, roll-RMSE, and FPS.
All quantitative DEM-SR evaluations are performed on the five configurations specified in Table 5. Statistical significance is assessed using the paired Wilcoxon signed-rank test, with p-values corrected using the Holm–Bonferroni method [46,47]. We also report an effect size (rank-biserial) alongside corrected p-values to convey practical significance beyond statistical significance.
Unless stated otherwise, DEM errors are computed on the native 30 m COP-30 grid after aligning 10 m predictions to 30 m via area-weighted averaging (≥90% valid coverage per cell; no pre-/post-smoothing). All rasters are compared in a common horizontal CRS and the EGM2008 vertical datum, and COP-30 voids remain masked. We report macro RMSE (the unweighted mean of per-ROI RMSEs) and micro RMSE (a single RMSE after pooling all valid 30 m cells across ROIs).
4. Experiments and Results
4.1. Experimental Setup
All experiments were conducted on a system featuring an ASUS ROG Strix GeForce RTX 4090 (OC, 24 GB; ASUSTeK Computer Inc., Taipei, Taiwan; GPU chipset by NVIDIA Corporation, Santa Clara, CA, USA), a Ryzen 9–class CPU, and 128 GB of RAM, using Python 3.10, PyTorch 2.3.1, GDAL 3.8, and Unity 2022 LTS. To ensure reproducibility, all relevant random seeds were fixed. The input DEM was COP-30; all data layers were harmonized to the WGS84/UTM and EGM2008 vertical datum (Section 3). ROIs were selected to span heterogeneous geomorphologies (urban, mountainous, coastal) with sufficient tiles for paired comparison, increasing the sensitivity of nonparametric tests. The DEM-SR comparisons were performed using the five model configurations designed in Section 3. All configurations shared the same two-channel input, tiling protocol, and boundary handling. The object-to-Unity pipeline used OSM as the primary data source, with Sentinel-2 serving an auxiliary role for QA and gap filling. Final objects were placed on the 10 m SR-DEM using the Snap-to-Terrain rule.
4.2. Quantitative Evaluation of DEM-SR
This experiment was designed to test our central hypothesis regarding the distributional shift in next-generation vision models and to quantify the effectiveness of the proposed stabilization methods. To provide a fair assessment that accounts for variations in the area of each ROI, we report both macro RMSE (the simple mean over ROIs) and micro RMSE (a pixel-count–weighted average).
The results, visualized in Figure 5, provide stark evidence of model instability.
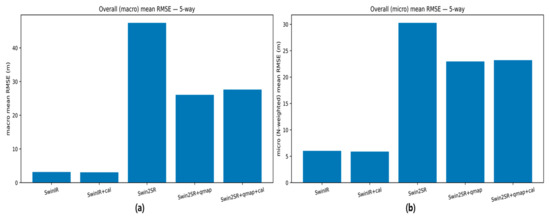
Figure 5.
Global average RMSE for the five DEM-SR configurations, showing (a) macro (unweighted) and (b) micro (pixel-weighted) averages.
The baseline SwinIR performed robustly, achieving a macro RMSE of 3.154 m, a result well within the typical vertical accuracy requirements for urban planning. In stark contrast, the vanilla Swin2SR configuration, despite its architectural advancements, exhibited large errors (macro RMSE 47.421 m), indicating poor preservation of large-scale elevation statistics.
However, applying our proposed qmap stabilization technique dramatically rectified this issue, reducing Swin2SR’s macro RMSE by 45.0% to 26.062 m. This demonstrates that qmap is decisive in restoring the practical viability of Swin2SR for DEM data.
To provide a complete picture of the stabilization chain and address the reviewer’s query regarding the cal step, Table 6 details the full self-consistency metrics. As the reviewer correctly noted from Figure 5, applying cal (e.g., in SwinIR + cal) results in a slight increase in the overall RMSE (from 3.154 m to 3.221 m). This is an expected and acceptable trade-off.
Table 6.
Comprehensive self-consistency metrics for the five DEM-SR configurations (Macro-average).
The goal of cal is not to optimize RMSE, but to correct the residual systematic Bias and Slope errors, which are critical for geomorphological fidelity. As shown in Table 6, the baseline SwinIR model, while having the lowest RMSE, exhibits a residual bias of −0.160 m and a slope of 0.97. The SwinIR + cal configuration corrects this, forcing the Bias to 0.000 m and the Slope to 1.00 (by design of the OLS inverse, as described in Section 3.3). This ensures the large-scale form of the terrain is statistically correct, which is a crucial prerequisite for the subsequent geomorphometry (Axis 2) and usability (Axis 3) evaluations. The minor 0.067 m increase in RMSE is a negligible cost for eliminating this significant systematic bias.
To further validate the necessity of a domain-specific approach, we performed a targeted evaluation against ESRGAN, a leading generic image super-resolution architecture [48]. As detailed in the expanded Table 6, ESRGAN failed significantly, exhibiting a macro-average RMSE of 12.537 m and a systematic bias of 5.511 m. This failure, which is notably worse than the stability observed in the robust SwinIR model, serves as compelling evidence that models optimized for generic image domains are fundamentally unsuitable for unbounded physical data (DEM) without domain-specific stabilization. This strongly validates our focus on stability diagnostics over generic benchmarking.
The per-ROI results, detailed in Figure 6, show this trend holds consistently across diverse geographic regions.
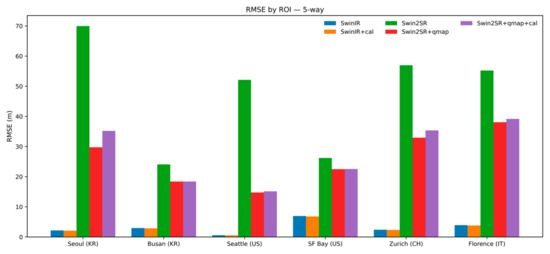
Figure 6.
Per-ROI comparison of macro RMSE across the five DEM-SR configurations.
Figure 7 provides a qualitative verification of these findings. The original COP-30 input (a) shows distinct “blocky” artifacts. Our proposed SwinIR + cal pipeline (b) successfully eliminates these, generating plausible, high-frequency details while preserving critical geomorphological features. The stabilized Swin2SR + qmap + cal output (c) also yields a smooth surface but tends to oversmooth the finest terrain features compared to SwinIR + cal. This visually confirms that SwinIR + cal excels in preserving detailed morphology. Although the calibration step can slightly increase RMSE, it removes residual bias and forces the overall slope to unity by construction, which is more relevant to Axis-2/3 stability than a small RMSE gain. Even after qmap stabilization, Swin2SR showed no consistent advantage over SwinIR (+cal) in Axis-2 (slope/curvature RMSE) or Axis-3 (Unity metrics; see Section 4.4), so we adopt SwinIR (+cal) as the final model for deployment.
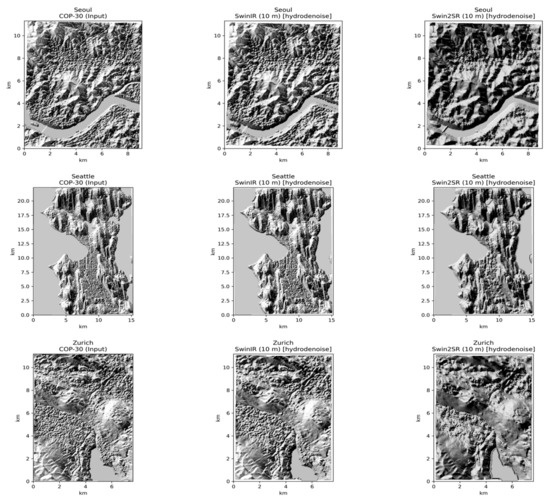
Figure 7.
Qualitative comparison of DEM-SR outputs (10 m). Left: COP-30 (input). Middle: SwinIR + cal (10 m). Right: Swin2SR + qmap + cal (10 m).
4.3. Object-Layer Performance
Our pipeline’s OSM-first policy is complemented by an auxiliary instance-segmentation (IS) module that targets building footprints. The IS branch is designed to (i) recover small objects missed by vector sources and (ii) sharpen polygon boundaries used by downstream topology. We evaluate an enhanced Mask R-CNN on a representative building-footprint dataset under a controlled protocol. We fix NumPy/PyTorch/CUDA seeds, use per-channel z-score normalization (means/stds; see Table 7), and adopt a 70/15/15 train–val–test split with tile-level stratification to prevent geographic leakage. Unless noted, images are rendered identically across conditions so that “OSM-only” vs. “OSM + IS” constitutes a clean ablation on the same tiles. All training hyperparameters for the IS module—backbone/FPN, anchor scales/ratios, ROI sampling, optimizer/schedule, stabilization tricks—are summarized in Table 7.
Table 7.
Training hyperparameters for the Mask R-CNN IS module.
Reproducibility. We fixed NumPy/PyTorch/CUDA seeds, used per-channel z-score normalization, and adopted a 70/15/15 train–val–test split with tile-level stratification to avoid leakage. Under identical tiles and rendering, the auxiliary IS branch increased object recall by 11 percentage points and reduced building-shape error (Hausdorff distance) by 42%. A segmentation-first variant was not pursued due to the lack of global topology continuity required for routable networks at scale.
On this dataset, our final model achieved a mean Average Precision (AP) of 57.78, a standard benchmark for object detection and instance segmentation accuracy. This result significantly outperformed a baseline U-Net (49.12 AP) and a baseline Mask R-CNN implementation (55.10 AP). These cross-model comparisons provide external context; the within-Mask-R-CNN ablations quantifying where the gains come from are reported in Table 8 at commonly reported thresholds (AP50, AP75) and mIoU—covering (i) channel expansion (FPNPlus-128) for small-object features, (ii) Frozen BatchNorm + gradient clipping for stable convergence under small batch sizes, and (iii) RPN/ROI hyperparameter tuning to improve recall on small buildings.
Table 8.
Performance gains from incremental improvements to the Mask R-CNN backbone for building segmentation.
Qualitative comparisons in Figure 8 further show that the proposed model delineates building boundaries more cleanly than the baseline, especially around corners and narrow alleys where under-segmentation or mask bleeding often occurs. In summary, the IS module meaningfully complements the OSM-centric pipeline: it improves the geometric fidelity of object layers without sacrificing runtime practicality, and it provides a reproducible training recipe—captured in Table 7—that other groups can adopt or extend.
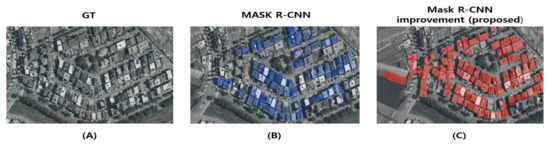
Figure 8.
Comparison of Building Extraction Results ((A) Ground Truth (GT), (B) Mask R-CNN Baseline, (C) Proposed Mask R-CNN Improvement).
4.4. Unity Integration and Application-Centric Evaluation
To complete the three-axis evaluation, we integrated the generated assets into Unity and measured their in-engine performance. The terrain was produced with the best-performing and most stable model, SwinIR + cal.
Under a fixed rendering profile on an RTX 4090, the resulting digital-twin environment sustained real-time operation at 100 ± 8 FPS. Temporal check: we conducted short horizon runs with moderate agents and weather enabled and observed frame rates within the 72–90 FPS interactive range, while leaving long-duration stress testing to future work. To contextualize these numbers, the frame rate exceeds widely cited interactive/VR targets of roughly 72–90 FPS, and the reported lateral-offset (~0.65 m) is well within a typical lane width of about 3.7 m, while the 0.30 m building z-offset is not intended for safety-critical autonomous-vehicle simulation but is adequate for general planning and visualization. It is important to contextualize this metric: this value represents a baseline performance, which aligns with widely cited interactive/VR performance targets (≥72–90 FPS) aand provides sufficient headroom for dynamic content [49,50]. The application-centric metrics in Table 9 indicate practical usability.
Table 9.
Unity-native metrics (mean ± SD unless noted).
The median building grounding error (z-offset) of 0.30 m is a key finding. While this is insufficient for high-precision applications like autonomous vehicle sensor simulation, it is comfortably below meter-level positional/height discussions commonly associated with Level of Detail (LoD) 2-scale city models [51]. The road lateral-offset of 0.65 ± 0.12 m can be interpreted against typical lane-width practice (≈3.7 m) and the tight deviation bounds used in lane-keeping test protocols, supporting its practical acceptability in driving simulations [52,53]. A high seam score (0.91 ± 0.03) and low roll-RMSE (1.58° ± 0.21°) verify terrain continuity and stability. Overall, these findings support the premise that high geomorphological fidelity at the data level translates into superior in-engine usability, while maintaining interactivity near ~100 FPS.
A post hoc inspection indicates that the residual 3–4% collision rate mainly arises from three sources. Collision detection protocol: collisions are counted when any mesh vertex or collider sample penetrates the terrain surface beyond the engine’s contact offset at a fixed evaluation stride (uniform along roads and per-building footprint), with NoData areas excluded. First, terrain–object misalignment at tile seams or at steep local slopes can introduce minor negative z spikes. Second, mesh and collider quality issues can trigger penetrations, including thin facets, non-manifold edges, or pivots that are not placed at the physical base. Third, Unity physics defaults can be insufficient for our assets and scales, including contact offset, solver iterations, and the absence of continuous collision detection for fast movers. We mitigate these issues with three measures. We apply slope-aware anchoring that snaps each building base to the local median DEM sample within its footprint. We enforce collider hygiene through a pivot-at-base convention, convex colliders for small or thin assets, and removal of non-manifold triangles. We also tune physics parameters through a slightly increased contact offset, a higher solver-iteration budget, and enabling continuous collision detection for fast movers. These measures target terrain, asset, and engine factors respectively and remain compatible with the fixed rendering profile reported above.
Dynamic workload context. Although our primary measurements used a fixed rendering profile, we also conducted a simple budget analysis for dynamic workloads. With typical agent and weather systems enabled at moderate density, the scene retained a frame-time reserve consistent with maintaining 72–90 FPS; an exhaustive stress test is left to future work.
Furthermore, we quantified the value of our hybrid OSM + IS approach. This test was designed to validate the marginal contribution of the supplementary IS module (used for gap-filling buildings) to the primary OSM-first pipeline. When we augmented OSM scenes with IS outputs, object-level accuracy improved substantially. Object recall increased by 11 percentage points from 78% to 89%, and shape error measured by Hausdorff distance decreased by 42% from 3.1 m to 1.8 m. All comparisons used the same tiles, the same rendering profile, and the same evaluation metrics, so the observed differences are attributable to the IS component. For the end user, these gains translate into a more complete and believable virtual environment with fewer visual artifacts such as floating buildings or roads cutting unnaturally through hillsides. This ablation therefore confirms the value of the hybrid approach. To be clear, this was a system-level test of a supplementary module, not a policy-level ablation of pipeline design (e.g., OSM-first vs. Segmentation-first). As justified in Section 2.2, the OSM-first policy was a foundational design choice based on the non-negotiable requirement for simulation-ready road network topology, which segmentation-only approaches cannot provide.
5. Discussion
The findings of this study offer critical insights into the generation of analysis-ready digital twins, centered on the unexpected instability of advanced vision models and the necessity of application-centric evaluation. This section synthesizes our experimental results to interpret their broader implications, articulate the effects and limitations of our design choices, and offer practical operating guidelines.
A central—and somewhat paradoxical—observation is the pronounced instability of the architecturally superior Swin2SR when applied to Digital Elevation Model (DEM) data. As shown in Section 4, the vanilla Swin2SR model produced errors so large as to be practically unusable, evidencing a severe domain gap and distributional shift when models optimized for 8-bit natural images are repurposed for unbounded physical datasets. This finding serves as a critical cautionary tale regarding the naive application of next-generation vision models.
The quantile mapping (qmap) stabilization was introduced not as a production alternative to SwinIR—which (as Figure 5 confirms) is the more robust choice—but as a diagnostic remedy. By successfully mitigating failure modes (reducing macro RMSE by 45%), qmap proves that Swin2SR’s failure was due to a correctable distributional shift, not a fundamental architectural flaw. This diagnostic analysis provides the analytical justification for selecting the demonstrably stable SwinIR (+cal) model for deployment.
Our three-axis evaluation framework overcomes limitations of PSNR-centric assessments by explicitly linking intrinsic data quality to extrinsic, application-level behavior. As confirmed in Section 4.4, improved DEM-SR morphology (Axis 2: Geomorphometry) translated directly into enhanced vehicle pose stability, superior geometric registration, and sustained real-time performance within Unity (Axis 3: Usability). The OLS-based linear calibration (cal), despite slightly increasing RMSE (Section 4.2), proved indispensable by eliminating systematic bias and forcing the terrain’s aggregate slope to unity, demonstrating that task-level, application-centric metrics are more critical than abstract pixel-level errors.
For production pipelines prioritizing stability with minimal post-processing, SwinIR (+cal) remains our deployment recommendation. Newer architectures such as Swin2SR may be included as a diagnostic stress-test under distribution shift, in which case a stabilization post-processing step (e.g., qmap) is indispensable. The use of two-channel inputs (DEM + HS) is also standard practice for preserving geomorphological fidelity. For large-scale processing, we recommend sharding by UTM zone and tile batches, enabling failure-isolated restarts and linear throughput scaling.
This study explicitly defines its scope under an ‘open-data-only’ constraint. Therefore, the primary limitation is the absence of a global, high-resolution ground-truth DEM (e.g., LiDAR), meaning absolute vertical accuracy cannot be certified. Our contribution is not the validation of absolute accuracy, but the demonstration of functional plausibility in-engine via the 3-axis framework. Consequently, the outputs are not validated for safety-critical applications demanding sub-meter absolute accuracy (e.g., autonomous vehicle sensor simulation).
Furthermore, the generalizability of the pipeline remains untested on extreme geomorphologies (e.g., deserts, glaciers), as our six ROIs were strategically chosen to represent diverse populated landscapes (urban, coastal, mountainous) commonly targeted for digital twins (Figure 3). Performance on non-terrestrial environments and temporal stability over long, dynamic simulation sessions are deferred to future work. Additional limitations include geographical variance in OSM data quality and the dependency of Unity-native metrics on a specific engine version and rendering profile. Looking ahead, next-generation global DEMs (e.g., NISAR, SWOT) will be crucial for direct validation.
In summary, this work not only demonstrates a feasible open-data pipeline for producing 10-m-class digital twins but also highlights two necessities for AI in scientific domains: domain-specific stabilization and application-centric evaluation.
6. Conclusions
To generate simulation-ready Unity digital twins from open data, this study addressed two central challenges: the instability of modern vision models and the inadequacy of conventional evaluation metrics. We demonstrated that the pronounced distributional shift in next-generation vision transformers like Swin2SR can be successfully mitigated using a lightweight, qmap-based stabilization technique. Furthermore, to overcome the limitations of pixel-based metrics, we proposed and validated a three-axis evaluation framework that integrates self-consistency, geomorphological fidelity, and Unity-native usability.
Our experiments empirically verified that the stable SwinIR-based pipeline performs robustly, while the proposed qmap method restores the practical usability of the otherwise unstable Swin2SR model. Most importantly, we established a clear causal link showing that improvements in DEM morphology preservation translate directly into measurable performance gains within the Unity environment, including more stable object grounding and vehicle dynamics.
The significance of this work extends beyond providing a reproducible, open-data pipeline. It underscores the critical importance of domain-specific stabilization and application-centric evaluation when deploying general-purpose AI models in specialized scientific contexts. Future work will build upon this foundation, focusing on three key directions: validation against high-precision reference DEMs to move from self-consistency to absolute accuracy, quantification of uncertainty to enhance model trustworthiness for critical applications, and improving the pipeline’s scalability for large-scale, real-time production. As an immediate next step, we will validate absolute vertical accuracy on selected ROIs using high-precision LiDAR (and/or ICESat-2) with a standardized protocol (DEM–LiDAR RMSE, slope/curvature RMSE on a common UTM grid, and cross-section analyses), so that our current open-data evaluation can be directly tied to ground truth.
Author Contributions
Conceptualization, D.W. and S.Y.; Methodology, D.W., H.C., and R.D.E.J.; Software, D.W., H.C., and R.D.E.J.; Validation, D.W., H.C., and R.D.E.J.; Formal Analysis, D.W.; Investigation, D.W., H.C., and R.D.E.J.; Data Curation, D.W. and H.C.; Writing—Original Draft Preparation, D.W.; Writing—Review & Editing, D.W., H.C., R.D.E.J., J.K. and S.Y.; Visualization, D.W.; Supervision, J.K. and S.Y.; Project Administration, S.Y.; Funding Acquisition, S.Y. All authors have read and agreed to the published version of the manuscript.
Funding
This work was supported by the IITP (Institute of Information & Communications Technology Planning & Evaluation)-ITRC (Information Technology Research Center) grant funded by the Korea government (Ministry of Science and ICT) (IITP-2025-RS-2024-00438409). Also, This results was supported by “Glocal University funded by the Ministry of Education(MOE)”.
Institutional Review Board Statement
This study is based on the processing of publicly available, anonymized geospatial data (Copernicus GLO-30 and OpenStreetMap) and the development of a computational pipeline. The research did not involve human participants, animal subjects, or the use of personally identifiable information. Therefore, ethical review and approval were not required for this study.
Informed Consent Statement
Not applicable.
Data Availability Statement
The Copernicus GLO-30 DEM data used in this study are openly available from the Copernicus Land Monitoring Service. OpenStreetMap data are available at https://www.openstreetmap.org. The super-resolved DEMs and other datasets generated during this study are available from the corresponding author upon reasonable request.
Conflicts of Interest
The authors declare no conflicts of interest.
References
- Wang, Z.; Zhang, X.; Wang, X. Digital twin simulation of connected and automated vehicles with the unity game engine. In Proceedings of the 2021 Winter Simulation Conference (WSC), Phoenix, AZ, USA, 13–16 December 2021; pp. 1–12. [Google Scholar]
- Balla, M.; Drgona, P.; Duriš, S.; Kajan, S.; Hubinský, P. Educational case studies: Creating a digital twin of the production line in TIA Portal, Unity, and Game4Automation Framework. Sensors 2023, 23, 4843. [Google Scholar] [CrossRef]
- Jyeniskhan, B.; Ganbat, T.; Lee, C.H. Integrating machine learning model and digital twin system for additive manufacturing. IEEE Access 2023, 11, 2862–2876. [Google Scholar] [CrossRef]
- Purinton, B.; Bookhagen, B. Beyond vertical point accuracy: Assessing inter-pixel consistency in 30 m global DEMs for the arid central Andes. Front. Earth Sci. 2021, 9, 749520. [Google Scholar] [CrossRef]
- Han, C.; Liu, Y.; Zhang, C.; Yang, C.; Zhang, Z. Quality assessment of three digital elevation models with 30 M resolution by taking 12 M TanDEM-X DEM as reference. In Proceedings of the 2020 IEEE International Geoscience and Remote Sensing Symposium (IGARSS), Waikoloa, HI, USA, 26 September–2 October 2020; pp. 2095–2098. [Google Scholar]
- Galin, E.; Peytavie, A.; Guérin, E.; Cordonnier, G.; Cani, M.P.; Benes, B.; Gain, J. A review of digital terrain modeling. Comput. Graph. Forum 2019, 38, 645–668. [Google Scholar] [CrossRef]
- Airbus Defence and Space GmbH. Copernicus Digital Elevation Model: Product Handbook, Version 5.0; Airbus Defence and Space GmbH: Potsdam, Germany, 2022; Available online: https://dataspace.copernicus.eu/sites/default/files/media/files/2024-06/geo1988-copernicusdem-spe-002_producthandbook_i5.0.pdf (accessed on 16 September 2025).
- Aguilar, F.J.; Aguilar, M.A.; Agüera, F.; Carvajal, F. Effects of terrain morphology, sampling density, and interpolation methods on grid DEM accuracy. Photogramm. Eng. Remote Sens. 2005, 71, 805–816. [Google Scholar] [CrossRef]
- Jiang, C.; He, D.; Cheng, T. Super-resolution for terrain modeling using deep learning in high mountain Asia. Geomorphology 2023, 420, 108507. [Google Scholar] [CrossRef]
- Demiray, S.K.; Karatekin, Ö.; Göksel, Ç. D-SRGAN: DEM super-resolution with generative adversarial networks. SN Comput. Sci. 2020, 1, 148. [Google Scholar] [CrossRef]
- Li, H.; Deng, L.; Liu, K.; Xu, X. A large scale digital elevation model super-resolution Transformer. Neurocomputing 2023, 556, 126629. [Google Scholar] [CrossRef]
- Arabboev, S.; Lee, S.; Whang, M. A comprehensive review of image super-resolution metrics: Classical and AI-based approaches. J. Inf. Commun. Converg. Eng. 2023, 21, 145–154. [Google Scholar] [CrossRef]
- Kawulok, M.; Kurek, J.; Hrynczenko, K.; Rusek, K. Towards robust evaluation of super-resolution satellite image reconstruction. In Proceedings of the Asian Conference on Intelligent Information and Database Systems, Dong Hoi, Vietnam, 19–21 March 2018; pp. 119–128. [Google Scholar]
- Ruiz-Lendínez, J.J.; Ariza-López, F.J. Deep learning methods applied to digital elevation models: State of the art. Int. J. Digit. Earth 2023, 16, 2686–2718. [Google Scholar] [CrossRef]
- Tuia, D.; Persello, C.; Bruzzone, L. Domain adaptation for the classification of remote sensing data: An overview of recent advances. IEEE Geosci. Remote Sens. Mag. 2016, 4, 41–57. [Google Scholar] [CrossRef]
- Lyu, F. Evaluating the evaluation matrices: Integrating spatial assessment in geospatial AI model training and evaluation. In Proceedings of the I-GUIDE Forum 2025: Geospatial AI and Innovation for Sustainability Solutions, Boulder, CO, USA, 15–17 May 2025. [Google Scholar]
- OpenStreetMap Contributors. OpenStreetMap. 2025. Available online: https://www.openstreetmap.org (accessed on 16 September 2025).
- Drusch, M.; Del Bello, U.; Carlier, S.; Colin, O.; Fernandez, V.; Gascon, F.; Hoersch, B.; Isola, C.; Laberinti, P.; Martimort, P.; et al. Sentinel-2: ESA’s optical high-resolution mission for GMES operational services. Remote Sens. Environ. 2012, 120, 25–36. [Google Scholar] [CrossRef]
- Liang, J.; Cao, J.; Sun, G.; Zhang, K.; Van Gool, L.; Timofte, R. SwinIR: Image restoration using Swin Transformer. In Proceedings of the IEEE/CVF International Conference on Computer Vision Workshops (ICCVW), Montreal, BC, Canada, 11–17 October 2021; pp. 1833–1844. [Google Scholar]
- Conde, M.V.; Choi, U.J.; Burchi, M.; Timofte, R. Swin2SR: SwinV2 transformer for compressed image super-resolution and restoration. In Proceedings of the IEEE/CVF Conference on Computer Vision and Pattern Recognition Workshops (CVPRW), Vancouver, BC, Canada, 18–22 June 2023; pp. 1957–1967. [Google Scholar]
- Chen, Y.; Zhang, R.; Liu, J.; Zhang, G.; Yu, H.; Li, J. Convolutional neural network based DEM super resolution. ISPRS Int. Arch. Photogramm. Remote Sens. Spat. Inf. Sci. 2016, XLI-B3, 731–735. [Google Scholar]
- Mesbah, A.; Al-Sulttani, A.O.; Howari, F.M.; Al-Mansoori, S. Error assessment and propagation in digital terrain modeling: A review. Int. Arch. Photogramm. Remote Sens. Spat. Inf. Sci. 2023, XLVIII-1/W3-2023, 373–379. [Google Scholar]
- Yu, Z.; Chen, S.; Wu, S. An integrated method for DEM simplification with terrain structural features and smooth morphology preserved. Geocarto Int. 2021, 37, 8168–8187. [Google Scholar] [CrossRef]
- Zheng, Z.; Chen, Z.; Wu, S.; Huang, C. Terrain self-similarity-based transformer for generating super resolution DEMs. Remote Sens. 2023, 15, 2002. [Google Scholar] [CrossRef]
- Kowaleczko, P.; Bromberek, J.; Jenerowicz, A. A real-world benchmark for Sentinel-2 multi-image super-resolution. Sci. Data 2022, 9, 596. [Google Scholar] [CrossRef] [PubMed]
- Lei, S.; Shi, Z.; Zhang, Z.; Lei, B. Transformer-based multi-stage enhancement for remote sensing image super-resolution. IEEE Trans. Geosci. Remote Sens. 2021, 60, 1–13. [Google Scholar]
- Argudo, O.; Andujar, C.; Chica, A.; Bover, C. Terrain super-resolution through aerial imagery and fully convolutional networks. Comput. Graph. Forum 2018, 37, 185–195. [Google Scholar] [CrossRef]
- Haklay, M.; Weber, P. OpenStreetMap: User-generated street maps. IEEE Pervasive Comput. 2008, 7, 12–18. [Google Scholar] [CrossRef]
- Ronneberger, O.; Fischer, P.; Brox, T. U-net: Convolutional networks for biomedical image segmentation. In Proceedings of the Medical Image Computing and Computer-Assisted Intervention (MICCAI), Munich, Germany, 5–9 October 2015; pp. 234–241. [Google Scholar]
- Chen, L.C.; Papandreou, G.; Kokkinos, I.; Murphy, K.; Yuille, A.L. DeepLab: Semantic image segmentation with deep convolutional nets, atrous convolution, and fully connected CRFs. IEEE Trans. Pattern Anal. Mach. Intell. 2018, 40, 834–848. [Google Scholar] [CrossRef]
- Chen, L.C.; Zhu, Y.; Papandreou, G.; Schroff, F.; Adam, H. Encoder-decoder with atrous separable convolution for semantic image segmentation. In Proceedings of the European Conference on Computer Vision (ECCV), Munich, Germany, 8–14 September 2018; pp. 833–851. [Google Scholar]
- He, K.; Gkioxari, G.; Dollár, P.; Girshick, R. Mask R-CNN. In Proceedings of the IEEE International Conference on Computer Vision (ICCV), Venice, Italy, 22–29 October 2017; pp. 2961–2969. [Google Scholar]
- Kirillov, A.; Mintun, E.; Ravi, N.; Mao, H.; Rolland, C.; Gustafson, L.; Xiao, T.; Whitehead, S.; Berg, A.C.; Lo, W.Y.; et al. Segment anything. In Proceedings of the IEEE/CVF International Conference on Computer Vision (ICCV), Paris, France, 2–6 October 2023; pp. 3879–3890. [Google Scholar]
- Wang, Z.; Chen, J.; Hoi, S.C.H. Deep learning for image super-resolution: A survey. IEEE Trans. Pattern Anal. Mach. Intell. 2021, 43, 3365–3387. [Google Scholar] [CrossRef] [PubMed]
- Huber, M.; Osterkamp, N.; Marschalk, U.; Tubbesing, R.; Wendleder, A.; Wessel, B.; Roth, A. Shaping the global high-resolution TanDEM-X digital elevation model. IEEE J. Sel. Top. Appl. Earth Obs. Remote Sens. 2021, 14, 7198–7212. [Google Scholar] [CrossRef]
- NGA.STND.0036; Department of Defense World Geodetic System 1984—Its Definition and Relationships with Local Geodetic Systems. National Geospatial-Intelligence Agency: Springfield, VA, USA, 2014.
- NGA.SIG.0012; The Universal Grids and the Transverse Mercator and Polar Stereographic Map Projections. National Geospatial-Intelligence Agency: Springfield, VA, USA, 2014.
- Pavlis, N.K.; Holmes, S.A.; Kenyon, S.C.; Factor, J.K. The development and evaluation of the Earth Gravitational Model 2008 (EGM2008). J. Geophys. Res. Solid Earth 2012, 117, B04406. [Google Scholar] [CrossRef]
- GDAL/OGR Contributors. GDAL—Geospatial Data Abstraction Library. Open Source Geospatial Foundation. 2025. Available online: https://gdal.org (accessed on 25 September 2025).
- Harris, F.J. On the use of windows for harmonic analysis with the discrete Fourier transform. Proc. IEEE 1978, 66, 51–83. [Google Scholar] [CrossRef]
- Gudmundsson, L.; Bremnes, J.B.; Haugen, J.E.; Engen-Skaugen, T. Technical note: Downscaling RCM precipitation to the station scale using quantile mapping–a comparison of methods. Hydrol. Earth Syst. Sci. 2012, 16, 3383–3390. [Google Scholar] [CrossRef]
- Cannon, A.J.; Sobie, S.R.; Murdock, T.Q. Bias correction of GCM precipitation by quantile mapping: How well do methods preserve changes in quantiles and extremes? J. Clim. 2015, 28, 6938–6959. [Google Scholar] [CrossRef]
- Song, Y.H.; Chung, E.S. Intercomparison of bias correction methods for precipitation of multiple GCMs across six continents. Geosci. Model Dev. 2024, 17, 8173–8203. [Google Scholar] [CrossRef]
- He, M.; He, K.; Huang, Q.; Xiao, H.; Zhang, H.; Li, G.; Chen, A. Lightweight mask R-CNN for instance segmentation and particle physical property analysis in multiphase flow. Powder Technol. 2025, 449, 120366. [Google Scholar] [CrossRef]
- Diachenko, O.; Vovk, O.; Ustymenko, I.; Gaponova, O. Industrial collaborative robot digital twin integration and control using Robot Operating System. In Advances in Manufacturing; Springer: Cham, Switzerland, 2022; pp. 1–12. [Google Scholar]
- Aickin, M.; Gensler, H. A gentle introduction to the Holm-Bonferroni method. J. Clin. Epidemiol. 2008, 61, 640–641. [Google Scholar]
- Holm, S. A simple sequentially rejective multiple test procedure. Scand. J. Stat. 1979, 6, 65–70. [Google Scholar]
- Wang, X.; Yu, K.; Wu, S.; Gu, J.; Liu, Y.; Dong, C.; Qiao, Y.; Loy, C.C. ESRGAN: Enhanced Super-Resolution Generative Adversarial Networks. In Proceedings of the European Conference on Computer Vision (ECCV) Workshops, Munich, Germany, 8–14 September 2018. [Google Scholar]
- Meta (Oculus). Testing and Performance Analysis (Unity); Meta Quest Developer Documentation; Meta Oculus: Menlo Park, CA, USA, 2024. [Google Scholar]
- Meta (Oculus). Guidelines for VR Performance Optimization (PC/Rift); Meta Developer Documentation; Meta Oculus: Menlo Park, CA, USA, 2024. [Google Scholar]
- Tang, L.; Zhao, J.; Biljecki, F.; Ying, S.; Li, L.; Zhu, H.; Zhu, Y.; Su, F. An Application-Driven LOD Modelling Paradigm for 3D City Models. ISPRS J. Photogramm. Remote Sens. 2020, 161, 194–207. [Google Scholar] [CrossRef]
- Federal Highway Administration (FHWA). Handbook for Designing Roadways for the Aging Population; Publication No. FHWA-SA-14-015; U.S. Department of Transportation, Federal Highway Administration, Office of Safety: Washington, DC, USA, 2014. Available online: https://highways.dot.gov/safety/other/older-road-user/handbook-designing-roadways-aging-population (accessed on 16 September 2025).
- Euro NCAP. Lane Support Systems (LSS) Test Protocol, Version 4.3; Euro NCAP: Leuven, Belgium, 2023.
Disclaimer/Publisher’s Note: The statements, opinions and data contained in all publications are solely those of the individual author(s) and contributor(s) and not of MDPI and/or the editor(s). MDPI and/or the editor(s) disclaim responsibility for any injury to people or property resulting from any ideas, methods, instructions or products referred to in the content. |
© 2025 by the authors. Licensee MDPI, Basel, Switzerland. This article is an open access article distributed under the terms and conditions of the Creative Commons Attribution (CC BY) license (https://creativecommons.org/licenses/by/4.0/).