Article

Spudcan Reinstallation Close to Natural Footprints Considering Strength Reduction: Insights from Single-Factor and Orthogonal Experiments

1
CNOOC Research Institute Ltd., Beijing 100028, China
2
School of Civil Engineering, Beijing Jiaotong University, Beijing 100044, China
*
Author to whom correspondence should be addressed.
Appl. Sci. 2025, 15(21), 11765; https://doi.org/10.3390/app152111765
Submission received: 30 September 2025 / Revised: 30 October 2025 / Accepted: 31 October 2025 / Published: 4 November 2025
(This article belongs to the Section Marine Science and Engineering)

Abstract

In offshore jack-up operations, it is common to reinstall spudcans close to existing footprints, which could result in asymmetric soil distribution and potential instability risks. This study investigates the mechanical behavior and stability of spudcans during reinstallation, focusing on the influence of footprint geometry, spudcan type, and offset distance. The coupled Eulerian–Lagrangian (CEL) method in ABAQUS is utilized together with soil strength reduction to assess stability. Both single-factor and orthogonal experimental designs are employed to systematically evaluate parameter effects. Results show that the footprint diameter has a greater impact than the depth, increasing the peak horizontal force by 33.4% and the moment by 10.9% due to enhanced soil asymmetry. Rectangular spudcans with tapered bases generate twice the vertical resistance and exhibit 8.8% smaller lateral displacements compared to circular spudcans. Offset distance significantly affects reinstallation performance, with adverse conditions occurring at 0.5 times the diameter of the spudcan. Orthogonal analysis further confirms that the offset distance has the greatest influence among the factors studied. These findings emphasize the necessity of considering footprint geometry, spudcan design and positioning to ensure safe and stable reinstallation, and provide guidance for engineering design and risk assessment of repeated spudcan operations.

1. Introduction

The jack-up drilling platform has become the most widely deployed mobile offshore platform in the field of oil and gas exploration due to its high mobility and low cost [1,2]. They are stably supported on the seabed by movable legs equipped with spudcans [3,4]. However, after the completion of the operation and subsequent removal of the spudcan, a large seabed depression, often referred to as a “footprint” [5], is formed at the installation site. With the growing trend toward offshore field re-development and dense well-pattern drilling, the demand for re-installation of platforms near the existing footprint is also increasing. Under such conditions, the foundation beneath the spudcan exhibits significant asymmetry, which induces additional horizontal forces and moments during re-penetration, thereby increasing the risk of leg displacement, structural bending, and even overall platform instability [6]. There have been many platform slide or overturning accidents caused by spudcan–footprint interaction worldwide, which have brought serious risks to operational safety and caused significant economic losses [7,8,9,10]. Therefore, it is of great engineering significance and urgent practical importance to systematically study the stability of spudcan in the process of reinstallation near the existing footprints, especially the factors affecting its sliding behavior and their influence degree.
Currently, the research on spudcan–footprint interaction can be divided into two categories: centrifuge model tests and numerical simulations. As illustrated in Figure 1, the reinstallation of a spudcan near a pre-existing footprint involves several key geometric and mechanical parameters that govern the soil-structure interaction behavior. The offset distance (denoted as β) represents the horizontal separation between the center of the spudcan and the centerline of a previously formed footprint, where D is the spudcan diameter. Other important geometric features include footprint depth (h) and footprint diameter (B). In the process of reinstallation, due to the existence of footprints, the soil on both sides of the spudcan is obviously asymmetric, so that the bottom of the spudcan is subjected to vertical force (V), horizontal force (H), and moment (M), all acting at the reference point (RP) located at the center of the spudcan base. Based on centrifuge testing, Cassidy et al. [11] showed that the effect of footprints on the stability of the platform is most significant when the offset distance is 0.5D, and once the offset exceeds 1.5D, the effect becomes negligible. This 1.5D threshold was also confirmed by Yuan et al. [12] and Hendriyawan et al. [13]. Kong et al. [14,15] also used centrifuge tests to determine that 1D is the most unfavorable offset distance for reinstallation, and further revealed that both footprint depth and slope angle significantly affect the horizontal sliding force and moment acting on the spudcan. Fang et al. [16] used 1 g model tests to show that spudcan footprint infilling in loose sand prevents “stamp-on-void” hazards, especially effective at shallow depths (0.05D) and small offsets (≤0.25D), but diminishes at larger offsets or depths. Hatono et al. [17] found that the ABAQUS/CEL numerical simulation results are in good agreement with the centrifuge test data, and strongly recommended the use of numerical simulation as an effective tool to evaluate the spudcan-shoe interaction problem. The reliability of the CEL method has also been confirmed by other studies [18,19,20]. For example, using the CEL method, Yu et al. [21] pointed out that the friction condition strongly affects the horizontal force, but only has a slight effect on the moment. In addition, the flat-bottomed spudcan shows the lowest peak sliding force but the highest peak bending moment. Gao et al. [22] further applied the CEL method to evaluate the effectiveness of pre-drilled perforation holes in mitigating sliding risk during reinstallation near existing footprints. They reported that increasing the diameter, number and depth of boreholes can improve mitigation efficiency, although the improvement effect tends to be stable when the depth of boreholes exceeds twice the depth of footprints. Yu et al. [23] found that earlier near-side collapse induces negative lateral force during reinstallation; dual moment peaks result from uneven contact and asynchronous failure, with skirted footings performing best. Yu et al. [24] studied novel spudcan designs using CEL simulations, showing they reduce horizontal forces and bending moments compared to conventional ones, with the lotus-shaped design improving vertical capacity by 16.33%. Yang et al. [25] combined CEL simulations with machine learning to study spudcan reinstallation near footprints in spatially variable clay, revealing significantly increased failure risk under high variability conditions. However, the existing research on the reinstallation of jack-up drilling platforms next to footprints mainly focuses on single factor analysis, and there are still few systematic studies using orthogonal experimental design.
In addition, the installation, operation and extracting process of the spudcan disturbs the surrounding soil, resulting in significant changes and spatial variability in the shear strength profile of the soil near the spudcan [26,27]. Landon et al. [28] found that the inhomogeneity of soil stratification under the spudcan and the degradation of the shear strength inside the spudcan will cause the spudcan to rotate and slide to the original spudcan during the reinstallation process. Gan et al. [1] reported that soil consolidation time plays a critical role in footprint soil strength; When the elapsed time between extraction and reinstallation is short, soil strength softening markedly reduces penetration resistance. The centrifuge test results of Leung et al. [29], Cassidy et al. [11], and Gan et al. [1] all indicate that the disturbance radius of the soil induced by the installation and extraction of spudcans is approximately 1.5D. Nevertheless, strength softening has rarely been considered in numerical simulations, limiting the accuracy of predicted spudcan–footprint interaction responses.
Gan et al. [30] analyzed the geometric characteristics of the footprints formed by the extraction of the spudcan in hard clay by centrifuge tests, and pointed out that the footprint shape can be approximated as a cylindrical footprint with a diameter of 1D and a depth of 0.5D (where D is the diameter of the spudcan). Kong et al. [14,15] simplified the footprint shape into an inverted cone with a diameter of 2D and a depth of 0.33D. Based on the half-spudcan centrifuge test, Hossain and Dong [31] concluded that penetration in soft clay would produce a conical footprint with a depth of 0.22~0.33D. Based on these insights into footprint geometry, subsequent studies often simplify the analysis of spudcan reinstallation near the footprint by using the so-called “artificial footprint” method [32,33,34,35], where the footprint is created by directly excavating part of the soil. However, this method ignores the natural formation process of footprints, so it may not fully represent the actual site conditions.
In view of the limitations of traditional studies that often rely on idealized geometry, ignore the softening of soil strength, and are usually limited to single-factor studies, this paper uses the coupled Eulerian–Lagrangian (CEL) method in ABAQUS to conduct a comprehensive numerical study on the reinstallation of spudcans near existing footprints. The main contributions and research methods of this paper are summarized as follows:
  • Realistic footprint simulation: Unlike previous studies that assumed artificially defined geometries, the footprints in this study were generated by realistic simulations of the initial spudcan penetration, extraction, and subsequent soil remolding, providing a more realistic representation of natural footprints prior to reinstallation. The process is illustrated in Figure 2, and the detailed numerical implementation is presented in Section 2.1.
    Figure 2. Schematic diagram of the two-stage numerical approach for generating realistic spudcan footprints.
    Figure 2. Schematic diagram of the two-stage numerical approach for generating realistic spudcan footprints.
    Applsci 15 11765 g002
  • Soil strength degradation modeling: In order to capture the degradation effects that are often neglected in numerical studies, soil strength softening is achieved by reducing the undrained shear strength within 1.5D from the footprint centerline.
  • The method of combining single factor and orthogonal test: on the basis of the verified numerical model, the parameters of the system are studied by single factor and orthogonal test design. The former is used to examine the individual effects of key parameters—footprint geometry, spudcan type, and offset distance—on key reinstallation responses, and the latter is used to identify and rank the relative importance of different factors.
The remainder of this paper is organized as follows. Section 2 introduces the numerical modeling process, including the establishment and verification of the model. Section 3 introduces the experimental design and the results of both single-factor and orthogonal experiments, focusing on the mechanical response under variations in footprint geometry, spudcan type, and offset distance. Finally, Section 4 summarizes the main findings and conclusions of this paper.

2. Numerical Modeling and Validation

2.1. Finite Element Model

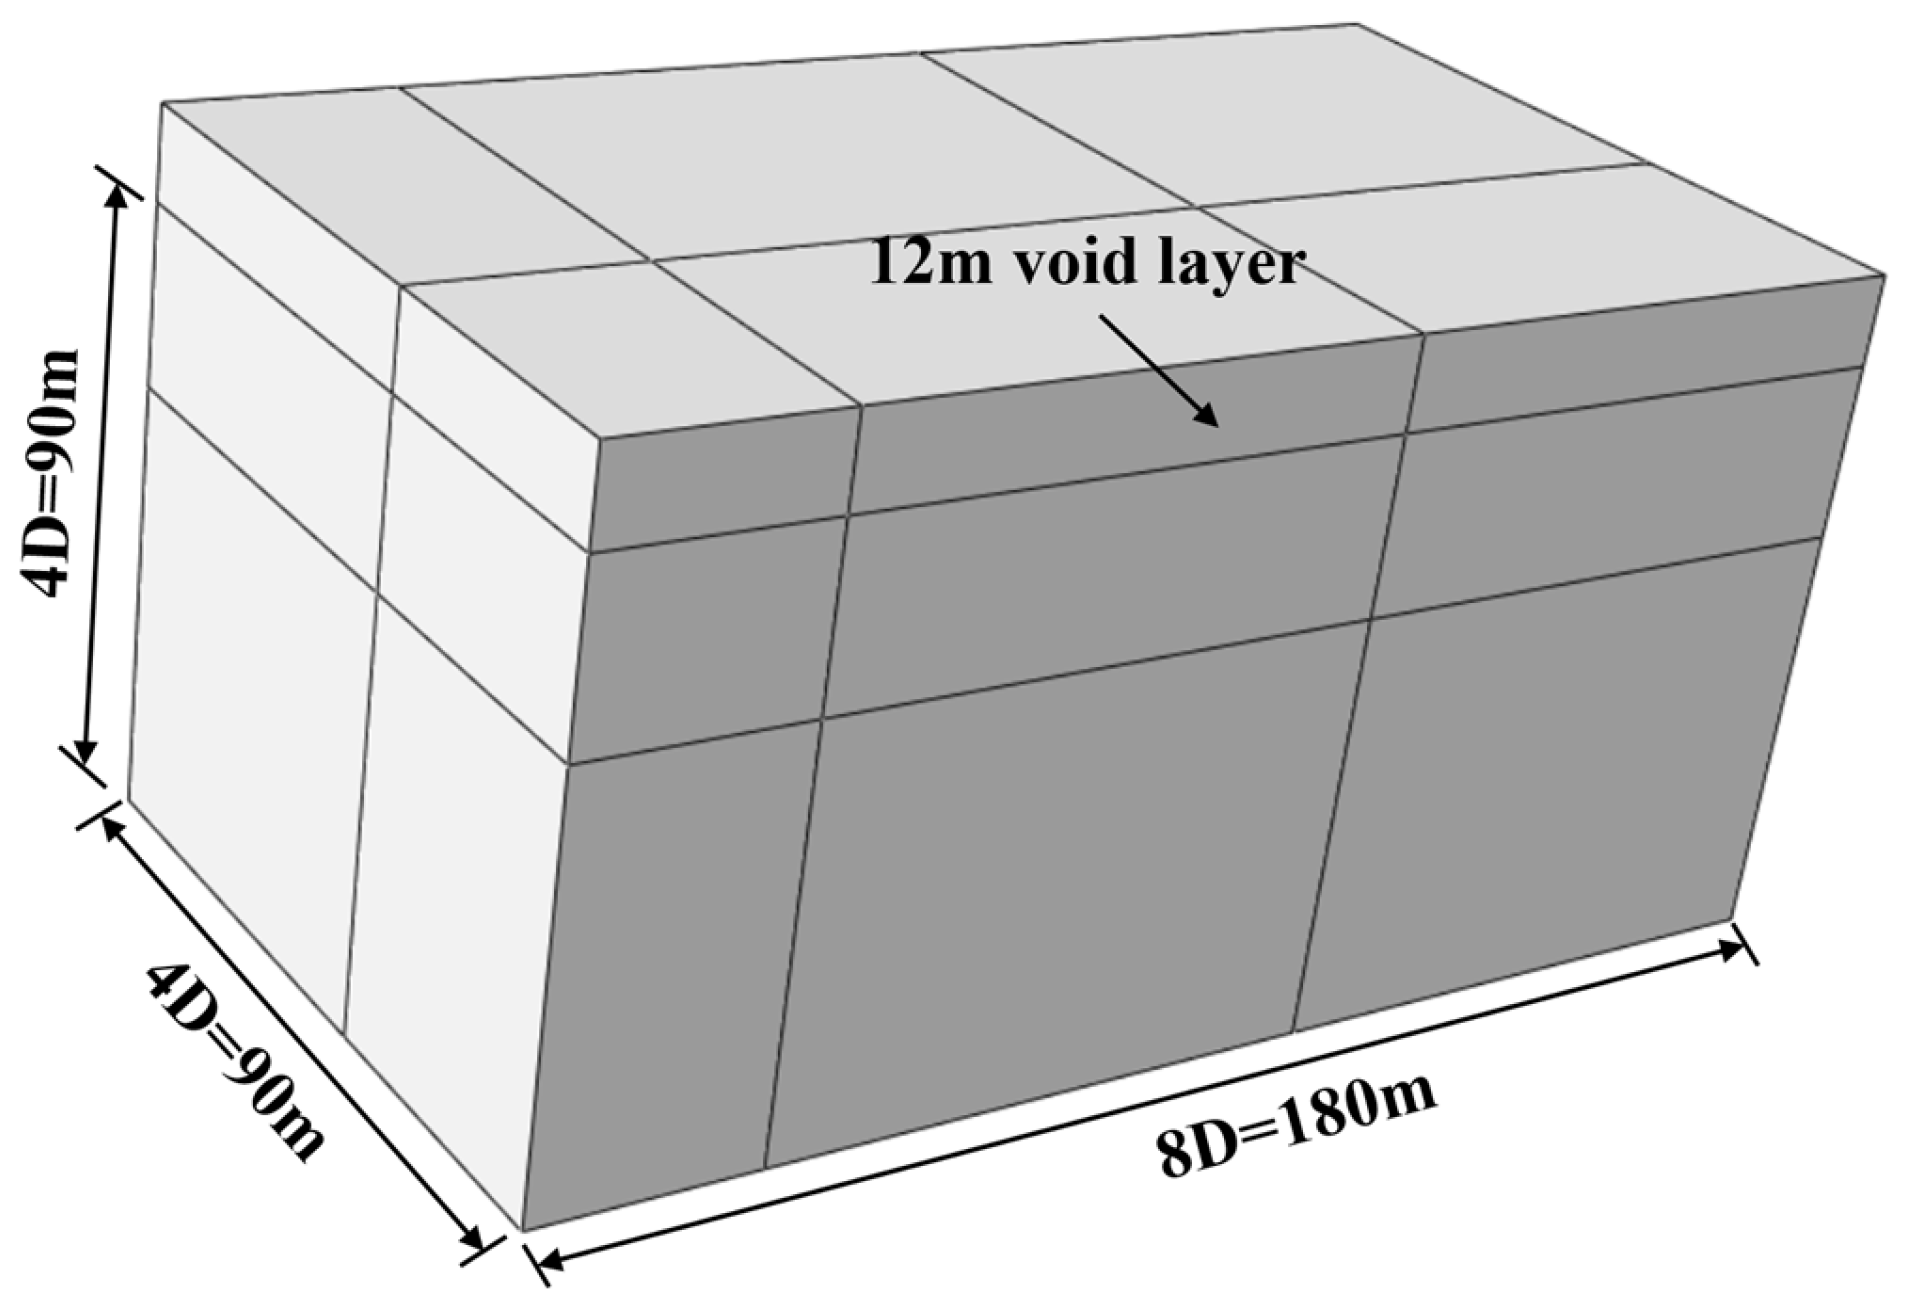
The numerical model was developed in ABAQUS using the CEL method. Considering the symmetry, the 1/2 model was used. In order to minimize the influence of boundary effects on the results, the soil domain was defined as a size with a length of 8D, a width of 4D, and a depth of 4D, where D is the diameter of the spudcan. In this study, the maximum diameter (22.3 m) of the three types of spudcans was selected for analysis, and its shape size was about 180 m × 90 m × 90 m. In addition, a 12 m void layer was placed above the soil to capture the surface heave during the penetration of the spudcan. The soil model is shown in Figure 3.
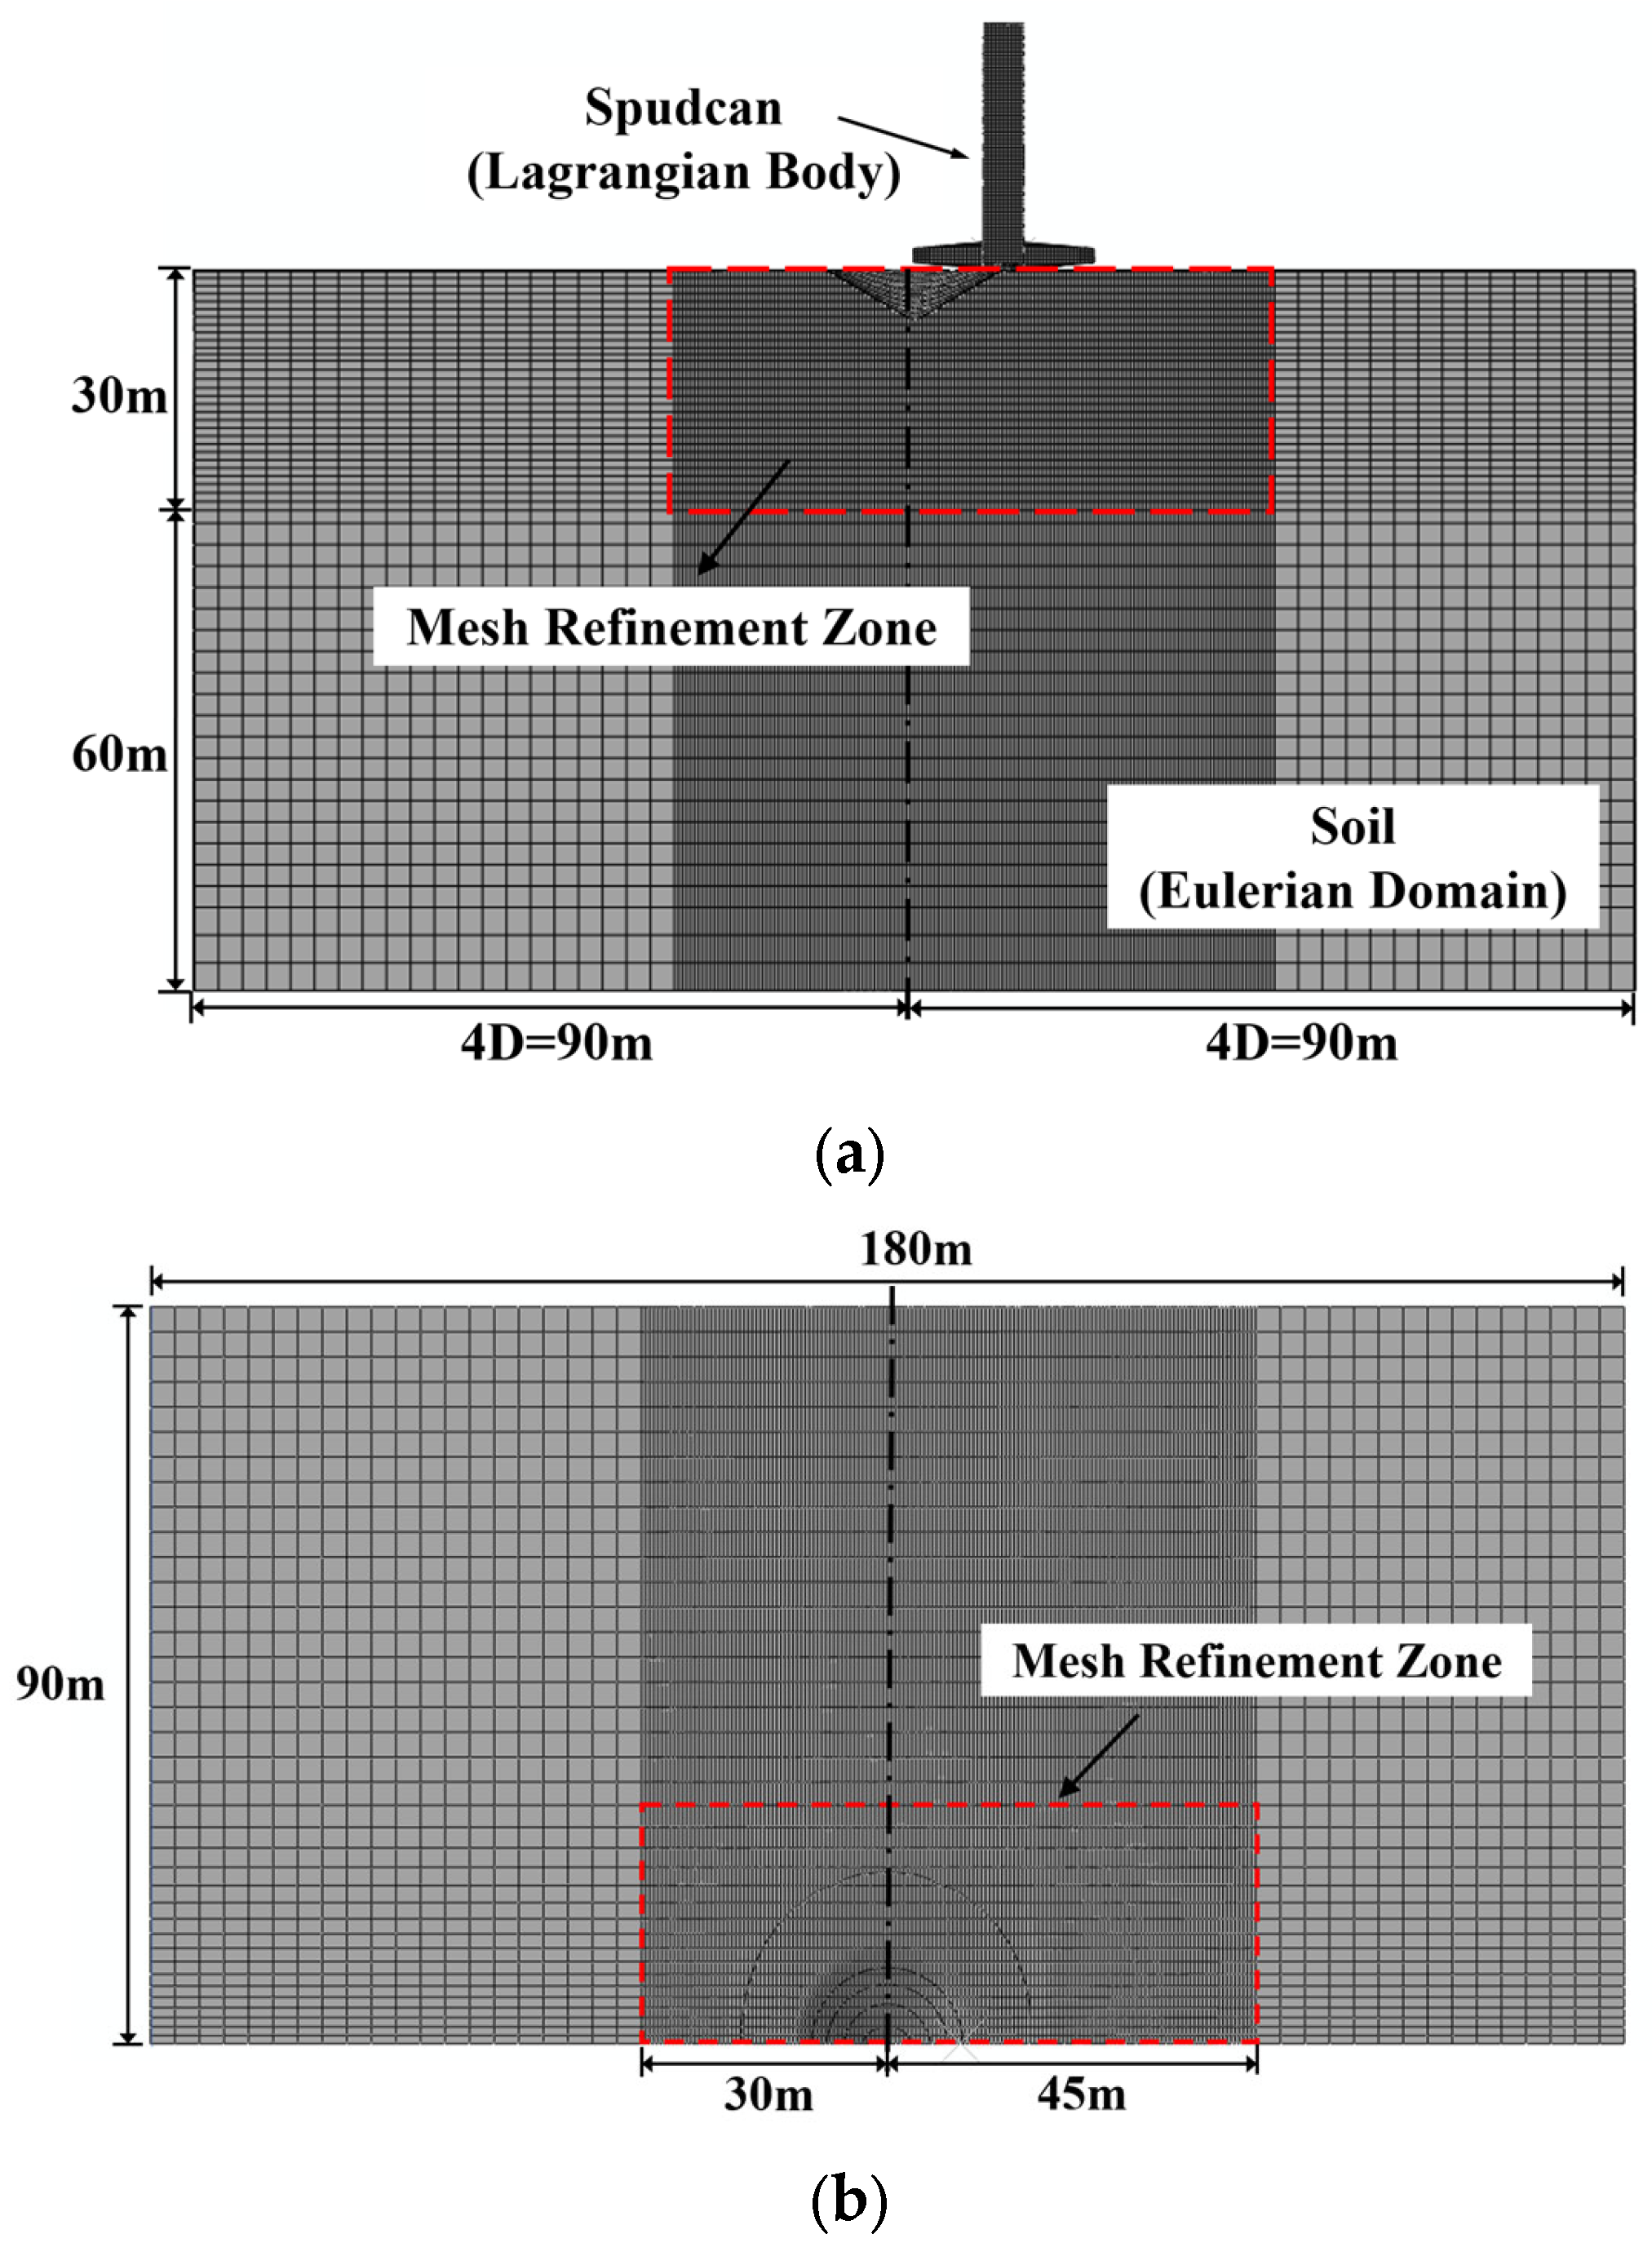
Considering both the calculation accuracy and efficiency, local mesh refinement was performed on the soil area within the range of 30 m on the left side of the footprint centerline, 45 m on the right side (in the reinstallation direction), and 30 m in depth.
In the refinement area, the size was set to 1 m in the vertical direction, 0.5 m in the x direction, and 1–3 m in the y direction. The mesh size gradually increases with the increase in the distance from the centerline. This configuration results in a minimum element size of 0.5 m, corresponding to approximately 0.022D to 0.028D for spudcan diameters ranging from 18.0 m to 22.3 m. Based on previous CEL studies [32,36], the resolution of 0.025D has been shown to achieve mesh convergence for similar spudcan-soil interaction problems. Therefore, the current mesh resolution is considered to be sufficient to capture the flow and load development behavior of large-deformation soils. The mesh arrangement is shown in Figure 4.
Based on the Mohr–Coulomb strength criterion, the ideal elasto-plastic model was used to describe the stress–strain relationship of soil. The density of clay was 630 kg/m3, the Poisson ‘s ratio was 0.35, and the internal friction angle and dilatancy angle were zero. The undrained shear strength (su) was 7 kPa, and the elastic modulus E = 500su. Three typical spudcans of HY944, HY941 and NH-4 with diameters of 22.3 m, 18 m and 18.3 m were selected. The pile shoe was simulated as an elastic material with a density of 7850 kg/m3, a Poisson ‘s ratio of 0.3, and an elastic modulus of 2 × 10¹¹ Pa.
The selection of the finite element followed the coupled Eulerian–Lagrangian (CEL) framework. The soil domain was modeled as a Eulerian body using an 8-node Euler solid element (EC3D8R), allowing material to flow through a fixed mesh and thereby avoiding mesh distortion during large deformations. The spudcan was modeled as a rigid body using an 8-node Lagrangian solid element (C3D8R) to accurately capture its structural response and contact behavior. This combination was well suited for simulating large-deformation soil-structure interaction problems. The general contact was used to simulate the spudcan-soil interaction, the normal direction was hard contact, and the tangential friction coefficient was 0.5. The penetration speed of the spudcan was set to 0.5 m/s.
Different from most previous studies using the idealized “artificial footprint”, this study generated a more realistic “natural footprint” as the initial condition for reinstallation through the following two steps:
  • The CEL method was used to simulate the initial penetration and subsequent extraction of three typical spudcans on a flat seabed, so as to capture the geometric shape of the footprints formed after extraction;
  • Based on the extracted footprint geometry, the CFD-DEM coupling method was used to simulate the natural remolding process under the action of seawater. Through these simulations, the footprint diameter, depth and soil strength reduction coefficient of three different spudcans after extraction and remodeling were obtained, as shown in Table 1.
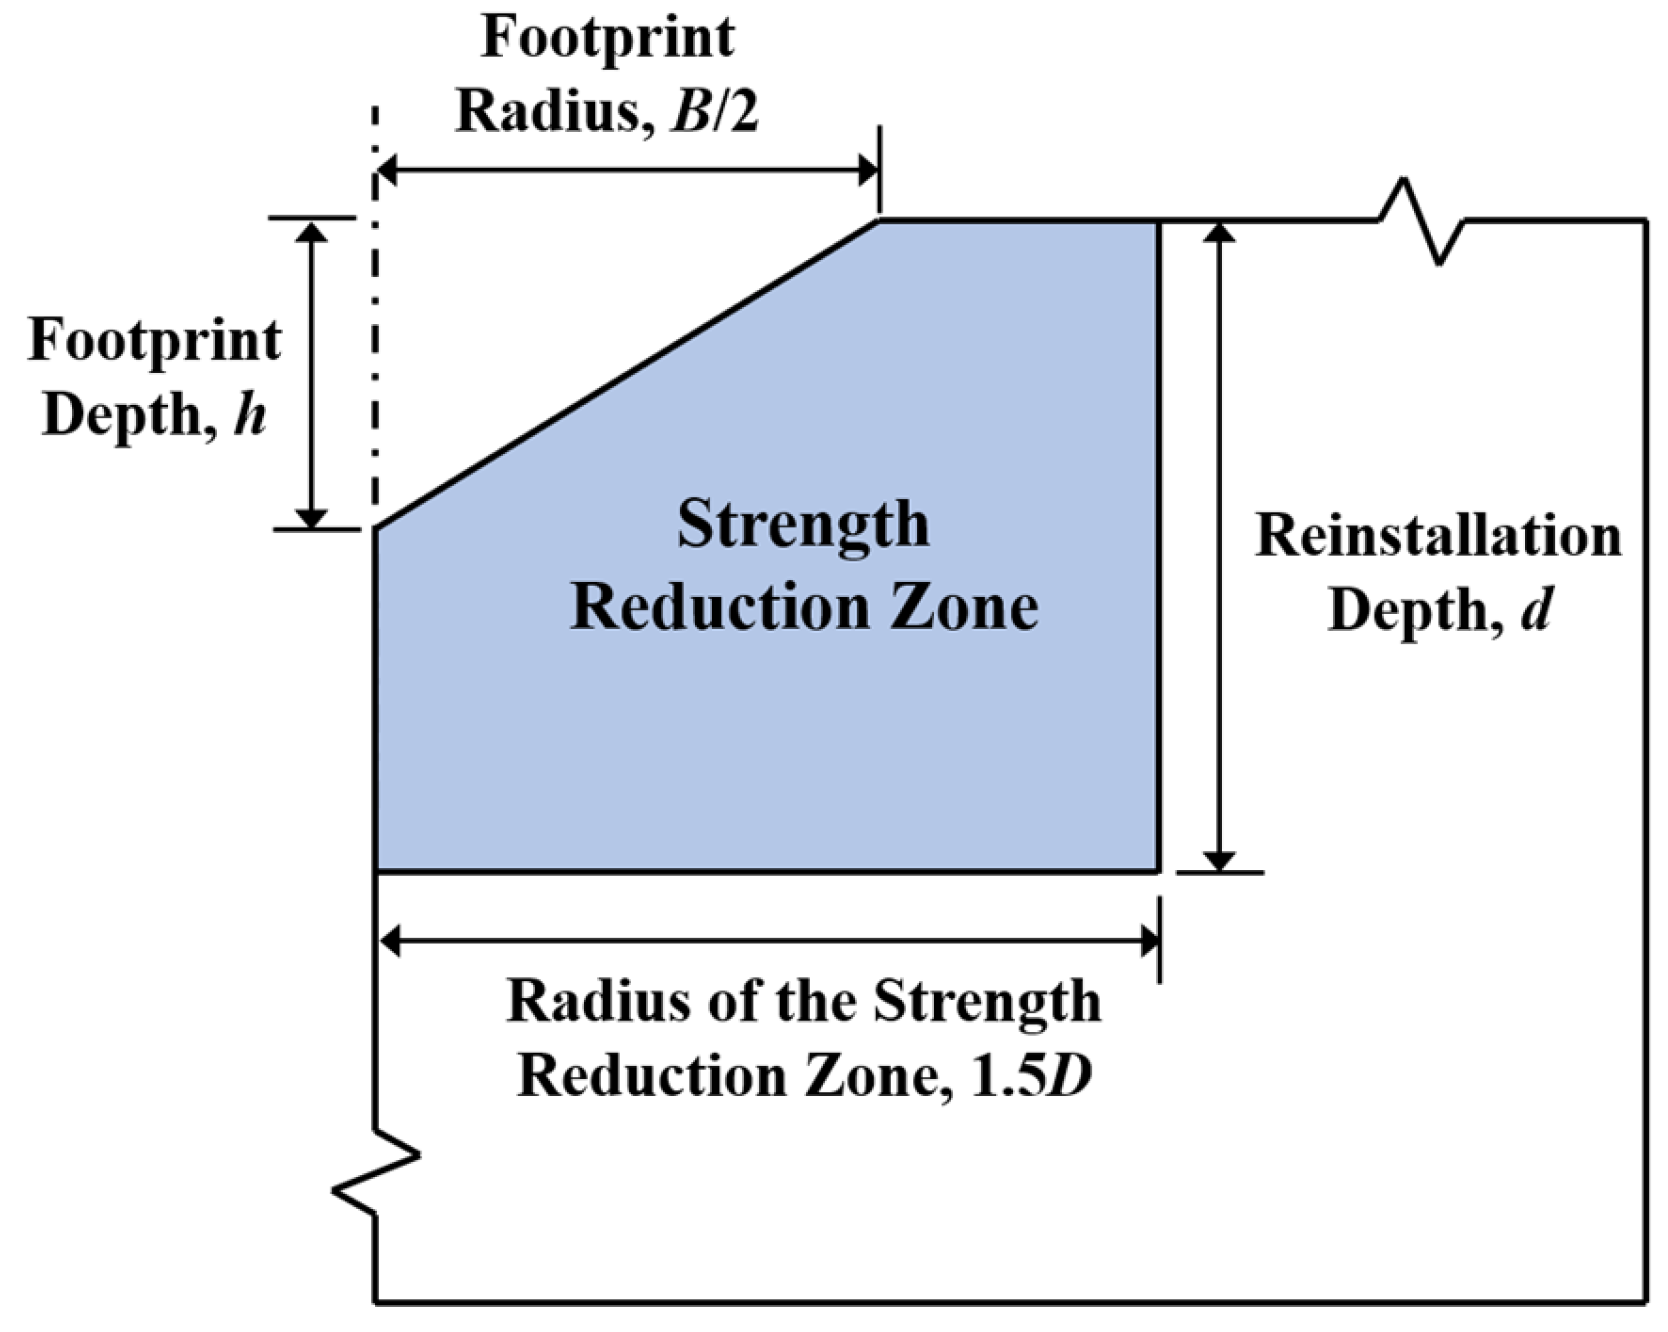
The Lagrangian reference geometry was established according to the shape of the reshaped footprint, and the volume fraction method was used to assign material properties to the soil outside the footprint. In addition, a cylindrical zone within a radius of 1.5D from the footprint centerline was defined as the strength reduction zone, in which soil strength was reduced according to the factors listed in Table 1. This zone extends vertically down to the reinstallation depth (d). The schematic diagram is shown in Figure 5.
In order to quantify the combined load on the spudcan, the lateral displacement δ = M/V and the rotation α = tan−1(H/V) of the spudcan are introduced. These parameters are critical to understand the impact of various factors on the reinstallation process.

2.2. Model Validation

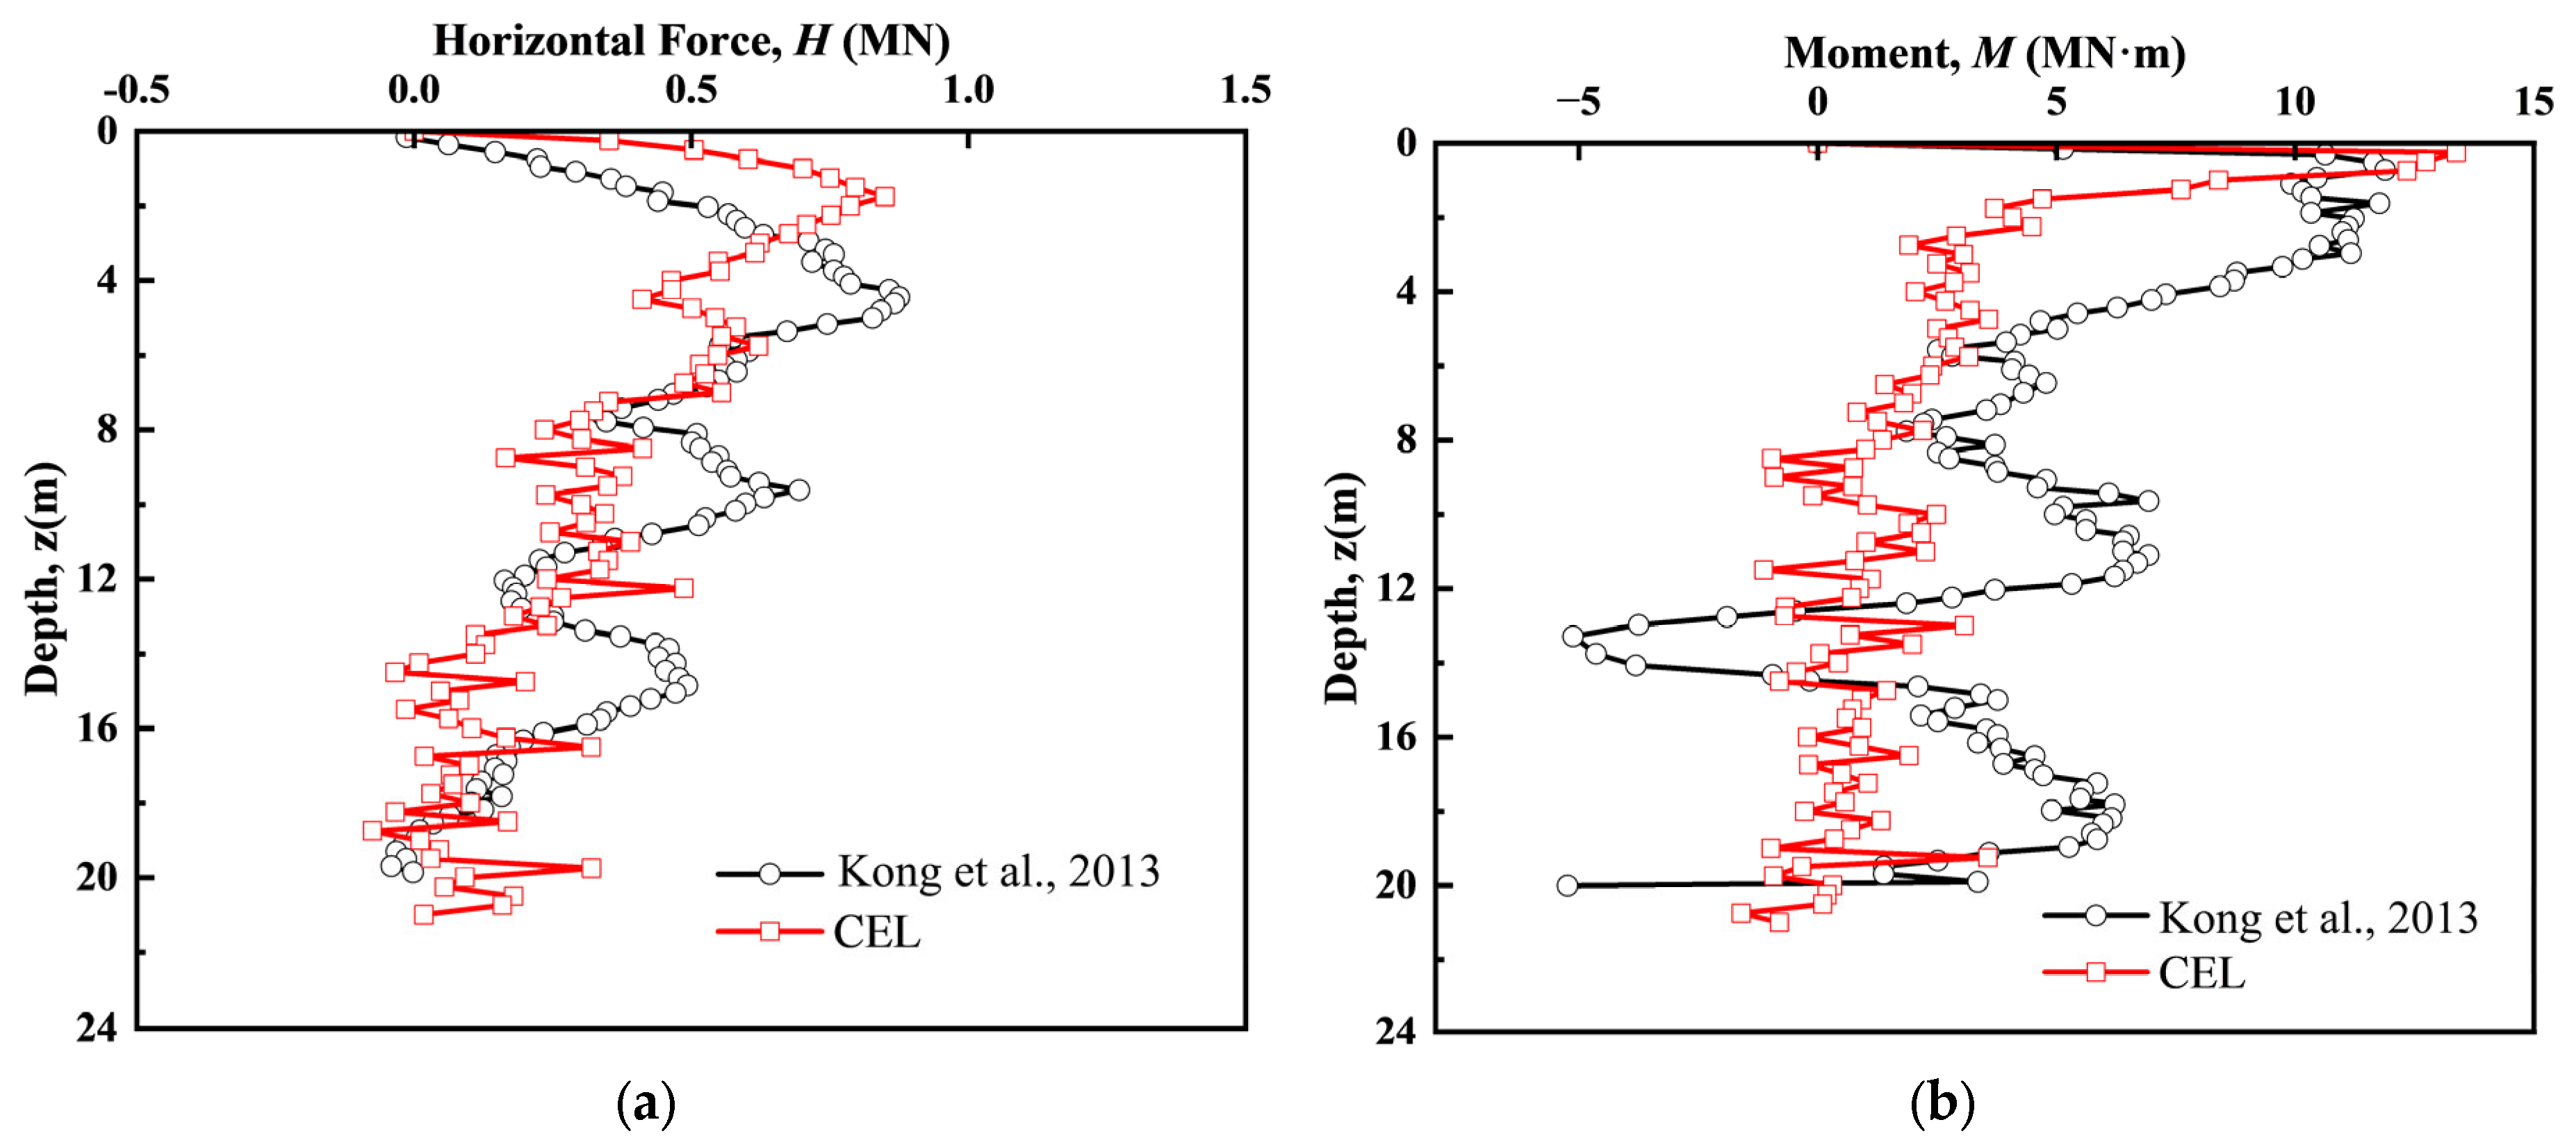
In order to verify the accuracy of the finite element modeling method, based on the centrifuge test parameters reported by Kong et al. [14], the CEL method was used to simulate the reinstallation of the flat spudcan with an offset distance of 1D. Then the simulated horizontal force (H) and moment (M) were compared with the corresponding centrifuge test results, as shown in Figure 6.
It can be seen from Figure 6 that the overall trend of the calculation results is consistent with the experimental results. The magnitude and depth of the horizontal force and moment peaks are very close, with only a difference of 2.9% (Hmax) and 7.2% (Mmax).
The results show that the CEL method used in this study can reliably capture the key mechanical responses during the reinstallation process. The slight deviations observed at some depths may be attributed to the simplification of the soil constitutive model, but these do not affect the accuracy of trends and peaks. In general, this verification establishes the credibility of the numerical model and provides a solid foundation for subsequent parameter studies.

3. Results and Discussion

Single-factor test and orthogonal test were designed to systematically study the influence of three key factors including footprint geometry, spudcan type and offset distance, on the reinstallation response. The results of single-factor test and orthogonal test are analyzed individually.

3.1. Single-Factor Test Analysis

The single-factor test conditions are summarized in Table 2. Case 1 serves as the control; Case 1–3 explore the effect of footprint geometry; Case 1 and 4–5 investigate the influence of spudcan type; Case 1, 6, and 7–8 examine the effect of offset distance.

3.1.1. Effect of Footprint Geometry

Three natural footprints with different geometric characteristics were selected and recorded as F1, F2 and F3, respectively, corresponding to the footprints formed by the extraction and subsequent remolding of the three different types of spudcans listed in Table 1. Their diameter and depth are shown in Figure 7. Numerical simulation is carried out under the same type of spudcan and offset distance, corresponding to Cases 1–3. Figure 8 illustrates the variation in vertical force, horizontal force, moment, inclination angle and displacement with the reinstallation depth in each case, and the peak values of these indicators are summarized in Table 3.
From the overall trend, different footprint geometries significantly affect the response during the reinstallation process. Specifically, as shown in Figure 8b and Table 3, Case 3 shows the largest horizontal force during the penetration process, reaching 0.491 MN, which is significantly higher than 0.457 MN of Case 1 and 0.368 MN of Case 2. When the diameter increases gradually, the horizontal force increases by approximately 33.4%, as calculated from the difference between Case 3 and Case 2. This phenomenon is mainly attributed to the fact that the maximum diameter of F3 corresponding to Case 3 is 28.2 m, which provides a lateral expansion range. When the spudcan is reinstalled, the soil supported on the left side is weaker, resulting in the increase in soil asymmetry and lateral squeezing effects, which induces higher horizontal reaction.
Correspondingly, as shown in Figure 8c, the moment shows a similar trend, increasing from 5.823 MN·m in Case 2 to 6.458 MN·m in Case 3, representing an increase of approximately 10.9%, but its sensitivity to footprint geometry is significantly lower than that of horizontal force. It is noteworthy that although the F2 footprint has the largest depth (7.34 m) and the smallest diameter (18.5 m), due to its steeper profile, it theoretically means higher loads during the reinstallation process, but the actual results show that under this condition, the horizontal force and moment are the lowest. This indicates that the lateral size (diameter) of the footprint may play a more critical role than its depth for the reinstallation response. Therefore, when evaluating the adverse effects of footprint geometry, it is not enough to consider a single index such as depth or diameter, but also consider the plane extension characteristics.
Further analysis of the variation in dip angle and displacement with depth (see Figure 8d,e, and Table 3) show that Case 3 still corresponds to the maximum peak. This indicates that when reinstalled near the F3 footprint, the spudcan is more prone to tilt and lateral offset, which reduces the overall stability.

3.1.2. Effect of Spudcan Type

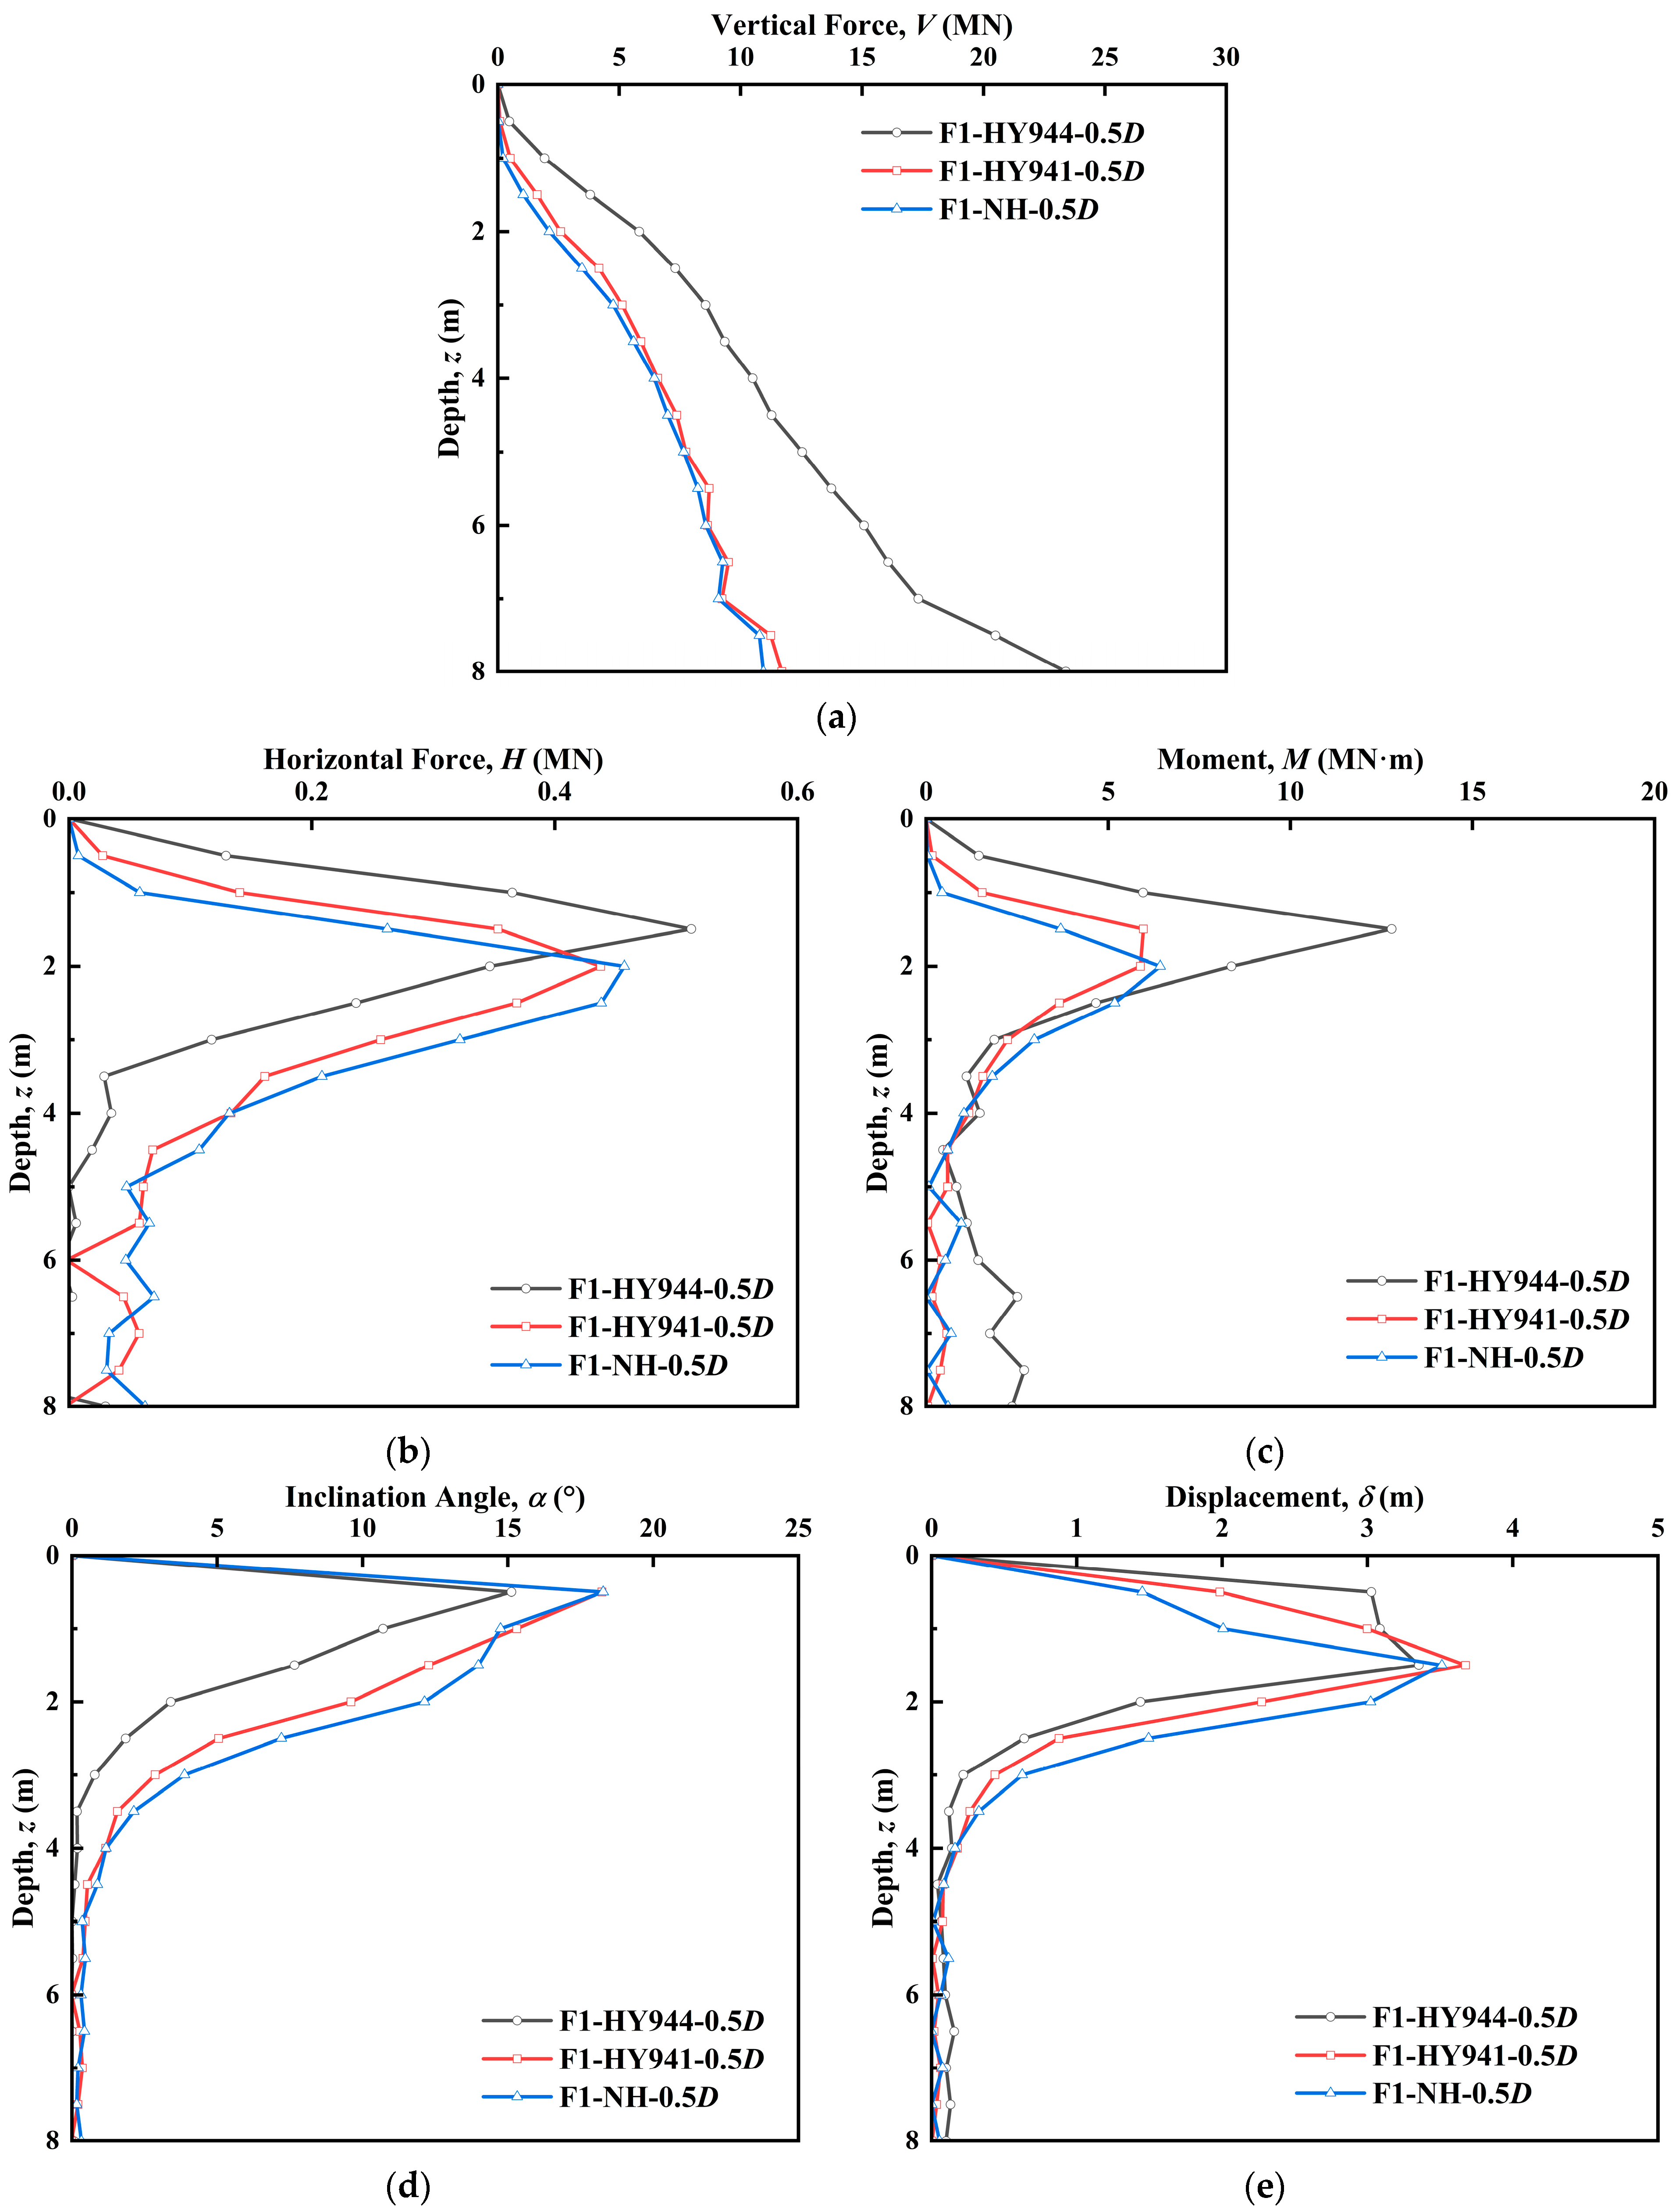
In order to compare the mechanical responses of different spudcan designs, three types were analyzed: HY944 (a rectangular spudcan with a converging base, 22.3 m in diameter), HY941 (a circular spudcan with a flat base, 18 m in diameter) and NH-4 (a circular spudcan with a flat base slightly smaller than that of HY941, 18.3 m in diameter). Their geometric configurations are shown in Figure 9. Numerical simulations were performed under the same footprint geometry and offset distance, corresponding to cases 4, 5 and 1, respectively, in Table 2. Figure 10 shows the distribution of vertical force, horizontal force, moment, inclination angle, and displacement along the depth in each case. The maximum values of these responses are shown in Table 4.
It is evident from Figure 10a that HY944 exhibits a vertical force approximately twice that of the other two spudcans, owing to its larger contact area. As shown in Figure 10b, the maximum horizontal forces for HY941 and NH-4 are nearly identical, whereas HY944 is slightly higher.
This difference becomes more pronounced in the moment response. As shown in Figure 10c and Table 4, the peak moment of HY944 reaches 12.785 MN·m, which is about twice that of HY941 (5.967 MN·m) and NH-4 (6.428 MN·m). This behavior is mainly due to its rectangular shape and tapered base. During the installation process near the footprint, a stronger stress concentration is generated at the corner, and the asymmetry of the soil is increased, resulting in greater moments.
However, despite experiencing higher horizontal forces and greater moments, HY944 did not exhibit inferior stability performance. As shown in Figure 10d and Table 4, the peak inclination angle of HY944 is the smallest (15.125°), while the peak inclination angles of HY941 and NH-4 are 18.236 and 18.279°, respectively. Similarly, the maximum displacement follows the same trend, and HY944 shows the lowest value, reduced by 8.8% compared to HY941 (Figure 10e). This phenomenon can be attributed to the significantly higher vertical force of HY944, which helps to reduce the increase in lateral displacement despite the larger bending moment. In contrast, although HY941 and NH-4 have smaller bending moment and horizontal force, their lower vertical force leads to higher inclination angle and lateral displacement.

3.1.3. Effect of Offset Distance

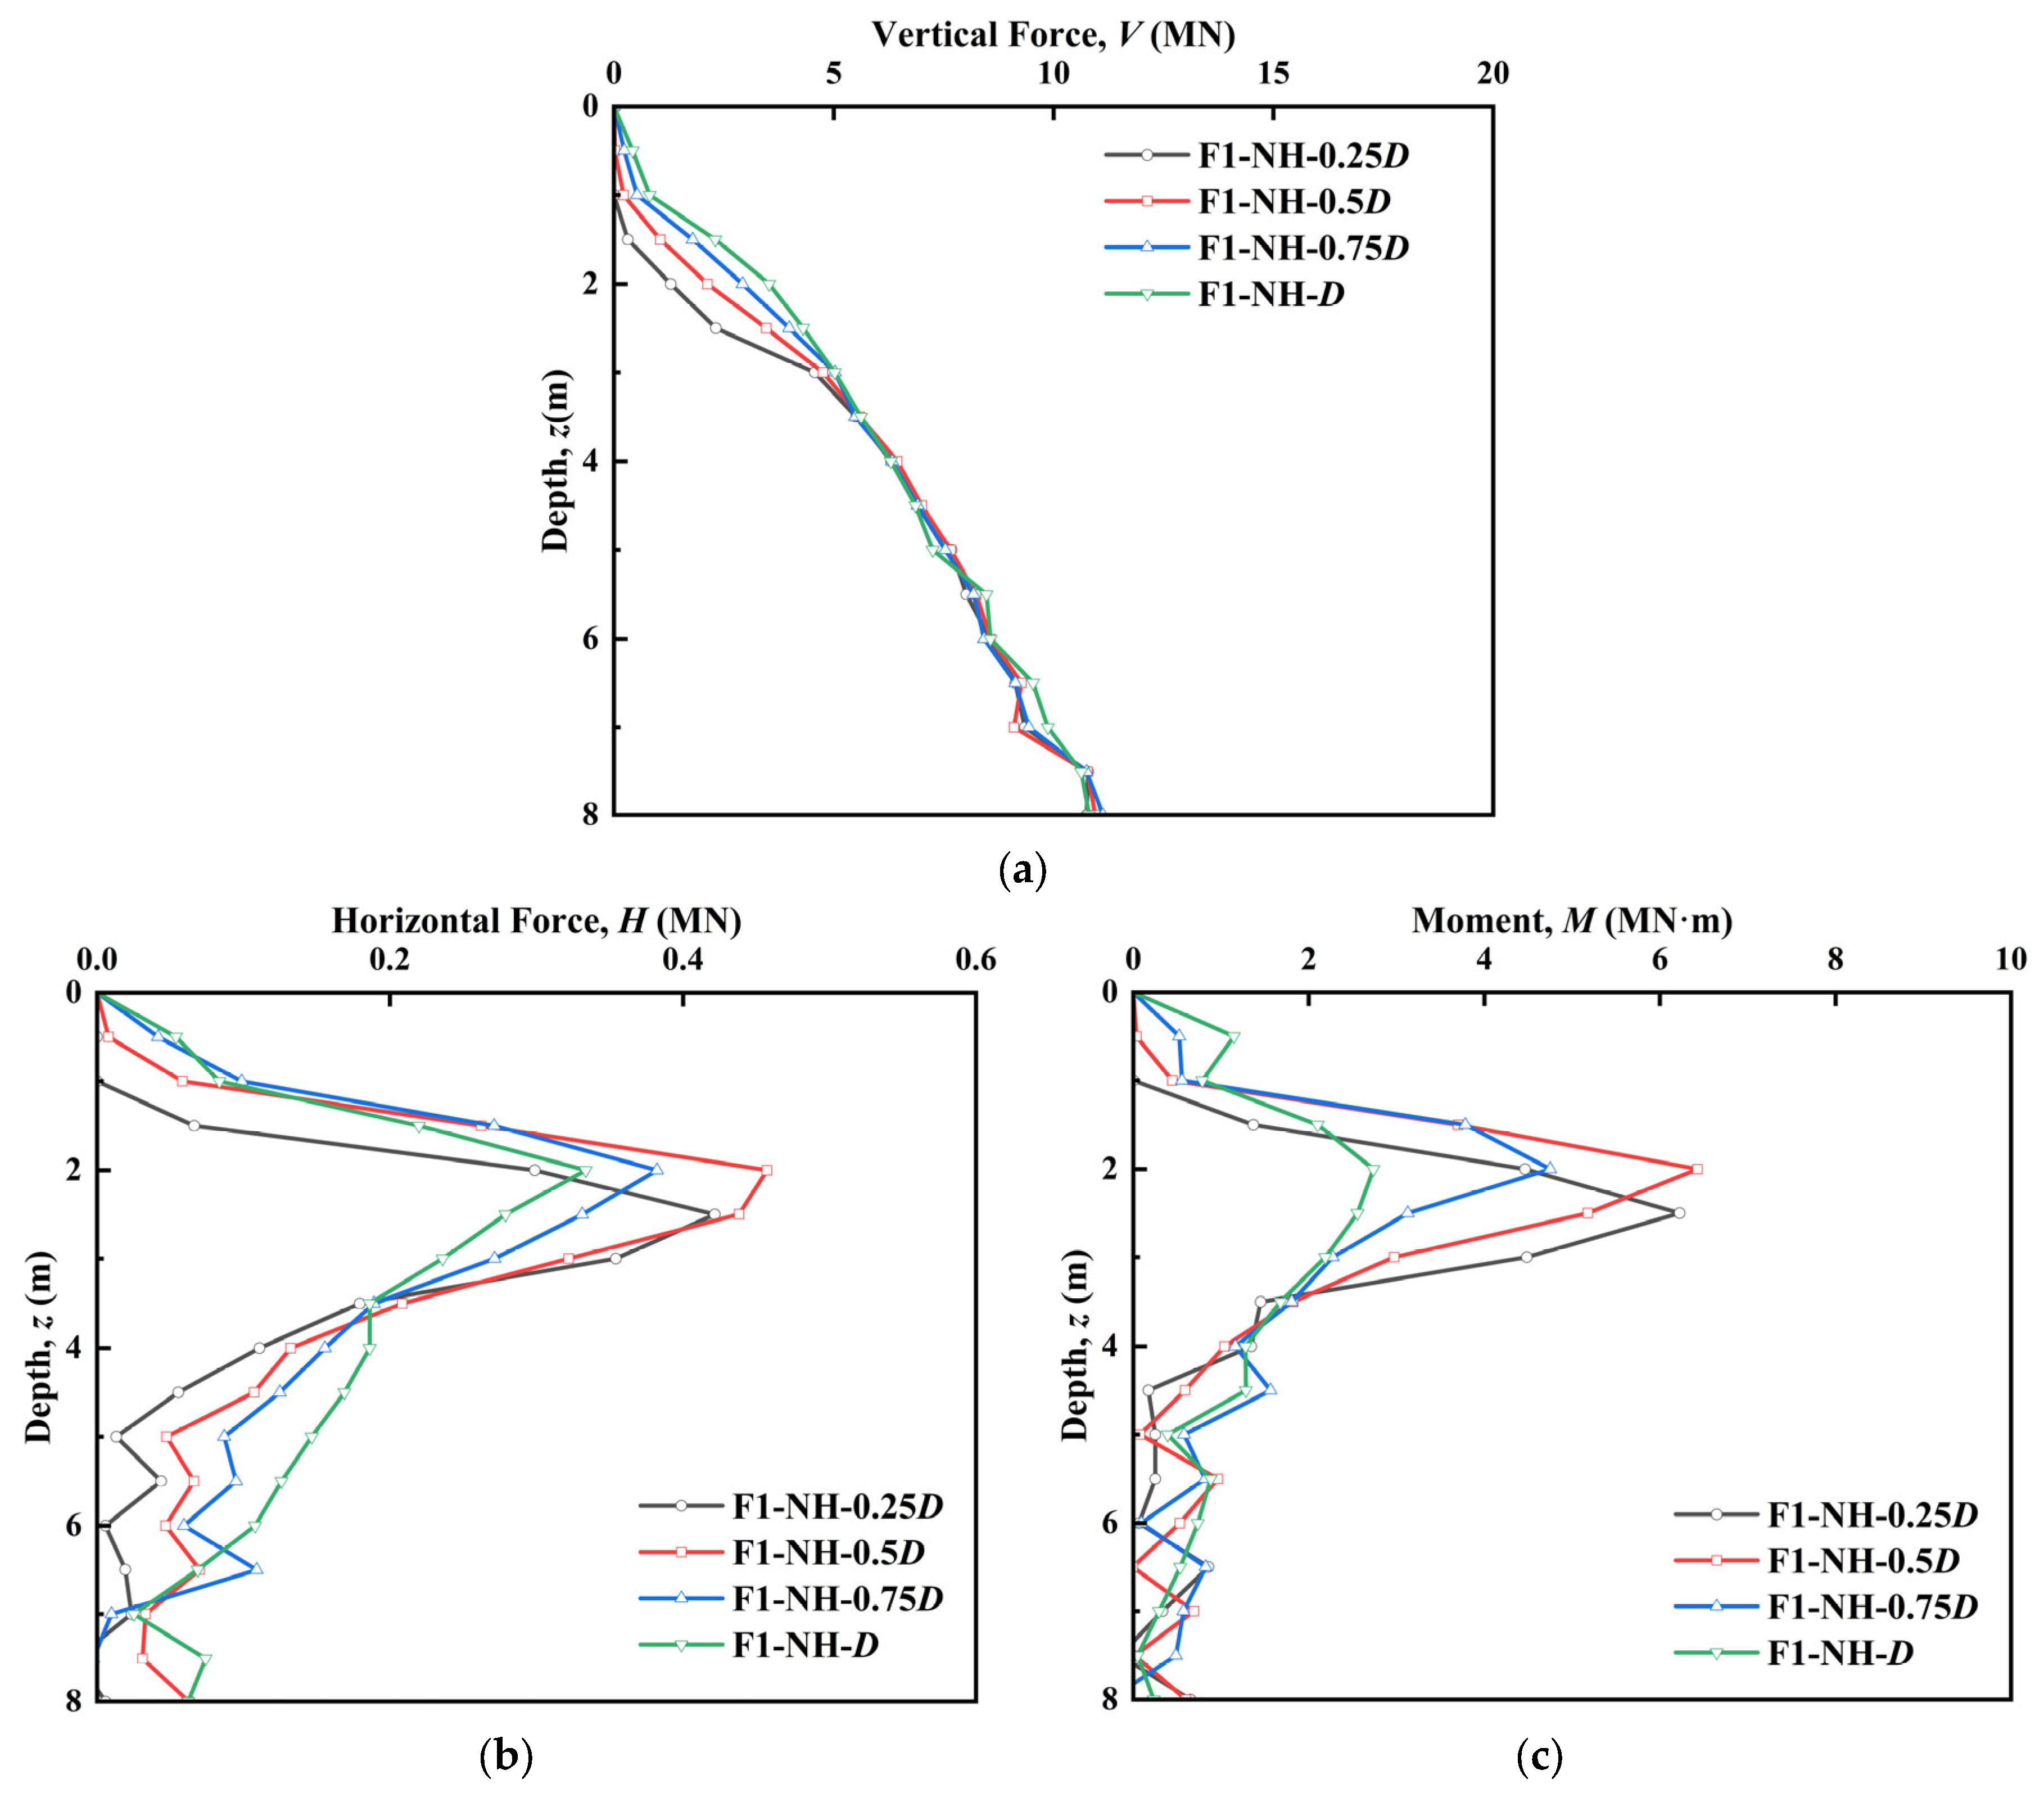
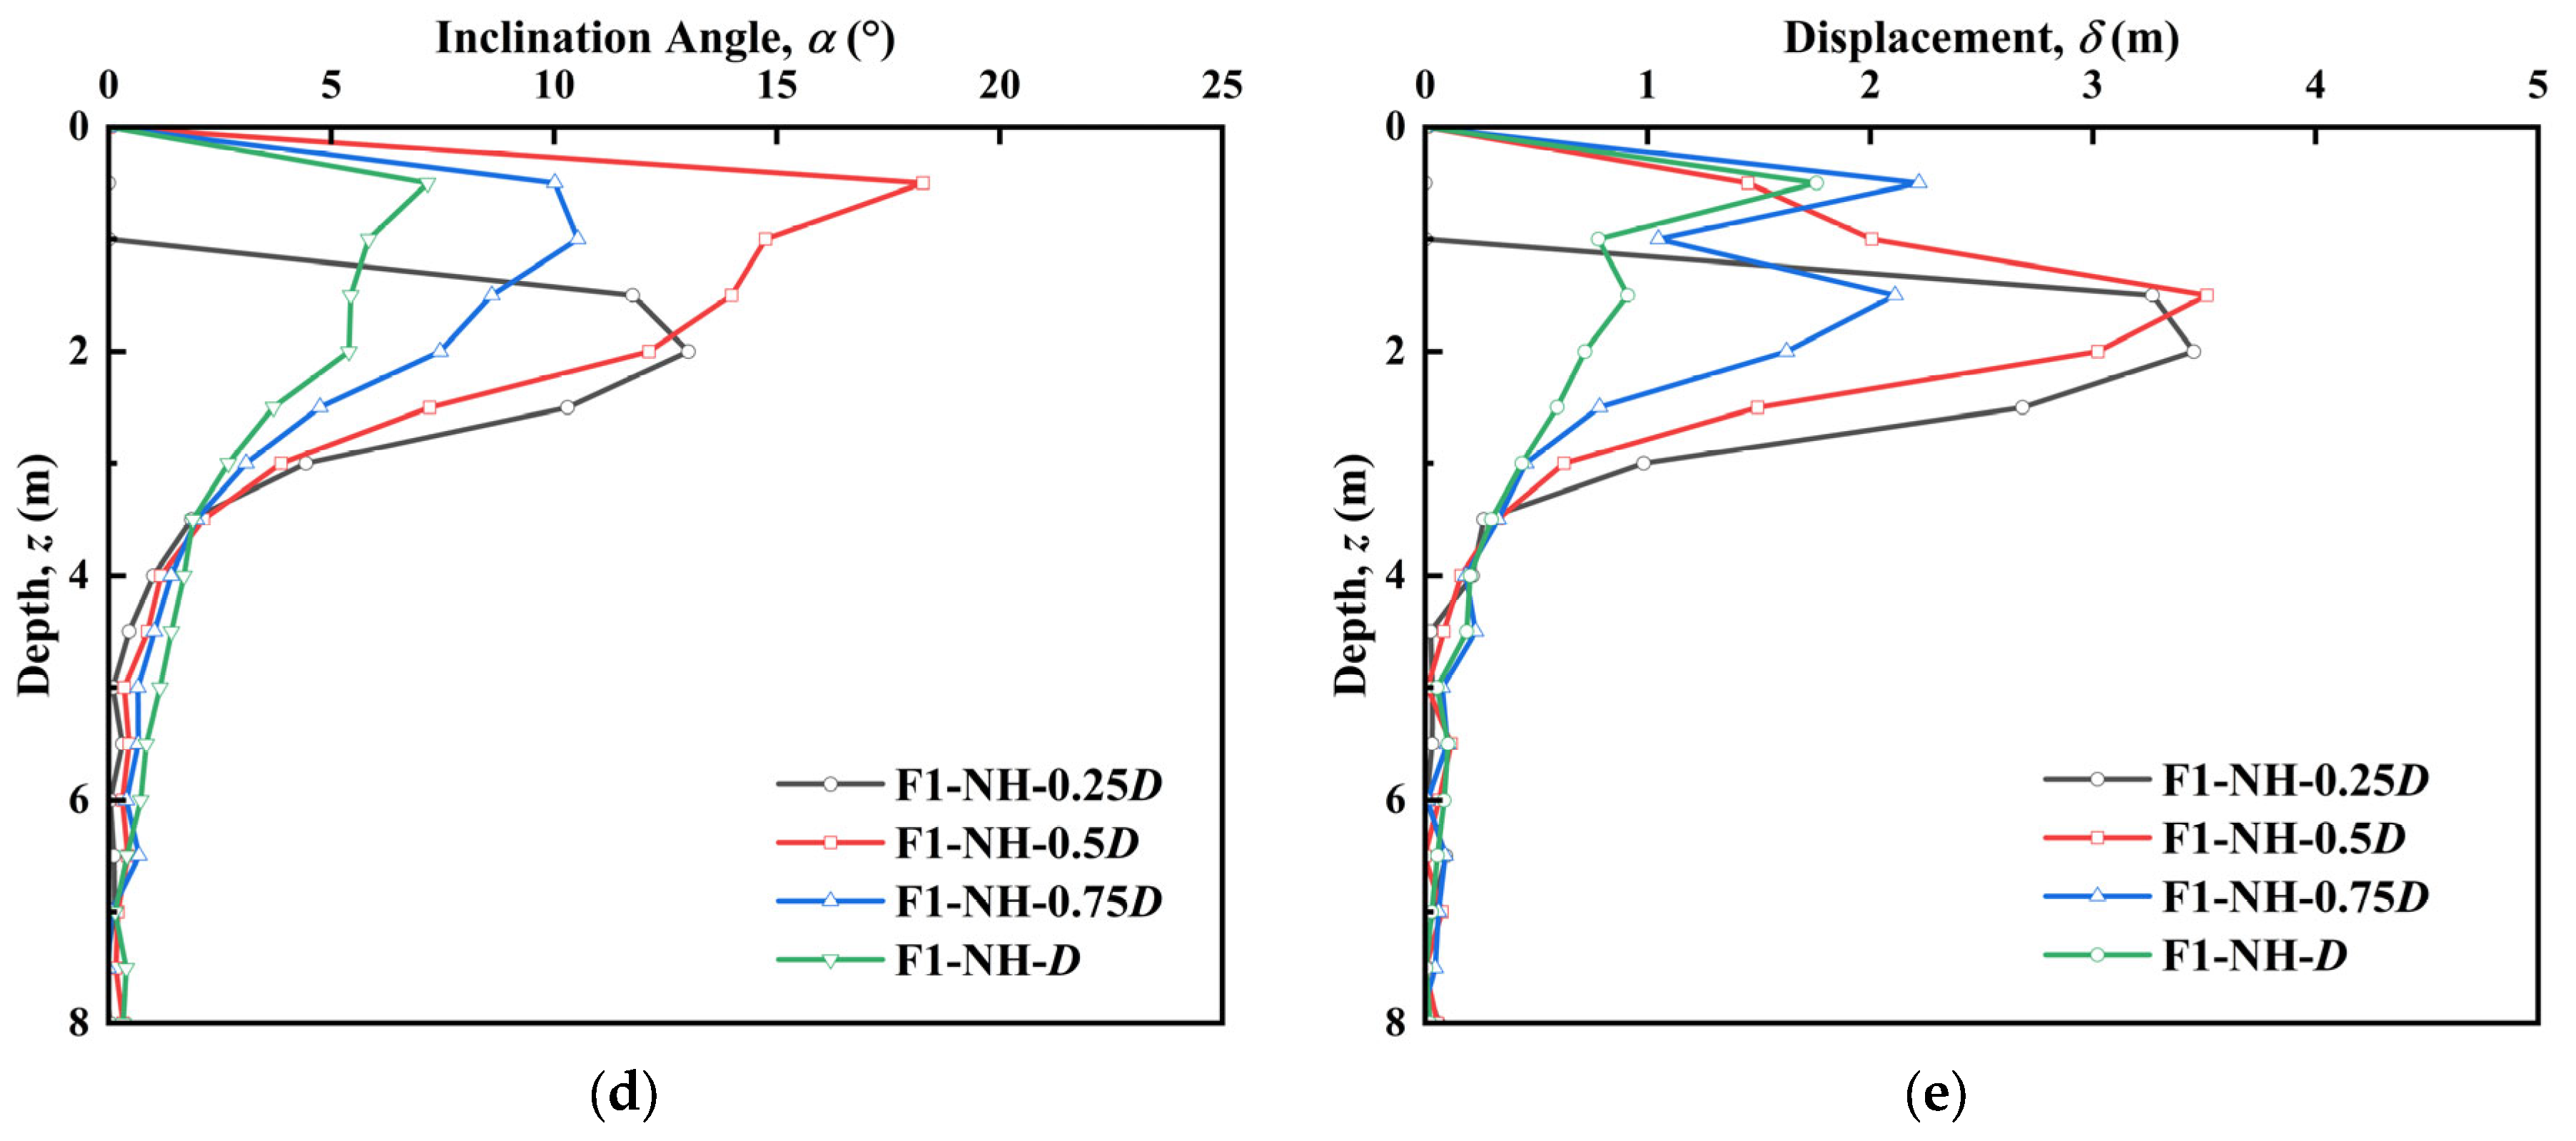
In order to systematically study the influence of the offset distance on the mechanical behavior of the spudcan during the reinstallation process, a parametric numerical study with an offset distance of 0.25D~D was carried out. All simulations used the same footprint geometry (F1) and spudcan type (NH-4), corresponding to conditions 1, 6 and 7–8, respectively. Figure 11 illustrates the variation in vertical force, horizontal force, moment, inclination angle and displacement with the reinstallation depth in each case, and the peak values of these indicators are summarized in Table 5.
As shown in Figure 11b,c and Table 5, the influence of offset distance on horizontal force and moment is significant. As the offset distance increases from 0.25 D to 0.5 D, both H and M show an increasing trend, reaching a maximum at 0.5 D (moment is 6.428 MN·m, horizontal force is 0.457 MN). However, as the offset distance increases from 0.5D to D, both responses gradually decrease. This can be explained as that the asymmetric soil flow around the spudcan contributes significantly to the total horizontal force at a small offset distance. However, as the offset distance increases, the soil distribution around the spudcan tends to be symmetrical, resulting in a decrease in horizontal force and moment.
The inclination angle and lateral displacement were calculated based on the vertical forces for each case. According to Figure 11d,e, along with the data summarized in Table 5, when the offset distance increases from 0.25 D to 0.5 D, the inclination angle rises from 13.016° to 18.279°, and the displacement increases from 3.453 m to 3.512 m. Conversely, as the offset distance continues to increase from 0.5 D to D, both the inclination angle and displacement gradually decrease. Therefore, it can be concluded that the stability during reinstallation is worst when the offset distance is 0.5 D.

3.2. Orthogonal Test Analysis

Orthogonal test is a method of replacing the comprehensive test with a representative test subset, thereby significantly reducing material consumption and time cost. Orthogonal table, the fundamental tool of this method, can determine the relative importance of different factors. Based on the results of the single-factor tests, an orthogonal test design was further conducted to quantitatively evaluate the relative influence degree of each factor. Table 6 presents the factor levels, and the orthogonal test Table L9(34) with the test results of the maximum inclination angle (αmax) and the maximum displacement (δmax) is shown in Table 7. By calculating the mean values of each factor index at different levels (K1, K2, K3) and the range ( R ¯ ), as summarized in Table 7, the influence of each factor was ranked seperately for the inclination angle and the displacement.
The ranking results of each index in Table 8 were normalized to obtain the influence ranking of the three factors, as shown in Figure 12. In Figure 12, red represents the αmax index, blue represents the δmax index, and the number represents the order of the influence of each factor on the corresponding index. It can be observed that the offset distance has the greatest effect on the reinstallation performance among the three factors, while the footprint geometry and the spudcan type are relatively small.

4. Conclusions

In this study, a comprehensive evaluation of spudcan reinstallation close to the natural footprint is conducted. The strength reduction method is introduced into the CEL method, and two types of tests including single-factor test and orthogonal test are conducted to evaluate the influence of key factors including footprint geometry, spudcan type, and offset distance on the spudcan reinstallation. The main conclusions are as follows:
(1)
The geometry of the natural footprint has a significant effect on the reinstallation behavior of the spudcan. The lateral size (diameter) of the footprint is more critical than its depth. The larger diameter leads to severer soil asymmetry, resulting in higher horizontal force, moments, and greater inclination and displacement, thereby reducing the reinstallation stability.
(2)
The shape and size of different spudcan types would affect their reinstallation stability. Compared with the circular flat-based spudcan, the rectangular spudcan with a tapered base shows greater horizontal force and moment due to the corner effect. At the same time, the larger spudcan diameter provides a larger contact area and increases the vertical force, thereby reducing the spudcan inclination and lateral displacement.
(3)
The offset distance is the main factor affecting the reinstallation behavior, and the least favorable condition occurs at the offset distance of 0.5 D. When the offset is smaller than this distance, the obvious soil asymmetry leads to a larger inclination angle and a larger lateral displacement. When the offset distance exceeds 0.5 D, the soil distribution becomes more symmetrical, which reduces the inclination and displacement, thereby improving the overall stability of the reinstallation process near the existing footprint.
(4)
Both single-factor test and orthogonal analysis show that among the three factors evaluated, the offset distance has the greatest influence on the reinstallation performance compared with the footprint geometry and spudcan type.
It should be noted that the analysis is conducted under undrained conditions and does not account for pore water pressure dissipation or consolidation effects, which may influence the long-term reinstallation behavior in real seabed environments. Additionally, the strength reduction zone is defined statically and does not capture its temporal evolution or spatial asymmetry during spudcan removal and soil remolding. These aspects will be addressed in future studies, which could explore coupled consolidation models and time-dependent, three-dimensional characterization of soil softening and recovery around spudcan footprints.

Author Contributions

Conceptualization, J.J. and G.X.; methodology, X.Z. and L.C.; software, X.Z., L.C. and X.G.; validation, X.Z. and L.C.; formal analysis, L.C., X.G. and X.L.; investigation, X.Z., L.C., X.G. and G.C.; resources, X.Z., J.J. and G.X.; data curation, X.Z.; writing—original draft preparation, X.Z. and L.C.; writing—review and editing, X.G. and G.C.; visualization, X.L.; supervision, J.J.; project administration, G.X.; funding acquisition, J.J. All authors have read and agreed to the published version of the manuscript.

Funding

This research was supported by a foresight technology project of CNOOC Research Institute Ltd. (KJQZ-2024-2002).

Institutional Review Board Statement

Not applicable.

Informed Consent Statement

Not applicable.

Data Availability Statement

The original contributions presented in this study are included in the article. Further inquiries can be directed to the corresponding author.

Conflicts of Interest

Authors Xin Zou, Jingang Jiao and Guoxian Xu were employed by the company CNOOC Research Institute Ltd. The remaining authors declare that the research was conducted in the absence of any commercial or financial relationships that could be construed as a potential conflict of interest.

References

  1. Gan, C.T.; Leung, C.F.; Cassidy, M.J.; Gaudin, C.; Chow, Y.K. Effect of Time on Spudcan–Footprint Interaction in Clay. Géotechnique 2012, 62, 401–413. [Google Scholar] [CrossRef]
  2. Sun, Z.Y.; Gao, P.; Gao, Y.L.; Bi, J.Z.; Gao, Q. Probabilistic Prediction of Spudcan Bearing Capacity in Stiff-over-Soft Clay Based on Bayes’ Theorem. J. Mar. Sci. Eng. 2025, 13, 1344. [Google Scholar] [CrossRef]
  3. Butterfield, R.; Houlsby, G.T.; Gottardi, G. Standardized Sign Conventions and Notation for Generally Loaded Foundations. Géotechnique 1997, 47, 1051–1054. [Google Scholar] [CrossRef]
  4. Randolph, M.; Cassidy, M.; Gourvenec, S.; Erbrich, C. Challenges of Offshore Geotechnical Engineering. In Proceedings of the 16th International Conference on Soil Mechanics and Geotechnical Engineering, Osaka, Japan, 12–16 September 2005. [Google Scholar]
  5. Stewart, D.P.; Finnie, I.M.S. Spudcan-Footprint Interaction during Jack-up Workovers. In Proceedings of the 11th International Offshore and Polar Engineering Conference, Stavanger, Norway, 17–22 June 2001. [Google Scholar]
  6. Gaudin, C.; Cassidy, M.J.; Donovan, T. Spudcan Reinstallation near Existing Footprints. In Proceedings of the 6th International Offshore Site Investigation and Geotechnics Conference: Confronting New Challenges and Sharing Knowledge, London, UK, 11–13 September 2007. [Google Scholar]
  7. Hunt, R.J.; Marsh, P.D. pportunities to Improve the Operational and Technical Management of Jack-up Deployments. Mar. Struct. 2004, 17, 261–273. [Google Scholar] [CrossRef]
  8. Young, A.G.; Remmes, B.D.; Meyer, B.J. Foundation Performance of Offshore Jack-up Drilling Rigs. J. Geotech. Eng. 1984, 110, 841–859. [Google Scholar] [CrossRef]
  9. Li, Y.; Zhou, Y.; Tao, J.; Zhang, C. Numerical Study of Spudcan Penetration Induced Loading on an Adjacent Jacket Pile in Soft Clays. In Proceedings of the 25th International Ocean and Polar Engineering Conference, Kona, HI, USA, 21–26 June 2015. [Google Scholar]
  10. Dier, A.; Carroll, B.; Abolfathi, S. Guidelines for Jack-Up Rigs with Particular Reference to Foundation Integrity; MSL Engineering Limited: Ringaskiddy, Ireland, 2004. [Google Scholar]
  11. Cassidy, M.J.; Quah, C.K.; Foo, K.S. Experimental Investigation of the Reinstallation of Spudcan Footings Close to Existing Footprints. J. Geotech. Geoenvironmental Eng. 2009, 135, 474–486. [Google Scholar] [CrossRef]
  12. Yuan, Y.; Duan, M.L.; Zhang, C.L.; Gao, P.; Bai, X.L. Experimental study on the global behaviour of jack-up unit reinstalled near a footprint. Appl. Ocean Res. 2021, 106, 102456. [Google Scholar] [CrossRef]
  13. Hendriyawan, D.; Vebrian, A.; Denny, T.; Indra, N.H.; Rildova; Farid, P.B. Effects of Prior Footprints on the Bearing Capacity of Spudcan Foundations: A Case Study. IOP Conf. Ser. Earth Environ. Sci. 2023, 1249, 012032. [Google Scholar] [CrossRef]
  14. Kong, V.; Cassidy, M.J.; Gaudin, C. Experimental Study of Effect of Geometry on Reinstallation of Jack-up next to Footprint. Can. Geotech. J. 2013, 50, 557–573. [Google Scholar] [CrossRef]
  15. Kong, V.; Cassidy, M.J.; Gaudin, C. Failure Mechanisms of a Spudcan Penetrating next to an Existing Footprint. Theor. Appl. Mech. Lett. 2015, 5, 64–68. [Google Scholar] [CrossRef]
  16. Fang, Y.S.; Shih, Y.C.; Liu, C.; Hsieh, J.Y. Reduction of footprint problems on spudcan in sand with infilling method Available to Purchase. Int. J. Phys. Model. Geotech. 2023, 23, 150–165. [Google Scholar]
  17. Hartono, H.; Tho, K.K.; Leung, C.F.; Chow, Y.K. Centrifuge and Numerical Modelling of Reaming as a Mitigation Measure for Spudcan-Footprint Interaction. In Proceedings of the Offshore Technology Conference-Asia, Kuala Lumpur, Malaysia, 25–28 March 2014. [Google Scholar]
  18. Qiu, G.; Henke, S. Controlled Installation of Spudcan Foundations on Loose Sand Overlying Weak Clay. Mar. Struct. 2011, 24, 528–550. [Google Scholar] [CrossRef]
  19. Hamann, T.; Qiu, G.; Grabe, J. Application of a Coupled Eulerian–Lagrangian Approach on Pile Installation Problems under Partially Drained Conditions. Comput. Geotech. 2015, 63, 279–290. [Google Scholar] [CrossRef]
  20. Tho, K.K.; Leung, C.F.; Chow, Y.K.; Swaddiwudhipong, S. Eulerian Finite-Element Technique for Analysis of Jack-up Spudcan Penetration. Int. J. Geomech. 2012, 12, 64–73. [Google Scholar]
  21. Yu, L.; Zhang, H.; Li, J.; Wang, X. Finite Element Analysis and Parametric Study of Spudcan Footing Geometries Penetrating Clay Near Existing Footprints. J. Mar. Sci. Eng. 2019, 7, 175. [Google Scholar] [CrossRef]
  22. Gao, P.; Liu, Z.; Shi, D.; Fu, X.; Yan, K. Mitigation Effect of Perforation Drilling on the Sliding Risk during Spudcan Installation Close to Footprints. J. Mar. Sci. Eng. 2020, 8, 118. [Google Scholar] [CrossRef]
  23. Yu, L.; Zhang, H.Y.; Liu, J.; Huang, Y. Numerical Study of Footprint Generation and Reinstallation of Jack-Up Footings. J. Geotech. Geoenvironmental Eng. 2021, 147, 04021089. [Google Scholar] [CrossRef]
  24. Yu, H.F.; Sun, Z.Z.; He, L.L.; Yang, L. Research on Optimal Design of Spudcan Structures to Ease Spudcan-Footprint Interactions in Clay and Comparative Analyses with Different Measures. Pol. Marit. Res. 2022, 29, 43–56. [Google Scholar] [CrossRef]
  25. Yang, L.; Yang, J.; Cheng, L.; Ma, C. Bearing mechanism analysis and PSO-CatBoost error-corrected prediction for spudcan reinstallation over existing footprints in spatially variable clay. Ocean Eng. 2025, 340, 122422. [Google Scholar] [CrossRef]
  26. Dean, E.T.R. A Spudcan Foundation Model with Excess Pore Pressures. Part 1. A Principle of Effective Loads. Mar. Struct. 2004, 17, 219–243. [Google Scholar] [CrossRef]
  27. Byrne, B.W.; Villalobos, F.; Houlsby, G.T.; Martin, C.M. Laboratory Testing of Shallow Skirted Foundations in Sand. In Proceedings of the BGA International Conference on Foundations: Innovations, Observations, Design and Practice, Dundee, Scotland, 2–5 September 2003. [Google Scholar]
  28. Landon, M.M.; Gaudin, C.; Cassidy, M.J. Jack-up Installation on an Uneven Seabed: Recommendations from Model Testing in Overconsolidated Clay. In Proceedings of the 28th International Conference on Ocean, Offshore and Arctic Engineering, Honolulu, HI, USA, 31 May–5 June 2009. [Google Scholar]
  29. Leung, C.F.; Gan, C.T.; Chow, Y.K. Shear Strength Changes within Jack-up Spudcan Footprint. In Proceedings of the 17th International Offshore and Polar Engineering Conference, Lisbon, Portugal, 1–6 July 2007. [Google Scholar]
  30. Gan, C. Centrifuge Model Study on Spudcan-Footprint Interaction. Ph.D. Thesis, National University of Singapore, Singapore, 2009. [Google Scholar]
  31. Hossain, M.S.; Dong, X. Extraction of Spudcan Foundations in Single and Multilayer Soils. J. Geotech. Geoenvironmental Eng. 2014, 140, 170–184. [Google Scholar] [CrossRef]
  32. Jun, M.J.; Kim, Y.H.; Hossain, M.S.; Cassidy, M.J.; Hu, Y.; Sim, J.W. Numerical Investigation of Novel Spudcan Shapes for Easing Spudcan-Footprint Interactions. J. Geotech. Geoenvironmental Eng. 2018, 144, 4018055. [Google Scholar] [CrossRef]
  33. Jun, M.J.; Kim, Y.H.; Hossain, M.S.; Cassidy, M.J.; Hu, Y.; Park, S.G. Optimising Spudcan Shape for Mitigating Horizontal and Moment Loads Induced on a Spudcan Penetrating near a Conical Footprint. Appl. Ocean Res. 2018, 79, 62–73. [Google Scholar] [CrossRef]
  34. Jun, M.J.; Kim, Y.H.; Hossain, M.S.; Cassidy, M.J.; Hu, Y.; Park, S.G. Global Jack-up Rig Behaviour next to a Footprint. Mar. Struct. 2019, 64, 421–441. [Google Scholar] [CrossRef]
  35. Yuan, Y.; Fan, L.; Li, J.; Gao, J.; Duan, M. Numerical Investigation on Reinstallation of Jack-up Unit with Rectangular Spudcan Close to Footprint. Ocean Eng. 2022, 252, 111212. [Google Scholar] [CrossRef]
  36. Hu, P.; Wang, D.; Cassidy, M.; Cassidy, M.; Stanier, S.A. Predicting the resistance profile of a spudcan penetrating sand overlying clay. Can. Geotech. J. 2014, 51, 1151–1164. [Google Scholar] [CrossRef]
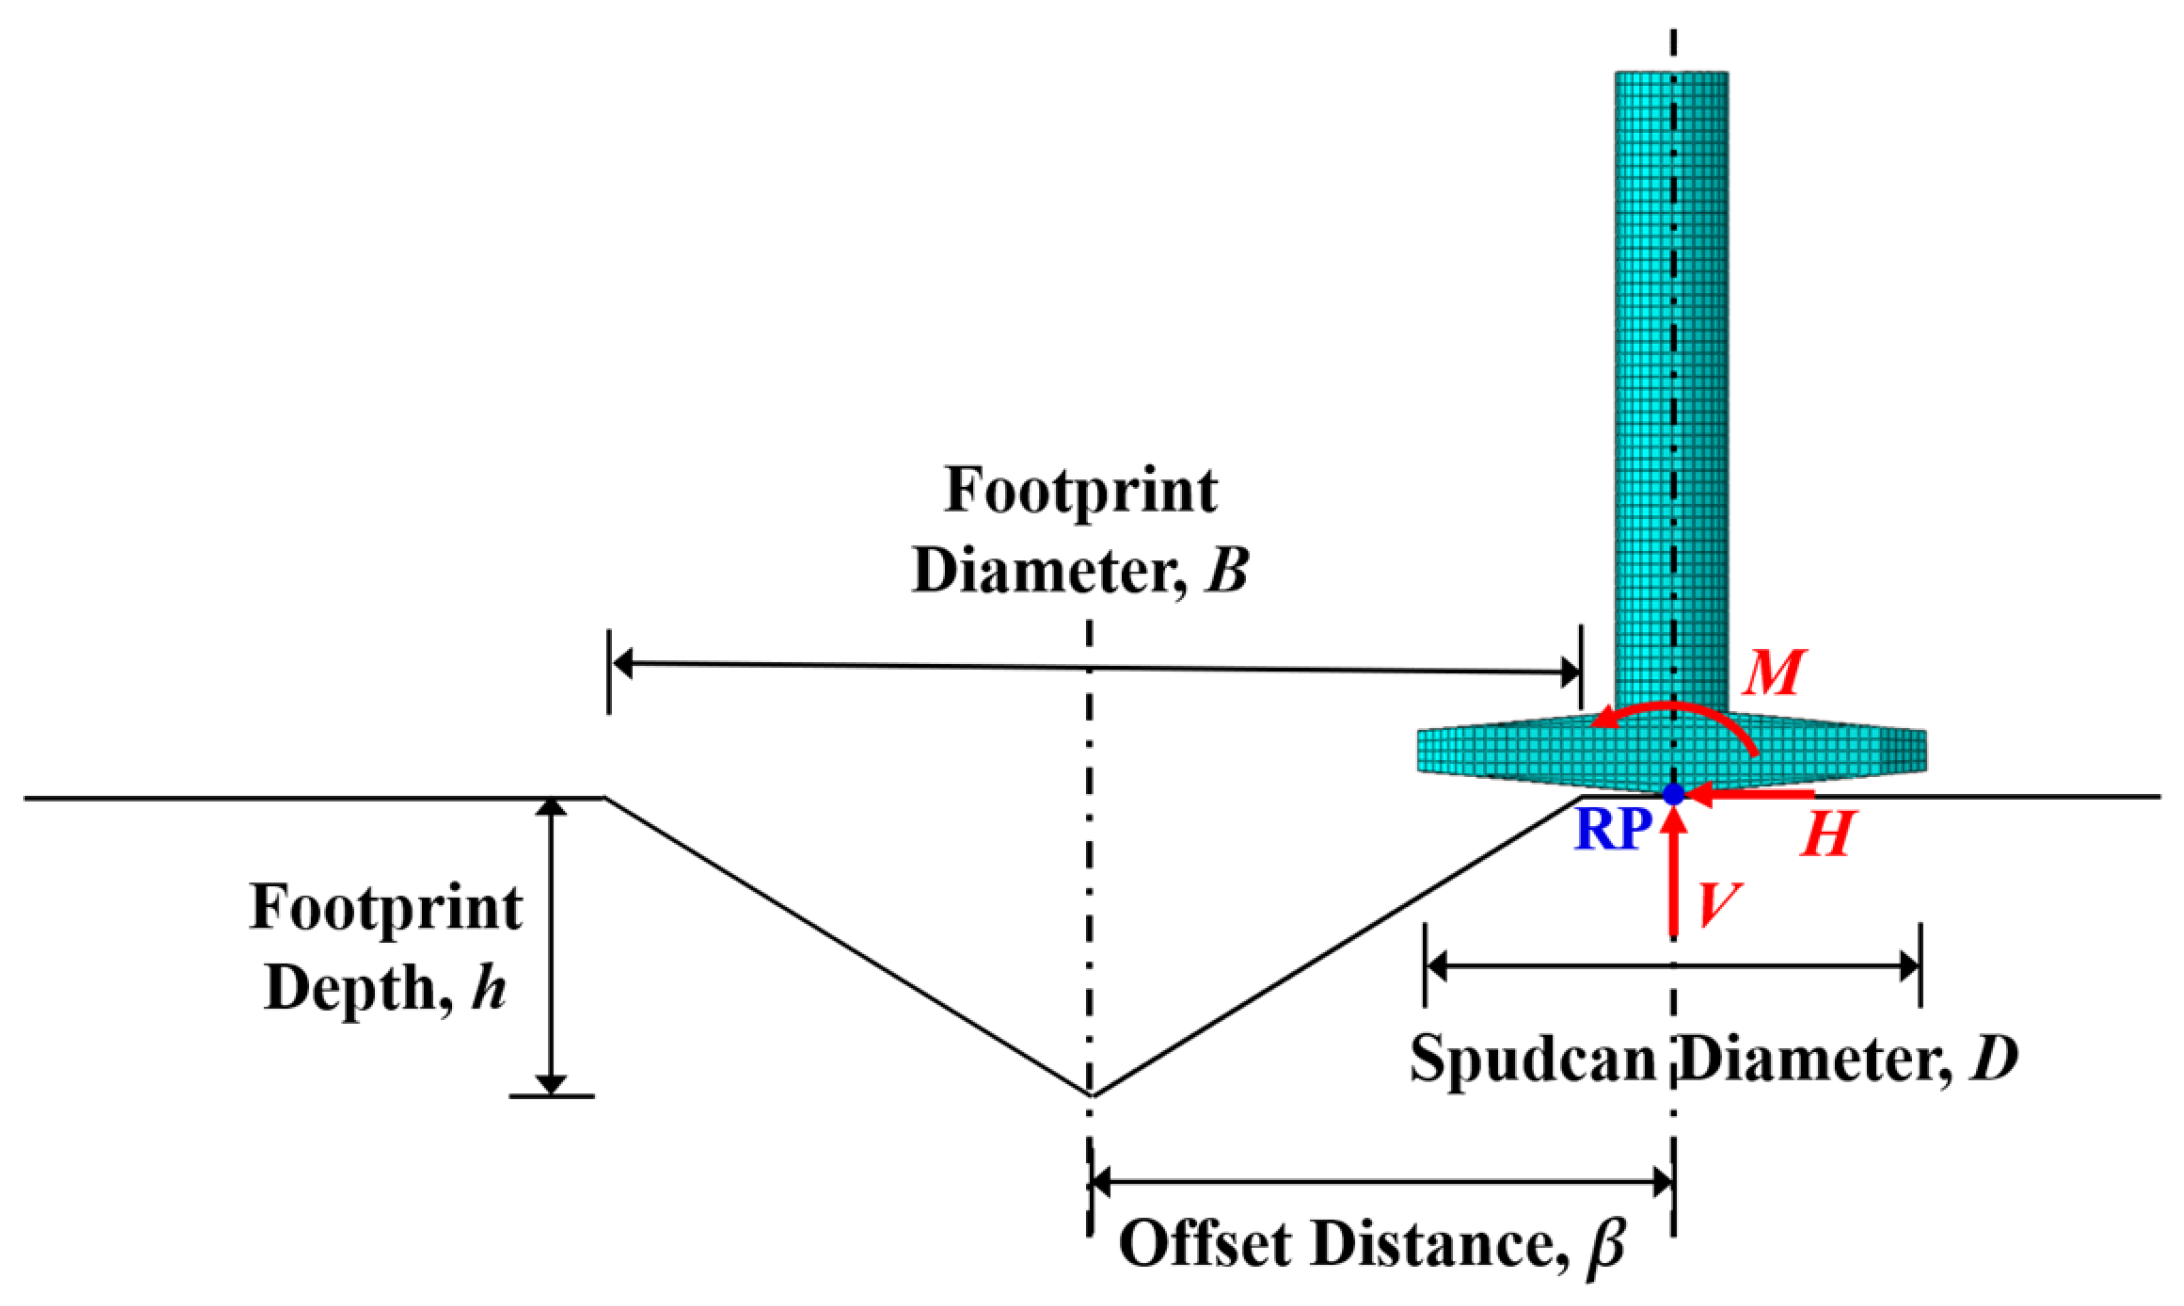
Figure 1. Sign convention and definition of terminology.
Applsci 15 11765 g001
Figure 3. Geometry of the soil domain.
Applsci 15 11765 g003
Figure 4. Mesh layout of the numerical model: (a) side view; (b) top view.
Applsci 15 11765 g004
Figure 5. Schematic diagram of strength reduction zone.
Applsci 15 11765 g005
Figure 6. Comparison of simulated and centrifuge test results: (a) Horizontal force; (b) Moment. (Kong et al. [14]).
Applsci 15 11765 g006
Figure 7. Dimensions of three natural footprints.
Applsci 15 11765 g007
Figure 8. Computed spudcan responses for different footprint geometries (Cases 1–3): (a) Vertical force; (b) Horizontal force; (c) Moment; (d) Inclination angle; (e) Displacement.
Applsci 15 11765 g008
Figure 9. Geometrical models of the three spudcan types: (a) HY944; (b) HY941; (c) NH-4.
Applsci 15 11765 g009
Figure 10. Computed spudcan responses for different spudcan types (Cases 4, 5 and 1): (a) Vertical force; (b) Horizontal force; (c) Moment; (d) Inclination angle; (e) Displacement.
Applsci 15 11765 g010
Figure 11. Computed spudcan responses for different offset distances (Cases 1, 6, and 7–8): (a) Vertical force; (b) Horizontal force; (c) Moment; (d) Inclination angle; (e) Displacement.
Applsci 15 11765 g011aApplsci 15 11765 g011b
Figure 12. Normalized effect of each parameter.
Applsci 15 11765 g012
Table 1. Dimensions and strength degradation factors of remolded footprints.
FootprintDiameter, B (m)Depth, h (m)Strength Reduction Factor (%)
F1 (HY944)226.5263.76
F2 (HY941)18.57.3461.93
F3 (NH-4)28.25.164.69
Table 2. Design of single-factor tests.
Case No.Case NameFootprint
Geometry
Spudcan
Type
Offset
Distance
1F1-NH-0.5DF1NH-40.5D
2F2-NH-0.5DF2NH-40.5D
3F3-NH-0.5DF3NH-40.5D
4F1-HY944-0.5DF1HY9440.5D
5F1-HY941-0.5DF1HY9410.5D
6F1-NH-0.25DF1NH-40.25D
7F1-NH-0.75DF1NH-40.75D
8F1-NH-DF1NH-4D
Table 3. Summary of peak spudcan responses for different footprint geometries (Cases 1–3).
Case No.Case NameMaximum Horizontal ForceMaximum Moment
Hmax (MN)αmax (°)Mmax (MN·m)δmax (m)
1F1-NH-0.5D0.45718.2796.4283.512
2F2-NH-0.5D0.36816.4865.8232.558
3F3-NH-0.5D0.49119.0256.4584.504
Table 4. Summary of peak spudcan responses for different spudcan types (Cases 4, 5 and 1).
Case No.Case NameMaximum Horizontal ForceMaximum Moment
Hmax (MN)αmax (°)Mmax (MN·m)δmax (m)
4F1-HY944-0.5D0.51315.12512.7853.354
5F1-HY941-0.5D0.43818.2365.9673.676
1F1-NH-0.5D0.45718.2796.4283.512
Table 5. Summary of peak spudcan responses for different offset distances (Cases 1, 6, and 7–8).
Case No.Case NameMaximum Horizontal ForceMaximum Moment
Hmax (MN)αmax (°)Mmax (MN·m)δmax (m)
6F1-NH-0.25D0.42213.0166.2263.453
1F1-NH-0.5D0.45718.2796.4283.512
7F1-NH-0.75D0.38210.5334.7502.219
8F1-NH-D0.3347.1602.7361.758
Table 6. Table of factor levels for the orthogonal test.
FactorLevel 1Level 2Level 2
Footprint geometryF1F2F3
Spudcan typeHY944HY941NH-4
Offset distance0.25D0.5D0.75D
Table 7. Table L9(34) and results of the orthogonal test.
Case
No.
FactorResult
Footprint
Geometry
Spudcan
Type
Offset
Distance
αmax (°)δmax (m)
F1HY9440.25D13.955.05
F1HY9410.5D15.893.73
F1NH-40.75D10.782.20
F2HY9440.5D13.563.11
F2HY9410.75D11.432.35
F2NH-40.25D16.225.09
F3HY9440.75D9.832.56
F3HY9410.25D20.056.50
F3NH-40.5D17.034.37
Table 8. Results of level average analysis for αmax and δmax.
ResultFactorK1K2K3 R ¯ Ranking
αmax(°)Footprint geometry13.54 13.74 15.64 2.10 3
Spudcan type12.45 15.79 14.68 3.35 2
Offset distance16.74 15.49 10.68 6.06 1
δmax(m)Footprint geometry3.66 3.52 4.480.96 2
Spudcan type3.57 4.20 3.89 0.62 3
Offset distance5.55 3.74 2.37 3.18 1
Disclaimer/Publisher’s Note: The statements, opinions and data contained in all publications are solely those of the individual author(s) and contributor(s) and not of MDPI and/or the editor(s). MDPI and/or the editor(s) disclaim responsibility for any injury to people or property resulting from any ideas, methods, instructions or products referred to in the content.