Article

Parametric Study and Hemocompatibility Assessment of a Centrifugal Blood Pump Based on CFD Simulation and Experimental Validation

School of Mechanical and Power Engineering, Harbin University of Science and Technology, Harbin 150080, China
*
Authors to whom correspondence should be addressed.
Appl. Sci. 2025, 15(21), 11710; https://doi.org/10.3390/app152111710 (registering DOI)
Submission received: 5 September 2025 / Revised: 26 October 2025 / Accepted: 30 October 2025 / Published: 2 November 2025
(This article belongs to the Section Biomedical Engineering)

Abstract

The heart is the body’s core pump. Heart failure impairs the heart’s ability to pump blood, leading to circulatory disorders. The artificial heart (blood pump) is an important mechanical circulatory support device that can partially or completely substitute cardiac pumping function, potentially improving hemodynamic performance and alleviating symptoms of heart failure. A combination of computational fluid dynamics simulation and hydraulic performance testing was used to study key parameters of the impeller, including blade count, blade wrap angle, impeller flow path, and diversion cone height. The goal was to reduce hemolysis risk and enhance pumping efficiency. Increasing the blade count raised the head, with optimal efficiency achieved at seven blades. A larger blade wrap angle decreased the head but improved efficiency. Synchronizing the flow path and diversion cone height at 4.1 mm maximized the head. Under various rotational speeds, the studied hemolysis index remained well below 0.1 g/100 L. Both experimental and simulation data were validated against each other, meeting the required error tolerances. The studied blood pump meets the design specifications. At an operating condition of 5 L/min flow rate and 2800 rpm, the pump achieves the required head and hemolysis criteria with a margin of safety.

1. Introduction

The heart, as the most vital organ in the human body, maintains systemic circulation through rhythmic contractions [1]. Frequent cardiac overload and cumulative myocyte injury precipitate cardiovascular diseases, progressively diminishing the heart’s pumping capacity and ultimately leading to heart failure [2]. An implantable ventricular assist device (VAD)—commonly referred to as an artificial heart or blood pump—is therefore employed to compensate for insufficient perfusion in end-stage heart failure. Owing to the intricate anatomical architecture, physiological parameters, and operating principles of the native heart, the VAD must be endowed with an appropriate geometry and studied operating conditions to achieve seamless integration with, and functional compensation of, the impaired circulation [3].
From a hydrodynamic perspective, a VAD is essentially a compact centrifugal pump. However, because it resides within the human body, its design must not only satisfy hydraulic performance targets but also minimize trauma to blood elements and surrounding tissues [4]. In clinical practice, after selecting an off-the-shelf blood pump that meets general requirements, implantation settings must balance head pressure against hemolysis [5]. Raising the speed to increase head immediately elevates the hemolysis index, whereas maintaining a low speed reduces blood supply. Optimizing the pump’s performance parameters is therefore of immediate practical importance.
Song et al. investigated the Kyoto-NTN magnetically levitated centrifugal pump featuring a dual-outlet volute. At a flow rate of 5 L/min and a rotational speed of 2000 rpm, impellers with varying blade numbers and profiles were assessed. Straight blades delivered the highest-pressure head, whereas backward-curved blades incurred the least hemolytic damage [6]. Zhou et al. developed a soft-magnetically levitated miniature centrifugal pump (SMLM) fabricated from compliant materials. Parametric analyses encompassing viscosity, rotational speed, and hydrostatic head revealed that an eight-blade impeller with a 60° blade exit angle yielded optimal performance in terms of delivered flow, maximum tilt angle, and rotor vibration amplitude [7]. Deng et al. varied the volute tongue radius and impeller geometry and found that altering the thickness of the impeller’s top and bottom shrouds and the tongue radius markedly affected both hydraulic performance and hemolysis, while the gap between impeller and volute strongly influenced overall efficiency and the impeller’s radial eccentric force [8]. Matthew et al. synthesized prior investigations on blade parameters, volute geometry, and secondary flow paths, confirming that configurational modifications directly alter hemolysis, inlet/outlet pressure differentials, and overall efficiency [9]. Although these studies employed orthogonal design, machine learning/genetic algorithms, and topology optimization for systematic parameter refinement, they did not simultaneously quantify the coupled variations in pressure head, efficiency, and hemolytic index arising from multi-parameter changes.
This study aims to develop a next-generation blood pump configuration that simultaneously offers high head and low hemolysis. Using the third-generation magnetically levitated centrifugal pump TERUMO DuraHeart II (Tokyo, Japan) as the baseline, and without increasing its nominal volume or adding extra components, we combine computational fluid dynamics (CFD) simulations with experimental validation to optimize key parameters—blade count, wrap angle, and diversion cone height. A three-dimensional flow model is built to assess how different parameter sets influence hydraulic performance and blood flow characteristics. By innovatively coupling hydraulic bench tests with hemolysis experiments, we not only corroborate the CFD predictions but also provide a direct evaluation of the pump’s blood compatibility.

2. Methods

2.1. Centrifugal Blood Pump Selection

The hydraulic performance of a blood pump is governed primarily by the impeller–volute assembly, whose geometry critically determines overall efficiency [10]. A closed impeller, defined by radial shrouds on both the hub and shroud sides, enforces superior hydraulic confinement and thereby maximizes energy transfer to the working fluid [11]. This configuration is particularly advantageous for implantable applications where high hydraulic efficiency must be reconciled with stringent volumetric constraints. Consequently, a closed-impeller architecture was adopted in this study, as illustrated in Figure 1a.
Volute casings are categorized, by cross-sectional contour, into circular, rectangular, and trapezoidal variants. Circular sections provide a smooth flow path yet are prone to secondary vortices near the outlet [12]. Trapezoidal profiles yield superior hydraulic characteristics but complicate fabrication and increase surface roughness. Rectangular cross-sections, conversely, combine geometric simplicity with high volumetric packing efficiency and straightforward manufacturability; comparative studies indicate that, under otherwise identical configurations, their hydraulic efficiency is only marginally inferior to that of trapezoidal designs [13]. Balancing hydraulic efficiency, manufacturability, and the hemocompatibility impact of surface roughness, we selected a rectangular-section volute paired with a closed impeller (Figure 1b) and proceeded to parametrically model and analyze this configuration.
Guided by the above selection criteria, the TERUMO DuraHeart II blood pump was chosen for this study.

2.2. Centrifugal Blood Pump Model Construction

A parametric model of the blood pump with a rectangular-section volute and a closed impeller was created using SolidWorks 2021 (Dassault Systèmes SolidWorks Corp., Waltham, MA, USA). During physical fabrication, sharp edges and corners of the impeller and casing were chamfered or fileted to reduce stress concentration, residual stress, and burrs. These small features minimally affect pump performance but reduce simulation efficiency, so they were simplified before meshing.
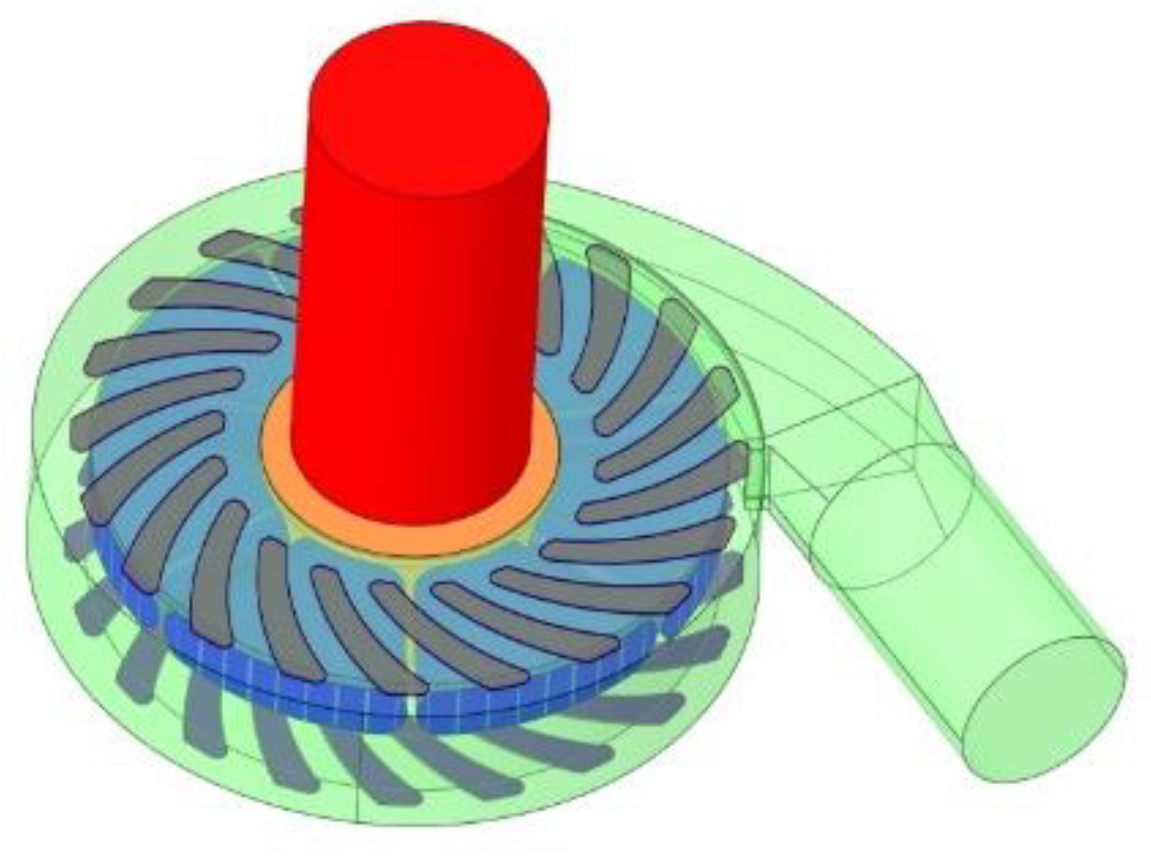
As the flow field contains both stationary and rotating regions, the internal fluid domain was extracted and divided into six parts: inlet passage, diversion cone passage, hydrodynamic bearing passage, volute passage, impeller passage, and outlet passage. Different mesh schemes can be combined as needed. The fluid domain and its divisions are shown in Figure 2.

2.3. Mesh Generation and Grid Independence Verification

Before finite-element simulation of the blood pump, the model must be meshed. The six regions were first meshed structurally in ICEM, then assembled; interfaces between regions were refined. The fluid-domain mesh is shown in Figure 3.
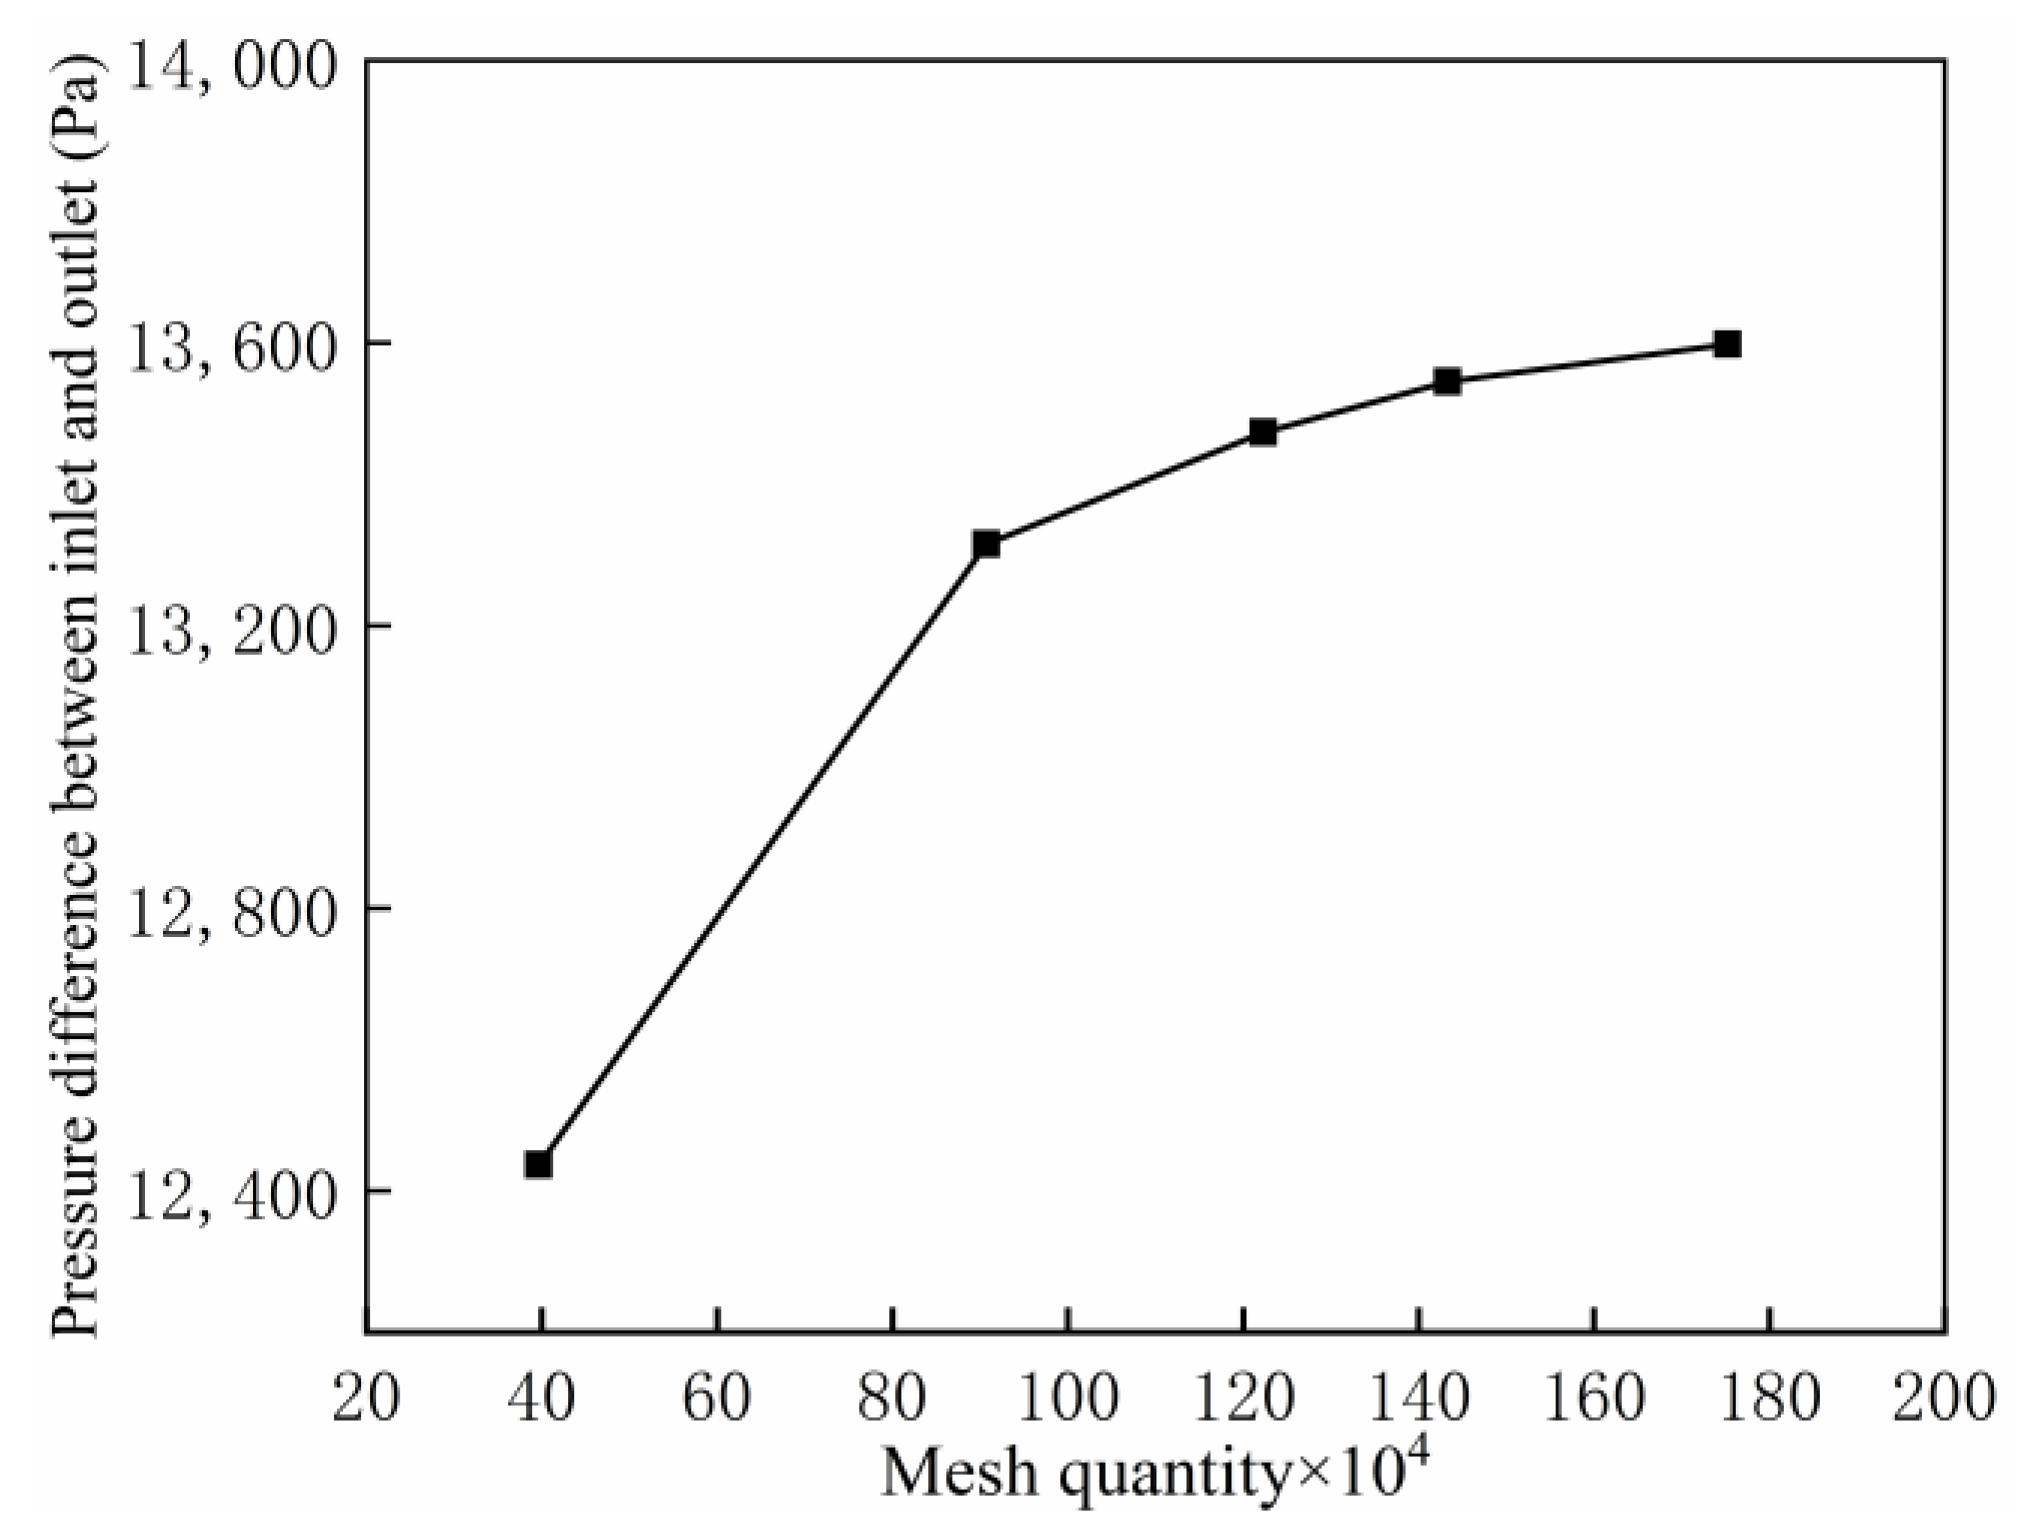
While increasing the element count, provided wall adherence and mesh quality are maintained, drives the numerical solution toward stability, it simultaneously lengthens computation time. Therefore, a grid independence study was conducted before blood pump simulations, and the mesh density was chosen according to the converged numerical results. Figure 4 presents this grid independence analysis for the blood pump.
The blood pump models with 396,655; 906,933; 1,223,046; 1,433,046; and 1,752,681 cells were analyzed to obtain the relation between cell count and pump head. At 1,433,046 cells, the head is 101.6 mmHg, and the deviation from the adjacent coarser and finer meshes is less than 5%; therefore, 1,433,046 cells were selected for the model.

2.4. Numerical Method and Boundary Conditions

As a hydraulic device for blood transport, a blood pump is designed analogously to a conventional water pump: an initial configuration is derived from the target rotational speed and pressure head, followed by iterative refinement via simulation or numerical modeling. In this study, the TURUMO DuraHeart II was adopted as the reference for optimization, simulation, and experimental validation. Analysis of normal human physiological parameters established an operating point of 5 L/min inlet flow and 100 mmHg pressure rise [14]; accordingly, the design rotational speed was set to 2800 rpm. Substituting these values into Equation (1) yields a specific speed of 73.
n s = 219 n Q H 3 / 4
where n is the impeller rotational speed, r/s; Q is the blood pump inlet flow rate, m3/s.
H is the pump head, defined as the pressure difference between outlet and inlet divided by the product of blood density and gravitational acceleration, mmHg.
The determination of pump head is given by Equation (2).
H = P o u t P i n ρ g
where P o u t and P i n are the pressures at the pump outlet and inlet, respectively, Pa; ρ is the blood density, kg·m−3; and g is the gravitational acceleration, m·s−2.
Based on the rheological properties of blood, the density and dynamic viscosity were set to 1060 kg/m3 and 3.5 mPa·s, respectively [15]. Subsequently, Reynolds numbers for the pump inlet, outlet, and the internal flow passages were calculated using Equations (3) and (4). The Reynolds numbers in all three flow regions were found to exceed 2300; therefore, a turbulence model was adopted for simulations.
Re = ρ v L μ = v L ν
Re = π n Q 60 k c v 2 g H
where Re denotes the Reynolds number (dimensionless), with a critical threshold of 2300, v is the characteristic velocity, m/s; L is the characteristic length, m; μ is the dynamic viscosity, kg/m·s; ν is the kinematic viscosity, m2/s; n is the impeller rotational speed, r/min; Q is the flow rate, m3/s; and k c is the impeller tip-speed coefficient.
Steady, single-phase, incompressible CFD simulations were carried out using a finite-volume solver with second-order spatial discretization and SIMPLEC pressure–velocity coupling. The rotating region was treated with a Multiple Reference Frame (MRF, frozen rotor) approach; non-conformal interfaces were used between rotating and stationary domains with local grid refinement such that the cell–size ratio across the interface mesh refinement was performed to ensure a cell–size ratio across the interface of no greater than 2:1, improving the transfer of fluid properties between regions. TURUMO DuraHeart II was modeled with the RNG k ε model owing to its improved performance in swirling and rapidly strained flows typical of centrifugal pumps. Standard wall functions were employed with near-wall resolution targeted to 30 y + 100 . Convergence was required when all scaled residuals fell below 10 5 and head varied by <0.5% over 500 additional iterations.
In addition, wall functions, numerical schemes, and turbulence models influence the simulation outcome [16]. A uniform velocity was prescribed at the inlet to meet the specified flow rate; a static-pressure outlet was applied at the pump discharge. All solid walls were no-slip; the impeller and hub surfaces were set as rotating walls at the specified angular speed. Blood was treated as a Newtonian fluid ( ρ = 1060 kg·m−3, μ = 3.5   mPa·s). The solver settings and boundary conditions adopted for the blood pump are summarized in Table 1.

2.5. Centrifugal Blood Pump Hemolysis Experiment

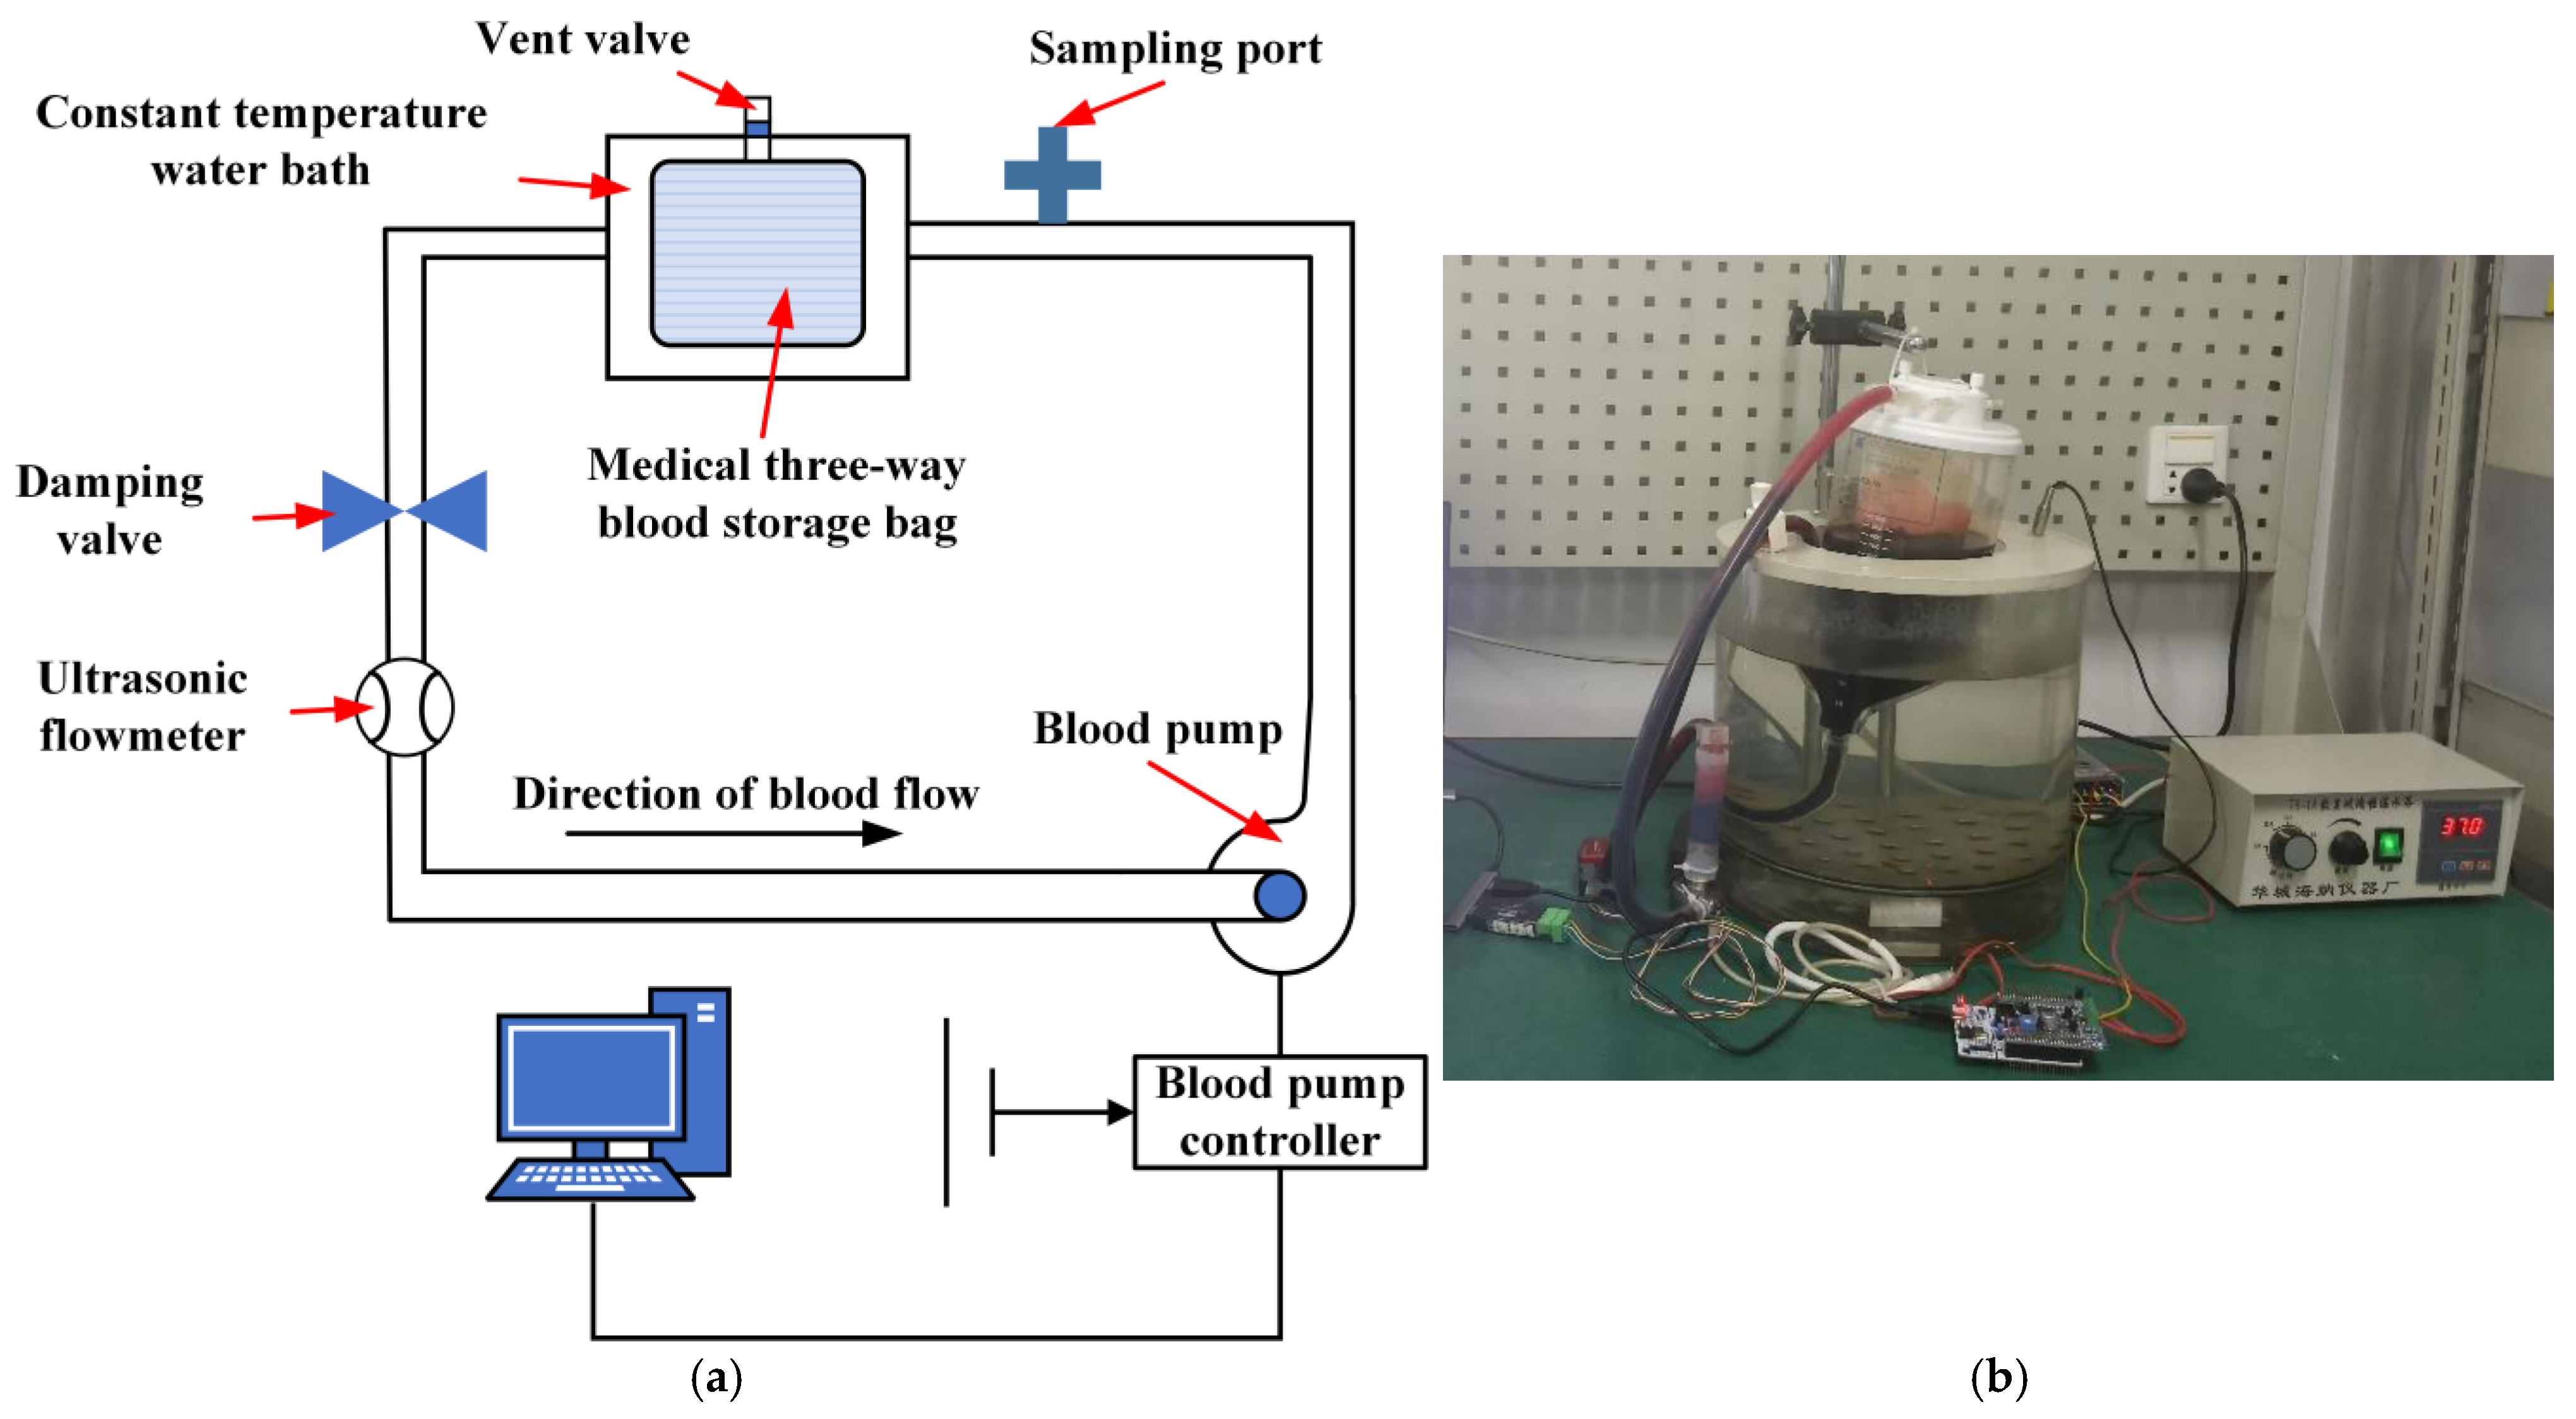
As an implantable medical device, the blood pump’s influence on blood and the human body must be evaluated [17]. Figure 5 presents the schematic and photograph of the hemolysis experimental platform.
The hemolysis test platform comprises a blood reservoir, a constant-temperature water bath, the blood pump, a flow sensor, and the tubing circuit. The reservoir stores test blood (e.g., porcine) and its mounting height is adjustable to simulate different cardiac loading conditions. The water bath maintains the blood at 37 ± 1 °C to match physiological temperature [18]. To minimize blood trauma, the system employs non-contact measurement (ultrasonic flow meter) and indirect flow control via tubing clamps. This arrangement accurately reproduces the human circulatory environment and ensures reliable hemolysis data. Core components of the platform are shown in Figure 6.
Hemolysis was assessed by comparing blood damage caused by the pump; samples were taken from the sampling port above the reservoir. Cell destruction releases hemoglobin and factors such as von Willebrand Factor (vWF); vWF is ignored here, and damage is judged solely from the change in hemoglobin concentration [19].
Experimental procedure: Collect animal blood, add sodium citrate anticoagulant at 9:1, add gentamicin, store at 4 ± 2 °C, and divide into four identical controls. Before the test, rinse the platform with pure water and PBS, dry, prime with blood, and maintain it at 37 °C via the water bath. Set pump speed and throttle to the operating point. Sample every hour for 6 h; discard 2 mL, then take 5 mL. Centrifuge, measure supernatant absorbance, calculate free hemoglobin, repeat three times, and average. Clean the platform after use.

3. Results

3.1. Influence of Blood Pump Parameters on the Performance of a Centrifugal Blood Pump

3.1.1. Influence of Blade Number in the Impeller

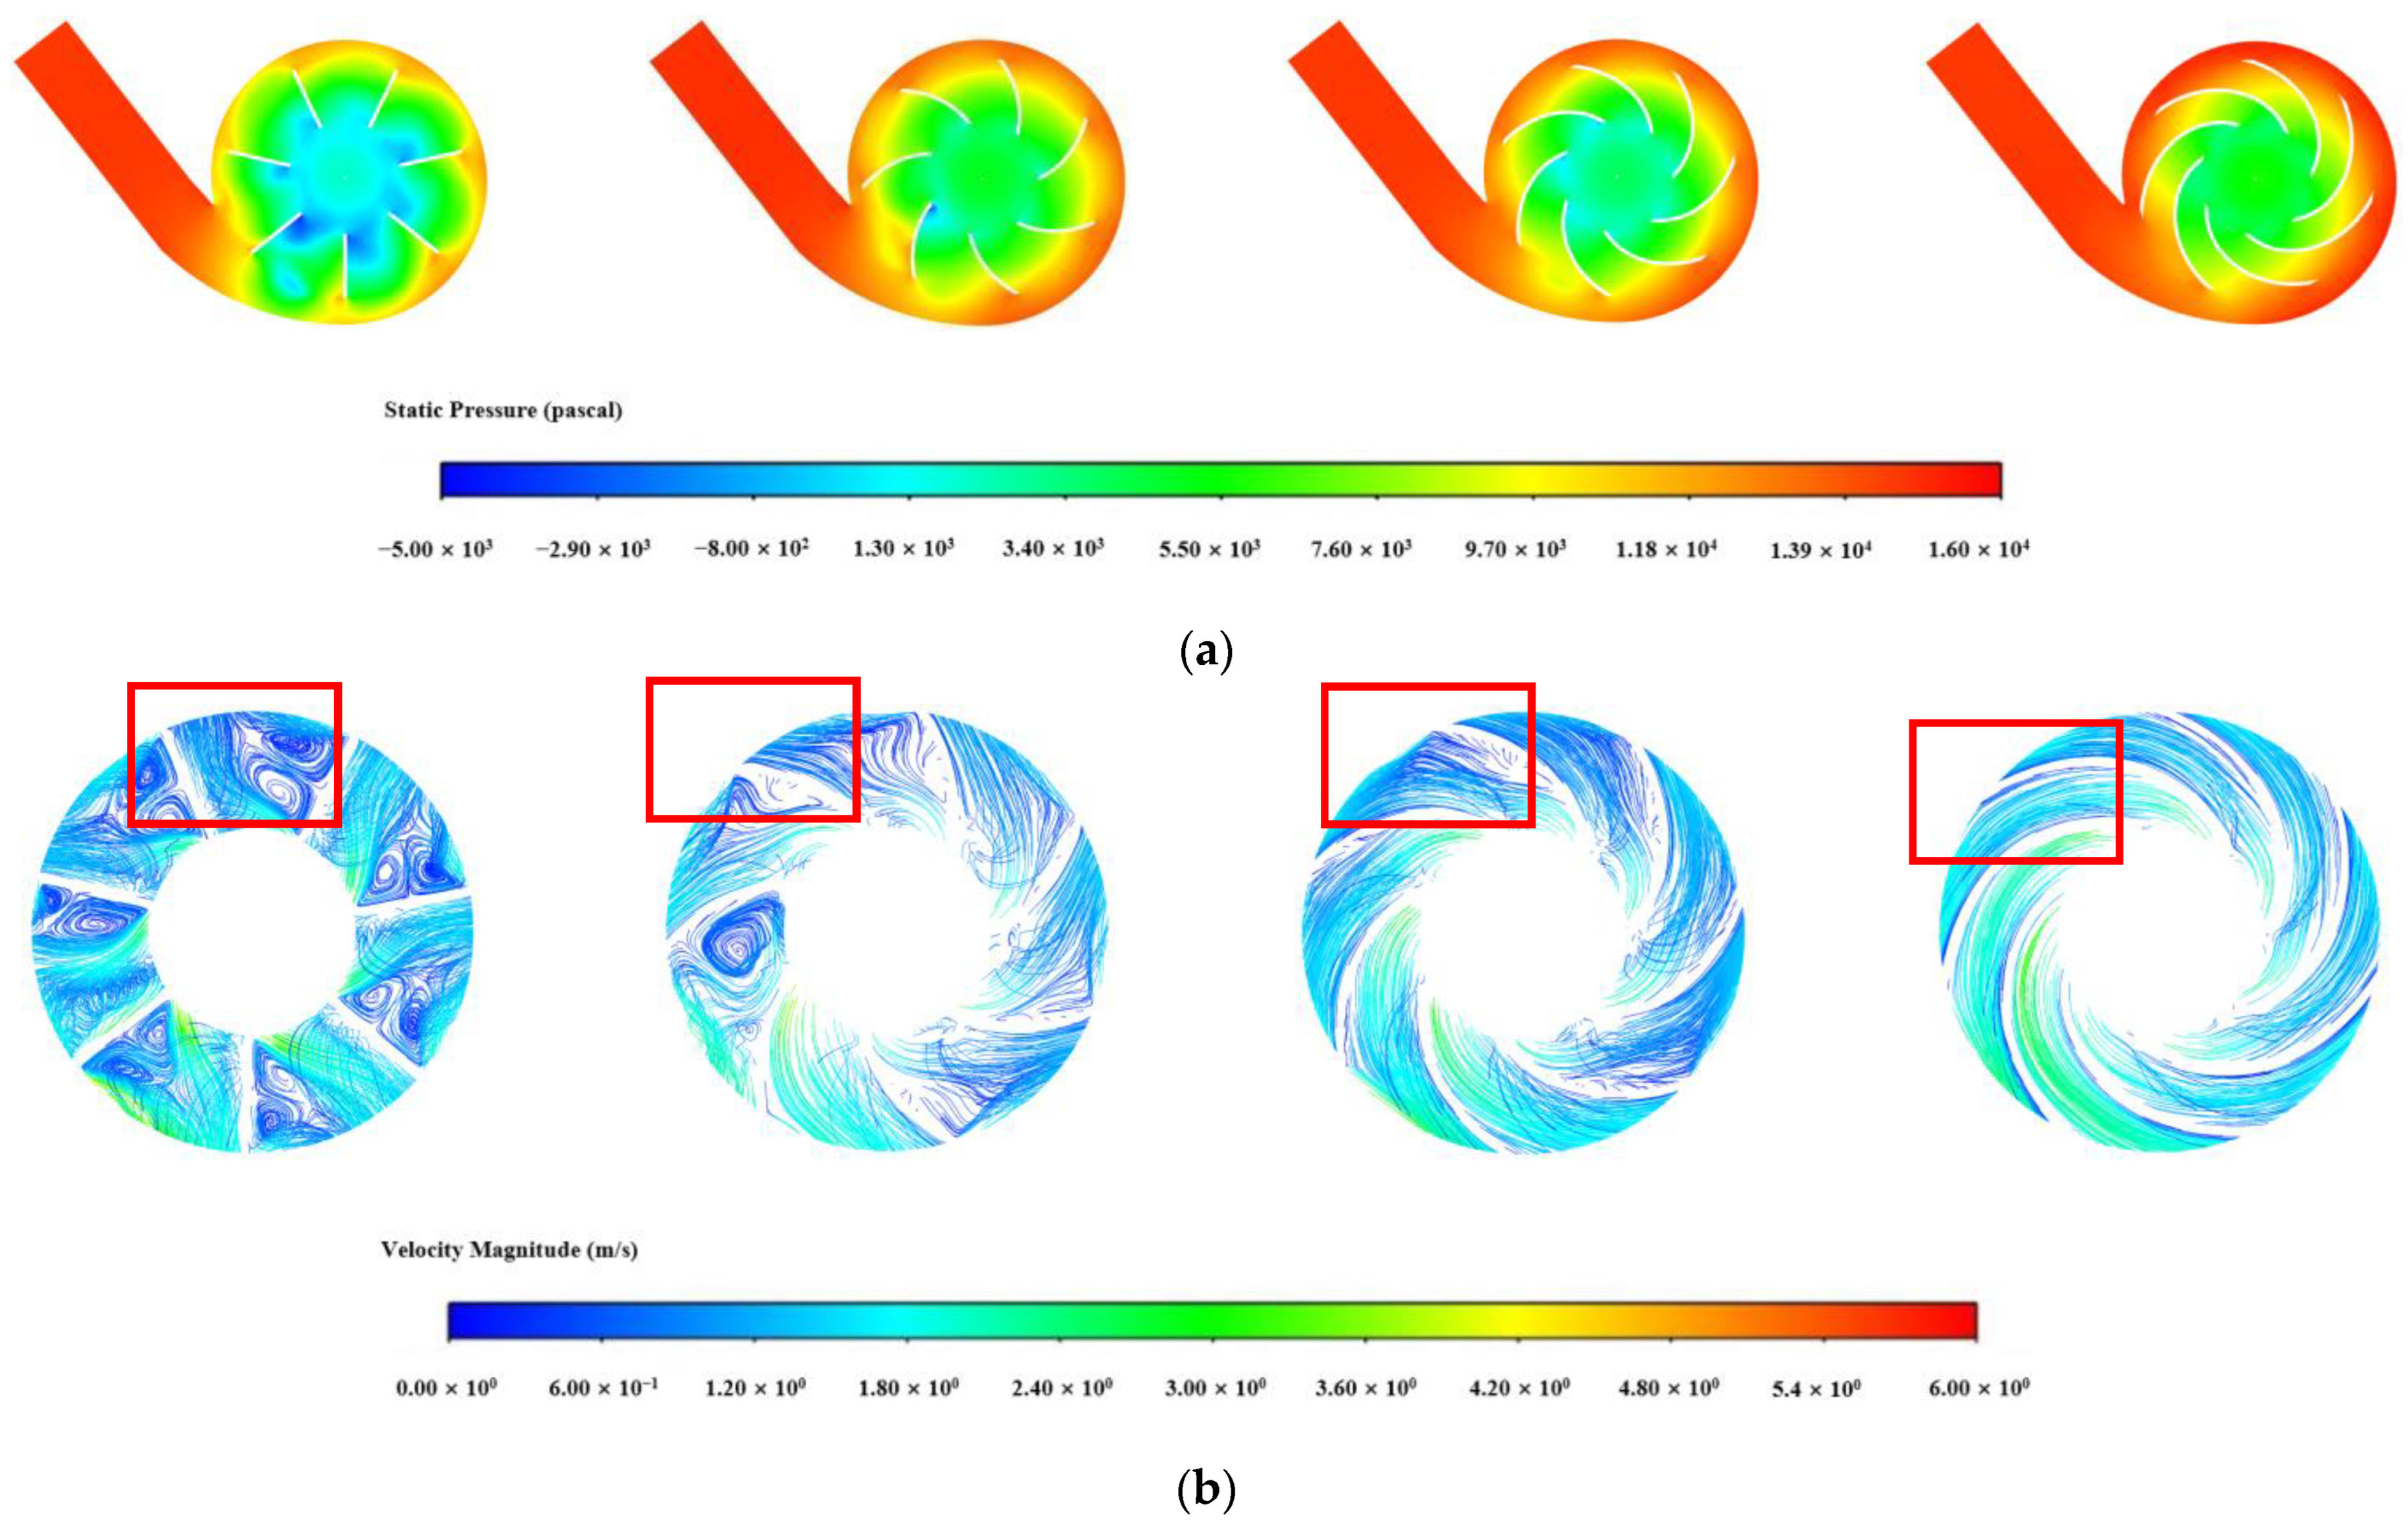
The impeller is the primary component within a blood pump that imparts energy to the blood; its judicious design is therefore essential to enhancing overall pump performance. With a specific speed of 73, the pump falls into the low-specific-speed centrifugal category. According to the literature, the optimal blade count for such pumps ranges from six to eight [20]. To ensure this range is appropriate, finite-element analyses were performed on impellers with six, seven, and eight blades. The internal flow fields were evaluated in terms of vorticity, pressure, and velocity distributions, as well as the resulting head rise and hydraulic efficiency. The simulations presented in Section 3.1.1 and Section 3.1.2 were performed with reference to the results obtained in Section 3.1.4. In order to ensure consistency among the comparative studies, the positions of the impeller flow passage and the splitter cone height were fixed at 4.1 mm, serving as geometric constraints for all subsequent analyses. The findings are summarized in Figure 7 and Table 2.
Table 2 shows that, under the design condition of 2800 rpm impeller speed and 5 L/min inlet flow, increasing the blade count raises the pump head, whereas the hydraulic efficiency rises first and then falls. This trend arises because more blades intensify the interaction between the impeller and blood, allowing fuller energy transfer and mitigating losses caused by velocity deviation [21]; consequently, head and efficiency are initially improved. However, additional blades enlarge the wet surface area and narrow the flow passages, thereby amplifying turbulent dissipation. Once the blade number becomes excessive, the rate of head gain slows and the device efficiency declines. Flow-field analysis via Figure 7 reveals extensive vortices within the impeller passages that dissipate energy and prolong blood residence time. As the blade number rises, the increased contact area between blades and blood elevates frictional trauma, yet the reduced individual passage area influences vortex intensity [22]. In addition, higher blade counts lower the minimum static and dynamic pressures near the impeller inlet and expand the corresponding low-pressure zones; simultaneously, velocities at the blade trailing edges and vortex strength inside the passages intensify.
Quantitatively, relative to six blades, seven blades increased head by +12.0% (90.74 to 101.64 mmHg) and efficiency by +6.5% (32.41 to 34.53%). Eight blades further increased head by +17.4% but reduced efficiency by –4.0% compared with seven blades. In summary, more blades deliver greater head, yet head is not the sole criterion for a blood pump; hemolysis and blood damage must also be considered. Therefore, seven blades are selected as the optimum configuration.

3.1.2. Influence of Blade Wrap Angle on Centrifugal Blood Pump Performance

Prior studies indicate that curved blades can reduce the relative velocity of the fluid entering the blade leading edge, thereby influencing blood pump efficiency [23]. In this section, impellers with wrap angles of 0°, 30°, 60°, and 90° were modeled and simulated to evaluate the effect of wrap angle on pump performance. Figure 8 and Table 3 present the resulting variations in internal flow field, head, and efficiency.
Compared with straight blades, a 30° wrap angle suppresses vortices on the suction surface, diminishing energy losses and flow separation and thus improving efficiency. When the wrap angle reaches 60°, the flow within the impeller passages becomes more stable, and the efficiency rises further. At 90°, however, both head and efficiency decline because the enlarged blade–blood contact area increases surface friction.
Relative to 0°, head decreased by –12.4%/–16.1%/–29.0% for 30°/60°/90°, whereas efficiency increased by +17.5%/+23.3%/+12.1% (maximum at 60°). In summary, a moderate increase in wrap angle can enhance efficiency but simultaneously reduces head. Since the required target head is 100 mmHg, straight blades (0° wrap angle) are selected for the impeller.

3.1.3. Influence of Impeller Flow Path on Centrifugal Blood Pump Performance

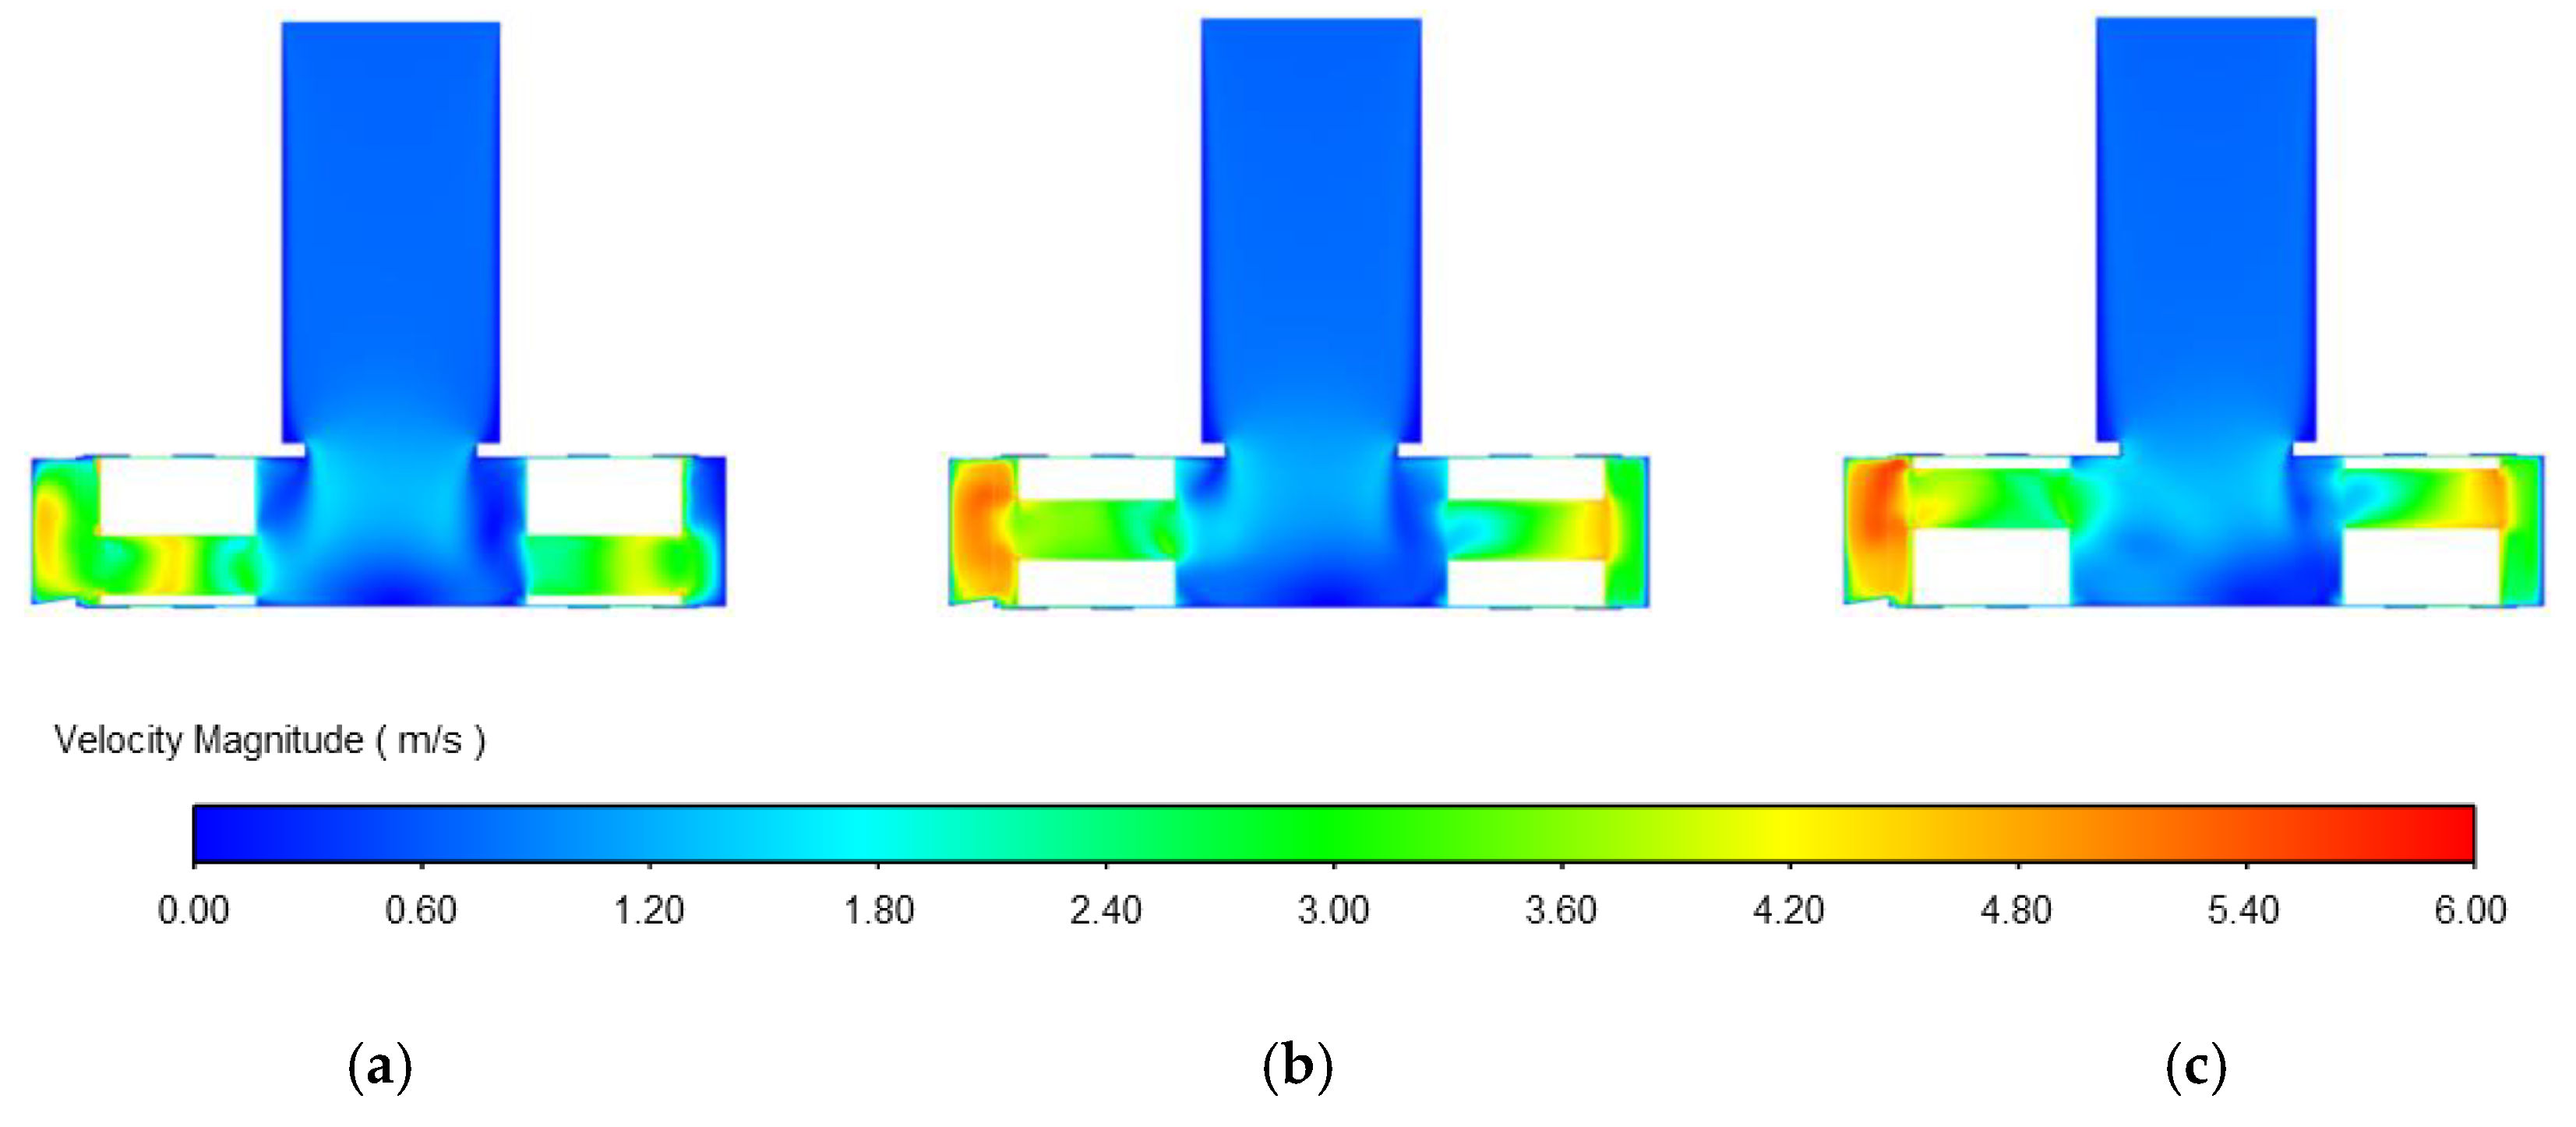
The axial position of the impeller within the blood pump strongly affects overall performance. As the impeller rotates, centrifugal force energizes the blood while simultaneously generating a low-pressure region that draws additional fluid toward the blades [24]; shifting the impeller thus alters the location and extent of this suction zone. In this section, impeller flow path is investigated by systematically varying the distance between the channel and the lower housing, while the effects of the diversion cone are neglected.
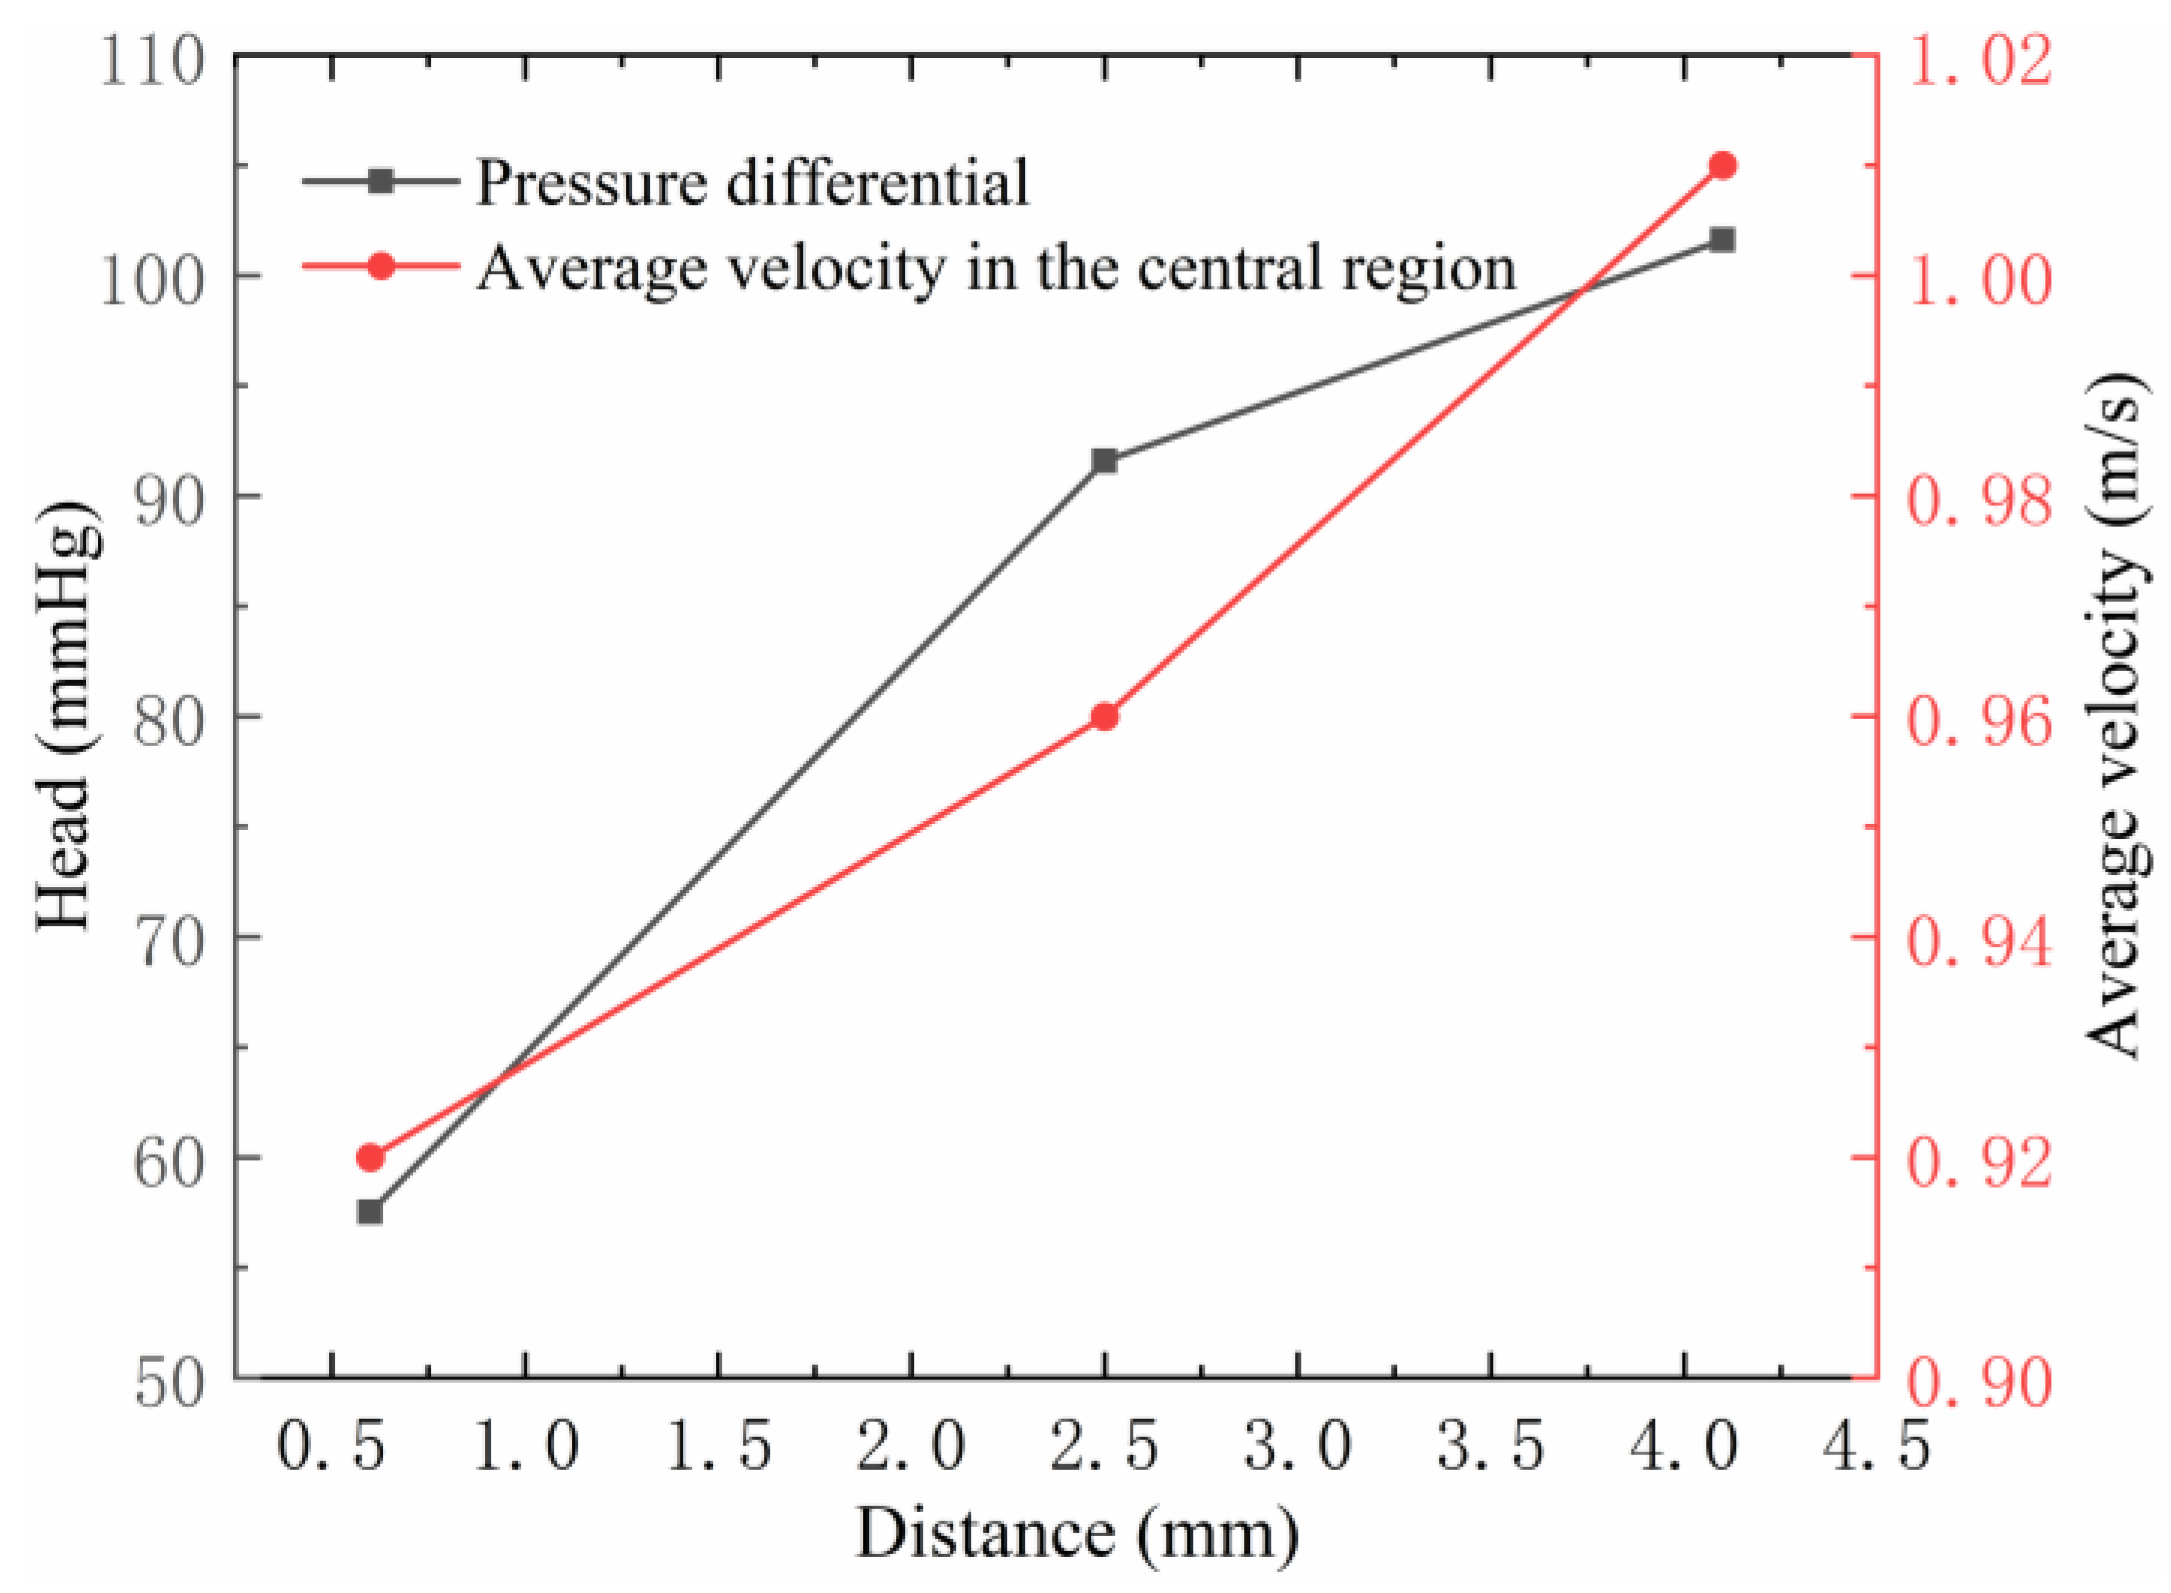
Figure 9 and Figure 10 illustrate the influence of impeller flow path on pump performance. As the channel is moved upward, the size of the internal stagnation zone diminishes and the mean velocity in the central region of the pump increases. This occurs because the rotating impeller preferentially ejects fluid into the channel rather than allowing it to continue downward; since the stagnant zone is governed primarily by the impeller surfaces and secondary flow passages, its sensitivity to channel elevation is limited. In addition, the altered flow path changes the impact pattern between the impeller outflow and the volute, thereby affecting both energy dissipation and generated head. Owing to the presence of the upper and lower shrouds, permanent-magnet bearings, and rotor assembly, the channel cannot coincide perfectly with either the upper or lower housing, establishing a minimum residual stagnant region. Consequently, an impeller flow path of 4.1 mm is selected.

3.1.4. Influence of the Diversion Cone Height on Centrifugal Blood Pump Performance

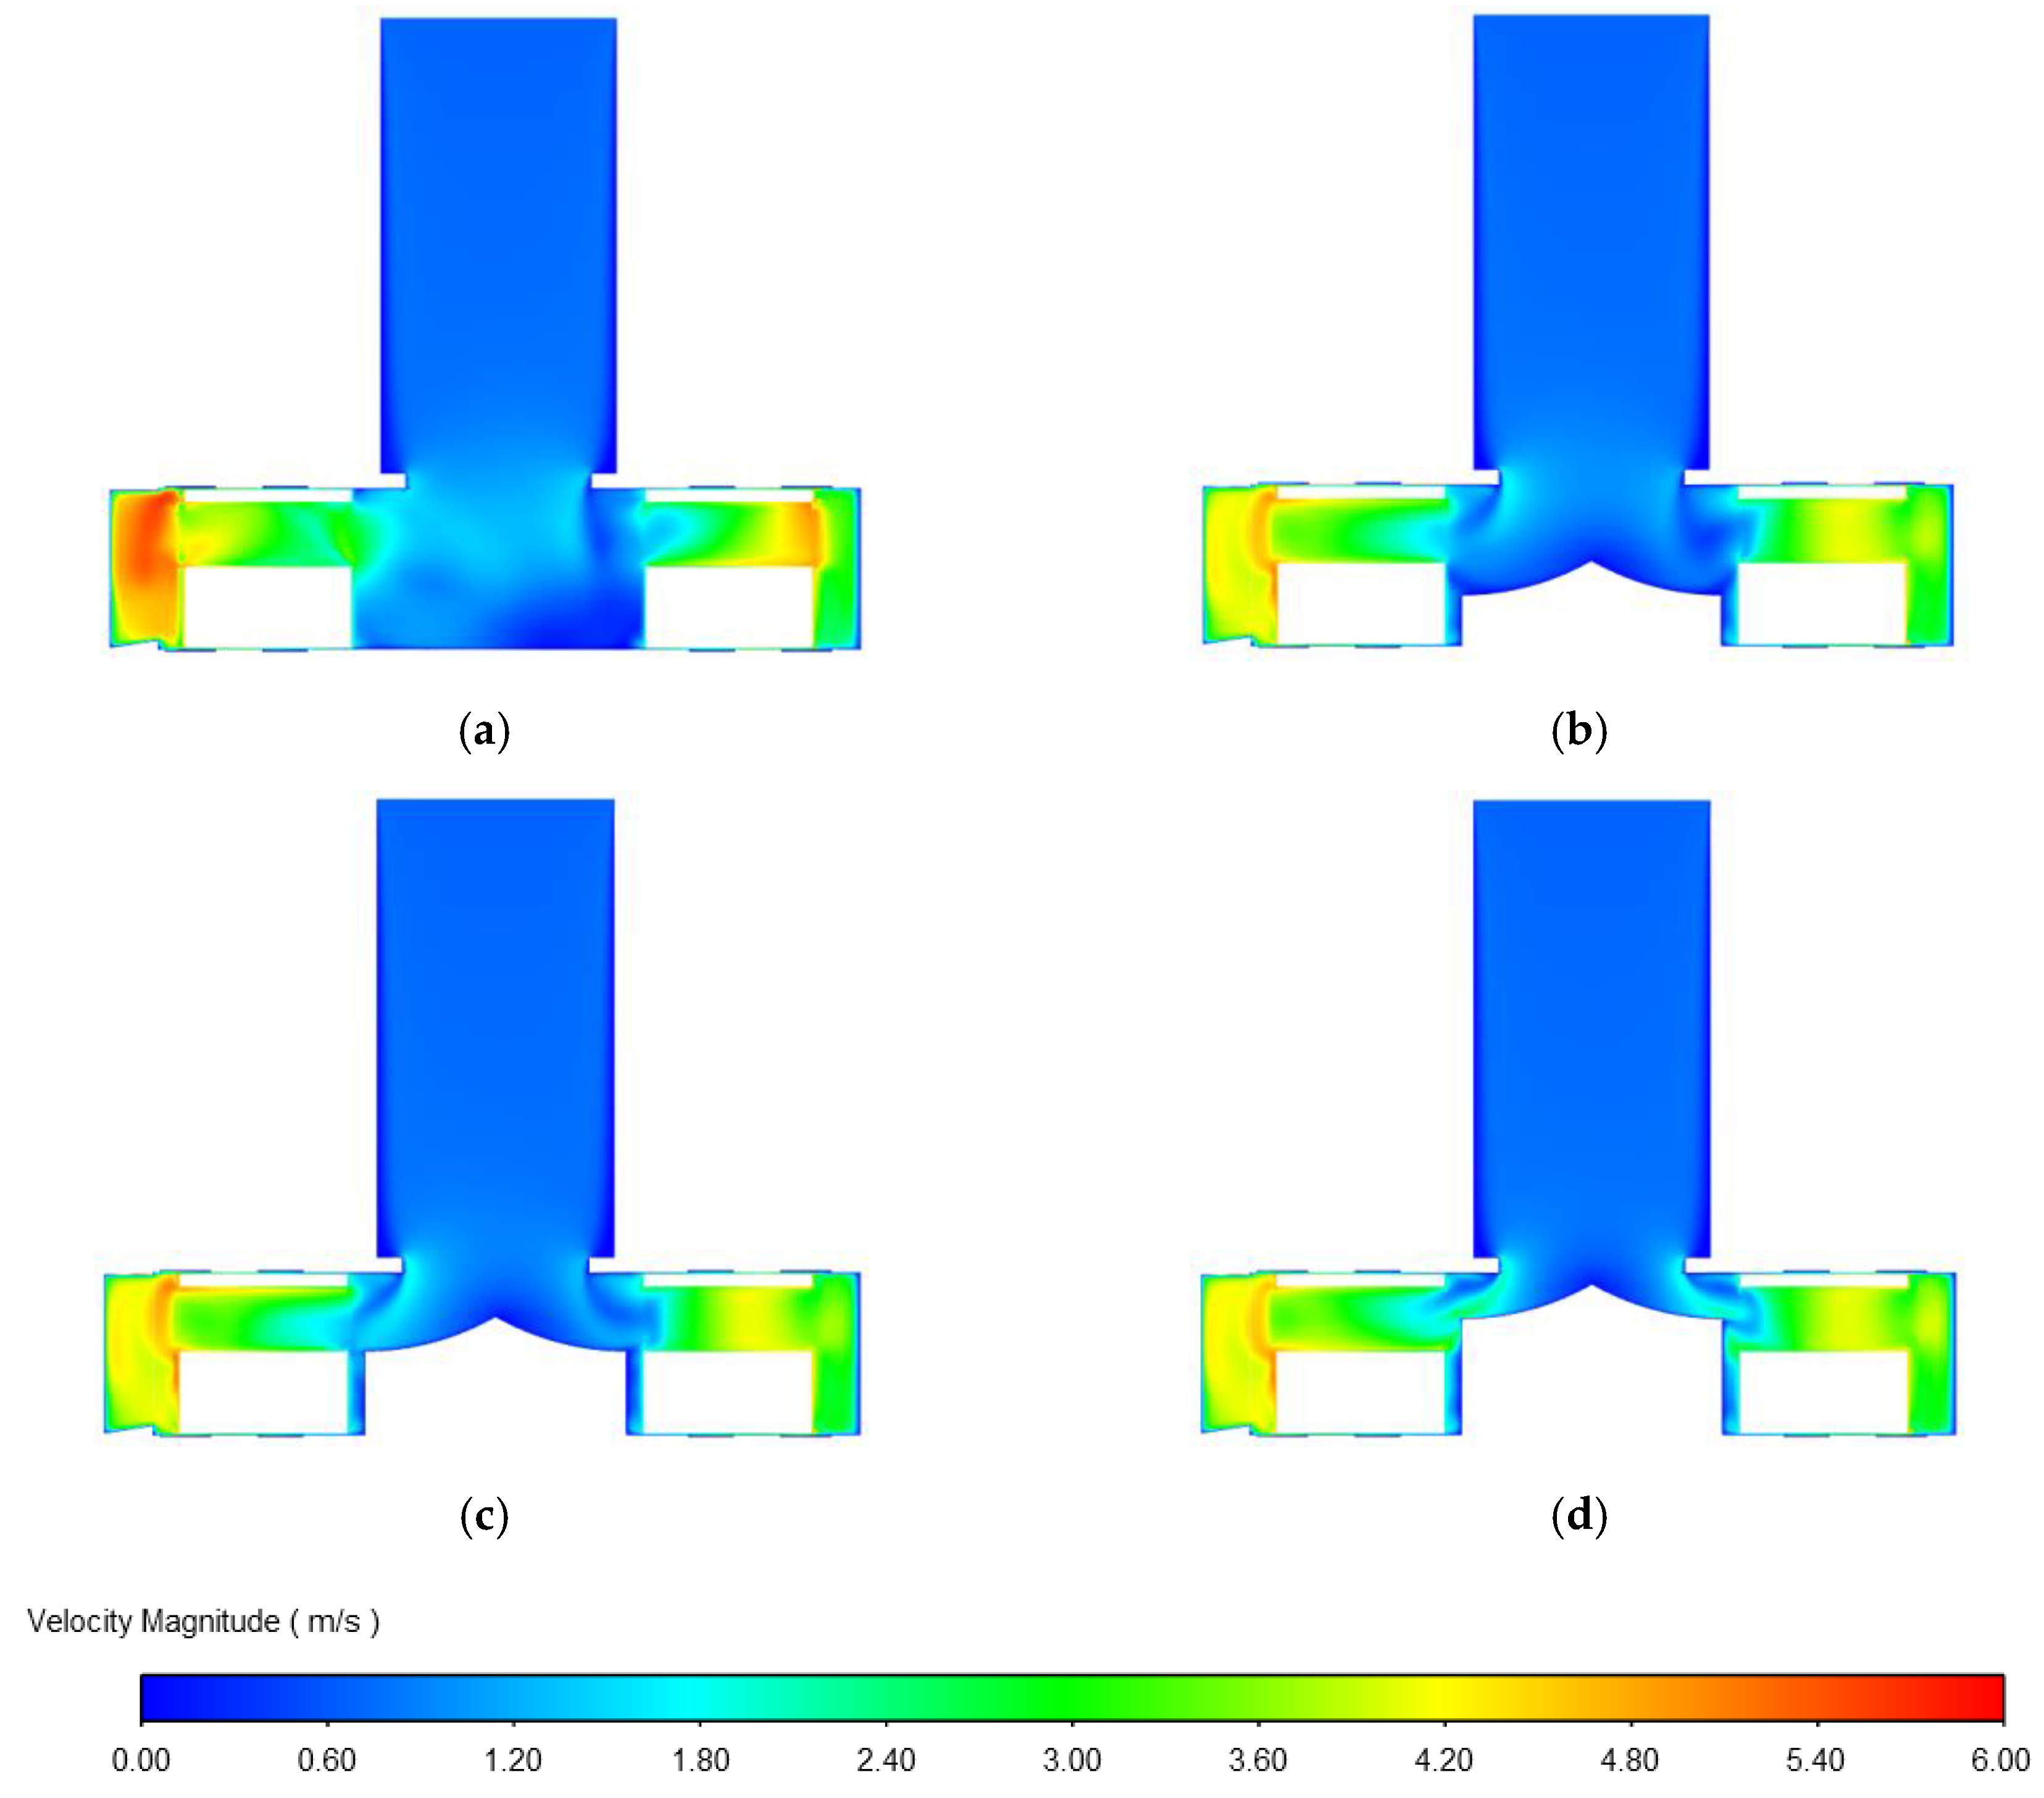
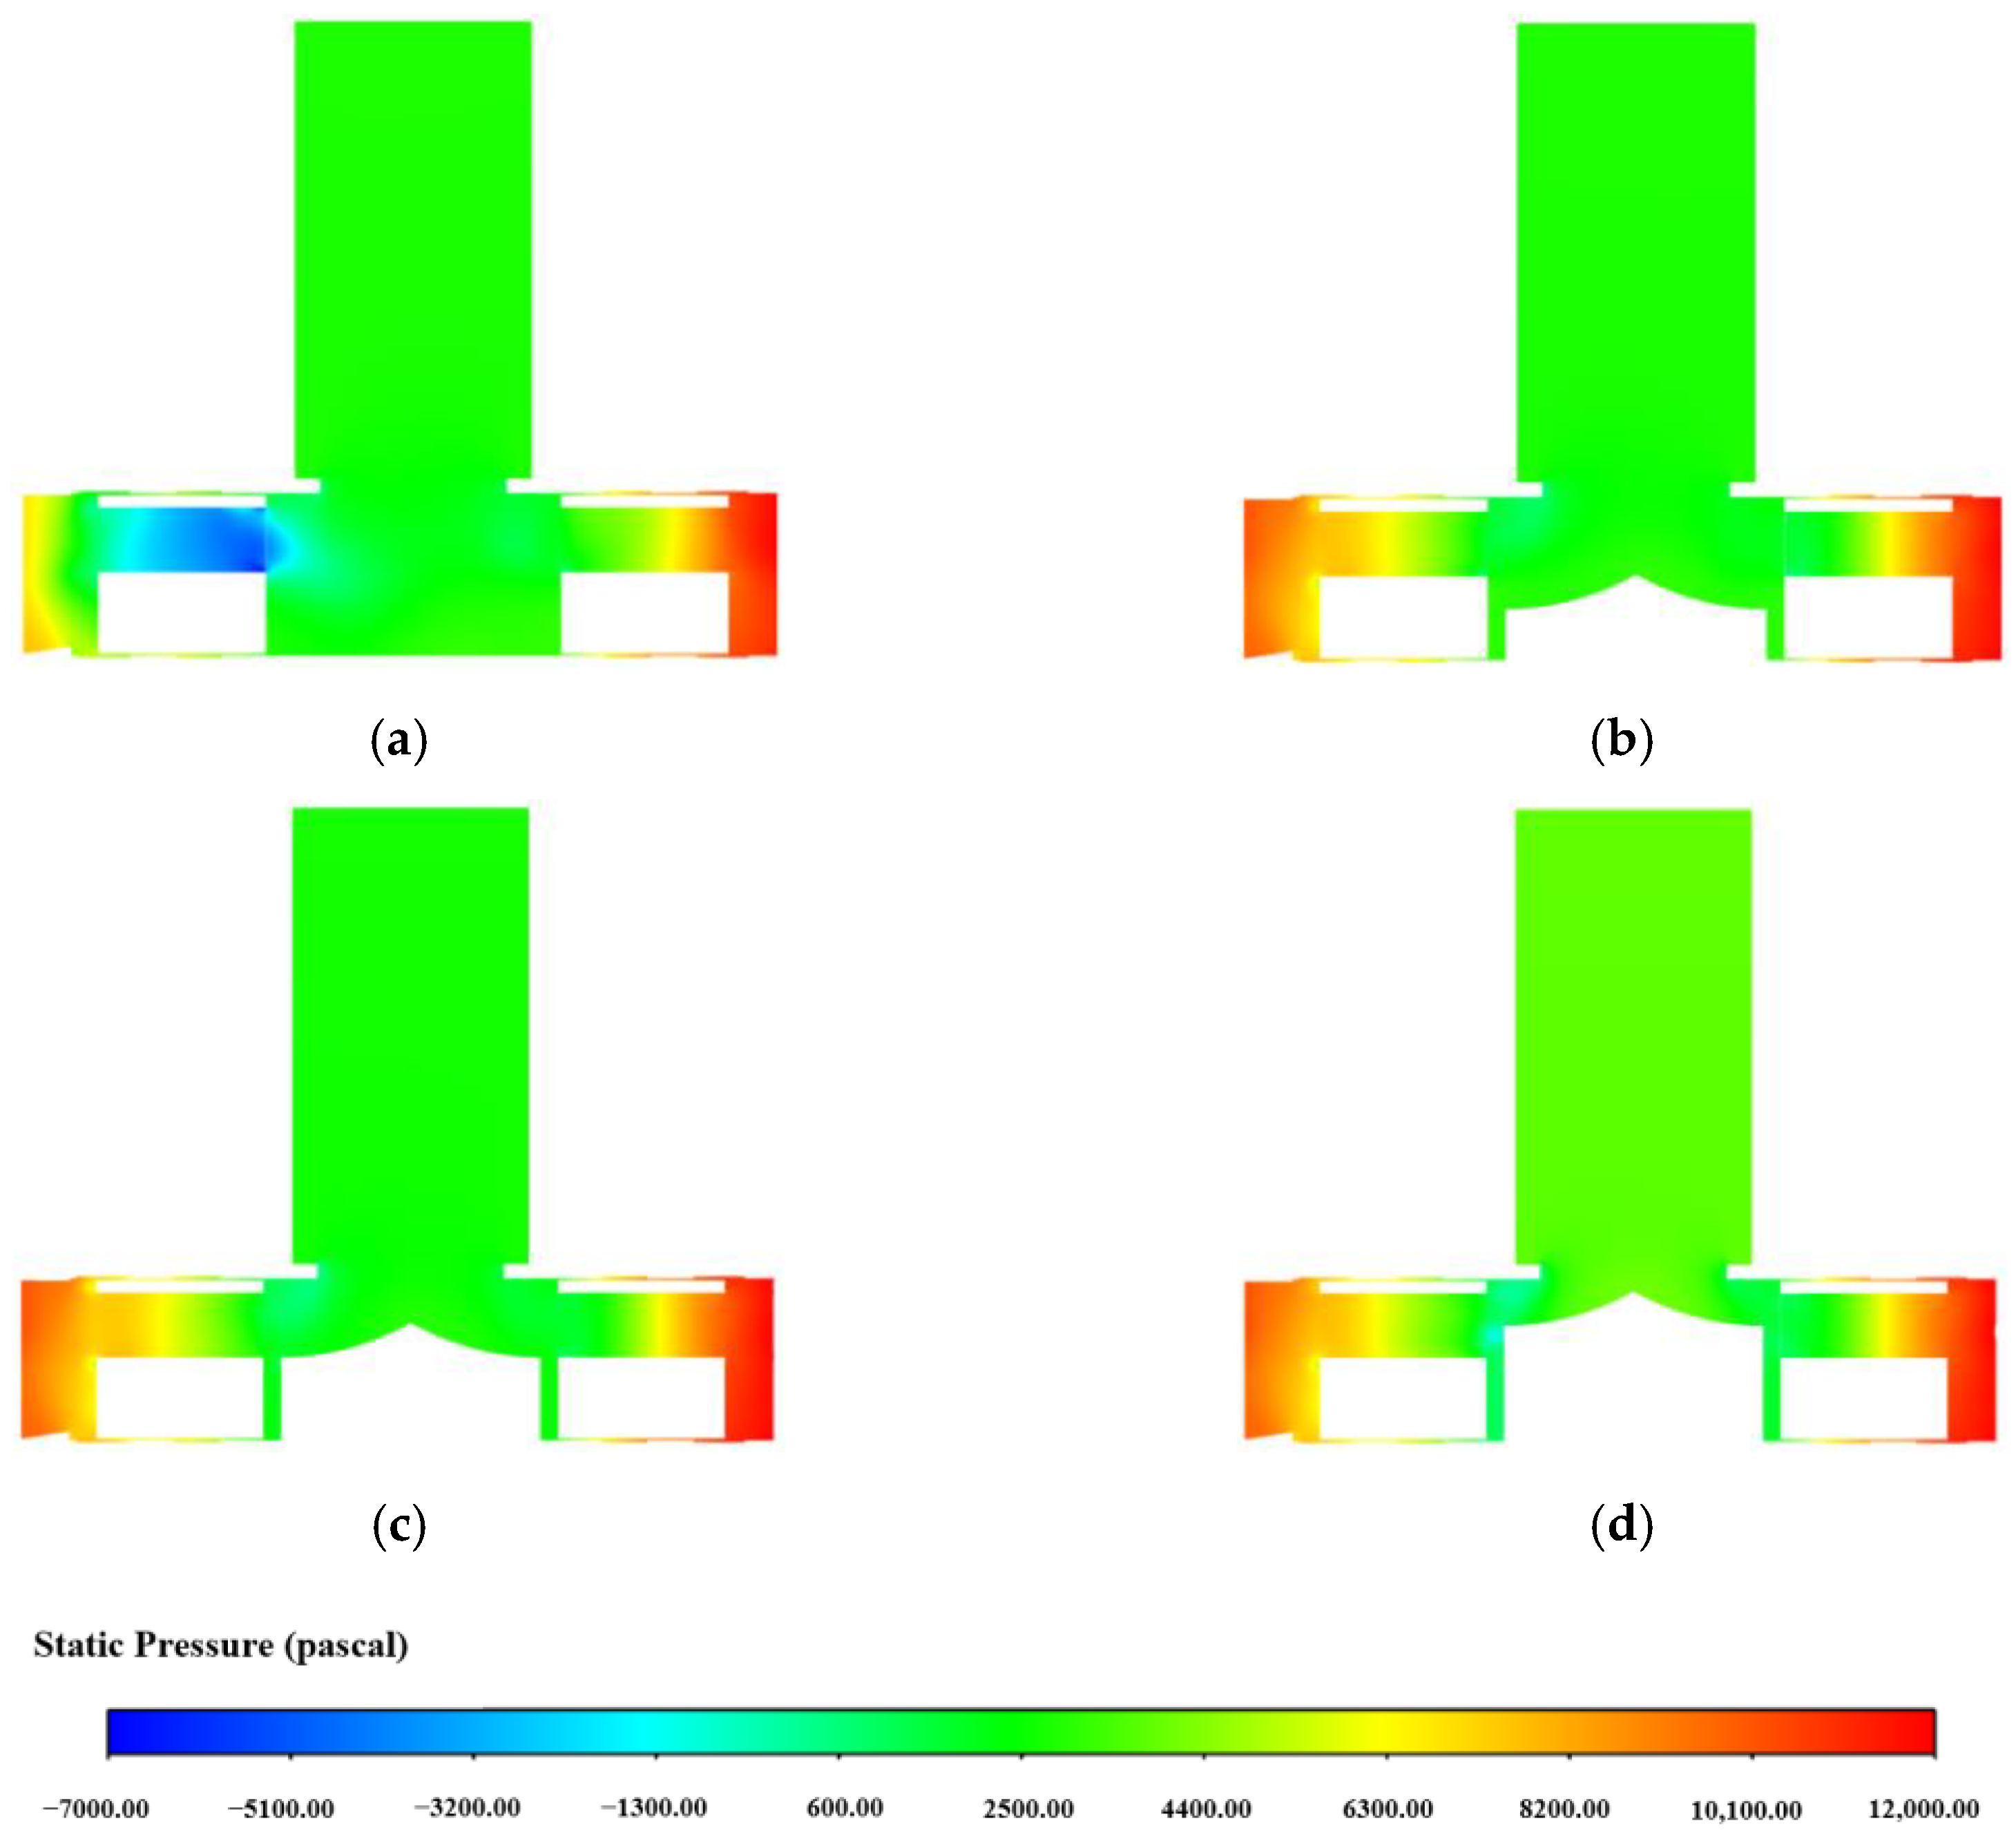
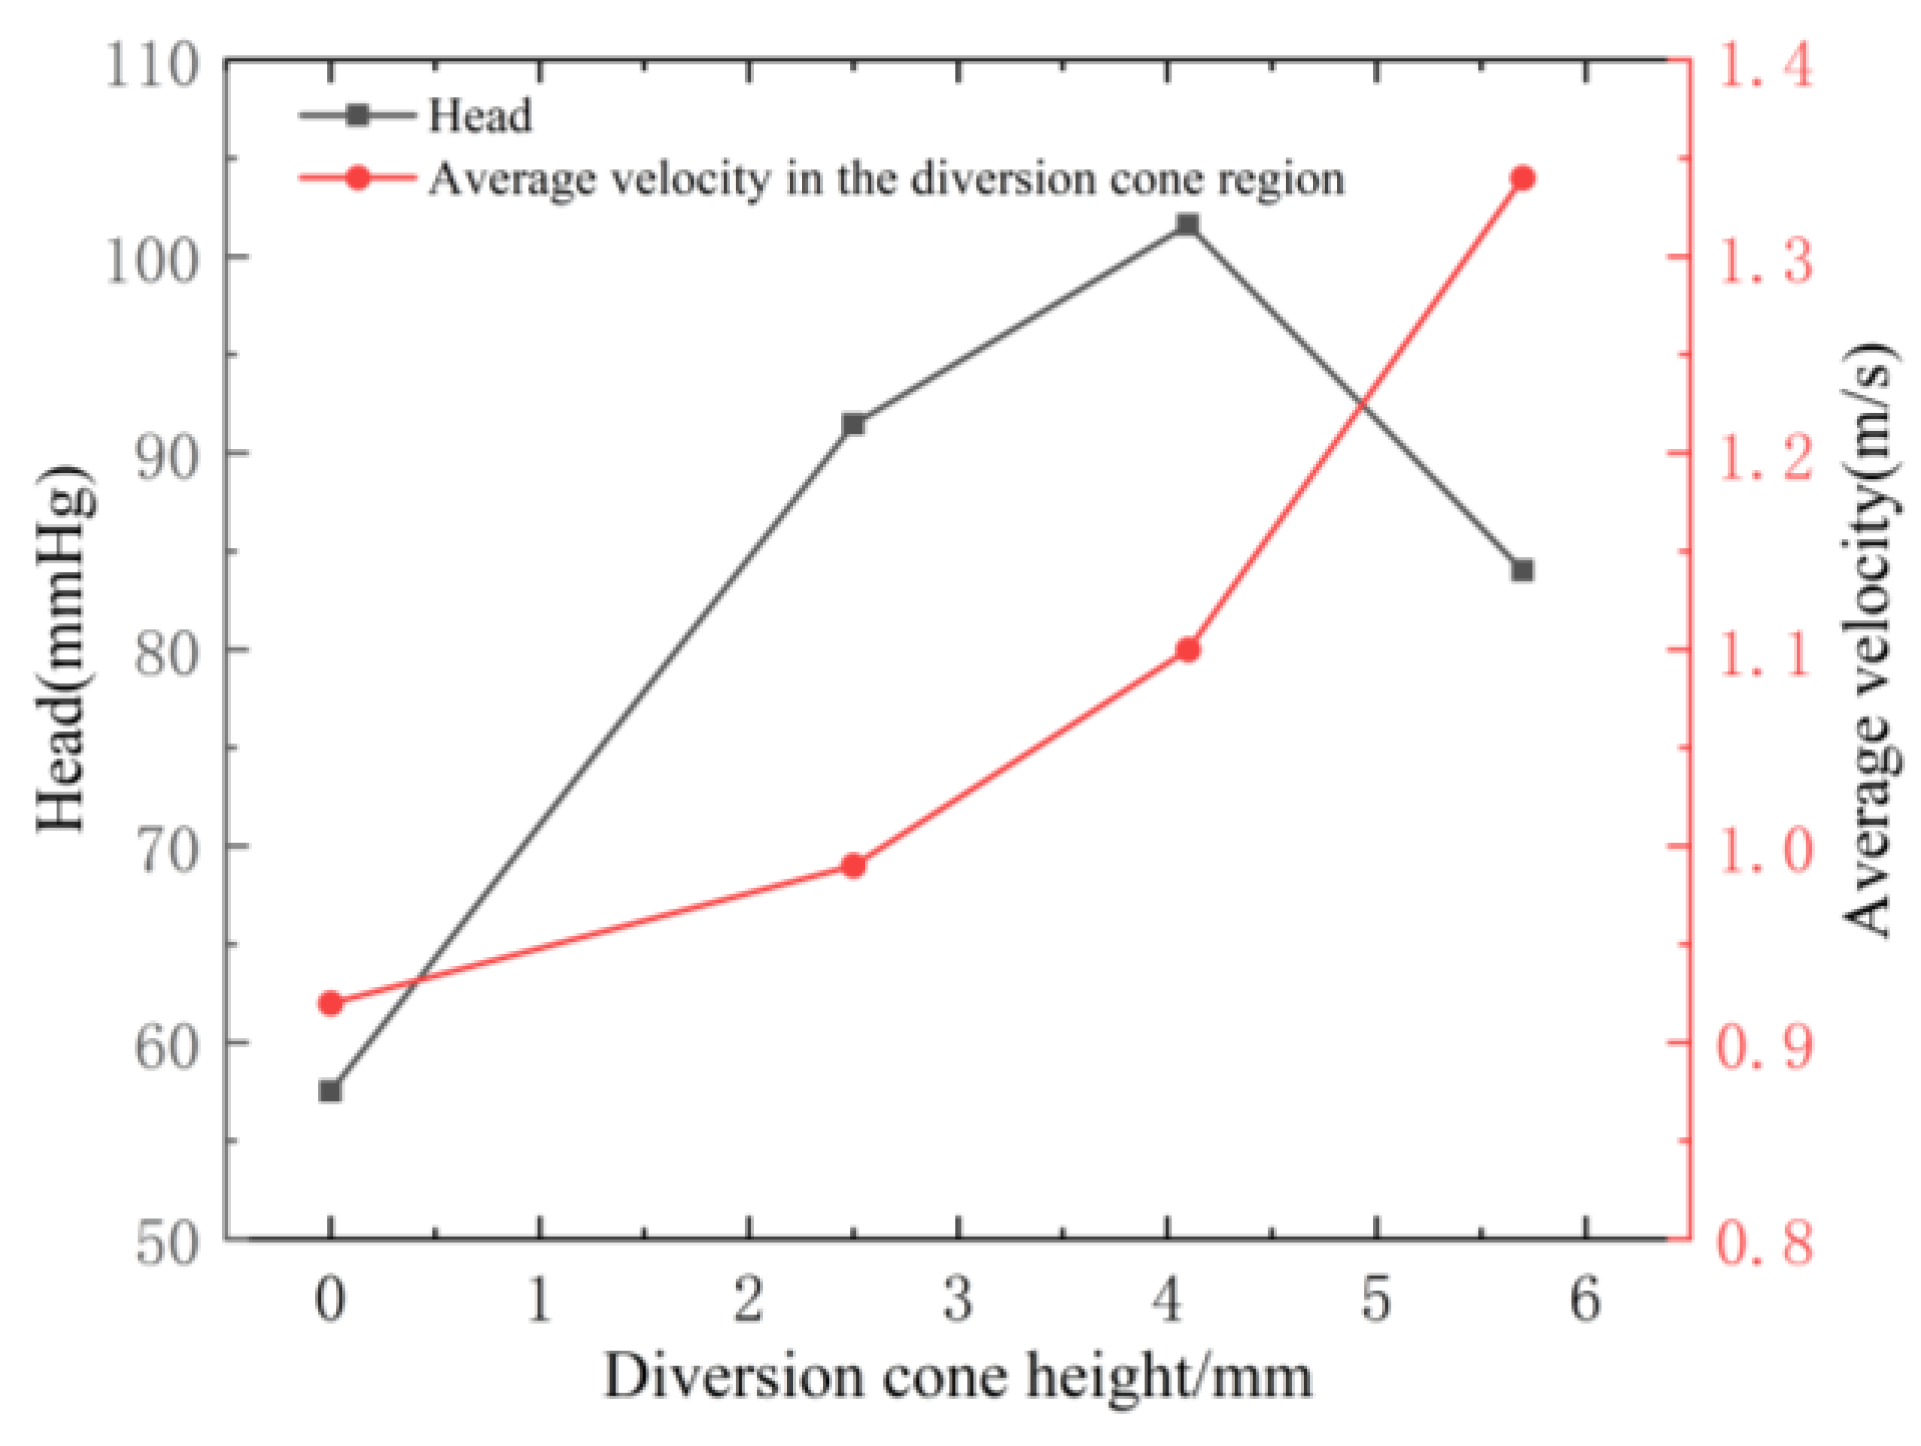
The geometries of both the diversion cone and the impeller jointly govern blood velocity, trauma, and pressure within the impeller passages [25,26]. To isolate the effect of the diversion, all impeller parameters are held constant in this section while only the geometric variables of the diversion cone are varied. The relevant dimensions are illustrated in Figure 11. The cone height H1 is defined relative to the impeller channel and takes four discrete values: H2 = 0 mm: no diversion cone is present. H2 = 2.5 mm: a diversion cone exists, but its tip tangent line lies below the bottom plane of the impeller channel at half the distance between the channel bottom and the lower housing. H2 = 4.1 mm: a diversion cone is present and its tip tangent line coincides exactly with the bottom plane of the impeller channel. H1 = 5.7 mm: a diversion cone is present and its tip tangent line aligns with the mid-plane of the impeller channel.
Under operating conditions of 2800 rpm and 5 L/min, the above configurations were analyzed to determine the effect of diversion cone height on pump performance. Figure 12, Figure 13 and Figure 14 present, respectively, the mid-plane velocity distribution, the mid-plane pressure distribution, and the generated head for each cone height.
As illustrated in Figure 12 and Figure 14, the introduction and progressive increase in the diversion cone height accelerate the fluid in the formerly stagnant regions; pump head initially rises but subsequently falls. Apart from the case without a diversion cone, further increases in cone height primarily influence the central stagnant zone, whereas the velocity fields near the impeller passage periphery and within the volute remain largely unchanged. Once the cone height exceeds 4.1 mm, the diversion begins to obstruct the inflow toward the impeller passages. While it does enhance velocity around the cone itself, this comes at the cost of additional energy losses, ultimately reducing the generated head.
As shown in Figure 13, the pressure field exhibits a non-monotonic response to the introduction and progressive increase in the diversion cone height. When the cone height is no greater than the distance from the impeller channel bottom to the lower housing, pressure variations across the impeller passages, volute, and pump center remain minimal. Once the cone height exceeds this distance, an enlarged low-pressure zone appears adjacent to the diversion within the impeller passages, while pressures at the passage trailing edges and in the volute decline, ultimately lowering pump head.
Figure 14 indicates that head rises initially with increasing cone height, peaks at H = 4.1 mm—where the diversion tip is tangent to the channel bottom—and then decreases, even though the average velocity in the diversion region continues to grow. Considering the target head of 100 mmHg, a diversion cone height of 4.1 mm is selected.

3.2. Establishment and Flow-Field Numerical Simulation of the Screening Blood Pump Model

By systematically varying the number of impeller blades, the blade wraps angle, the diversion cone height, and the axial position of the impeller channel, the influence of each structural parameter on pump performance was quantified. The data indicate the following: Increasing the blade count monotonically raises the pump head, whereas efficiency climbs to a maximum at seven blades and then declines. A larger blade wrap angle progressively reduces head while gradually improving efficiency. Raising the impeller channel height increases head; constrained by overall pump height and permanent-magnet thickness, the optimum clearance between the channel and the lower housing wall is 4.1 mm. Head initially rises and then falls with increasing diversion cone height, peaking when the cone tip is flush with the channel bottom (4.1 mm), at which point the velocity within the internal stagnation zone is maximized. Consequently, the parametric analysis of the structural parameters of the blood pump are summarized in Table 4.
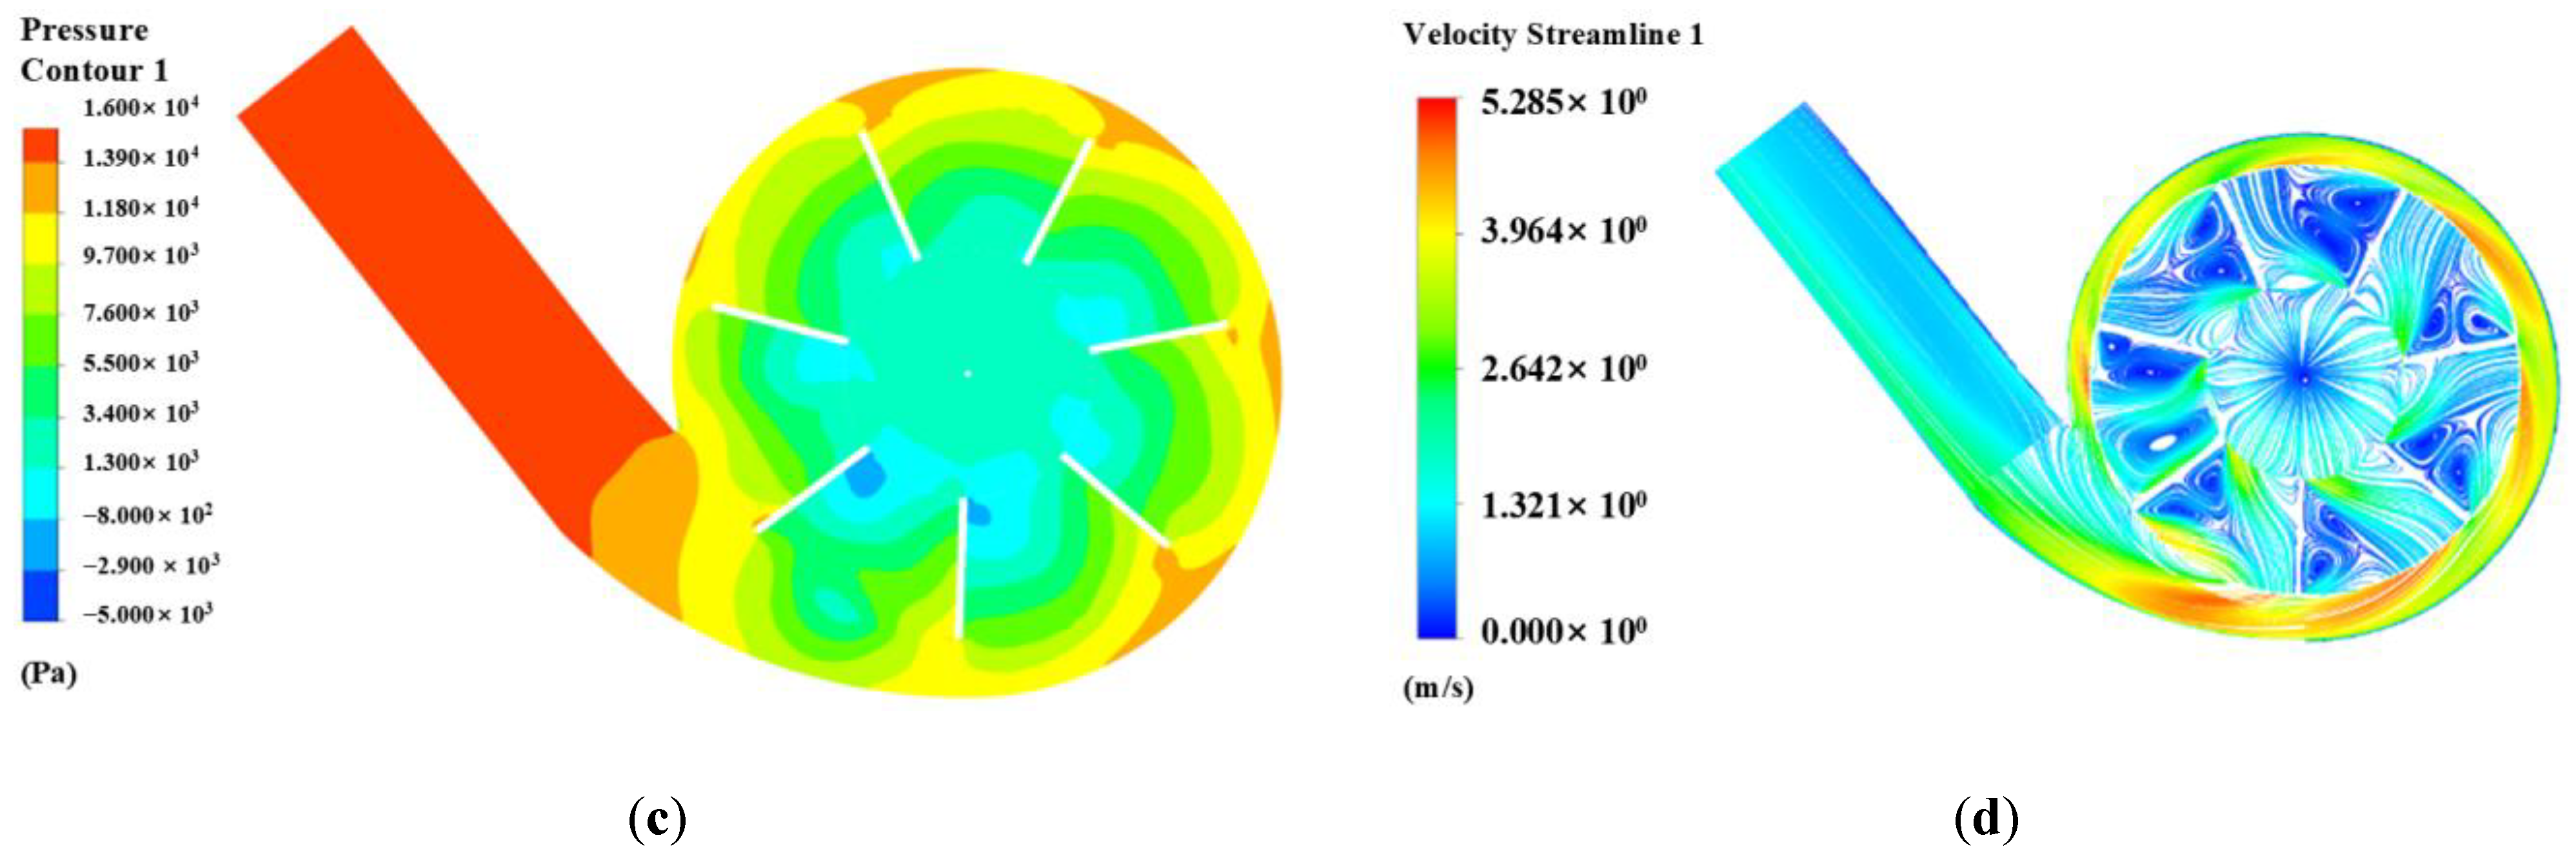
Because the pump employs magneto-hydrodynamic suspension rather than mechanical bearings to position the impeller, helical grooves are machined into the housing so that the pump itself can generate hydraulic forces on the impeller; these forces arise through the secondary flow channel formed between the impeller and the casing. To verify the rationality of the model parameters, numerical simulations were performed to obtain the pressure and velocity distributions within the pump. Figure 15 presents the mid-plane (X = 0 mm) and horizontal-plane (Z = 7.7 mm) distributions at the design operating point (inlet flow 5 L/min, impeller speed 2800 rpm).
Figure 15 shows that the secondary flow channel does not disturb the primary flow: blood still gains velocity and energy under centrifugal action, after which kinetic energy is converted to pressure energy in the volute. The negative-pressure zone, the high-velocity region, and the maximum static-pressure region remain located at the blade leading edge, blade trailing edge, and pump outlet, respectively. Furthermore, Figure 15b,d reveal that blood can be accelerated to 5.285 m/s below the erythrocyte impact hemolysis threshold of 6 m/s, so red-cell damage by impact is avoided.

3.3. Evaluation of Hydraulic Characteristics

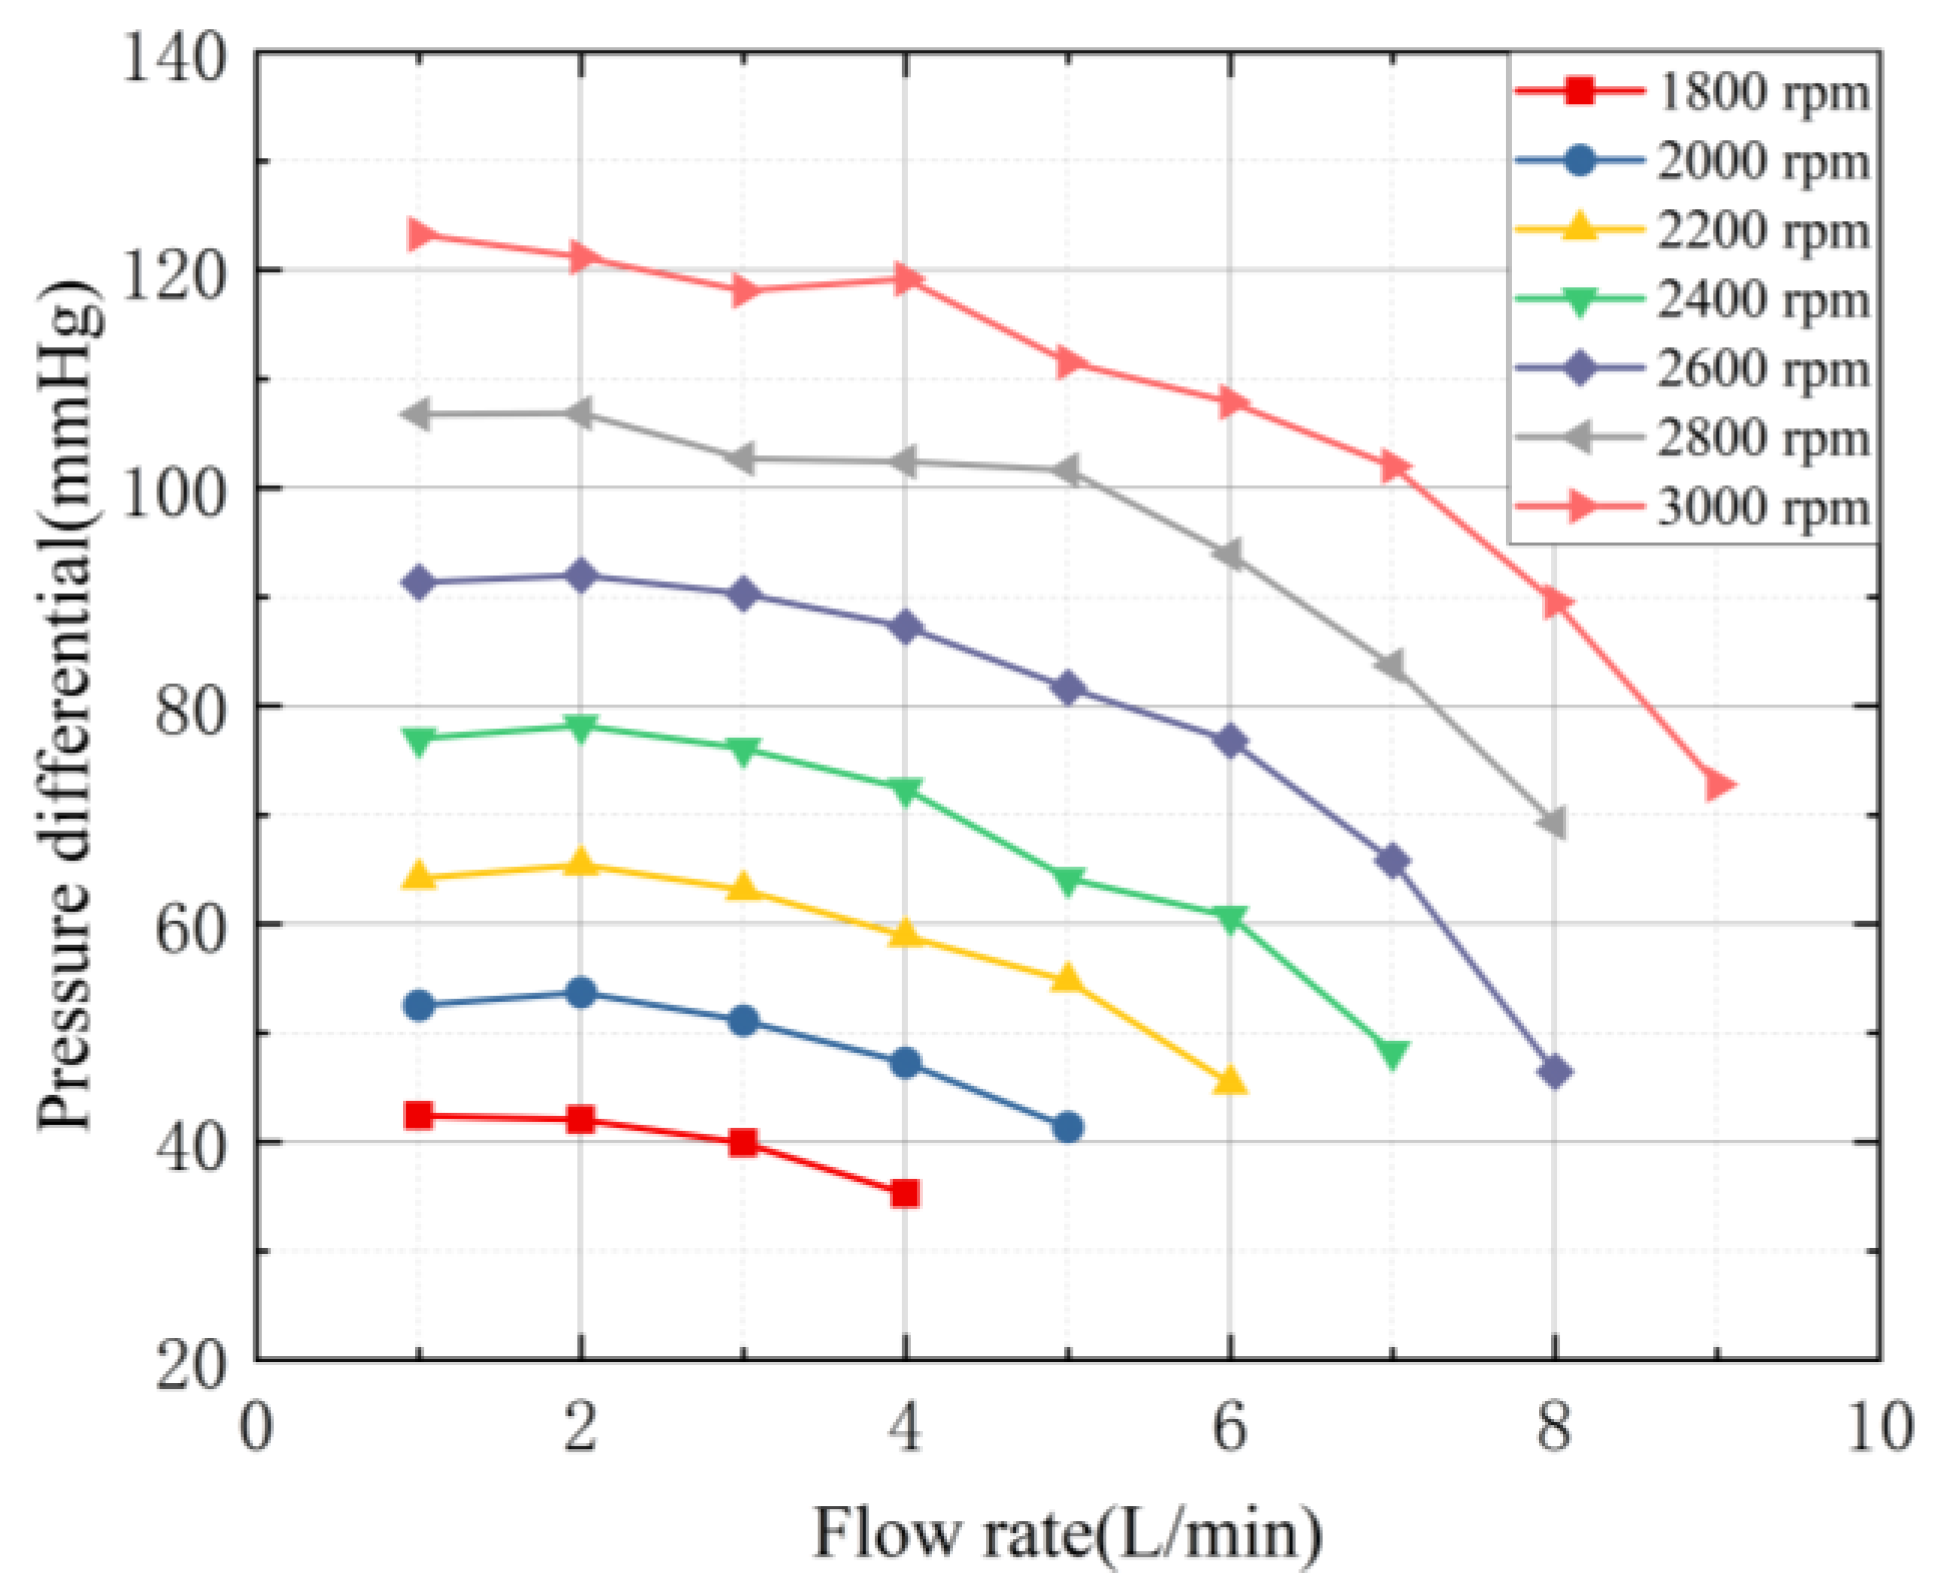
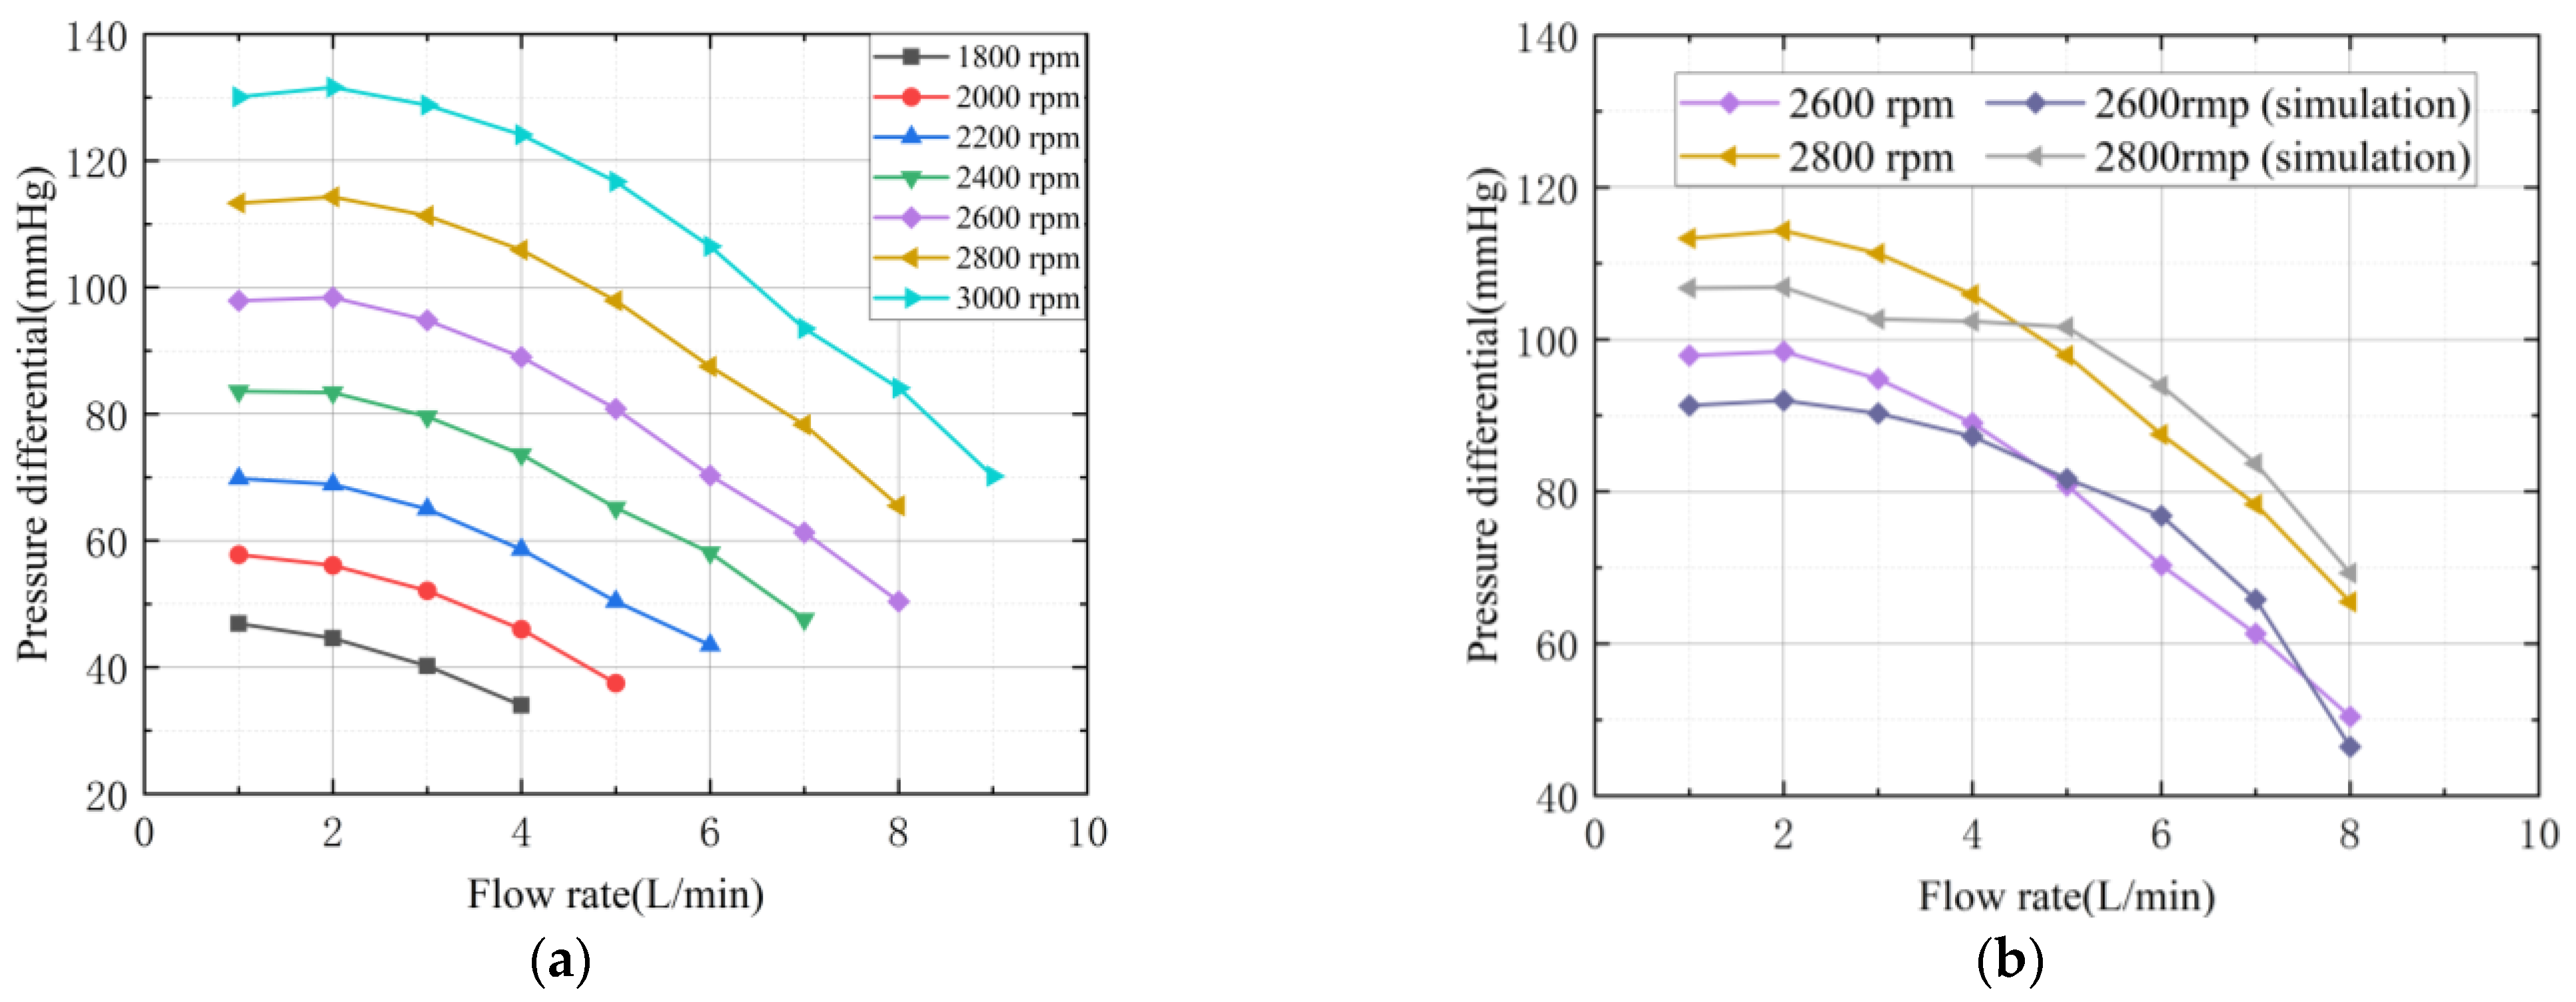
Human cardiac output fluctuates with environmental conditions, emotional states, and body posture, so the actual blood flow rate inevitably deviates from the design target [27]. Like industrial pumps, once a blood pump’s geometry and inlet flow are fixed, outlet pressure and velocity are regulated solely by varying the rotor speed. Therefore, this section conducts a hydraulic characteristic analysis to evaluate the pump’s head under different inlet flow and speed combinations, thereby assessing its performance across a range of operating points. Simulations were performed on the screening pump for inlet flows of 1–9 L/min and impeller speeds of 1800–3000 rpm; the resulting hydraulic characteristic curves are presented in Figure 16.
Figure 16 indicates that the pump head decreases as the inlet flow increases, because the energy imparted to the blood is limited by its residence time inside the pump, the motor power, and the impeller’s frictional resistance. The figure also shows that a higher impeller speed produces a greater head, since the control motor delivers more power, accelerating the impeller and thereby shortening the blood’s dwell time within the pump. At the design operating point (5 L min−1, 2800 rpm) the pump delivers 101.3 mmHg of head, which satisfies the physiological requirements for cardiac assistance.

3.4. Hemocompatibility Results and Analysis

Since hemolysis releases intracellular hemoglobin into the plasma, the extent of blood damage after circulating through the pump for various durations was quantified by measuring plasma absorbance at multiple wavelengths with a spectrophotometer; the corresponding hemoglobin concentration was then calculated using Equation (5).
H b = ( 154.7 × A 415 130.7 × A 450 123.9 × A 700 ) × 100
where HB represents plasma free-hemoglobin concentration, mg/L; A415, A450, A700, respectively, represent absorbance of plasma at 415 nm, 450 nm, and 700 nm.
The measured hemoglobin concentration is then substituted into Equation (6) to compute the normalized hemolysis parameter NIH.
N I H = Δ F H B × V [ ( 100 H c t ) / 100 ] × [ 100 / ( Q × T ) ]
where ΔFHB represents incremental increase in plasma free hemoglobin concentration over the test interval, g/L; V represents total blood volume of the experimental circuit, L; Hct represents hematocrit of the blood, %; Q represents device flow rate, L/min; T represents test interval, min.
The experimentally measured data were processed to yield the hemocompatibility results at each sampling point, summarized in Table 5. These data were subsequently fitted with a linear regression model; the slope of the resulting line represents the incremental rise in free hemoglobin, and the fitted regression equation is depicted in Figure 17.
Since the increment in free hemoglobin (ΔFHB) equals the slope of the fitted line, ΔFHB is 0.0329 g/L. Substituting this value into Equation (6) yields a normalized hemolysis index of 0.01403 g/100 L. Repeating the same procedure for other constant and variable-speed conditions produces Figure 18.
Figure 18 shows that under constant-speed operation, the hemolysis index rises with increasing rotational speed; at the design point it is 0.01403 g/100 L. In variable-speed mode, the index exceeds that of every tested constant speed. This is attributed to transient flow-field disturbances caused by speed fluctuations, which intensify hemolysis beyond the level associated with the baseline speed. Moreover, the variable-speed profile spends part of its cycle at lower speeds—for example, the pulsatile waveform remains at 2600 rpm for half the cycle and only peaks at 3000 rpm—so the constant-speed hemolysis values are lower than those obtained at the variable-speed amplitude. According to the literature, the maximum acceptable normalized hemolysis for human use is NIH = 0.1 g/100 L; thus, the pump satisfies the hemocompatibility requirement at the design speed.

3.5. Verification Tests

3.5.1. Working Principle and Construction of the Hydraulic Performance Test Platform

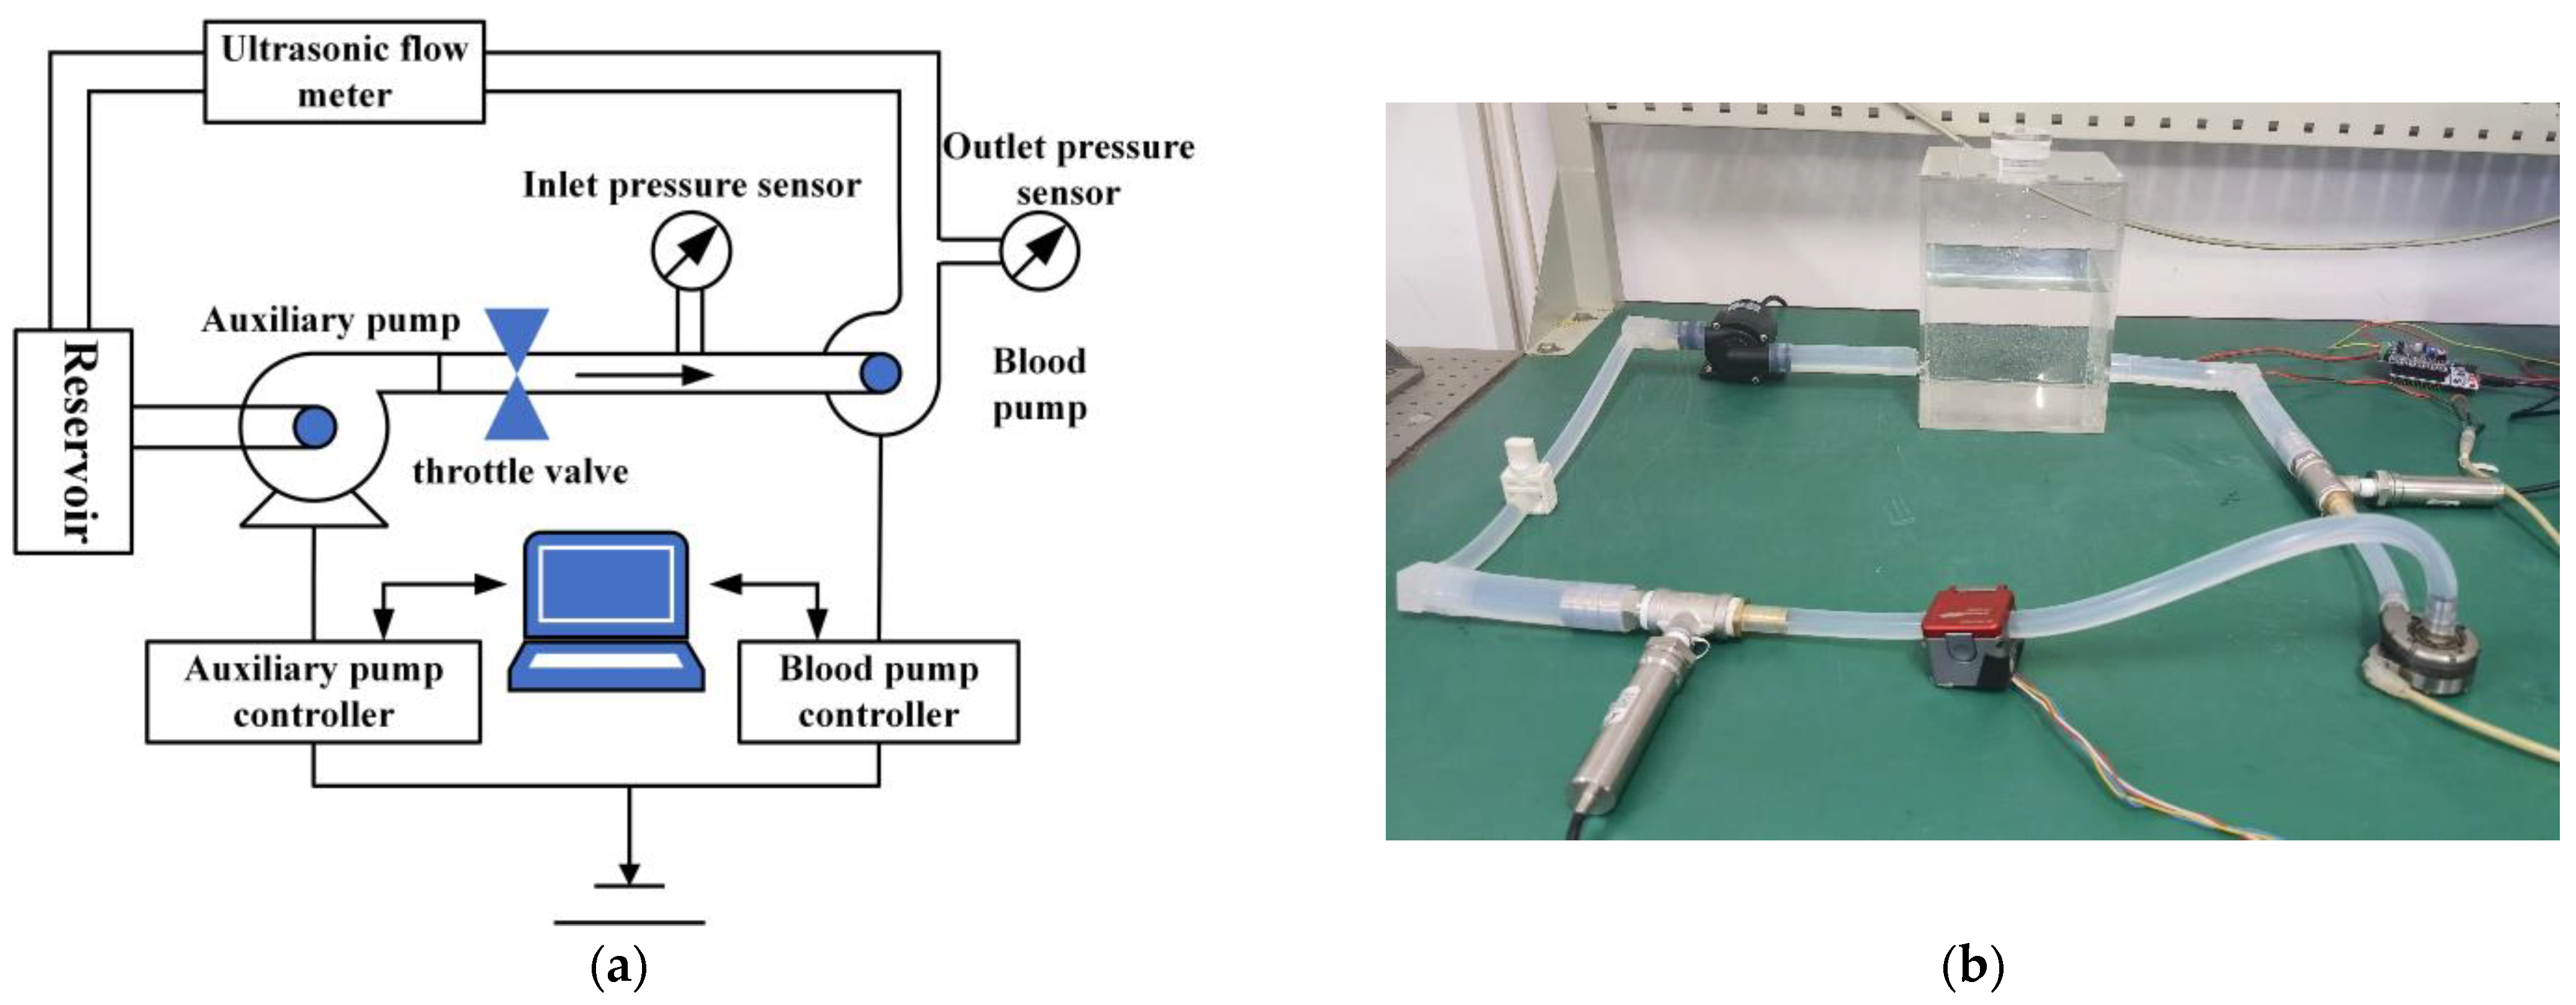
To verify that the pump can deliver the target head under the intended design conditions, a hydraulic performance test platform capable of measuring the pressure and flow at the pump inlet and outlet was constructed; its schematic and physical layout are shown in Figure 19.
The test platform comprises an ultrasonic flow meter, pressure sensors, a DC power supply, the centrifugal blood pump, a reservoir, an auxiliary pump and its controller, and a flow-regulating valve. First, all components were connected according to the schematic; to mimic vascular compliance, flexible silicone tubing was employed. Once assembled, the equipment forms a closed loop that allows continuous fluid circulation. T-junctions are installed at the pump inlet and outlet. The straight-through ports are linked to the silicone tubing to maintain a closed circuit while preventing excessive pressure losses from abrupt flow path changes; the branch ports are connected to pressure sensors for real-time measurement of inlet and outlet pressures under varying speeds and flows. Because these pressures fluctuate with operating conditions, pump head is derived by substituting the measured values into Equation (2). Actual flow through the circuit is monitored with a flow sensor. Since hemolysis testing is planned and blood–metal contact can introduce additional hemolysis, a clamp-on ultrasonic flow sensor is used to eliminate any blood–sensor interface.

3.5.2. Hydraulic Performance Test Procedure

Connect all platform components as shown in Figure 19a. Fully open the tubing clamp/proportional solenoid valve and fill the reservoir with 5 L of 40% glycerol solution to prevent suction phenomenon caused by excessive flow from either the auxiliary or test pump.
Start the auxiliary pump and let it run for 10 min to purge any air bubbles from the fluid and circuit. Set the blood pump controller to the desired rotational speed and start the test pump. Coordinate the auxiliary pump and the test pump to maintain the required inlet flow. If the measured inlet flow is below the target, increase the auxiliary pump speed by adjusting its PWM signal until the desired inlet flow is achieved. If the measured inlet flow exceeds the target, reduce the flow by throttling the tubing clamp/proportional solenoid valve.
Record the inlet and outlet pressures and the flow rate for each speed–flow combination. After post-processing these data, compile the flow–speed–head dataset and plot the hydraulic performance curves.

3.5.3. Comparison and Analysis of Hydraulic Performance Results

The literature indicates that a blood pump must deliver at least 3 L/min of flow against a head of 40 mmHg to meet the perfusion needs of heart failure patients, and cardiac output itself varies with the cardiac cycle [28,29]. Consequently, this section adjusts the auxiliary pump speed and the impeller speed to test pump head over an inlet flow range of 2–9 L/min and an impeller speed range of 1800–3000 rpm. The resulting hydraulic characteristic curves, together with the corresponding simulation parameters, are presented in Figure 20.
As shown in Figure 20, the allowable deviation between experimental and simulated data is 5% at the design point and 10% at off-design points. The head discrepancies at all measured operating points fall within these tolerances, confirming the validity of the simulation.

4. Discussion

4.1. Blood Pump Parametric Analysis

In this study, key structural parameters of the centrifugal blood pump were systematically optimized through a combination of CFD simulation and experimental validation. Results show that increasing the blade count to seven elevates head by 10.7% while maximizing efficiency, a finding consistent with Song et al.’s observations on the trade-off between head generation and blood damage [6]. Straight blades (0° wrap angle) yield the highest head, corroborating Deng et al.’s findings on blade–blood interactions [8]. A coupled mechanism between impeller flow path and diversion cone height is identified and proposed: synchronizing both parameters at 4.1 mm yields the maximum head. After analysis, the pump achieves a hemolysis index of only 0.014 g/100 L at 5 L/min and 2800 rpm—well below the clinical safety threshold of 0.1 g/100 L [30]—thereby confirming the effectiveness of the structural optimization.

4.2. Innovation and Clinical Significance

For the first time, we uncovered a coupling effect between diversion cone height and impeller flow path: when the two are equal (4.1 mm), head and flow uniformity are simultaneously maximized (Figure 14), offering a new design paradigm for magnetically levitated blood pumps. The hydraulic characteristic curves (Figure 16 and Figure 20) show that the studied pump delivers a head greater than 40 mmHg—the minimum required for heart failure patients—across flow rates from 2 L/min into 9 L/min and rotational speeds from 1800 rpm to 3000 rpm, with off-design errors less than 10%, confirming its ability to cope with physiological flow fluctuations. A peak erythrocyte impact velocity of 5.285 m/s (Figure 15d), which is lower than the 6 m/s damage threshold [31], together with the low hemolysis results, demonstrate that structural optimization significantly improves hemocompatibility.

4.3. Limitations and Future Prospects

Single-factor optimization did not quantify interactions among parameters (e.g., the potential coupling between blade wrap angle and diversion cone height); future work could employ neural networks or particle swarm optimization for structural design.
In addition, the blood damage assessment focused only on erythrocyte destruction, without addressing vWF unfolding or platelet activation. Future studies should incorporate multiscale damage models and, for long-term implantation scenarios, add thrombosis-risk evaluations.
Although the proposed blood pump demonstrated favorable performance in in vitro tests, its clinical feasibility remains to be further validated. Future work will include animal experiments and clinical investigations to comprehensively assess its long-term stability and safety under physiological conditions, facilitating clinical translation and application.

5. Conclusions

We performed a parametric analysis—rather than multi-objective optimization—of key impeller and inlet geometries (blade number, wrap angle, impeller flow path, and diversion cone height) using CFD and bench testing. Increasing blade number raised head with a peak efficiency at seven blades; increasing wrap angle reduced head but improved efficiency. Synchronizing the impeller flow path position and the diversion cone height at 4.1 mm maximized head. The recommended configuration satisfies the target duty (5 L·min−1 at 2800 rpm) with a safety margin on head and an NIH well below 0.1 g/100 L.

Author Contributions

Conceptualization, Y.W.; Methodology, Y.W.; Software, Y.W.; Validation, L.X. and Q.W.; Formal analysis, L.X. and Q.W.; Investigation, L.X.; Resources, L.X.; Data curation, L.X. and Q.W.; Writing—original draft, L.X. and Q.W.; Writing—review & editing, L.X. and Q.W.; Visualization, Y.W. and Q.W.; Supervision, Y.W. and Q.W.; Project administration, Y.W.; Funding acquisition, Y.W. All authors have read and agreed to the published version of the manuscript.

Funding

This research was funded by Natural Science Foundation of Heilongjiang Province of China grant number [LH2024E085].

Institutional Review Board Statement

Not applicable.

Informed Consent Statement

Not applicable.

Data Availability Statement

The original contributions presented in this study are included in the article. Further inquiries can be directed to the corresponding author.

Conflicts of Interest

The authors declare no conflicts of interest.

Abbreviations

The following abbreviations are used in this manuscript:
SMLMsoft-magnetically levitated miniature centrifugal pump
VADventricular assist device
CFDcomputational fluid dynamics
vWFvon Willebrand Factor (vWF)

References

  1. Wang, S.; Jia, T.; Liu, G.; Lu, X.; Yang, Q.; Zhu, C. Mapping the research trends and hot topics of ventricular arrhythmia: A bibliometric analysis from 2001 to 2020. Front. Cardiovasc. Med. 2022, 9, 856695. [Google Scholar] [CrossRef]
  2. Mi, S.; Huang, F.; Jiao, M.; Qian, Z.; Han, M.; Miao, Z.; Zhan, H. Inhibition of MEG3 ameliorates cardiomyocyte apoptosis and autophagy by regulating the expression of miRNA-129-5p in a mouse model of heart failure. Redox Rep. 2023, 28, 2224607. [Google Scholar] [CrossRef] [PubMed]
  3. Dandel, M. Cardiological Challenges Related to Long-Term Mechanical Circulatory Support for Advanced Heart Failure in Patients with Chronic Non-Ischemic Cardiomyopathy. J. Clin. Med. 2023, 12, 6451. [Google Scholar] [CrossRef] [PubMed]
  4. Bounouib, M.; Taha-Janan, M.; Maazouzi, W. Optimization of hemocompatibility metrics in ventricular assist device design using machine learning and CFD-based response surface analysis. Int. J. Artif. Organs 2025, 48, 367–383. [Google Scholar] [CrossRef] [PubMed]
  5. Oran, E.; Abo-Serie, E.; Jewkes, J.; Henry, M.; Oran, B. Design and optimisation of an Intra-Aortic Shrouded rotor axial pump. J. Biomech. 2024, 162, 111858. [Google Scholar] [CrossRef]
  6. Song, G.; Chua, L.P.; Lim, T.M. Numerical study of a centrifugal blood pump with different impeller profiles. ASAIO J. 2010, 56, 24–29. [Google Scholar] [CrossRef]
  7. Zhou, M.; Qi, Z.; Xia, Z.; Li, Y.; Ling, W.; Yang, J.; Yang, Z.; Pei, J.; Wu, D.; Huo, W.; et al. Miniaturized soft centrifugal pumps with magnetic levitation for fluid handling. Sci. Adv. 2021, 7, eabi7203. [Google Scholar] [CrossRef]
  8. Deng, Q.; Pei, J.; Wang, W.; Lin, B.; Zhang, C.; Zhao, J. Energy Loss and Radial Force Variation Caused by Impeller Trimming in a Double-Suction Centrifugal Pump. Entropy 2021, 23, 1228. [Google Scholar] [CrossRef]
  9. Hirschhorn, M.; Catucci, N.; Day, S.W.; Stevens, R.M.; Tchantchaleishvili, V.; Throckmorton, A.L. Channel impeller design for centrifugal blood pump in hybrid pediatric total artificial heart: Modeling, magnet integration, and hydraulic experiments. Artif. Organs 2022, 47, 680–694. [Google Scholar] [CrossRef]
  10. Diallo, A.B.; Çınar, H.; Yapıcı, R. Analysis of fluid forces impacting on the impeller of a mixed flow blood pump with computational fluid dynamics. Int. J. Artif. Organs 2024, 47, 894–907. [Google Scholar] [CrossRef]
  11. Ji, D.; Lu, W.; Xu, B.; Xu, L.; Lu, L. Study of Energy Loss Characteristics of a Shaft Tubular Pump Device Based on the Entropy Production Method. Entropy 2023, 25, 995. [Google Scholar] [CrossRef]
  12. Parente, R.; Fumagalli, M.R.; Di Claudio, A.; Rincón, C.L.C.; Erreni, M.; Zanini, D.; Iapichino, G.; Protti, A.; Garlanda, C.; Rusconi, R.; et al. A Multilayered Imaging and Microfluidics Approach for Evaluating the Effect of Fibrinolysis in Staphylococcus aureus Biofilm Formation. Pathogens 2023, 12, 1141. [Google Scholar] [CrossRef] [PubMed]
  13. Zhu, L.; Fang, Y.; Shen, Y.; Li, H.; Wang, Y.; Zhu, X.; Lu, X. Structural characteristics of corrugated sandwich rectangular pressure vessels. Sci. Rep. 2025, 15, 10646. [Google Scholar] [CrossRef] [PubMed]
  14. Hatoum, H.; Moore, B.L.; Dasi, L.P. On the Significance of Systolic Flow Waveform on Aortic Valve Energy Loss. Ann. Biomed. Eng. 2018, 46, 2102–2111. [Google Scholar] [CrossRef]
  15. Zhang, J.; Rothenberger, S.M.; Brindise, M.C.; Markl, M.; Rayz, V.L.; Vlachos, P.P. Wall Shear Stress Estimation for 4D Flow MRI Using Navier-Stokes Equation Correction. Ann. Biomed. Eng. 2022, 50, 1810–1825. [Google Scholar] [CrossRef] [PubMed]
  16. Saha, S.C.; Saha, G. Effect of microplastics deposition on human lung airways: A review with computational benefits and challenges. Heliyon 2024, 10, e24355. [Google Scholar] [CrossRef]
  17. Peng, P.; Chen, H.; Che, B.; Li, X.; Fan, C.; Liu, L.; Luo, T.; Deng, L. Research on a portable electrical impedance tomography system for evaluating blood compatibility of biomaterials. Sheng Wu Yi Xue Gong Cheng Xue Za Zhi J. Biomed. Eng. Shengwu Yixue Gongchengxue Zazhi 2025, 42, 219–227. [Google Scholar] [CrossRef]
  18. Fu, M.; Liu, G.; Wang, W.; Gao, B.; Ji, B.; Chang, Y.; Liu, Y. Hemodynamic evaluation and in vitro hemolysis evaluation of a novel centrifugal pump for extracorporeal membrane oxygenation. Ann. Transl. Med. 2021, 9, 679. [Google Scholar] [CrossRef]
  19. Yun, Z.; Yao, J.; Wang, L.; Tang, X.; Feng, Y. The design and evaluation of the outflow structures of an interventional microaxial blood pump. Front. Physiol. 2023, 14, 1169905. [Google Scholar] [CrossRef]
  20. Gu, K.; Yang, K.; Zhao, C.; Shu, Q.; Lin, R. Optimizing the design of a pediatric blood pump through orthogonal experimentation. Heliyon 2025, 11, e42502. [Google Scholar] [CrossRef]
  21. Li, Y.; Yu, J.; Wang, H.; Xi, Y.; Deng, X.; Chen, Z.; Fan, Y. Investigation of the influence of blade configuration on the hemodynamic performance and blood damage of the centrifugal blood pump. Artif. Organs 2022, 46, 1817–1832. [Google Scholar] [CrossRef]
  22. Wang, J.; Nakata, T.; Liu, H. Development of Mixed Flow Fans with Bio-Inspired Grooves. Biomimetics 2019, 4, 72. [Google Scholar] [CrossRef]
  23. Sarkisyan, H.; Stevens, R.; Tchantchaleishvili, V.; Rossano, J.; Throckmorton, A. Integrated long-term multifunctional pediatric mechanical circulatory assist device. Artif. Organs 2020, 45, E65–E78. [Google Scholar] [CrossRef]
  24. Medina, R.; Sánchez, R.-V.; Cabrera, D.; Cerrada, M.; Estupiñan, E.; Ao, W.; Vásquez, R.E. Scale-Fractal Detrended Fluctuation Analysis for Fault Diagnosis of a Centrifugal Pump and a Reciprocating Compressor. Sensors 2024, 24, 461. [Google Scholar] [CrossRef]
  25. Peng, G.; Chen, Q.; Zhou, L.; Pan, B.; Zhu, Y. Effect of Blade Outlet Angle on the Flow Field and Preventing Overload in a Centrifugal Pump. Micromachines 2020, 11, 811. [Google Scholar] [CrossRef]
  26. Yu, N.; Yu, X.; Cai, Z.; Yang, X.; Tian, L.; Li, S. Research on multi-condition optimization of centrifugal compressor impeller meridian profile. PLoS ONE 2025, 20, e0318783. [Google Scholar] [CrossRef]
  27. Lloyd, A.; Fiala, D.; Heyde, C.; Havenith, G. A mathematical model for predicting cardiovascular responses at rest and during exercise in demanding environmental conditions. J. Appl. Physiol. 2022, 133, 247–261. [Google Scholar] [CrossRef]
  28. Mazimba, S.; Jeukeng, C.; Ondigi, O.; Mwansa, H.; E Johnson, A.; Elumogo, C.; Breathett, K.; Kwon, Y.; Mubanga, M.; Mwansa, V.; et al. Coronary perfusion pressure is associated with adverse outcomes in advanced heart failure. Perfusion 2022, 38, 1492–1500. [Google Scholar] [CrossRef]
  29. Reymond, P.; Bendjelid, K.; Giraud, R.; Richard, G.; Murith, N.; Cikirikcioglu, M.; Huber, C. To Balloon or Not to Balloon? The Effects of an Intra-Aortic Balloon-Pump on Coronary Artery Flow during Extracorporeal Circulation Simulating Normal and Low Cardiac Output Syndromes. J. Clin. Med. 2021, 10, 5333. [Google Scholar] [CrossRef]
  30. Olsen, D.B. The history of continuous-flow blood pumps. Artif. Organs 2000, 24, 401–404. [Google Scholar] [CrossRef]
  31. Carson, J.L.; Stanworth, S.J.; Dennis, J.A.; Trivella, M.; Roubinian, N.; Fergusson, D.A.; Triulzi, D.; Dorée, C.; Hébert, P.C. Transfusion thresholds for guiding red blood cell transfusion. Cochrane Database Syst. Rev. 2021, 12, Cd002042. [Google Scholar] [CrossRef]
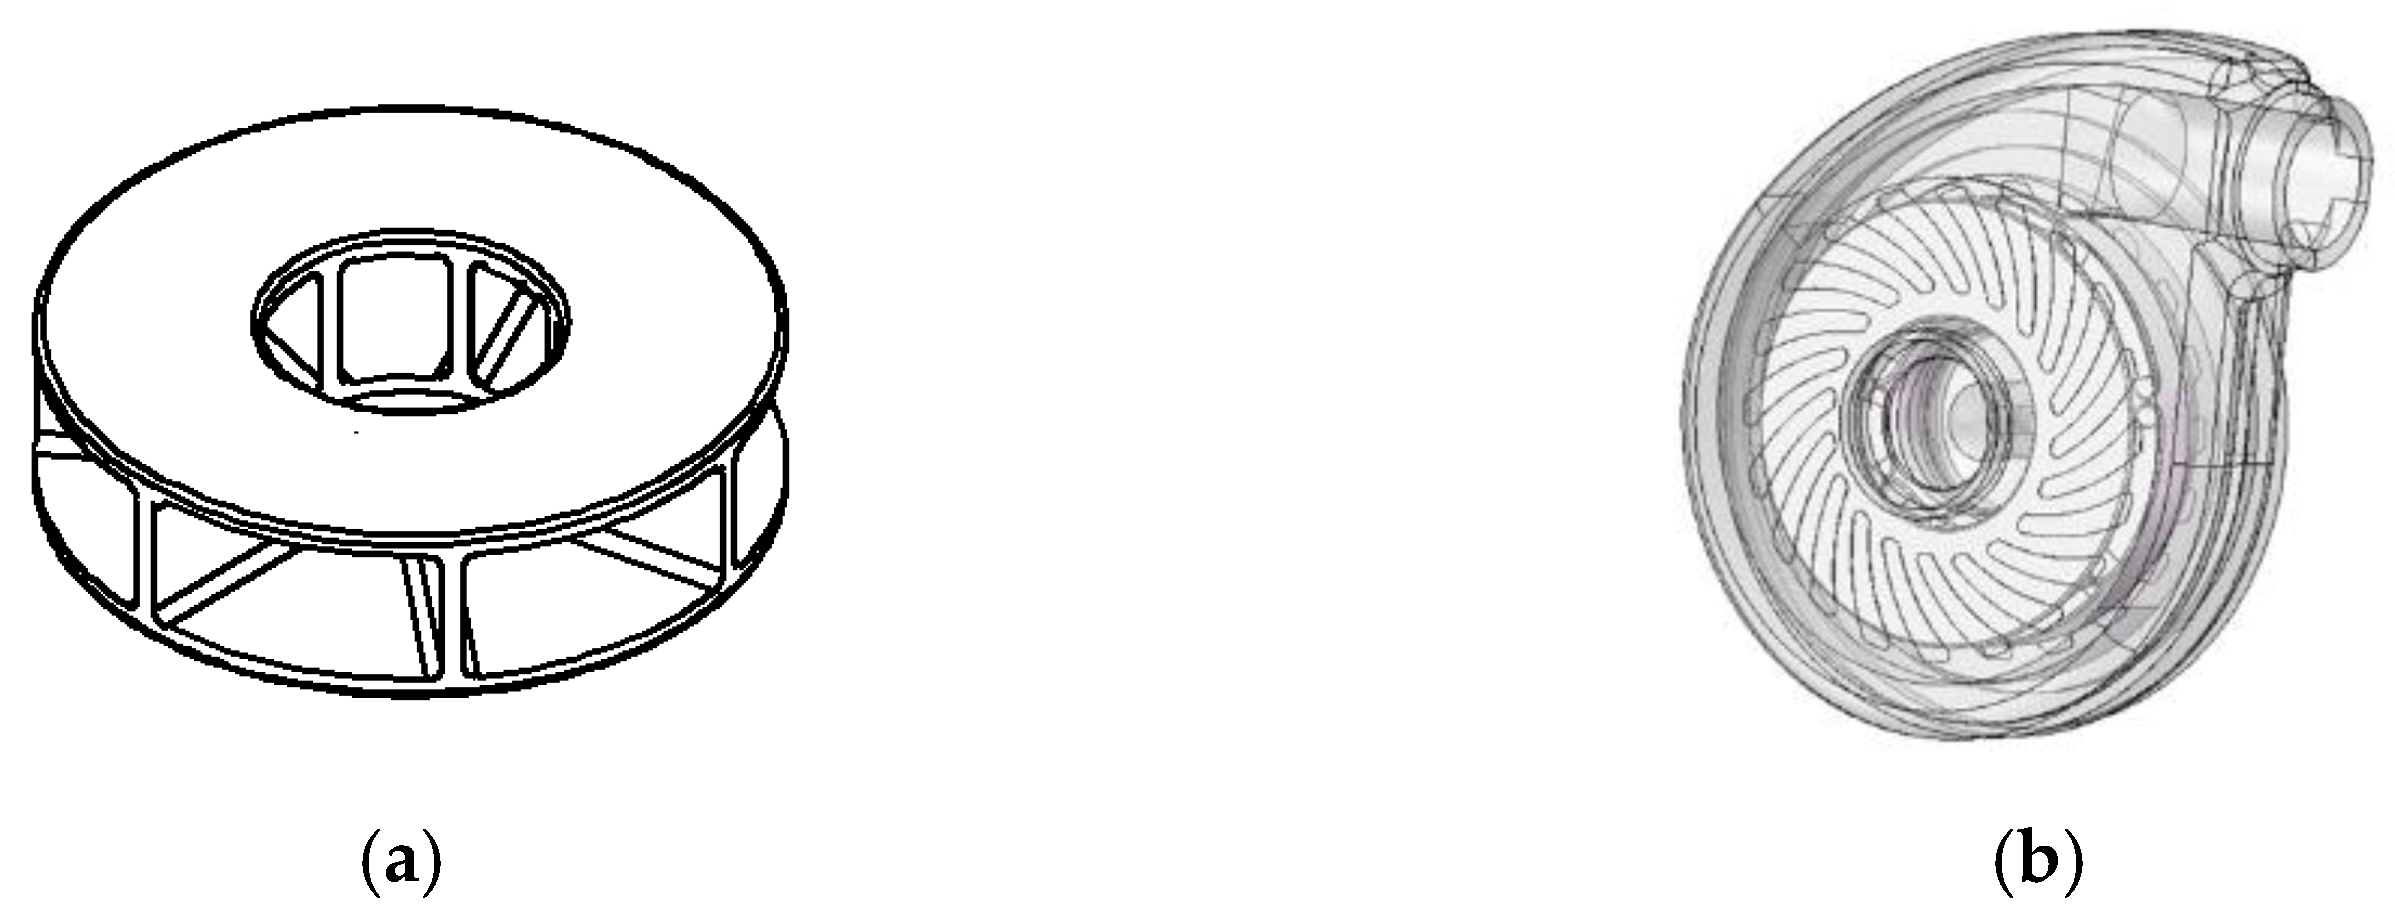
Figure 1. Schematic diagram of the blood pump. (a) Schematic diagram of impeller structure; (b) three-dimensional model of blood pump.
Applsci 15 11710 g001
Figure 2. Schematic diagram of the fluid domain of the device.
Applsci 15 11710 g002
Figure 3. Schematic diagram of fluid-domain grid of blood pump. (a) Pump mesh; (b) impeller mesh.
Applsci 15 11710 g003
Figure 4. Grid independence.
Applsci 15 11710 g004
Figure 5. Schematic and physical diagram of the blood pump experimental platform. (a) Schematic diagram; (b) physical diagram.
Applsci 15 11710 g005
Figure 6. Partial experimental equipment of hemolysis experiment platform. (a) Spectrophotometer; (b) centrifuge; (c) microscope.
Applsci 15 11710 g006
Figure 7. Vortex, static pressure, and velocity fields of blood pumps with different blade numbers. (a) Blood pump Q criterion; (b) blood pump pressure distribution; (c) blood pump velocity distribution.
Applsci 15 11710 g007
Figure 8. Pressure and velocity fields of blood pumps with different blade wrap angles. (a) Blood pump pressure distribution; (b) blood pump velocity streamlines.
Applsci 15 11710 g008
Figure 9. The influence of different impeller flow paths on the center position of the device. (a) H = 0.6 mm; (b) H = 2.5 mm; (c) H = 4.1 mm.
Applsci 15 11710 g009
Figure 10. The influence of different impeller flow path positions on device performance.
Applsci 15 11710 g010
Figure 11. Schematic diagram of diversion cone structure parameters. (a) Axial section diagram of the diversion cone; (b) axial section diagram of the diversion cone.
Applsci 15 11710 g011
Figure 12. The influence of the height of the diversion cone on the velocity of the flow field. (a) H2 = 0 mm; (b) H2 = 2.5 mm; (c) H2 = 4.1 mm; (d) H2 = 5.7 mm.
Applsci 15 11710 g012
Figure 13. The influence of the height of the diversion cone on the flow-field pressure. (a) H2 = 0 mm; (b) H2 = 2.5 mm; (c) H2 = 4.1 mm; (d) H2 = 5.7 mm.
Applsci 15 11710 g013
Figure 14. Influence of diversion cone height on device performance.
Applsci 15 11710 g014
Figure 15. Flow-field analysis diagram of the device. (a) Pressure contour map of the mid-plane (X = 0 mm); (b) Pressure distribution map of the mid-plane (X = 0 mm); (c) Pressure contour map on the plane (Z = 7.7 mm); (d) Velocity streamlines on the plane (Z = 7.5 mm).
Applsci 15 11710 g015aApplsci 15 11710 g015b
Figure 16. Hydraulic characteristic curve of blood pump.
Applsci 15 11710 g016
Figure 17. Linear fitting of free hemoglobin concentration.
Applsci 15 11710 g017
Figure 18. Hemolysis at different rotational speeds.
Applsci 15 11710 g018
Figure 19. Schematic and physical diagram of hydraulic characteristic experimental platform. (a) Schematic diagram; (b) physical diagram.
Applsci 15 11710 g019
Figure 20. Hydraulic characteristic curve of blood pump. (a) Blood pump experimental data; (b) Comparison of some experimental data and simulation data of the blood pump.
Applsci 15 11710 g020
Table 1. Blood pump solution settings and boundary conditions.
ParameterValue or SelectionRemarks
blood density1060 kg/m3Human normal blood density1050~1060 kg/m3
blood viscosity3.5 × 10−3 Pa·sThe range of 0.0030.004 Pa·s
blood pressure value100 mmHgThe ranges from 80 to 120 mmHg
blood pump flow rate5 L/minCardiac output of an adult male
Inlet Boundary ConditionsVelocity inlet boundary
Outlet Boundary ConditionsPressure outlet boundaryPressure difference value of the human heart
Turbulence ModelRNG k-ε model
Wall Boundary ConditionsRotating wallThe remaining walls are all stationary walls.
Impeller Rotational Speed2800 r/min
Interface between the stationary and rotating regionsInlet–Impeller liquid–liquid
Impeller–Volute liquid–liquid
The interface between the stationary and rotating regions is treated using the interface method.
SolverSIMPLEC algorithmThe pressure correction value is readily obtained.
Convergence Accuracy0.00001Convergence criterion based on the root-mean-square residual value
Table 2. The influence of blade number on the head and efficiency of blood pumps.
Blade NumberHead (mmHg)Efficiency (%)
690.7445732.41
7101.6404134.53
8106.5446333.14
Table 3. The influence of blade wrap angle on the head and efficiency of blood pump.
Blade Wrap Angle (°)Head (mmHg)Efficiency (%)
101.633.1
30°89.038.9
60°85.240.8
90°72.137.1
Table 4. Geometric parameters of blood pump impeller and guide cone.
ParameterNumerical Value
Inner diameter of impeller7.5 mm
Outer diameter of impeller16 mm
Number of leaves7
Wrap angle of blade
Position of the flow channel4.1 mm
Diversion cone height4.1 mm
Table 5. Free hemoglobin test data.
Time (h)0123456
Plasma free hemoglobin concentration (mg/L)37.5250.9688.35113.75148.23201.75226.14
Disclaimer/Publisher’s Note: The statements, opinions and data contained in all publications are solely those of the individual author(s) and contributor(s) and not of MDPI and/or the editor(s). MDPI and/or the editor(s) disclaim responsibility for any injury to people or property resulting from any ideas, methods, instructions or products referred to in the content.